network analysis of interactions between students and an
TRANSCRIPT
Paper ID #16950
Network Analysis of Interactions between Students and an Instructor duringDesign Meetings
Dr. Kathleen Quardokus Fisher, Oregon State University
Dr. Kathleen Quardokus Fisher is a postdoctoral scholar at Oregon State University. She is currentlyparticipating in a project that supports the use of evidence-based instructional practices in undergraduateSTEM courses through developing communities of practice. Her research interests focus on understandinghow organizational change occurs in higher education with respect to teaching and learning in STEMcourses.
Dr. Laura Hirshfield, University of Michigan
Laura Hirshfield is a postdoctoral researcher and lecturer at the University of Michigan. She received herB.S. from the University of Michigan and her Ph.D. from Purdue University, both in chemical engineering.She then transitioned into the engineering education field by completing a post-doctoral appointmentat Oregon State University investigating technology-aided conceptual learning. She is currently doingresearch on self-efficacy in project-based learning.
Amanda Siebert-Evenstone, University of Wisconsin - MadisonGolnaz Arastoopour, University of Wisconsin - Madison
Golnaz Arastoopour is a Ph.D. student in Learning Sciences at the University of Wisconsin-Madison.Before becoming interested in education, Golnaz studied Mechanical Engineering at the University ofIllinois at Urbana-Champaign. In Urbana, she worked as a computer science instructor at Campus MiddleSchool for Girls. She earned her M.A. in mathematics education at Columbia University, Teachers Collegeand taught in the Chicago Public School system. Currently, Golnaz is working with the Epistemic GamesResearch Group where she designs engineering virtual internship simulations. Her current research isfocused on engineering design learning in virtual environments and assessing design thinking.
Prof. Milo Koretsky, Oregon State University
Milo Koretsky is a Professor of Chemical Engineering at Oregon State University. He received his B.S.and M.S. degrees from UC San Diego and his Ph.D. from UC Berkeley, all in Chemical Engineering.He currently has research activity in areas related engineering education and is interested in integratingtechnology into effective educational practices and in promoting the use of higher-level cognitive skillsin engineering problem solving. His research interests particularly focus on what prevents students frombeing able to integrate and extend the knowledge developed in specific courses in the core curriculum tothe more complex, authentic problems and projects they face as professionals. Dr. Koretsky is one of thefounding members of the Center for Lifelong STEM Education Research at OSU.
c©American Society for Engineering Education, 2016
Network Analysis of Interactions between Students and an Instructor during Design Meetings
Introduction Undergraduate programs aim to prepare engineers for professional practice. Project-based learning is an approach to coursework that allows students to work on open-ended, industrially-situated challenges prior to full time participation in the profession. The role of the professor in this environment is one of coach who provides feedback to guide students in the use of tools and practices of the discipline to productively engage in their work. The purpose of this paper is to continue our investigation of feedback between an instructor and small groups of students in open-ended projects by exploring the use of network diagrams as a discourse analysis tool.1,2
Feedback has been found to be one of the most important factors for educational achievement.3 It is especially valuable in open-ended projects where student teams can proceed along multiple paths. Our Industrially-Situated Virtual Laboratory projects provide a unique learning environment for the study of feedback due to the instructional design and to the variation in student teams, project types, and instructors. Feedback is the mechanism that the coach uses to guide or redirect student efforts, to challenge student conceptions, and to enculturate students to the expectations of industrial project work. Our previous research on these virtual projects involved developing the coding protocol to characterize the feedback given during meetings between teams of two to three students and their coach.1,2 These coaching sessions are used to evaluate a team’s current understanding and to guide their next steps. Interaction between the coach and the students was found to be characterized by distinct episodes with up to four stages.1 Coach and student interactions were coded in terms of episode stages and episode themes (e.g., what coaching or student engineering objectives they addressed). In addition, the talk time of the participants was analyzed. In this paper, we build upon this research by employing Epistemic Network Analysis (ENA) to compare the features of the coaching sessions.4 ENA is an analysis tool that is new to this context. In general, a network consists of nodes (objects or ideas) and relationships between nodes (ties or connections). In ENA, the nodes are represented as the coded data (i.e., stages and themes) and the relationship between nodes indicate when two codes occur within the same segmentation of time. The resulting networks allows for inquiry into the structure of feedback and the differences in feedback employed by the coaches. Our exploratory research using this tool was guided by two research foci. First, we are interested in investigating the differences between the two coaches involved in the Virtual Laboratory projects. We consider these questions within this focus: (1a) To what extent are there differences in approaches to feedback taken by each coach? (1b) What does ENA elucidate as the differences in approaches to feedback practiced by each coach? (1c) Do these identified differences support or refute the findings of previous
research into these coaching sessions? We chose these research questions in order to discover if ENA identifies similar findings that are consistent with our previous analysis. For the second research focus, we probe further into the discourse networks of a single coach as a preliminary and exploratory investigation into the new insights provided by ENA. We explore this second research focus into a single coach’s discourse networks by asking: (2a) What are the preliminary trends identifiable between the feedback approach of a coach and the project grades of the student teams? And (2b) What does this trend suggest about feedback that is productive in the completion of the Virtual Laboratory? We will provide preliminary answers to these questions and use this analysis as a starting point for suggesting next steps for investigating a coach’s feedback structure. Context This paper presents a comparative case study of feedback provided by two coaches to 27 teams of students. Students are grouped in teams of mostly three, and chose to work on one of two specific optimization projects, one based on a Virtual Chemical Vapor Deposition (VCVD) reactor or one based on a Virtual Bioreactor (VBioR) reactor. The latter project had two variations. The project type also determined which coach worked with the team. Two faculty members, a CVD domain expert and a bioprocesses domain expert, provided feedback to student teams during scheduled 30 minute coaching sessions. The coaching sessions are vital for providing feedback to the student groups. The coach seeks to assess the team’s current approach, to incorporate concepts from prior courses and to guide the students towards productive engagement in disciplinary practice. These coaching sessions were perceived by students to be similar to a meeting with a boss or manager in industry. This study builds upon the work of earlier research on each team’s first coaching session.1,2 Data sources included transcripts of the video recorded coaching sessions and the teams’ final project scores.1 This study was approved by the IRB and all participants signed informed consent forms. The first coaching session was a 30 minute meeting where the students present their initial input parameters, budget, and experimental strategy in a design strategy memorandum. If the students are able to successfully defend their choices (through primary literature sources, disciplinary concepts, and logical reasoning) then they are granted access to the Virtual Laboratory. The virtual environment allows students to run their experiments in a short amount time, thus enabling students to complete the complex project in three weeks. The previous analysis used discourse analysis to code talking turns according to episode themes and stages.1,2 Themes refer to the topic of the talking turn (hereafter utterance). These include coaching objectives, student engineering objectives, and project contextualization. Furthermore, coaching objectives and student engineering objectives are separated into subcategories. The coaching objectives include: experimental design and strategy, kinetics, transport, and professional skills. Student engineering objectives are differentiated among input parameters, measurement strategy, and performance metrics. Stages refer to the coach’s intentions of the conversation as surveying, probing, guiding, and confirmation. Descriptions of these codes appear in Table 1. In the following section, we detail how we used ENA to address the research questions.
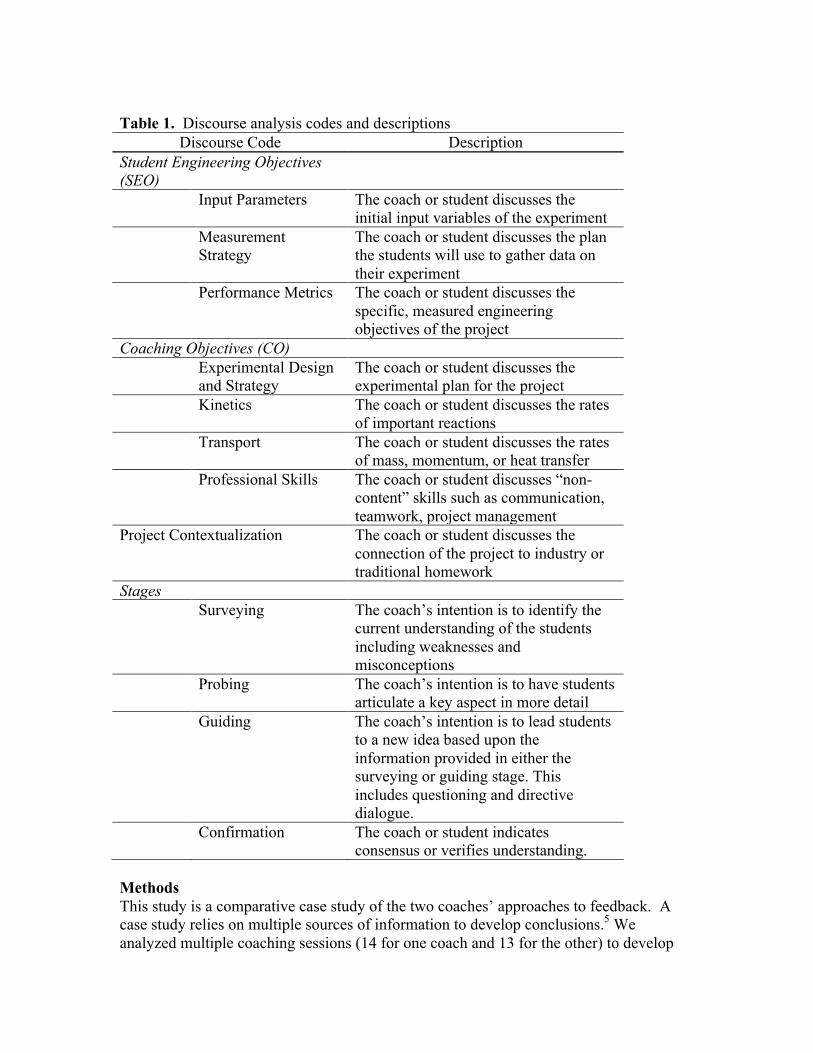
Table 1. Discourse analysis codes and descriptions
Discourse Code Description Student Engineering Objectives (SEO)
Input Parameters The coach or student discusses the initial input variables of the experiment
Measurement Strategy
The coach or student discusses the plan the students will use to gather data on their experiment
Performance Metrics The coach or student discusses the specific, measured engineering objectives of the project
Coaching Objectives (CO) Experimental Design
and Strategy The coach or student discusses the experimental plan for the project
Kinetics The coach or student discusses the rates of important reactions
Transport The coach or student discusses the rates of mass, momentum, or heat transfer
Professional Skills The coach or student discusses “non-content” skills such as communication, teamwork, project management
Project Contextualization The coach or student discusses the connection of the project to industry or traditional homework
Stages Surveying The coach’s intention is to identify the
current understanding of the students including weaknesses and misconceptions
Probing The coach’s intention is to have students articulate a key aspect in more detail
Guiding The coach’s intention is to lead students to a new idea based upon the information provided in either the surveying or guiding stage. This includes questioning and directive dialogue.
Confirmation The coach or student indicates consensus or verifies understanding.
Methods This study is a comparative case study of the two coaches’ approaches to feedback. A case study relies on multiple sources of information to develop conclusions.5 We analyzed multiple coaching sessions (14 for one coach and 13 for the other) to develop
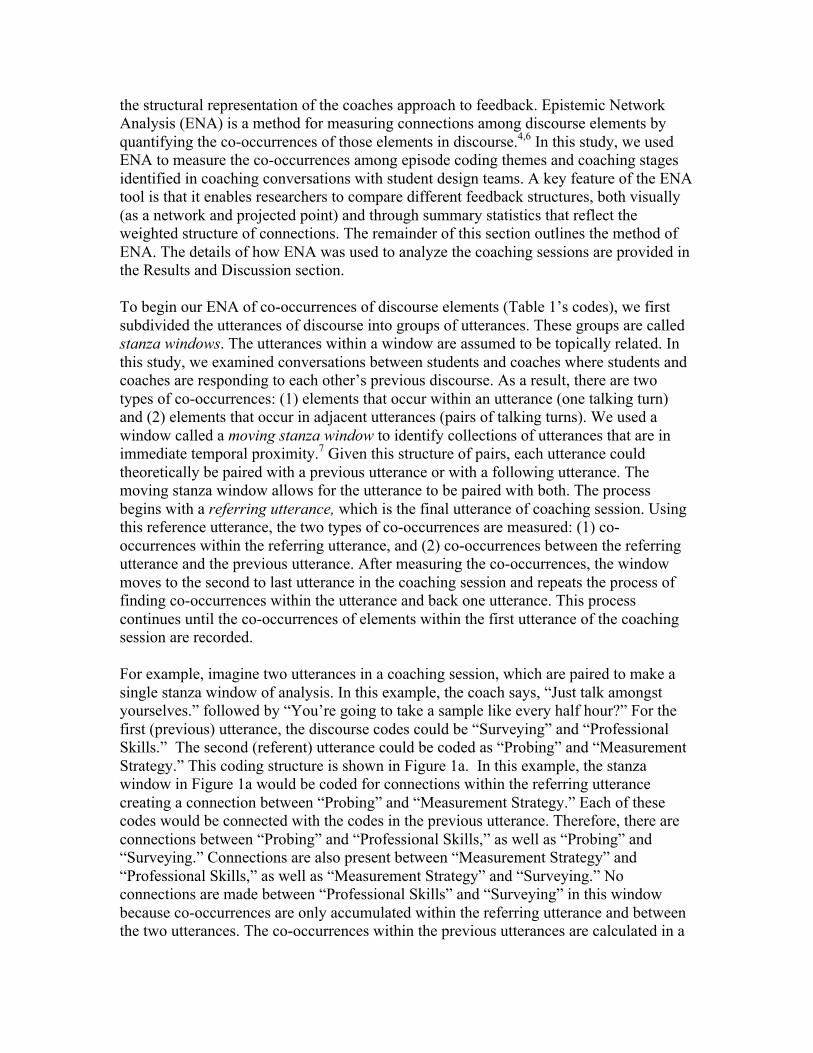
the structural representation of the coaches approach to feedback. Epistemic Network Analysis (ENA) is a method for measuring connections among discourse elements by quantifying the co-occurrences of those elements in discourse.4,6 In this study, we used ENA to measure the co-occurrences among episode coding themes and coaching stages identified in coaching conversations with student design teams. A key feature of the ENA tool is that it enables researchers to compare different feedback structures, both visually (as a network and projected point) and through summary statistics that reflect the weighted structure of connections. The remainder of this section outlines the method of ENA. The details of how ENA was used to analyze the coaching sessions are provided in the Results and Discussion section. To begin our ENA of co-occurrences of discourse elements (Table 1’s codes), we first subdivided the utterances of discourse into groups of utterances. These groups are called stanza windows. The utterances within a window are assumed to be topically related. In this study, we examined conversations between students and coaches where students and coaches are responding to each other’s previous discourse. As a result, there are two types of co-occurrences: (1) elements that occur within an utterance (one talking turn) and (2) elements that occur in adjacent utterances (pairs of talking turns). We used a window called a moving stanza window to identify collections of utterances that are in immediate temporal proximity.7 Given this structure of pairs, each utterance could theoretically be paired with a previous utterance or with a following utterance. The moving stanza window allows for the utterance to be paired with both. The process begins with a referring utterance, which is the final utterance of coaching session. Using this reference utterance, the two types of co-occurrences are measured: (1) co-occurrences within the referring utterance, and (2) co-occurrences between the referring utterance and the previous utterance. After measuring the co-occurrences, the window moves to the second to last utterance in the coaching session and repeats the process of finding co-occurrences within the utterance and back one utterance. This process continues until the co-occurrences of elements within the first utterance of the coaching session are recorded. For example, imagine two utterances in a coaching session, which are paired to make a single stanza window of analysis. In this example, the coach says, “Just talk amongst yourselves.” followed by “You’re going to take a sample like every half hour?” For the first (previous) utterance, the discourse codes could be “Surveying” and “Professional Skills.” The second (referent) utterance could be coded as “Probing” and “Measurement Strategy.” This coding structure is shown in Figure 1a. In this example, the stanza window in Figure 1a would be coded for connections within the referring utterance creating a connection between “Probing” and “Measurement Strategy.” Each of these codes would be connected with the codes in the previous utterance. Therefore, there are connections between “Probing” and “Professional Skills,” as well as “Probing” and “Surveying.” Connections are also present between “Measurement Strategy” and “Professional Skills,” as well as “Measurement Strategy” and “Surveying.” No connections are made between “Professional Skills” and “Surveying” in this window because co-occurrences are only accumulated within the referring utterance and between the two utterances. The co-occurrences within the previous utterances are calculated in a
different stanza window. Figure 1b shows this stanza as a symmetric adjacency matrix where the codes are represented both as rows and columns. A one represents elements that co-occurred, and a zero represents elements that did not co-occur. Figure 1c shows this stanza represented as a network in and X-Y plane where the elements that co-occurred in that stanza window are now connected while elements that do not co-occur are not connected. In addition, ENA calculates the centroid of the network’s polygon. This centroid allows the entire network to be represented by a single projection point in the X-Y plane (point C in Figure 1c).
Figure 1. (a) Example stanza window coded for three design codes. (b) Example stanza
represented as an adjacency matrix. (c) Example stanza represented as a network
Each utterance is also coded according to speaker, and adjacency matrices are created for each participant. The adjacency matrices are converted into a cumulative adjacency vector and then normalized to control for varying lengths of vectors. Thus, participants who repeated concepts in their discourse are not weighted more heavily than participants who participated less but used the same configuration of connections in their discourse. Finally, the normalized vectors are projected into a high-dimensional space through a singular value decomposition, which is mathematically similar to a Principal Components Analysis (PCA). However, unlike traditional PCA, ENA is performed on the co-occurrence between codes instead of the counts of codes themselves. The singular value decomposition provides a rotation of the original high-dimensional space, such that the rotated space reduces the number of dimensions to show the greatest variance in the data.8,9 Each participant’s adjacency vector that contains the co-occurrences of discourse elements is summarized as a centroid, which is the arithmetic mean of the edge weights of that network, and shown as a single point in the ENA space. Thus, each participant’s discourse can be represented as a network and a point in the ENA space. To interpret the X-Y dimensions of the projected space, ENA places the codes from the original dataset in the ENA space such that the centroid of each student’s network corresponds to the student’s projected point. We can compare a large number of networks simultaneously because centroids that are located in the same part of the projection space correspond to student networks with similar patterns of connections in their discourse. Centroids that are located in other parts of the projection space correspond to networks with different patterns of connections. In our example, X- and Y-axes are superimposed over the networks of Figure 1c. We can interpret this X-Y projection space by analyzing
(a) (b) (c)
X
Y
C
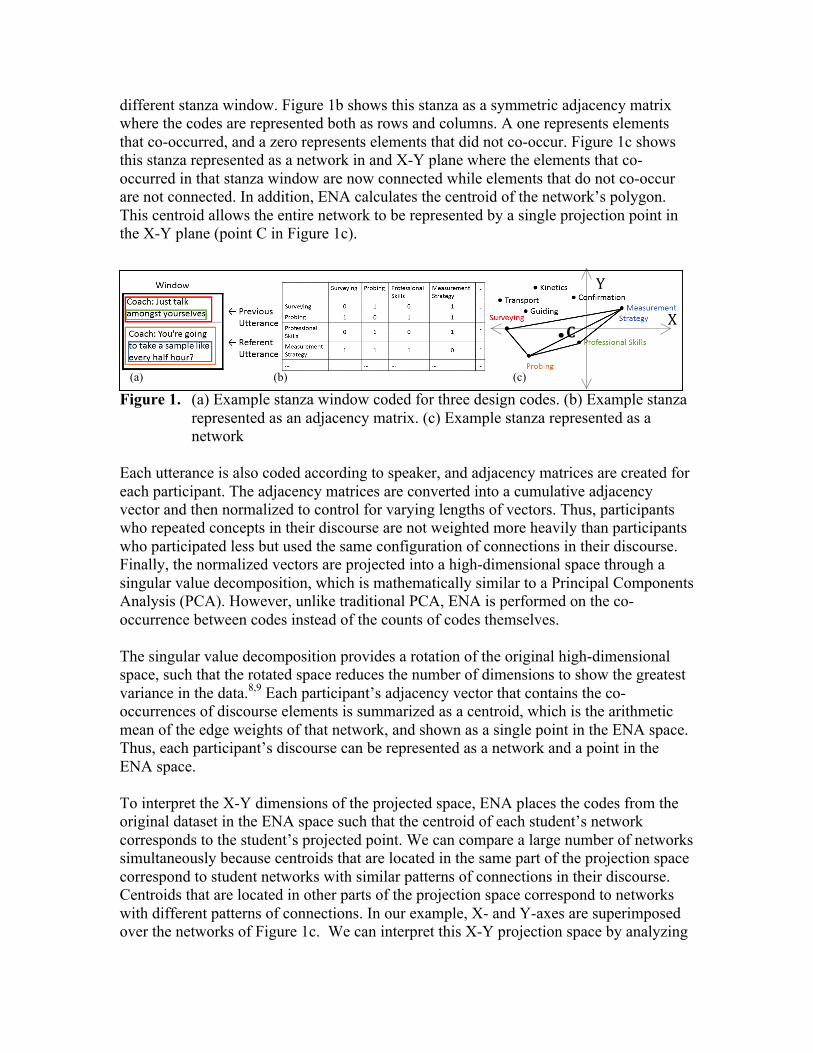
the location of discourse codes in this X-Y plane. “Measurement Strategy” and “Confirmation” are in the positive Y direction. Thus, students who had frequent co-occurrences of the discourse codes of “Measurement Strategy” and “Confirmation” would have strong network connections located in the positive Y-direction. Furthermore, the centroid of this network (not pictured) would be weighted towards the positive Y direction. When this space is created, ENA also provides percentages for each axis that represents the percent of variance in the networks accounted for by that dimension. Results and Discussion These analyses have two foci. The first is to investigate the different approaches taken by the coaches to providing feedback during the first coaching session. Next, we investigate the usefulness of ENA to illuminate new research questions by exploring further the network structure of one of the coaches. Differences in Coaching Approaches: Research Focus One The first research focus was guided by three questions: (1a) To what extent are there differences in approaches to feedback taken by each coach? (1b) What does ENA elucidate as the differences in approaches to feedback practiced by each coach? (1c) Do these identified differences support or refute the findings of previous research into these coaching sessions? In order to investigate the first research focus, we plotted the epistemic networks’ projection points of all of the participants in the coaching sessions. Figure 2 includes the projection points of individual people as dots and the average of these points as a square. Individuals in Coach 1’s sessions are indicated by red dots/square, and individuals who interacted with Coach 2 are blue dots/square. Each coach is a member of multiple coaching sessions and is represented by many dots. Thus, each student is plotted once, and each coach is plotted multiple times. The outline of the rectangle around the squares is the 95% confidence interval of the average of the projection points (and corresponding networks). From the plot in Figure 2, we can conclude that the epistemic network analysis was able to explain 33% of the variance of the coding co-occurrences with the X-axis and 29% of the variance with the Y-axis. In addition, the average networks partitioned by coaches are significantly different along the Y-axis but are not significantly different along the X-axis. Table 2 shows the results of a t-test of means. Note that the Y-dimension has a p-value that is less than .001. We conclude that in response to research question 1a (To what extent are there differences in approaches to feedback taken by each coach?) a statistically significant difference does exist between the approaches of the two coaches. To understand what it means to be significantly different along the Y-axis we turn to the discourse networks of Figure 3.
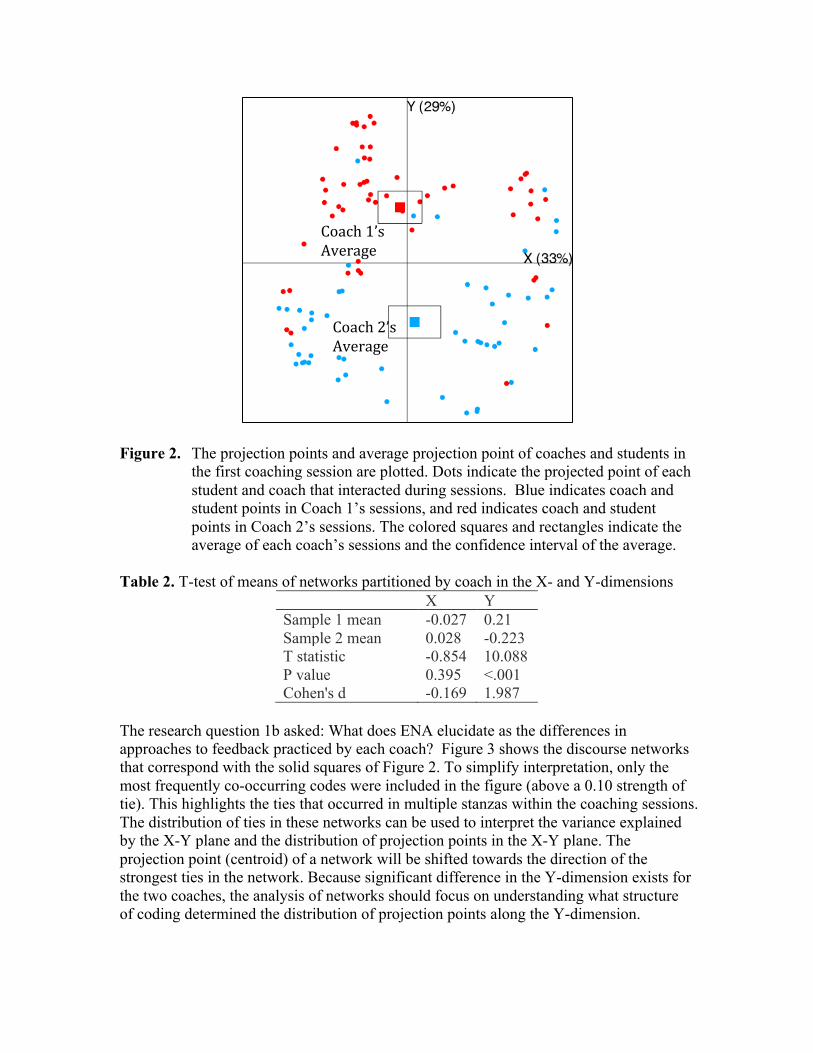
Figure 2. The projection points and average projection point of coaches and students in the first coaching session are plotted. Dots indicate the projected point of each student and coach that interacted during sessions. Blue indicates coach and student points in Coach 1’s sessions, and red indicates coach and student points in Coach 2’s sessions. The colored squares and rectangles indicate the average of each coach’s sessions and the confidence interval of the average.
Table 2. T-test of means of networks partitioned by coach in the X- and Y-dimensions
X Y Sample 1 mean -0.027 0.21 Sample 2 mean 0.028 -0.223 T statistic -0.854 10.088 P value 0.395 <.001 Cohen's d -0.169 1.987
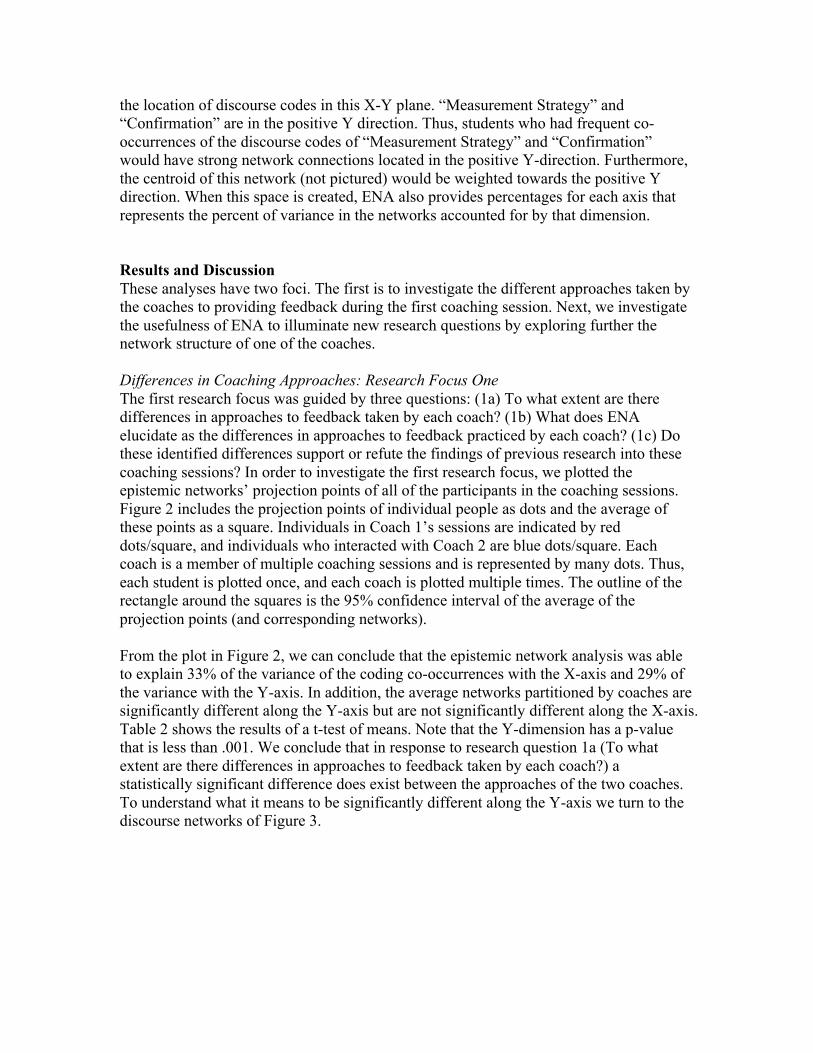
The research question 1b asked: What does ENA elucidate as the differences in approaches to feedback practiced by each coach? Figure 3 shows the discourse networks that correspond with the solid squares of Figure 2. To simplify interpretation, only the most frequently co-occurring codes were included in the figure (above a 0.10 strength of tie). This highlights the ties that occurred in multiple stanzas within the coaching sessions. The distribution of ties in these networks can be used to interpret the variance explained by the X-Y plane and the distribution of projection points in the X-Y plane. The projection point (centroid) of a network will be shifted towards the direction of the strongest ties in the network. Because significant difference in the Y-dimension exists for the two coaches, the analysis of networks should focus on understanding what structure of coding determined the distribution of projection points along the Y-dimension.
Coach2’sAverage
Coach1’sAverage
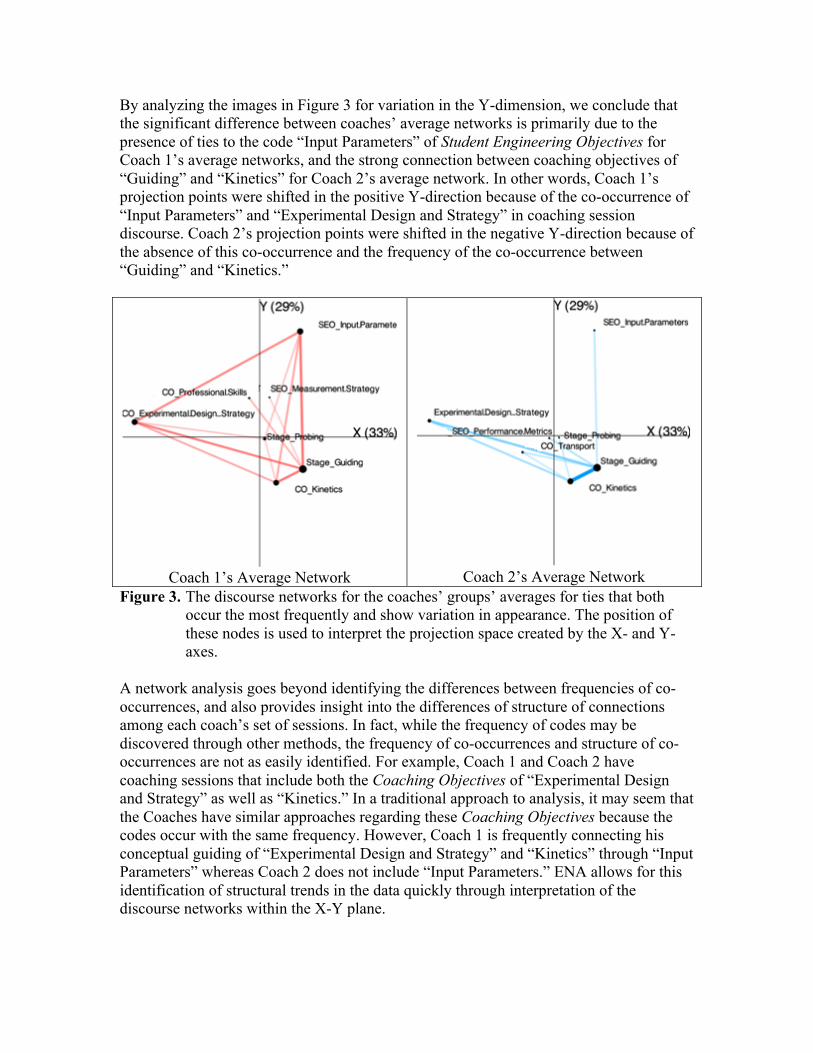
By analyzing the images in Figure 3 for variation in the Y-dimension, we conclude that the significant difference between coaches’ average networks is primarily due to the presence of ties to the code “Input Parameters” of Student Engineering Objectives for Coach 1’s average networks, and the strong connection between coaching objectives of “Guiding” and “Kinetics” for Coach 2’s average network. In other words, Coach 1’s projection points were shifted in the positive Y-direction because of the co-occurrence of “Input Parameters” and “Experimental Design and Strategy” in coaching session discourse. Coach 2’s projection points were shifted in the negative Y-direction because of the absence of this co-occurrence and the frequency of the co-occurrence between “Guiding” and “Kinetics.”
Coach 1’s Average Network
Coach 2’s Average Network
Figure 3. The discourse networks for the coaches’ groups’ averages for ties that both occur the most frequently and show variation in appearance. The position of these nodes is used to interpret the projection space created by the X- and Y-axes.
A network analysis goes beyond identifying the differences between frequencies of co-occurrences, and also provides insight into the differences of structure of connections among each coach’s set of sessions. In fact, while the frequency of codes may be discovered through other methods, the frequency of co-occurrences and structure of co-occurrences are not as easily identified. For example, Coach 1 and Coach 2 have coaching sessions that include both the Coaching Objectives of “Experimental Design and Strategy” as well as “Kinetics.” In a traditional approach to analysis, it may seem that the Coaches have similar approaches regarding these Coaching Objectives because the codes occur with the same frequency. However, Coach 1 is frequently connecting his conceptual guiding of “Experimental Design and Strategy” and “Kinetics” through “Input Parameters” whereas Coach 2 does not include “Input Parameters.” ENA allows for this identification of structural trends in the data quickly through interpretation of the discourse networks within the X-Y plane.
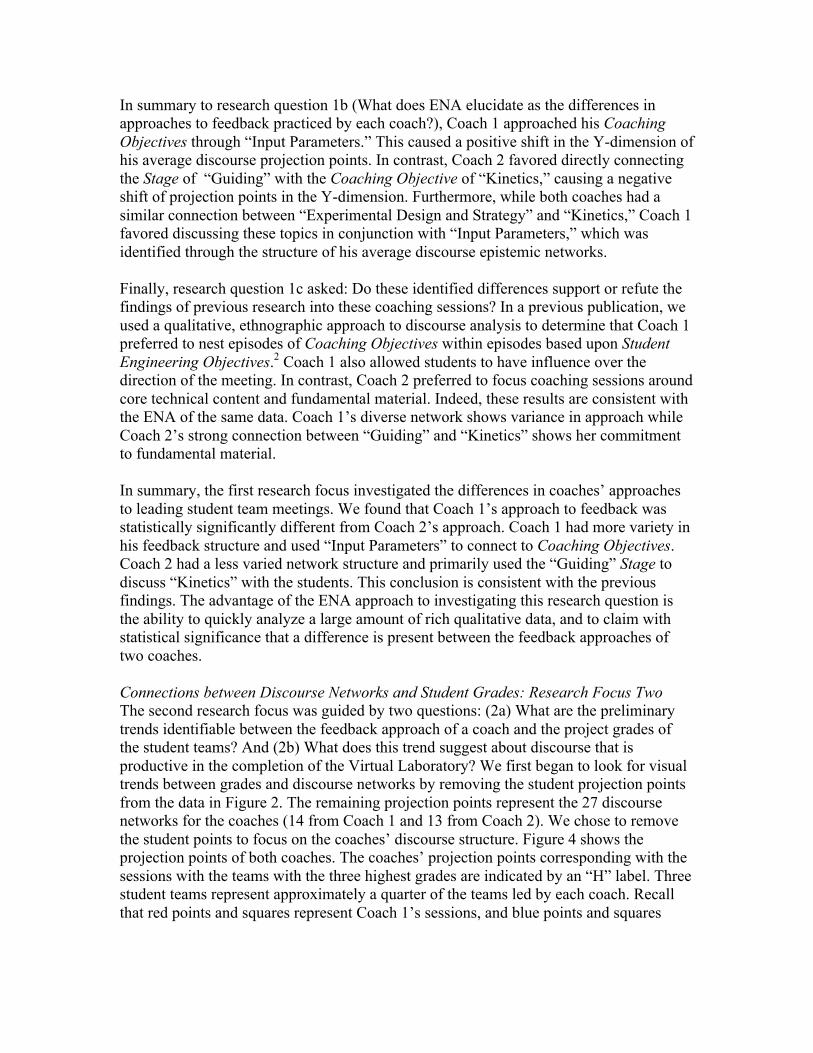
In summary to research question 1b (What does ENA elucidate as the differences in approaches to feedback practiced by each coach?), Coach 1 approached his Coaching Objectives through “Input Parameters.” This caused a positive shift in the Y-dimension of his average discourse projection points. In contrast, Coach 2 favored directly connecting the Stage of “Guiding” with the Coaching Objective of “Kinetics,” causing a negative shift of projection points in the Y-dimension. Furthermore, while both coaches had a similar connection between “Experimental Design and Strategy” and “Kinetics,” Coach 1 favored discussing these topics in conjunction with “Input Parameters,” which was identified through the structure of his average discourse epistemic networks. Finally, research question 1c asked: Do these identified differences support or refute the findings of previous research into these coaching sessions? In a previous publication, we used a qualitative, ethnographic approach to discourse analysis to determine that Coach 1 preferred to nest episodes of Coaching Objectives within episodes based upon Student Engineering Objectives.2 Coach 1 also allowed students to have influence over the direction of the meeting. In contrast, Coach 2 preferred to focus coaching sessions around core technical content and fundamental material. Indeed, these results are consistent with the ENA of the same data. Coach 1’s diverse network shows variance in approach while Coach 2’s strong connection between “Guiding” and “Kinetics” shows her commitment to fundamental material. In summary, the first research focus investigated the differences in coaches’ approaches to leading student team meetings. We found that Coach 1’s approach to feedback was statistically significantly different from Coach 2’s approach. Coach 1 had more variety in his feedback structure and used “Input Parameters” to connect to Coaching Objectives. Coach 2 had a less varied network structure and primarily used the “Guiding” Stage to discuss “Kinetics” with the students. This conclusion is consistent with the previous findings. The advantage of the ENA approach to investigating this research question is the ability to quickly analyze a large amount of rich qualitative data, and to claim with statistical significance that a difference is present between the feedback approaches of two coaches. Connections between Discourse Networks and Student Grades: Research Focus Two The second research focus was guided by two questions: (2a) What are the preliminary trends identifiable between the feedback approach of a coach and the project grades of the student teams? And (2b) What does this trend suggest about discourse that is productive in the completion of the Virtual Laboratory? We first began to look for visual trends between grades and discourse networks by removing the student projection points from the data in Figure 2. The remaining projection points represent the 27 discourse networks for the coaches (14 from Coach 1 and 13 from Coach 2). We chose to remove the student points to focus on the coaches’ discourse structure. Figure 4 shows the projection points of both coaches. The coaches’ projection points corresponding with the sessions with the teams with the three highest grades are indicated by an “H” label. Three student teams represent approximately a quarter of the teams led by each coach. Recall that red points and squares represent Coach 1’s sessions, and blue points and squares
represent Coach 2’s sessions. Figure 4 also includes axes through the average coach networks to facilitate the search for trends.
Figure 4. The projection points of the coaches’ discourse networks in the first coaching
session are plotted. Blue points indicate Coach 1’s sessions, and red points indicate Coach 2’s sessions. The colored squares and rectangles indicate the average of each coach’s points and the confidence interval of the average.
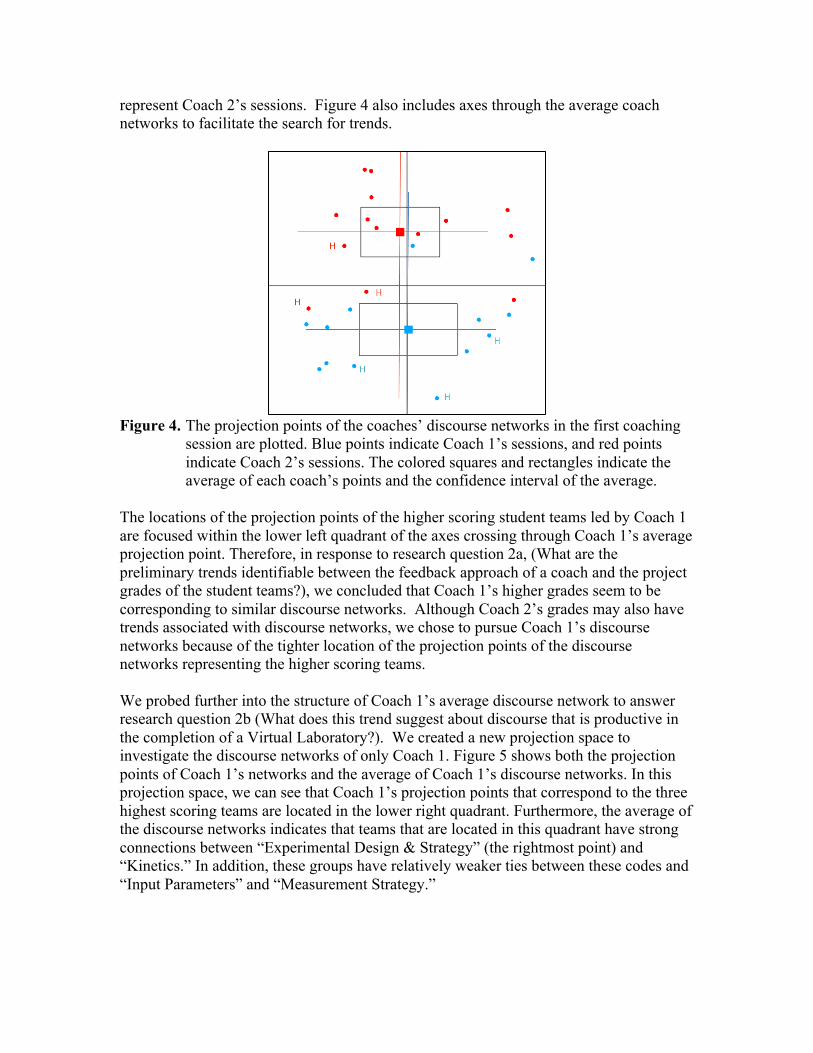
The locations of the projection points of the higher scoring student teams led by Coach 1 are focused within the lower left quadrant of the axes crossing through Coach 1’s average projection point. Therefore, in response to research question 2a, (What are the preliminary trends identifiable between the feedback approach of a coach and the project grades of the student teams?), we concluded that Coach 1’s higher grades seem to be corresponding to similar discourse networks. Although Coach 2’s grades may also have trends associated with discourse networks, we chose to pursue Coach 1’s discourse networks because of the tighter location of the projection points of the discourse networks representing the higher scoring teams. We probed further into the structure of Coach 1’s average discourse network to answer research question 2b (What does this trend suggest about discourse that is productive in the completion of a Virtual Laboratory?). We created a new projection space to investigate the discourse networks of only Coach 1. Figure 5 shows both the projection points of Coach 1’s networks and the average of Coach 1’s discourse networks. In this projection space, we can see that Coach 1’s projection points that correspond to the three highest scoring teams are located in the lower right quadrant. Furthermore, the average of the discourse networks indicates that teams that are located in this quadrant have strong connections between “Experimental Design & Strategy” (the rightmost point) and “Kinetics.” In addition, these groups have relatively weaker ties between these codes and “Input Parameters” and “Measurement Strategy.”
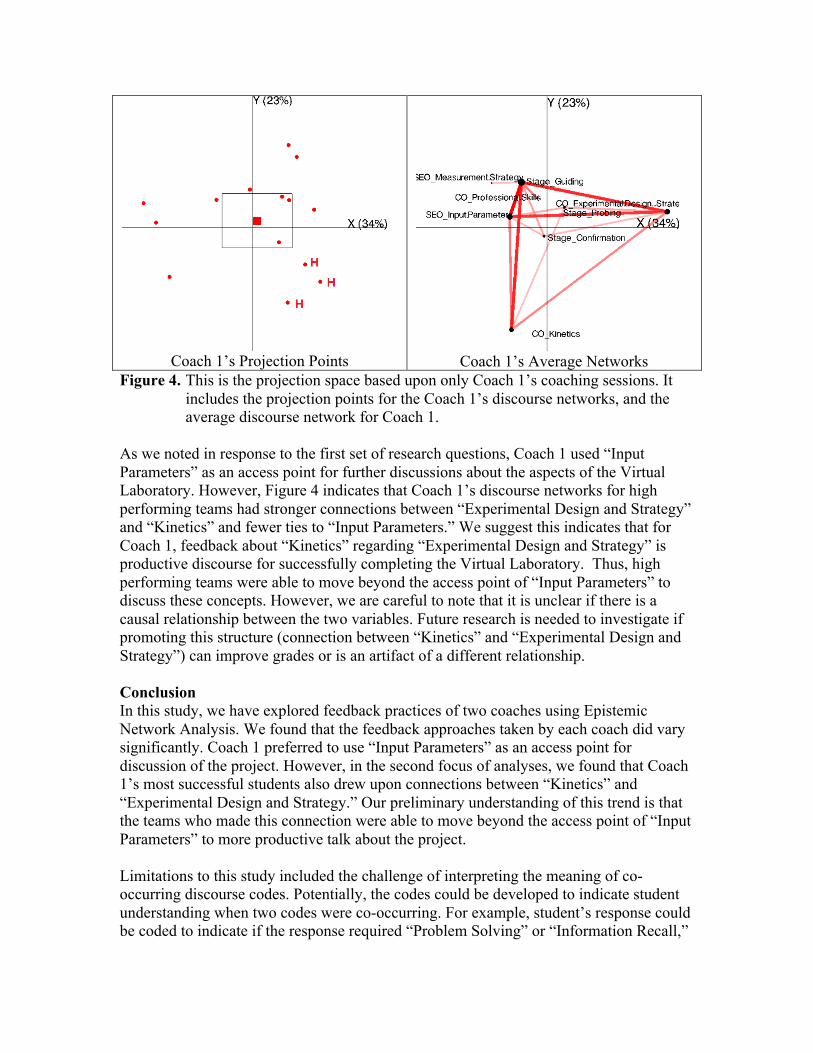
Coach 1’s Projection Points
Coach 1’s Average Networks
Figure 4. This is the projection space based upon only Coach 1’s coaching sessions. It includes the projection points for the Coach 1’s discourse networks, and the average discourse network for Coach 1.
As we noted in response to the first set of research questions, Coach 1 used “Input Parameters” as an access point for further discussions about the aspects of the Virtual Laboratory. However, Figure 4 indicates that Coach 1’s discourse networks for high performing teams had stronger connections between “Experimental Design and Strategy” and “Kinetics” and fewer ties to “Input Parameters.” We suggest this indicates that for Coach 1, feedback about “Kinetics” regarding “Experimental Design and Strategy” is productive discourse for successfully completing the Virtual Laboratory. Thus, high performing teams were able to move beyond the access point of “Input Parameters” to discuss these concepts. However, we are careful to note that it is unclear if there is a causal relationship between the two variables. Future research is needed to investigate if promoting this structure (connection between “Kinetics” and “Experimental Design and Strategy”) can improve grades or is an artifact of a different relationship. Conclusion In this study, we have explored feedback practices of two coaches using Epistemic Network Analysis. We found that the feedback approaches taken by each coach did vary significantly. Coach 1 preferred to use “Input Parameters” as an access point for discussion of the project. However, in the second focus of analyses, we found that Coach 1’s most successful students also drew upon connections between “Kinetics” and “Experimental Design and Strategy.” Our preliminary understanding of this trend is that the teams who made this connection were able to move beyond the access point of “Input Parameters” to more productive talk about the project. Limitations to this study included the challenge of interpreting the meaning of co-occurring discourse codes. Potentially, the codes could be developed to indicate student understanding when two codes were co-occurring. For example, student’s response could be coded to indicate if the response required “Problem Solving” or “Information Recall,”
as well as the Student Engineering Objectives. Thus, the network would be more interpretable based upon the connection between codes that indicated deeper understanding. For example, a student who connected “Problem Solving” with “Input Parameters” would demonstrate a deeper understanding of these parameters. This preliminary investigation suggests a multitude of future studies with ENA and discourse analysis of coach feedback. We are particularly interested in investigating the importance of connecting “Experimental Design and Strategy” with “Kinetics,” as noted in the final results sections. In addition, future studies will explore coaching sessions with different objectives to see if the structural trends continue. References 1. Gilbuena D, Sherrett BU, Koretsky M. Episodes as a discourse analysis framework to examine
feedback in an industrially-situated virtual laboratory project. In: American Society for Engineering Education Annual Conference and Exposition. 2011.
2. Hirshfield L, Whinnery J, Gilbuena D, Koretsky MD. A study of feedback provided to student teams engaged in an open-ended project. In: American Society of Engineering Education Annual Meeting, 2014.
3. Cohen VB. A Reexamination of Feedback in Computer-Based Instruction: Implications for Instructional Design. Education Technology. 1985;25(1), 33–37.
4. Shaffer DW, Hatfield D, Svarovsky G, Nash P, Nulty A, Bagley EA, … Mislevy RJ. Epistemic Network Analysis: A prototype for 21st century assessment of learning. The International Journal of Learning and Media. 2009;1(1), 1-21.
5. Yin RK. Case study research: Design and methods. Sage. 2009. 6. Shaffer DW. User guide for Epistemic Network Analysis web version 3.3. Madison, WI: Games and
Professional Simulations Technical Report 2014-1. 2014. 7. Siebert-Evenstone A, Arastoopour G, Collier W, Swiecki Z, Ruis AR, & Shaffer DW. In search of
conversational grain size: Modeling semantic structure using moving stanza windows. Paper submitted to the 12th International Conference of the Learning Sciences. 2016.
8. Arastoopour G, Swiecki Z, Chesler NC, Shaffer DW. Epistemic Network Analysis as a Tool for Engineering Design Assessment. American Society for Engineering Education Annual Conference. 2015.
9. Arastoopour G, Chesler NC, Shaffer, DW. Epistemic persistence: A simulation-based approach to increasing participation of women in engineering. Journal of Women and Minorities in Science and Engineering, 2014;20(3), 211-234.