nesdc economic report
TRANSCRIPT

www.nesdc.go.th
962 Krung Kasem Road, Pomprab, Bangkok 10100 Office of the National Economic and Social Development Council (NESDC)
Press Release 9.30 a.m. Aug 17, 2020
Thai Economic Performance in Q2 and Outlook for 2020
NESDC ECONOMIC REPORT
Macroeconomic Strategy and Planning Division
The Thai Economy in the second quarter contracted by 12.2 percent, compared with a decrease of 2.0 percent in the previous quarter. After seasonally adjusted, the economy decreased by 9.7 percent from the first quarter (%QoQ sa). In the first half of 2020, the Thai economy declined by 6.9 percent.
On expenditure side: export of goods and services, private consumption, and private investment continually declined, while public investment and government expenditure expanded. On Production side: the accommodation and food service activities, the agriculture sector, the manufacturing sector, the transportation and storage sector, the wholesale and retail trade sector, and the electricity and gas sector declined, while the construction sector, and financial and insurance activities increased.
The Thai economy in 2020 is expected to lie within the range of (-7.8) - (-7.3) percent, mainly due to (i) the sharp decline in numbers and revenues from foreign tourist, (ii) the severe recession of global economy and merchandised trade, (iii) the impact of the outbreak, and (iv) the drought condition. In all, it is expected that export values of goods, private consumption expenditure, and total investment will decline by 10.0 percent, 3.1 percent, and 5.8 percent respectively. Meanwhile, the headline inflation is expected to be in a range of (-1.2) - (-0.7) percent, and the current account tends to register a surplus of 2.5 percent of GDP.
The policy management for the remaining of 2020 should put emphasis on the measures for the Covid-19 prevention and control together with the macroeconomic policy implementation as follows: (1) Coordinating monetary policy and fiscal policy to support economic recovery, especially: (i) Monitoring the implemented policies in order to ensure that they can reach the target group efficiently, be more flexible and be in line with the recovery of each business sector. (ii) Controlling and preventing the spread of potential problems in some production sectors that may affect the financial sector. (iii) Providing a suitable financial environment to support continuous economic recovery: (2) Considering additional reliefs for businesses and workers who experience the difficulty to recover, particularly: (i) Businesses and employees in tourism and related service sectors. (ii) SMEs with potential to recover but face difficulty to access government support. (iii) Temporarily closed businesses and furloughed workers. Together with providing supports for unemployed workers and workers who will initially enter the job market. (3) Driving export of goods to generate foreign-currency income to compensate the decrease in foreign tourist income and to encourage the recovery of production and private investment, emphasizing on: (i) Driving exports of goods benefited from trade diversion and relocation in the previous period, as well as the export products benefited from the outbreak. (ii) Advertising and utilizing the strengths of Thailand, especially the success in controlling and preventing the spread of COVID-19. (iii) Promoting economic and trade cooperation between ASEAN’s countries. (4) Supporting agricultural sector that experienced severe drought and decrease in export prices, especially by: (i) Providing water resource and water management to the agricultural sector. (ii) Providing immediate compensation to farmers affected by drought. (iii) Improving production process in agricultural sector. (iv) Supporting online distribution channels for agricultural products, and low logistics cost. (5) Driving government expenditure, including the FY2020 and FY2021 annual budget disbursement in the first quarter, and the carry-over budget disbursement, together with the further driving measures for supporting long-term economic expansion. (6) Promoting domestic tourism and the purchase of domestic-made product. (7) Preparing measure to handle additional risks factors, especially the prolonged outbreak in major countries and the possibility of a second wave, the fluctuation of global economic and financial market, and risks from global economic condition in the medium term.
Economic Projection of 2020
(%YoY) 2019 2020
Year Q4 Q1 Year (f) Q2
GDP (CVM) 2.4 1.5 -2.0 (-7.8) - (-7.3) -12.2
Investment1/ 2.1 0.8 -6.5 -5.8 -8.0
Private 2.8 2.6 -5.4 -10.2 -15.0
Public 0.2 -5.1 -9.3 8.6 12.5
Private Consumption 4.5 4.1 2.7 -3.1 -6.6
Government Consumption 1.4 -0.9 -2.8 3.6 1.4
Export of Goods2/ -3.3 -5.2 1.4 -10.0 -17.8
Volume2/ -3.7 -5.6 1.8 -9.0 -16.1
Import of Goods2/ -5.6 -8.0 -1.0 -15.4 -23.4
Volume2/ -5.7 -8.6 -0.1 -12.4 -19.2
Current Account to 7.0 7.5 6.7 2.5 -0.8
GDP (%)
Inflation 0.7 0.4 0.4 (-1.2) - (-0.7) -2.7
Note: 1/ Investment means Gross Fixed Capital Formation 2/ base on the Bank of Thailand’s data

Macroeconomic Strategy and Planning Division
NESDC Economic Outlook
Aug 17, 2020 2
Private consumption decreased following the loose of income base, change of consumer behavior
and, government measures controlling situation under COVID-19 pandemic. However, the
government measures were a key factor to mitigate effects of outbreak and prevent the further
severe decline of private spending in this quarter. In the second quarter of 2020, private consumption
dropped by 6.6 percent compared with a 2.7-percent expansion in the previous quarter. The decrease in
consumption was due to a decline in spending in several categories of goods and services, such as (i) a purchase
of vehicles in line with the sales of the commercial car, sales of passenger car and sales of motorcycle sale
which dropped by 58.0, 42.9, and 28.1 percent respectively, (ii) a purchase of clothing and footwear
decreased by 21.4 in line with a 21.5-percent drop in the textile and clothing import index, (iii) a spending
for restaurants and hotels dropped by 45.8 percent in regard with a 75.2-percent drop in hotel and
restaurant VAT index, and (iv) a 17.1-percent drop in alcohol beverages in line with a 41.1-percent drop in sales
of beer. However, a spending for household water and electricity increased by 3.8 percent in line with
an 11.1-percent increase in the household electricity consumption index, which positively impacted from
the social distancing and work from home activities. The decline in private consumption expenditure in
this quarter was a result of the loose of people income bases in the economic system, changes in consumer
behavior to prevent risks from the COVID-19 pandemic, and the government measures to control situation
under COVID-19. However, the government also implemented the state aid measures to mitigate effects
on private spending to not be more severe in this quarter. Consumer Confidence Index, pertaining the
overall economic situation, stood at 40.3 compared with 49.7 in the previous quarter.
In the first half of 2020, private consumption expenditure decreased by 2.1 percent.
Private investment decreased, following a decline of investment in machinery and equipment, and
construction. In the second quarter of 2020, private investment decreased by 15.0 percent, compared with
a 5.4-percent decrease in the previous quarter. Investment in machinery and equipment decreased by
18.4 percent, compared with a 5.7-percent drop in the previous quarter. This was in line with the decrease
in the import volume of capital goods, domestic sales of machinery and equipment, and a decline in the
number of news registrated vehicles , by 19.6 percent, 22.5 percent and 24.5 percent, respectively.
Investment in construction dropped by 2.1 percent compared to a 4.3-percent drop in the previous
quarter. This was in line with a 1.2-percent drop in municipal construction permitted areas compared to a
2.1-percent drop in the previous quarter, and the domestic building material sales index which rose by 2.7
percent, compared with a 0.3-percent drop in the previous quarter. Business Confident Index stood at 35.2
compared with 45.1 in the previous quarter.
In the first half of 2020, private investment expenditure decreased by 10.2 percent compared with 2.4
percent in the second half of 2019.
1. The Thai Economy in Q2/2020
In the second quarter of 2020, export of goods, private consumption expenditures and investment declined.
Expenditure Side:
Private consumption decreased following a reduction in durable goods and semi-durable goods spending, while non-durable spending increased.
Private investment decreased by 15.0 percent, following a decline of investment in machinery and equipment as well as investment in construction.
40.0
45.0
50.0
55.0
60.065.0
70.0
75.0
-8
-6
-4
-2
02
4
6
Index%YoYPrivate consumption expenditure decreased
Private consumption expenditure (LHS)Consumer confidence index (RHS)
Source: NESDC, University of the Thai Chamber of Commerce Source: NESDC, BOT, Department of Energy Business
-60.0
-40.0
-20.0
0.0
20.0
40.0
-8.0-6.0-4.0-2.00.02.04.06.0
%YoY
Private consumption expenditure and key indicatorsPrivate consumption expenditure (LHS)Sales of benzene, gasohol and diesel indexHousehold electricity consumption indexImport of textiles indexSales of passenger cars

Macroeconomic Strategy and Planning Division
NESDC Economic Outlook
Aug 17, 2020 3
Exports in US dollar term decreased following the global economic and trade slowdown, and
limitation of transportation leading to higher cost of logistics. Export value in the second quarter of
2020 was recorded at 49.8 billion us dollars, decreased by 17.8 percent (the lowest recorded since the
second quarter of 2009, fell by 25.6 percent), compared with a 1.4-percent growth in the previous quarter.
The export volume index dropped by 16.1 percent, compared with a 1.8-percent increase in the previous
quarter following the decrease in some economic activities in key trading partners, the global economy
and trading slowdown, and limitation of transportation leading to higher cost of logistics. The export
volume of fishery products and manufacturing products decreased by 7.9 and 18.6 percent, respectively.
However, the export volume of agricultural commodities expanded by 3.6 percent. The export price
dropped by 2.0 percent, accelerating from a 0.4-percent decline in the previous quarter. Excluding
unwrought gold, export value fell by 21.4 percent, decelerating from a 3.2-percent decrease in the
previous quarter. In baht term, export value was recorded at 1,592 billion Baht, decreased by 16.8
percent, compared with a 0.4-percent growth in the previous quarter.
In the first half of 2020, both export value in US dollar term and Baht term decreased by 8.2 percent.
Exports value of agricultural commodities increased by 4.2 percent, compared with a 10.5-percent decline
in the previous quarter due to the growth in export of main agricultural products to China, especially tapioca and fruits, as well as the recovery of demand in key trading countries. However, exports value of rice, rubber
and sugar decreased. Exports value of manufacturing products declined by 20.6 percent, compared with a
3.0-percent drop in the previous quarter as a result of the reduction in certain economic activities in the key
trading partners and limitation of logistic system. Exports value of fishery products decreased by 12.7
percent due to the reduction in exports quantity and price. Exports value of other products rose by 68.5
percent as a result of the increase in exports of non-monetary gold recorded at 73.3 percent.
Export items with decreased value included passenger cars (-45.2 percent), pick up & trucks (-67.7
percent), vehicle parts & accessories (-45.0 percent), electronics (-6.6 percent), machinery & equipment
(-23.4 percent), chemicals (-20.4 percent), petro-chemical products(-18.9 percent), petroleum products
(-42.7 percent), rice (-0.9 percent), rubber (-41.0 percent), sugar (-28.4 percent), and crustaceans (-15.3 percent). On the other hand, export items with increased value included computer (5.8 percent), rubber
products (23.4 percent), fruits (47.4 percent), tapioca (0.3 percent), fish canned, prepared, or preserved
(17.9 percent), animal food (24.0 percent), and non-monetary gold (73.3 percent).
Export in US dollar term decreased by 17.8 percent as a result of the global economic and trade slowdown, and limitation of transportation leading to higher cost of logistics. Export value excluding unwrought gold fell by 21.4 percent. Export quantity declined by 16.1 percent and export price decreased by 2.0 percent. In Baht term, export value decreased by 16.8 percent.
Export value of agricultural commodities increased, mainly due to the growth in export of tapioca and fruits to China. Export value of manufacturing products declined, as a result of a reduction in certain economic activities in key trading partners, and limitation of logistic system. Export value of fishery products dropped, in accordance with the domestic production.

Macroeconomic Strategy and Planning Division
NESDC Economic Outlook
Aug 17, 2020 4
Export markets: exports to the US and China increased, while exports to Japan, ASEAN (9), EU
( 1 5 ) , Australia, and the Middle East (15) declined. Exports to the US increased by 8.9 percent.
Excluding military drill weaponry reshipment, export value recorded at a 1.1-percent growth, following
the growth in exports of computer & accessories, solar cells, fish canned, prepared, or preserved and
animal food. Exports to China rose by 12.1 percent as a result of an increase in exports of fruits, rubber
products, and vehicles, parts & accessories. Exports to Japan decreased by 13.5 percent, due to the
contraction in exports of vehicles, parts & accessories, plastic resin and machinery & parts. Similarly,
exports to ASEAN (9) decreased by 22.3 percent as a result of a contraction in exports to ASEAN (5) and
CLMV by 19.7 and 25.8 percent, respectively. In addition, exports to EU (15) decreased by 30.3 percent,
due to the contraction in exports of vehicles, parts & accessories, computer & accessories, and air
conditioning machines. Exports to Australia contracted by 16.1 percent, mainly due to a contraction in
exports of vehicles, parts & accessories. Also, exports to the Middle East (15) decreased by 19.7 percent,
as a result of the decrease in exports of vehicles, parts & accessories, jewelry, and rubber products.
Export Value of Major Product in US Dollar Term
%YoY 2019 2020 Share Q2/20 (%) Year H1 H2 Q1 Q2 Q3 Q4 H1 Q1 Q2
Agriculture -8.4 -3.6 -13.4 -2.1 -4.9 -8.9 -17.8 -3.1 -10.5 4.2 9.0 Rice - 5. - . -34. - . - 3. -35. -33. - 4. - 5. - . . Rubber - . - .4 - .5 - . - . -3. - 5. - . - . -4 . .3 Tapioca - . - . -33. - 4. - .5 - .3 -3 . - . - . .3 . Fruits 3 .4 4 .3 . . 3 . 4 .4 . . - . 4 .4 3.
Manufacturing -3.9 -3.5 -4.2 -1.7 -5.4 -4.9 -3.4 -11.6 -3.0 -20.6 81.3 Sugar 3.3 - . .4 - 5. - . . 54. - . . - .4 . Fish canned, prepared, or preserved - . 4. -5. . . -3. - .4 . -3.4 . . Beverages . 5.5 . - . . 5. .4 -4. 3. - . . Rubber products - . - . - . 4. - 3. - 4. - .5 4. . 3.4 . Animal food 4.3 5. . . - . . 3. . . 4. . Apparels and Textile - . - .5 - . - . -4. - . -3. - . -5.5 - . .4 Electronics - . - .4 -3. - .4 - .4 - . . - . 5.3 - . 5.3
- Computer . 3 . 5. 4 . . .4 . .4 . 5. .3 - Computer parts &
accessories - .4 - 5.5 -3. - . - . - . 5. .5 5. - . 5. - Integrated circuits & - . - . -5. - .3 - 4.3 - . - . -5. - .3 -5. 3.3 - Printed circuits - 3. - . - 5.4 - .4 - 3. - 5.4 - 5.3 - . .3 - .5 .5
Electrical appliances . - .4 3. -4.5 . . 5. - .4 5. - . 5. - Air condition machines 4.4 3.3 . -3.3 . 4. . - .3 4. - . . - Parts of electrical
appliances 3. - .3 .3 - . . .5 . 3. .4 -4. . Metal & steel - . - . - . -5. - . -4. - . -5. . - . 4.3 Automotive -3. -3. -3. - . -3.5 - .5 -5. - . - . -4 . .
- Passenger car - . - .5 -4. - . - . -4.4 -4. - .4 - . -45. . - Pick up and trucks -3. 3.4 - . . -4.3 . - .3 -4 . - .4 - . . - Vehicle parts & - . . - .4 - . . . -3. - . . -45. 4.4
Machinery & equipment - . -4. - .5 -3.3 - .4 - . - . - 5. - . - 3.4 .5 Chemicals - . - . - .5 - . - . - . - . - . - 4. - .4 . Petro-chemical products - . - .3 - . - . - . - . - .3 - 4. - . - . 5.3 Petroleum products - . - . -3 .4 - .3 - 4.4 - . -3 . - 3. -4.4 -4 . .
Fishery -6.5 -12.0 -1.2 -15.0 -9.2 -2.8 0.4 -9.9 -6.7 -12.7 0.8 Crustaceans - .3 - . - . - 4.3 - .4 . -5. - 4. - 3. - 5.3 .4
Other Exports 80.3 38.9 132.3 6.7 66.2 317.3 -11.5 119.3 212.4 68.5 7.9 Non-monetary gold (excl. articles of goldsmiths) 4. 4 . 4 . . . 34 . - .4 5.4 3.5 3.3 .
Total Exports (Customs basis) -2.6 -2.8 -2.5 -1.9 -3.8 -0.5 -4.4 -7.1 0.9 -15.2 100.0 Exports, f.o.b. (BOP basis) -3.3 -4.0 -2.7 -3.7 -4.2 -0.3 -5.2 -8.2 1.4 -17.8 96.4 Export Value (exclude gold) -5.0 -4.9 -5.0 -4.0 -5.8 -5.0 -5.0 -12.3 -3.2 -21.4 88.6 Source: Bank of Thailand
Exports to the US and China increased, while export to Japan, ASEAN (9), EU (15), Australia, and the Middle East (15) declined.

Macroeconomic Strategy and Planning Division
NESDC Economic Outlook
Aug 17, 2020 5
Import value in US dollar term decreased by 23.4 percent (continued to decline for the sixth consecutive quarter).
Import value in US dollar term continued to decline from the previous quarter in accordance with a
decrease of exports, domestic demand, and import price. In the second quarter of 2020, the value of import was recorded at 41.8 billion US dollars, declined by 23.4 percent, compared with a 1.0-percent decline in the previous quarter. Import quantity dropped by 19.3 percent, compared with a 0.1-percent decline in the previous quarter associated with the decrease in all classification of import quantity composed by consumer goods, capital goods and raw materials & intermediate goods with the fall of by 16.3, 19.4, and 13.6 percent, respectively. Price of import decreased by 5.1 percent, compared with a 0.9-percent decrease in the previous quarter. Import value excluding unwrought gold declined by 21.5 percent. In Thai Baht term,
the import value was recorded at 1,335 billion Baht decreased by 22.5 percent, compared with a 2.1-percent drop in the previous quarter.
In the first half of 2020, import value was recorded at 94.6 billion US dollars decreased by 12.3 percent. Quantity and import price fall by 9.7, and 3.0 percent, respectively. In Thai Baht term, import value was recorded at 2,986 billion Baht decreased by 12.4 percent.
Export Value to Key Markets in US Dollar Term %YOY 2019 Share
Q2/20 (%) 2020
Year H1 H2 Q1 Q2 Q3 Q4 H1 Q1 Q2 Total Exports (Mil US$) (Customs basis) 246,269 123,074 123,195 62,110 60,963 63,597 59,598 114,343 62,672 51,671 100.0 (%YoY) -2.6 -2.8 -2.5 -1.9 -3.8 -0.5 -4.4 -7.1 0.9 -15.2
United States . .3 . 3 . 3.3 . 5.5 .5 - . . 5. - excluding military drill
weaponry reshipment 5. 3.4 .5 3.5 3. . 5.4 .3 5. . 4.
Japan - . - . - .4 - .4 - .5 . -5.3 - .3 -5.5 - 3.5 . EU ( 5) -5. - . -5. - .3 - . -5. -5. - . -3. -3 .3 . China -3. - . . - .3 5. . . 5. - . . 5.4 ASEAN ( ) - .3 -5. - .3 -4.4 -5. - 4. - .3 - . 4.3 - .3 3. - ASEAN (5)* - . - . - .3 - . - . - . - . - . 5. - . 3. - CLMV** - .3 - . - . . - . - . - . - . . - 5. . Middle East ( 5) .4 - . 3. - .3 -5. . 5. - . .4 - . 3. Australia -5. - . - . 3 - . - .5 4. - 4. - . -3.3 - . 4. Hong Kong - .5 - .4 -3.5 - 3. -5. -5.4 - . .4 .3 - . 5.3 India -3. . - . .4 4.3 - . - 4.3 -3 . - . - . .3 South Korea -4.3 -3. -5. -5. - .3 - . - . - 5. -4. - 5.4 . Taiwan . - . . - 4.4 -5.3 .3 5.3 - . . - . .
Note: * ASEAN (5) consist of Brunei, Indonesia, Malaysia, Philippines, and Singapore ** CLMV consist of Cambodia, Laos, Myanmar, and Vietnam Source: Bank of Thailand
By categories, there was a decline in import value of consumer goods, capital goods, raw materials and
intermediate goods, and other import goods. Import value of consumer goods declined by 15.5 percent
compared with a 16.3-percent decrease of import quantity as associated with the decline in private domestic
demand, while import price increased by 1.0 percent. Import value of capital goods decreased by 18.3
percent following the decrease in import quantity by 19.4 percent, in accordance with a decrease in
domestic investment, while import price increased by 1.3 percent. Import value of raw materials and
intermediate goods reduced by 23.4 percent with decrease in import quantity and import price by 13.6 and
11.3 percent, respectively. Import value of other goods fell by 46.0 percent associated with the decrease in
non-monetary gold and automotive, respectively.
-30.0
-20.0
-10.0
0.0
10.0
20.0
Q2/16 Q2/17 Q2/18 Q2/19 Q2/20
%YoY Import Indices
Price Value Volume
Source: Bank of Thailand Source: Bank of Thailand
-30.0
-20.0
-10.0
0.0
10.0
20.0
30.0
Q2/16 Q2/17 Q2/18 Q2/19 Q2/20
%YoYImport Classified by Economic Classification
Consumer goods
Raw materials and intermediate goods
Capital goods
Total
Macroeconomic Strategy and Planning Division
NESDC Economic Outlook
Aug 17, 2020 6
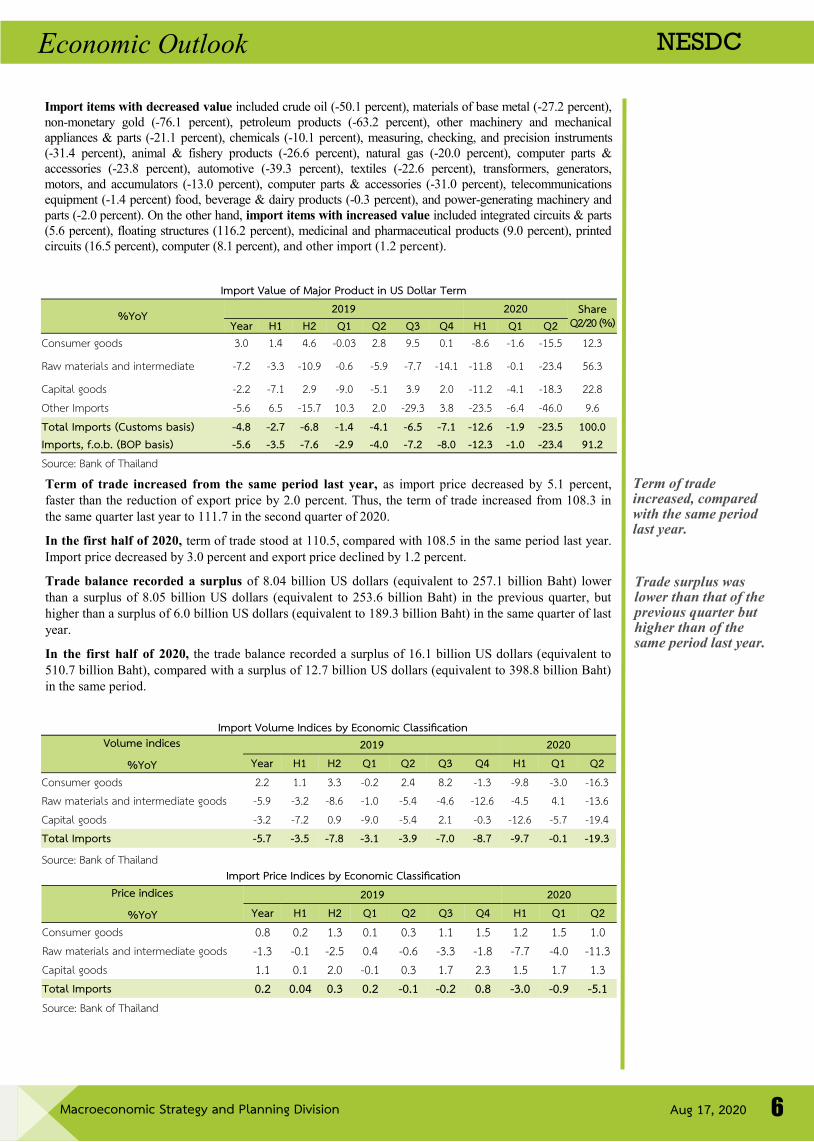
Import items with decreased value included crude oil (-50.1 percent), materials of base metal (-27.2 percent),
non-monetary gold (-76.1 percent), petroleum products (-63.2 percent), other machinery and mechanical
appliances & parts (-21.1 percent), chemicals (-10.1 percent), measuring, checking, and precision instruments
(-31.4 percent), animal & fishery products (-26.6 percent), natural gas (-20.0 percent), computer parts &
accessories (-23.8 percent), automotive (-39.3 percent), textiles (-22.6 percent), transformers, generators,
motors, and accumulators (-13.0 percent), computer parts & accessories (-31.0 percent), telecommunications
equipment (-1.4 percent) food, beverage & dairy products (-0.3 percent), and power-generating machinery and
parts (-2.0 percent). On the other hand, import items with increased value included integrated circuits & parts
(5.6 percent), floating structures (116.2 percent), medicinal and pharmaceutical products (9.0 percent), printed
circuits (16.5 percent), computer (8.1 percent), and other import (1.2 percent).
Term of trade increased from the same period last year, as import price decreased by 5.1 percent,
faster than the reduction of export price by 2.0 percent. Thus, the term of trade increased from 108.3 in
the same quarter last year to 111.7 in the second quarter of 2020.
In the first half of 2020, term of trade stood at 110.5, compared with 108.5 in the same period last year.
Import price decreased by 3.0 percent and export price declined by 1.2 percent.
Trade balance recorded a surplus of 8.04 billion US dollars (equivalent to 257.1 billion Baht) lower
than a surplus of 8.05 billion US dollars (equivalent to 253.6 billion Baht) in the previous quarter, but
higher than a surplus of 6.0 billion US dollars (equivalent to 189.3 billion Baht) in the same quarter of last
year.
In the first half of 2020, the trade balance recorded a surplus of 16.1 billion US dollars (equivalent to
510.7 billion Baht), compared with a surplus of 12.7 billion US dollars (equivalent to 398.8 billion Baht)
in the same period.
Term of trade increased, compared with the same period last year.
Import Value of Major Product in US Dollar Term
%YoY 2019 Share Q2/20 (%)
2020 Year H1 H2 Q1 Q2 Q3 Q4 H1 Q1 Q2
Consumer goods 3. .4 4. - . 3 . .5 . - . - . - 5.5 .3
Raw materials and intermediate - . -3.3 - . - . -5. - . - 4. - . - . - 3.4 5 .3
Capital goods - . - . . - . -5. 3. . - . -4. - .3 . Other Imports -5. .5 - 5. .3 . - .3 3. - 3.5 - .4 -4 . . Total Imports (Customs basis) -4.8 -2.7 -6.8 -1.4 -4.1 -6.5 -7.1 -12.6 -1.9 -23.5 100.0 Imports, f.o.b. (BOP basis) -5.6 -3.5 -7.6 -2.9 -4.0 -7.2 -8.0 -12.3 -1.0 -23.4 91.2 Source: Bank of Thailand
Import Volume Indices by Economic Classification Volume indices
%YoY 2019 2020
Year H1 H2 Q1 Q2 Q3 Q4 H1 Q1 Q2 Consumer goods . . 3.3 - . .4 . - .3 - . -3. - .3 Raw materials and intermediate goods -5. -3. - . - . -5.4 -4. - . -4.5 4. - 3. Capital goods -3. - . . - . -5.4 . - .3 - . -5. - .4 Total Imports -5.7 -3.5 -7.8 -3.1 -3.9 -7.0 -8.7 -9.7 -0.1 -19.3 Source: Bank of Thailand
Import Price Indices by Economic Classification Price indices
%YoY 2019 2020
Year H1 H2 Q1 Q2 Q3 Q4 H1 Q1 Q2 Consumer goods . . .3 . .3 . .5 . .5 . Raw materials and intermediate goods - .3 - . - .5 .4 - . -3.3 - . - . -4. - .3 Capital goods . . . - . .3 . .3 .5 . .3 Total Imports 0.2 0.04 0.3 0.2 -0.1 -0.2 0.8 -3.0 -0.9 -5.1 Source: Bank of Thailand
Trade surplus was lower than that of the previous quarter but higher than of the same period last year.

Macroeconomic Strategy and Planning Division
NESDC Economic Outlook
Aug 17, 2020 7
Agriculture sector continually declined due to the drought and the lower level of water in most
reservoirs and natural water resources. Production in agricultural sector, forestry, and fisheries
contracted by 3.2 percent, continuously dropped from a 9.8-percent decrease in the previous quarter. This
was in line with a contraction of Agricultural Production Index of 4.7 percent. The production of
Agricultural product decreased, yet likely to rebound, including (i) maize (-28.2 percent) resulting
from drought and the outbreak of pest, and (ii) cassava (-5.1 percent) caused by drought and a prolonged
periods of delayed rain. The production of agricultural products that continued to decline such as (i)
paddy (-43.7 percent) resulting from drought and a prolonged period of delayed rain during the growing
season where dam reservoir level was lower than the same period last year, (ii) sugarcane (-100.0 percent)
as the harvesting season finished faster than last year, and (iii) white shrimp (-16.1 percent) resulting from
decrease in demand during COVID-19 pandemic. Nevertheless, major agricultural products with
production expansion included fruits (10.9 percent), poultry (15.0 percent), oil palm (4.3 percent), rubber
(0.9 percent), and egg (1.0 percent), etc. Agricultural Price Index decreased by 1.4 percent compared to
an increase of 8.8 percent in the previous quarter. Such increase in API index was mainly contributed by
the decrease in price index of certain products, such as rubber (-27.0 percent), swine (-5.2 percent),
poultry (-7.1 percent), cassava (-10.1 percent), and white shrimp (-3.5 percent). In contrast, major
agricultural price index with the increased price index consisted of paddy (12.7 percent), oil palm (31.5
percent), sugarcane (4.4 percent), fruits (0.9 percent), and egg (3.8 percent). Dropping in both agricultural
production index and agricultural price index led to overall decrease for three consecutive quarter in Farm
Income Index by 6.0 percent.
In the first half of 2020, agricultural sector contracted by 6.7 percent, continuously dropped from a 0.6-
percent decrease in the second half of 2019. Agricultural Production Index shrank by 9.2 percent, while
Agricultural Price Index increased by 3.8 percent, and Farm Income Index decreased by 6.1 percent.
Agricultural sector declined for three consecutive quarters by 3.2 percent, following a decrease of some agricultural products which are affected by drought. Farm Income decreased due to the decline of price and production of agricultural products.
Manufacturing sector decreased continually from the previous quarter due to a dramatic decline in
export value and global economic during impact of COVID-19 and lockdown policies. Production in
manufacturing sector dropped sharply by 14.4 percent followed a drop of 2.6 percent in Q1/2020. Such
decrease in production found in accordance with the 20.0-percent drop in Manufacturing Production Index.
Manufacturing Production Index of the industries (with 30 - 60 percent export share to total
production) drastically declined by 50.9 percent, due mainly to the decline in major semi-export-oriented
industries, including production of vehicles (-68.8 percent), tires (-46.5 percent), bicycle (-57.5 percent),
textiles (-40.1 percent) and sugar (-36.5 percent), respectively. Manufacturing Production Index of
export-oriented industries (with export share of more than 60 percent to total production) declined by
13.1 percent in Q2/2020 from a drop of 1.3-percent in the previous quarter. A contraction was contributed by
the decrease in production of key products included other general-purpose machinery (-39.4 percent),
electronic components (-7.2 percent), other rubber products (-9.9 percent), clothing (-18.4 percent) and
laboratory apparatus, surgical and medical instruments (-39.6 percent), respectively. Manufacturing
Production Index of the domestic-oriented industries (with export share of less than 30 percent to total
production) declined by 7.6 percent compared to a drop of 1.8-percent in Q1/2020. The contraction was
caused by the decrease in production of major industries, such as refined petroleum products (-15.5 percent),
steel (-19.4 percent), malt liquors (-43.8 percent), parts and accessories for motor vehicles (-61.9 percent), wire
(-21.9 percent), respectively. The average capacity utilization rate stood at 52.9 percent, declined from 66.9
percent in the previous quarter and declined from 65.0 percent in the same quarter last year.
Sectors which experienced a production drop in Q2/2020 included: accommodation and food services, manufacturing, agriculture, transportation, wholesale & retail trade, and electricity, gas, steam and air conditioning supply. Meanwhile, production in construction sector increased.
Production Side:
Manufacturing sector continually dropped sharply by 14.4 for four consecutive quarters owing to a contraction of all group in industries index.
Manufacturing Production Index of the industries (with 30 - 60 percent export share to total production) declined by 50.9 percent.
Manufacturing Production Index of export-oriented industries (with export share of more than 60 percent to total production) declined by 13.1 percent.
Manufacturing Production Index of the domestic-oriented industries (with export share of less than 30 percent to total production) declined by 7.6 percent.
The average capacity utilization rate stood at 52.9 percent
-20
-10
0
10
20
30
Q2/16 Q2/17 Q2/18 Q2/19 Q2/20
(%YoY)
Agr. production index Agr. price indexFarm income index
Source: Office of Agricultural Economics
Farm Income Index decreased by 6.0 percent due to the decrease of agricultural production index
and agricultural price index
The prices of paddy, oil palm and sugarcane increased while prices of rubber and cassava declined.
Source: Office of Agricultural Economics
-75-50-25
0255075
100125150
Q2/16 Q2/17 Q2/18 Q2/19 Q2/20
(%YoY)Paddy CassavaUnsmoked Sheet no.3 oil palmSugarcane

Macroeconomic Strategy and Planning Division
NESDC Economic Outlook
Aug 17, 2020 8
Manufacturing Production Index with negative growth principally included vehicles (-68.8 percent),
refined petroleum products (-15.5 percent), other general-purpose machinery (-39.4 percent), sugar (-36.5
percent), tires (-46.5 percent), steel (-19.4 percent), bicycle (-57.5 percent), malt liquors (-43.8 percent),
electronic components (-7.2 percent), and textiles (-40.1 percent).
Manufacturing Production Index with positive growth mainly included processed and preserved fish
(28.6 percent), pharmaceuticals (15.4 percent), animal feed (7.0 percent), concrete (5.2 percent), fertilizers
(18.7 percent), dairy products (5.6 percent), cans (7.0 percent), processing and preserving of poultry (3.9
percent), vegetable oils (18.3 percent), and electronic and electric wires and cables (4.8 percent).
In the first half of 2020, manufacturing sector decreased by 8.3 percent continually from a drop of 1.5-
percent in H2/2019. Manufacturing Production Index dropped by 12.9 and the average capacity utilization
rate stood at 59.9 percent.
Accommodation and food service activities sector declined for two consecutive quarters by 50.2 percent, following to the contraction in tourist arrivals, revenue generated from foreign tourists, and a decline in domestic tourism. Average Occupancy Rate was at 6.51 percent, dropped form 51.50 percent in the previous quarter and dropped form 70.79 percent in the same period last year.
Wholesale and Retail Trade; Repair of Motor Vehicles and Motorcycles sector decreased by 9.8 percent, the first drop of foreign tourists in 23 quarters since the second quarter of 2014, following to the contraction in household spending and a decline in foreign tourist numbers.
-120
-100
-80
-60
-40
-20
0
20
40
0.0
0.2
0.4
0.6
17 18 19 20
(%YoY)Trillion baht
Tourism receipts %YoY (RHS)
Income from foreign tourists for Q2/2020 stood at 0 baht or drop by 100.0 percent.
Source: Ministry of Tourism and Sports
The
blas
t in
7 pr
ovin
ces
of so
uthe
rn T
haila
nd
Illeg
al t
ouris
m so
lutio
n
Visa
on
Arriv
al fe
e wa
ived
(1 M
ar
31 A
ug 2
017)
Visa
on
Arriv
al fe
e wa
ived
(1 D
ec 2
016
28
Feb
2017
)Vi
sa o
n Ar
rival
fee
waive
d(1
Mar
31
Aug
201
7)
Visa
on
Arriv
al fe
e wa
ived
(15
Nov
2018
13
Jan
2019
)Vi
sa o
n Ar
rival
fee
waive
d(1
4 Ja
n 3
0 Ap
r 201
9)Vi
sa o
n Ar
rival
fee
waive
d(1
May
31
Oct
201
9)
Caps
ized
boat
acc
iden
t in
Phuk
et
(5 Ju
ly 2
018)
Visa
on
Arriv
al fe
e wa
ived
(1 M
ay
31 O
ct 2
019)
Visa
on
Arriv
al fe
e wa
ived
(1 N
ov 2
019
30
Apr 2
020)
COVI
D-19
Pan
dem
ic
Accommodation and food service activities sector significantly declined for two consecutive
quarters due to the COVID-19 pandemic and a nationwide lockdown measures which led Thailand
to recorded zero foreign tourists in this quarter. In the second quarter of 2020, production in the
accommodation and food service activities sector contracted by 50.2 percent, continuously dropped from
a 23.3-percent decrease in the previous quarter. This was consistent with following indicators; the total
number of foreign tourists recorded at 0, contracted by 100 percent, continuously dropped from a 38.0-
percent decrease in the previous quarter. Due to the current situation of COVID-19 pandemic, the Thai
government continued the emergency situation pursuant under the Emergency Decree on Public
Administration in Emergency Situations, B.E. 2548 since 26 March 2 0 2 0 . An announcement of the
emergency situation pursuant also led to the closure of all bordering immigrations where the Civil
Aviation Authority of Thailand (CAAT) imposed a flight ban from the 4 April 2020 to 30 June 2020. As a
result, Thailand recorded zero foreign tourists in this quarter. The total revenue from tourism stood at
0.019 trillion Baht, dropped by 97.1 percent, continuously dropped from a 38.2-percent decrease in the
previous quarter. This was attributed to; (i) foreign tourism receipts, which drastically decreased by
100.0 percent, continuously dropped from a 40.4-percent decrease in the previous quarter; and (ii) Thai
tourism receipts which were at 0.019 trillion Baht, declined by 92.7 percent, continuously dropped from
a 33.6-percent decrease in the previous quarter. The Average Occupancy Rate was at 6.51 percent,
dropped form 51.50 percent in the previous quarter and dropped form 70.79 percent in the same period
last year.
In the first half of 2020, Accommodation and food service activities sector contracted by 36.2 percent, dropped from a 6.7-percent growth in the second half of 2019. The tourism receipts stood at 0.332 trillion
Baht while the number of foreign tourists dropped by 66.2 percent. Moreover, the average occupancy rate
was at 29.01 percent.
Wholesale and Retail Trade Sector, and Repair of Motor sector declined from the previous quarter,
following the contraction of private consumption expenditure and a decline in the number of
foreign tourists. In the second quarter of 2020, wholesale and retail trade, and repair of motor vehicles
and motorcycles sector declined by 9.8 percent compared with a rise of 4.8-percent growth in the previous
quarter, in accordance with the decrease of Total Wholesale and Retail Sales, and Repair of Motor
Vehicles Index of 24.3 percent, which consisted of (i) Wholesales Index (except motor vehicles and
motorcycles) decreased by 21.4 percent, compared with a 10.4-percent growth in the previous quarter,
mainly supported by 50.9 percent drop in wholesales of household goods (i.e. watches and jewellery),
on the other hand, wholesale of food, beverages, and tobacco increased by 13.5 percent, (ii) Retail Sales
Index (except motor vehicles and motorcycles) decreased by 22.5 percent, continuously dropped from

Macroeconomic Strategy and Planning Division
NESDC Economic Outlook
Aug 17, 2020 9
a 1.4-percent decrease in the previous quarter, mainly supported by a 33.9-percent drop in retail sales of
other goods (i.e. jewellery and other new goods), and a 10.5-percent decline in retail sales of general store,
(iii) Wholesale and Retail Sales, and Repair of Motor Vehicles Index decreased by 37.1 percent,
continuously dropped from a 12.0-percent decrease in the previous quarter, mainly supported by a 38.5-
percent drop in trading motor vehicles sales, and a 36.3-percent decline in automotive parts sale.
In the first half of 2020, wholesale and retail trade sector, and repair of motor sector contracted by 1.9
percent, dropped from a 5.3-percent growth in the second half of 2019. Wholesale and Retail Sales, and
Repair of Motor Vehicles Index decreased by 24.4 percent, Wholesales Index (except motor vehicles and
motorcycles) decreased by 5.7 percent, while Retail Sales Index (except motor vehicles and motorcycles)
decreased by 12.1 percent.
Transportation and storage sector declined as transport services dropped due to a contraction of the air
transport services which was affected by COVID-19. In the Q2/2020, transportation and storage sector
declined by 38.9 percent continuously dropped from a 6-percent decrease in the previous quarter. Transport
services declined by 41.4 percent continuously dropped from a 6.4-percent decrease in the previous quarter.
This was mainly due to the expansion of goods and passengers transport services, attributed by (i) 89.6-percent
decline in air transport services, (ii) 43.9-percent decline in land and tubes transport services, and (iii) 2.2-
percent decline in water transport services. Besides, shipping support services declined by 26.1 percent
continuously dropped from a 2.4-percent decrease in the previous quarter. However, postal services increased
by 22.9 percent. This was in line with the higher revenue of entrepreneurs.
In the first half of 2020, transportation and storage sector contracted by 21.7 percent, comparing with a 3.5-
percent growth in the second half of 2019. Transport services dropped by 23.0 percent, shipping support
services decreased by 14.0 percent, while postal services expanded by 14.0 percent.
Financial and insurance activities expanded with a decelerated rate, following the slowdown in financial service activities whereas insurance, reinsurance, and pension funding activities
decreased. In the Q2/2020, Financial and insurance activities rose by 1.7 percent compared with a rise of
4.5 percent in the previous quarter. An expansion of financial service activities followed a rise of
operating income in non-bank financial institutions from an expansion of credit card spending and
consumer loans, meanwhile, operating income of commercial bank declined. Insurance, reinsurance, and
pension funding decreased from the previous quarter due to a contraction of non-life insurance and a drop
of motor, marine, aviation, and transport insurance associated with the drop of in a number of car sales.
In the first half of 2020, Financial and insurance activities rose by 3.1 percent compared with a rose by 3.6-
percent growth in the second half of 2019. Financial service activities increased by 3.9 percent while
Insurance, reinsurance, and pension funding decreased by 2.0 percent.
Information and communication sector slowdown by the downturn of computer programming,
consultancy and related activities, conversely, telecommunications service increased. In the Q2/2020,
information and communication sector rose by a 1.7 percent compare with an increased by a 3.2 percent in
Q1/2020, following a slowdown of operating income in the Wireless Broadband Access, while Cable
Broadband Access accelerated along with an expanded of Information service activities. However,
Computer programming, consultancy, and related activities decreased.
In the first half of 2020, information and communication sector rose by 2.4 percent, slowdown from a 9.5-
percent growth in the second half of 2019. Telecommunications service increased by 5.0 percent while
computer programming, consultancy, and related activities declined by a 0.4 percent.
Electricity, gas, steam, and air conditioning supply sector decreased in both electricity generation
and gas separation plant activities due to COVID-19 pandemic and lockdown policies. Electricity,
gas, steam, and air conditioning supply sector sharply declined by 13.3 percent compared with a rise of
1.1 percent in the previous quarter. In details, (i) electric power generation contracted by 12.9 percent
compared with a 0.9-percent growth in Q1/2020, following the contraction of manufacturing and business
activities as the COVID-19 continued; particularly, in hotel and restaurant service and department store
decreased under lockdown, however, household demand rose due to the work from home policy, and
(ii) gas separation decreased sharply by 16.6 percent, compared with a rise of 2.7 percent in the previous
quarter, associated with the decrease in gas volume used in power plants and a drop of transportation.
In the first half of 2020, Electricity, gas, steam, and air conditioning supply sector decreased by 6.4
compared with a rise of 1.1 percent in H2/2019. Electric power generation and gas separation contracted by
6.3 percent and 7.4 percent, respectively.
Transportation and storage sector declined by 38.9 percent owing to a drop in an air transport services, which was affected by COVID-19 pandemic.
Financial and insurance activities expanded by 1.7-percent, slowdown from the previous quarter due to a decrease in financial service activities. Moreover insurance, reinsurance, and pension funding activities decreased for three consecutive quarters.
Electricity, gas, steam, and air conditioning supply sector declined by 13.3 percent, decreased for three consecutive quarters following the decrease in both electricity generation activities and gas separation plant activities.
Information and communication sector rose by 1.7 percent, slowdown by the downturn of Computer programming, consultancy, and related activities. Conversely, telecommunications service increased.

Macroeconomic Strategy and Planning Division
NESDC Economic Outlook
Aug 17, 2020 10
Production in construction sector rebounded from the previous quarter due to an increasing public
construction, followed a rise in both government construction and state-owned enterprises
construction. At the same time, public construction steadily declined, yet likely to bounce back from
previous quarter. In second quarter of 2020, construction sector rose by 7.4 percent from a 9.9- percent
contraction in the previous quarter. Public construction rose by 15.6 percent, rebounded from a decrease of 13.4
percent in Q1/2020. In details, (i) government construction rose by 22.3 percent from a decrease of 29.6 percent
in the previous quarter, and (ii) state-owned enterprises construction steadily increasing by 3.4 percent in
Q2/2020. Meanwhile, private construction declined by 2.1 percent due mainly to a decrease in residential
construction and non-residential construction (i.e. commercial buildings, factory buildings) in associated with
a decline of domestic demand. However, non-dwelling construction rebounded. Construction Materials Price
Index declined by 3.6 percent, decreased for four consecutive quarters owing to a decrease in the price of steel
and steel products (-14.0 percent), concrete (-2.6 percent), and cements (-1.1 percent).
In the first half of 2020, construction sector decreased by 1.3 compared with a rise of 0.5-percent in the second
half of 2019. Public construction rose by 0.2 percent while private construction declined by 3.2 percent.
Employment: decreased for five consecutive quarters due to a decline in both agricultural
employment and non-agricultural employment, while unemployment rate rising. Employment in
Q2/2020 declined by 1.9 percent compared with a drop by 0.7 percent in the previous quarter. In details,
employment in agricultural sector dropped by 0.3 percent; however employment in major crops seemingly
recovered from the previous quarter such as maize and cassava. Besides, non-agricultural employment
dropped by 2.5 percent, due mainly to a decrease in manufacturing activities, construction activities,
wholesale, retail sales, repair of motor vehicles and motorcycles activities, and accommodation and food
service activities. The contraction in service sector associated with the COVID-19 as a result of travel
restrictions and lockdown policies. Overall, the rate of unemployment in the second quarter of 2020
stood at 2.0 percent compared to a rate of 1.0 percent in previous quarter, while the average
unemployment recorded at 745,176 persons (the highest unemployment in 10 years) compared with the
376,926 unemployment in the same period last year.
Construction sector rose by 7.4 percent, recovered from a contraction for three quarters followed a rise in both government and state-owned enterprises construction.
Employment decreased for five consecutive quarters due to the COVID-19 pandemic and lockdown policies. Unemployment in the second quarter of 2020 stood at 2.0 percent.
Employed Persons by Industry %YOY Share
Q2/20 2019 2020
Year H1 H2 Q1 Q2 Q3 Q4 H1 Q1 Q2 Employed 100.00 -0.5 0.3 -1.6 0.9 -0.3 -2.1 -1.1 -1.3 -0.7 -1.9 - Agricultural 30.96 -3.3 -4.1 -1.7 -4.2 -4.0 -1.8 -1.6 -1.9 -3.7 -0.3 - Non-Agricultural 69.04 0.8 2.3 -1.6 3.2 1.5 -2.3 -0.9 -1.0 0.5 -2.5
Manufacturing 16.19 - . .3 -4. . - .5 -5. -3. - . - .4 -4.4 Construction 5.94 4. .3 - . .5 . - . . -3.3 - . - .3 Wholesale and retail trade; repair of motor vehicles and motorcycles 16.71 - . . - . .4 - .4 -4. . - . - . - .
Accommodation and food service activities 7.53 .3 .4 . - . . 3. - . .4 3. - . Total labor force (Million persons) 38.2 38.4 38.0 38.3 38.4 38.0 38.0 38.1 38.1 38.1 employed (Million persons) 37.7 37.7 37.5 37.7 37.8 37.5 37.5 37.3 37.4 37.1 Unemployment (Hundred thousand persons) 3.7 3.6 3.8 3.5 3.8 3.9 3.7 5.7 3.9 7.5
Unemployment Rate (%) 1.0 1.0 0.9 0.9 1.0 1.0 1.0 1.5 1.0 2.0 Source : National Statistical Office (NSO)
0.0
0.6
1.2
1.8
2.4
36.0
36.5
37.0
37.5
38.0
38.5
2Q16 2Q17 2Q18 2Q19 2Q20
Employment Unemployment rate (RHS)(%)(Million Persons)
Employment decreased by 1.9 percent, following a decrease in both of employment agriculture sector and non-agriculture sector.
Unemployment rate was low at 2.0 percent.
Source: National Statistical Office

Macroeconomic Strategy and Planning Division
NESDC Economic Outlook
Aug 17, 2020 11
On the revenue side, in the first 8 months of the fiscal year 2020 (October 2019 – May 2020), the net
government revenue collection stood at 1,500.3 billion Baht, accounted for 11.2 percent, and was 189.7
billion baht lower than a revenue estimation stated in the annual Budget Bill. The decrease in net
government revenue collection was due to several factors including the severe decline in economic and
trade volume, decrease in price of certain products, and the implementation of fiscal measures to alleviate
the burden on citizens and increase liquidity for the entrepreneurs impacted by the COVID-19 where the
government extended the due date for filing and payment of various taxes, as well as reducing the rate of
withholding tax.
In details, key contributing components leading to a decrease in net government revenue collection during
the first 8 months of the fiscal year 2020 included: (i) the revenue collected from VAT decreased, due to a
decline in domestic economic transactions as well as price index of certain products, mostly due to the
severe decline in global and trade volume, an implementation of preventive measures over the COVID-19
pandemic, and the extension of due date for e-Filing and tax payment from May to the 1st of June 2020;
(ii) the revenue collected from corporate income tax decreased, due to several tax measures to ease
burdens on corporate taxpayers such as (a) deadline extension for filing and payment of CIT calculated
from the net profit in 2019 (P.N.D. 50) to August 2020, (b) deadline extension for CIT calculated from the
net profit in the first half of 2020 (P.N.D. 51) to September 2020, (c) withholding tax reduction from 3 to
1.5 percent for the payment and remittance of assessable income during the 1st of April to 30th of
September 2020, and to 2 percent for the payment and remittance of assessable income through
e-Withholding tax system during the 1st of October to 31st of December 2020; (iii) the revenue collected
from personal income tax decreased, due to the extension of filing and payment deadline for assessable
income in tax year 2019 (P.N.D. 90 and P.N.D. 91) to August 2020, and a reduction of the withholding
tax rate for payments of certain assessable income according to the specified delivery method; (iv) the
revenue collected from excise tax on cars decreased, due to the extension of the filing and payment period
for taxes due in May and June 2020 to the 15th of July 2020; (v) the revenue collected from tax on oil and
oil products decreased, due to the extension of the filing and payment deadline for domestic oil and oil
products manufacturers to June 2020, and the decline in domestic fuel consumption during the domestic
travel restriction period; and (vi) the revenue collected from import and export duties decreased, as a
result of a severe decline in imports and exports.
On the expenditure side, the total budget disbursement in the third quarter of fiscal year 2020 was at
1,027.3 billion Baht1, increased by 44.3 percent from the same quarter of FY2019 in which current and
capital expenditure disbursements increased by 54.2 percent and 10.8 percent, respectively.
Classified by sources of funds, the government disbursements were as follows: (i) the 2020 annual budget
disbursement stood at 712.9 billion Baht, increased from the same quarter last year by 20.8 percent. The
disbursement rate was at 22.3 percent, higher than the rate in the same quarter last year of 19.7 percent.
In details, the current expenditure disbursement amounted to 606.5 billion Baht, raised by 21.9 percent from the
same quarter in FY2019. The disbursement rate was at 23.3 percent, greater than the rate of 20.3 percent in the
same quarter last year. The increase in current expenditure disbursement was significantly the result of the high
disbursement in the general subsidy category. The capital expenditure disbursement marked at 106.4 billion
Baht, increased from the same quarter last year by 14.7 percent. The rate of disbursement was at 17.9 percent,
higher than a rate of 16.8 percent in the same quarter last year, which was a result of an increase in
disbursement from the other expenditures category as well as land and construction category;
The net government revenue collection in the first 8 months of the fiscal year 2020 fell and stood at 11.2 percent lower than the estimation stated in the annual Budget Bill due to the severe decline in global economic and trade volume, as well as the implementation of fiscal measures to alleviate the burden on citizens and businesses.
The total budget disbursement in the third quarter expanded by 44.3 percent as a result of an increase in disbursement of loans under the Royal Decree authorizing the MOF to seek 1-trillian baht Loan to alleviate COVID-19 impact. Meanwhile, the disbursement of the carry-over budget and the SOEs capital expenditure budget declined.
Fiscal Conditions:
-40
-20
0
20
40
60
80
100
-400,000
-200,000
0
200,000
400,000
600,000
800,000
1,000,000
YOY (%)Million THB
Source: GFMIS
Annual Budget Disbursement
Capital Exp. (LHS)
Current Exp. (LHS)
Annual budget disbursement Growth Rates (RHS)
22.3
17.9
0
5
10
15
20
25
30
Q3/10 Q3/11 Q3/12 Q3/13 Q3/14 Q3/15 Q3/16 Q3/17 Q3/18 Q3/19 Q3/20
%
Source: GFMIS
The 3rd Quarter Annual Budget Disbursement and Average Rates
Total Annual Exp. Disbursement Rate Capital Exp. Disbursement Rate
Average Total Annual Exp. Average Capital Exp.
Avg. = 21.1
Avg. = 15.8
1 The total budget disbursement means the disbursement of the grand total of annual budget, the carry-over budget, the off-budget loans, and the State-owned enterprises’ capital expenditure budget.

Macroeconomic Strategy and Planning Division
NESDC Economic Outlook
Aug 17, 2020 12
(ii) the carry-over budget disbursement stood at 32.7 billion Baht, decreased from the same quarter last
year by 54.1 percent. The disbursement rate was at 12.4 percent, lower than the rate of 19.2 percent in the
same quarter last year; (iii) state-owned enterprises’ capital expenditure budget (excluding PTT)
stood at 49.8 billion Baht2 , declined from the same period last year by 6.8 percent as a result of the
investment plan revision of the Mass Rapid Transport Authority of Thailand, the State Railway of
Thailand, and Thai Airways International Public Company Limited; and (iv) the off-budget loans were
disbursed at 234,663.2 million Baht including the disbursement of 122.6 million Baht on the
Development Policy Loan (DPL), and the disbursement of 234,540.6 million Baht of loans under the
Royal Decree authorizing Ministry of Finance to seek loan for economic and social problem solving,
remedy, and rehabilitation as a result of spread of COVID-19, B.E. 2563 (1-trillion Baht Loan).
For the first 9 months of the fiscal year 2020, the total budget disbursement was at 2,816.3 billion Baht,
a 12.5 percent increase from the same period of 2019, with the allowing detail: (i) the 2020 annual budget
disbursement of 2,253.5 billion Baht. The disbursement rate was 70.4 percent, lower than the
disbursement rate of 71.7 in the same period last year. In detail, disbursements of the current expenditure
was at 2,056.6 billion Baht (the disbursement rate was 78.9 percent, greater than the disbursement rate of
76.9 in the same period last year), while the capital expenditure disbursement was at 196.9 billion Baht
(the disbursement rate was 33.1 percent, lower than the disbursement rate of 48.7 percent in the same
period last year); (ii) the disbursement of the carry-over budget stood at 176.2 billion Baht, equivalent to
66.9 percent of the total carry-over budget; (iii) state-owned enterprises’ capital expenditure budget
(excluding PTT) disbursement was at 158.8 billion Baht3 ; and (iv) the off-budget loans disbursement
amounted to 236.0 billion Baht.
Public Debt: at the end of June 2020, the debt was accumulated at 7.4 trillion Baht, equivalent to 44.8
percent of GDP. The public debt was comprised of domestic loans of 7.3 trillion Baht (43.9 percent of
GDP) and foreign loans of 141.1 billion Baht (0.8 percent of GDP).
In Q3/FY2020, the disbursement rate of the 2020 annual budget was at 22.3 percent. The disbursement rate of current and capital expenditure were at 23.3 percent and 17.9 percent, respectively.
2 The number was included the 2,810.5 million Baht of the capital spending allocated from the annual budget and the carry-over budget. 3 The number was included the 8,299.2 million Baht of the capital spending allocated from the annual budget and the carry-over budget.
At the end of June 2020, the public debt remained under the fiscal prudential framework at 44.8 percent of GDP.
0
5
10
15
20
25
30
35
40
45
50
0
1,000
2,000
3,000
4,000
5,000
6,000
7,000
8,000
% of GDPBillion Baht
Source: PDMO
Public Debt (Accumulated)
foreign loans domestic loans Total Accumulated Debt to GDP (RHS)
For 9M/FY2020, the disbursement rate of the 2020 annual budget stood at 70.4 percent. The disbursement rate of current and capital expenditure were at 78.9 percent and 33.1 percent, respectively.
At the end of May 2020, the treasury reserve stood at 265.6 billion baht.
Fiscal Balance: during April to May 2020, the budgetary balance recorded a deficit of 236.8 billion Baht
whereas the non-budgetary balance recorded a surplus of 18.6 billion Baht. In the meantime, the
government conducted a cash balance management through borrowing of 292.4 billion Baht. Therefore,
the cash balance after debt financing recorded a net surplus of 74.2 billion Baht. At the end of May 2020,
the treasury reserve stood at 265.6 billion Baht.
For the first 8 months of the 2020 fiscal year, the budgetary balance recorded a deficit of 738.4 billion
Baht whereas the non-budgetary balance recorded a surplus of 98.6 billion Baht. The government
conducted a cash balance management through borrowing total of 392.4 billion Baht. As a result, the cash
balance after debt financing recorded a net deficit of 247.4 billion Baht.

Macroeconomic Strategy and Planning Division
NESDC Economic Outlook
Aug 17, 2020 13
The Monetary policy of Thailand was more flexible. MPC cuts the policy rate to historically low.
Financial Conditions:
In the second quarter of 2020, the policy interest rate decreased by 0.25 basis points and stood at
0.50 percent per annum.
At the meeting on the 20th of May 2020, the Monetary Policy Committee (MPC) revolved to lower the
policy interest rate by 0.25 basis points, from 0.75 percent per annum to the historical lowest rate at 0.50
percent per annum. The decision based on the assessment that the Thai economy in 2020 would contract
beyond the outlook presented in the previous assessment due to the severe contraction of the global
economy and economic impacts arising from the implementation control measures over COVID-19.
However, the more accommodative monetary policies were expected to alleviate the negative impacts as
well as reinforce the previously announced fiscal, financial, and credit measures. In fact, other regional
countries such as India, Indonesia, Malaysia, the Philippines, and South Korea also announced to
decrease their policy rate in this quarter. The Federal Reserve (FED) of the United States maintained its
policy rate at a range of 0.00 - 0.25 percent per annum and expects to maintain this target range until it is
confident that the economy has weathered recent events and is a track to achieve its maximum
employment and price stability goals. Similarly, Australia, England, Canada, China, Japan, and New
Zealand continually maintain the policy rate in second quarter of 2020.
In July 2020, Russia, Indonesia and Malaysia decided to reduce their policy rate by 0.25 basis points to
4.25 percent per annum, 4.00 percent per annum, and 1.75 percent per annum, respectively.
0
50,000
100,000
150,000
200,000
250,000
300,000
0
100,000
200,000
300,000
400,000
500,000
600,000
700,000
10 11 12 13 14 15 16 17 18 19 20
Source: MOF
Statement of Government Operations
Treasury Reserve (LHS)
Financing (RHS)
Million BahtMillion Baht
Policy Interest Rate (%)
At the end of period
2018 2019 2020 Year Year Q1 Q2 Q3 Q4 Q2 Apr. May Jun. Q1 Jul.
USA . 5- .5 .5 - . 5 . 5- .5 . 5- .5 . 5- . .5 - . 5 . - . 5 . - . 5 . - . 5 . - . 5 . - . 5 . - . 5 EU . . . . . . . . . . . . England . 5 . 5 . 5 . 5 . 5 . 5 . . . . . . Japan - . - . - . - . - . - . - . - . - . - . - . - . Canada . 5 . 5 . 5 . 5 . 5 . 5 . 5 . 5 . 5 . 5 . 5 . 5 Australia .5 . 5 .5 . 5 . . 5 . 5 . 5 . 5 . 5 . 5 . 5 New Zealand . 5 . . 5 .5 . . . 5 . 5 . 5 . 5 . 5 . 5 Russia . 5 . 5 . 5 .5 . . 5 4.5 5.5 5.5 4.5 . 4. 5 China 4.35 4.35 4.35 4.35 4.35 4.35 4.35 4.35 4.35 4.35 4.35 4.35 Korea, South . 5 . 5 . 5 . 5 .5 . 5 .5 . 5 .5 .5 . 5 .5 India .5 5. 5 . 5 5. 5 5.4 5. 5 4. 4.4 4. 4. 4.4 4. Indonesia . 5. . . 5. 5 5. 4. 5 4.5 4.5 4. 5 4.5 4. Philippines 4. 5 4. 4. 5 4.5 4. 4. . 5 . 5 . 5 . 5 3. 5 . 5 Malaysia 3. 5 3. 3. 5 3. 3. 3. . .5 . . .5 . 5 Thailand . 5 . 5 . 5 . 5 .5 . 5 .5 . 5 .5 .5 . 5 .5 Source: Collected by NESDC

Macroeconomic Strategy and Planning Division
NESDC Economic Outlook
Aug 17, 2020 14
Private loans of depository institutions continuously expanded particularly specialized financial institutions loans were accelerated.
Financial institutions reduced interest rates on both deposits and loans from the previous quarter, especially large commercial banks which reduced the interest rates to a record low.
Thai Baht against US dollar depreciated in line with a net deficit of current account and decreasing of the policy rate by MPC.
Large, medium-sized commercial banks and specialized financial institutions (SFIs) continually cut
interest rates on both deposits and loans from the previous quarter. In the second quarter of 2020, large
commercial banks cut interest rates on both deposits and loans to a record low. The average 12-month fixed
deposit rate decreased from 1.08 percent to 0.64 percent per year. The average interest rate on Minimum Loan
Rate (MLR) decreased from 6.02 percent to 5.53 percent per year. Medium-sized banks lowered the average
deposit and MLR rates to 0.91 and 6.25 percent, respectively, from 1.20 and 6.65 percent in the previous
quarter. Specialized financial institutions reduced deposit and average MLR rates to 1.06 and 6.19 percent,
respectively. The average effective deposit and average MLR loan rates increased in line with the changes in
inflation.
In July 2020, large commercial banks and specialized financial institutions maintained interest rates for both
deposits and loans. Meanwhile, medium-sized banks lowered their deposit rates and maintained loan rates.
Meanwhile, the real interest rate increased in line with the decrease in inflation.
Private business loans outstanding continued to expand whereas the household loans accelerated, partly
due to the implementation of debt holiday and soft loans measures by the government. At the end of the
second quarter of 2020, private loans outstanding by depository institution increased by 3.5 percent,
accelerating from 3.4 percent in the previous quarter. This was due to business loans of specialized financial
institutions which grew by 9.7 percent compared to 0.7 percent in the previous quarter. Nevertheless, the
commercial bank loans rose 3.3 percent, compared with a 3.9 percent expansion in the previous quarter, partly
due to the increased lending standard criteria as the number of NPLs in the commercial bank loan system is
likely to rise. The commercial bank loan for manufacturing grew by 1.6 percent, continuing from a 2.0 percent
expansion in the previous quarter. Transportation and storage, accommodation and food service activities and
construction expanded at 15.7 percent, 14.3 percent and 8.2 percent, compared with 11.1 percent, 1.0 percent
and 6.2 percent growth in the previous quarter, respectively. The outstanding of loans for small and medium-
sized businesses in the commercial banking system (excluding financial and insurance activities) fell by 18.5
percent, compared to a 0.2 percent drop in the previous quarter, due to a decrease in all activities with high
loans outstanding excluding in the accommodation and food service activities which grew by 7.4 percent,
continued from 6.2 percent growth in the previous quarter. Household loans rose by 3.5 percent, accelerating
from a 3.3 percent expansion in the previous quarter. This was partly due to the increase in the field of housing
provision and buying or leasing of cars and motorcycles, while the outstanding balance of credit cards declined.
4 The BOT began using the new NEER and REER in March 2014. The base year would also be changed to 2012, that the indicators could capture the true structure of trade in line with changing international dynamics.
Private loans (including accrued interest) of depository corporations
accelerated from the previous quarter
Source: Bank of Thailand
3.4 3.5
-2
0
2
4
6
8
10
-2
0
2
4
6
8
10
15 16 17 18 19 20
% YOY% YOY
Private loan (including accrued interest)
Business loan (RHS)
Household loan (RHS)
Thai Baht against US Dollar depreciated compared with the previous quarter. In the second quarter, an
average exchange rate was at 31.94 baht per US dollar, depreciated by 2.11 percent from the previous quarter.
In line with a net deficit of current account and the other regional countries currency such as Singapore dollar,
Indian rupee, South Korean won, Vietnam dong, Indonesian rupiah and Malaysian ringgit. Meanwhile,
Philippine peso, Hong Kong dollar, Taiwan dollar and Japanese yen appreciated from the previous quarter. In
the beginning of the quarter, Thai baht against US dollar depreciated due to (i) the slowdown of Thai economy
due to the COVID-19 pandemic and impacts of lockdown measures, and (ii) the Monetary Policy Committee
decision to reduce the policy by 0.25 basis points to 0.50 percent per annum in this quarter. However, in the end
of the quarter Thai baht against US dollar has turned to appreciate in line with depreciating of US dollars in
association with the widespread of the COVID-19 pandemic and the higher US and China tension that affected
the US economy. Thai Baht against trading partners (NEER)4 depreciated an average by 0.60 percent from
the previous quarter (An average of 122.55).
In July 2020, Thai Baht was at an average of 31.41 Baht per US dollar, depreciated by 0.8 percent from the previous
month. The key factors were a concern of a second wave of the COVID-19 pandemic and political instability.

Macroeconomic Strategy and Planning Division
NESDC Economic Outlook
Aug 17, 2020 15
SET index has an upward trending which was influenced by internal and external factors.
Throughout the second quarter, SET index as well as the other reginal stock markets experienced a
growth with upward trend. The key contributing factors to the volatility of SET index were (i) a
fluctuation in global economy resulting from the worsen situation of coronavirus pandemic across the
world, (ii) the US – China tension in political economy, (iii) the effects resulting from the implementation
in local and global monetary and fiscal policies, and (iv) the progress of COVID-19 vaccine. Altogether,
SET index at the end of the second quarter of 2020 closed at 1,339 points. This was an increase of 18.92
percent from the previous quarter. In addition, foreign investors continually imposed a net sell position of
101.3 billion baht, while institutional and individual investors registered a net buy.
In July 2020, SET Index declined to 1,329 points, equaling to a 0.75-percent reduction from June 2020,
which was pressured by a net sell of foreign investors and local institutions. The volatility of SET index
was caused by (i) local political uncertainty, (ii) the political tension between US – China, (iii) fears over
the second wave of COVID-19 pandemic in Thailand, and (iv) concern on economic recovery in the US
as the US GDP in the second quarter reached the worst in modern history.
The government bond market had a sign of recovery after the implementation of government
measures to enhance liquidity in the bond market such as an establishment of the Corporate Bond
Stabilization Fund (BSF) and the repurchase of bonds in April. In the second quarter, dairy average
outright trading recorded at 78.9 billion Baht declined from 104.1 billion Baht in the previous quarter. Foreign investors had a net sell of 6.8 billion Baht decreasing from a net sell of 109.7 billion Baht in the
previous quarter. However, foreign investor registered a net buy in June. The short-term yield decreased
while policy rate was decreased in May. The long-term yield fluctuated with a downward trend which was
caused by (i) a fluctuation in global economy resulting from coronavirus pandemic, (ii) the effect of local
and global monetary policy and fiscal policy, and (iii) a variation in the amount of bond auction.
In July 2020, foreign investors continued recording a net buy at 17.9 billion Baht. Foreign investors
registed a net sell in short-term bond and registed a net buy in long-term bond. In addition, the SEC
established high-yield bond funds to provide bridge financing for firms that faced liquidity shortage and
might need to change their funding structures.
The government bond yield shifted downward meanwhile the foreign investor registered a net buy in June.
SET index fluctuated in an upward trend, whereas foreign investors continually imposed a net sell.
Thai Baht depreciated against US dollars from
the previous quarter
Source : CEIC, Bank of Thailand
29.0
30.0
31.0
32.0
33.0
34.0
35.0
36.095
100
105
110
115
120
125
130
Jan
17
Apr
17
Jul 17 Oct
17
Jan
18
Apr
18
Jul 18 Oct
18
Jan
19
Apr
19
Jul 19 Oct
19
Jan
20
Apr
20
Index
NEER REER Baht/US dollars (RHS)
Baht US dollars
700
900
1100
1300
1500
1700
1900
10,000
20,000
30,000
40,000
50,000
60,000
70,000
80,000
90,000
IndexMillion Baht
Value SET Index (RHS)
SET Index and turnover increased in the second quarter of 2020
Source: SET
0.0
1.0
2.0
3.0
1M 6M 2Y 4Y 6Y 8Y 10Y 12Y 14Y 16Y 18Y 20Y 22Y 24Y 26Y 28Y
percent
Q1/2020
Q2/2020
Jul-20
Government short-term yield and long-term yield decreased
Source: ThaiBMA

Macroeconomic Strategy and Planning Division
NESDC Economic Outlook
Aug 17, 2020 16
Capital and financial account recorded a net inflow of 8.79 billion US dollars in the first two months of the
second quarter of 2020. This was caused by a net inflow of Thai investor in term of both direct and portfolio
investments. However, there was a continual net inflow of foreign investor in term of direct investment.
International reserve at the end of June 2020 stood at 241.6 billion US dollars.
Current account registered a deficit of 0.8 billion US dollars (27.0 billion Baht). This was a result of a trade surplus
of 8.0 billion US dollars and a deficit in services, and primary and secondary income of 8.8 billion US dollars.
In the first half of 2020, current account registered a surplus of 8.1 billion US dollars (250.0 billion Baht),
compared with a surplus of 17.9 billion US dollars (562.0 billion Baht) in the same period of last year.
International reserve at the end of June 2020 stood at 241.6 billion US dollars (excluding net forward
position of 24.5 billion US dollars), which was equivalent to 3.8 times of short-term foreign debt, or to an
import value of 17.4 months (given the average of import value in the second quarter of 2020).
Current account registered a deficit compared with a surplus in the same period last year.
Headline inflation decreased by 2.7 percent, following the decline in Non-Food-and-Beverage price index, and the decline of energy index.
Capital and financial account recorded a net inflow.
Producer Price Index (PPI) decreased by 4.1 percent, mainly due to the decrease in price of mining products and manufactured products.
Capital Flow
(Billion USD) 2018 2019 2020 Year Year Q1 Q2 Q3 Q4 H1 Q1 Q2(2M
) Apr. May - Direct Investment -8.0 -8.8 -3.8 -1.8 0.5 -3.8 -1.4 -2.8 1.3 2.4 -1.1
Thai investor - .3 - 4. -4.4 -3. -3. - . - .3 - .4 . . - . Foreign investor 3. . . . 4.4 - . 4. 3. .3 . .5
- Portfolio Investments -5.9 -9.0 -2.6 2.0 -6.3 -2.1 -9.7 -7.2 -2.4 -1.2 -1.2 Thai investor - .3 -3. - .3 . - .4 - .3 . .3 . . . Foreign investor - 5. - . . - .4 - .4 - . - . - . - . . - .
Others -1.0 2.8 1.2 -2.8 4.7 -0.3 13.0 3.1 9.9 5.4 4.5 Capital and financial account -15.0 -15.0 -5.1 -2.5 -1.1 -6.2 1.9 -6.9 8.8 6.5 2.3 Source: BOT
Source: Bank of Thailand
-15,000
-10,000
-5,000
0
5,000
10,000
15,000
20,000
Q2/16 Q2/17 Q2/18 Q2/19 Q2/20
Mil. USD
Current account balance, Trade balance,Net services, primary income and secondary income
Current account balance
Trade balance
Net services, primary income and secondary income
Headline inflation: In the second quarter of 2020, headline inflation decreased by 2.7 percent, compare
with a 0.4-percent growth in the previous quarter. Food-and-Beverage price index increased by 0.4
percent, from 1.8 percent in the previous quarter, due to an increase in prices of rice, flour & cereal
products, seasoning and condiments, and eggs and non-alcoholic beverages by 6.3 percent, 3.3 percent,
and 2.1 percent, respectively. Non-Food and Beverage price index decreased by 4.4 percent, from 0.4
percent in the previous quarter, due to energy index which decreased by 23.0 percent continually
decreased from 4.0 percent in the previous quarter. Core inflation was averaged at 0.1 percent5.
In the first half of 2020, Headline inflation was decreased by 1.1 percent while core inflation was
averaged at 0.3 percent.
Producer Price Index (PPI): In the second quarter of 2020, Producer Price Index decreased by 4.1 percent,
compared with a 0.4-percent decrease in the previous quarter, due to the decrease in price of mining products and
manufactured products. The price of mining products decreased by 19.8 percent, from a 3.7-percent fell in the
previous quarter due to a decrease in price of lignite, petroleum, & natural gas by 23.4 percent, compared with a
4.4-percent decline in the previous quarter. The price of manufactured products decreased by 3.8 percent,
compared with a 1.0 percent decrease in the previous quarter as price of petroleum products, and chemicals &
chemical products continuously declined. Also, the price of agricultural products increased by 1.5 percent,
decline from a 5.1-percent growth in the previous quarter as price of crops and livestock decreased6.
In the first half of 2020, Producer Price Index decreased by 2.2 compared with a 1.6-percent decrease in
the second half of 2019.
5 In July 2020, headline inflation decreased by 1.0 percent, Core inflation was 0.4 percent. On the 7-month average, headline inflation decreased by 1.1 percent, Core inflation was average at 0.3 percent.
6 In July 2020, Producer Price Index (PPI) decreased by 2.5 percent. On the 7-month average, PPI decreased by 2.3 percent.
-6
-4
-2
0
2
4
Q2/16 Q2/17 Q2/18 Q2/19 Q2/20
%YoYHeadline inflation in the second quarter of 2020
decreased by 2.7 percent
Headline Inflation
Core Inflation
PPI
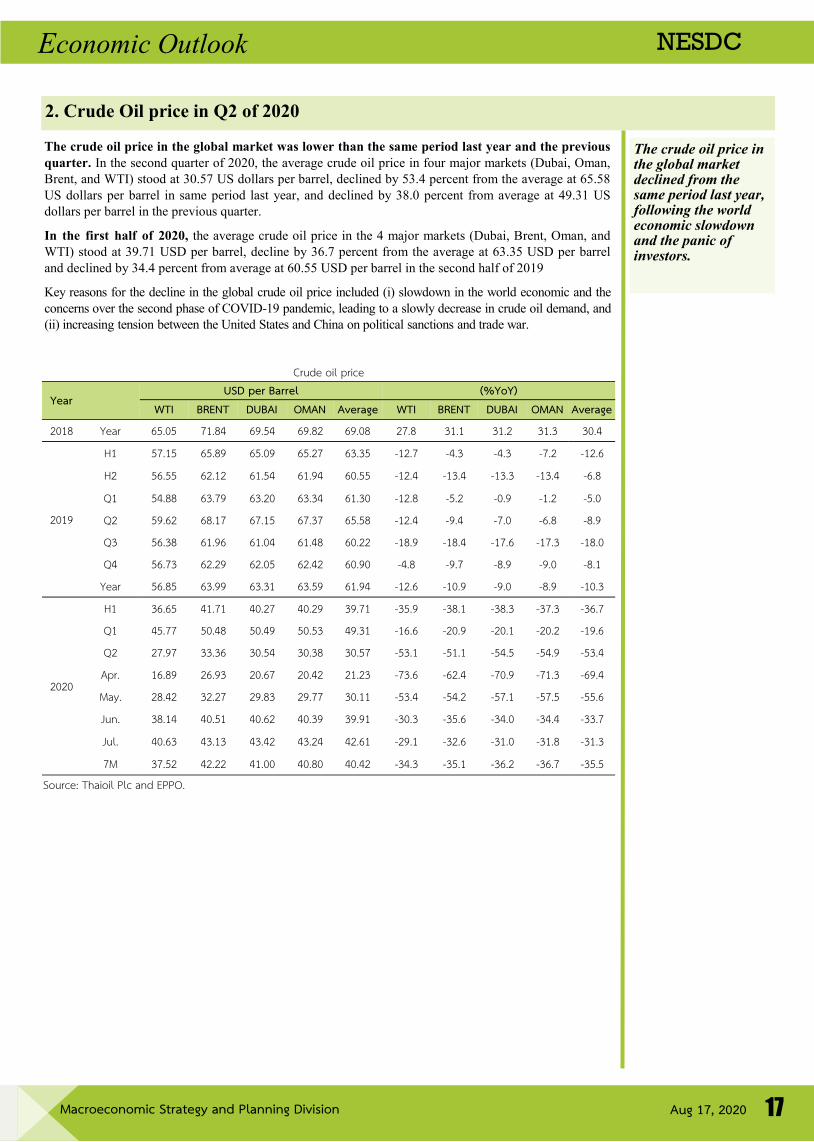
Macroeconomic Strategy and Planning Division
NESDC Economic Outlook
Aug 17, 2020 17
2. Crude Oil price in Q2 of 2020
The crude oil price in the global market was lower than the same period last year and the previous
quarter. In the second quarter of 2020, the average crude oil price in four major markets (Dubai, Oman,
Brent, and WTI) stood at 30.57 US dollars per barrel, declined by 53.4 percent from the average at 65.58
US dollars per barrel in same period last year, and declined by 38.0 percent from average at 49.31 US
dollars per barrel in the previous quarter.
In the first half of 2020, the average crude oil price in the 4 major markets (Dubai, Brent, Oman, and
WTI) stood at 39.71 USD per barrel, decline by 36.7 percent from the average at 63.35 USD per barrel
and declined by 34.4 percent from average at 60.55 USD per barrel in the second half of 2019
Key reasons for the decline in the global crude oil price included (i) slowdown in the world economic and the
concerns over the second phase of COVID-19 pandemic, leading to a slowly decrease in crude oil demand, and
(ii) increasing tension between the United States and China on political sanctions and trade war.
The crude oil price in the global market declined from the same period last year, following the world economic slowdown and the panic of investors.
Crude oil price
Year USD per Barrel (%YoY)
WTI BRENT DUBAI OMAN Average WTI BRENT DUBAI OMAN Average Year 5. 5 . 4 .54 . . . 3 . 3 . 3 .3 3 .4
H 5 . 5 5. 5. 5. 3.35 - . -4.3 -4.3 - . - .
H 5 .55 . .54 . 4 .55 - .4 - 3.4 - 3.3 - 3.4 - .
Q 54. 3. 3. 3.34 .3 - . -5. - . - . -5.
Q 5 . . . 5 .3 5.5 - .4 - .4 - . - . - .
Q3 5 .3 . . 4 .4 . - . - .4 - . - .3 - .
Q4 5 . 3 . . 5 .4 . -4. - . - . - . - .
Year 5 . 5 3. 3.3 3.5 . 4 - . - . - . - . - .3
H 3 . 5 4 . 4 . 4 . 3 . -35. -3 . -3 .3 -3 .3 -3 . Q 45. 5 .4 5 .4 5 .53 4 .3 - . - . - . - . - .
Q . 33.3 3 .54 3 .3 3 .5 -53. -5 . -54.5 -54. -53.4
Apr. . . 3 . .4 . 3 - 3. - .4 - . - .3 - .4
May. .4 3 . . 3 . 3 . -53.4 -54. -5 . -5 .5 -55.
Jun. 3 . 4 4 .5 4 . 4 .3 3 . -3 .3 -35. -34. -34.4 -33.
Jul. 4 . 3 43. 3 43.4 43. 4 4 . - . -3 . -3 . -3 . -3 .3
M 3 .5 4 . 4 . 4 . 4 .4 -34.3 -35. -3 . -3 . -35.5 Source: Thaioil Plc and EPPO.

Macroeconomic Strategy and Planning Division
NESDC Economic Outlook
Aug 17, 2020 18
The world economy experienced a severe economic recession in the second quarter of 2020, following the
paralyzed global economic activity in the first quarter. These recessions had set the lowest growth on
record across the world. The escalation of COVID-19 pandemic in 213 countries and territories has led to
restrictions on domestic and international movement, closures of public and private places, and controls
over events and gatherings that are prone to new transmissions. Even though a number of countries had
successfully limited the spread of COVID-19, resulting in decreases of new infected number, those drastic
measures had weighed on the dampened economic activities, including productions, exports, investments
and consumptions. Particularly, the employment sector was directly impacted by slower economic
activities as seen in the historically high unemployment rate in many economies, such as US and Hong
Kong. Meanwhile, Chinese economy made a rebound in the second quarter as the government lifted some
lockdown restrictions since mid-February in some regions. Hence, business could start to operate while
domestic travels showed improvement.
In light of a rising concern over COVID-19 and with economic downturns, most governments adopted
several measures along with a healthcare procurement in order to support and stimulate market activity
and to mitigate economic impact. Common responses are: (i) Monetary policy easing in which several
advanced countries have kept their policy rates low while India, Thailand, and the Philippines cut their
rates to a historical low. Meanwhile, many central banks continually pursued unconventional monetary
policy such as large asset purchases to increase market liquidity by the US Federal Reserve (Fed),
increased asset purchase under Pandemic Emergency Purchase Program by the European Central Bank
(ECB), the unlimited government bond purchase, an increase in budget for private’s short maturity bond,
and liquidity injection for SMEs under New Fund-Provisioning Measure by the Bank of Japan (BOJ).
Moreover, several central banks also provided soft-loans to affected SMEs and asset-backed security, and
suspended debt payment. (ii) Fiscal measures, such as a direct increase in supplementary budget, a direct
transfer, tax measures, namely credits of payroll tax, exempt for VAT and tariff on medical equipment,
reducing social security contributions, providing credits guarantee. (iii) Social assistance and employment
measures, such as providing unemployment benefits for employees who lost their jobs or being
furloughed, increasing unemployment benefits, and subsidizing employers to continue employment.
(iv) Additional cost of living subsidy.
The US Economy in the second quarter declined by 9.5 percent (%YoY), compared with a 0.3-percent
expansion in the first quarter. With seasonally adjusted, the US economy decreased by 32.9 percent
(%QoQ), reaching a record low, due to major contractions in both manufacturing and service sectors.
Evidentially, the Manufacturing Purchasing Managers Index (PMI) was at 41.9 while the service PMI was
at 37.4, the lowest level in 11 years since 2008 for both indexes. These decreases were also evident in a
decline in labor market as non-agricultural jobs showed employment dropped by 12.96 million, compared
with the same period last year. Simultaneously, unemployment rate in the second quarter stood at 13.0
percent which the rate in April surged by 14.7 percent, the highest on record. This was in line with a 10.7-
percent decrease in private consumption and a 17.8-percent drop in private investment which registered a
lowest level in 43 quarters. Meanwhile, the core PCE price index was at 0.6 percent, decreasing from 1.7
percent in the previous quarter. Nonetheless, government spending expanded by 2.1 percent, comparing to
a 2.7-percent increase in the previous quarter, partially driven by a 2.3 trillion US Dollars fiscal stimulus
force under CARES Act. The Federal Open Market Committee (FOMC) indicated to remain its policy
rate at 0.00-0.25 percent in the June 10th 2020 meeting after it cut the rate at the previous unscheduled
meeting in March. The Fed also issued other key monetary measures in order to liquidate the financial
market, such as the Money Market Mutual Fund Liquidity Facility (MMLF), Municipal Liquidity Facility,
Primary Dealer Credit Facility (PDCF), and Commercial Mortgage-backed Securities7.
The Eurozone economy contracted by 15.0 percent (%YoY), the slowest pace on record. Compared with
the same quarter of the previous year, the Eurozone economy declined by 12.1 percent after a seasonal
adjustment, with major economies suffering some of the most severe economic downturns. Germany,
France, and Italy economies decreased by 11.7 percent, 19.0 percent, and 17.3 percent, respectively. This
was consistent with the falls in PMI data as Composite PMI and Service PMI were at 31.3 and 30.3
respectively, compared with 44.2 and 43.8 in the previous quarter. Particularly, service PMI decreased to
a historical low of 12.0 in April. Consumer confidence index concurrently deteriorated to -18.58 .
Unemployment rate was 7.67 percent up from 7.27 percent last quarter, which reached the highest level in
5 quarters, while inflation rate was at 0.2 percent. On May 8th, 2020, the European Commission agreed to
US economy experienced the lowest contraction. Employment sector was the most impacted, reflected in the historical-high unemployment rate and a decrease in the inflation rate.
3. The World Economy in Q2 of 2020
Eurozone economy declined at the slowest pace on record, in line with the lowest level of PMI and consumer confidence index.
7 The measure was originally announced on March 15th 2020, and then had another budget extension for asset purchase on March 23rd 2020. 8 The 0 number means the neutral condition, while the negative value means the unfavorable situation.

Macroeconomic Strategy and Planning Division
NESDC Economic Outlook
Aug 17, 2020 19
expand the scope of the State Aid Temporary Framework (Recapitalization and subordinated debt
measures to further support the economy owning to the COVID-19 outbreak) to December 2020, while
the recapitalization was extended to June 2021. The ECB also decided to provide the monetary support
and keep its policy rate unchanged at 0.00 percent. Additional budgets for public and private asset
purchase were expanded under Pandemic Emergency Purchase Programme9 for a total of 1.35 trillion
Euro until the end of June 2021. The ECB also alleviated the condition of collateral for effected
companies under the Targeted Longer-term Refinancing Operations (TLTRO-III) during the period from
June 2020 to June 2021.
The Japanese economy contracted by 9.9 percent (%YoY), mainly due to the decreases in production,
export, and private consumption. This is consistent with PMI which was at 40.1, the lowest level in 11
year and remained below 50 for 6 consecutive quarters. Exports declined to 23.7 percent, the lowest rate
in 11 year. Simultaneously, retail trade dropped by 9.3 percent while consumer confidence index was at
25.3, the lowest on records for both indicators. Unemployment rate was at 2.8 percent, the highest level in
11 quarters while inflation rate stayed at 0.1 percent. For COVID-19 relief measures, the Japanese
government adopted the Emergency Economic Package Against COVID-19 (III) of 117.1 trillion
Japanese Yen on April 7th 2020, consisting of (i) improve and develop preventive measures against the
spread of infection, (ii) support employment and businesses, (iii) regain economic activities after the
outbreak, and (iv) prepare for risk-mitigation for the future. On June 12th 2020, the Japanese government
passed the second FY2020 draft supplementary budget of another 117.1 trillion Japanese Yen (same
amount as the 3rd stimulus package). In the mean time, Bank of Japan (BOJ) announced to adopt the
unlimited purchases of Japanese government bonds (JGBs), increase purchases of commercial paper and
corporate bonds for 20 trillion Japanese Yen, and increase the budget under Special Funds-Supplying
Operations. Meanwhile, on May 22nd 2020, the BOJ announced additional measures to increase SMEs
liquidity under the New Fund-Provisioning Measure to Support Financing Mainly of SME Firms
program, valued 30 trillion Japanese Yen. Under this scheme, commercial banks can borrow from Central
bank with interest-free (0.0 percent) based on actual loans to SMEs, using eligible pooled collateral
guarantee under the budget of 1,000 billion Japanese Yen per one commercial bank.
The Chinese economy expanded by 3.2 percent, rebounding from a contraction of 6.8 percent in the
previous quarter, following the improvement in all production sectors after a gradual easing of the
containment policy. The Caixin Manufacturing PMI increased to 50.4 from a level of 47.2 in the previous
quarter. This was in accordance with an increase in export by 0.1 percent, comparing to a 13.3 percent
decline in the first quarter. Retail sales dropped by 11.4 percent, a smaller contraction compared with a
19.0-percent decrease in the previous quarter. Meanwhile, fixed asset investment declined by 3.1 percent
in the first half of the year, improving from a 16.1-percent decrease in the first quarter. The average
inflation rate was at 2.7 percent, decreasing from 5.0 percent in the previous quarter due to the
deceleration of food and transportation and communication prices. Under the spread of COVID-19, the
People’s Bank of China (PBOC) indicated to remain monetary policy easing by (i) reducing the interest
rate of excess reserves to 0.35 percent which was the first reduction since 2014 on April 7th, (ii) lowering
the 1-year medium-term lending facility (MLF) rate for commercial banks to 2.95 percent, (iii) Reducing
the RRR for SMEs banks by 0.5 percent and another additional 0.5 percent, in effect from May 15th
onwards, (iv) Reducing the 1-year loan prime rate to 3.85 percent on April 20th, and (v) Reducing the 14-
day reverse repo rates to 2.35 percent on June 18th. Accordingly, the government also imposed several
fiscal measures, such as increasing budgets on epidemic prevention and control and medical equipment
production, accelerating the disbursement of unemployment insurance to migrant workers, and providing
tax relief and waiving social security contributions.
The Newly Industrial Economies (NIEs) mostly experienced the lowest decline on record. Korean
economy contracted by 2.9 percent, compared with the 1.4-percent expansion in the first quarter and the
lowest decrease in 86 quarters. Particularly, exports of goods and services contracted by 13.6 percent, a
historical low. Taiwan’s economy decreased by 0.6 percent, the lowest level in 43 quarter and a consecutive
decline from a 2.2-percent growth in the first quarter, specifically in private consumption which reached a
record low of 2.7 percent. Singapore’s economy contracted by 13.2 percent, following a decrease of 0.3
percent in the prior period. This historical decline was mainly due to the declines in the manufacturing
production sector, construction sector, and service sector. Hong Kong’s economy contracted by 9.0 percent,
following a 9.1-percent decrease in the first quarter, and accounted for 4 consecutive declines. Meanwhile,
the inflation in most economies dropped to the negative range for the first time. Exceptionally, Hong Kong’s
inflation rate remained positive albeit lower than the previous quarter.
Chinese economy rebounded, following the improvement in all production sectors after a gradual easing of the containment policy. The inflation rate decreased due to the deceleration of food and transportation and communication prices.
Japanese Economy is expected to decline, due mainly to the decreases in production, exports, and private consumption which in line with a record-low consumer confidence index. Government announced the 3rd package stimulus while BOJ adopted the unlimited purchase of JGBs.
9 ECB primarily increased asset purchases to 1,200 billion euro until the end of 2020 on March 13th 2020. Later, the bank announced to adopt Pandemic Emergency Purchase Programme on March 18th 2020.
The NIEs economy contracted, the lowest in several quarters. Inflation dropped to the negative range for the first time due to a weaker purchasing power.

Macroeconomic Strategy and Planning Division
NESDC Economic Outlook
Aug 17, 2020 20
The ASEAN economies mostly experienced economic decline as a result of the deceleration of domestic
consumption and exports. Indonesian economy contracted by 5.3 percent, compared with a 3.0-percent
expansion in the first quarter, owning mainly to the decreases in private consumption, government
expenditure, gross investment, and exports of goods and services. Malaysian economy declined by 17.1
percent, compared to a 0.7-percent increase in the prior period, due to the contraction of household
consumption, government expenditure, gross investment, as well as exports of goods and services. The
Philippines’ economy contracted by 16.5 percent, compared with a 0.7-percent contraction in the
previous quarter. The contraction was mainly due to the drops in household consumption, investment, and
export of good and services; however, government expenditure expanded more than the previous quarter.
Vietnam’s economy expanded by 0.4 percent, decelerating from a 3.7-expansion in the first quarter,
following a decrease in service sector, and the deceleration of production. Additionally, exports of goods
declined by 6.9 percent, the first drop in 43 quarters. Meanwhile, the inflation rates in most countries
decreased as an effect of the fall in food, transportation, and oil prices. Under the outbreak of COVID-19
and the economic fallouts, central banks in many countries in ASEAN continuously cut their policy rate
to the lowest level on record1 0 . Simultaneously, the government also adopted several fiscal policies to
mitigate economic impact, such as providing subsidies for low-income household and cost of living,
increasing health expenditure to prevent the spread of the new infection, providing subsidy on social
security contributions for the vulnerable, and giving the exempt and lower taxes for business.
The ASEAN economies mostly declined at the historical-low level, owning to the deceleration of domestic consumption and export of goods. Specifically, Vietnamese exports experienced the first contraction in 43 quarters.
10 At the end of the second quarter of 2020, the Central Banks of Indonesia, Malaysia, the Philippines and Vietnam lowered the policy interest rate to 4.25 percent, 2.00 percent, 2.25 percent, and 3.00 percent, down from 4.50 percent, 2.50 percent, 3.25 percent, and 3.50 percent at the end of the first quarter of 2020, respectively.
GDP and Export growths in several key economies
(%YoY) GDP Export Value
2018 2019 2020 2018 2020 2019 Year Year Q4 Q1 Q2 Year Year Q4 Q1 Q2
USA 3. . .3 .3 - .5 . - .5 - .5 -3.3 -3 .3 Eurozone . .3 . -3. - 5. . - .5 - . -4. - 4. UK .3 .5 . - . - . . -3.5 5.3 - .4 - 5.
Australia . . . .4 - .3 5.3 - . - . - 4. Japan .3 . - . - . - 5. -4.4 -4.4 -4.4 - 3.
China . . . - . 3. . .5 . - 3.3 . India . 4. 4. 3. - . - . - . - . -3 . South Korea . . .3 .4 - . 5.4 - .4 - . - . - .3
Taiwan . . 3.3 . - . 5. - .4 . 3. - .4
Hong Kong . - . -3. - . - . . -4. - . - . -3. Singapore 3.4 . . - .3 - 3. .3 -5. -3.5 -3. - . Indonesia 5. 5. 5. 3. -5.3 . - . -3. . - . Malaysia 4. 4.3 3. . - . 4. -4.3 -3. - . - . Philippines .3 . . - . - .5 . .3 . -5. - .5 Vietnam . . . 3. .4 3.3 .4 .5 . - . Source: CEIC , Collected by NESDC

Macroeconomic Strategy and Planning Division
NESDC Economic Outlook
Aug 17, 2020 21
The world economy and merchandise trade in 2020 are likely to experience a sharp drop due to the historically low economic growth of
key economies in the second quarter, caused by the spreading of COVID-19 in major economies especially in the US as well as the
extensive outbreak covering more of the global economy, especially in South Africa, the Middle East, and the emerging economies. In
addition, during the rest of the year, it is expected that economic and merchandise trade recovery will be slower than previously
anticipated, as the outbreak situation is more severe and lingered than predicted in the previous baseline assuming that most economies
will contain the disease within the third quarter. However, the current situation shows that the outbreak situation remains highly
uncertain looking forward, as seen in the increasing number of new patients especially in the U.S., Brazil, India, Russia, and South
Africa. Several countries are also experiencing the second wave of the outbreak, namely China, Japan, South Korea, Vietnam, France,
Spain, and Australia. These conditions caused many governments to return to implement containment measures again including
closures of key places as well as restricting travels since July, after some measures were relaxed in the second quarter. As the epidemic
situation is evolving, the global economy and trade volume for the rest of 2020 remain highly uncertain depending on these crucial
factors as follows: (i) state capacity and the duration for controlling and containing the contagion of virus in its own jurisdiction
particularly to avoid the second wave outbreak, which will trigger additional containment measures, (ii) adjustment of consumer
behaviors and business models after the pandemic, (iii) policy space and effectiveness of the policy implementation to support business
sector to be able to resume their operation and not further affect the labor market, as well as to control the contagious impacts not to
move from the real sector to the financial and government sectors, and (iv) the development of the vaccine or the treatment against the
COVID-19 infection, and the virus adaptability to different weather conditions.
The baseline forecast rests upon the following key assumptions: (i) Most major economies are able to contain the spread of the virus the
last quarter of 2020 and thus economic activities can be resumed to the same level as the current level of China by the first quarter of
2021, under an effective examination, tracing, and quarantine system, as well as a strict and ongoing behaviors for controlling and
preventing further outbreak. (ii) There is a successfully developed vaccines against COVID-19 within the end of 2020, which is
expected to be partially produced and distributed within the first quarter of 2021, especially in the US, the UK, Japan, and China. The
production capacity is expected to increase and result in a more widespread usage by the latter half of 2021. (iii) The spread of the virus
will not be intensified during winter, which would lead to a wider and lengthened outbreak of the disease and result in the redeployment
of containment measures. (iv) The international travel restrictions in major countries will be partially relaxed in the first quarter of 2021
and will fully loosened within the second quarter of 2021, allowing international travel to increasingly recover during the second half of
2021. (v) There is no contagious impacts moving from the real sector to the financial sector, causing the financial or fiscal crisis as well
as the government policy both fiscal and monetary can fully support the business sector to operate at a 80-percent of their full capacity
in the first quarter of 2021. (vi) The conflict between the US and China will not further intensify resulting in more trade measures,
which will aggravate economic slowdown during the rest of the year. Under this baseline scenario, the global economy and global trade
tend to gradually pick up its pace, mainly supported by the lifting of containment measures and the reopening of economic activities
both by consumers and by businesses, as well as the historical government stimulus packages in both fiscal and monetary policy of
major economies. As such, the world economy and trade volume in 2020 is projected to decline by 4.5 percent and 12.0 percent,
respectively, compared with the previously forecasted rates of 2.8 percent, and 10.0 percent, respectively. Prospects on key economies
are as follows:
The US Economy is expected to decline by 9.0 percent, the lowest in 74 years since the second World War in 1946, compared with
a growth of 2.2 percent in 2019. This is a downward revision of the forecast from a 6.0-percent contraction, especially because of the
severe outbreak where the number of newly infected starts to increase again in June, which, subsequence, causes some states with
spiked number of newly infected have to reemploy closures of places and prohibition of public gathering, especially in California,
Colorado, Florida, and Texas. As a result, the economic recovery of the US tends to be slower than previously expected. However, the
relaxation of the measures in many states since May is expected to support economic recovery in the third quarter after the severe
decline in the second quarter, as evident by the recovering July manufacturing and services PMI, which are at 50.9 and 50.0
respectively, and are higher than 50 for the first time since February and January respectively. Consumer confidence index in July also
improved to 92.6 from 90.0 in the second quarter. Similarly, unemployment was at 10.5 percent in July, a decline from historically high
14.4 percent in April. Under the conditions of non-recovering outbreak of the disease as well as the slow economic recovery in the
second half of the year, the government implemented the major additional fiscal measures to alleviate the economic impact as President
Donald Trump has already signed on August 9th to issue an economic measure emphasizing on extending the jobless claims and
personal income tax reduction1 1 . Additional alleviation and recovery plans are also in the processes of consideration by the House of
Representatives, including personal income assistance, income assistance for dependents and youth, and jobless claims. At the same
time, the Federal Reserve also tends to continually maintain low rates of interests, as seen in the 29th July meeting which maintained the
rates to be within 0.00 – 0.25 and signaled that the rates will not be lifted until the economy goals on employment and price stability
will be reached. The Federal Reserve also implemented measures to assist businesses with their liquidity as announced earlier in the
year, temporarily extended the deadline of Swap Line opening for key economies’ central banks, and opened Temporary Repurchase
Agreement Facility (FIMA Repo Facility) for central banks and international organizations until the end of March 2021, from the
previously stated deadline of September 2020, in order to create more liquidity of the US dollars in the global financial markets.
4. The World Economic Outlook for 2020
11 Such order may be faced with legal challenges and therefore may not be effective, as the US constitution gives power to the House of Representatives on the changes of taxes or any other expenditure, while the president is not allowed such authority.

Macroeconomic Strategy and Planning Division
NESDC Economic Outlook
Aug 17, 2020 22
The Eurozone economy is anticipated to fall by 10.5 percent, a record low, compared with a growth of 1.3 percent in 2019, and is
a downward revision from 7.4 percent in the previous forecast. This adjustment is due to the lengthened outbreak of COVID-19 and
some of the members are currently in the second wave of the outbreak, particularly Spain and France. These result in a slower-than-
expected recovery in the latter half of the year. The recovery will also be in different paces depending on the economic fundamental
between the Eurozone members. Specifically, key Eurozone economies such as Germany and the Netherlands tend to recover faster
than others due to the regaining manufacturing. On the other hand, countries with high proportion of services and under the second
wave of the outbreak such as Italy and Spain are recovering slower than previously expected. Nevertheless, the outbreak situation in
several economies are improving and thus allow relaxation of the containment measures, resulting in recovering economic activities in
the third quarter, reflected by the July manufacturing and services PMI which improved to 51.8 and 54.7, highest in the 21 and 25
months respectively. During the rest of the year, the economy is also supported by a major fiscal stimuli, after the European Union
achieved a joint agreement as of 21 July 2020 to employ 1.82 trillion Euro worth of economic stimulus, which consisted of long-term
expenditure budget of the EU during 2021 and 2027 worth 1.07 trillion Euro and “Next Generation EU” economic recovery plan worth
0.75 trillion Euro. In addition, the ECB tends to still employ a relaxed monetary condition and maintain low interests. The ECB has also
initiated Eurosystem Repo Facility (EUREP) in order to maintain liquidity in the financial markets as well as re-standardization of the
securities used for collateral in order to borrow from the ECB, to offset the credit rating downgrade of assets in Europe.
The Japanese economy is expected to contract by 6.2 percent, a historical low, compared with 0.7-percent expansion, and is a
downward revision from the last forecast of 4.9 percent. This is due to the intensified outbreak and the second wave reflected by the
increasing number of the infected people, causing the government to force closure of several places as well as to put forward additional
travel restrictions in August. It is anticipated that the economic recovery during the latter half of the year will be slower than previously
expected. Nevertheless, the government has approved 117 trillion yen, or about 21 percent of GDP, worth of economic stimulation in
12 June. Together with the third phase economic stimulus measures previously announced, the total value of Japan economic
stimulation stands at 234 trillion yen, or about 42 percent of GDP, a record high. In addition, the BOJ has continually set its monetary
policy to a more expansionary stance by extending its asset purchases to be unlimited, both government bonds and private debt
securities.
The Chinese economy is estimated to expand by 2.0 percent as in the previous forecast, the lowest growth rate in 44 years since 1976.
The economy recovered in the second quarter from relaxing containment measures in some areas since mid-February, consistent with
the recovering Caixin Manufacturing PMI from 49.4 in April, to 50.7, 51.2, and 52.8 in May, June, and July, respectively, which were
higher than 50 for the third month consecutively signifying a recovering production. In addition, exports has been recovering for 2
months in a row and grew by 7.2 in July, which is highest in the past 7 months. Moreover, the Chinese economy will be supported by
the fiscal impulse announced on 30 July 2020 which is worth 4.6 trillion Yuan (4.5 percent of GDP) and PBOC’s expansionary actions
by injecting liquidity to the financial market by further reducing commercial banks’ reserve requirements and continually perform bond
repurchases. The Chinese government is also keen put more measures to alleviate the affected households and businesses. However, the
Chinese economy is still prone to the US’s trade measures which has been tenser and tend to be even more harsh. In particular, Chinese
imports from the US in the first 7 months of 2020 has be only at 221 billion USD, less than the deal from the phase 1 trade agreements:
China is to imports 200 billion USD more than it did in 2017, which was at 433 billion USD, from 2020 to 2021.
The Newly Industrialized Economies (NIEs) are expected to contract more than previously expected due to the severe impact of the
outbreak and second wave of the outbreak in several countries. The economies of South Korea, Hong Kong, and Singapore are
expected to decrease by 2.0 percent, 7.2 percent, and 5.8 percent, respectively, in contrast to the previously forecasted decline of 1.2
percent, 5.0 percent, and 3.5 percent, respectively. On the other hand, the economy of Taiwan is seen to decline by 2.0 percent, an
optimistic revision from the previous forecast of a 4.0-percent decrease, due to the timely containment of the epidemic, no occurrence
of the second wave outbreak, and the fast recovering exports. However, the economic impact of COVID-19 will vary from country to
country mainly depending on the export dependency of each economy, especially those related to tourism which have been directly
affected by the outbreak and the intensity of the measures of closure of attractions and travel restrictions, as well as the global economic
deceleration. Latest data shows that the outbreak in Taiwan is limited while the second wave is started to be seen in South Korea, Hong
Kong, and Singapore. Nevertheless, the NIEs will be supported throughout the latter half of 2020 due to fiscal stimuli. The governments
of South Korea, Hong Kong, and Singapore have initiated fiscal measures accounting for 14.6 percent, 10.2 percent, and 24.5 percent
for their respective GDPs. Monetary policies also tend to be more relaxed.
The ASEAN economies are expected to decline in 2020. In particular, the economies of Indonesia, Malaysia, and the Philippines
are expected to decrease by 1.3 percent, 5.0 percent, and 5.0 percent, respectively, in contrast to the 2019 growth rates of 5.0 percent,
4.3 percent, and 6.0 percent, respectively. These are downward revisions, from the previous forecasts that Indonesian economy would
expand by 0.5 percent and that the Malaysian economy would decline by 1.7 percent, due to severe effects of the COVID-19 outbreak
on the global economy, causing the second quarter figures to be below expectations. On the other hand, the economy of Vietnam is
still expected to expand by 2.4 percent in 2020 remaining unchanged from the previous estimates. Nevertheless, it is expected that
throughout the second half of the year, monetary and fiscal policies will be expansionary buttressing the negative economic impacts of
the outbreak. As of 30th July, the governments of Indonesia, Malaysia, the Philippines, and Vietnam have provided fiscal impulses
worth 4.2 percent, 4.2 percent, 3.1 percent, and 3.7 percent of their respective GDP. In addition, the ASEAN economies tend to be
benefited by the recovery of their trading partners during the latter half of 2020, which is signaled by the exports recovery in June
compared to May, particularly export expansions of Indonesia and Malaysia, as well the production relocation from major economies
which partly reflected the adjustments of supply chain due to COVID-19.

Macroeconomic Strategy and Planning Division
NESDC Economic Outlook
Aug 17, 2020 23
Without the second wave outbreak of COVID-19 domestically, under the baseline assumption it is expected that the Thai economy for
the rest of 2020 will gradually recover from its lowest contraction in the second quarter. The recovery will be supported by the easing of
lockdown policy which thus made the economic activities adjusted to normal level, the recovery of key trading partners’ economies, the
disbursement under the budget and the government stimulus package, and the production and exports of goods that benefit from trade
war and the pandemic. Nonetheless, the levels of economic activity and income base in the second half of the year are likely to be lower
than the same period last year, mainly due to the delayed opening of international travel, the impact from the drought, and the rise in
unemployment. Meanwhile, there are also additional risks that need to be closely monitored, such as the uncertainty of the pandemic,
the U.S. policy direction before and after the U.S. presidential election, and the economic stability of countries with weak economic
fundamental.
5. Thai Economic Outlook for 2020
1) The success of the pandemic control and prevention in Thailand which led to the ease of lockdown and traveling restrictions
will support the economic activities to recover and normalize to a pre-pandemic level. According to the Center for COVID-19
Situation Administration (CCSA), some lockdown policies have been relaxed since May 3rd, 2020. Simultaneously, all restrictions
over activities have been lifted on August 13th, 2020, but the activities still need to strictly follow the pandemic preventive
guidelines. Furthermore, Thailand has recorded zero domestic cases of infection since May 26th, 2020, which helps improve the
consumer confidence index. This translates to the gradual improvement of domestic expenditure and the economic activity in many
sectors which will make the Thai economy recover in the second half of 2020 after experiencing the lowest contraction in the
second quarter.
2) The disbursements under the budgetary framework and stimulus package, which is consisted of: (i) The baseline
disbursement under the FY2020’s annual government budget should be about 2,905,614 million baht, increasing from the
FY2019’s annual government by 4.4 percent. (ii) The FY2021’s annual government budget should be disbursed 848,100 million
baht in the first quarter, increasing by 13.1 percent from the same period last year. (iii) The disbursement under the Emergency
Decree Authorizing the Ministry of Finance to Raise Loans to Solve Problems, to Remedy and Restore the Economy and Society as
Affected by the Coronavirus Disease Pandemic, B.E. 2563 (2020), valued at 1 trillion baht, should be at least 563,400 million baht.
(iv) The support from key measures, such as the Emergency Decree on Financial Assistance to Small and Medium-sized
Enterprises Affected by Coronavirus Pandemic, and the measures to help retail borrowers’ phase 1 and phase 2.
3) The recovery of the world economy and the global trade volume in the latter half of the year, mainly supported by the
improvement of the outbreak situation in several countries. The recent data showed that the new infection number has remained low
in many key trading partners’ economies, such as the United Kingdom, Germany, and Taiwan. Those economies have lifted up the
containment and travel restrictions which helped further drive the economic activities. Consequently, some countries' important
economic indicators during June – July significantly improved although other countries show a signal of a second wave outbreak.
From a baseline, the second outbreak during the remaining of the year is expected to be less severe than the first half. Countries that
continue to experience a severe spread of the coronavirus, such as the U.S. and India, will gradually be able to contain the outbreak
in the second half of the year. Together with the fiscal stimulus in the key trading partners’ economies, the world economy and the
global trade volume will pick up consistently.
4) The expansions of some key production and exports that benefit from trade war, the relocation of production base, and the
increase in demand for certain goods due to the pandemic. This was evident by an increase in the Thai export to the U.S. and China,
as well as the expansion of the goods related to the coronavirus outbreak in the second quarter, particularly; food products-canned
and processed seafood (13.4 percent), fresh frozen chicken (27.1 percent), seasoning (3.6 percent), and soups and flavored food
(15.0 percent); medical equipment-medical equipment and supplies (7.3 percent); and information technology-related product-
transmitters, radios, telephones, telephones, televisions (6.3 percent) and fax and telephone components (5.9 percent). It is thus
expected that growths of these products will support overall exports and manufacturing production not to experience a sharp
contraction.
Supporting factors for the economic growth:

Macroeconomic Strategy and Planning Division
NESDC Economic Outlook
Aug 17, 2020 24
Even though, the supporting factors as mentioned earlier will help the Thai economy to gradually recover, the economic activities in the
latter half of this year remain at a lower level compared to the level of the last year due to the crucial limitation as follows:
1) The severe decline in the numbers of foreign tourists and revenue from tourist spending and the delay in reopening to
international travelers in the second half of the year. The drops of numbers and revenue from foreign tourists are expected to be
less than the previous estimate. The recent data showed that there is still an ongoing outbreak in many tourist origins, particularly in
the U.S., India, and Russia, as well as the second wave outbreak in China, Japan, and South Korea. Therefore, under baseline
condition, it is expected that Thailand will not be able to lift the travel ban for foreign tourists during the second half of 2020 as
previously expected. The major origins of tourists also tend to adopt a high level of travel restriction during the rest of the year,
which will stifle the demand and limit the recovery of the Thai economy.
2) The drought. The actual figure of all useable water stored in dams and reservoirs, as of August 1st, 2020, is 7,120 million cubic
metres (10 percent of all available storage), which is below the level of 10,374 million cubic metres in 2019 (15 percent of all
available storage), and below the same period in 2015 (13 percent of available storage) when the agricultural sector was affected
significantly and declined by 6.5 percent. Under these conditions, the agricultural production in 2020 is expected to decrease
continually from a 6.7-percent contraction in the first half of the year.
3) The increase in unemployment and the financial limitation of household and business sectors tend to limit the economic
recovery in the latter half of the year. The number of unemployed workers in the second quarter was about 750,000 people,
increasing from 390,000 people at the same time last year. The unemployment rate was 1.95 percent, the highest rate compared
with the second quarter rates since 2008 and was in accordance with the rise in the number of claimed insurances under section 38
which increased from 170,000 people in March to 400,000 people in June, together with an increase in household debt to GDP. The
increase in unemployment amid rising debt burdens tends to restrict income, spending and household debt repayment in certain
groups. Similarly, some business sectors were also struggling with financial liquidity due to the outbreak in the first half the year
which is reflected in the increase in the proportion of Special Mention Loan (SML). Although the problems tend to recover due to
several government measures in terms of debt restructuring, credit extension, and the reoperation of business in many sectors, such
issues are still likely to hinder the recovery of a number of economic sectors, particularly the tourism and related-service sectors
due to continuous restriction to travel in the second half of the year as well as some SMEs that could not access government
support.
Key Limitation to Economic Growth:
There remains uncertainty that could make the economic projection in the latter half of 2020 differ from baseline assumption. Key risks
factors needed to be constantly monitored are as follows:
1) Uncertainty of a pandemic outbreak and the state capacity to control the spread in key trading economies and key origins of
inbound tourists could last longer or sooner than the baseline assumptions. In addition, the risks of the domestic and international
second wave outbreak could lead the world economy, global trade volume, and the overall growth in 2020 to differ from assumed
in the baseline scenario.
2) The fluctuations of the world economy and financial market. There are additional conditions in the world economy that need to
be closely monitored and assessed, including (i) the US-China trade tension during the remainder of 2020, especially before the
U.S. presidential election which may intensify the recession of world economy and trade activity, (ii) the direction of U.S. trade
policy after the election, particular, the economic stimulus measure, and the trade relations with its key trading economies, (iii) the
expectation of investors regarding the monetary policy and the fiscal climate of key economies, and (iv) the risk of economic crisis
in major countries that have weak economic fundamental which may expand from production problems to monetary and fiscal
crisis, and probably could lead to political uncertainty.
Key Risk Factors:
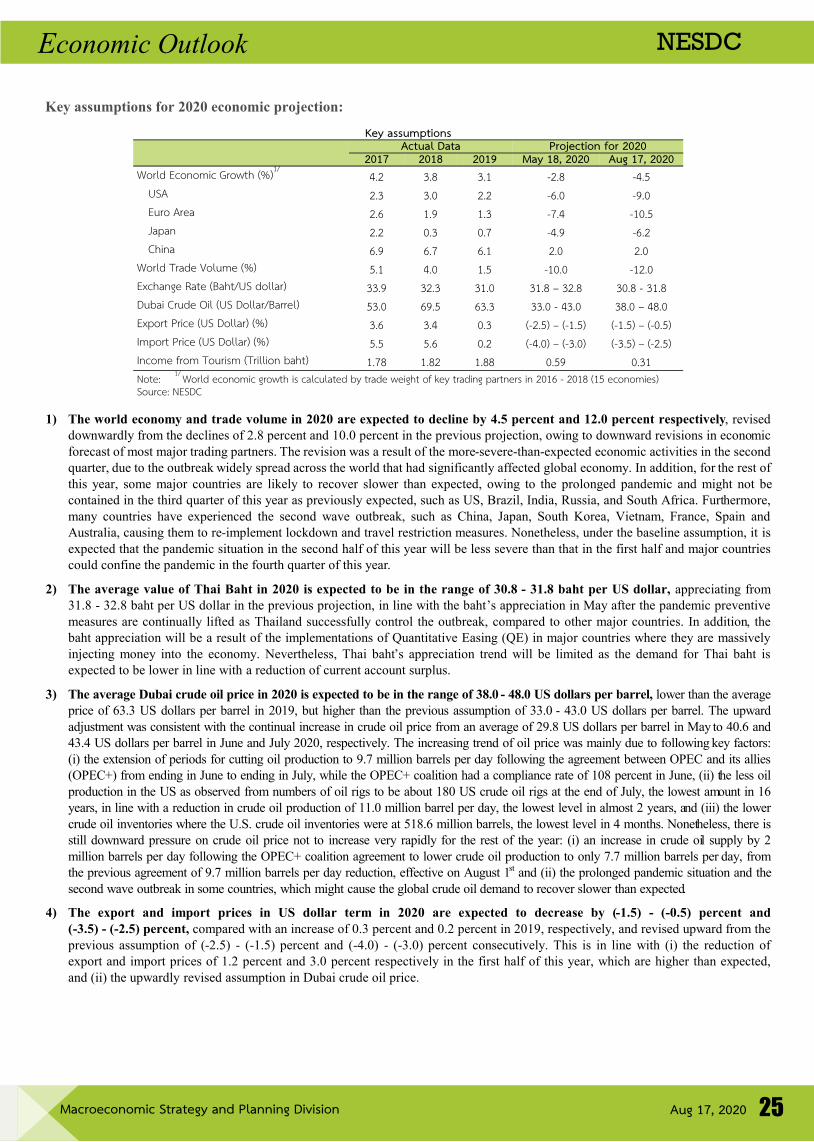
Macroeconomic Strategy and Planning Division
NESDC Economic Outlook
Aug 17, 2020 25
1) The world economy and trade volume in 2020 are expected to decline by 4.5 percent and 12.0 percent respectively, revised
downwardly from the declines of 2.8 percent and 10.0 percent in the previous projection, owing to downward revisions in economic
forecast of most major trading partners. The revision was a result of the more-severe-than-expected economic activities in the second
quarter, due to the outbreak widely spread across the world that had significantly affected global economy. In addition, for the rest of
this year, some major countries are likely to recover slower than expected, owing to the prolonged pandemic and might not be
contained in the third quarter of this year as previously expected, such as US, Brazil, India, Russia, and South Africa. Furthermore,
many countries have experienced the second wave outbreak, such as China, Japan, South Korea, Vietnam, France, Spain and
Australia, causing them to re-implement lockdown and travel restriction measures. Nonetheless, under the baseline assumption, it is
expected that the pandemic situation in the second half of this year will be less severe than that in the first half and major countries
could confine the pandemic in the fourth quarter of this year.
2) The average value of Thai Baht in 2020 is expected to be in the range of 30.8 - 31.8 baht per US dollar, appreciating from
31.8 - 32.8 baht per US dollar in the previous projection, in line with the baht’s appreciation in May after the pandemic preventive
measures are continually lifted as Thailand successfully control the outbreak, compared to other major countries. In addition, the
baht appreciation will be a result of the implementations of Quantitative Easing (QE) in major countries where they are massively
injecting money into the economy. Nevertheless, Thai baht’s appreciation trend will be limited as the demand for Thai baht is
expected to be lower in line with a reduction of current account surplus.
3) The average Dubai crude oil price in 2020 is expected to be in the range of 38.0 - 48.0 US dollars per barrel, lower than the average
price of 63.3 US dollars per barrel in 2019, but higher than the previous assumption of 33.0 - 43.0 US dollars per barrel. The upward
adjustment was consistent with the continual increase in crude oil price from an average of 29.8 US dollars per barrel in May to 40.6 and
43.4 US dollars per barrel in June and July 2020, respectively. The increasing trend of oil price was mainly due to following key factors:
(i) the extension of periods for cutting oil production to 9.7 million barrels per day following the agreement between OPEC and its allies
(OPEC+) from ending in June to ending in July, while the OPEC+ coalition had a compliance rate of 108 percent in June, (ii) the less oil
production in the US as observed from numbers of oil rigs to be about 180 US crude oil rigs at the end of July, the lowest amount in 16
years, in line with a reduction in crude oil production of 11.0 million barrel per day, the lowest level in almost 2 years, and (iii) the lower
crude oil inventories where the U.S. crude oil inventories were at 518.6 million barrels, the lowest level in 4 months. Nonetheless, there is
still downward pressure on crude oil price not to increase very rapidly for the rest of the year: (i) an increase in crude oil supply by 2
million barrels per day following the OPEC+ coalition agreement to lower crude oil production to only 7.7 million barrels per day, from
the previous agreement of 9.7 million barrels per day reduction, effective on August 1st and (ii) the prolonged pandemic situation and the
second wave outbreak in some countries, which might cause the global crude oil demand to recover slower than expected.
4) The export and import prices in US dollar term in 2020 are expected to decrease by (-1.5) - (-0.5) percent and
(-3.5) - (-2.5) percent, compared with an increase of 0.3 percent and 0.2 percent in 2019, respectively, and revised upward from the
previous assumption of (-2.5) - (-1.5) percent and (-4.0) - (-3.0) percent consecutively. This is in line with (i) the reduction of
export and import prices of 1.2 percent and 3.0 percent respectively in the first half of this year, which are higher than expected,
and (ii) the upwardly revised assumption in Dubai crude oil price.
Key assumptions for 2020 economic projection:
Key assumptions Actual Data Projection for 2020
2017 2018 May 18, 2020 Aug 17, 2020 2019 World Economic Growth (%) /
4. 3. - . -4.5 3. USA .3 3. - . - . . Euro Area . . - .4 - .5 .3 Japan . .3 -4. - . . China . . . . .
World Trade Volume (%) 5. 4. - . - . .5 Exchange Rate (Baht/US dollar) 33. 3 .3 31.8 – 32.8 3 . - 3 . 3 . Dubai Crude Oil (US Dollar/Barrel) 53. .5 33. - 43. 38.0 – 48.0 3.3 Export Price (US Dollar) (%) 3. 3.4 (-2.5) – (-1.5) (-1.5) – (-0.5) .3 Import Price (US Dollar) (%) 5.5 5. (-4.0) – (-3.0) (-3.5) – (-2.5) . Income from Tourism (Trillion baht) . . .5 .3 . Note: / World economic growth is calculated by trade weight of key trading partners in - ( 5 economies) Source: NESDC

Macroeconomic Strategy and Planning Division
NESDC Economic Outlook
Aug 17, 2020 26
5) Revenue from foreign tourists in 2020 is expected to be 0.31 trillion baht, decreasing by 83.6 percent from 1.88 trillion baht in
2019 and declining from 0.59 trillion baht in the previous projection. The number of foreign tourists in 2020 is projected to be 6.7
million people, revised downwardly from 12.7 million people in the previous projection, and also lower than 39.8 million people in
2019. The projection is under the assumption that the COVID-19 outbreak in several countries have currently remained severe and
prolonged. In addition, many countries experienced with the second wave outbreak and, subsequently, would lead those countries
including Thailand to delays in relaxing international travel restrictions for tourists, as compared to previous assumption that is
expected to start international travel during the end of the third quarter.
6) The budget disbursement assumptions are as follows: (i) The FY2020’s annual budget disbursement rate of 91.8 percent of the
overall budget, upwardly revised from 90.5 percent in the previous projection, where the disbursement rates of capital and current
budgets are 99.0 percent and 60.0 percent consecutively. This is mainly due to the upward revision of capital budget disbursement
rate from the previous expectation of 55.0 percent, as resulting from the fact that the actual disbursement rate of 40.4 percent
during the first ten months of the FY2020, was higher than previously expected, and it is expected that the disbursement during the
last quarter of this fiscal year will be fasten. (ii) The FY2021’s annual budget disbursement rate is anticipated at 94.2 percent of
overall budget, and there will be no delay in budgetary process. Specifically, the budget disbursement rates of current and capital
budgets are expected at 98 percent and 80 percent, respectively. (iii) The carry-over budget disbursement of 88.0 percent. (iv) The
State-owned enterprises’ capital budget disbursement is expected to be 75.0 percent, remained unchanged from the previous
forecast. (v) The budget under the Emergency decree authorizing the Ministry of Finance to raise loans to solve problems, to
remedy and restore the economy and society as affected by the Coronavirus disease pandemic B.E. 2563 (2020) is expected to be
disbursed around 563,400 million bath in 2020.
Economic Projection for the Thai Economy in 2020:
The Thai economy in 2020 is projected to decline in the range of (-7.8) - (-7.3) percent (with the midpoint of -7.5 percent),
compared with a 2.4-percent expansion in 2019. Headline inflation is estimated to lie within the range of (-1.2) - (-0.7) percent
and the current account is anticipated to record a surplus of 2.5 percent of GDP.
In the press release dated on August 17th, 2020, the NESDC forecasted that the Thai economy is expected to decline in the range of
(-7.8) - (-7.3) percent (with the midpoint of -7.5 percent), downwardly revised from the range of (-6.0) - (-5.0) percent (with the
midpoint of -5.5 percent) in the previous projection, released on May 18th, 2020, together with the revision in key growth components
to be consistent with changing conditions and revised assumptions as follows;
1) The downward revisions of the number of foreign tourists and foreign revenues was due to the delay in reopening to international
travelers during the remainder of the year. The recent data showed that there is still an ongoing outbreak in many tourist origins,
particularly in the US, India, and Russia, as well as the second wave outbreak in China, Japan, Hong Kong, France, Spain, and Australia.
Under this condition, it is expected that Thailand will not be able to lift the travel ban for foreign tourists during the last quarter of 2020 as
previously expected. The major origins of tourists also tend to adopt a high level of international travel restriction. Then, it is expected that
that, in 2020, the total foreign tourists would be 6.7 million people, compared with 12.7 million people in the previous projection and with
39.8 million people in 2019. Meanwhile, the revenue from foreign tourists in 2020 would be 0.31 trillion baht, compared with 0.59 trillion
baht in the previous estimate and with 1.88 trillion baht in 2019. Under such conditions, there will be significantly less driving force from
the export of services, compared with the previous anticipation.
2) The global economy and trade in 2020 were expected to decline by 4.5 percent and 12.0 percent respectively, revised
downwardly from a 2.8-percent and a 10.0-percent contractions. This revision was owing to (i) the lowest contraction and recession
in several economies in the second quarter, (ii) the tendency of the more-severe-than-expected outbreak in some countries during
the latter half of 2020, and (iii) the second wave outbreak in many countries. Under such conditions, many economies tend to not
fully recover as expected in the previous projection. Nonetheless, the spread of coronavirus is projected to be less in severity and
impact than in the first half of 2020.

Macroeconomic Strategy and Planning Division
NESDC Economic Outlook
Aug 17, 2020 27
1) Total Consumption: (1) Private Consumption Expenditure tends to decline by 3.1 percent, compared with a 4.5-percent growth
in 2019, and a 1.7-percent decrease in the previous projection. This downward revision was mainly owing to the lower-than-
expected income from tourism and export sectors. Nevertheless, the private consumption tends to gradually increase during the rest
of the year as results of more easing containment measures, and the continuity of zero new-infected number, which made
households to be able to adjust their behaviors and normalize their consumption patterns amid the continual economic and income
recovery. (2) Government Consumption Expenditure is projected to expand by 3.6 percent, the same level as previous
estimation, and accelerating from a 1.4-percent growth in 2019. This was in accordance with the unchanged assumptions of current
budget disbursement under the key budgetary frameworks.
2) Total Investment is expected to decrease by 5.8 percent, compared with a 2.1-percent decline in the previous assumption and
a 2.1-percent growth in 2019. (1) Public investment is estimated to grow by 8.6 percent, compared with a 5.6-percent in the
previous quarter and speeding up from 0.2 percent in 2019. This was in line with the upward revision of the FY2020’s capital
budget disbursement rate from 55.0 percent in the previous projection to 60.0 percent in the current estimation. (2) Private
investment is expected to decrease by 10.2 percent, compared with a 2.8-percent growth in 2019, and revised down from 4.2
percent in the previous projection. This downward revision was in line with declines in exports, level of capital utilization rate,
business confidence, as well as the travel restrictions of international investors, and the highly uncertain world economy.
3) Export value of good in US dollar terms is anticipated to decrease by 10.0 percent, compared with a decrease of 3.3 percent in
2019, and revised down from an 8.0-percent decline in the previous assumption. This downward revision was a result of the
downward adjustment of export volume forecast from a 6.0-percent decrease to a 9.0-percent contraction in line with the
adjustment of assumption on world economic growth and global trade volume. Additionally, export price assumption is expected to
decrease by 1.0 percent, compared with a 2.0-percent decrease in the previous projection. Meanwhile, export of services is also
expected to be 0.31 trillion baht, downwardly revised from 0.59 trillion baht in the previous projection. Consequently, the export
quantity of goods and services is estimated to decrease by 20.9 percent, compared with a 17.3-percent decline in the previous
projection, and a 2.6-percent contraction in 2019.
4) Import value of goods in US dollar terms is expected to decline by 15.4 percent, compared with a 5.6-percent contraction in
2019, and a 13.2-percent decrease in the previous projection. This downward revision is mainly due to the adjustment of import
quantity of goods from a 9.7-percent decline in the previous projection to a 12.4-percent decrease in this projection. This downward
revision is in line with a revision of exports, private investment and private consumption. The import price assumption is revised to
a 3.0-percent decrease from a 3.5-percent contraction in the previous quarter. Together with a less service import due to the
limitation of Thai traveling abroad, the import of goods and services in 2020 is expected to decrease by 16.3 percent, compared
with a 13.3-percent contraction in the previous estimation, and a 4.4-percent decrease in 2019.
5) Trade balance is estimated to register a surplus of 35.7 billion US dollars, increasing from a surplus of 26.7 billion US dollars in
2019, and the same level as the previous estimation. Combining with higher deficit in service account due to declining revenues
from foreign tourists, the current account is expected to register a surplus of 12.6 billion US dollars or 2.5 percent of GDP,
lower than a surplus of 7.0 percent in 2019, and a surplus of 4.9 percent of GDP in the previous projection.
6) Economic stability: the headline inflation rate in 2020 is projected to be in the range of (-1.2) – (-0.7) percent, compared with a
0.7 percent in 2019.
Key components of the economic growth :

Macroeconomic Strategy and Planning Division
NESDC Economic Outlook
Aug 17, 2020 28
The Thai economy for the rest of 2020 is expected to gradually recover from its most severe contraction in the second quarter,
supported mainly by the easing of lockdown policy which thus made the economic activities adjusted to normal operations, the
recovery of key trading partners’ economies, the disbursement under the budget and the government stimulus package, and the
production and exports of goods that benefit from trade war and the pandemic. Nonetheless, the levels of economic activity and income
base in the second half of the year are likely to be lower than the same period last year, mainly due to the possible delay in relaxing the
restrictions on international travel, the drought impacts, and the rise in unemployment. Meanwhile, there are additional risks that need
to be closely monitored, including the uncertainty of the pandemic, the U.S. policy directions before and after the presidential election,
and the economic stability of countries with weak economic fundamental. Given these conditions, it is important to emphasize on the
measures for the Covid-19 prevention and control together with the macroeconomic policy implementation during the rest of the year
2020 which should focus on:
1) Coordinating monetary and fiscal policies to support economic recovery, especially: (i) Expediting the implemented policies in
order to ensure that they will reach the target group efficiently, and to encourage readiness of the business sector for resuming
operation after the economic recovery, particularly the credits provision which need to be accelerated, monitored, assessed, and
improved. (ii) Reorganizing financial measure to be more flexible and to be in line with the recovery of each business sector.
(iii) Controlling and preventing the spread of potential problems in some production sectors that may affect the financial sector.
(iv) Providing a suitable financial environment to support continuous economic recovery in terms of financial cost, reducing the
difficulty of loan accessibility, and the risk from Baht appreciation during the global economic recovery amid the continued
expansion of monetary policy in other economies.
2) Considering additional reliefs for businesses and workers who experience the difficulty to recover, particularly: (i) Businesses
and employees in tourism and related service sectors due to the delay in reopening borders to international tourists. (ii) SMEs with
potential to recover but face difficulty to access government support. (iii) Temporarily closed businesses and furlough workers that
require specific measures including credit provision, debt restructuring, the supports and incentives to maintain employment, the
budget disbursement under public seminar program aiming to mitigate the lost in tourism sector, as well as the support for
unemployed workers and workers who will join the new job market by focusing on (i) Integrating data and creating a mechanism
for workforce matching, both in term of job vacancies, and skills of workers, (ii) Developing the labor force’s skill set through
upgrading training for labors in affected industries, specifically those in the tourism sector which may need to switch to new job
market, and (iii) Creating new job positions for unemployed workers and new graduates, and solving the labor shortage for
unskilled and low-skilled laborers from neighboring countries.
3) Driving export of goods to generate foreign-currency income to compensate the decrease in foreign tourist revenue and to
encourage the recovery of production and private investment, emphasizing on: (i) Driving exports of goods that benefited from
trade diversion and relocation in the previous period, including the groups of products that receive advantages from the outbreak, as
well as the change in consumer behavior and business practices that increase demand for more products. (ii) Advertising and
utilizing the strengths of Thailand, especially the success in controlling and preventing the spread of COVID-19 to support
products’ figure in the international market. (iii) Encouraging active online market. (iv) Promoting economic and trade cooperation
between ASEAN’s countries. (v) Alleviating and solving the drought problems that may affect the areas of major manufacturing
bases.
4) Assisting agricultural sector that experienced severe drought and decrease in export prices, especially for: (i) Providing water
resource and water management to the agricultural sector. (ii) Providing immediate compensation to farmers affected by drought.
(iii) Supporting production improvement in agricultural sector. (iv) Supporting online distribution channels for agricultural
products, and providing low-cost logistics directly from producers to consumers in order to increase income share to farmers.
5) Driving government expenditure, including the baseline of: (i) The FY2020’s annual budget disbursement should be at least 91.8
percent of the total budget. (ii) The FY2021’ annual budget disbursement in the first quarter should be at least 25.7 percent.
(iii) The carry-over budget disbursement should be at least 88.0 percent. (iv) The disbursement under the Emergency Decree
Authorizing the Ministry of Finance to Raise Loans to Solve Problems, to Remedy and Restore the Economy and Society as
Affected by the Coronavirus Disease Pandemic, B.E. 2563 (2020)., valued 1 trillion baht, should be at least 563,400 million baht.
It is also important to further drive measures for supporting long-term economic expansion by focusing on (i) driving private
investment, (ii) eliminating the key obstacles to do business for foreign investors and business owners, (iii) driving large-scale
public infrastructure investment in both economic area development and transportation infrastructure, and (iv) restructuring the key
manufacturing and service sectors in order to increase competitive competency, support aging society transition and the change in
technology, increase income distribution, in accordance with the changes consumer behavior and business model.
6. Economic Management for the year 2020

Macroeconomic Strategy and Planning Division
NESDC Economic Outlook
Aug 17, 2020 29
6) Promoting domestic tourism and the purchase of domestic-made product, by (i) encouraging Thais who usually travel abroad
to travel domestically, (ii) building up the cooperation between government sector, state enterprises and private businesses to
consider additional holidays without affecting economic activities, (iii) driving government travel policy to create concrete and
efficient tourism activities, and (iv) encouraging the use of made-in-Thailand products in the government, household and private
sectors in order to support domestic economic recovery and to reduce import amid the deceleration of current account surplus and
continual fiscal deficits.
7) Preparing measure to handle additional risks factors, especially (i) the prolonged outbreak in major countries and the possibility
of a second wave, (ii) the fluctuation of global economic and financial market owing to change in the U.S. policy direction to key
trading partners both before and after the U.S. election, the change in investors’ projection on economic, monetary policy, and
fiscal policies in advanced economies, coupled with the economic stability of countries with vulnerable economic structure, and
(iii) risks from global economic condition in the medium term.

Macroeconomic Strategy and Planning Division
NESDC Economic Outlook
Aug 17, 2020 30
The decline in international tourism revenue, causing by the COVID-19 pandemic since the first quarter of this year, have severely
impacted Thai tourism sector and other related industries. From the data in 2019, Thailand earned 1.88 trillion baht from foreign
visitors, which was accounted for 11.1 percent of 2019 GDP, while revenue from Thai visitors was around 1.1 trillion baht. Revenue
from foreign visitors shared about 63.5 percent of total revenue. Thus the reduction of foreign tourists would have significant impacts
on businesses related to the tourism sector, especially those in the regions that depended heavily on income from foreign visitors.
From the information on visitors in each province, the first three provinces with the highest ratio of revenue from foreign visitors to
total received revenue are Phuket, Phang-nga and Yala, where the revenues from foreign visitors account for 89 percent, 88 percent, and
84 percent respectively. At the same time, the top three provinces with the highest ratio of tourist related sectors to total Gross
Provincial Product (GPP) are Phuket, Phang-nga, and Krabi, with the ratio of 65 percent, 49 percent, and 38 percent respectively. Thus
those provinces with high dependence on foreign visitors are more likely to be prone to the impacts from the reduction of foreign
tourists.
Therefore, under the conditions where lifting international travel control could be delayed and there are high possibilities of a
resurgence of COVID-19 in those key tourists originated countries, the following measures for alleviating adverse impacts in tourism
sector as well as provinces with high foreign dependence are utterly crucial namely: (i) considering additional monetary and fiscal
measures for supporting businesses and workers in the tourism sector and other related industries, especially those in the regions
depending heavily on foreign tourism revenue, (ii) encouraging Thai people who used to travel and spending abroad to travel
domestically instead, especially traveling to those provinces where the impacts are high, (iii) requesting for collaboration among
government, state-own enterprises as well as private sector to consider additional holidays, of which will not affect overall economic
activities, as to support domestic tourism industries, (iv) driving the current tourism campaign to be more productive and effective, and
(v) accelerating the disbursement of FY’s 2021 budget, especially those related to seminar and training in the public sector.
COVID-19 Impacts to Thai Tourism Sector
Proportion of revenue from foreign visitors to total revenue from visitors
Proportion of tourism related sectors to GPP
0 100,000 200,000 300,000 400,000 500,000 600,000 700,000 800,000 900,000 1,000,000 1,100,000
PhuketPhang-nga
YalaSurat ThaniChon BuriNarathiwat
KrabiBangkok
SongkhlaSamut Prakan
TratChiang Mai
Pathum ThaniMae Hong Son
Prachuap Khiri KhanAyutthaya
Foreigners Thais
89%
80%83%
84%88%
49%
65%66%
69%
52%
39%39%
40%
42%
32%33%
(Proportion of revenue from foreign visitors to total revenue from visitors)Million Baht
0 100,000 200,000 300,000 400,000 500,000 600,000 700,000 800,000 900,000
PhuketPhang-nga
YalaSurat Thani
Chon BuriNarathiwat
KrabiBangkok
SongkhlaSamut Prakan
TratChiang Mai
Pathum ThaniMae Hong Son
Prachuap Khiri KhanAyutthaya
Transportation and StorageAccommodation and Food Service
65%49%
4%27%
14%3%38%
17%8%
23%13%15%4%4%
16%5% (Proportion of tourism related sectors to GPP)
Million Baht

Macroeconomic Strategy and Planning Division
NESDC Economic Outlook
Aug 17, 2020 31

Macroeconomic Strategy and Planning Division
NESDC Economic Outlook
Aug 17, 2020 32
Projection for 2020 1/
Actual Data
Projection for 2020
2018 2019 May 18, 2020 Aug 17, 2020 2017
GDP (at current prices: Bil. Bht) ,3 5. , 5. 5, 4 . 5, . 5,4 . GDP per capita (Bht per year) 3 , 5. 43,4 . ,434. 4,5 .4 5, 5.
GDP (at current prices: Bil. USD) 5 .5 543. 4 3. 4 . 45 .3
GDP per capita (USD per year) ,3 . , 4 . , 3. , 5. , 3 .
GDP Growth (CVM, %) 4. .4 (- . ) - (-5. ) (- . ) - (- .3) 4.
Investment (CVM, %)2/ 3. . - . -5. .
Private (CVM, %) 4. . -4. - . .
Public (CVM, %) . . 5. . - .4
Private Consumption (CVM, %) 4. 4.5 - . -3. 3.
Government Consumption (CVM, %) . .4 3. 3. .
Export volume of goods & services (%) 3.3 - . - .3 - . 5.
Export value of goods (Bil. USD) 5 . 4 . 3.5 . 33.
Growth rate (%)3/ .5 -3.3 - . - . .5
Growth rate (Volume, %)3/ 3. -3. - . - . 5.
Import volume of goods & services (%) .3 -4.4 - 3.3 - .3 .
Import value of goods (Bil. USD) . . . 3. .
Growth rate (%)3/ 3. -5. - 3. - 5.4 3.
Growth rate (Volume, %)3/ . -5. - . - .4 .3
Trade balance (Bil. USD) .4 . 35. 35. 3 .
Current account balance (Bil. USD) .5 3 .4 4. . 44.
Current account to GDP (%) 5. . 4. .5 .
Inflation (%)
CPI . . (- .5) - (- .5) (- . ) - (- . ) . GDP Deflator .5 . (- .5) - .5 (- .3) - . .
Source: Office of the National Economic and Social Development Council, 17th August 2020
Note: 1/ Data was calculated based on new national accounts series, published on www.nesdc.go.th 2/ Investment means Gross Fixed Capital Formation 3/ Export and import base on the Bank of Thailand’s data.
For more information e-mail : [email protected] Tel. 0-2280-4085 ext. 6504 or 6459