nehrp recommended provisions: design...
TRANSCRIPT

6-1
6REINFORCED CONCRETE
Finley A. Charney, Ph.D., P.E.
In this chapter, a 12-story reinforced concrete office building with some retail shops on the first floor isdesigned for both high and moderate seismic loadings. For the more extreme loading, it is assumed thatthe structure will be located in Berkeley, California, and for the moderate loading, in Honolulu, Hawaii.
Figure 6-1 shows the basic structural configuration for each location in plan view and Figure 6-2, insection. The building, to be constructed primarily from sand-lightweight (LW) aggregate concrete, has12 stories above grade and one basement level. The typical bays are 30 ft long in the north-south (N-S)direction and either 40 ft or 20 ft long in the east-west (E-W) direction. The main gravity framing systemconsists of seven continuous 30-ft spans of pan joists. These joists are spaced 36 in. on center and havean average web thickness of 6 in. and a depth below slab of 16 in. Due to fire code requirements, a 4-in.-thick floor slab is used, giving the joists a total depth of 20 in.
The joists along Gridlines 2 through 7 are supported by variable depth "haunched" girders spanning 40 ftin the exterior bays and 20 ft in the interior bays. The girders are haunched to accommodatemechanical-electrical systems. The girders are not haunched on exterior Gridlines 1 and 8, and the 40-ftspans have been divided into two equal parts forming a total of five spans of 20 ft. The girders along allspans of Gridlines A and D are of constant depth, but along Gridlines B and C, the depth of the end baygirders has been reduced to allow for the passage of mechanical systems.
Normal weight (NW) concrete walls are located around the entire perimeter of the basement level. NWconcrete also is used for the first (ground) floor framing and, as described later, for the lower levels of thestructural walls in the Berkeley building.
For both locations, the seismic-force-resisting system in the N-S direction consists of four 7-bay moment-resisting frames. The interior frames differ from the exterior frames only in the end bays where thegirders are of reduced depth. At the Berkeley location, these frames are detailed as special moment-resisting frames. Due to the lower seismicity and lower demand for system ductility, the frames of theHonolulu building are detailed as intermediate moment-resisting frames.
In the E-W direction, the seismic-force-resisting system for the Berkeley building is a dual systemcomposed of a combination of frames and frame-walls (walls integrated into a moment-resisting frame). Along Gridlines 1 and 8, the frames have five 20-ft bays with constant depth girders. Along Gridlines 2and 7, the frames consist of two exterior 40-ft bays and one 20-ft interior bay. The girders in each spanare of variable depth as described earlier. At Gridlines 3, 4, 5 and 6, the interior bay has been filled witha shear panel and the exterior bays consist of 40-ft-long haunched girders. For the Honolulu building, thestructural walls are not necessary so E-W seismic resistance is supplied by the moment frames alongGridlines 1 through 8. The frames on Gridlines 1 and 8 are five-bay frames and those on Gridlines 2through 7 are three-bay frames with the exterior bays having a 40-ft span and the interior bay having a20-ft span. Hereafter, frames are referred to by their gridline designation (e.g., Frame 1 is located on

FEMA 451, NEHRP Recommended Provisions: Design Examples
6-2
Figure 6-2A
102'-6"
5 at 20'-0"
216'
-0"
7 at
30'
-0"
Figure 6-2B
N
' '
Figure 6-1 Typical floor plan of the Berkeley building. The Honolulu building issimilar but without structural walls (1.0 ft = 0.3048 m).
Gridline 1). It is assumed that the structure for both the Berkeley and Honolulu locations is founded onvery dense soil (shear wave velocity of approximately 2000 ft/sec).

Chapter 6, Reinforced Concrete
6-3
R 12 11 10 9 8 7 6 5 4 3 2 G
Leve
lSt
ory B 1 2 3 4 5 6 7 8 9101112
11 at 12'-6" 18'-0" 15'-0"
40'-0
"20
'-0"
40'-0
"
''
R 12 11 10 9 8 7 6 5 4 3 2 G
Leve
lSt
ory B 1 2 3 4 5 6 7 8 9101112
11 at 12'-6" 18'-0" 15'-0"
40'-0
"20
'-0"
40'-0
"
''
A.
Sect
ion
at W
all
B.
Sect
ion
at F
ram
e
Figure 6-2 Typical elevations of the Berkeley building; the Honolulu building issimilar but without structural walls (1.0 ft = 0.3048 m).

FEMA 451, NEHRP Recommended Provisions: Design Examples
6-4
The calculations herein are intended to provide a reference for the direct application of the designrequirements presented in the 2000 NEHRP Recommended Provisions (hereafter, the Provisions) and toassist the reader in developing a better understanding of the principles behind the Provisions.
Because a single building configuration is designed for both high and moderate levels of seismicity, twodifferent sets of calculations are required. Instead of providing one full set of calculations for theBerkeley building and then another for the Honolulu building, portions of the calculations are presentedin parallel. For example, the development of seismic forces for the Berkeley and Honolulu buildings arepresented before structural design is considered for either building. The full design then is given for theBerkeley building followed by the design of the Honolulu building. Each major section (development offorces, structural design, etc.) is followed by discussion. In this context, the following portions of thedesign process are presented in varying amounts of detail for each structure:
1. Development and computation of seismic forces;2. Structural analysis and interpretation of structural behavior;3. Design of structural members including typical girder in Frame 1, typical interior column in Frame 1,
typical beam-column joint in Frame 1, typical girder in Frame 3, typical exterior column in Frame 3,typical beam-column joint in Frame 3, boundary elements of structural wall (Berkeley building only)and panel of structural wall (Berkeley building only).
The design presented represents the first cycle of an iterative design process based on the equivalentlateral force (ELF) procedure according to Provisions Chapter 5. For final design, the Provisions mayrequire that a modal response spectrum analysis or time history analysis be used. The decision to usemore advanced analysis can not be made a priori because several calculations are required that cannot becompleted without a preliminary design. Hence, the preliminary design based on an ELF analysis is anatural place to start. The ELF analysis is useful even if the final design is based on a more sophisticatedanalysis (e.g., forces from an ELF analysis are used to apply accidental torsion and to scale the resultsfrom the more advanced analysis and are useful as a check on a modal response spectrum or time-historyanalysis).
In addition to the Provisions, ACI 318 is the other main reference in this example. Except for very minorexceptions, the seismic-force-resisting system design requirements of ACI 318 have been adopted in theirentirety by the Provisions. Cases where requirements of the Provisions and ACI 318 differ are pointedout as they occur. ASCE 7 is cited when discussions involve live load reduction, wind load, and loadcombinations.
Other recent works related to earthquake resistant design of reinforced concrete buildings include:
ACI 318 American Concrete Institute. 1999 [2002]. Building Code Requirements andCommentary for Structural Concrete.
ASCE 7 American Society of Civil Engineers. 1998 [2002]. Minimum Design Loads forBuildings and Other Structures.
Fanella Fanella, D.A., and M. Munshi. 1997. Design of Low-Rise Concrete Buildings forEarthquake Forces, 2nd Edition. Portland Cement Association, Skokie, Illinois.
ACI 318 Notes Fanella, D.A., J. A. Munshi, and B. G. Rabbat, Editors. 1999. Notes on ACI 318-99Building Code Requirements for Structural Concrete with Design Applications. PortlandCement Association, Skokie, Illinois.

Chapter 6, Reinforced Concrete
6-5
ACI SP127 Ghosh, S. K., Editor. 1991. Earthquake-Resistant Concrete Structures InelasticResponse and Design, ACI SP127. American Concrete Institute, Detroit, Michigan.
Ghosh Ghosh, S. K., A. W. Domel, and D. A. Fanella. 1995. Design of Concrete Buildings forEarthquake and Wind Forces, 2nd Edition. Portland Cement Association, Skokie, Illinois.
Paulay Paulay, T., and M. J. N. Priestley. 1992. Seismic Design of Reinforced Concrete andMasonry Buildings. John Wiley & Sons, New York.
The Portland Cement Association’s notes on ACI 318 contain an excellent discussion of the principlesbehind the ACI 318 design requirements and an example of the design and detailing of a frame-wallstructure. The notes are based on the requirements of the 1997 Uniform Building Code (InternationalConference of Building Officials) instead of the Provisions. The other publications cited above provideadditional background for the design of earthquake-resistant reinforced concrete structures.
Most of the large-scale structural analysis for this chapter was carried out using the ETABS BuildingAnalysis Program developed by Computers and Structures, Inc., Berkeley, California. Smaller portionsof the structure were modeled using the SAP2000 Finite Element Analysis Program, also developed byComputers and Structures. Column capacity and design curves were computed using Microsoft Excel,with some verification using the PCACOL program created and developed by the Portland CementAssociation.
Although this volume of design examples is based on the 2000 Provisions, it has been annotated to reflectchanges made to the 2003 Provisions. Annotations within brackets, [ ], indicate both organizationalchanges (as a result of a reformat of all of the chapters of the 2003 Provisions) and substantive technicalchanges to the 2003 Provisions and its primary reference documents. While the general concepts of thechanges are described, the design examples and calculations have not been revised to reflect the changesto the 2003 Provisions.
The changes related to reinforced concrete in Chapter 9 of the 2003 Provisions are generally intended tomaintaining compatibility between the Provisions and the ACI 318-02. Portions of the 2000 Provisionshave been removed because they were incorporated into ACI 318-02. Other chances to Chapter 9 arerelated to precast concrete (as discussed in Chapter 7 of this volume of design examples).
Some general technical changes in the 2003 Provisions that relate to the calculations and/or design in thischapter include updated seismic hazard maps, revisions to the redundancy requirements, revisions to theminimum base shear equation, and revisions several of the system factors (R, Ω0, Cd) for dual systems.
Where they affect the design examples in this chapter, other significant changes to the 2003 Provisionsand primary reference documents are noted. However, some minor changes to the 2003 Provisions andthe reference documents may not be noted.
Note that these examples illustrate comparisons between seismic and wind loading for illustrativepurposes. Wind load calculations are based on ASCE 7-98 as referenced in the 2000 Provisions, andthere have not been any comparisons or annotations related to ASCE 7-02.
FEMA 451, NEHRP Recommended Provisions: Design Examples
6-6
6.1 DEVELOPMENT OF SEISMIC LOADS AND DESIGN REQUIREMENTS
6.1.1 Seismicity
Using Provisions Maps 7 and 8 [Figures 3.3-3 and 3.3-4] for Berkeley, California, the short period andone-second period spectral response acceleration parameters SS and S1 are 1.65 and 0.68, respectively. [The 2003 Provisions have adopted the 2002 USGS probabilistic seismic hazard maps, and the maps havebeen added to the body of the 2003 Provisions as figures in Chapter 3 (instead of the previously usedseparate map package.] For the very dense soil conditions, Site Class C is appropriate as described inProvisions Sec. 4.1.2.1 [3.5.1]. Using SS = 1.65 and Site Class C, Provisions Table 4.1.2.4a [3.3-1] lists ashort period site coefficient Fa of 1.0. For S1 > 0.5 and Site Class C, Provisions Table 4.1.2.4b [3.3-2]gives a velocity based site coefficient Fv of 1.3. Using Provisions Eq. 4.1.2.4-1 and 4.1.2.4-2 [3.3-1 and3.3-2], the maximum considered spectral response acceleration parameters for the Berkeley building are:
SMS = FaSS = 1.0 x 1.65 = 1.65SM1 = FvS1 = 1.3 x 0.68 = 0.884
The design spectral response acceleration parameters are given by Provisions Eq. 4.1.2.5-1 and 4.1.2.5-2[3.3-3 and 3.3-4]:
SDS = (2/3) SMS = (2/3) 1.65 = 1.10SD1 = (2/3) SM1 = (2/3) 0.884 = 0.589
The transition period (Ts) for the Berkeley response spectrum is:
0.589 0.535 sec1.10
D1s
DS
STS
= = =
Ts is the period where the horizontal (constant acceleration) portion of the design response spectrumintersects the descending (constant velocity or acceleration inversely proportional to T) portion of thespectrum. It is used later in this example as a parameter in determining the type of analysis that isrequired for final design.
For Honolulu, Provisions Maps 19 and 20 [Figure 3.3-10] give the short-period and 1-sec period spectralresponse acceleration parameters of 0.61 and 0.178, respectively. For the very dense soil/firm rock sitecondition, the site is classified as Site Class C. Interpolating from Provisions Table 4.1.4.2a [3.3-1], theshort-period site coefficient (Fa) is 1.16 and, from Provisions Table 4.1.2.4b [3.3-2], the interpolatedlong-period site coefficient (Fv) is 1.62. The maximum considered spectral response accelerationparameters for the Honolulu building are:
SMS = FaSS = 1.16 x 0.61 = 0.708SM1 = FvS1 = 1.62 x 0.178 = 0.288
and the design spectral response acceleration parameters are:
SDS = (2/3) SMS = (2/3) 0.708 = 0.472SD1 = (2/3) SM1 = (2/3) 0.288 = 0.192
The transition period (Ts) for the Honolulu response spectrum is:
Chapter 6, Reinforced Concrete
6-7
0.192 0.407 sec0.472
D1s
DS
STS
= = =
6.1.2 Structural Design Requirements
According to Provisions Sec. 1.3 [1.2], both the Berkeley and the Honolulu buildings are classified asSeismic Use Group I. Provisions Table 1.4 [1.3] assigns an occupancy importance factor (I) of 1.0 to allSeismic Use Group I buildings.
According to Provisions Tables 4.2.1a and 4.2.1b [Tables 1.4-1 and 1.4-2], the Berkeley building isclassified as Seismic Design Category D. The Honolulu building is classified as Seismic DesignCategory C because of the lower intensity ground motion.
The seismic-force-resisting systems for both the Berkeley and the Honolulu buildings consist of moment-resisting frames in the N-S direction. E-W loading is resisted by a dual frame-wall system in theBerkeley building and by a set of moment-resisting frames in the Honolulu building. For the Berkeleybuilding, assigned to Seismic Design Category D, Provisions Sec. 9.1.1.3 [9.2.2.1.3] (which modifieslanguage in the ACI 318 to conform to the Provisions) requires that all moment-resisting frames bedesigned and detailed as special moment frames. Similarly, Provisions Sec. 9.1.1.3 [9.2.2.1.3] requiresthe structural walls to be detailed as special reinforced concrete shear walls. For the Honolulu buildingassigned to Seismic Design Category C, Provisions Sec. 9.1.1.3 [9.2.2.1.3] allows the use of intermediatemoment frames. According to Provisions Table 5.2.2 [4.3-1], neither of these structures violate heightrestrictions.
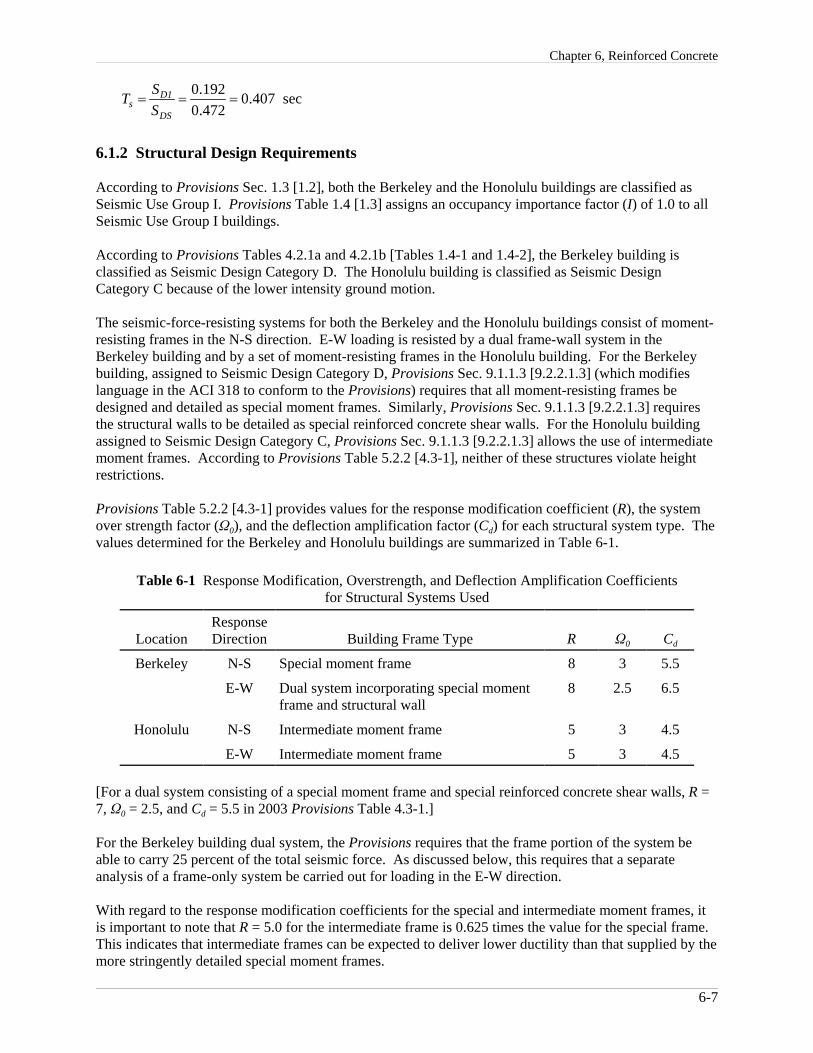
Provisions Table 5.2.2 [4.3-1] provides values for the response modification coefficient (R), the systemover strength factor (Ω0), and the deflection amplification factor (Cd) for each structural system type. Thevalues determined for the Berkeley and Honolulu buildings are summarized in Table 6-1.
Table 6-1 Response Modification, Overstrength, and Deflection Amplification Coefficientsfor Structural Systems Used
LocationResponseDirection Building Frame Type R Ω0 Cd
Berkeley N-S Special moment frame 8 3 5.5
E-W Dual system incorporating special moment frame and structural wall
8 2.5 6.5
Honolulu N-S Intermediate moment frame 5 3 4.5
E-W Intermediate moment frame 5 3 4.5
[For a dual system consisting of a special moment frame and special reinforced concrete shear walls, R =7, Ω0 = 2.5, and Cd = 5.5 in 2003 Provisions Table 4.3-1.]
For the Berkeley building dual system, the Provisions requires that the frame portion of the system beable to carry 25 percent of the total seismic force. As discussed below, this requires that a separateanalysis of a frame-only system be carried out for loading in the E-W direction.
With regard to the response modification coefficients for the special and intermediate moment frames, itis important to note that R = 5.0 for the intermediate frame is 0.625 times the value for the special frame. This indicates that intermediate frames can be expected to deliver lower ductility than that supplied by themore stringently detailed special moment frames.

FEMA 451, NEHRP Recommended Provisions: Design Examples
6-8
For the Berkeley system, the response modification coefficients are the same (R = 8) for the frame andframe-wall systems but are higher than the coefficient applicable to a special reinforced concretestructural wall system (R = 6). This provides an incentive for the engineer to opt for a frame-wall systemunder conditions where a frame acting alone may be too flexible or a wall acting alone cannot beproportioned due to excessively high overturning moments.
6.1.3 Structural Configuration
Based on the plan view of the building shown in Figure 6-1, the only possibility of a plan irregularity is atorsional irregularity (Provisions Table 5.2.3.2 [4.3-2]) of Type 1a or 1b. While the actual presence ofsuch an irregularity cannot be determined without analysis, it appears unlikely for both the Berkeley andthe Honolulu buildings because the lateral-force-resisting elements of both buildings are distributedevenly over the floor. For the purpose of this example, it is assumed (but verified later) that torsionalirregularities do not exist.
As for the vertical irregularities listed in Provisions Table 5.2.3.3 [4.3-3], the presence of a soft or weakstory cannot be determined without calculations based on an existing design. In this case, however, thefirst story is suspect, because its height of 18 ft is well in excess of the 12.5-ft height of the story above. As with the torsional irregularity, it is assumed (but verified later) that a vertical irregularity does notexist.
6.2 DETERMINATION OF SEISMIC FORCES
The determination of seismic forces requires knowledge of the magnitude and distribution of structuralmass, the short period and long period response accelerations, the dynamic properties of the system, andthe system response modification factor (R). Using Provisions Eq. 5.4.1 [5.2-1], the design base shear forthe structure is:
V = CSW
where W is the total (seismic) weight of the building and CS is the seismic response coefficient. The upperlimit on CS is given by Provisions Eq. 5.4.1.1-1 [5.2-2]:
/DS
SSCR I
=
For intermediate response periods, Eq. 5.4.1.1-2 [5.2-3] controls:
( / )D1
SSC
T R I=
However, the response coefficient must not be less than that given by Eq. 5.4.1.1-3 [changed in the 2003Provisions]:
CS = 0.044SDSI
Note that the above limit will apply when the structural period is greater than SD1/0.044RSDS. This limit is(0.589)/(0.044 x 8 x 1.1) = 1.52 sec for the Berkeley building and (0.192)/(0.044 x 5 x 0.472) = 1.85 secfor the Honolulu building. [The minimum Cs value is simply 0.01in the 2003 Provisions, which wouldnot be applicable to this example as discussed below.]

Chapter 6, Reinforced Concrete
6-9
In each of the above equations, the importance factor (I) is taken as 1.0. With the exception of the periodof vibration (T), all of the other terms in previous equations have been defined and/or computed earlier inthis chapter.
6.2.1 Approximate Period of Vibration
Requirements for the computation of building period are given in Provisions Sec. 5.4.2 [5.2.2]. For thepreliminary design using the ELF procedure, the approximate period (Ta) computed in accordance withProvisions Eq. 5.4.2.1-1 [5.2-6] could be used:
xa r nT C h=
Because this formula is based on lower bound regression analysis of measured building response inCalifornia, it will generally result in periods that are lower (hence, more conservative for use in predictingbase shear) than those computed from a more rigorous mathematical model. This is particularly true forbuildings located in regions of lower seismicity. If a more rigorous analysis is carried out (using acomputer), the resulting period may be too high due to a variety of possible modeling errors. Consequently, the Provisions places an upper limit on the period that can be used for design. The upperlimit is T = CuTa where Cu is provided in Provisions Table 5.4.2 [5.2-1].
For the N-S direction of the Berkeley building, the structure is a reinforced concrete moment-resistingframe and the approximate period is calculated according to Provisions Eq. 5.4.2.1-1 [5.2-6]. UsingProvisions Table 5.4.2.1 [5.2-2], Cr = 0.016 and x = 0.9. With hn = 155.5 ft, Ta = 1.50 sec. With SD1 >0.40 for the Berkeley building, Cu = 1.4 and the upper limit on the analytical period is T = 1.4(1.5) = 2.1sec.
For E-W seismic activity in Berkeley, the structure is a frame-wall system with Cr = 0.020 and x =0.75.Substituting the appropriate values in Provisions Eq. 5.4.2.1-1 [5.2-6], the E-W period Ta = 0.88 sec. Theupper limit on the analytical period is (1.4)0.88 = 1.23 sec.
For the Honolulu building, the Ta = 1.5 sec period computed above for concrete moment frames isapplicable in both the N-S and E-W direction. For Honolulu, SD1 is 0.192g and, from Provisions Table5.4.2 [5.2-1], Cu can be taken as 1.52. The upper limit on the analytical period is T = 1.52(1.5) = 2.28 sec.
The period to be used in the ELF analysis will be in the range of Ta to CuTa. If an accurate analysisprovides periods greater than CuTa, CuTa should be used. If the accurate analysis produces periods lessthan CuTa but greater than Ta, the period from the analysis should be used. Finally, if the accurate analysisproduces periods less than Ta, Ta may be used.
Later in this chapter, the more accurate periods will be computed using a finite element analysis program. Before this can be done, however, the building mass must be determined.
6.2.2 Building Mass
Before the building mass can be determined, the approximate size of the different members of theseismic-force-resisting system must be established. For special moment frames, limitations onbeam-column joint shear and reinforcement development length usually control. This is particularly truewhen lightweight (LW) concrete is used. An additional consideration is the amount of verticalreinforcement in the columns. ACI 318 Sec. 21.4.3.1 limits the vertical steel reinforcing ratio to 6 percentfor special moment frame columns; however, 4 percent vertical steel is a more practical limit.
FEMA 451, NEHRP Recommended Provisions: Design Examples
1ACI 318 Sec. 21.6.4 [21.7.4] gives equations for the shear strength of the panels of structural walls. In the equations, the term appears, but there is no explicit requirement to reduce the shear strength of the concrete when LW aggregate is used. cf ′
However, ACI 318 Sec. 11.2 states that wherever the term appears in association with shear strength, it should becf ′multiplied by 0.75 when all-LW concrete is used and by 0.85 when sand-LW concrete is used. In this example, which utilizessand-LW concrete, the shear strength of the concrete will be multiplied by 0.85 as specified in ACI 318 Chapter 11.
6-10
Based on a series of preliminary calculations (not shown here), it is assumed that all columns andstructural wall boundary elements are 30 in. by 30 in., girders are 22.5 in. wide by 32 in. deep, and thepanel of the structural wall is 16 in. thick. It has already been established that pan joists are spaced 36 in.o.c., have an average web thickness of 6 in., and, including a 4-in.-thick slab, are 20 in. deep. For theBerkeley building, these member sizes probably are close to the final sizes. For the Honolulu building(which has no structural wall and ultimately ends up with slightly smaller elements), the masses computedfrom the above member sizes are on the conservative (heavy) side.
In addition to the building structural weight, the following superimposed dead loads (DL) were assumed:
Partition DL (and roofing) = 10 psfCeiling and mechanical DL = 15 psfCurtain wall cladding DL = 10 psf
Based on the member sizes given above and on the other dead load, the individual story weights, masses,and mass moments of inertia are listed in Table 6-2. These masses were used for both the Berkeley andthe Honolulu buildings.
As discussed below, the mass and mass moments of inertia are required for the determination of modalproperties using the ETABS program. Note from Table 6-2 that the roof and lowest floor have massesslightly different from the typical floors. It is also interesting to note that the average density of thisbuilding is 11.2 pcf. A normal weight (NW) concrete building of the same configuration would have adensity of approximately 14.0 pcf.
The use of LW instead of NW concrete reduces the total building mass by more than 20 percent andcertainly satisfies the minimize mass rule of earthquake-resistant design. However, there are somedisadvantages to the use of LW concrete. In general, LW aggregate reinforced concrete has a lowertoughness or ductility than NW reinforced concrete and the higher the strength, the larger the reduction inavailable ductility. For this reason and also the absence of pertinent test results, ACI 318 Sec. 21.2.4.2allows a maximum compressive strength of 4,000 psi for LW concrete in areas of high seismicity. [Notethat in ACI 318-02 Sec. 21.2.4.2, the maximum compressive strength for LW concrete has been increasedto 5,000 psi.] A further penalty placed on LW concrete is the reduction of shear strength. This primarilyaffects the sizing of beam-column joints (ACI 318 Sec. 21.5.3.2) but also has an effect on the amount ofshear reinforcement required in the panels of structural walls.1 For girders, the reduction in shear strengthof LW aggregate concrete usually is of no concern because ACI 318 disallows the use of the concrete indetermining the shear resistance of members with significant earthquake shear (ACI 318 Sec. 21.4.5.2). Finally, the required tension development lengths for bars embedded in LW concrete are significantlygreater than those required for NW concrete.
Table 6-2 Story Weights, Masses, and Moments of Inertia
Story Level Weight (kips)Mass
(kips-sec2/in.)Mass Moment of Inertia
(in.-kip-sec2/rad)

Chapter 6, Reinforced Concrete
6-11
Roof12111098765432
Total
2,7833,0513,0513,0513,0513,0513,0513,0513,0513,0513,0513,169
36,462
7.2027.8967.8967.8967.8967.8767.8967.8967.8967.8967.8968.201
4,675,0005,126,0005,126,0005,126,0005,126,0005,126,0005,126,0005,126,0005,126,0005,126,0005,126,0005,324,000
1.0 kip = 4.45 kN, 1.0 in. = 25.4 mm.
6.2.3 Structural Analysis
Structural analysis is used primarily to determine the forces in the elements for design purposes, computestory drift, and assess the significance of P-delta effects. The structural analysis also provides otheruseful information (e.g., accurate periods of vibration and computational checks on plan and verticalirregularities). The computed periods of vibration are addressed in this section and the other results arepresented and discussed later.
The ETABS program was used for the analysis of both the Berkeley and Honolulu buildings. Thoseaspects of the model that should be noted are:
1. The structure was modeled with 12 levels above grade and one level below grade. The perimeterbasement walls were modeled as shear panels as were the main structural walls. It was assumed thatthe walls were "fixed" at their base.
2. As automatically provided by the ETABS program, all floor diaphragms were assumed to beinfinitely rigid in plane and infinitely flexible out-of-plane.
3. Beams, columns, and structural wall boundary members were represented by two-dimensional frameelements. Each member was assumed to be uncracked, and properties were based on gross area forthe columns and boundary elements and on effective T-beam shapes for the girders. (The effect ofcracking is considered in a simplified manner.) The width of the flanges for the T-beams is based onthe definition of T-beams in ACI 318 Sec. 8.10. Except for the slab portion of the joists whichcontributed to T-beam stiffness of the girders, the flexural stiffness of the joists was ignored. For thehaunched girders, an equivalent depth of stem was used. The equivalent depth was computed toprovide a prismatic member with a stiffness under equal end rotation identical to that of thenonprismatic haunched member. Axial, flexural, and shear deformations were included for allmembers.
4. The structural walls of the Berkeley building are modeled as a combination of boundary elements andshear panels.
5. Beam-column joints are modeled as 50 percent rigid. This provides effective stiffness forbeam-column joints halfway between a model with fully rigid joints (clear span analysis) and fullyflexible joints (centerline analysis).

FEMA 451, NEHRP Recommended Provisions: Design Examples
6-12
6. P-delta effects are ignored. An evaluation of the accuracy of this assumption is provided later in thisexample.
6.2.4 Accurate Periods from Finite Element Analysis
The computed periods of vibration and a description of the associated modes of vibration are given for thefirst 11 modes of the Berkeley building in Table 6-3. With 11 modes, the accumulated modal mass ineach direction is more than 90 percent of the total mass. Provisions Sec. 5.5.2 [5.3.2] requires that adynamic analysis must include at least 90 percent of the actual mass in each of the two orthogonaldirections. Table 6-4 provides the computed modal properties for the Honolulu building. In this case, 90percent of the total mass was developed in just eight modes.
For the Berkeley building, the computed N-S period of vibration is 1.77 sec. This is between theapproximate period, Ta = 1.5 sec, and CuTa = 2.1 sec. In the E-W direction, the computed period is 1.40sec, which is greater than both Ta = 0.88 sec and CuTa = 1.23 sec.
If cracked section properties were used, the computed period values for the Berkeley building would besomewhat greater. For preliminary design, it is reasonable to assume that each member has a crackedmoment of inertia equal to one-half of the gross uncracked moment of inertia. Based on this assumption,and the assumption that flexural behavior dominates, the cracked periods would be approximately 1.414(the square root of 2.0) times the uncracked periods. Hence, for Berkeley, the cracked N-S and E-Wperiods are 1.414(1.77) = 2.50 sec, and 1.414(1.4) = 1.98 sec, respectively. Both of these cracked periodsare greater than CuTa, so CuTa can be used in the ELF analysis.
For the Honolulu building, the uncracked periods in the N-S and E-W directions are 1.78 and 1.87 sec,respectively. The N-S period is virtually the same as for the Berkeley building because there are no wallsin the N-S direction of either building. In the E-W direction, the increase in period from 1.4 sec to 1.87sec indicates a significant reduction in stiffness due to the loss of the walls in the Honolulu building. Forboth the E-W and the N-S directions, the approximate period (Ta) for the Honolulu building is 1.5 sec,and CuTa is 2.28 sec. Both of the computed periods fall within these bounds. However, if cracked sectionproperties were used, the computed periods would be 2.52 sec in the N-S direction and 2.64 sec in theE-W direction. For the purpose of computing ELF forces, therefore, a period of 2.28 sec can be used forboth the N-S and E-W directions in Honolulu.
A summary of the approximate and computed periods is given in Table 6-5.

Chapter 6, Reinforced Concrete
6-13
Table 6-3 Periods and Modal Response Characteristics for the Berkeley Building
ModePeriod*
(sec)% of Effective Mass Represented by Mode**
DescriptionN-S E-W
1 2 3 4 5 6 7 8 91011
1.771.401.27
0.5810.3940.3650.3360.2300.2100.1710.135
80.23 (80.2)0.0 (80.2)0.0 (80.2)
8.04 (88.3)0.00 (88.3)0.00 (88.3)2.24 (90.5)0.88 (91.4)0.00 (91.4)0.40 (91.8)0.00 (91.8)
00.00 (0.00)71.48 (71.5)0.00 (71.5)0.00 (71.5)0.00 (71.5)
14.17 (85.6)0.00 (85.6)0.00 (85.6)0.00 (85.6)0.00 (85.6)4.95 (90.6)
First Mode N-SFirst Mode E-WFirst Mode TorsionSecond Mode N-SSecond Mode TorsionSecond Mode E-WThird Mode N-SFourth Mode N-SThird Mode TorsionFifth Mode N-SThird Mode E-W
* Based on gross section properties.** Accumulated mass in parentheses.
Table 6-4 Periods and Modal Response Characteristics for the Honolulu Building
ModePeriod*
(sec)% of Effective Mass Represented by Mode**
DescriptionN-S E-W
1 2 3 4 5 6 7 8 91011
1.871.781.38
0.6100.5840.4520.3450.3370.2600.2350.231
79.7 (79.7)0.00 (79.7)0.00 (79.7)8.79 (88.5)0.00 (88.5)0.00 (88.5)2.27 (90.7)0.00 (90.7)0.00 (90.7)0.89 (91.6)0.00 (91.6)
0.00 (0.00)80.25 (80.2)0.00 (80.2)0.00 (80.2)8.04 (88.3)0.00 (88.3)0.00 (88.3)2.23 (90.5)0.00 (90.5)0.00 (90.5)0.87 (91.4)
First Mode E-WFirst Mode N-SFirst Mode TorsionSecond Mode E-WSecond Mode N-SSecond Mode TorsionThird Mode E-WThird Mode N-SThird Mode TorsionFourth Mode E-WFourth Mode N-S
* Based on gross section properties.** Accumulated mass in parentheses.
Table 6-5 Comparison of Approximate and "Exact" Periods (in seconds)
Method of PeriodComputation
Berkeley Honolulu
N-S E-W N-S E-W
Approximate Ta 1.50 0.88 1.50 1.50
Approximate × Cu 2.10* 1.23 2.28 2.28
ETABS (gross) 1.77 1.40 1.78 1.87
ETABS (cracked) 2.50 1.98 2.52 2.64* Values in italics should be used in the ELF analysis.
6.2.5 Seismic Design Base Shear

FEMA 451, NEHRP Recommended Provisions: Design Examples
6-14
The seismic design base shear for the Berkeley is computed below.
In the N-S direction with W = 36,462 kips (see Table 6-2), SDS = 1.10, SD1 = 0.589, R = 8, I = 1, and T =2.10 sec:
,1.10 0.1375
/ 8 /1DS
S maxSCR I
= = =
0.589 0.0351( / ) 2.10(8/1)
D1S
SCT R I
= = =
, 0.044 0.044(1.1)(1) 0.0484S min DSC S I= = =
[As noted previously in Sec. 6.2, the minimum Cs value is 0.01 in the 2003 Provisions.]
CS,min = 0.0484 controls, and the design base shear in the N-S direction is V = 0.0484 (36,462) = 1,765kips.
In the stiffer E-W direction, CS,max and CS,min are as before, T = 1.23 sec, and
0.589 0.0598( / ) 1.23(8 /1)
D1S
SCT R I
= = =
In this case, CS = 0.0598 controls and V = 0.0598 (36,462) = 2,180 kips
For the Honolulu building, base shears are computed in a similar manner and are the same for the N-S andthe E-W directions. With W = 36,462 kips, SDS = 0.474, SD1 = 0.192, R = 5, I = 1, and T = 2.28 sec:
,0.472 0.0944
/ 5 /1DS
S maxSCR I
= = =
0.192 0.0168( / ) 2.28(5/1)
D1S
SCT R I
= = =
, 0.044 0.044(0.472)(1.0) 0.0207S min DSC S I= = =
CS = 0.0207 controls and V = 0.0207 (36,462) = 755 kips
A summary of the Berkeley and Honolulu seismic design parameters are provided in Table 6-6.
Note that Provisions Sec. 5.4.6 [5.2.6.1] states that for the purpose of computing drift, a base shearcomputed according to Provisions Eq. 5.4.1.1-2 [5.2-3] (used to compute CS above) may be used in lieuof the shear computed using Provisions Eq. 5.4.1.1-3 [5.2-4] (used to compute CS,min above).
Table 6-6 Comparison of Periods, Seismic Shears Coefficients, and Base Shears for the Berkeley and Honolulu Buildings
LocationResponseDirection Building Frame Type
T (sec) Cs
V(kips)

Chapter 6, Reinforced Concrete
6-15
Berkeley N-S Special moment frame 2.10 0.0485 1,765
E-W Dual system incorporating special moment frame and structural wall
1.23 0.0598 2,180
Honolulu N-S Intermediate moment frame 2.28 0.0207 755
E-W Intermediate moment frame 2.28 0.0207 7551.0 kip = 4.45 kN.
6.2.6 Development of Equivalent Lateral Forces
The vertical distribution of lateral forces is computed from Provisions Eq. 5.4.3-1 and 5.4.3-2 [5.2-10 and5.2-11]:
Fx = CvxV
kx x
vx nk
i ii = 1
w hC = w h∑
where
k = 1.0 for T < 0.5 seck = 2.0 for T > 2.5 seck = 0.75 + 0.5T for 1.0 < T < 2.5 sec
Based on the equations above, the seismic story forces, shears, and overturning moments are easilycomputed using an Excel spreadsheet. The results of these computations are shown in Tables 6-7a and6-7b for the Berkeley buildings and in Table 6-8 for the Honolulu building. A note at the bottom of eachtable gives the calculated vertical force distribution factor (k). The tables are presented with as manysignificant digits to the left of the decimal as the spreadsheet generates but that should not be interpretedas real accuracy; it is just the simplest approach. Also, some of the sums are not exact due to truncationerror.

FEMA 451, NEHRP Recommended Provisions: Design Examples
6-16
Table 6-7a Vertical Distribution of N-S Seismic Forces for the Berkeley Building*
LevelHeight h
(ft)Weight W
(kips) Whk Whk/ΣForce Fx
(kips)Story
Shear Vx(kips)
OverturningMomentMx (ft-k)
R121110 9 8 7 6 5 4 3 2
Total
155.5143.0130.5118.0105.5 93.0 80.5 68.0 55.5 43.0 30.5 18.0
2,783 3,051 3,051 3,051 3,051 3,051 3,051 3,051 3,051 3,051 3,051 3,16936,462
24,526,067 23,123,154 19,612,869 16,361,753 13,375,088 10,658,879 8,220,056 6,066,780 4,208,909 2,658,799 1,432,788 575,987130,821,129
0.1870.1770.1500.1250.1020.0810.0630.0460.0320.0200.0110.0040.998
330.9 311.9 264.6 220.7 180.4 143.8 110.9 81.8 56.8 35.9 19.3 7.81764.8
330.9 642.8 907.41,128.11,308.51,452.31,563.21,645.01,701.81,737.71,757.01,764.8
4,136 12,170 23,512 37,613 53,970 72,123 91,663112,226133,498155,219177,181208,947
* Table based on T = 2.1 sec and k = 1.8.1.0 ft = 0.3048 m, 1.0 kip = 4.45 kN, 1.0 ft-kip = 1.36 kN-m.
Table 6-7b Vertical Distribution of E-W Seismic Forces for the Berkeley Building*
LevelHeight h
(ft)Weight W
(kips) Whk Whk/ΣForce Fx
(kips)Story
Shear Vx(kips)
OverturningMomentMx (ft-k)
R121110 9 8 7 6 5 4 3 2
Total
155.5143.0130.5118.0105.5 93.0 80.5 68.0 55.5 43.0 30.5 18.0
2,783 3,051 3,051 3,051 3,051 3,051 3,051 3,051 3,051 3,051 3,051 3,16936,462
2,730,393 2,669,783 2,356,408 2,053,814 1,762,714 1,483,957 1,218,579 967,870 733,503 517,758 323,975 163,82116,982,575
0.1610.1570.1390.1210.1040.0870.0720.0570.0430.0300.0190.0101.000
350.6 342.8 302.5 263.7 226.3 190.5 156.5 124.3 94.2 66.5 41.6 21.02180.5
351 693 9961,2601,4861,6761,8331,9572,0512,1182,1592,180
4,382 13,049 25,497 41,242 59,816 80,771103,682128,146153,788180,260207,253246,500
* Table based on T = 1.23 sec and k = 1.365.1.0 ft = 0.3048 m, 1.0 kip = 4.45 kN, 1.0 ft-kip = 1.36 kN-m.

Chapter 6, Reinforced Concrete
6-17
Table 6-8 Vertical Distribution of N-S and E-W Seismic Forces for the Honolulu Building*
LevelHeight h
(ft)Weight W
(kips) Whk Whk/ΣForce Fx
(kips)Story
Shear Vx(kips)
OverturningMomentMx (ft-k)
R121110 9 8 7 6 5 4 3 2
Total
155.5143.0130.5118.0105.5 93.0 80.5 68.0 55.5 43.0 30.5 18.0
2,783 3,051 3,051 3,051 3,051 3,051 3,051 3,051 3,051 3,051 3,051 3,16936,462
38,626,348 36,143,260 30,405,075 25,136,176 20,341,799 16,027,839 12,210,028 8,869,192 6,041,655 3,729,903 1,948,807 747,115200,218,197
0.1930.1810.1520.1260.1020.0800.0610.0440.0300.0190.0100.0041.002
145.6136.2114.6 94.8 76.7 60.4 46.0 33.4 22.8 14.1 7.3 2.8754.7
145.6281.9396.5491.2567.9628.3674.3707.8730.5744.6751.9754.8
1,820 5,34310,29916,44023,53931,39339,82248,66957,80167,10876,50890,093
* Table based on T = 2.28 sec and k = 1.89.1.0 ft = 0.3048 m, 1.0 kip = 4.45 kN, 1.0 ft-kip = 1.36 kN-m
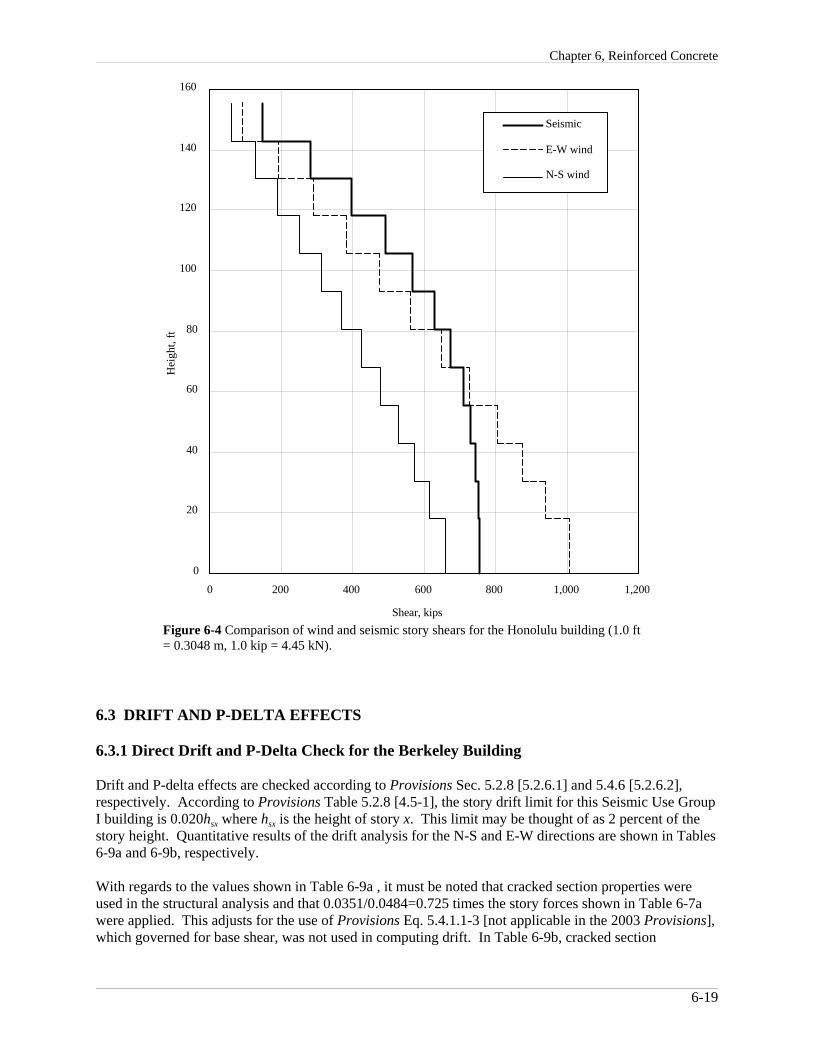
The computed seismic story shears for the Berkeley and Honolulu buildings are shown graphically inFigures 6-3 and 6-4, respectively. Also shown in the figures are the story shears produced by ASCE 7wind loads. For Berkeley, a 3-sec gust of 85 mph was used and, for Honolulu, a 3-sec gust of 105 mph. In each case, an Exposure B classification was assumed. The wind shears have been factored by a valueof 1.36 (load factor of 1.6 times directionality factor 0.85) to bring them up to the ultimate seismicloading limit state represented by the Provisions.
As can be seen from the figures, the seismic shears for the Berkeley building are well in excess of thewind shears and will easily control the design of the members of the frames and walls. For the Honolulubuilding, the N-S seismic shears are significantly greater than the corresponding wind shears, but the E-Wseismic and wind shears are closer. In the lower stories of the building, wind controls the strengthdemands and, in the upper levels, seismic forces control the strength demands. (A somewhat moredetailed comparison is given later when the Honolulu building is designed.) With regards to detailing theHonolulu building, all of the elements must be detailed for inelastic deformation capacity as required byACI 318 rules for intermediate moment frames.

FEMA 451, NEHRP Recommended Provisions: Design Examples
6-18
0
20
40
60
80
100
120
140
160
0 500 1,000 1,500 2,000 2,500
Shear, kips
Hei
ght,
ft
E-W seismicN-S seismic
E-W wind
N-S wind
Figure 6-3 Comparison of wind and seismic story shears for the Berkeley building (1.0ft = 0.3048 m, 1.0 kip = 4.45 kN).
Chapter 6, Reinforced Concrete
6-19
0
20
40
60
80
100
120
140
160
0 200 400 600 800 1,000 1,200
Shear, kips
Hei
ght,
ft
Seismic
E-W wind
N-S wind
Figure 6-4 Comparison of wind and seismic story shears for the Honolulu building (1.0 ft= 0.3048 m, 1.0 kip = 4.45 kN).
6.3 DRIFT AND P-DELTA EFFECTS
6.3.1 Direct Drift and P-Delta Check for the Berkeley Building
Drift and P-delta effects are checked according to Provisions Sec. 5.2.8 [5.2.6.1] and 5.4.6 [5.2.6.2],respectively. According to Provisions Table 5.2.8 [4.5-1], the story drift limit for this Seismic Use GroupI building is 0.020hsx where hsx is the height of story x. This limit may be thought of as 2 percent of thestory height. Quantitative results of the drift analysis for the N-S and E-W directions are shown in Tables6-9a and 6-9b, respectively.
With regards to the values shown in Table 6-9a , it must be noted that cracked section properties wereused in the structural analysis and that 0.0351/0.0484=0.725 times the story forces shown in Table 6-7awere applied. This adjusts for the use of Provisions Eq. 5.4.1.1-3 [not applicable in the 2003 Provisions],which governed for base shear, was not used in computing drift. In Table 6-9b, cracked section

FEMA 451, NEHRP Recommended Provisions: Design Examples
6-20
0
20
40
60
80
100
120
140
160
0.0 5.0 10.0 15.0 20.0 25.0 30.0 35.0 40.0Total drift, in.
Hei
ght,
ft
E-W*6.5 x E-WN-S*5.5 x N-S2% limit
* Elasticlly computed under code-prescribed seismic forces
Figure 6-5 Drift profile for Berkeley building (1.0 ft =0.3048 m, 1.0 in. = 25.4 mm).
properties were also used, but the modifying factor does not apply because Provisions Eq. 5.4.1.1-2 [5.2-3] controlled in this direction.
In neither case does the computed drift ratio (magnified story drift/hsx) exceed 2 percent of the storyheight. Therefore, the story drift requirement is satisfied. A plot of the total drift resulting from both theN-S and E-W equivalent lateral seismic forces is shown in Figure 6-5.
An example calculation for drift in Story 5 loaded in the E-W direction is given below. Note that therelevant row is highlighted in Table 6-9b.
Deflection at top of story = δ5e = 1.812 in.Deflection at bottom of story = δ4e = 1.410 in.Story drift = ∆5e = δ5e - δ4e = 1.812 - 1.410 = 0.402 in.Deflection amplification factor, Cd = 6.5Importance factor, I = 1.0Magnified story drift = ∆5 = Cd ∆5e/I = 6.5(0.402)/1.0 = 2.613 in.Magnified drift ratio = ∆5/h5 = (2.613/150) = 0.01742 = 1.742% < 2.0% OK

Chapter 6, Reinforced Concrete
6-21
Table 6-9a Drift Computations for the Berkeley Building Loaded in the N-S Direction
StoryTotal Deflection
(in.)Story Drift
(in.)Story Drift × Cd *
(in.)Drift Ratio
(%)
121110987654321
3.6403.5333.4083.2052.9732.6972.3932.0591.7111.3630.9990.618
0.0870.1450.2030.2320.2760.3050.3340.3480.3480.3640.3810.618
0.4780.7981.1171.2761.5151.6751.8341.9141.9142.0022.0973.397
0.3190.5320.7440.8511.0101.1171.2231.2761.2761.3341.3981.573
* Cd = 5.5 for loading in this direction; total drift is at top of story, story height = 150 in. for Levels 3through roof and 216 in. for Level 2.1.0 in. = 25.4 mm.
Table 6-9b Drift Computations for the Berkeley Building Loaded in the E-W Direction
StoryTotal Drift
(in.)Story Drift
(in.)Story Drift × Cd
*
(in.)Drift Ratio
(%)
121110987654321
4.3604.0603.7203.3803.0202.6202.2201.8121.4101.0240.6700.362
0.3000.3400.3400.3600.4000.4000.4080.4020.3860.3540.3080.362
1.9502.2102.2102.3402.6002.6002.6522.6132.5092.3012.0022.353
1.3001.4731.4731.5601.7331.7331.7681.7421.6731.5341.3351.089
* Cd = 6.5 for loading in this direction; total drift is at top of story, story height = 150 in. for Levels 3through roof and 216 in. for Level 2.1.0 in. = 25.4 mm.
When a soft story exists in a Seismic Design Category D building, Provisions Table 5.2.5.1 [4.4-1]requires that a modal analysis be used. However, Provisions Sec. 5.2.3.3 [4.3.2.3] lists an exception:
Structural irregularities of Types 1a, 1b, or 2 in Table 5.2.3.3 [4.3-2] do not apply where no story drift ratiounder design lateral load is less than or equal to 130 percent of the story drift ratio of the next story above. .. . The story drift ratios of the top two stories of the structure are not required to be evaluated.

FEMA 451, NEHRP Recommended Provisions: Design Examples
6-22
For the building responding in the N-S direction, the ratio of first story to second story drift ratios is1.573/1.398 = 1.13, which is less than 1.3. For E-W response, the ratio is 1.089/1.335 = 0.82, which alsois less than 1.3. Therefore, a modal analysis is not required and the equivalent static forces from Tables6-7a and 6-7b may be used for design.
The P-delta analysis for each direction of loading is shown in Tables 6-10a and 6-10b. The upper limit onthe allowable story stability ratio is given by Provisions Eq. 5.4.6.2-2 [changed in the 2003 Provisions]as:
0.5 0.50maxdC
θβ
= ≤
Taking β as 1.0 (see Provisions Sec. 5.4.6.2 [not applicable in the 2003 Provisions]), the stability ratiolimit for the N-S direction is 0.5/(1.0)5.5 = 0.091, and for the E-W direction the limit is 0.5/(1.0)6.5 =0.077.
[In the 2003 Provisions, the maximum limit on the stability coefficient has been replaced by arequirement that the stability coefficient is permitted to exceed 0.10 if and only “if the resistance to lateralforces is determined to increase in a monotonic nonlinear static (pushover) analysis to the targetdisplacement as determined in Sec. A5.2.3. P-delta effects shall be included in the analysis.” Therefore,in this example, the stability coefficient should be evaluated directly using 2003 Provisions Eq. 5.2.-16.]
For this P-delta analysis a (reduced) story live load of 20 psf was included in the total story weightcalculations. Deflections are based on cracked sections, and story shears are adjusted as necessary for useof Provisions Eq. 5.4.1.1-3 [5.2-3]. As can be seen in the last column of each table, the stability ratio (θ)does not exceed the maximum allowable value computed above. Moreover, since the values are less than0.10 at all levels, P-delta effects can be neglected for both drift and strength computed limits according toProvisions Sec. 5.4.6.2 [5.2.6.2].
An example P-delta calculation for the Level 5 under E-W loading is shown below. Note that the relevantrow is highlighted in Table 6-10b.
Magnified story drift = ∆5 = 2.613 in.Story shear = V5 = 1,957 kipsAccumulated story weight P5 = 27,500 kipsStory height = hs5= 150 in.Cd = 6.5θ = (P5 (∆5/Cd)) /(V5hs5) = 27,500(2.613/6.5)/(1957.1)(150) = 0.0377 < 0.077 OK
[Note that the equation to determine the stability coefficient has been changed in the 2003 Provisions. The importance factor, I, has been added to 2003 Provisions Eq. 5.2-16. However, this does not affectthis example because I = 1.0.]

Chapter 6, Reinforced Concrete
6-23
Table 6-10a P-Delta Computations for the Berkeley Building Loaded in the N-S Direction
LevelStory Drift
(in.) Story Shear *
(kips)
Story DeadLoad(kips)
Story LiveLoad(kips)
Total StoryLoad(kips)
Accum. StoryLoad(kips)
StabilityRatioθ
121110987654321
0.4780.7981.1171.2761.5151.6751.8341.9141.9142.0022.0973.397
239.9466.0657.8817.9948.7
1052.91133.31192.61233.81259.81273.81279.5
278330513051305130513051305130513051305130513169
420420420420420420420420420420420420
320334713471347134713471347134713471347134713589
32036674
10145136161708720558240292750030971344423791341502
0.00770.01380.02090.02570.03310.03960.04710.05350.05820.06630.07570.0928
* Story shears in Table 6-7a factored by 0.725. See Sec. 6.3.1.1.0 in. = 25.4 mm, 1.0 kip = 4.45 kN.
Table 6-10b P-Delta Computations for the Berkeley Building Loaded in the E-W Direction
LevelStory Drift
(in.) Story Shear
(kips)
Story DeadLoad(kips)
Story LiveLoad(kips)
Total StoryLoad(kips)
Accum. StoryLoad(kips)
StabilityRatioθ
121110987654321
1.9502.2102.2102.3402.6002.6002.6522.6132.5092.3012.0022.353
350.6693.3995.9
1259.61485.91676.41832.91957.12051.32117.82159.42180.4
278330513051305130513051305130513051305130513169
420420420420420420420420420420420420
320334713471347134713471347134713471347134713589
32036674
10145136161708720558240292750030971344423791341502
0.01830.02180.02310.02590.03070.03270.03570.03770.03890.03840.03610.0319
1.0 in. = 25.4 mm, 1.0 kip = 4.45 kN.
6.3.2 Test for Torsional Irregularity for Berkeley Building
In Sec. 6.1.3 it was mentioned that torsional irregularities are unlikely for the Berkeley building becausethe elements of the seismic-force-resisting system were well distributed over the floor area. This will nowbe verified by applying the story forces of Table 6-3a at an eccentricity equal to 5 percent of the buildingdimension perpendicular to the direction of force (accidental torsion requirement of Provisions Sec.5.4.4.2 [5.2.4.2]). This test is required per Provisions Sec. 5.2.3.2 [4.3.2.2]. Analysis was performedusing the ETABS program.
FEMA 451, NEHRP Recommended Provisions: Design Examples
6-24
The eccentricity is 0.05(102.5) = 5.125 ft for forces in the N-S direction and 0.05(216) = 10.8 ft in the E-W direction.
For forces acting in the N-S direction:
Total displacement at center of mass = δavg = 3.640 in. (see Table 6-9a)Rotation at center of mass = 0.000189 radiansMaximum displacement at corner of floor plate = dmax = 3.640 + 0.000189(102.5)(12)/2 = 3.756 in.Ratio δmax/δavg = 3.756/3.640 = 1.03 < 1.20, so no torsional irregularity exists.
For forces acting in the E-W direction:
Total displacement at center of mass = δavg = 4.360 in. (see Table 6-9b)Rotation at center of mass = 0.000648 radiansMaximum displacement at corner of floor plate = dmax = 4.360 + 0.000648(216)(12)/2 = 5.200 in.Ratio dmax/davg = 5.200/4.360 = 1.19 < 1.20, so no torsional irregularity exists.
It is interesting that this building, when loaded in the E-W direction, is very close to being torsionallyirregular (irregularity Type 1a of Provisions Table 5.2.3.2 [4.3-2]), even though the building is extremelyregular in plan. The torsional flexibility of the building arises from the fact that the walls exist only oninterior Gridlines 3, 4, 5, and 6.
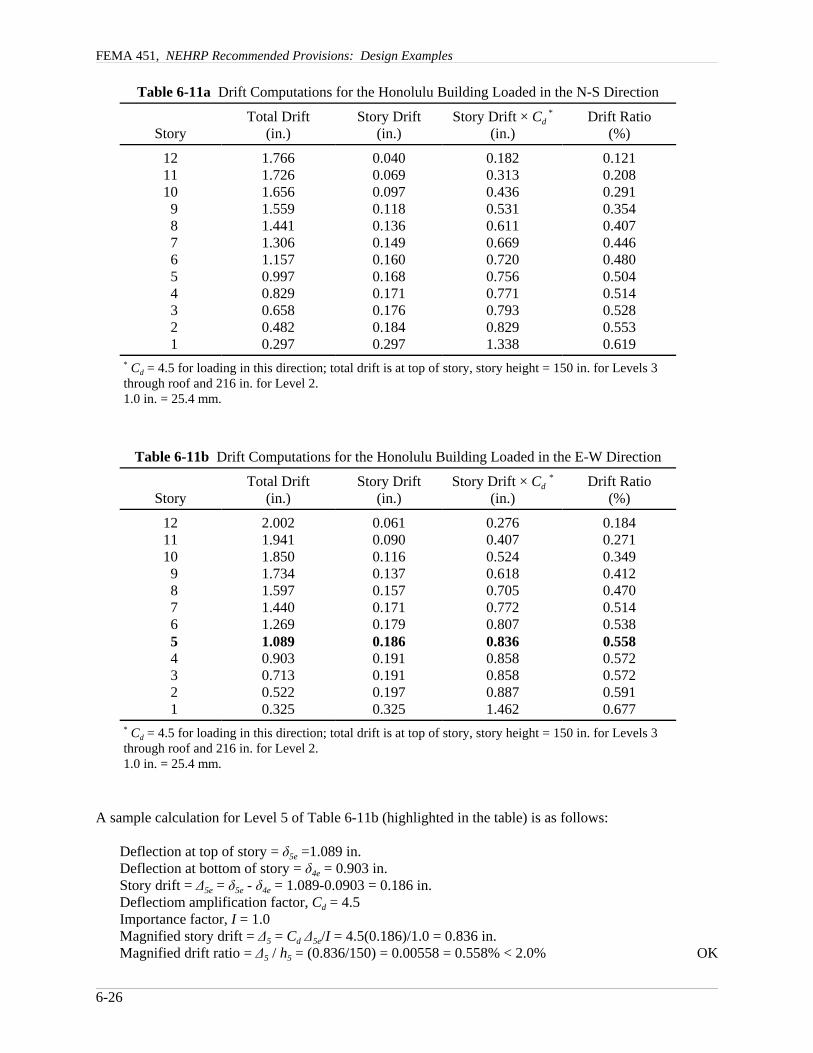
6.3.3 Direct Drift and P-Delta Check for the Honolulu Building
The interstory drift computations for the Honolulu building deforming under the N-S and E-W equivalentstatic forces are shown in Tables 6-11a and 6-11b. As with the Berkeley building, the analysis usedcracked section properties. The applied seismic forces, shown previously in Table 6-3b were multipliedby the ratio 0.0168/0.0207 = 0.808 to adjust for the use of Provisions Eq. 5.4.1.1-3. [As noted previouslyin Sec. 6.2, the minimum Cs value has been removed in the 2003 Provisions.]
These tables, as well as Figure 6-6, show that the story drift at each level is less than the allowableinterstory drift of 0.020hsx (Provisions Table 5.2.8 [4.5-1]). Even though it is not pertinent for SeismicDesign Category C buildings, a soft first story does not exist for the Honolulu building because the ratioof first story to second story drift does not exceed 1.3.

Chapter 6, Reinforced Concrete
6-25
E-W*6.5 x E-WN-S*5.5 x N-S2% limit
0
20
40
60
80
100
120
140
160
0.0 5.0 10.0 15.0 20.0 25.0 30.0 35.0 40.0Total drift, in.
Hei
ght,
ft
* Elasticlly computed under code-prescribed seismic forces
Figure 6-6 Drift profile for the Honolulu building (1.0 ft = 0.3048 m,1.0 in. = 25.4 mm).
FEMA 451, NEHRP Recommended Provisions: Design Examples
6-26
Table 6-11a Drift Computations for the Honolulu Building Loaded in the N-S Direction
StoryTotal Drift
(in.)Story Drift
(in.)Story Drift × Cd
*
(in.)Drift Ratio
(%)
121110 9 8 7 6 5 4 3 2 1
1.7661.7261.6561.5591.4411.3061.1570.9970.8290.6580.4820.297
0.0400.0690.0970.1180.1360.1490.1600.1680.1710.1760.1840.297
0.1820.3130.4360.5310.6110.6690.7200.7560.7710.7930.8291.338
0.1210.2080.2910.3540.4070.4460.4800.5040.5140.5280.5530.619
* Cd = 4.5 for loading in this direction; total drift is at top of story, story height = 150 in. for Levels 3through roof and 216 in. for Level 2.1.0 in. = 25.4 mm.
Table 6-11b Drift Computations for the Honolulu Building Loaded in the E-W Direction
StoryTotal Drift
(in.)Story Drift
(in.)Story Drift × Cd *
(in.)Drift Ratio
(%)
121110 9 8 7 6 5 4 3 2 1
2.0021.9411.8501.7341.5971.4401.2691.0890.9030.7130.5220.325
0.0610.0900.1160.1370.1570.1710.1790.1860.1910.1910.1970.325
0.2760.4070.5240.6180.7050.7720.8070.8360.8580.8580.8871.462
0.1840.2710.3490.4120.4700.5140.5380.5580.5720.5720.5910.677
* Cd = 4.5 for loading in this direction; total drift is at top of story, story height = 150 in. for Levels 3through roof and 216 in. for Level 2.1.0 in. = 25.4 mm.
A sample calculation for Level 5 of Table 6-11b (highlighted in the table) is as follows:
Deflection at top of story = δ5e =1.089 in.Deflection at bottom of story = δ4e = 0.903 in.Story drift = ∆5e = δ5e - δ4e = 1.089-0.0903 = 0.186 in.Deflectiom amplification factor, Cd = 4.5Importance factor, I = 1.0Magnified story drift = ∆5 = Cd ∆5e/I = 4.5(0.186)/1.0 = 0.836 in.Magnified drift ratio = ∆5 / h5 = (0.836/150) = 0.00558 = 0.558% < 2.0% OK

Chapter 6, Reinforced Concrete
6-27
Therefore, story drift satisfies the drift requirements.
Calculations for P-delta effects are shown in Tables 6-12a and 6-12b for N-S and E-W loading,respectively. The stability ratio at the 5th story from Table 6-12b is computed:
Magnified story drift = ∆5 = 0.836 in.Story shear = V5 = 571.9 = kipsAccumulated story weight P5 = 27500 kipsStory height = hs5 = 150 in.Cd = 4.5θ = [P5 (∆5/Cd)]/(V5hs5) = 27500(0.836/4.5)/(571.9)(150) = 0.0596
[Note that the equation to determine the stability coefficient has been changed in the 2003 Provisions. The importance factor, I, has been added to 2003 Provisions Eq. 5.2-16. However, this does not affectthis example because I = 1.0.]
The requirements for maximum stability ratio (0.5/Cd = 0.5/4.5 = 0.111) are satisfied. Because thestability ratio is less than 0.10 at all floors, P-delta effects need not be considered (Provisions Sec. 5.4.6.2[5.2.6.2]). (The value of 0.1023 in the first story for the E-W direction is considered by the author to beclose enough to the criterion.)
Table 6-12a P-Delta Computations for the Honolulu Building Loaded in the N-S Direction
LevelStory Drift
(in.) Story Shear *
(kips)
Story DeadLoad(kips)
Story LiveLoad(kips)
Total StoryLoad(kips)
Accum. StoryLoad(kips)
StabilityRatioθ
121110 9 8 7 6 5 4 3 2 1
0.1820.3130.4360.5310.6110.6690.7200.7560.7710.7930.8291.338
117.7227.7320.4396.9458.9507.7544.9571.9590.3601.6607.6609.8
278330513051305130513051305130513051305130513169
420420420420420420420420420420420420
320334713471347134713471347134713471347134713589
3203 667410145136161708720558240292750030971344423791341502
0.00730.01360.02050.02700.03370.04010.04700.05390.05990.06720.07660.0937
* Story shears in Table 6-8 factored by 0.808. See Sec. 6.3.3.1.0 in. = 25.4 mm, 1.0 kip = 4.45 kN.

FEMA 451, NEHRP Recommended Provisions: Design Examples
6-28
Table 6-12b P-Delta Computations for the Honolulu Building Loaded in the E-W Direction
LevelStory Drift
(in.) Story Shear *
(kips)
Story DeadLoad(kips)
Story LiveLoad(kips)
Total StoryLoad(kips)
Accum. StoryLoad(kips)
StabilityRatioθ
121110 9 8 7 6 5 4 3 2 1
0.2760.4070.5240.6180.7050.7720.8070.8360.8580.8580.8871.462
117.7227.7320.4396.9458.9507.7544.9571.9590.3601.6607.6609.8
278330513051305130513051305130513051305130513169
420420420420420420420420420420420420
320334713471347134713471347134713471347134713589
3203 667410145136161708720558240292750030971344423791341502
0.01110.01770.02460.03140.03890.04630.05270.05960.06670.07280.08200.1023
* Story shears in Table 6-8 factored by 0.808. See Sec. 6.3.3.1.0 in. = 25.4 mm, 1.0 kip = 4.45 kN.
6.3.4 Test for Torsional Irregularity for the Honolulu Building
A test for torsional irregularity for the Honolulu building can be performed in a manner similar to that forthe Berkeley building. However, it is clear that a torsional irregularity will not occur for the Honolulubuilding if the Berkeley building is not irregular. This will be the case because the walls, which draw thetorsional resistance towards the center of the Berkeley building, do not exist in the Honolulu building.
6.4 STRUCTURAL DESIGN OF THE BERKELEY BUILDING
6.4.1 Material Properties
For the Berkeley building, sand-LW aggregate concrete of 4,000 psi strength is used everywhere exceptfor the lower two stories of the structural walls where 6,000 psi NW concrete is used. All reinforcementhas a specified yield strength of 60 ksi, except for the panel of the structural walls which contains 40 ksireinforcement. This reinforcement must conform to ASTM A706. According to ACI 318 Sec. 21.2.5,however, ASTM A615 reinforcement may be used if the actual yield strength of the steel does not exceedthe specified strength by more than 18 ksi and the ratio of actual ultimate tensile stress to actual tensileyield stress is greater than 1.25.
6.4.2 Combination of Load Effects
Using the ETABS program, the structure was analyzed for the equivalent lateral loads shown in Tables6-7a and 6-7b. For strength analysis, the loads were applied at a 5 percent eccentricity as required foraccidental torsion by Provisions Sec. 5.4.4.2 [5.2.4.2]. Where applicable, orthogonal loading effects wereincluded per Provisions Sec. 5.2.5.2.3 [4.4.2.3]. The torsional magnification factor (Ax) given byProvisions Eq. 5.4.4.3-1 [5.2-13] was not used because the building has no significant plan irregularities.
Provisions Sec. 5.2.7 [4.2.2.1] and Eq. 5.2.7-1 and 5.2.7-2 [4.2-1 and 4.2-2] require combination of loadeffects be developed on the basis of ASCE 7, except that the earthquake load effect, E, be defined as:
Chapter 6, Reinforced Concrete
6-29
0.2E DSE Q S Dρ= +
when gravity and seismic load effects are additive and
0.2E DSE Q S Dρ= −
when the effects of seismic load counteract gravity.
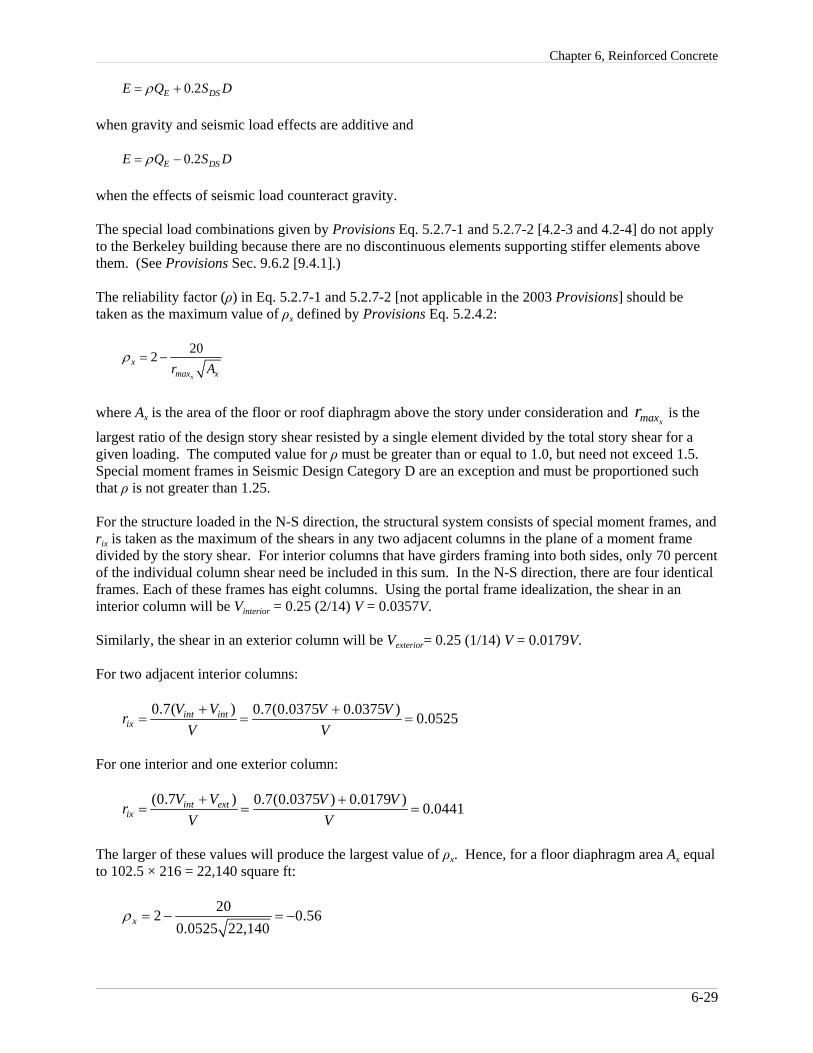
The special load combinations given by Provisions Eq. 5.2.7-1 and 5.2.7-2 [4.2-3 and 4.2-4] do not applyto the Berkeley building because there are no discontinuous elements supporting stiffer elements abovethem. (See Provisions Sec. 9.6.2 [9.4.1].)
The reliability factor (ρ) in Eq. 5.2.7-1 and 5.2.7-2 [not applicable in the 2003 Provisions] should betaken as the maximum value of ρx defined by Provisions Eq. 5.2.4.2:
202x
xmax xr A
ρ = −
where Ax is the area of the floor or roof diaphragm above the story under consideration and is thexmaxr
largest ratio of the design story shear resisted by a single element divided by the total story shear for agiven loading. The computed value for ρ must be greater than or equal to 1.0, but need not exceed 1.5. Special moment frames in Seismic Design Category D are an exception and must be proportioned suchthat ρ is not greater than 1.25.
For the structure loaded in the N-S direction, the structural system consists of special moment frames, and rix is taken as the maximum of the shears in any two adjacent columns in the plane of a moment framedivided by the story shear. For interior columns that have girders framing into both sides, only 70 percentof the individual column shear need be included in this sum. In the N-S direction, there are four identicalframes. Each of these frames has eight columns. Using the portal frame idealization, the shear in aninterior column will be Vinterior = 0.25 (2/14) V = 0.0357V.
Similarly, the shear in an exterior column will be Vexterior= 0.25 (1/14) V = 0.0179V.
For two adjacent interior columns:
0.7( ) 0.7(0.0375 0.0375 ) 0.0525int intix
V V V VrV V+ +
= = =
For one interior and one exterior column:
(0.7 ) 0.7(0.0375 ) 0.0179 ) 0.0441int extix
V V V VrV V+ +
= = =
The larger of these values will produce the largest value of ρx. Hence, for a floor diaphragm area Ax equalto 102.5 × 216 = 22,140 square ft:
202 0.560.0525 22,140xρ = − = −

FEMA 451, NEHRP Recommended Provisions: Design Examples
6-30
As this value is less than 1.0, ρ will be taken as 1.0 in the N-S direction.
For seismic forces acting in the E-W direction, the walls carry significant shear, and for the purposes ofcomputing ρ, it will be assumed that they take all the shear. According to the Provisions, rix for walls istaken as the shear in the wall multiplied by 10/lw and divided by the story shear. The term lw representsthe plan length of the wall in feet. Thus, for one wall:
0.25 (10 / 20) 0.125xmax ix
Vr rV
= = =
Only 80 percent of the ρ value based on the above computations need be used because the walls are partof a dual system. Hence, in the E-W direction
200.8 2 0.7400.125 22,140xρ
⎛ ⎞= − =⎜ ⎟⎜ ⎟
⎝ ⎠
and as with the N-S direction, ρ may be taken as 1.0. Note that ρ need not be computed for the columnsof the frames in the dual system, as this will clearly not control.
[The redundancy requirements have been substantially changed in the 2003 Provisions. For a buildingassigned to Seismic Design Category D, ρ = 1.0 as long as it can be shown that failure beam-to-columnconnections at both ends of a single beam (moment frame system) or failure of a single shear wall withaspect ratio greater than 1.0 (shear wall system) would not result in more than a 33 percent reduction instory strength or create an extreme torsional irregularity. Alternatively, if the structure is regular in planand there are at least 2 bays of perimeter framing on each side of the structure in each orthogonaldirection, it is permitted to use, ρ = 1.0. Per 2003 Provisions Sec. 4.3.1.4.3 special moment frames inSeismic Design Category D must be configured such that the structure satisfies the criteria for ρ = 1.0. There are no reductions in the redundancy factor for dual systems. Based on the preliminary design, ρ =1.0 for because the structure has a perimeter moment frame and is regular.]
For the Berkeley structure, the basic ASCE 7 load combinations that must be considered are:
1.2D + 1.6L1.2D + 0.5L ± 1.0E0.9D ± 1.0E
The ASCE 7 load combination including only 1.4 times dead load will not control for any condition inthis building.
Substituting E from the Provisions, with ρ taken as 1.0, the following load combinations must be used forearthquake:
(1.2 + 0.2SDS)D + 0.5L + E(1.2 + 0.2SDS)D + 0.5L - E(0.9 - 0.2 SDS)D + E(0.9 - 0.2SDS)D - E
Finally, substituting 1.10 for SDS, the following load combinations must be used for earthquake:
1.42D + 0.5L + E1.42D + 0.5L - E
Chapter 6, Reinforced Concrete
2The analysis used to create Figures 6-7 and 6-8 did not include the 5 percent torsional eccentricity or the 30 percent orthogonalloading rules specified by the Provisions. The eccentricity and orthogonal load were included in the analysis carried out formember design.
6-31
0.68D + E0.68D - E
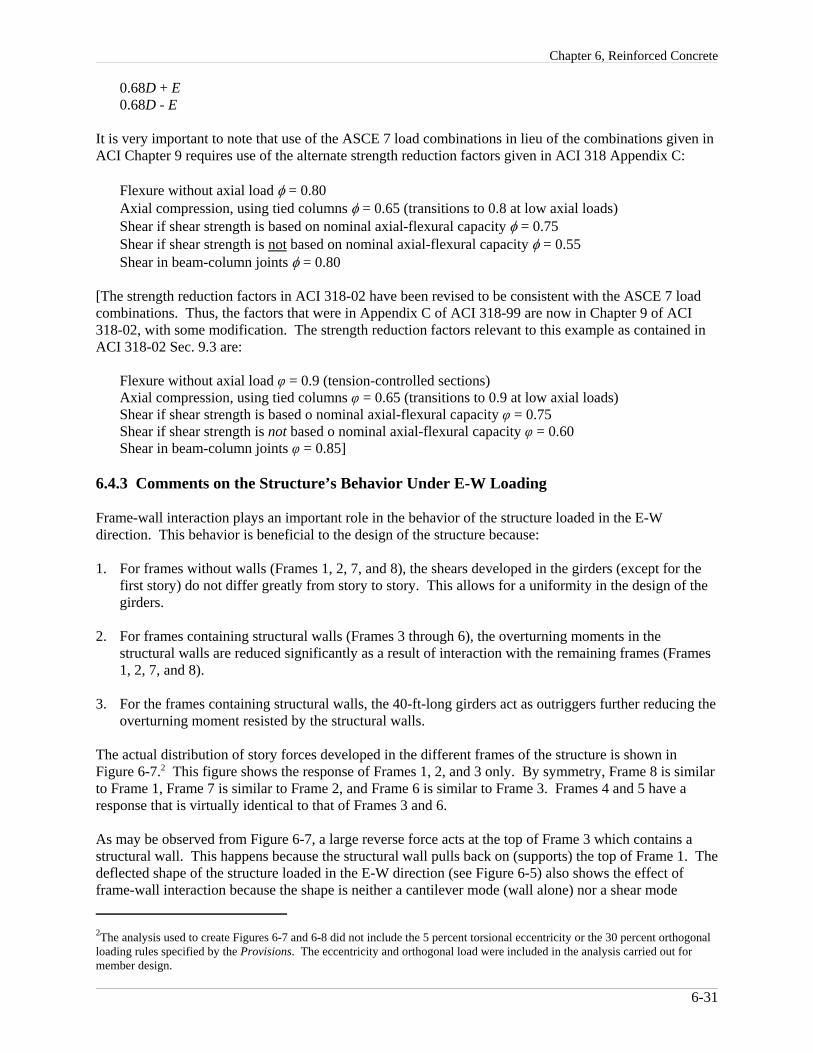
It is very important to note that use of the ASCE 7 load combinations in lieu of the combinations given inACI Chapter 9 requires use of the alternate strength reduction factors given in ACI 318 Appendix C:
Flexure without axial load φ = 0.80Axial compression, using tied columns φ = 0.65 (transitions to 0.8 at low axial loads)Shear if shear strength is based on nominal axial-flexural capacity φ = 0.75Shear if shear strength is not based on nominal axial-flexural capacity φ = 0.55Shear in beam-column joints φ = 0.80
[The strength reduction factors in ACI 318-02 have been revised to be consistent with the ASCE 7 loadcombinations. Thus, the factors that were in Appendix C of ACI 318-99 are now in Chapter 9 of ACI318-02, with some modification. The strength reduction factors relevant to this example as contained inACI 318-02 Sec. 9.3 are:
Flexure without axial load φ = 0.9 (tension-controlled sections)Axial compression, using tied columns φ = 0.65 (transitions to 0.9 at low axial loads)Shear if shear strength is based o nominal axial-flexural capacity φ = 0.75Shear if shear strength is not based o nominal axial-flexural capacity φ = 0.60Shear in beam-column joints φ = 0.85]
6.4.3 Comments on the Structure’s Behavior Under E-W Loading
Frame-wall interaction plays an important role in the behavior of the structure loaded in the E-Wdirection. This behavior is beneficial to the design of the structure because:
1. For frames without walls (Frames 1, 2, 7, and 8), the shears developed in the girders (except for thefirst story) do not differ greatly from story to story. This allows for a uniformity in the design of thegirders.
2. For frames containing structural walls (Frames 3 through 6), the overturning moments in thestructural walls are reduced significantly as a result of interaction with the remaining frames (Frames1, 2, 7, and 8).
3. For the frames containing structural walls, the 40-ft-long girders act as outriggers further reducing theoverturning moment resisted by the structural walls.
The actual distribution of story forces developed in the different frames of the structure is shown inFigure 6-7.2 This figure shows the response of Frames 1, 2, and 3 only. By symmetry, Frame 8 is similarto Frame 1, Frame 7 is similar to Frame 2, and Frame 6 is similar to Frame 3. Frames 4 and 5 have aresponse that is virtually identical to that of Frames 3 and 6.
As may be observed from Figure 6-7, a large reverse force acts at the top of Frame 3 which contains astructural wall. This happens because the structural wall pulls back on (supports) the top of Frame 1. Thedeflected shape of the structure loaded in the E-W direction (see Figure 6-5) also shows the effect offrame-wall interaction because the shape is neither a cantilever mode (wall alone) nor a shear mode

FEMA 451, NEHRP Recommended Provisions: Design Examples
6-32
-58.4-8.58-8.68-2.88
0.964.266.768.628.7213.28
-18.96107.8
12345678910112
Story force, kips
-114.9-30.1-20.18
-8.181.649.5615.7419.9821.4826.56
-29.12255.7
123456789101112
91.9631.7934.7734.3736.2639.8845.1452.1461.2966.71
120.88-77.67
12345678910112
Story force, kipsStory force, kips
Frame 1 Frame 2 Frame 3 (includes wall)
Figure 6-7 Story forces in the E-W direction (1.0 kip = 4.45 kN).
(frame alone). It is the “straightening out” of the deflected shape of the structure that causes the storyshears in the frames without walls to be relatively equal.
A plot of the story shears in Frames 1, 2, and 3 is shown in Figure 6-8. The distribution of overturningmoments is shown in Figure 6-9 and indicates that the relatively stiff Frames 1 and 3 resist the largestportion of the total overturning moment. The reversal of moment at the top of Frame 3 is a typicalresponse characteristic of frame-wall interaction.
6.4.4 Analysis of Frame-Only Structure for 25 Percent of Lateral Load
When designing a dual system, Provisions Sec. 5.2.2.1 [4.3.1.1] requires the frames (without walls) toresist at least 25 percent of the total base shear. This provision ensures that the dual system has sufficientredundancy to justify the increase from R = 6 for a special reinforced concrete structural wall to R = 8 fora dual system (see Provisions Table 5.2.2 [4.3-1]). [Note that R = 7 per 2003 Provisions Table 4.3-1.] The 25 percent analysis was carried out using the ETABS program with the mathematical model of thebuilding being identical to the previous version except that the panels of the structural wall were removed. The boundary elements of the walls were retained in the model so that behavior of the interior frames(Frames 3, 4, 5, and 6) would be analyzed in a rational way.
The results of the analysis are shown in Figures 6-10, 6-11, and 6-12. In these figures, the originalanalysis (structural wall included) is shown by a solid line and the 25 percent (backup frame) analysis(structural wall removed) is shown by a dashed line. As can be seen, the 25 percent rule controls only atthe lower level of the building.

Chapter 6, Reinforced Concrete
6-33
0
20
40
60
80
100
120
140
160
-200 -100 0 100 200 300 400 500 600
Shear, kips
Hei
ght,
ft
Frame 1
Frame 2
Frame 3
Figure 6-8 Story shears in the E-W direction (1.0 ft = 0.3048 m, 1.0 kip = 4.45 kN).
0
20
40
60
80
100
120
140
160
-10,000 0 10,000 20,000 30,000 40,000 50,000
Bending moment, ft-kips
Hei
ght,
ft
Frame 1
Frame 2
Frame 3
Figure 6-9 Story overturning moments in the E-W direction (1.0 ft = 0.3048 m, 1.0 ft-kip = 1.36 kN-m).

FEMA 451, NEHRP Recommended Provisions: Design Examples
6-34
0
20
40
60
80
100
120
140
160
0 50 100 150 200 250 300 350
Shear, kips
Hei
ght,
ft
25% V analysis for Frame 1
Frame 1
Figure 6-10 25 percent story shears, Frame 1 E-W direction (1.0 ft = 0.3048m, 1.0 kip = 4.45 kN).

Chapter 6, Reinforced Concrete
6-35
0
20
40
60
80
100
120
140
160
0 50 100 150 200 250 300 350
Shear, kips
Hei
ght,
ft
25% V analysis for Frame 2
Frame 2
Figure 6-11 25 percent story shears, Frame 2 E-W direction (1.0 ft = 0.3048m, 1.0 kip = 4.45 kN).

FEMA 451, NEHRP Recommended Provisions: Design Examples
6-36
0
20
40
60
80
100
120
140
160
0 50 100 150 200 250 300 350
Shear, kips
Hei
ght,
ft
25% V analysis for Frame 3
Frame 3 (without panels)
Figure 6-12 25 percent story shear, Frame 3 E-W direction (1.0 ft = 0.3048 m,1.0 kip = 4.45 kN)..
6.4.5 Design of Frame Members for the Berkeley Building
A sign convention for bending moments is required in flexural design. In this example, when the steel atthe top of a beam section is in tension, the moment is designated as a negative moment. When the steel atthe bottom is in tension, the moment is designated as a positive moment. All moment diagrams are drawnusing the reinforced concrete or tension-side convention. For beams, this means negative moments areplotted on the top and positive moments are plotted on the bottom. For columns, moments are drawn onthe tension side of the member.
6.4.5.1 Initial Calculations
Before the quantity and placement of reinforcement is determined, it is useful to establish, in an overallsense, how the reinforcement will be distributed. The preliminary design established that beams wouldhave a maximum depth of 32 in. and columns would be 30 in. by 30 in. In order to consider thebeam-column joints “confined” per ACI 318 Sec. 21.5, it was necessary to set the beam width to 22.5 in.,which is 75 percent of the column width.
In order to determine the effective depth used for the design of the beams, it is necessary to estimate thesize and placement of the reinforcement that will be used. In establishing this depth, it is assumed that #8bars will be used for longitudinal reinforcement and that hoops and stirrups will be constructed from #3deformed bars. In all cases, clear cover of 1.5 in. is assumed. Since this structure has beams spanning in

Chapter 6, Reinforced Concrete
6-37
2'-6"
1.5" cover
#8 bar
#3 hoopEast-west
spanning beam
2'-8
"
2'-5
1 2"
2'-4
1 2"
North-southspanning beam
Figure 6-13 Layout for beam reinforcement (1.0 ft = 0.3048 m, 1.0 in = 25.4mm).
two orthogonal directions, it is necessary to layer the flexural reinforcement as shown in Figure 6-13. Thereinforcement for the E-W spanning beams was placed in the upper and lower layers because the strengthdemand for these members is somewhat greater than that for the N-S beams.
Given Figure 6-13, compute the effective depth for both positive and negative moment as:
Beams spanning in the E-W direction, d = 32 - 1.5 - 0.375 - 1.00/2 = 29.6 in.Beams spanning in the N-S direction, d = 32 - 1.5 - 0.375 - 1.0 - 1.00/2 = 28.6 in.
For negative moment bending, the effective width is 22.5 in. for all beams. For positive moment, the slabis in compression and the effective T-beam width varies according to ACI 318 Sec. 8.10. The effectivewidths for positive moment are as follows (with the parameter controlling effective width shown inparentheses):
20-ft beams in Frames 1 and 8 b = 22.5 + 20(12)/12 = 42.5 in. (span length)Haunched beams b = 22.5 + 2[8(4)] = 86.5 in. (slab thickness)30-ft beams in Frames A, B, C, and D b = 22.5 + [6(4)] = 46.5 in. (slab thickness)
ACI 318 Sec. 21.3.2 controls the longitudinal reinforcement requirements for beams. The minimumreinforcement to be provided at the top and bottom of any section is:
2,
200 200(22.5)29.6 2.22 in.60,000
ws min
y
b dAf
= = =

FEMA 451, NEHRP Recommended Provisions: Design Examples
6-38
This amount of reinforcement can be supplied by three #8 bars with As = 2.37 in.2 Since the three #8 barswill be provided continuously top and bottom, reinforcement required for strength will include these #8bars.
Before getting too far into member design, it is useful to check the required tension development lengthfor hooked bars since the required length may control the dimensions of the columns and the boundaryelements of the structural walls.
From Eq. 21-6 of ACI 318 Sec. 21.5.4.1, the required development length is:
65y b
dhc
f dl
f=
′
For NW concrete, the computed length should not be less than 6 in. or 8db. For LW concrete, theminimum length is the larger of 1.25 times that given by ACI 318 Eq. 21-6, 7.5 in., or 10db. For fc' =4,000 psi LW concrete, ACI 318 Eq. 21-6 controls for #3 through #11 bars.
For straight “top” bars, ld = 3.5ldh and for straight bottom bars, ld = 2.5ldh. These values are applicableonly when the bars are anchored in well confined concrete (e.g., column cores and plastic hinge regionswith confining reinforcement). The development length for the portion of the bar extending intounconfined concrete must be increased by a factor of 1.6. Development length requirements for hookedand straight bars are summarized in Table 6-13.
Where hooked bars are used, the hook must be 90 degrees and be located within the confined core of thecolumn or boundary element. For bars hooked into 30-in.-square columns with 1.5 in. of cover and #4ties, the available development length is 30 - 1.50 - 0.5 = 28.0 in. With this amount of available length,there will be no problem developing hooked bars in the columns. As required by ACI 318 Sec. 12.5,hooked bars have a 12db extension beyond the bend. ACI 318 Sec. 7.2 requires that #3 through #8 barshave a 6db bend diameter and #9 through #11 bars have a 8db diameter.
Table 6-13 is applicable to bars anchored in joint regions only. For development of bars outside of jointregions, ACI 318 Chapter 12 should be used.
Table 6-13 Tension Development Length Requirements for Hooked Barsand Straight Bars in 4,000 psi LW Concrete
Bar Size db (in.) ldh hook (in.) ld top (in.) ld bottom (in.)
#4#5#6#7#8#9
#10#11
0.5000.6250.7500.8751.0001.1281.2701.410
9.111.413.716.018.220.623.225.7
31.939.948.056.063.772.181.290.0
22.828.534.340.045.551.558.064.2
1.0 in. = 25.4 mm.

Chapter 6, Reinforced Concrete
3See Chapter 1 of the 2nd Edition of the Handbook of Concrete Engineering edited by Mark Fintel (New York: Van NostrandReinhold Company, 1984).
6-39
6.4.5.2 Design of Members of Frame 1 for E-W Loading
For the design of the members of Frame 1, the equivalent lateral forces of Table 6-7b were applied at aneccentricity of 10.5 ft together with 30 percent of the forces of Table 6-7a applied at an eccentricity of 5.0ft. The eccentricities were applied in such a manner as to maximize torsional response and produce thelargest shears in Frame 1.
For this part of the example, the design and detailing of all five beams and one interior column of Level 5are presented in varying amounts of detail. The beams are designed first because the flexural capacity ofthe as-designed beams is a factor in the design and detailing of the column and the beam-column joint. The design of a corner column will be presented later.
Before continuing with the example, it should be mentioned that the design of ductile reinforced concretemoment frame members is dominated by the flexural reinforcement in the beams. The percentage andplacement of beam flexural reinforcement governs the flexural rebar cutoff locations, the size and spacingof beam shear reinforcement, the cross-sectional characteristics of the column, the column flexuralreinforcement, and the column shear reinforcement. The beam reinforcement is critical because the basicconcept of ductile frame design is to force most of the energy-absorbing deformation to occur throughinelastic rotation in plastic hinges at the ends of the beams.
In carrying out the design calculations, three different flexural strengths were used for the beams. Thesecapacities were based on:
Design strength φ = 0.8, tensile stress in reinforcement at 1.00 fy
Nominal strength φ = 1.0, tensile stress in reinforcement at 1.00 fy
Probable strength φ = 1.0, tensile stress in reinforcement at 1.25 fy
Various aspects of the design of the beams and other members depend on the above capacities as follows:
Beam rebar cutoffs Design strengthBeam shear reinforcement Probable strength of beamBeam-column joint strength Probable strength of beamColumn flexural strength 6/5 × nominal strength of beamColumn shear strength Probable strength of column
In addition, beams in ductile frames will always have top and bottom longitudinal reinforcementthroughout their length. In computing flexural capacities, only the tension steel will be considered. Thisis a valid design assumption because reinforcement ratios are quite low, yielding a depth to the neutralaxis similar to the depth of the compression reinforcement (d'/d is about 0.08, while the neutral axis depthat ultimate ranges from 0.07 to 0.15 times the depth) .3
The preliminary design of the girders of Frame 1 was based on members with a depth of 32 in. and awidth of 22.5 in. The effective depth for positive and negative bending is 29.6 in. and the effectivewidths for positive and negative bending are 42.5 and 22.5 in., respectively. This assumes the stressblock in compression is less than the 4.0-inch flange thickness.
The layout of the geometry and gravity loading on the three eastern-most spans of Level 5 of Frame 1 aswell as the unfactored gravity and seismic moments are illustrated in Figure 6-14. The seismic momentsare taken directly from the ETABS program output and the gravity moments were computed by hand

FEMA 451, NEHRP Recommended Provisions: Design Examples
6-40
4,515
4,515
4,708
4,635
4,457
3,988
492786
562 492
715715 715 715
492
152
173
242 221 221
152 152
221221
5,232 5,225
951
4,122 3,453834
5,834 5,761
4,222 4,149834
5,641
4,028
5,641
4,0281.42D + 0.5L + E
0.68D - E1.2D+1.6L - midspan
(a)Span layoutand loading
(b)Earthquake moment(in.-kips)
(c)Unfactored DL moment(in.-kips)
(d)Unfactored LL moment(in.-kips)
(e) Required strengthenvelopes (in.-kips)
17'-6"20'-0" 20'-0"
20'-0"
'
Figure 6-14 Bending moments for Frame 1 (1.0 ft = 0.3048 m, 1.0 in.-kip = 0.113 kN-m).
using the coefficient method of ACI 318 Chapter 8. Note that all moments (except for midspan positivemoment) are given at the face of the column and that seismic moments are considerably greater than thosedue to gravity.
Factored bending moment envelopes for all five spans are shown in Figure 6-14. Negative moment at thesupports is controlled by the 1.42D + 0.5L + 1.0E load combination, and positive moment at the supportis controlled by 0.68D - 1.0E. Midspan positive moments are based on the load combination 1.2D + 1.6L. The design process is illustrated below starting with Span B-C.
6.4.5.2.1 Span B-C
1. Design for Negative Moment at the Face of the Support
Mu = 1.42(-715) + 0.5(-221) + 1.0(-4515) = -5,641 in.-kips
Try two #9 bars in addition to the three #8 bars required for minimum steel:
As = 2(1.0) + 3(0.79) = 4.37 in.2
fc' = 4,000 psify = 60 ksi

Chapter 6, Reinforced Concrete
6-41
Width b for negative moment = 22.5 in.d = 29.6 in.Depth of compression block, a = Asfy/.85fc'ba = 4.37 (60)/[0.85 (4) 22.5] = 3.43 in.Design strength, φMn = φAsfy(d - a/2)φMn = 0.8(4.37)60(29.6 - 3.43/2) = 5,849 in.-kips > 5,641 in.-kips OK
2. Design for Positive Moment at Face of Support
Mu = [-0.68(715)] + [1.0(4,515)] = 4,028 in.-kips
Try two #7 bars in addition to the three #8 bars already provided as minimum steel:
As = [2(0.60)] + [3(0.79)] = 3.57 in. 2
Width b for positive moment = 42.5 in.d = 29.6 in.a = [3.57(60)]/[0.85(4)42.5] = 1.48 in.φMn = 0.8(3.57) 60(29.6 - 1.48/2) = 4,945 in.-kips > 4,028 in.-kips OK
3. Positive Moment at Midspan
Mu = [1.2(492)] + [1.6(152)] = 833.6 in.-kips
Minimum reinforcement (three #8 bars) controls by inspection. This positive moment reinforcement willalso work for Spans A'-B and A-A'.
6.4.5.2.2 Span A'-B
1. Design for Negative Moment at the Face of Support A'
Mu = [1.42(-715)] + [0.5(-221)] + [1.0(-4,708)] = -5,834 in.-kips
Three #8 bars plus two #9 bars (capacity = 5,849 in.-kips) will work as shown for Span B-C.
2. Design for Negative Moment at the Face of Support B
Mu = [1.42(-715)] + [0.5(-221)] + [1.0(-4,635)] = -5,761 in.-kips
As before, use three #8 bars plus two #9 bars.
3. Design for Positive Moment at Face of Support A'
Mu = [-0.68(715)] + [1.0(4708)] = 4,222 in.-kips
Three #8 bars plus two #7 bars (capacity = 4,945 in.-kips) works as shown for Span B-C.
4. Design for Positive Moment at Face of Support B'
Mu = [-0.68(715)] + [1.0(4,635)] = 4,149 in.-kips
As before, use three #8 bars plus two #7 bars.
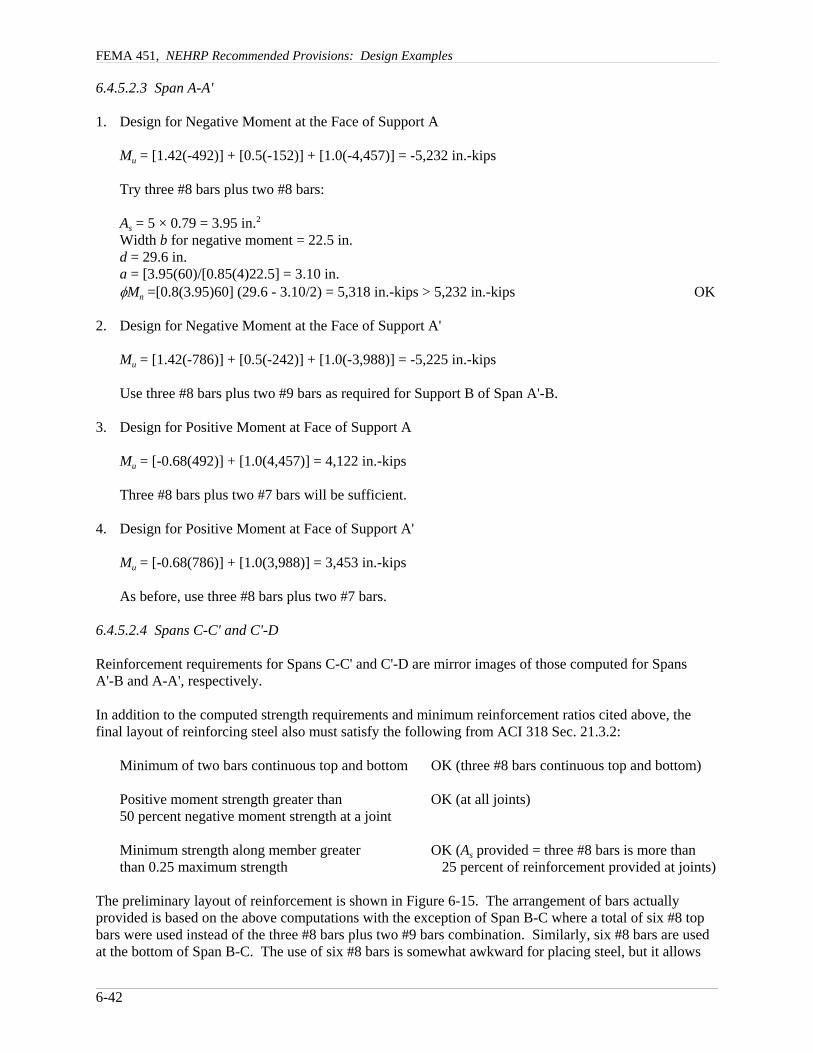
FEMA 451, NEHRP Recommended Provisions: Design Examples
6-42
6.4.5.2.3 Span A-A'
1. Design for Negative Moment at the Face of Support A
Mu = [1.42(-492)] + [0.5(-152)] + [1.0(-4,457)] = -5,232 in.-kips
Try three #8 bars plus two #8 bars:
As = 5 × 0.79 = 3.95 in.2
Width b for negative moment = 22.5 in.d = 29.6 in.a = [3.95(60)/[0.85(4)22.5] = 3.10 in.φMn =[0.8(3.95)60] (29.6 - 3.10/2) = 5,318 in.-kips > 5,232 in.-kips OK
2. Design for Negative Moment at the Face of Support A'
Mu = [1.42(-786)] + [0.5(-242)] + [1.0(-3,988)] = -5,225 in.-kips
Use three #8 bars plus two #9 bars as required for Support B of Span A'-B.
3. Design for Positive Moment at Face of Support A
Mu = [-0.68(492)] + [1.0(4,457)] = 4,122 in.-kips
Three #8 bars plus two #7 bars will be sufficient.
4. Design for Positive Moment at Face of Support A'
Mu = [-0.68(786)] + [1.0(3,988)] = 3,453 in.-kips
As before, use three #8 bars plus two #7 bars.
6.4.5.2.4 Spans C-C' and C'-D
Reinforcement requirements for Spans C-C' and C'-D are mirror images of those computed for SpansA'-B and A-A', respectively.
In addition to the computed strength requirements and minimum reinforcement ratios cited above, thefinal layout of reinforcing steel also must satisfy the following from ACI 318 Sec. 21.3.2:
Minimum of two bars continuous top and bottom OK (three #8 bars continuous top and bottom)
Positive moment strength greater than OK (at all joints)50 percent negative moment strength at a joint
Minimum strength along member greater OK (As provided = three #8 bars is more thanthan 0.25 maximum strength 25 percent of reinforcement provided at joints)
The preliminary layout of reinforcement is shown in Figure 6-15. The arrangement of bars actuallyprovided is based on the above computations with the exception of Span B-C where a total of six #8 topbars were used instead of the three #8 bars plus two #9 bars combination. Similarly, six #8 bars are usedat the bottom of Span B-C. The use of six #8 bars is somewhat awkward for placing steel, but it allows

Chapter 6, Reinforced Concrete
6-43
'
Note:Drawing not to scale
'
(2) #8(3) #8
(2) #9
(2) #7(3) #8
(2) #7
(3) #8 (3) #8(2) #8
(2) #9
(2) #7
20'-0"
(2) #7(3) #8
2'-8
"
2'-6"(typical)
Figure 6-15 Preliminary rebar layout for Frame 1 (1.0 ft = 03.048 m).
for the use of three #8 continuous top and bottom at all spans. An alternate choice would have been touse two #9 continuous across the top of Span B-C instead of the three of the #8 bars. However, the use oftwo #9 bars (ρ = 0.00303) does not meet the minimum reinforcement requirement ρmin = 0.0033.
As mentioned above, later phases of the frame design will require computation of the design strength andthe maximum probable strength at each support. The results of these calculations are shown in Table6-14.
Table 6-14 Design and Maximum Probable Flexural Strength For Beams in Frame 1
ItemLocation
A A' B C C' D
NegativeMoment
Reinforcement five #8 three #8 +two #9
six #8 six #8 three #8 +two #9
five #8
Design Strength(in.-kips) 5,318 5,849 6,311 7,100 5,849 5,318
Probable Strength(in.-kips) 8,195 8,999 9,697 9,697 8,999 8,195
PositiveMoment
Reinforcement three #8 +two #7
three #8 +two #7
six #8 six #8 three #8 +two #7
three #8 +two #7
Design Strength(in.-kips) 4,945 4,945 6,510 6,510 4,945 4,945
Probable Strength(in.-kips) 7,677 7,677 10,085 10,085 7,655 7,677
1.0 in.-kip = 0.113 kN-m.
As an example of computation of probable strength, consider the case of six #8 top bars:
As = 6(0.79) = 4.74 in.2
Width b for negative moment = 22.5 in.d = 29.6 in.Depth of compression block, a = As(1.25fy)/0.85fc'ba = 4.74(1.25)60/[0.85(4)22.5] = 4.65 in.Mpr = 1.0As(1.25fy)(d - a/2)

FEMA 451, NEHRP Recommended Provisions: Design Examples
6-44
Mpr = 1.0(4.74)1.25(60)(29.6 - 4.65/2) = 9,697 in.-kips
For the case of six #8 bottom bars:
As = 6(0.79) = 4.74 in.2
Width b for positive moment = 42.5 in.d = 29.6 in.a = 4.74(1.25)60/(0.85 × 4 × 42.5 ) = 2.46 in.Mpr = 1.0(4.74)1.25(60)(29.6 - 2.46/2) = 10,085 in.-kips
6.4.5.2.5 Adequacy of Flexural Reinforcement in Relation to the Design of the Beam-Column Joint
Prior to this point in the design process, the layout of reinforcement has been considered preliminarybecause the quantity of reinforcement placed in the girders has a direct bearing on the magnitude of thestresses developed in the beam-column joint. If the computed joint stresses are too high, the onlyremedies are increasing the concrete strength, increasing the column area, changing the reinforcementlayout, or increasing the beam depth. The option of increasing concrete strength is not viable for thisexample because it is already at the maximum (4,000 psi) allowed for LW concrete. If absolutelynecessary, however, NW concrete with a strength greater than 4,000 psi may be used for the columns andbeam-column joint region while the LW concrete is used for the joists and beams.
The design of the beam-column joint is based on the requirements of ACI 318 Sec. 21.5.3. Thedetermination of the forces in the joint of the column on Gridline C of Frame 1 is based on Figure 6-16a,which shows how plastic moments are developed in the various spans for equivalent lateral forces actingto the east. An isolated subassemblage from the frame is shown in Figure 6-16b. The beam shears shownin Figure 6-16c are based on the probable moment strengths shown in Table 6-14.
For forces acting from west to east, compute the earthquake shear in Span B-C:
VE = (Mpr- + Mpr
+ )/lclear = (9,697 + 10,085)/(240 - 30) = 94.2 kips
For Span C-C':
VE = (10,085 + 8,999)/(240 - 30) = 90.9 kips
With the earthquake shear of 94.2 and 90.9 kips being developed in the beams, the largest shear thattheoretically can be developed in the column above Level 5 is 150.5 kips. This is computed fromequilibrium as shown at the bottom of Figure 6-16:
94.2(9.83) + 90.9(10.50) = 2Vc(12.5/2)Vc = 150.4 kips
With equal spans, gravity loads do not produce significant column shears, except at the end column,where the seismic shear is much less. Therefore, gravity loads are not included in this computation.
The forces in the beam reinforcement for negative moment are based on six #8 bars at 1.25 fy:
T = C = 1.25(60)[(6(0.79)] = 355.5 kips

Chapter 6, Reinforced Concrete
6-45
'
- +
- + +
- +- -
8,9999,697
10,085 10,085
150.4
150.4
90.994.2
(a)Plasticmechanism
(b)Plastic moments (in.-kips) in spansB-C and C-C'
(c)Girder andcolumn shears(kips)
'
'
20'-0"20'-0"
9'-10" 10'-6"
Figure 6-16 Diagram for computing column shears (1.0 ft =0.3048 m, 1.0 kip = 4.45kN, 1.0 in.-kip = 0.113 kN-m).
For positive moment, six #8 bars also are used, assuming C = T, C = 355.5 kips.
As illustrated in Figure 6-17, the joint shear force Vj is computed as:
Vj = T + C - VE = 355.5 + 355.5 - 150.4 = 560.6 kips
The joint shear stress is:
2 2560.5 623 psi30
jj
c
Vv
d= = =

FEMA 451, NEHRP Recommended Provisions: Design Examples
6-46
C = 355.5 kips
T = 355.5 kipsC = 355.5 kips
T = 355.5 kips
V = 150.5 kipsc
V = 2(355.5)-150.5 = 560.5 kips
g
Figure 6-17 Computing joint shear stress (1.0 kip = 4.45kN).
For joints confined on three faces or on two opposite faces, the allowable shear stress for LW concrete isbased on ACI 318 Sec. 21.5.3. Using φ = 0.80 for joints (from ACI Appendix C) and a factor of 0.75 as amodifier for LW concrete:
, 0.80(0.75)(15 4,000) 569 psij allowablev = =
[Note that for joints, φ = 0.85 per ACI 318-02 Sec 9.3 as referenced by the 2003 Provisions. See Sec6.4.2 for discussion.]
Since the actual joint stress (623 psi) exceeds the allowable stress (569 psi), the joint is overstressed. Oneremedy to the situation would be to reduce the quantity of positive moment reinforcement. The six #8bottom bars at Columns B and C could be reduced to three #8 bars plus two #7 bars. This would require asomewhat different arrangement of bars than shown in Figure 6-15. It is left to the reader to verify thatthe joint shear stress would be acceptable under these circumstances. Another remedy would be toincrease the size of the column. If the column is increased in size to 32 in. by 32 in., the new joint shearstress is:
2 2560.5 547psi < 569 psi32
jj
c
Vv
d= = =
which is also acceptable. For now we will proceed with the larger column, but as discussed later, the finalsolution will be to rearrange the bars to three #8 plus two #7.
Joint stresses would be checked for the other columns in a similar manner. Because the combined area oftop and bottom reinforcement used at Columns A, A', C', and D is less than that for Columns B and C,these joints will not be overstressed.
Given that the joint stress is acceptable, ACI 318 Sec. 21.5.2.3 controls the amount of reinforcementrequired in the joint. Since the joint is not confined on all four sides by a beam, the total amount oftransverse reinforcement required by ACI 318 Sec. 21.4.4 will be placed within the depth of the joint. Asshown later, this reinforcement consists of four-leg #4 hoops at 4 in. on center.

Chapter 6, Reinforced Concrete
6-47
Because the arrangement of steel is acceptable from a joint strength perspective, the cutoff locations ofthe various bars may be determined (see Figure 6-15 for a schematic of the arrangement ofreinforcement). The three #8 bars (top and bottom) required for minimum reinforcement are supplied inone length that runs continuously across the two end spans and are cut off in the center span. Anadditional three #8 bars are placed top and bottom in the center span; these bars are cut off in Spans A'-Band C-C'. At Supports A, A', C' and D, shorter bars are used to make up the additional reinforcementrequired for strength.
To determine where bars should be cut off in each span, it is assumed that theoretical cutoff locationscorrespond to the point where the continuous top and bottom bars develop their design flexural strength.Cutoff locations are based on the members developing their design flexural capacities (fy = 60 ksi and φ =0.8). Using calculations similar to those above, it has been determined that the design flexural strengthsupplied by a section with only three #8 bars is 3,311 in.-kips for positive moment and 3,261 in.-kips fornegative moment.
Sample cutoff calculations are given first for Span B-C. To determine the cutoff location for negativemoment, it is assumed that the member is subjected to earthquake plus 0.68 times the dead load forces. For positive moment cutoffs, the loading is taken as earthquake plus 1.42 times dead load plus 0.5 timeslive load. Loading diagrams for determining cut off locations are shown in Figure 6-18.
For negative moment cutoff locations, refer to Figure 6-19a, which is a free body diagram of the west endof the member. Since the goal is to develop a negative moment capacity of 3,261 in.-kips in thecontinuous #8 bars summing moments about Point A in Figure 6-19a:
20.1216,311 73.7 3,2612
x x+ − =
In the above equation, 6,311 (in.-kips) is the negative moment capacity for the section with six #8 bars,0.121 (kips/in.) is 0.68 times the uniform dead load, 73.3 kips is the end shear, and 3,261 in.-kips is thedesign strength of the section with three #8 bars. Solving the quadratic equation results in x = 42.9 in. ACI 318 Sec. 12.10.3 requires an additional length equal to the effective depth of the member or 12 bardiameters (whichever is larger). Consequently, the total length of the bar beyond the face of the supportis 42.9 + 29.6 = 72.5 in. and a 6 ft-1 in. extension beyond the face of the column could be used.
For positive moment cutoff, see Figure 6-14 and Figure 6-19b. The free body diagram produces anequilibrium equation as:
20.2816,510 31.6 3,3112
x x− − =
where the distance x is computed to be 75.7 in. Adding the 29.6 in. effective depth, the requiredextension beyond the face of the support is 76.0 + 29.6 = 105.3 in, or 8 ft-9 in. Note that this is exactly atthe midspan of the member.

FEMA 451, NEHRP Recommended Provisions: Design Examples
6-48
EE +0.68DE +1.42D+0.68L
X- X+
W = 0.66 klfL
W = 2.14 klfDFace ofsupport
17'-6"
6,311
3,261
3,311
6,510
Bending moment(in.-kips)
Figure 6-18 Loading for determination of rebar cutoffs(1.0 ft = 0.3048 m, 1.0 klf = 14.6 kN/m, 1.0 in.-kip =0.113 kN-m).
6,311 in.-kips
X-
A
0.68 W = 0.121 kip/in.D
73.7 kips
X+
A
31.6 kips
6,510 in.-kips1.42D+0.5L = 0.281 kip/in.
(b)
(a)
Figure 6-19 Free body diagrams (1.0 kip =4.45kN, 1.0 klf = 14.6 kN/m, 1.0 in.-kip =0.113 kN-m).
Clearly, the short bottom bars shown in Figure 6-15 are impractical. Instead, the bottom steel will berearranged to consist of three #8 plus two #7 bars continuous. Recall that this arrangement ofreinforcement will satisfy joint shear requirements, and the columns may remain at 30 in. by 30 in.
As shown in Figure 6-20, another requirement in setting cutoff length is that the bar being cut off musthave sufficient length to develop the strength required in the adjacent span. From Table 6-13, therequired development length of the #9 top bars in tension is 72.1 in. if the bar is anchored in a confinedjoint region. The confined length in which the bar is developed is shown in Figure 6-20 and consists of

Chapter 6, Reinforced Concrete
6-49
dh
F
c
d =
2'-8
"
d = 2'-6"
7'-10"
6'-1"
Confinedregion
Must also checkfor force F. Requiredlength = 3.5 l = 72.1"
#9 bar
Cut off length basedon moments in spanA'-B
b
'
Figure 6-20 Development length for top bars (1.0 ft = 0.3048 m, 1.0 in = 25.4 mm).
the column depth plus twice the depth of the girder. This length is 30 + 32 + 32 = 94 in., which is greaterthan the 72.1 in. required. The column and girder are considered confined because of the presence ofclosed hoop reinforcement as required by ACI 318 Sec. 21.3.3 and 21.4.4.
The bottom bars are spliced at the center of Spans A'-B and C-C' as shown in Figure 6-21. The splicelength is taken as the bottom bar Class B splice length for #8 bars. According to ACI 318 Sec. 12.15, thesplice length is 1.3 times the development length. From ACI 318 Sec. 12.2.2, the development length (ld)is computed from:
'
340
yd
b trc
b
fld c Kf
d
αβγλ=
⎛ ⎞+⎜ ⎟⎝ ⎠
using α = 1.0 (bottom bar), β =1.0 (uncoated), γ = 1.0 (#9 bar), λ = 1.3 (LW concrete), taking c as thecover (1.5 in.) plus the tie dimension (0.5 in.) plus 1/2 bar diameter (0.50 in.) = 2.50 in., and usingKtr = 0, the development length for one #9 bar is:
3 60,000 1 1 1.0 1.3 (1.0) 37.0 in.2.5 040 4,000
1.0
dl⎛ ⎞ × × ×
= =⎜ ⎟⎜ ⎟ +⎛ ⎞⎝ ⎠ ⎜ ⎟⎝ ⎠
The splice length = 1.3 × 37.0 = 48.1 in. Therefore, use a 48-in. contact splice. According to ACI 318Sec. 21.3.2.3, the entire region of the splice must be confined by closed hoops spaced no closer than d/4or 4 in.
The final bar placement and cutoff locations for all five spans are shown in Figure 6-21. Due to thedifferent arrangement of bottom steel, the strength at the supports must be recomputed. The results areshown in Table 6-15.

FEMA 451, NEHRP Recommended Provisions: Design Examples
6-50
(3) #8
' '
(2) #9 (2) #8(3) #8
5'-0"
4'-0"(3) #8 +(2) #7
Hoop spacing (from each end):Typical spans A-A', B-C, C'-D(4) #3 leg 1 at 2", 19 at 5.5"
Typical spans A'-B,C-C',(4) #3 leg 1 at 2",15 at 5.5", 6 at 4"
Figure 6-21 Final bar arrangement (1.0 ft = 0.3048 m, 1.0 in = 25.4 mm).
Table 6-15 Design and Maximum Probable Flexural Strength For Beams in Frame 1 (Revised)
ItemLocation
A A' B C C' D
NegativeMoment
Reinforcement five #8 three #8 +two #9
six #8 six #8 three #8 +two #9
five #8
Design Moment(in.-kips) 5,318 5,849 6,311 6,311 5,849 5,318
Probable moment(in.-kips) 8,195 8,999 9,696 9,696 8,999 8,195
PositiveMoment
Reinforcement three #8 +two #7
three #8 +two #7
three #8 +two #7
three #8+ two #7
three #8 +two #7
three #8 +two #7
Design Moment(in.-kips) 4,944 4,944 4,944 4,944 4,944 4,944
Probable moment(in.-kips) 7,677 7,677 7,677 7,677 7,677 7,677
1.0 in.-kip = 0.113 kN-m.
6.4.5.2.6 Transverse Reinforcement
Transverse reinforcement requirements are covered in ACI 318 Sec. 21.3.3 (minimum reinforcement) and21.3.4 (shear strength).
To avoid nonductile shear failures, the shear strength demand is computed as the sum of the factoredgravity shear plus the maximum probable earthquake shear. The maximum probable earthquake shear isbased on the assumption that φ = 1.0 and the flexural reinforcement reaches a tensile stress of 1.25fy. Theprobable moment strength at each support is shown in Table 6-15.

Chapter 6, Reinforced Concrete
6-51
Figure 6-22 illustrates the development of the design shear strength envelopes for Spans A-A', A'-B, andB-C. In Figure 6-22a, the maximum probable earthquake moments are shown for seismic forces acting tothe east (solid lines) and to the west (dashed lines). The moments shown occur at the face of the supports.
The earthquake shears produced by the maximum probable moments are shown in Figure 6-22b. ForSpan A-B, the values shown in the figure are:
pr prE
clear
M MV
l
− ++=
where lclear = 17 ft-6 in. = 210 in.
Note that the earthquake shears act in different directions depending on the direction of load.
For forces acting to the east, VE = (9696 + 7677) / 210 = 82.7 kips.For forces acting to the west, VE = (8999 + 7677) / 210 = 79.4 kips.

FEMA 451, NEHRP Recommended Provisions: Design Examples
6-52
'
9,6969,696
7,6777,6777,6777,677
8,9998,195
82.782.779.4
75.6 79.4 82.7
29.5
29.529.5
29.5
29.5
29.5
112.2
53.2
112.2
53.2
53.2
112.2
49.9
108.9
49.9
108.9
46.1105.1
Loading
(a)Seismic moment(tension side)in.-kips
kips
positive
kips
positive
kips
positive
(d)Design shearseismic + gravity
240"210"
15" 15"
(c)Gravity shear(1.42D + 0.5L)
(b)Seismic shear
Figure 6-22 Shear forces for transverse reinforcement (1.0 in = 25.4 mm, 1.0 kip= 4.45kN, 1.0 in.-kip = 0.113 kN-m).

Chapter 6, Reinforced Concrete
6-53
9.3" 54.4" 41.3"
s = 5"φ V = 132.6 kipss
s = 6"s = 7"
φ V = 110.5 kipssφ V = 94.7 kipss
112.2 kips
53.2 kips
112.2 kips
53.2 kips
Figure 6-23 Detailed shear force envelope in Span B-C (1.0 in =25.4 mm, 1.0 kip = 4.45kN).
The gravity shears shown in Figure 6-22c are:
Factored gravity shear = VG = 1.42Vdead + 0.5VliveVdead = 2.14 × 17.5/2 = 18.7 kipsVlive = 0.66 × 17.5/2 = 5.8 kipsVG = 1.42(18.7) + 0.5(5.8) = 29.5 kips
Total design shears for each span are shown in Figure 6-22d. The strength envelope for Span B-C isshown in detail in Figure 6-23, which indicates that the maximum design shears is 82.7 + 29.5 = 112.2kips. While this shear acts at one end, a shear of 82.7 - 29.5 = 53.2 kips acts at the opposite end of themember.
In designing shear reinforcement, the shear strength can consist of contributions from concrete and fromsteel hoops or stirrups. However, according to ACI 318 Sec. 21.3.4.2, the design shear strength of theconcrete must be taken as zero when the axial force is small (Pu/Agf!c < 0.05) and the ratio VE/Vu is greaterthan 0.5. From Figure 6-22, this ratio is VE/Vu = 82.7/112.2 = 0.73, so concrete shear strength must betaken as zero. Using the ASCE 7 compatible φ for shear = 0.75, the spacing of reinforcement required iscomputed as described below. [Note that this is the basic strength reduction factor for shear per ACI 318-02 Sec 9.3. See Sec 6.4.2 for discussion.]
Compute the shear at d = 29.6 in. from the face of the support:
Vu = φVs = 112.2 - (29.6/210)(112.2 - 53.2) = 103.9 kipsVs = Avfyd/s
Assuming four #3 vertical legs (Av = 0.44 in.2), fv = 60 ksi and d = 29.6 in., compute the required spacing:
s = φAvfyd/Vu = 0.75[4(0.11)](60)(29.6/103.9) = 5.65 in., say 5.5 in.
At midspan, the design shear Vu = (112.2 + 53.2)/2 = 82.7 kips. Compute the required spacing:
s = 0.75[4(0.11)](60)(29.6/82.7) = 7.08 in., say 7.0 in.
Check maximum spacing per ACI 318 Sec. 21.3.3.2:

FEMA 451, NEHRP Recommended Provisions: Design Examples
6-54
d/4 = 29.6/4 = 7.4 in.8db = 8(1.0) = 8.0 in.24dh = 24(3/8) = 9.0 in.
The spacing must vary between 5.5 in. at the support and 7.0 in. at midspan. Due to the relatively flatshear force gradient, a spacing of 5.5 in. will be used for the full length of the beam. The first hoop mustbe placed 2 in. from the face of the support. This arrangement of hoops will be used for Spans A-A', B-C,and C'-D. In Spans A'-B and C-C', the bottom flexural reinforcement is spliced and hoops must be placedover the splice region at d/4 or a maximum of 4 in. on center.
ACI 318 Sec. 21.3.3.1 states that closed hoops are required over a distance of twice the member depthfrom the face of the support. From that point on, stirrups may be used. For the girders of Frame 1,however, stirrups will not be used, and the hoops will be used along the entire member length. This isbeing done because the earthquake shear is a large portion of the total shear, the girder is relatively short,and the economic premium is negligible.
Where hoops are required (first 64 in. from face of support), longitudinal reinforcing bars should besupported as specified in ACI 318 Sec. 7.10.5.3. Hoops should be arranged such that every corner andalternate longitudinal bar is supported by a corner of the hoop assembly and no bar should be more than 6in. clear from such a supported bar. Details of the transverse reinforcement layout for all spans of Level 5of Frame 1 are shown in Figure 6-21.
6.4.5.3 Design of a Typical Interior Column of Frame 1
This section illustrates the design of a typical interior column on Gridline A'. The column, whichsupports Level 5 of Frame 1, is 30 in. square and is constructed from 4,000 psi LW concrete, 60 ksilongitudinal reinforcement, and 60 ksi transverse reinforcement. An isolated view of the column isshown in Figure 6-24. The flexural reinforcement in the beams framing into the column is shown inFigure 6-21. Using simple tributary area calculations (not shown), the column supports an unfactoredaxial dead load of 528 kips and an unfactored axial live load of 54 kips. The ETABS analysis indicatesthat the maximum axial earthquake force is 84 kips, tension or compression. The load combination usedto compute this force consists of full earthquake force in the E-W direction, 30 percent of the N-S force,and accidental torsion. Because no beams frame into this column along Gridline A', the column bendingmoment for N-S forces can be neglected. Hence, the column is designed for axial force plus uniaxialbending.
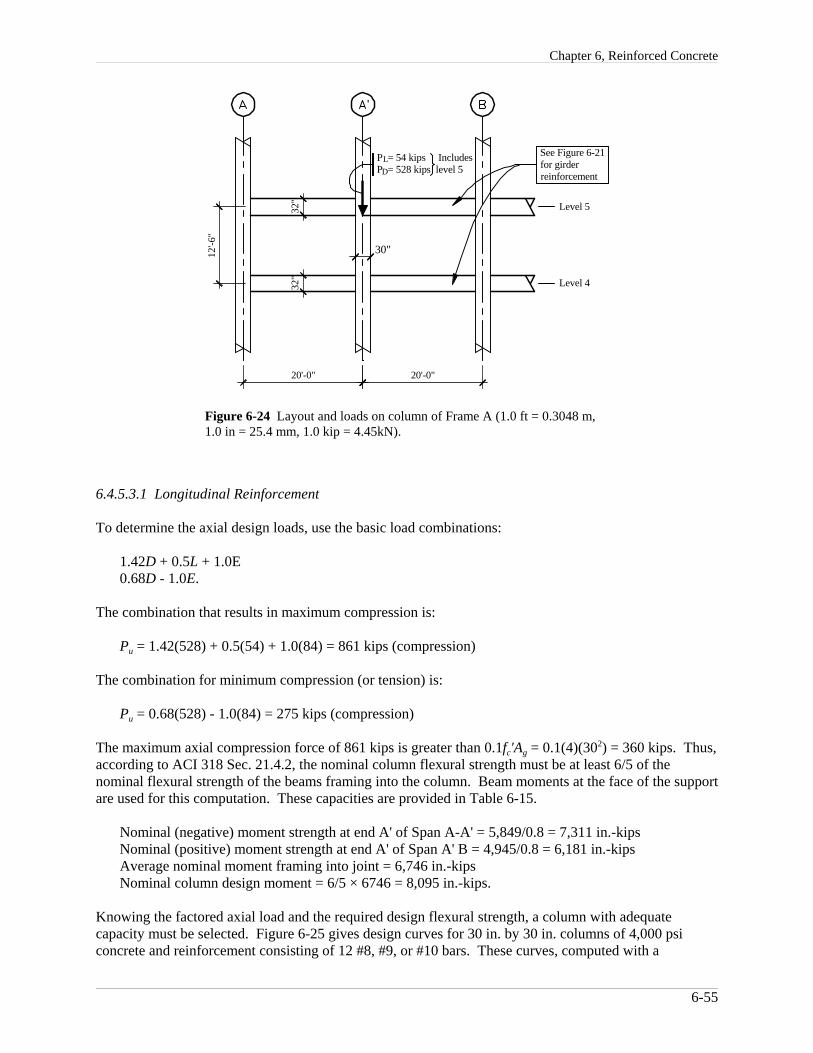
Chapter 6, Reinforced Concrete
6-55
See Figure 6-21for girderreinforcement
L
30"
'
Level 5
Level 4
20'-0"20'-0"
32"
32"
P = 54 kips IncludesP = 528 kips level 5D
12'-6
"
Figure 6-24 Layout and loads on column of Frame A (1.0 ft = 0.3048 m,1.0 in = 25.4 mm, 1.0 kip = 4.45kN).
6.4.5.3.1 Longitudinal Reinforcement
To determine the axial design loads, use the basic load combinations:
1.42D + 0.5L + 1.0E0.68D - 1.0E.
The combination that results in maximum compression is:
Pu = 1.42(528) + 0.5(54) + 1.0(84) = 861 kips (compression)
The combination for minimum compression (or tension) is:
Pu = 0.68(528) - 1.0(84) = 275 kips (compression)
The maximum axial compression force of 861 kips is greater than 0.1fc'Ag = 0.1(4)(302) = 360 kips. Thus,according to ACI 318 Sec. 21.4.2, the nominal column flexural strength must be at least 6/5 of thenominal flexural strength of the beams framing into the column. Beam moments at the face of the supportare used for this computation. These capacities are provided in Table 6-15.
Nominal (negative) moment strength at end A' of Span A-A' = 5,849/0.8 = 7,311 in.-kipsNominal (positive) moment strength at end A' of Span A' B = 4,945/0.8 = 6,181 in.-kipsAverage nominal moment framing into joint = 6,746 in.-kipsNominal column design moment = 6/5 × 6746 = 8,095 in.-kips.
Knowing the factored axial load and the required design flexural strength, a column with adequatecapacity must be selected. Figure 6-25 gives design curves for 30 in. by 30 in. columns of 4,000 psiconcrete and reinforcement consisting of 12 #8, #9, or #10 bars. These curves, computed with a

FEMA 451, NEHRP Recommended Provisions: Design Examples
6-56
(12) #10
(12) #9(12) #8
0
0
500 1,000 1,500 2,000
1,000
2,000
3,000
4,000
5,000
-1,000
-2,000
uM (ft-kips)
uP (kips)
Figure 6-25 Design interaction diagram for column onGridline A' (1.0 kip = 4.45kN, 1.0 ft-kip = 1.36 kN-m).
Microsoft Excel spreadsheet, are based on a φ factor of 1.0 as required for nominal strength. At axialforces of 275 kips and 861 kips, solid horizontal lines are drawn. The dots on the lines represent therequired nominal flexural strength (8095 in.-kips) at each axial load level. These dots must lie to the leftof the curve representing the design columns. For both the minimum and maximum axial forces, acolumn with 12 #8 bars (with As = 9.48 in.2 and 1.05 percent of steel) is clearly adequate.
6.4.5.3.2 Transverse Reinforcement
ACI 318 Sec. 21.4.4 gives the requirements for minimum transverse reinforcement. For rectangularsections with hoops, ACI 318 Eq. 21-3 and 21-4 are applicable:
0.3 1gc csh
yh ch
Ash fAf A
⎛ ⎞′ ⎛ ⎞= −⎜ ⎟⎜ ⎟⎜ ⎟⎝ ⎠⎝ ⎠
0.09 csh c
yh
fA shf′
=
The first of these equations controls when Ag/Ach > 1.3. For the 30-in.-by-30-in. columns:
Ach = (30 - 1.5 - 1.5)2 = 729 in.2
Ag = 30 (30) = 900 in.2
Ag/Ach = 900/729 = 1.24
ACI 318 Eq. 21-4 therefore controls.

Chapter 6, Reinforced Concrete
6-57
For LW concrete, try hoops with four #4 legs and fc' = 4,000 psi:
hc = 30 - 1.5 - 1.5 - 0.25 - 0.25 = 26.5 in.s = [4 (0.2) 60,000]/[0.09 (26.5) 4000] = 5.03 in.
However, the maximum spacing of transverse reinforcement is the lesser of one-fourth the maximumcolumn dimension (30/4=7.5 in.), six bar diameters (6 × 1.0 = 6.0 in.), or the dimension sx where:
1443
xx
hs −= +
and where hx is the maximum horizontal spacing of hoops or cross ties. For the column with twelve #8bars and #4 hoops and cross ties, hx = 8.833 in. and sx = 5.72 in. The 5.03-in. spacing required by ACI Eq.21-4 controls, so a spacing of 5 in. will be used. This transverse reinforcement must be spaced over adistance lo = 30 in. at each end of the member and, according to ACI 318 Sec. 21.5.2, must extendthrough the joint at (at most) the same spacing.
ACI 318 Sec. 21.4.4.6 requires a maximum spacing of transverse reinforcement in the region of thecolumn not covered by Sec. 21.4.4.4. The maximum spacing is the smaller of 6.0 in. or 6db, which for #8bars is also 6 in. ACI 318 requires transverse steel at this spacing, but it does not specify what the detailsof reinforcement should be. In this example, hoops and crossties with the same details as those placed inthe critical regions of the column are used.
6.4.5.3.3 Transverse Reinforcement Required for Shear
The amount of transverse reinforcement computed above is the minimum required. The column alsomust be checked for shear with the column shears being based on the maximum probable moments in thebeams that frame into the column. The average probable moment is roughly 1.25/0.8 (φ = 0.8) times theaverage design moment = (1.25/0.8)(5397) = 8,433 in.-kips. With a clear height of 118 in., the columnshear can be estimated at 8433/(0.5x118) = 143 kips. This shear will be compared to the capacityprovided by the 4-leg #4 hoops spaced at 6 in. on center. If this capacity is well in excess of the demand,the columns will be acceptable for shear.
For the design of column shear capacity, the concrete contribution to shear strength may be consideredbecause Pu > Agf!c/20. Using a shear strength reduction factor of 0.85 for sand-LW concrete (ACI 318Sec. 11.2.1.2) in addition to the capacity reduction factor for shear, the design shear strength contributedby concrete is:
0.75 0.75(0.85)( 4,000(30)(27.5) 33.2 kipsc c c cV f b dφ φ ′= = =
/ 0.75(4)(0.2)(60)(27.5) / 6 165 kipss v yV A f d sφ φ= = =
OK33.2 165 198.2 kips > 143 kipsn c sV V Vφ φ φ= + = + =
The column with the minimum transverse steel is therefore adequate for shear. The final column detailwith both longitudinal and transverse reinforcement is given in Figure 6-26. The spacing ofreinforcement through the joint has been reduced to 4 in. on center. This is done for practical reasonsonly. Column bar splices, where required, should be located in the center half of the of the column andmust be proportioned as (Class B) tension splices.
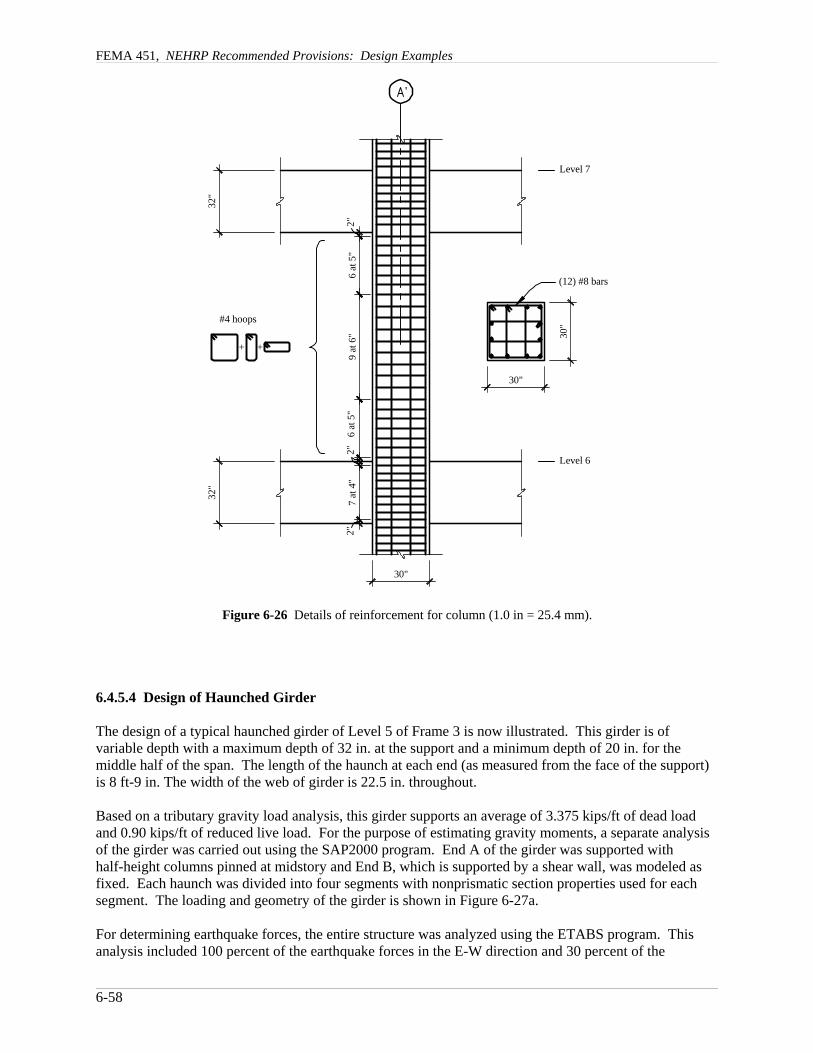
FEMA 451, NEHRP Recommended Provisions: Design Examples
6-58
'
Level 7
Level 6
30"
32"
32"
30"
30"
(12) #8 bars
#4 hoops
+ +2"
7 at
4"
2"6
at 5
"9
at 6
"6
at 5
"2"
Figure 6-26 Details of reinforcement for column (1.0 in = 25.4 mm).
6.4.5.4 Design of Haunched Girder
The design of a typical haunched girder of Level 5 of Frame 3 is now illustrated. This girder is ofvariable depth with a maximum depth of 32 in. at the support and a minimum depth of 20 in. for themiddle half of the span. The length of the haunch at each end (as measured from the face of the support)is 8 ft-9 in. The width of the web of girder is 22.5 in. throughout.
Based on a tributary gravity load analysis, this girder supports an average of 3.375 kips/ft of dead loadand 0.90 kips/ft of reduced live load. For the purpose of estimating gravity moments, a separate analysisof the girder was carried out using the SAP2000 program. End A of the girder was supported withhalf-height columns pinned at midstory and End B, which is supported by a shear wall, was modeled asfixed. Each haunch was divided into four segments with nonprismatic section properties used for eachsegment. The loading and geometry of the girder is shown in Figure 6-27a.
For determining earthquake forces, the entire structure was analyzed using the ETABS program. Thisanalysis included 100 percent of the earthquake forces in the E-W direction and 30 percent of the
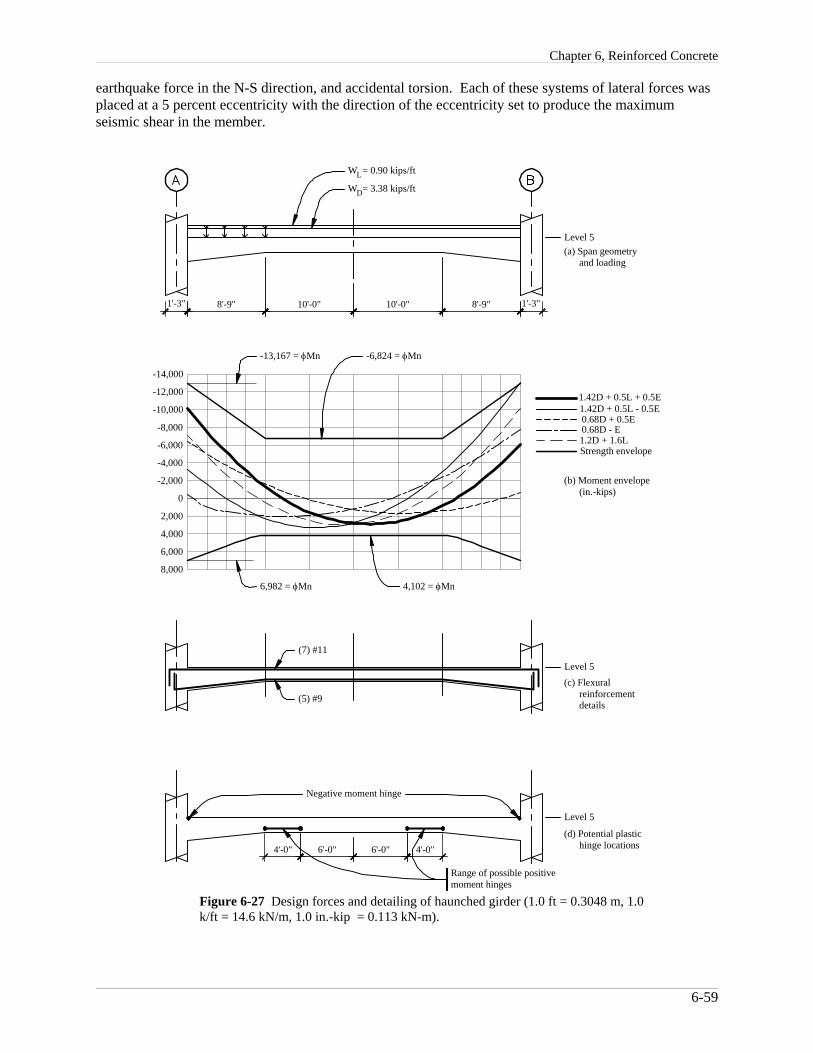
Chapter 6, Reinforced Concrete
6-59
Negative moment hinge
-2,000
0
-4,000
-6,000
-8,000
-10,000
-12,000
-14,000
8,000
6,000
4,000
2,000
Range of possible positivemoment hinges
Level 5
4'-0"6'-0"4'-0" 6'-0"(d) Potential plastic hinge locations
Level 5(c) Flexural reinforcement details
(7) #11
(5) #9
6,982 = φMn 4,102 = φMn
-13,167 = φMn -6,824 = φMn
1.42D + 0.5L + 0.5E
1.2D + 1.6L
1.42D + 0.5L - 0.5E0.68D + 0.5E0.68D - E
Strength envelope
Level 5(a) Span geometry and loading
(b) Moment envelope (in.-kips)
1'-3"8'-9"10'-0"1'-3" 8'-9" 10'-0"
W = 0.90 kips/ftL
W = 3.38 kips/ftD
Figure 6-27 Design forces and detailing of haunched girder (1.0 ft = 0.3048 m, 1.0k/ft = 14.6 kN/m, 1.0 in.-kip = 0.113 kN-m).
earthquake force in the N-S direction, and accidental torsion. Each of these systems of lateral forces wasplaced at a 5 percent eccentricity with the direction of the eccentricity set to produce the maximumseismic shear in the member.

FEMA 451, NEHRP Recommended Provisions: Design Examples
6-60
6.4.5.4.1 Design and Detailing of Longitudinal Reinforcement
The results of the analysis for five different load combinations are shown in Figure 6-27b. Envelopes ofmaximum positive and negative moment are shown on the figure indicate that 1.42D + 0.5L ± E controlsnegative moment at the support, 0.68D ± E controls positive moment at the support, and 1.2D + 1.6Lcontrols positive moment at midspan. The maximum positive moment at the support is less than 50percent of the maximum negative moment and the positive and negative moment at midspan is less than25 percent of the maximum negative moment; therefore, the design for negative moment controls theamount of reinforcement required at all sections per ACI 318 Sec. 21.3.2.2.
For a factored negative moment of 12,600 in.-kips at Support B, try seven #11 bars, and assuming #3hoops:
As = 7 × 1.54 = 10.92 in.2
d = 32- 1.5 - 3/8 - 1.41/2 = 29.4 in.ρ = 10.92/(29.4 × 22.5) = 0.0165 < 0.025, O.K.b = 22.5 in.Depth of compression block, a = [10.92 (60)]/[0.85 (4) 22.5] = 8.56 in.Design strength, φMn = [0.8 (10.92) 60](29.4 - 8.56/2) = 13,167 in.-kips > 12,600 in.-kips OK
For positive moment at the support, try five #9 bars, which supplies about half the negative momentreinforcement:
As = 5 (1.0) = 5.00 in.2
d = 32 - 1.5 - 3/8 - 1.128/2 = 29.6 in.ρ = 5.00/(29.6 × 22.5) = 0.0075 > 0.033, O.K.b = 86.5 in. (assuming stress block in flange)a = [5.00 (60)]/(0.85 (4) 86.5] = 1.02 in.φMn = [0.8 (5.00) 60] (29.6 - 1.02/2) = 6,982 in.-kips.
This moment is larger than the design moment and, as required by ACI 318 Sec. 21.3.2.2, is greater than50 percent of the negative moment capacity at the face of the support.
For positive moment at midspan the same five #9 bars used for positive moment at the support will betried:
As = 5 (1.0) = 5.00 in.2
d = 20 - 1.5 - 3/8 - 1.128/2 = 17.6 in.ρ =5.00/(17.6 × 22.5) = 0.0126b = 86.5 in.a = [5.00 (60)]/[0.85 (4) 86.5] = 1.02 in.φMn = [0.8 (5.00) 60] (17.6 - 1.02/2) = 4,102 in.-kips > 3,282 in.-kips. OK
The five #9 bottom bars are adequate for strength and satisfy ACI 318 Sec. 21.3.2.2, which requires thatthe positive moment capacity be not less than 25 percent of the negative moment capacity at the face ofthe support.
For negative moment in the 20-ft span between the haunches, four #11 bars (ρ = 0.016) could be used atthe top. These bars provide a strength greater than 25 percent of the negative moment capacity at thesupport. Using four bars across the top also eliminates the possibility that a negative moment hinge willform at the end of the haunch (8 ft-9 in. from the face of the support) when the 0.68D - E loadcombination is applied. These four top bars are part of the negative moment reinforcement already sized

Chapter 6, Reinforced Concrete
6-61
for negative moment at the support. The other three bars extending from the support are not needed fornegative moment in the constant depth region and would be cut off approximately 6 ft beyond thehaunch; however, this detail results in a possible bar cutoff in a plastic hinge region (see below) that is notdesirable. Another alternative would be to extend all seven #11 bars across the top and thereby avoid thebar cutoff in a possible plastic hinge region; however, seven #11 bars in 20-in. deep portion of the girderprovide ρ = 0.028, which is a violation of ACI 21.3.2.1 (ρmax = 0.025). The violation is minor and will beaccepted in lieu of cutting off the bars in a potential plastic hinge region. Note that these bars provide anegative design moment capacity of 6,824 in.-kips in the constant depth region of the girder.
The layout of longitudinal reinforcement used for the haunched girder is shown in Figure 6-27c, and theflexural strength envelope provided by the reinforcement is shown in Figure 6-27b. As noted in Table6-13, the hooked #11 bars can be developed in the confined core of the columns. Finally, where seven#11 top bars are used, the spacing between bars is approximately 1.4 in., which is greater than thediameter of a #11 bar and is therefore acceptable. This spacing should accommodate the vertical columnreinforcement.
Under combined gravity and earthquake load, a negative moment plastic hinge will form at the supportand, based on the moment envelopes from the loading (Figure 6-27b), the corresponding positive momenthinge will form in the constant depth portion of the girder. As discussed in the following sections, theexact location of plastic hinges must be determined in order to design the transverse reinforcement.
6.4.5.4.2 Design and Detailing of Transverse Reinforcement
The design for shear of the haunched girder is complicated by its variable depth; therefore, a tabularapproach is taken for the calculations. Before the table may be set up, however, the maximum probablestrength must be determined for negative moment at the support and for positive moment in the constantdepth region,
For negative moment at the face of the support and using seven #11 bars:
As = 7 (1.56) = 10.92 in.2
d = 32 - 1.5 - 3/8 - 1.41/2 = 29.4 in.b = 22.5 in.a = [10.92 (1.25) 60]/[0.85 (4) 22.5] = 10.71 in.Mpr = 1.0(10.92)(1.25)(60)(29.4 - 10.71/2) = 19,693 in.-kips.
For positive moment in the constant depth region and using five #9 bars:
As = 5 (1.0) = 5.00 in.2
d = 20 - 1.5 - 3/8 - 1.128/2 = 17.6 in.b = 86.5 in.a = [5.00 (1.25) 60]/[0.85 (4) 86.5] = 1.28 in.Mpr = [1.0 (5.00) 1.25 (60)] (17.6 - 1.28/2) = 6,360 in.-kips
Before the earthquake shear may be determined, the location of the positive moment hinge that will formin the constant depth portion of the girder must be identified. To do so, consider the free-body diagram ofFigure 6-28a. Summing moments (clockwise positive) about point B gives:
2
02pr pr
wxM M Rx+ −+ + − =
At the positive moment hinge the shear must be zero, thus R – wx = 0
FEMA 451, NEHRP Recommended Provisions: Design Examples
4The equation for the location of the plastic hinge is only applicable if the hinge forms in the constant depth region of the girder. If the computed distance x is greater than 28 ft - 9 in. (345 in.), the result is erroneous and a trial and error approach is required tofind the actual hinge location.
6-62
By combining the above equations:
2( )pr prM Mx
w
+ −+=
Using the above equation with Mpr as computed and w = 1.42(3.38) + 0.5(0.90) = 5.25 k/ft = 0.437 k/in.,x = 345 in., which is located exactly at the point where the right haunch begins.4
The reaction is computed as R = 345 (0.437) = 150.8 kips.
The earthquake shear is computed as VE = R = wL/2 = 150.8-(0.437)(450)/2 = 52.5 kips
This earthquake shear is smaller than would have been determined if the positive moment hinge hadformed at the face of support.
The earthquake shear is constant along the span but changes sign with the direction of the earthquake. InFigure 6-28a, this shear is shown for the equivalent lateral seismic forces acting to the west. The factoredgravity load shear (1.42VD + 0.5VL) varies along the length of the span as shown in Figure 6-28b. AtSupport A, the earthquake shear and factored gravity shear are additive, producing a design ultimate shearof 150.8 kips. At midspan, the shear is equal to the earthquake shear acting alone and, at Support C, theultimate design shear is -45.8 kips. Earthquake, gravity, and combined shears are shown in Figures 6-28athrough 6-28c and are tabulated for the first half of the span in Table 6-16. For earthquake forces actingto the east, the design shears are of the opposite sign of those shown in Figure 6-28.
According to ACI 318 Sec. 21.3.4.2, the contribution of concrete to member shear strength must be takenas zero when VE/VU is greater than 0.5 and Pu/Agf!c is less than 0.05. As shown in Table 6-16, the VE/VUratio is less than 0.5 within the first three-fourths of the haunch length but is greater than 0.50 beyond thispoint. In this example, it is assumed that if VE/VU is less than 0.5 at the support, the concrete strength canbe used along the entire length of the member.
The concrete contribution to the design shear strength is computed as:
'(0.85)2c c wV f b dφ φ=
where the ASCE 7 compatible φ = 0.75 for shear, and the 0.85 term is the shear strength reduction factorfor sand-LW concrete. [Note that this is the basic strength reduction factor for shear per ACI 318-02 Sec9.3. See Sec 6.4.2 for discussion.] The remaining shear, φVs = Vu - φVc, must be resisted by closed hoopswithin a distance 2d from the face of the support and by stirrups with the larger of 6dh or 3.0 in. hookextensions elsewhere. The 6dh or 3.0 in. “seismic hook” extension is required by ACI 318 Sec. 21.3.3.3.
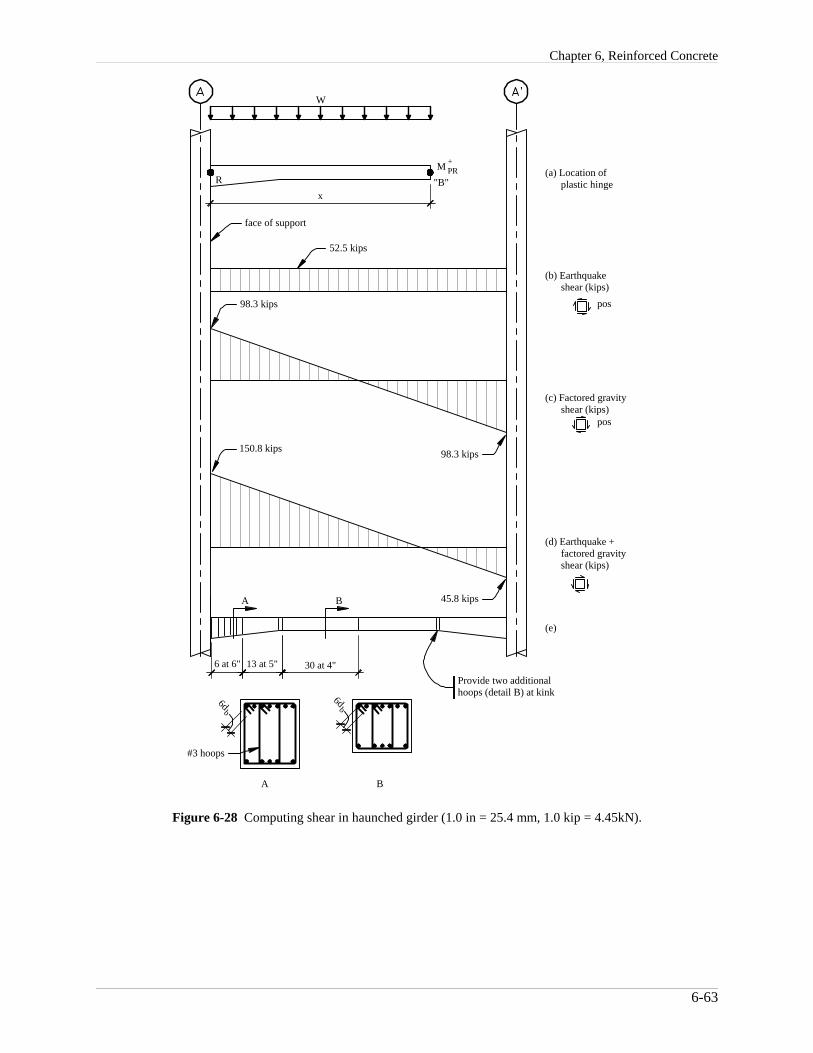
Chapter 6, Reinforced Concrete
6-63
45.8 kips
(a) Location of plastic hinge
+PR
'
(b) Earthquake shear (kips)
(c) Factored gravity shear (kips)
pos
pos
(d) Earthquake + factored gravity shear (kips)
(e)
98.3 kips150.8 kips
98.3 kips
52.5 kips
face of support
M"B"
Provide two additionalhoops (detail B) at kink
A B
A B
6 at 6" 13 at 5" 30 at 4"
#3 hoops
6db
6db
R
W
x
Figure 6-28 Computing shear in haunched girder (1.0 in = 25.4 mm, 1.0 kip = 4.45kN).
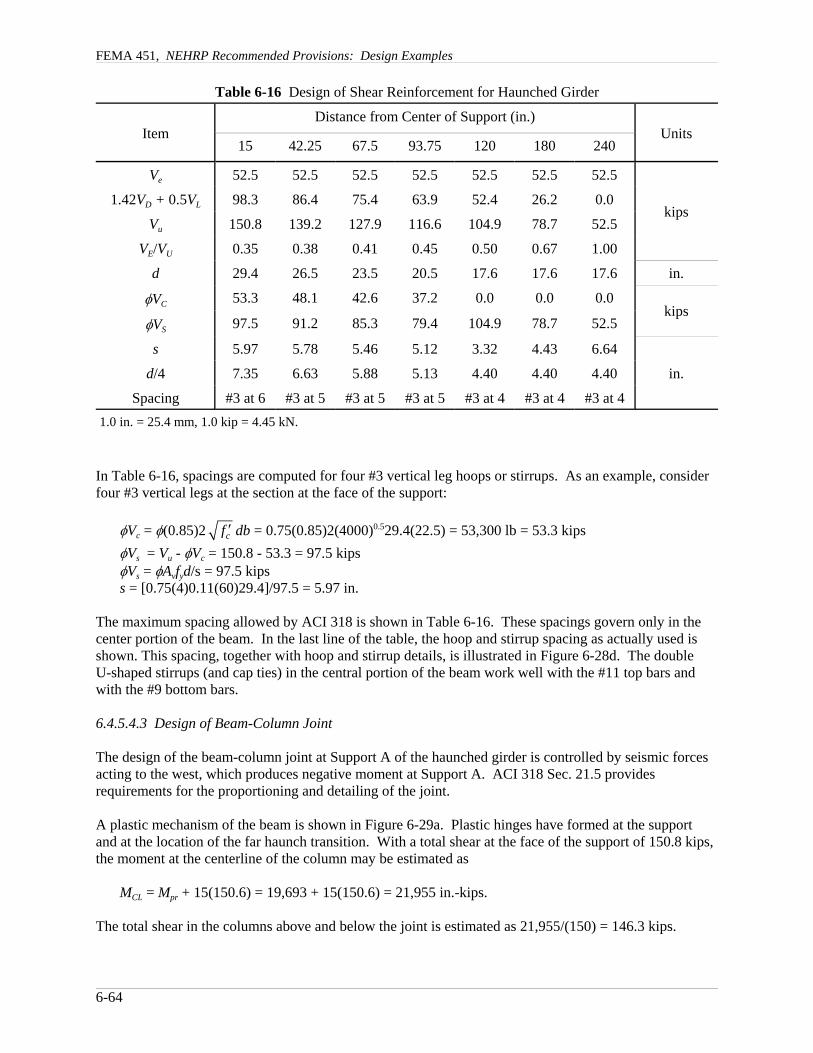
FEMA 451, NEHRP Recommended Provisions: Design Examples
6-64
Table 6-16 Design of Shear Reinforcement for Haunched Girder
ItemDistance from Center of Support (in.)
Units15 42.25 67.5 93.75 120 180 240
Ve 52.5 52.5 52.5 52.5 52.5 52.5 52.5
kips1.42VD + 0.5VL 98.3 86.4 75.4 63.9 52.4 26.2 0.0
Vu 150.8 139.2 127.9 116.6 104.9 78.7 52.5
VE/VU 0.35 0.38 0.41 0.45 0.50 0.67 1.00
d 29.4 26.5 23.5 20.5 17.6 17.6 17.6 in.
φVC 53.3 48.1 42.6 37.2 0.0 0.0 0.0kips
φVS 97.5 91.2 85.3 79.4 104.9 78.7 52.5
s 5.97 5.78 5.46 5.12 3.32 4.43 6.64
in.d/4 7.35 6.63 5.88 5.13 4.40 4.40 4.40
Spacing #3 at 6 #3 at 5 #3 at 5 #3 at 5 #3 at 4 #3 at 4 #3 at 41.0 in. = 25.4 mm, 1.0 kip = 4.45 kN.
In Table 6-16, spacings are computed for four #3 vertical leg hoops or stirrups. As an example, considerfour #3 vertical legs at the section at the face of the support:
φVc = φ(0.85)2 db = 0.75(0.85)2(4000)0.529.4(22.5) = 53,300 lb = 53.3 kipscf ′φVs = Vu - φVc = 150.8 - 53.3 = 97.5 kipsφVs = φAvfyd/s = 97.5 kipss = [0.75(4)0.11(60)29.4]/97.5 = 5.97 in.
The maximum spacing allowed by ACI 318 is shown in Table 6-16. These spacings govern only in thecenter portion of the beam. In the last line of the table, the hoop and stirrup spacing as actually used isshown. This spacing, together with hoop and stirrup details, is illustrated in Figure 6-28d. The doubleU-shaped stirrups (and cap ties) in the central portion of the beam work well with the #11 top bars andwith the #9 bottom bars.
6.4.5.4.3 Design of Beam-Column Joint
The design of the beam-column joint at Support A of the haunched girder is controlled by seismic forcesacting to the west, which produces negative moment at Support A. ACI 318 Sec. 21.5 providesrequirements for the proportioning and detailing of the joint.
A plastic mechanism of the beam is shown in Figure 6-29a. Plastic hinges have formed at the support and at the location of the far haunch transition. With a total shear at the face of the support of 150.8 kips,the moment at the centerline of the column may be estimated as
MCL = Mpr + 15(150.6) = 19,693 + 15(150.6) = 21,955 in.-kips.
The total shear in the columns above and below the joint is estimated as 21,955/(150) = 146.3 kips.

Chapter 6, Reinforced Concrete
6-65
(a) Plastic mechanism
- +
(b) Plastic moment(in.-kips)
19,693
10,8006,360
(c) Column shears(kips)
61.1 kips
146.3 kips
146.3 kips
288"
75"
75"
450" 15"15"
Figure 6-29 Computation of column shears for use in jointdesign (1.0 in = 25.4 mm, 1.0 kip = 4.45 kN).
The stresses in the joint are computed from equilibrium considering the reinforcement in the girder to bestressed at 1.25fy. A detail of the joint is shown in Figure 6-30. Compute the joint shear Vj:
Force in the top reinforcement = 1.25Asfy = 1.25(7)1.56(60) = 819 kipsJoint shear = Vj = 819.0 - 146.3 = 672.7 kips
The joint shear stress vj = Vj/dc2 = 672.7/[30 (30)] = 0.819 ksi
In the case being considered, all girders framing into the joint have a width equal to 0.75 times thecolumn dimension so confinement is provided on three faces of the joint. According to ACI 318 Sec.21.5.3, the allowable joint shear stress = 0.75φ(15)2pfc'. The 0.75 term is the strength reduction factor forLW concrete. Compute the allowable joint shear stress:
vj,allowable = 0.75(0.80)15(4,000)0.5
= 569 psi = 0.569 ksi

FEMA 451, NEHRP Recommended Provisions: Design Examples
6-66
T = 819 kips
146 kips
V = 819-146 = 673 kips
30"
J
C = 819 kips
Figure 6-30 Computing joint shear force (1.0 kip =4.45kN).
This allowable stress is significantly less than the applied joint shear stress. There are several ways toremedy the situation:
1. Increase the column size to approximately 35 × 35 (not recommended)
2. Increase the depth of the haunch so that the area of reinforcement is reduced to seven #10 bars. Thiswill reduce the joint shear stress to a value very close to the allowable stress.
2. Use 5000 psi NW concrete for the column. This eliminates the 0.75 reduction factor on allowablejoint stress, and raises the allowable stress to 848 psi.
For the remainder of this example, it is assumed that the lower story columns will be constructed from5000 psi NW concrete.
Because this joint is confined on three faces, the reinforcement within the joint must consist of the sameamount and spacing of transverse reinforcement in the critical region of the column below the joint. Thisreinforcement is detailed in the following section.
6.4.5.5 Design and Detailing of Typical Interior Column of Frame 3
The column supporting the west end of the haunched girder between Gridlines A and B is shown inFigure 6-31. This column supports a total unfactored dead load of 804 kips and a total unfactored liveload of 78 kips. From the ETABS analysis, the axial force on the column from seismic forces is ±129kips. The design axial force and bending moment in the column are based on one or more of the loadcombinations presented below.
Earthquake forces acting to the west are:
Pu = 1.42(804) + 0.5(78) + 1.0(129) = 1310 kips (compression)

Chapter 6, Reinforced Concrete
6-67
Level 5
Level 432
"32
"
12'-6
"
20"
LP = 78.4 kips IncludesP = 803.6 kips level 5D
Figure 6-31 Column loading (1.0 ft = 0.3048 m, 1.0 in = 25.4 mm, 1.0 kip = 4.45kN).
This axial force is greater than 0.1fc'Ag = 360 kips; therefore, according to ACI 318 Sec. 21.4.2.1, thecolumn flexural strength must be at least 6/5 of the nominal strength (using φ = 1.0 and 1.0 fy) of the beamframing into the column. The nominal beam moment capacity at the face of the column is 16,458in.-kips. The column must be designed for six-fifths of this moment, or 19,750 in-kips. Assuming amidheight inflection point for the column above and below the beam, the column moment at thecenterline of the beam is 19,750/2 = 9,875 in.-kips, and the column moment corrected to the face of thebeam is 7,768 in.-kips.
Earthquake forces acting to the east are:
Pu = 0.68(804) - 1.0(129) = 424 kips (compression)
This axial force is greater than 0.1fc'Ag = 360 kips. For this loading, the end of the beam supported by thecolumn is under positive moment, with the nominal beam moment at the face of the column being 8,715 in.-kips. Because Pu > 0.1fc'Ag, the column must be designed for 6/5 of this moment, or 10,458 in.-kips. Assuming midheight inflection points in the column, the column moment at the centerline and the face ofthe beam is 5,229 and 4,113 in.-kips, respectively.
Axial force for gravity alone is:
Pu = 1.6(804) + 1.2(78) = 1,380 kips (compression)

FEMA 451, NEHRP Recommended Provisions: Design Examples
6-68
(12) #10
(12) #9(12) #8
uM (ft-kips)
0
0
500 1,000 1,500 2,000
1,000
2,000
3,000
4,000
5,000
-1,000
-2,000
uP (kips)
Figure 6-32 Interaction diagram and column design forces(1.0 kip = 4.45kN, 1.0 ft-kip = 1.36 kN-m).
This is approximately the same axial force as designed for earthquake forces to the west, but as can beobserved from Figure 6-25, the design moment is significantly less. Hence, this loading will not control.
6.4.5.5.1 Design of Longitudinal Reinforcement
Figure 6-32 shows an axial force-bending moment interaction diagram for a 30 in. by 30 in. column with12 bars ranging in size from #8 to #10. A horizontal line is drawn at each of the axial load levelscomputed above, and the required flexural capacity is shown by a solid dot on the appropriate line. Thecolumn with twelve #8 bars provides more than enough strength for all loading combinations.
6.4.5.5.2 Design of Transverse Reinforcement
In Sec. 6.4.5.3, an interior column supporting Level 5 of Frame 1 was designed. This column has a shearstrength of 198.2 kips, which is significantly greater than the imposed seismic plus gravity shear of 146.3kips. For details on the computation of the required transverse reinforcement for this column, see the“Transverse Reinforcement” and “Transverse Reinforcement Required for Shear” subsections in Sec.6.4.5.3. A detail of the reinforcement of the column supporting Level 5 of Frame 3 is shown in Figure 6-33. The section of the column through the beams shows that the reinforcement in the beam-column jointregion is relatively uncongested.

Chapter 6, Reinforced Concrete
6-69
Level 6
Level 7
30"
30"
30"
(12) #8 bars
#4 hoops
+ +
6 at
4"
4"2"
7 at
4"
5"8
at 6
"5"
7 at
4"
2"
Figure 6-33 Column detail (1.0 in = 25.4 mm).
6.4.5.6 Design of Structural Wall of Frame 3
The factored forces acting on the structural wall of Frame 3 are summarized in Table 6-17. The axialcompressive forces are based on a tributary area of 1,800 square ft for the entire wall, an unfactored deadload of 160 psf, and an unfactored (reduced) live load of 20 psf. For the purposes of this example it isassumed that these loads act at each level, including the roof. The total axial force for a typical floor is:
Pu = 1.42D + 0.5L = 1,800((1.42×0.16) + 0.50x0.02)) = 427 kips for maximum compressionPu = 0.68D = 1,800(0.68×0.16) = 196 kips for minimum compression
The bending moments come from the ETABS analysis. Note the reversal in the moment sign due to theeffects of frame-wall interaction. Each moment contains two parts: the moment in the shear panel and thecouple resulting from axial forces in the boundary elements. For example, at the base of Level 2:

FEMA 451, NEHRP Recommended Provisions: Design Examples
6-70
ETABS panel moment =162,283 in.-kipsETABS column force = 461.5 kipsTotal moment, Mu = 162,283 + 240(461.5) = 273,043 in.-kips
The shears in Table 6-17 also consist of two parts, the shear in the panel and the shear in the column. Using Level 2 as an example:
ETABS panel shear = 527 kipsETABS column shear = 5.90 kipsTotal shear, Vu = 527 + 2(5.90) = 539 kips
As with the moment, note the reversal in wall shear, not only at the top of the wall but also at Level 1where the first floor slab acts as a support. If there is some in-plane flexibility in the first floor slab, or ifsome crushing were to occur adjacent to the wall, the shear reversal would be less significant, or mighteven disappear. For this reason, the shear force of 539 kips at Level 2 will be used for the design ofLevel 1 as well.
Recall from Sec. 6.2.2 that the structural wall boundary elements are 30 in. by 30 in. in size. The basicphilosophy of this design will be to use these elements as “special” boundary elements where a closespacing of transverse reinforcement is used to provide extra confinement. This avoids the need forconfining reinforcement in the wall panel. Note, however, that there is no code restriction on extendingthe special boundary elements into the panel of the wall.
It should also be noted that preliminary calculations (not shown) indicate that a 12-in. thickness of thewall panel is adequate for this structure. This is in lieu of the 18-in. thickness assumed when computingstructural mass.
Table 6-17 Design Forces for Structural Wall
SupportingLevel
Axial Compressive Force Pu (kips) Moment Mu(in.-kips)
Shear Vu(kips)1.42D + 0.5L 0.68D
R121110987654321
427854
1,2811,7082,1352,5622,9893,4163,8434,2704,6975,1245,550
196392588783979
1,1751,3711,5671,7631,9582,1542,3502,546
-30,054-39,725-49,954-51,838-45,929-33,81717,84745,44478,419
117,975165,073273,043268,187
-145-462
118163203240274308348390539
-376 (use 539)1.0 kip = 4.45 kN, 1.0 in.-kip = 0.113 kN-m.

Chapter 6, Reinforced Concrete
6-71
6.4.5.6.1 Design of Panel Shear Reinforcement
First determine the required shear reinforcement in the panel and then design the wall for combinedbending and axial force. The nominal shear strength of the wall is given by ACI 318 Eq. 21-7:
'( )n cv c c n yV A f fα ρ= +
where αc = 2.0 because hw/lw = 155.5/22.5 = 6.91 > 2.0. Note that the length of the wall was taken as thelength between boundary element centerlines (20 ft) plus one-half the boundary element length (2.5 ft) ateach end of the wall.
Using fc' = 4000 psi, fy = 40 ksi, Acv = (270)(12) = 3240 in.2, and taking φ for shear = 0.55, the ratio ofhorizontal reinforcement is computed:
Vu = φVn
539.000 (0.85 2 4,000)3,2400.55 0.0049
3,240(40,000)nρ
⎛ ⎞ − ×⎜ ⎟⎝ ⎠= =
Note that the factor of 0.85 on concrete strength accounts for the use of LW concrete. Reinforcementratios for the other stories are given in Table 6-18. This table gives requirements using fc' = 4,000 psi, aswell as 6,000 psi NW concrete. As shown later, the higher strength NW concrete is required to managethe size of the boundary elements of the wall. Also shown in the table is the required spacing ofhorizontal reinforcement assuming that two curtains of #4 bars will be used. If the required steel ratio isless than 0.0025, a ratio of 0.0025 is used to determine bar spacing.
Table 6-18 Design of Structural Wall for Shear
Level fc' = 4,000 psi (lightweight) fc' = 6,000 psi (normal weight)
Reinforcementratio
Spacing1
(in.)Reinforcement
ratioSpacing *
(in.)
R121110 9 8 7 6 5 4 3 2 1
0.002500.002500.002500.002500.002500.002500.002500.002500.002500.002500.002780.004870.00487
13.33 (12.0)13.33 (12.0)13.33 (12.0)13.33 (12.0)13.33 (12.0)13.33 (12.0)13.33 (12.0)13.33 (12.0)13.33 (12.0)13.33 (12.0)12.00 (6.0)6.84 (6.0)6.84 (6.0)
0.002500.002500.002500.002500.002500.002500.002500.002500.002500.002500.002500.003690.00369
13.33 (12.0)13.33 (12.0)13.33 (12.0)13.33 (12.0)13.33 (12.0)13.33 (12.0)13.33 (12.0)13.33 (12.0)13.33 (12.0)13.33 (12.0)13.33 (9.0)9.03 (9.0)9.03 (9.0)
* Values in parentheses are actual spacing used.1.0 in. = 25.4 mm.
For LW concrete, the required spacing is 6.84 in. at Levels 1 and 2. Minimum reinforcementrequirements control all other levels. For the final design, it is recommended to use a 6-in. spacing at

FEMA 451, NEHRP Recommended Provisions: Design Examples
6-72
Levels 1, 2, and 3 and a 12-in. spacing at all levels above. The 6-in. spacing is extended one level higherthat required because it is anticipated that an axial-flexural plastic hinge could propagate this far.
For the NW concrete, the required spacing is 9.03 in. at Levels 1 and 2 and minimum reinforcementrequirements control elsewhere. For the final design, a 9-in. spacing would be used at Levels 1, 2, and 3with a 12-in. spacing at the remaining levels.
ACI 318 Sec. 21.6.4.3 [21.7.4.3] requires the vertical steel ratio to be greater than or equal to thehorizontal steel ratio if hwl/lw is less than 2.0. As this is not the case for this wall, the minimum verticalreinforcement ratio of 0.0025 is appropriate. Vertical steel consisting of two curtains of #4 bars at 12 in.on center provides a reinforcement ratio of 0.0028, which ill be used at all levels.
6.4.5.6.2 Design for Flexure and Axial Force
The primary consideration in the axial-flexural design of the wall is determining whether or not specialboundary elements are required. ACI 318 provides two methods for this. The first approach, specified inACI 318 Sec. 21.6.6.2 [21.7.6.2], uses a displacement based procedure. The second approach, describedin ACI 318 Sec. 21.6.6.3 [21.7.6.3], is somewhat easier to implement but, due to its empirical nature, isgenerally more conservative. In the following presentation, only the displacement based method will beused for the design of the wall.
Using the displacement based approach, boundary elements are required if the length of the compressionblock, c, satisfies ACI 318 Eq. 21-8:
600( )w
u w
lchδ
≥
where δu is the total elastic plus inelastic deflection at the top of the wall. From Table 6-9b, the totalelastic roof displacement is 4.36 in., and the inelastic drift is Cd times the elastic drift, or 6.5(4.36) = 28.4in. or 2.37 feet. Recall that this drift is based on cracked section properties assuming Icracked = 0.5 Igross andassuming that flexure dominates. Using this value together with lw = 22.5 ft, and hw = 155.5 ft:
22.5 2.46 ft = 29.52 in.600( ) 600(2.37 155.5)
w
u w
lhδ
= =
To determine if c is greater than this value, a strain compatibility analysis must be performed for the wall. In this analysis, it is assumed that the concrete reaches a maximum compressive strain of 0.003 and thewall reinforcement is elastic-perfectly plastic and yields at the nominal value. A rectangular stress blockwas used for concrete in compression, and concrete in tension was neglected. A straight line straindistribution was assumed (as allowed by ACI 318 Sec. 21.6.5.1 [21.7.5.1]). Using this straight linedistribution, the extreme fiber compressive strain was held constant at 0.003, and the distance c wasvaried from 100,000 in. (pure compression) to 1 in. (virtually pure tension). For each value of c, a totalcross sectional nominal axial force (Pn) and nominal bending moment (Mn) were computed. Using thesevalues, a plot of the axial force (Pn) versus neutral axis location (c) was produced. A design value axialforce-bending moment interaction diagram was also produced.
The analysis was performed using an Excel spreadsheet. The concrete was divided into 270 layers, eachwith a thickness of 1 in. The exact location of the reinforcement was used. When the reinforcement wasin compression, an adjustment was made to account for reinforcement and concrete sharing the samephysical volume.

Chapter 6, Reinforced Concrete
6-73
-4,000
-2,000
0
2,000
4,000
6,000
8,000
10,000
12,000
14,000
16,000
18,000
0 100,000 200,000 300,000 400,000 500,000 600,000 700,000 800,000
Bending moment, in.-kips
Axi
al fo
rce,
kip
s
1.42D + 0.5L
0.68 D
6 ksi NW
4 ksi LW
Figure 6-34 Interaction diagram for structural wall (1.0 kip = 4.45kN, 1.0 in.-kip = 0.113 kN-m).
Two different sections were analyzed: one with fc' = 4,000 psi (LW concrete) and the other with fc' =6,000 psi (NW concrete). In each case, the boundary elements were assumed to be 30 in. by 30 in. andthe panel was assumed to be 12 in. thick. Each analysis also assumed that the reinforcement in theboundary element consisted of twelve #9 bars, producing a reinforcement ratio in the boundary elementof 1.33 percent. Panel reinforcement consisted of two curtains of #4 bars spaced at approximately 12 in.on center. For this wall the main boundary reinforcement has a yield strength of 60 ksi, and the verticalpanel steel yields at 40 ksi.
The results of the analysis are shown in Figures 6-34 and 6-35. The first of these figures is the nominalinteraction diagram multiplied by φ = 0.65 for tied sections. Also plotted in the figure are the factoredP-M combinations from Table 6-17. The section is clearly adequate for both 4,000 psi and 6,000 psiconcrete because the interaction curve fully envelopes the design values.

FEMA 451, NEHRP Recommended Provisions: Design Examples
6-74
-3,000
-1,000
1,000
3,000
5,000
7,000
9,000
11,000
13,000
15,000
0 50 100 150 200 250
Neutral axis location, in.
Fact
ored
axi
al fo
rce,
kip
s
6 ksi NW
4 ksi LW
0
Figure 6-35 Variation of neutral axis depth with compressive force (1.0 in = 25.4 mm, 1.0 kip = 4.45kN).
Figure 6-35 shows the variation in neutral axis depth with axial force. For a factored axial force of 5,550kips, the distance c is approximately 58 in. for the 6,000 psi NW concrete and c is in excess of 110 in. forthe 4,000 psi LW concrete. As both are greater than 29.52 in., special boundary elements are clearlyrequired for the wall.
According to ACI 318 Sec. 21.6.6.4 [21.7.6.4], the special boundary elements must have a plan length ofc - 0.1lw, or 0.5c, whichever is greater. For the 4,000 psi concrete, the first of these values is 110 -0.1(270) = 83 in., and the second is 0.5(110) = 55 in. Both of these are significantly greater than the 30in. assumed in the analysis. Hence, the 30-in. boundary element is not adequate for the lower levels ofthe wall if fc' = 4,000 psi. For the 6,000 psi concrete, the required length of the boundary element is58-0.1(270) = 31 in., or 0.5(58) = 29 in. The required value of 31 in. is only marginally greater than the30 in. provided and will be deemed acceptable for the purpose of this example.
The vertical extent of the special boundary elements must not be less than the larger of lw or Mu/4Vu. Thewall length lw = 22.5 ft and, of the wall at Level 1, Mu/4Vu = 273,043/4(539) =126.6 in., or 10.6 ft. 22.5 ftcontrols and will be taken as the required length of the boundary element above the first floor. Thespecial boundary elements will begin at the basement level, and continue up for the portion of the wallsupporting Levels 2 and 3. Above that level, boundary elements will still be present, but they will not bereinforced as special boundary elements.
Another consideration for the boundary elements is at what elevation the concrete may change from 6,000psi NW to 4,000 LW concrete. Using the requirement that boundary elements have a maximum plandimension of 30 in., the neutral axis depth (c) must not exceed approximately 57 in. As may be seen fromFigure 6-35, this will occur when the factored axial force in the wall falls below 3,000 kips. From Table6-17, this will occur between Levels 6 and 7. Hence, 6,000 psi concrete will be continued up throughLevel 7. Above Level 7, 4,000 psi LW concrete may be used.

Chapter 6, Reinforced Concrete
6-75
(12) #9
#5at 5" o.c. Alternatelocation of 90° bend
4"
4"
#5 at 5" o.c.
4"
#5 xdeveloped in wall
Figure 6-36 Details of structural wall boundary element (1.0 in = 25.4 mm).
Where special boundary elements are required, transverse reinforcement must conform to ACI 318 Sec.21.6.6.4(c) [21.7.6.4(c)], which refers to Sec. 21.4.4.1 through 21.4.4.3. If rectangular hoops are used,the transverse reinforcement must satisfy ACI 318 Eq. 21-4:
0.09 csh c
yh
fA shf′
=
If #5 hoops are used in association with two crossties in each direction, Ash = 4(0.31) = 1.24 in.2, and hc =30 - 2(1.5) - 0.525 = 26.37 in. With fc' = 6 ksi and fyh = 60 ksi:
1.24 5.2260.09(26.37)60
s = =
If 4,000 psi concrete is used, the required spacing increases to 7.83 in.
Maximum spacing is the lesser of h/4, 6db, or sx where sx = 4 + (14-hx)/3. With hx = 8.83 in., the third ofthese spacings controls at 5.72 in. The 5.22-in. spacing required by ACI 318 Eq. 21-4 is less than this, soa spacing of 5 in. on center will be used wherever the special boundary elements are required.
Details of the panel and boundary element reinforcement are shown in Figures 6-36 and 6-37,respectively. The vertical reinforcement in the boundary elements will be spliced as required using Type2 mechanical splices at all locations. According to Table 6-13 (prepared for 4,000 psi LW concrete),there should be no difficulty in developing the horizontal panel steel into the 30-in.-by-30-in. boundaryelements.

FEMA 451, NEHRP Recommended Provisions: Design Examples
6-76
#5 at 4"
(24) #11
#4 at 12" EF
#4 at 6" EF
Cla
ss B
Cla
ss B
#5 at 4"
#4 at 12" EF
#4 at 6" EF
#5 at 4"
(24) #11
#4 at 12"EW-EFSee figure
6-26
#4 at 12"EW-EF
#4 at 4"
(24) #9
#4 at 12"EW-EF
#4 at 4"#4 at 12"
EW-EF
#4 at 4"
(24) #10
#4 at 12"EW-EF
#4 at 4"#4 at 12"
EW-EF
Cla
ss BC
lass B
See figure6-26
(12) #9
#4 at 12" EF
#4 at 12" EF
See figure6-26
(12) #9
#4 at 12" EF
#4 at 12" EF
See figure6-26
#4 at 12" EF
#4 at 12" EF
See figure6-26
#4 at 12" EF
#4 at 12" EF
See figure6-26
#4 at 12" EF
#4 at 12" EF
cf' = 4.0ksi(LW)
cf' =6.0ksi(NW)
cf' = 4.0ksi(LW)
Figure 6-37 Overall details of structural wall (1.0 in = 25.4 mm).
ACI 318 Sec. 21.6.6.4(d) [21.7.6.4(d)] also requires that the boundary element transverse reinforcementbe extended into the foundation tie beam a distance equal to the tension development length of the #9 barsused as longitudinal reinforcement in the boundary elements. Assuming the tie beam consists of 6,000 psiNW concrete, the development length for the #9 bar is 2.5 times the value given by ACI 318 Eq. 21-6:
60,000(1.128)2.5 2.5 33.6 in.65 6,00065
y bd
c
f dl
f
⎡ ⎤⎢ ⎥= = =⎢ ⎥′⎣ ⎦
Hence, the transverse boundary element reinforcement consisting of #5 hoops with two crossties in eachdirection, spaced at 5 in. on center, will extend approximately 3 ft into the foundation tie beam.
6.5 STRUCTURAL DESIGN OF THE HONOLULU BUILDING
The structure illustrated in Figure 6-1 and 6-2 is now designed and detailed for the Honolulu building. Because of the relatively moderate level of seismicity, the lateral load resisting system will consist of aseries of intermediate moment-resisting frames in both the E-W and N-S directions. This is permitted forSeismic Design Category C buildings under Provisions Sec. 9.6 [9.4]. Design guidelines for thereinforced concrete framing members are provided in ACI 318 Sec. 21.10 [21.12].

Chapter 6, Reinforced Concrete
6-77
Preliminary design for the Honolulu building indicated that the size of the perimeter frame girders couldbe reduced to 30 in. deep by 20 in. wide (the Berkeley building has girders that are 32 in. deep by 22.5 in.wide) and that the columns could be decreased to 28 in. square (the Berkeley building uses 30-in.-by-30-in. columns). The haunched girders along Frames 2 through 7 have a maximum depth of 30 in. and awidth of 20 in. in the Honolulu building (the Berkeley building had haunches with a maximum depth of32 in. and a width of 22.5 in.). The Frame 2 through Frame 7 girders in Bays B-C have a constant depthof 30 in. Using these reduced properties, the computed drifts will be increased over those shown inFigure 6-6, but will clearly not exceed the drift limits.
6.5.1 Material Properties
ACI 318 has no specific limitations for materials used in structures designed for moderate seismic risk.For the Honolulu building, 4,000 psi sand-LW concrete is used with ASTM A615 Grade 60 rebar forlongitudinal reinforcement and Grade 60 or Grade 40 rebar for transverse reinforcement.
6.5.2 Combination of Load Effects
For the design of the Honolulu building, all masses and superimposed gravity loads generated for theBerkeley building are used. This is conservative because the members for the Honolulu building areslightly smaller than the corresponding members for the Berkeley building. Also, the Honolulu buildingdoes not have reinforced concrete walls on Gridlines 3, 4, 5, and 6 (these walls are replaced by infilled,nonstructural masonry designed with gaps to accommodate frame drifts in the Honolulu building).
Provisions Sec. 5.2.7 [4.2.2] and Eq. 5.2.7-1 and 5.2.7-2 [4.2-1 and 4.2-2] require a combination of loadeffects to be developed on the basis of ASCE 7, except that the earthquake load (E) is defined as:
0.2E DSE Q S Dρ= +
when gravity and seismic load effects are additive and as:
0.2E DSE Q S Dρ= −
when the effects of seismic load counteract gravity.
For Seismic Design Category C buildings, Provisions Sec. 5.2.4.1 [4.3.3.1] permits the reliability factor(ρ) to be taken as 1.0. The special load combinations of Provisions Eq. 5.2.7-1 and 5.2.7-2 [4.2-3 and4.2-4] do not apply to the Honolulu building because there are no discontinuous elements supportingstiffer elements above them. (See Provisions Sec. 9.6.2 [9.4.1].)
For the Honolulu structure, the basic ASCE 7 load combinations that must be considered are:
1.2D + 1.6L1.2D + 0.5L ± 1.0E0.9D ± 1.0E
The ASCE 7 load combination including only 1.4 times dead load will not control for any condition inthis building.

FEMA 451, NEHRP Recommended Provisions: Design Examples
6-78
Substituting E from the Provisions and with ρ taken as 1.0, the following load combinations must be usedfor earthquake:
(1.2 + 0.2SDS)D + 0.5L + E(1.2 + 0.2SDS)D + 0.5L - E(0.9 - 0.2SDS)D + E(0.9 - 0.2SDS)D -E
Finally, substituting 0.472 for SDS (see Sec. 6.1.1), the following load combinations must be used forearthquake:
1.30D + 0.5L + E1.30D + 0.5L - E0.80D + E0.80D - E
Note that the coefficients on dead load have been slightly rounded to simplify subsequent calculations.
As E-W wind loads apparently govern the design at the lower levels of the building (see Sec. 6.2.6 andFigure 6-4), the following load combinations should also be considered:
1.2D + 0.5L + 1.6W1.2D + 0.5L - 1.6W0.9D - 1.6W
The wind load (W) from ASCE 7 includes a directionality factor of 0.85.
It is very important to note that use of the ASCE 7 load combinations in lieu of the combinations given inACI 318 Chapter 9 requires use of the alternate strength reduction factors given in ACI 318 Appendix C:
Flexure without axial load φ = 0.80Axial compression, using tied columns φ = 0.65 (transitions to 0.8 at low axial loads)Shear if shear strength is based on nominal axial-flexural capacity φ = 0.75Shear if shear strength is not based on nominal axial-flexural capacity φ = 0.55Shear in beam-column joints φ = 0.80
[The strength reduction factors in ACI 318-02 have been revised to be consistent with the ASCE 7 loadcombinations. Thus, the factors that were in Appendix C of ACI 318-99 are now in Chapter 9 of ACI318-02, with some modification. The strength reduction factors relevant to this example as contained inACI 318-02 Sec. 9.3 are:
Flexure without axial load φ = 0.9 (tension-controlled sections)Axial compression, using tied columns φ = 0.65 (transitions to 0.9 at low axial loads)Shear if shear strength is based o nominal axial-flexural capacity φ = 0.75Shear if shear strength is not based o nominal axial-flexural capacity φ = 0.60Shear in beam-column joints φ = 0.85]
6.5.3 Accidental Torsion and Orthogonal Loading (Seismic Versus Wind)
As has been discussed and as illustrated in Figure 6-4, wind forces appear to govern the strengthrequirements of the structure at the lower floors, and seismic forces control at the upper floors. Theseismic and wind shears, however, are so close at the midlevels of the structure that a careful evaluation
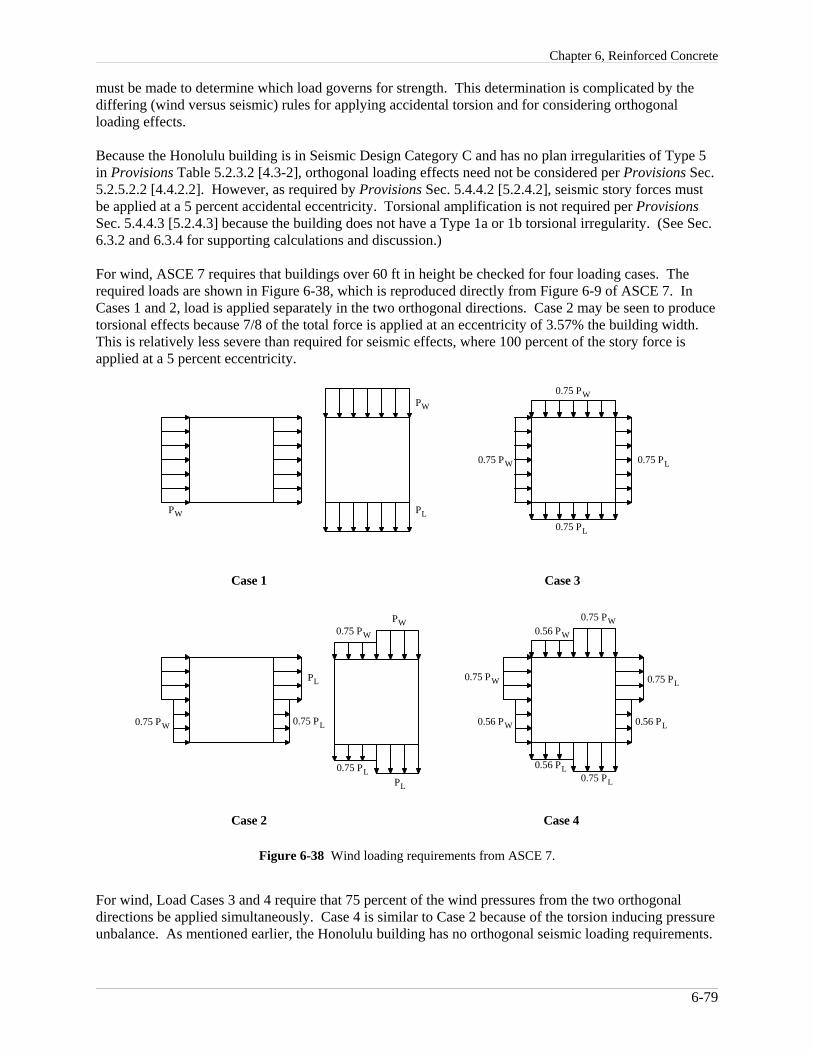
Chapter 6, Reinforced Concrete
6-79
PW
L
PL
PW
Case 1
0.75 PL
Case 3
0.75 PL
0.75 PW
0.75 PW
Case 2 Case 4
0.75 PW0.56 PW
0.75 PL
0.56 PL0.56 PW
0.75 PW
L
0.56 PL
PW
0.75 PL0.75 PW
0.75 PL
0.75 PW
0.75 P
LP
P
Figure 6-38 Wind loading requirements from ASCE 7.
must be made to determine which load governs for strength. This determination is complicated by thediffering (wind versus seismic) rules for applying accidental torsion and for considering orthogonalloading effects.
Because the Honolulu building is in Seismic Design Category C and has no plan irregularities of Type 5in Provisions Table 5.2.3.2 [4.3-2], orthogonal loading effects need not be considered per Provisions Sec.5.2.5.2.2 [4.4.2.2]. However, as required by Provisions Sec. 5.4.4.2 [5.2.4.2], seismic story forces mustbe applied at a 5 percent accidental eccentricity. Torsional amplification is not required per ProvisionsSec. 5.4.4.3 [5.2.4.3] because the building does not have a Type 1a or 1b torsional irregularity. (See Sec.6.3.2 and 6.3.4 for supporting calculations and discussion.)
For wind, ASCE 7 requires that buildings over 60 ft in height be checked for four loading cases. Therequired loads are shown in Figure 6-38, which is reproduced directly from Figure 6-9 of ASCE 7. InCases 1 and 2, load is applied separately in the two orthogonal directions. Case 2 may be seen to producetorsional effects because 7/8 of the total force is applied at an eccentricity of 3.57% the building width. This is relatively less severe than required for seismic effects, where 100 percent of the story force isapplied at a 5 percent eccentricity.
For wind, Load Cases 3 and 4 require that 75 percent of the wind pressures from the two orthogonaldirections be applied simultaneously. Case 4 is similar to Case 2 because of the torsion inducing pressureunbalance. As mentioned earlier, the Honolulu building has no orthogonal seismic loading requirements.

FEMA 451, NEHRP Recommended Provisions: Design Examples
6-80
In this example, only loading in the E-W direction is considered. Hence, the following lateral loadconditions were applied to the ETABS model:
100% E-W Seismic applied at 5% eccentricityASCE 7 Wind Case 1 applied in E-W direction onlyASCE 7 Wind Case 2 applied in E-W direction onlyASCE 7 Wind Case 3ASCE 7 Wind Case 4
All cases with torsion are applied in such a manner as to maximize the shears in the elements of Frame 1.
6.5.4 Design and Detailing of Members of Frame 1
In this section, the girders and a typical interior column of Level 5 of Frame 1 are designed and detailed. For the five load cases indicated above, the girder shears produced from seismic effects control at the fifthlevel, with the next largest forces coming from direct E-W wind without torsion. This is showngraphically in Figure 6-39, where the shears in the exterior bay of Frame 1 are plotted vs. story height. Wind controls at the lower three stories and seismic controls for all other stories. This is somewhatdifferent from that shown in Figure 6-4, wherein the total story shears are plotted and where windcontrolled for the lower five stories. The basic difference between Figures 6-4 and 6-39 is that Figure 6-39 includes accidental torsion and, hence, Frame 1 sees a relatively larger seismic shear.

Chapter 6, Reinforced Concrete
6-81
0
20
40
60
80
100
120
140
160
0 5 10 15 20 25 30 35 40
Girder shear, kips
Hei
ght,
ft
Seismic (with torsion)
Wind (without torsion)
Figure 6-39 Wind vs. seismic shears in exterior bay of Frame 1 (1.0 ft = 0.3048 m, 1.0 kip = 4.45kN).
6.5.4.1 Initial Calculations
The girders of Frame 1 are 30 in. deep and 20 in. wide. For positive moment bending, the effective widthof the compression flange is taken as 20 + 20(12)/12 = 40.0 in. Assuming 1.5 in. cover, #3 stirrups and#8 longitudinal reinforcement, the effective depth for computing flexural and shear strength is 27.6 in.
6.5.4.2 Design of Flexural Members
ACI 318 Sec. 21.10.4 [21.12.4] gives the minimum requirements for longitudinal and transversereinforcement in the beams of intermediate moment frames. The requirements for longitudinal steel areas follows:
1. The positive moment strength at the face of a joint shall be at least one-third of the negative momentstrength at the same joint.
2. Neither the positive nor the negative moment strength at any section along the length of the membershall be less than one-fifth of the maximum moment strength supplied at the face of either joint.

FEMA 451, NEHRP Recommended Provisions: Design Examples
6-82
2,835
2,835
2,886
2,852
2,796
2,492
502802
573 502
729729 729 729
502
155
176
247 225 225
155 155
225225
3,526 3,658
969
2,394 1,850850
3,946 3,927
2,302 2,269850
3,910
2,252
3,910
2,252 1.3D+0.5L+E0.8D - E
1.2D+1.6L
(a)Span layoutand loading
(b)Earthquake moment(in.-kips)
(c)Unfactored DL moment(in.-kips)
(d)Unfactored LL moment(in.-kips)
(e)Required strengthenvelopes (in.-kips)
17.67'20.0' 20.0' 20.0'
'W = 0.66 kips/ftW = 2.14 kips/ft
LD
Figure 6-40 Bending moment envelopes at Level 5 of Frame 1 (1.0 ft = 0.3048 m, 1.0 kip/ft= 14.6 kN/m, 1.0 in.-kip = 0.113 kN-m).
The second requirement has the effect of requiring top and bottom reinforcement along the full length ofthe member. The minimum reinforcement ratio at any section is taken from ACI 318 Sec. 10.5.1 as 200/fyor 0.0033 for fy = 60 ksi. However, according to ACI 318 Sec. 10.5.3, the minimum reinforcementprovided need not exceed 1.3 times the amount of reinforcement required for strength.
The gravity loads and design moments for the first three spans of Frame 1 are shown in Figure 6-40. Theseismic moments are taken directly from the ETABS analysis, and the gravity moments were computedby hand using the ACI coefficients. All moments are given at the face of the support. The gravitymoments shown in Figures 6-40c and 6-40d are slightly larger than those shown for the Berkeley building(Figure 6-14) because the clear span for the Honolulu building increases due to the reduction in columnsize from 30 in. to 28 in.
Based on preliminary calculations, the reinforcement layout of Figure 6-41 will be checked. Note that thesteel clearly satisfies the detailing requirements of ACI 318 Sec. 21.10.4 [21.12.4].

Chapter 6, Reinforced Concrete
6-83
' '
(1) #7(2) #8
20'-0"
30"
28" 48"
#3x stirrups spaced fromeach support: 1 at 2", 10 at 6",5 at 8" (typical each span).
(3) #8(2) #8
(3) #8(2) #8
(3) #8(2) #8
(1) #7 (1) #7(2) #8
(1) #7(3) #7(3) #7
5'-0"
(typical)
Figure 6-41 Preliminary reinforcement layout for Level 5 of Frame 1 (1.0 in = 25.4mm, 1.0 ft = 0.3048 m).
6.5.4.2.1 Design for Negative Moment at Face of Support A
Mu = -1.3 (502) - 0.5 (155) - 1.0 (2,796) = -3,526 in.-kips
Try three #7 short bars and two #8 long bars.
As = 3 (0.60) + 2 (0.79) = 3.38 in.2
ρ = 0.0061Depth of compression block, a = [3.38 (60)]/[0.85 (4) 20] = 2.98 in.Nominal moment capacity, Mn = Asfy(d - a/2) = [3.38 (60.0)] [27.6 - 2.98/2] = 5,295 in.-kipsDesign capacity, φMn = 0.8(5,295) = 4,236 in.-kips > 3,526 in.-kips OK
6.5.4.2.2 Design for Positive Moment at Face of Support A
Mu = -0.8 (502) + 1.0 (2,796) = 2,394 in.-kips
Try three #8 long bars.
Asfy = 3 (0.79) = 2.37 in.2
ρ = 0.0043a = 2.37 (60)/[0.85 (4) 40] = 1.05 in.Mn = Asfy(d - a/2) = [2.37 (60.0)][27.6 - 1.05/2] = 3,850 in.-kipsφMn = 0.8(3850) = 3,080 in.-kips > 2,394 in.-kips OK
This reinforcement also will work for positive moment at all other supports.
6.5.4.2.3 Design for Negative Moment at Face of Support A'
Mu = -1.3 (729) - 0.5 (225) - 1.0 (2,886) = 3,946 in.-kips
Try four #8 long bars and one #7 short bar:
As = 4 (0.79) + 1 (0.6) = 3.76 in.2
ρ = 0.0068

FEMA 451, NEHRP Recommended Provisions: Design Examples
6-84
a = [3.76 (60)]/[0.85 (4) 20] = 3.32 in.Mn = Asfy(d - a/2) = [3.76 (60.0)][27.6 - 3.32/2] = 5,852 in.-kipsφMn = 0.8(5,852) = 4,681 in.-kips > 3,946 in.-kips OK
This reinforcement will also work for negative moment at Supports B and C. Therefore, the flexuralreinforcement layout shown in Figure 6-41 is adequate. The top short bars are cut off 5 ft-0 in. from theface of the support. The bottom bars are spliced in Spans A'-B and C-C' with a Class B lap length of 48in. Unlike special moment frames, there are no requirements that the spliced region of the bars inintermediate moment frames be confined by hoops over the length of the splice.
6.5.4.2.4 Design for Shear Force in Span A'-B:
ACI 318 Sec. 21.10.3 [21.12.3] provides two choices for computing the shear strength demand in amember of an intermediate moment frame:
1. The first option requires that the design shear force for earthquake be based on the nominal momentstrength at the ends of the members. Nominal moment strengths are computed with a flexuralreinforcement tensile strength of 1.0fy and a flexural φ factor of 1.0. The earthquake shears computedfrom the nominal flexural strength are added to the factored gravity shears to determine the totaldesign shear.
2. The second option requires that the design earthquake shear force be 2.0 times the factoredearthquake shear taken from the structural analysis. This shear is used in combination with thefactored gravity shears.
For this example, the first option is used. The nominal strengths at the ends of the beam were computedearlier as 3850 in.-kips for positive moment at Support A' and 5,852 in.-kips for negative moment atSupport B. Compute the design earthquake shear VE:
5,852 3,850 45.8 kips212EV +
= =
where 212 in. is the clear span of the member. For earthquake forces acting in the other direction, theearthquake shear is 43.1 kips.
The gravity load shears at the face of the supports are:
2.14(20 2.33) 18.9 kips2DV −
= =
0.66(20 2.33) 5.83 kips2LV −
= =
The factored design shear Vu = 1.3(18.9) + 0.5(5.8) + 1.0(45.8) = 73.3 kips. This shear force applies forearthquake forces coming from either direction as shown in the shear strength design envelope in Figure6-42.
The design shear force is resisted by a concrete component (Vc) and a steel component (Vs). Note that theconcrete component may be used regardless of the ratio of earthquake shear to total shear. The requireddesign strength is:

Chapter 6, Reinforced Concrete
6-85
Vu # φVc + φVs
where φ = 0.75 for shear.
(0.85) (2 4,000)20(27.6) 59.3 kips1,000cV = =
The factor of 0.85 above reflects the reduced shear capacity of sand-LW concrete.
The shear to be resisted by steel, assuming stirrups consist of two #3 legs (Av = 0.22) and fy = 40 ksi is:
73.3 0.75(59.3) 38.4 kips0.75
u cs
V VV φφ− −
= = =
Using VS = Av fyd/s:
(0.22)(40)(27.6) 6.32 in.38.4
s = =
Minimum transverse steel requirements are given in ACI 318 Sec. 21.10.4.2 [21.12.4.2]. The first stirrupshould be placed 2 in. from the face of the support, and within a distance 2h from the face of the support,the spacing should be not greater than d/4, eight times the smallest longitudinal bar diameter, 24 times thestirrup diameter, or 12 in. For the beam under consideration d/4 controls minimum transverse steel, withthe maximum spacing being 27.6/4 = 6.9 in. This is slightly greater, however, than the 6.32 in. requiredfor strength. In the remainder of the span, stirrups should be placed at a maximum of d/2 (ACI 318 Sec.21.10.4.3 [21.12.4.3]).
Because the earthquake shear (at midspan) is greater than 50 percent of the shear strength provided byconcrete alone, the minimum requirements of ACI 318 Sec. 11.5.5.3 must be checked:
0.2(40,000) 8.0 in.50(20)maxs = =
This spacing controls over the d/2 requirement. The final spacing used for the beam is shown in Figure 6-41. This spacing is used for all other spans as well. The stirrups may be detailed according to ACI 318Sec. 7.1.3, which requires a 90-degree hook with a 6db extension. This is in contrast to the details of theBerkeley building where full hoops with 135-degree hooks are required in the critical region (within 2dfrom the face of the support) and stirrups with 135-degree hooks are required elsewhere.

FEMA 451, NEHRP Recommended Provisions: Design Examples
6-86
'
5,8525,852
3,8503,8503,8503,850
5,8525,295
45.845.845.8
43.1 45.8 45.8
27.5
27.527.5
27.5
27.5
27.5
73.3
18.3
73.3
18.3
Loading
18.3
73.3
18.3
73.373.3
18.3
70.6
15.6
(a)Seismic moment(tension side)in.-kips
kips
positive
kips
positive
kips
positive
(b)Seismic shear
(c)Gravity shear(1.175D + 1.0L)
(d)Design shearseismic + gravity
212" 14"14"
240"
Figure 6-42 Shear strength envelopes for Span A'-B of Frame 1 (1.0 in =25.4 mm, 1.0 kip = 4.45kN, 1.0 in.-kip = 0.113 kN-m).

Chapter 6, Reinforced Concrete
6-87
'
20'-0" 20'-0"
12'-6
"
Level 4
Level 5
30"
30"
28"
See Figure 6-41for girderreinforcement
P = 54 kips IncludesP = 528 kips level 5
Figure 6-43 Isolated view of column A' (1.0 ft = 0.3048 m, 1.0 kip =4.45kN).
6.5.4.3 Design of Typical Interior Column of Frame 1
This section illustrates the design of a typical interior column on Gridline A'. The column, whichsupports Level 5 of Frame 1, is 28 in. square and is constructed from 4,000 psi LW concrete, 60 ksilongitudinal reinforcement, and 40 ksi transverse reinforcement. An isolated view of the column isshown in Figure 6-43.
The column supports an unfactored axial dead load of 528 kips and an unfactored axial live load of 54kips. The ETABS analysis indicates that the axial earthquake force is ±33.2 kips, the earthquake shearforce is ±41.9 kips, and the earthquake moments at the top and the bottom of the column are ±2,137 and±2,708 in.-kips, respectively. Moments and shears due to gravity loads are assumed to be negligible.
6.5.4.3.1 Design of Longitudinal Reinforcement
The factored gravity force for maximum compression (without earthquake) is:
Pu = 1.2(528) + 1.6(54) = 720 kips
This force acts with no significant gravity moment.
The factored gravity force for maximum compression (including earthquake) is:
Pu = 1.3(528) + 0.5(54) + 33.2 = 746.6 kips
The factored gravity force for minimum compression (including earthquake) is:
Pu = 0.8(528) - 33.2 = 389.2 kips
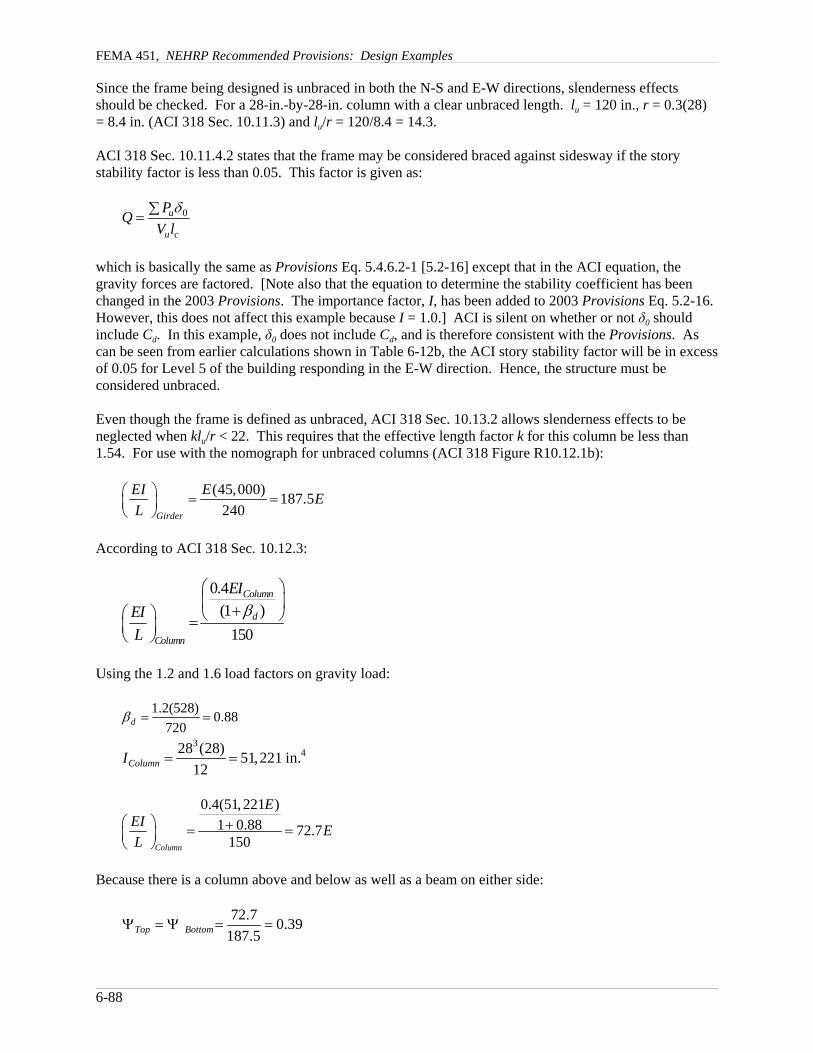
FEMA 451, NEHRP Recommended Provisions: Design Examples
6-88
Since the frame being designed is unbraced in both the N-S and E-W directions, slenderness effectsshould be checked. For a 28-in.-by-28-in. column with a clear unbraced length. lu = 120 in., r = 0.3(28)= 8.4 in. (ACI 318 Sec. 10.11.3) and lu/r = 120/8.4 = 14.3.
ACI 318 Sec. 10.11.4.2 states that the frame may be considered braced against sidesway if the storystability factor is less than 0.05. This factor is given as:
0u
u c
PQV l
δ∑=
which is basically the same as Provisions Eq. 5.4.6.2-1 [5.2-16] except that in the ACI equation, thegravity forces are factored. [Note also that the equation to determine the stability coefficient has beenchanged in the 2003 Provisions. The importance factor, I, has been added to 2003 Provisions Eq. 5.2-16. However, this does not affect this example because I = 1.0.] ACI is silent on whether or not δ0 shouldinclude Cd. In this example, δ0 does not include Cd, and is therefore consistent with the Provisions. Ascan be seen from earlier calculations shown in Table 6-12b, the ACI story stability factor will be in excessof 0.05 for Level 5 of the building responding in the E-W direction. Hence, the structure must beconsidered unbraced.
Even though the frame is defined as unbraced, ACI 318 Sec. 10.13.2 allows slenderness effects to beneglected when klu/r < 22. This requires that the effective length factor k for this column be less than1.54. For use with the nomograph for unbraced columns (ACI 318 Figure R10.12.1b):
(45,000) 187.5240Girder
EI E EL
⎛ ⎞ = =⎜ ⎟⎝ ⎠
According to ACI 318 Sec. 10.12.3:
0.4(1 )
150
Column
d
Column
EIEIL
β⎛ ⎞⎜ ⎟+⎛ ⎞ ⎝ ⎠=⎜ ⎟
⎝ ⎠
Using the 1.2 and 1.6 load factors on gravity load:
1.2(528) 0.88720dβ = =
3428 (28) 51,221 in.
12ColumnI = =
0.4(51, 221 )1 0.88 72.7
150Column
EEI EL
⎛ ⎞ += =⎜ ⎟⎝ ⎠
Because there is a column above and below as well as a beam on either side:
72.7 0.39187.5Top BottomΨ = Ψ = =
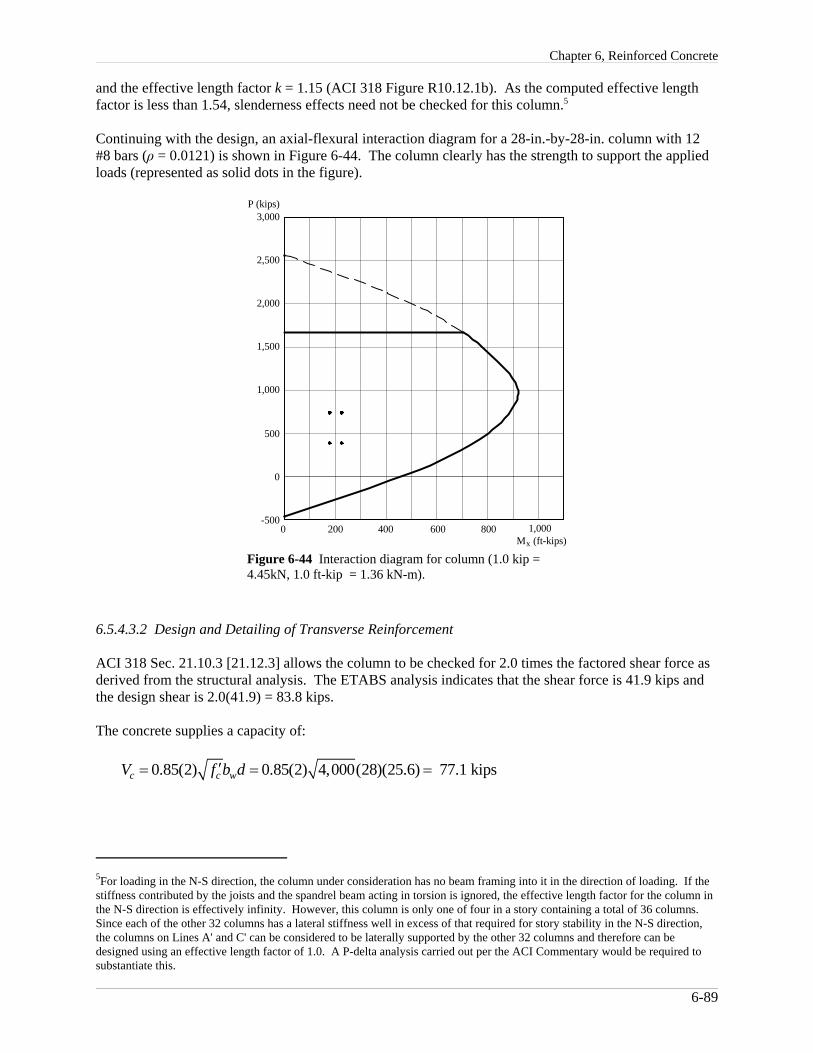
Chapter 6, Reinforced Concrete
5For loading in the N-S direction, the column under consideration has no beam framing into it in the direction of loading. If thestiffness contributed by the joists and the spandrel beam acting in torsion is ignored, the effective length factor for the column inthe N-S direction is effectively infinity. However, this column is only one of four in a story containing a total of 36 columns. Since each of the other 32 columns has a lateral stiffness well in excess of that required for story stability in the N-S direction,the columns on Lines A' and C' can be considered to be laterally supported by the other 32 columns and therefore can bedesigned using an effective length factor of 1.0. A P-delta analysis carried out per the ACI Commentary would be required tosubstantiate this.
6-89
500
1,500
2,500
-500200 400 600 800 1,000
P (kips)
1,000
2,000
3,000
0
M (ft-kips)x0
Figure 6-44 Interaction diagram for column (1.0 kip =4.45kN, 1.0 ft-kip = 1.36 kN-m).
and the effective length factor k = 1.15 (ACI 318 Figure R10.12.1b). As the computed effective lengthfactor is less than 1.54, slenderness effects need not be checked for this column.5
Continuing with the design, an axial-flexural interaction diagram for a 28-in.-by-28-in. column with 12#8 bars (ρ = 0.0121) is shown in Figure 6-44. The column clearly has the strength to support the appliedloads (represented as solid dots in the figure).
6.5.4.3.2 Design and Detailing of Transverse Reinforcement
ACI 318 Sec. 21.10.3 [21.12.3] allows the column to be checked for 2.0 times the factored shear force asderived from the structural analysis. The ETABS analysis indicates that the shear force is 41.9 kips andthe design shear is 2.0(41.9) = 83.8 kips.
The concrete supplies a capacity of:
0.85(2) 0.85(2) 4,000(28)(25.6) 77.1 kipsc c wV f b d′= = =

FEMA 451, NEHRP Recommended Provisions: Design Examples
6-90
The requirement for steel reinforcement is:
83.8 0.75(77.1) 34.6 kips0.75
u cs
V VV φφ− −
= = =
Using ties with four #3 legs, s = [4(0.11)] [40.0 (25.6/34.6)] = 13.02 in.
ACI 318 Sec. 21.10.5 [21.12.5] specifies the minimum reinforcement required. Within a region lo fromthe face of the support, the tie spacing should not exceed:
8.0db = 8.0 (1.008) = 8.00 in. (using #8 longitudinal bars)24dtie = 24 (3/8) = 9.0 in. (using #3 ties)1/2 the smallest dimension of the frame member = 28/2 = 14 in.12 in.
The 8.0 in. maximum spacing controls. Ties at this spacing are required over a length lo of:
1/6 clearspan of column = 120/6 = 20 in.maximum cross section dimension = 28 in.18.0 in.
Given the above, a four-legged #3 tie spaced at 8 in. over a depth of 28 in. will be used. One tie will beprovided at 4 in. below the beam soffit, the next tie is placed 4 in. above the floor slab, and the remainingties are spaced at 8 in. on center. The final spacing is as shown in Figure 6-45. Note that the tie spacingis not varied beyond lo.

Chapter 6, Reinforced Concrete
6-91
'
Level 7
Level 6
28"
30"
30"
28"
28"
(12) #8 bars
14 sp
aces
at 8
" o.
c.4"
4"
3"3
at 8
"3"
Figure 6-45 Column reinforcement (1.0 in = 25.4 mm).
6.5.4.4 Design of Beam-Column Joint
Joint reinforcement for intermediate moment frames is addressed in ACI 318 Sec. 21.10.5.3 [21.12.5.5],which refers to Sec. 11.11.2. ACI 318 Sec. 11.11.2 requires that all beam-column connections have aminimum amount of transverse reinforcement through the beam-column joints. The only exception is innonseismic frames where the column is confined on all four sides by beams framing into the column. Theamount of reinforcement required is given by ACI 318 Eq. 11-13:
50 wv
y
b sAf
⎛ ⎞= ⎜ ⎟⎜ ⎟
⎝ ⎠
This is the same equation used to proportion minimum transverse reinforcement in beams. Assuming Avis supplied by four #3 ties and fy = 40 ksi:
4(0.11)(40,000) 12.6 in.50(28)
s = =
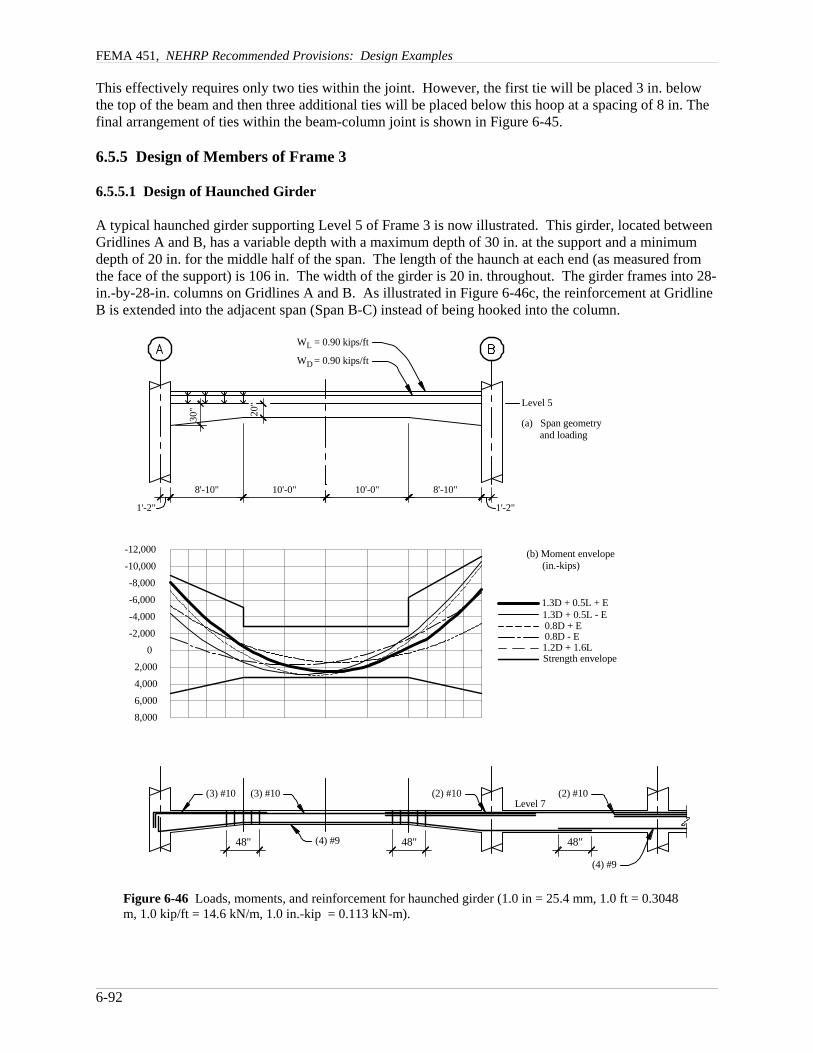
FEMA 451, NEHRP Recommended Provisions: Design Examples
6-92
1.3D + 0.5L + E
1.2D + 1.6L
1.3D + 0.5L - E0.8D + E0.8D - E
Strength envelope
(b) Moment envelope (in.-kips)
L
D
-2,0000
-4,000-6,000-8,000
-10,000-12,000
8,0006,0004,0002,000
Level 5
Level 7
(a) Span geometry and loading
48" 48"
1'-2"
8'-10" 10'-0"
1'-2"
8'-10"10'-0"
W = 0.90 kips/ft
W = 0.90 kips/ft
30" 20
"
48"
(3) #10 (3) #10 (2) #10 (2) #10
(4) #9
(4) #9
Figure 6-46 Loads, moments, and reinforcement for haunched girder (1.0 in = 25.4 mm, 1.0 ft = 0.3048m, 1.0 kip/ft = 14.6 kN/m, 1.0 in.-kip = 0.113 kN-m).
This effectively requires only two ties within the joint. However, the first tie will be placed 3 in. belowthe top of the beam and then three additional ties will be placed below this hoop at a spacing of 8 in. Thefinal arrangement of ties within the beam-column joint is shown in Figure 6-45.
6.5.5 Design of Members of Frame 3
6.5.5.1 Design of Haunched Girder
A typical haunched girder supporting Level 5 of Frame 3 is now illustrated. This girder, located betweenGridlines A and B, has a variable depth with a maximum depth of 30 in. at the support and a minimumdepth of 20 in. for the middle half of the span. The length of the haunch at each end (as measured fromthe face of the support) is 106 in. The width of the girder is 20 in. throughout. The girder frames into 28-in.-by-28-in. columns on Gridlines A and B. As illustrated in Figure 6-46c, the reinforcement at GridlineB is extended into the adjacent span (Span B-C) instead of being hooked into the column.

Chapter 6, Reinforced Concrete
6-93
Based on a tributary gravity load analysis, this girder supports an average of 3.38 kips/ft of dead load and0.90 kips/ft of reduced live load. A gravity load analysis of the girder was carried out in a similar mannersimilar to that described above for the Berkeley building.
For determining earthquake forces, the entire structure was analyzed using the ETABS program. Thisanalysis included 100 percent of the earthquake forces in the E-W direction placed at a 5 percenteccentricity with the direction of the eccentricity set to produce the maximum seismic shear in themember.
6.5.5.2 Design of Longitudinal Reinforcement
The results of the analysis are shown in Figure 6-46b for five different load combinations. The envelopesof maximum positive and negative moment indicate that 1.2D + 1.6L and 1.3D + 0.5L ± E produceapproximately equal negative end moments. Positive moment at the support is nearly zero under 0.8D -E, and gravity controls midspan positive moment. Since positive moment at the support is negligible, apositive moment capacity of at least one-third of the negative moment capacity will be supplied per ACI318 Sec. 21.10.4.1 [21.12.4.1]. The minimum positive or negative moment strength at any section of thespan will not be less than one-fifth of the maximum negative moment strength.
For a factored negative moment of 8,106 in.-kips on Gridline A, try six #10 bars. Three of the bars areshort, extending just past the end of the haunch. The other three bars are long and extend into Span B-C.
As = 6 (1.27) = 7.62 in.2
d = 30 - 1.5 - 0.375 - 1.27/2 = 27.49 in.ρ = 7.62/[20 (27.49)] = 0.0139Depth of compression block, a = [7.62 (60)]/[0.85 (4) 20.0] = 6.72 in.Nominal capacity, Mn = [7.62 (60)](27.49 - 6.72/2) = 11,031 in-kipsDesign capacity, φMn = 0.8(11,031) = 8,824 in.-kips > 8,106 in.-kips OK
The three #10 bars that extend across the top of the span easily supply a minimum of one-fifth of thenegative moment strength at the face of the support.
For a factored negative moment of 10,641 in.-kips on Gridline B, try eight #10 bars. Three of the barsextend from Span A-B, three extend from Span B-C, and the remaining two are short bars centered overSupport B.
As = 8 (1.27) = 10.16 in.2
d = 30 - 1.5 - 0.375 - 1.27/2 = 27.49 in.ρ = 10.16/[20 (27.49)] = 0.0185a = [10.16 (60)]/[0.85 (4) 20.0] = 8.96 in.Mn = [10.16 (60)](27.49 - 8.96/2) = 13,996 in.-kipsφMn = 0.8(13,996) = 11,221 in.-kips > 10,641 in.-kips OK
For the maximum factored positive moment at midspan of 2,964 in-kips., try four #9 bars:
As = 4 (1.0) = 4.00 in.2d = 20 - 1.5 - 0.375 - 1.128/2 = 17.56 in.ρ = 4.0/[20 (17.56)] = 0.0114a = [4.00 (60)]/[0.85 (4) 84] = 0.84 in. (effective flange width = 84 in.)Mn = [4.00 (60)](17.56 - 0.84/2) = 4,113 in.-kipsφMn = 0.8(4,113) = 3,290 in.-kips > 2,964 OK

FEMA 451, NEHRP Recommended Provisions: Design Examples
6-94
Even though they provide more than one-third of the negative moment strength at the support, the four #9bars will be extended into the supports as shown in Figure 6-46. The design positive moment strength forthe 30-in.-deep section with four #9 bars is computed as follows:
As = 4 (1.00) = 1.00 in.2
d = 30 - 1.5 - 0.375 - 1.128/2 = 27.56 in.ρ = 4.00/[20 (27.56)] = 0.0073a = [4.0 (60)]/[0.85 (4) 20.0] = 0.84 in.Mn = [4.00 (60)] (27.56 - 0.84/2) = 6,514 in.-kipsφMn = 0.8(6,514) = 5,211 in.-kips
The final layout of longitudinal reinforcement used is shown in Figure 6-46. Note that the supplieddesign strengths at each location exceed the factored moment demands. The hooked #10 bars can easilybe developed in the confined core of the columns. Splices shown are Class B and do not need to beconfined within hoops.
6.5.5.3 Design of Transverse Reinforcement
For the design for shear, ACI 318 Sec. 21.10.3 [21.12.3] gives the two options discussed above. For thehaunched girder, the approach based on the nominal flexural capacity (φ = 1.0) of the girder will be usedas follows:
For negative moment and six #10 bars, the nominal moment strength = 11,031 in.-kipsFor negative moment and eight #10 bars, the nominal strength =13,996 in.-kipsFor positive moment and four #9 bars, the nominal moment strength = 6,514 in.-kips
Earthquake shear when Support A is under positive seismic moment is:
VE = (13,996 + 6,514)/(480 - 28) = 45.4 kips
Earthquake shear when Support B is under positive seismic moment is:
VE = (11,031 + 6,514)/(480 - 28) = 38.8 kipsVG = 1.3VD + 0.5VL = 1.3 (63.6) + 0.5(16.9) = 91.1 kips
Maximum total shear occurs at Support B:
Vu = 45.4+91.1 = 136.5 kips
The shear at Support A is 38.8 + 91.9 = 130.1 kips. The complete design shear (demand) strengthenvelope is shown in Figure 6-47a. Due to the small difference in end shears, use the larger shear fordesigning transverse reinforcement at each end.
Stirrup spacing required for strength is based on two #4 legs with fy = 60 ksi.
(0.85)(2) 4,000)(20)(27.6) 59.3 kips1,000cV = =
136.5 0.75(59.3) 122.7 kips0.75
u cs
V VV φφ− −
= = =
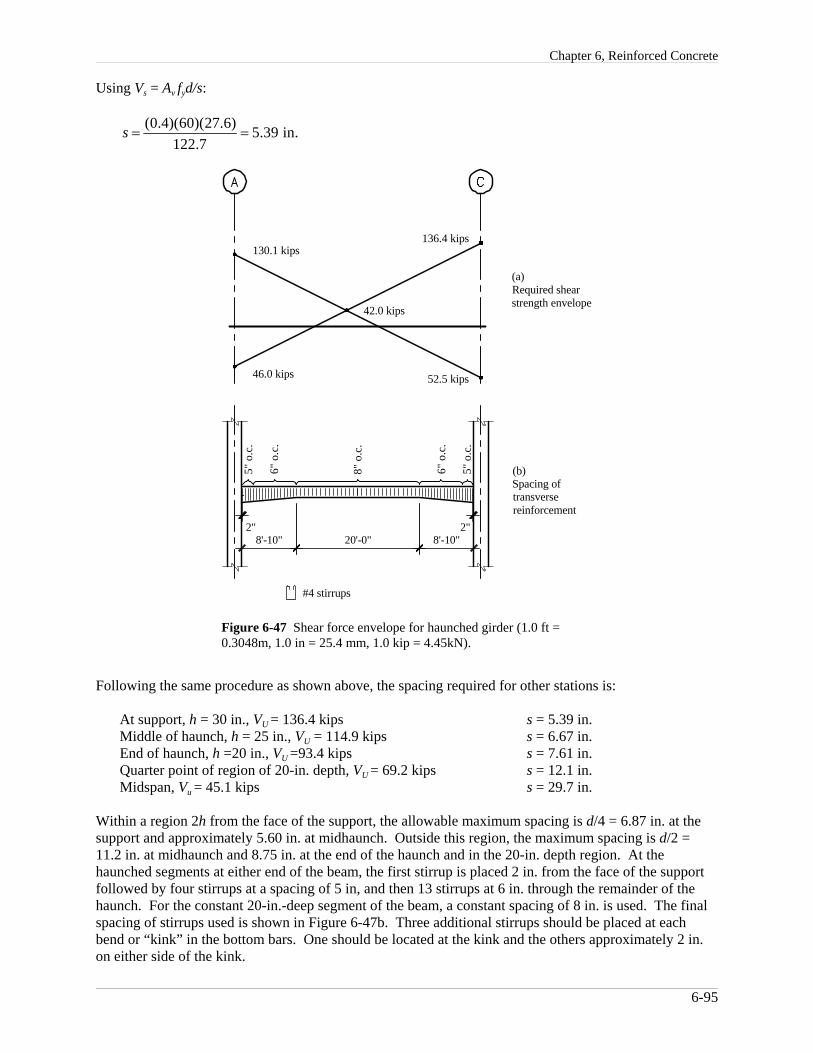
Chapter 6, Reinforced Concrete
6-95
8'-10" 20'-0" 8'-10"
5" o
.c.
8" o
.c.
6" o
.c.
130.1 kips136.4 kips
42.0 kips
#4 stirrups
(a)Required shearstrength envelope
(b)Spacing oftransversereinforcement
2"
46.0 kips 52.5 kips
2"
5" o
.c.
6" o
.c.
Figure 6-47 Shear force envelope for haunched girder (1.0 ft =0.3048m, 1.0 in = 25.4 mm, 1.0 kip = 4.45kN).
Using Vs = Av fyd/s:
(0.4)(60)(27.6) 5.39 in.122.7
s = =
Following the same procedure as shown above, the spacing required for other stations is:
At support, h = 30 in., VU = 136.4 kips s = 5.39 in.Middle of haunch, h = 25 in., VU = 114.9 kips s = 6.67 in.End of haunch, h =20 in., VU =93.4 kips s = 7.61 in.Quarter point of region of 20-in. depth, VU = 69.2 kips s = 12.1 in.Midspan, Vu = 45.1 kips s = 29.7 in.
Within a region 2h from the face of the support, the allowable maximum spacing is d/4 = 6.87 in. at thesupport and approximately 5.60 in. at midhaunch. Outside this region, the maximum spacing is d/2 =11.2 in. at midhaunch and 8.75 in. at the end of the haunch and in the 20-in. depth region. At thehaunched segments at either end of the beam, the first stirrup is placed 2 in. from the face of the supportfollowed by four stirrups at a spacing of 5 in, and then 13 stirrups at 6 in. through the remainder of thehaunch. For the constant 20-in.-deep segment of the beam, a constant spacing of 8 in. is used. The finalspacing of stirrups used is shown in Figure 6-47b. Three additional stirrups should be placed at eachbend or “kink” in the bottom bars. One should be located at the kink and the others approximately 2 in.on either side of the kink.
FEMA 451, NEHRP Recommended Provisions: Design Examples
6-96
6.5.5.4 Design of Supporting Column
The column on Gridline A which supports Level 5 of the haunched girder is 28 in. by 28 in. and supportsa total unfactored dead load of 803.6 kips and an unfactored reduced live load of 78.4 kips. The layout ofthe column is shown in Figure 6-48. Under gravity load alone, the unfactored dead load moment is 2,603in.-kips and the corresponding live load moment is 693.0 in.-kips. The corresponding shears are 43.4 and11.5 kips, respectively. The factored gravity load combinations for designing the column are as follows:
Bending moment, M = 1.2(2,603) + 1.6(693) = 4,232 in.-kips
This moment causes tension on the outside face of the top of the column and tension on the inside face ofthe bottom of the column.
Shear, V = 1.2(43.4) + 0.5(11.5) = 57.8 kips
Axial compression, P = 1.2(803.6) + 1.6(78.4) = 1,090 kips
For equivalent static earthquake forces acting from west to east, the forces in the column are obtainedfrom the ETABS analysis as follows:
Moment at top of column = 690 in.-kips (tension on inside face subtracts from gravity)Moment at bottom of column = 874 in.-kips (tension on outside face subtracts from gravity)Shear in column = 13.3 kips (opposite sign of gravity shear)Axial force = 63.1 kips tension
The factored forces involving earthquake from west to east are:
Moment at top 0.80(2603) - 690 = 1,392 in.-kipsMoment at bottom = 0.80(2603) - 874 = 1,208 in.-kipsShear = 0.80(43.4) - 2(13.3) = 8.1 kips (using the second option for computing EQ shear)Axial force = 0.80(803.6) - 63.1 = 580 kips
For earthquake forces acting from east to west, the forces in the column are obtained from the ETABSanalysis as follows:
Moment at top of column = 690 in.-kips (tension on outside face adds to gravity)Moment at bottom of column = 874 in.-kips (tension on inside face adds to gravity)Shear in column = 13.3 kips (same sign of gravity shear)Axial force = 63.1 kips compression

Chapter 6, Reinforced Concrete
6-97
P = 78.4 kips IncludesP = 803.6 kips level 5
Level 4
Level 5
LD
20"
30"
30"
12'-6
"28"
Figure 6-48 Loading for Column A, Frame 3 (1.0 ft =0.3048 m, 1.0 in = 25.4 mm, 1.0 kip = 4.45kN).
The factored forces involving earthquake from east to west are:
Moment at top 1.3(2,603) + 0.5(693) + 690 = 4,420 in.-kipsMoment at bottom = 1.3(2,603) + 0.5(693) + 874 = 4,604 in.-kipsShear = 1.3(43.4) + 0.5(11.5) + 2(13.3) = 94.6 kips (using second option for computing EQ shear)Axial force = 1.3(803.6) + 0.5(78.4) + 63.1 = 1,147 kips
As may be observed from Figure 6-49, the column with 12 #8 bars is adequate for all loadingcombinations. Since the maximum design shear is less than that for the column previously designed forFrame 1 and since minimum transverse reinforcement controlled that column, the details for the columncurrently under consideration are similar to those shown in Figure 6-45. The actual details for the columnsupporting the haunched girder of Frame 3 are shown in Figure 6-50.

FEMA 451, NEHRP Recommended Provisions: Design Examples
6-98
500
1,500
2,500
-500200 400 600 800 1,000
P (kips)
2,000
1,000
0
3,000
M (ft-kips)x0
Figure 6-49 Interaction diagram for Column A, Frame 3(1.0 kip = 4.45kN, 1.0 ft-kip = 1.36 kN-m).
6.5.5.5 Design of Beam-Column Joint
The detailing of the joint of the column supporting Level 5 of the haunched girder is the same as that forthe column interior column of Frame A. The joint details are shown in Figure 6-50.

Chapter 6, Reinforced Concrete
6-99
Level 5
Level 4
28"
28"
28"
(12) #8 bars
14 sp
aces
at 8
" o.
c.4"
4"
Figure 6-50 Details for Column A, Frame 3 (1.0in = 25.4 mm).