needlestick tracking: results of the first 2 years of the california sharps injury surveillance...
TRANSCRIPT
Needlestick Tracking: Results of the first 2 years of the
California Sharps Injury Surveillance Registry
California Department of Health Services
University of California, San FranciscoPresented at Health Care Workers Conference, July 2002

Project Staff
Marion Gillen, RN, MPH, PhD, Principal Investigator Martha Davis, MPH, EMT, Project Coordinator, 1998-2000 Jennifer McNary, CIH, MPH, Industrial Hygienist Alisa Boyd, MPH, Research Assistant Julieann Lewis, MPH, Research Assistant/Health Educator Chris Curran, MS, Research Assistant Mary Schuller, BS, Research Assistant James Cone, MD, MPH, Contract Officer and Chief, OHB Florence Reinisch, MPH – Project coordinator, 2002-

Project Aims
• Mandated by CA Senate Bill 2005;• Pilot study to determine the feasibility of
establishing a Sharps Injury Registry;• Overlapped passage of CA Assembly
Bill 1208 which mandated emergency changes to the Bloodborne Pathogens Standard.

Overview of Sharps Injury Surveillance Program
California the first state in the U.S. to develop a voluntary sharps injury registry
Collects data from acute care hospitals, home health agencies, and skilled nursing facilities.
Collected 1940 reports from 442 facilities (Jan. 98-Jan 30, 2000).

Response Rate
Overall response rate - 18%• Acute care facilities – 106/477 (22%)• Home health agencies – 120/872 (13%)• Skilled nursing facilities – 216/1177 (18%)
Average daily expenses in participating hospitals higher than non-participating hospitals (t = 2.55, p = 0.01)

Overall Project Aims
Conduct 2-year sharps injury surveillance study (injury registry)
Compile list of safety device studies Educate the public regarding sharps
injuries and Bloodborne pathogens Compile a list of available devices with
sharps injury prevention features

Research Methods
Developed injury log form for reporting Sent survey letter to 2550 California
acute care hospitals, skilled nursing facilities and home health care agencies requesting data
Sent follow up post card; second mailing Data coding, entry, cleaning and analyses

Study Parameters
Data was collected before and after effective date of revisions to California Bloodborne Pathogens standard
Sharps Injury Surveillance ProgramJanuary 1, 1998-December 31, 1999
Revisions to Bloodborne Pathogens Standard
Effective July 1999
Inclusion Criteria
Only includes injuries from sharp objects (not splashes, bites, or exposure to mucous membranes)
Only injuries from contaminated sharps Injuries to employees (not patients or
visitors)
Study Limitations
Participation was voluntary; data accepted in any format
Necessary to re-code data• Initial instructions not provided for log• Brand and model often unknown • Missing data in all data fields• Variability among facilities with regard to
data collection efforts considerable

Sharps Injury Log Form
Description of the Exposure Incident Job Classification Department or work area Procedure How the incident occurred
Sharps Injury Log Based on Cal-OSHA BBP Standard
Protective mechanism activated? Body part injured Employee’s opinion whether a safety
device or other controls could have prevented injury
Type, brand, model http://www.dhs.cahwnet.gov/ohb/SHARPS/Default.htm

Percent of All Reported Injuries by Facility Type
Other1%
HHA3%SNF
4%
HOSP92%

Sharps Injuries by Gender(n = 696)
Female77%
Male23%

Sharps Injuries by Shift Worked(n = 821)
Nights16%
Evenings28%
Days57%
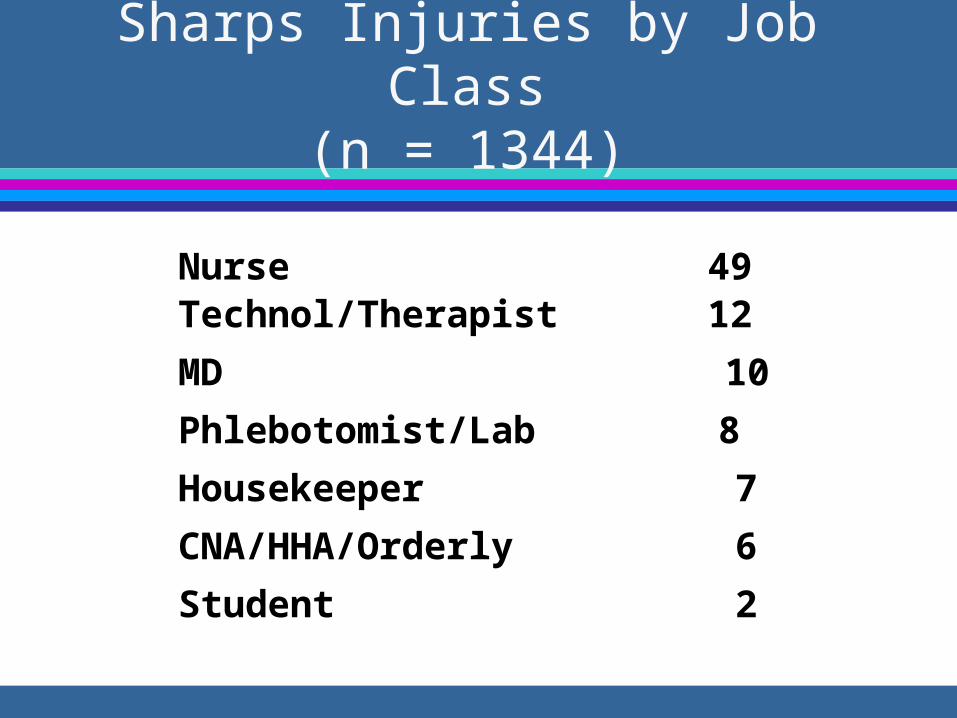
Sharps Injuries by Job Class(n = 1344)
Nurse 49Technol/Therapist 12
MD 10
Phlebotomist/Lab 8
Housekeeper 7
CNA/HHA/Orderly 6
Student 2

Sharps Injuries by Location(n = 1455)
Location Percent
Patient Room 25
Operating Room 19
Emergency Dept. 10
ICU / CCU / NICU 8
Clinical Lab/Phlebotomy 7
Procedure room 7

Sharps Injuries by Procedure(n = 1327)
Procedure % of Injuries
Injection 22
Drawing venous blood 20
Suturing 11
Start IV/ DC IV 10
Procedure/Biopsy 10
Manipulating IV/port 8

Sharps Injuries by Secondary Procedures (n = 494)
Procedure %
Assisting w/ procedure 24
Equipment cleaning 21
Contact with trash 12
Room cleaning 11
Sharps protruding from SDC 8
Patient assistance 6

Sharps Injury by Work Process(n = 1345)
During use of sharp 30
After use/before disposal 23
Sharps left 16
While putting 11
During cleaning 7
Recapping 6

Sharps Injuries by Body Part(n = 983)
Hand13%
Other6%
Finger81%

Devices Associated With Injuries
Disposable Needle/Syringe 32% Needle, Not sure what kind 14% I.V. Catheter (Stylet) 9% Suture Needle 8% Winged steel needle/blood draw 7%
Scalpel 6% Vacuum tube blood needle 5%
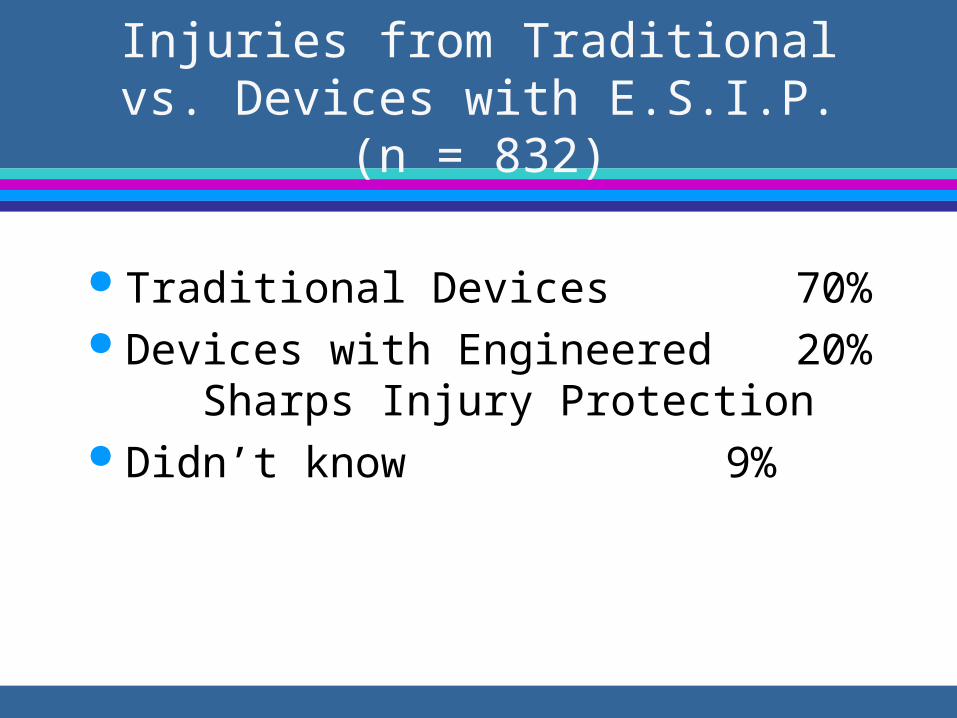
Injuries from Traditional vs. Devices with E.S.I.P. (n = 832)
Traditional Devices 70% Devices with Engineered 20% Sharps
Injury Protection Didn’t know 9%

Age of Injured Workers (n = 411)
Mean age 38.48 years Minimum 18 years Maximum 72 years Housekeepers/laundry personnel
significantly older (mean=46 years) than phlebotomists, CNA/HHAs, therapists & technologists and others.

Size of Needle (n = 363)
Mean 23 gauge Minimum 30 gauge Maximum 14 gauge Mode 28 gauge
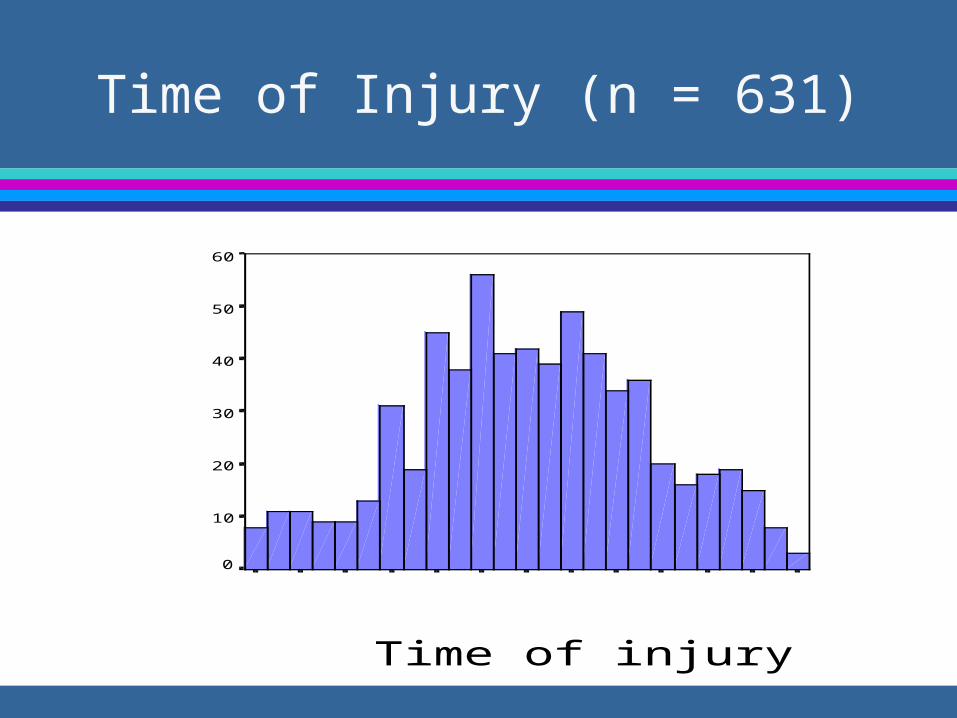
Time of Injury (n = 631)
Time of injury
240022002000180016001400120010008006004002000
Frequency
60
50
40
30
20
10
0

Other findings noted in text fields (n = 336)
Other circumstances contributing to injury event:• Patient moved 26%• Stuck by someone else 24%• Safety device related 17%• Sharps contained design or 10%
placement• Stuck by needle in sharps box 10%

Employee opinions regarding sharps with ESIP (n = 491)
yes67%
Text explanations = 191 Safety device could/would
have prevented injury (62%) SD could not have
prevented injury (8%) SD needs better design (7%) In stock, but not used (5%)

Employee opinions regarding sharps with ESIP (n = 491)
yes67%
Device was a safety device, but it was not activated (5%)
Safety device on order/on trial/unavailable (5%)
Thought there was no SD on marker for procedure (3%)
Employee thought SD would hinder procedure (3%)

Employee opinions regarding other work controls (n = 474)
yes74%
Text explanations = 311 Human factors including
slowing down (41%) Proper sharps disposal (20%) SDC design, placement, or
container too full (8%) Revised procedures or
improved protocols (7%)

Employee opinions regarding other work controls (n = 474)
yes74%
Improved staffing/training (6%) Other design feature; better
design of non-sharps tools or PPE; availability (6%)
Avoidance of recapping (5%) Have someone help (3%) Revised pt. care protocols (2%)

Employee opinions regarding other work controls (n = 474)
Work practice controls 73% Administrative controls 15% Engineering controls 10% Of note, many of the circumstances would
have benefited from engineering controls as a primary means or injury prevention. Most of the human factors explanations involved self-blame.

Facility Type and Injury Circumstances (n = 1258)
Circumstances Hospitals(%)
SNF & HHA(%)
During use 32 20
After use 23 30
While putting 12 7
Sharps left 17 25
2 = 10.69. P = 0.03

Job Classification and Injury Circumstances (n = 1125)
MD (%) Lab (%) Nurse(%)
CNA(%)
During use 79 35 31 20
After use 12 30 32 25
While putting 2 22 12 10
Sharps left 0 4 8 33
2 = 464, p = <.001

Job Classification and Procedure (n = 1100)
MD (%) Nurse(%)
Tech(%)
Others(%)
Draw blood 5 20 13 43
Injection 24 30 7 13Start IV 1 15 4 8Suture/assist 46 11 49 14Finger stick 0 4 1 6Other 24 19 26 16
2 = 275, p = <.001

Job Classification and Secondary Procedure (n = 446)
Hskpr(%)
CNA(%)
Nurse(%)
Tech(%)
Other(%)
Assisting 0 10 27 47 30
Rm/pt cleaning 29 58 19 9 15Equip cleaning 1 25 18 28 25Trash 60 2 3 5 6SDC-related 10 4 18 6 15
2 = 284, p = <.001

Injury Circumstance and Procedure (n = 1075)
Duringuse
Afteruse
Whileputting
Sharpsleft
Other
Draw blood 21 27 42 12 9
Injection 16 37 30 12 32Start IV 8 14 4 21 4Suture/assist 28 8 8 22 29Fingerstick 2 2 1 16 7Other 26 11 15 18 22
2 = 232, p = <.001

Injury Circumstance and Type of Device (n = 1239)
Duringuse(%)
Afteruse(%)
Whileputting
(%)
Sharpsleft(%)
Other(%)
Syringe 37 50 41 23 40IV needles 10 14 2 14 5Winged steel 11 18 31 6 4Lancet 2 2 1 10 5Suture 18 3 4 10 4
2 = 255, p = <.001

Department Location and Procedure (n = 1201)
Room(%)
OR(%)
ICU (%)
ED(%)
Other(%)
Draw blood 24 2 33 40 29
Injection 32 10 21 13 25Start IV 15 2 20 15 7Suture/assist 2 63 7 14 17Other 26 23 20 18 23
2 = 433, p = <.001

Device Type and Injury Circumstance (n = 1239)
Syringe(%)
IVneedle
(%)
Wingedsteel(%)
Lancet(%)
Suture(%)
During use 28 32 28 14 68
After use 33 35 35 16 10While putting 11 2 25 2 5Sharps left 10 23 8 43 10Other 18 9 6 25 8
2 = 255, p = <.001

Why Sharps Injury Surveillance?
Benefits of aggregated data Identify devices that continue to result in
injuries Serve as early warning for device or
design-related injuries Identify job class., procedures, work
activities, that continue to be at risk for sharps injuries.

Future Plans/Recommendations
Continue to collect sharps injury logs.
Encourage use of standard reporting format
Change voluntary nature of reporting
Develop recommendations based on injury circumstance and device type