nebraska ag climate update october 9, 2015 - · pdf filenebraska ag climate update october 9,...
TRANSCRIPT
Nebraska Ag Climate Update October 9, 2015
State Summary
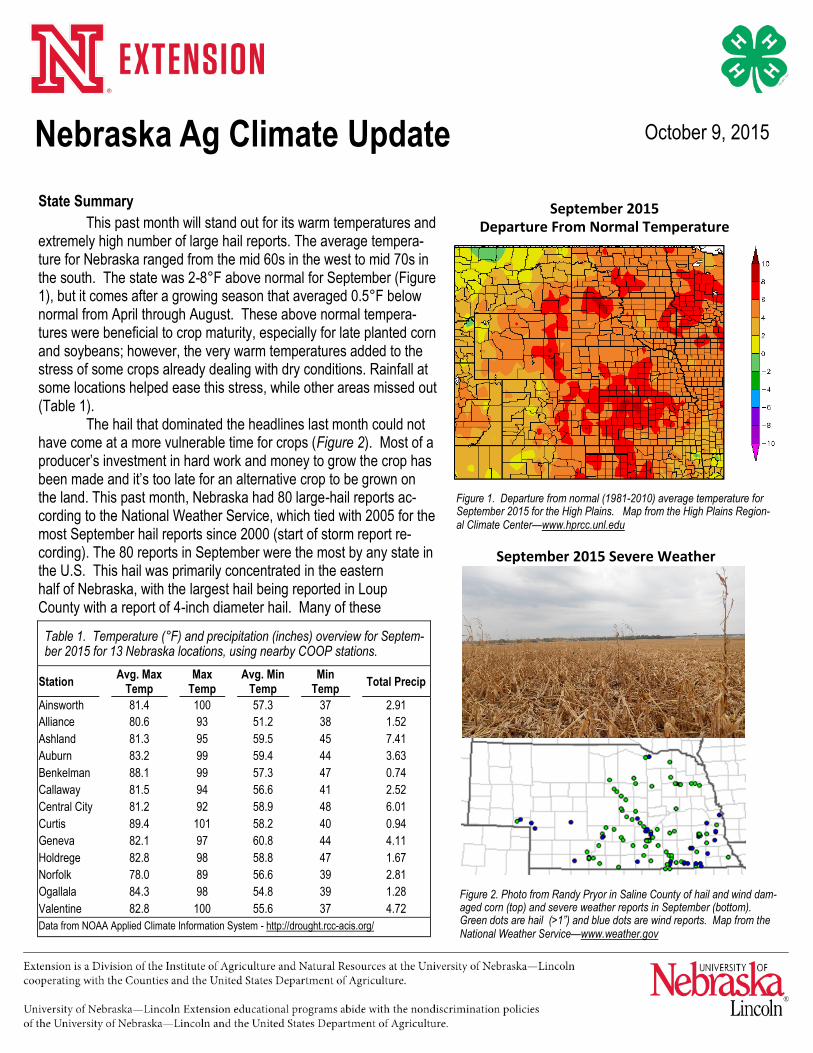
This past month will stand out for its warm temperatures and extremely high number of large hail reports. The average tempera-ture for Nebraska ranged from the mid 60s in the west to mid 70s in the south. The state was 2-8°F above normal for September (Figure 1), but it comes after a growing season that averaged 0.5°F below normal from April through August. These above normal tempera-tures were beneficial to crop maturity, especially for late planted corn and soybeans; however, the very warm temperatures added to the stress of some crops already dealing with dry conditions. Rainfall at some locations helped ease this stress, while other areas missed out (Table 1). The hail that dominated the headlines last month could not have come at a more vulnerable time for crops (Figure 2). Most of a producer’s investment in hard work and money to grow the crop has been made and it’s too late for an alternative crop to be grown on the land. This past month, Nebraska had 80 large-hail reports ac-cording to the National Weather Service, which tied with 2005 for the most September hail reports since 2000 (start of storm report re-cording). The 80 reports in September were the most by any state in the U.S. This hail was primarily concentrated in the eastern half of Nebraska, with the largest hail being reported in Loup County with a report of 4-inch diameter hail. Many of these
Table 1. Temperature (°F) and precipitation (inches) overview for Septem-ber 2015 for 13 Nebraska locations, using nearby COOP stations.
Station Avg. Max
Temp
Max Temp
Avg. Min
Temp
Min Temp
Total Precip
Ainsworth 81.4 100 57.3 37 2.91
Alliance 80.6 93 51.2 38 1.52
Ashland 81.3 95 59.5 45 7.41
Auburn 83.2 99 59.4 44 3.63
Benkelman 88.1 99 57.3 47 0.74
Callaway 81.5 94 56.6 41 2.52
Central City 81.2 92 58.9 48 6.01
Curtis 89.4 101 58.2 40 0.94
Geneva 82.1 97 60.8 44 4.11
Holdrege 82.8 98 58.8 47 1.67
Norfolk 78.0 89 56.6 39 2.81
Ogallala 84.3 98 54.8 39 1.28
Valentine 82.8 100 55.6 37 4.72
Data from NOAA Applied Climate Information System - http://drought.rcc-acis.org/
Figure 2. Photo from Randy Pryor in Saline County of hail and wind dam-aged corn (top) and severe weather reports in September (bottom). Green dots are hail (>1”) and blue dots are wind reports. Map from the National Weather Service—www.weather.gov
September 2015 Departure From Normal Temperature
Figure 1. Departure from normal (1981-2010) average temperature for September 2015 for the High Plains. Map from the High Plains Region-al Climate Center—www.hprcc.unl.edu
September 2015 Severe Weather
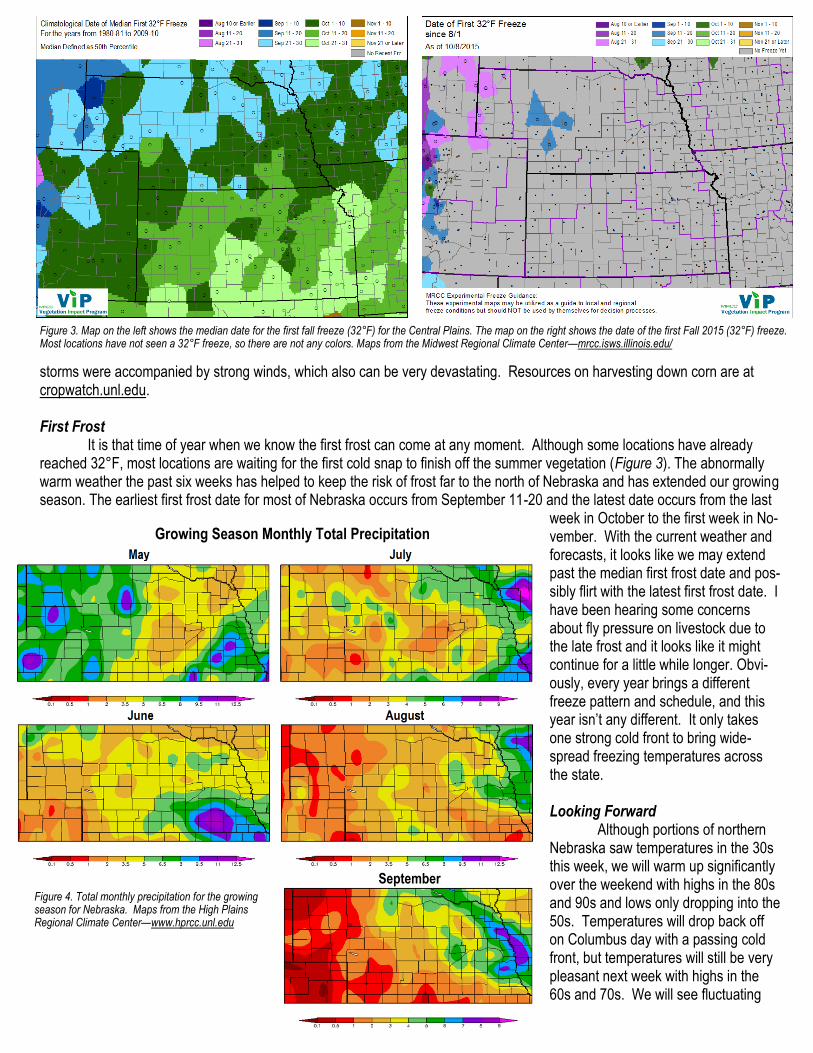
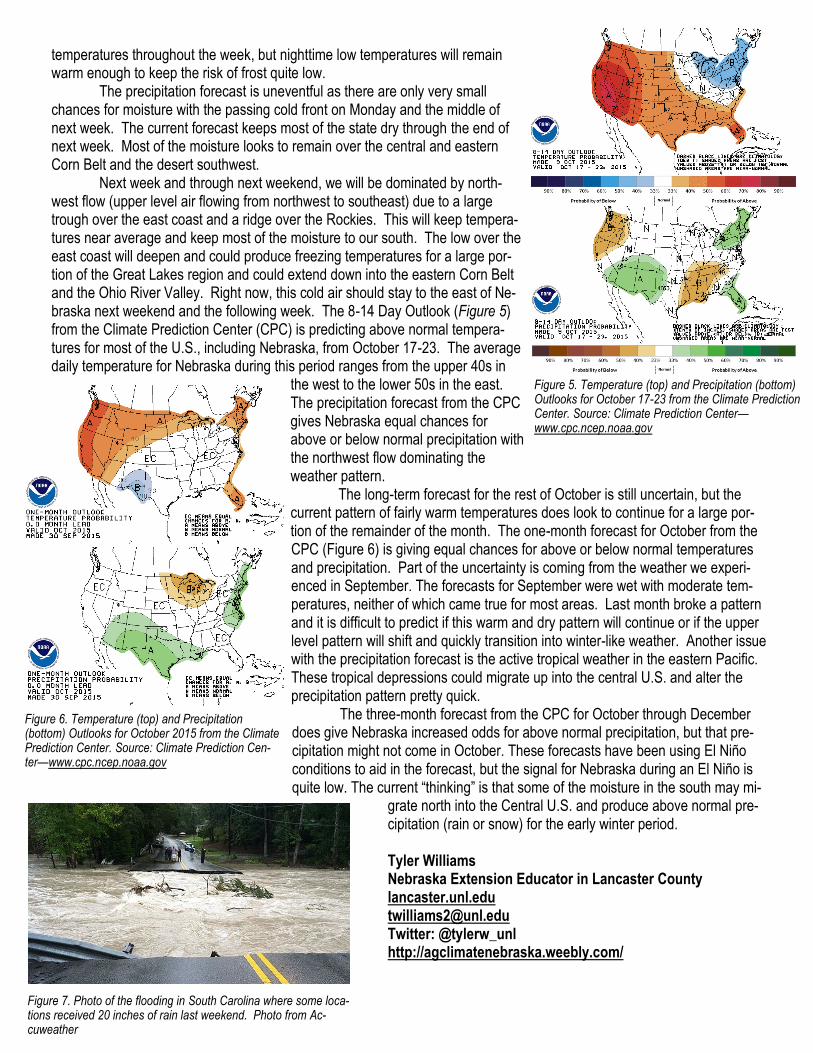
storms were accompanied by strong winds, which also can be very devastating. Resources on harvesting down corn are at cropwatch.unl.edu. First Frost It is that time of year when we know the first frost can come at any moment. Although some locations have already reached 32°F, most locations are waiting for the first cold snap to finish off the summer vegetation (Figure 3). The abnormally warm weather the past six weeks has helped to keep the risk of frost far to the north of Nebraska and has extended our growing season. The earliest first frost date for most of Nebraska occurs from September 11-20 and the latest date occurs from the last
week in October to the first week in No-vember. With the current weather and forecasts, it looks like we may extend past the median first frost date and pos-sibly flirt with the latest first frost date. I have been hearing some concerns about fly pressure on livestock due to the late frost and it looks like it might continue for a little while longer. Obvi-ously, every year brings a different freeze pattern and schedule, and this year isn’t any different. It only takes one strong cold front to bring wide-spread freezing temperatures across the state. Looking Forward Although portions of northern Nebraska saw temperatures in the 30s this week, we will warm up significantly over the weekend with highs in the 80s and 90s and lows only dropping into the 50s. Temperatures will drop back off on Columbus day with a passing cold front, but temperatures will still be very pleasant next week with highs in the 60s and 70s. We will see fluctuating
Figure 4. Total monthly precipitation for the growing season for Nebraska. Maps from the High Plains Regional Climate Center—www.hprcc.unl.edu
Growing Season Monthly Total Precipitation
September
Figure 3. Map on the left shows the median date for the first fall freeze (32°F) for the Central Plains. The map on the right shows the date of the first Fall 2015 (32°F) freeze. Most locations have not seen a 32°F freeze, so there are not any colors. Maps from the Midwest Regional Climate Center—mrcc.isws.illinois.edu/
temperatures throughout the week, but nighttime low temperatures will remain warm enough to keep the risk of frost quite low. The precipitation forecast is uneventful as there are only very small chances for moisture with the passing cold front on Monday and the middle of next week. The current forecast keeps most of the state dry through the end of next week. Most of the moisture looks to remain over the central and eastern Corn Belt and the desert southwest. Next week and through next weekend, we will be dominated by north-west flow (upper level air flowing from northwest to southeast) due to a large trough over the east coast and a ridge over the Rockies. This will keep tempera-tures near average and keep most of the moisture to our south. The low over the east coast will deepen and could produce freezing temperatures for a large por-tion of the Great Lakes region and could extend down into the eastern Corn Belt and the Ohio River Valley. Right now, this cold air should stay to the east of Ne-braska next weekend and the following week. The 8-14 Day Outlook (Figure 5) from the Climate Prediction Center (CPC) is predicting above normal tempera-tures for most of the U.S., including Nebraska, from October 17-23. The average daily temperature for Nebraska during this period ranges from the upper 40s in
the west to the lower 50s in the east. The precipitation forecast from the CPC gives Nebraska equal chances for above or below normal precipitation with the northwest flow dominating the weather pattern. The long-term forecast for the rest of October is still uncertain, but the current pattern of fairly warm temperatures does look to continue for a large por-tion of the remainder of the month. The one-month forecast for October from the CPC (Figure 6) is giving equal chances for above or below normal temperatures and precipitation. Part of the uncertainty is coming from the weather we experi-enced in September. The forecasts for September were wet with moderate tem-peratures, neither of which came true for most areas. Last month broke a pattern and it is difficult to predict if this warm and dry pattern will continue or if the upper level pattern will shift and quickly transition into winter-like weather. Another issue with the precipitation forecast is the active tropical weather in the eastern Pacific. These tropical depressions could migrate up into the central U.S. and alter the precipitation pattern pretty quick. The three-month forecast from the CPC for October through December does give Nebraska increased odds for above normal precipitation, but that pre-cipitation might not come in October. These forecasts have been using El Niño conditions to aid in the forecast, but the signal for Nebraska during an El Niño is quite low. The current “thinking” is that some of the moisture in the south may mi-
grate north into the Central U.S. and produce above normal pre-cipitation (rain or snow) for the early winter period. Tyler Williams Nebraska Extension Educator in Lancaster County lancaster.unl.edu [email protected] Twitter: @tylerw_unl http://agclimatenebraska.weebly.com/
Figure 6. Temperature (top) and Precipitation (bottom) Outlooks for October 2015 from the Climate Prediction Center. Source: Climate Prediction Cen-ter—www.cpc.ncep.noaa.gov
Figure 5. Temperature (top) and Precipitation (bottom) Outlooks for October 17-23 from the Climate Prediction Center. Source: Climate Prediction Center—www.cpc.ncep.noaa.gov
Figure 7. Photo of the flooding in South Carolina where some loca-tions received 20 inches of rain last weekend. Photo from Ac-cuweather