aurubis ag - climate change 2020
TRANSCRIPT

Aurubis AG - Climate Change 2020
C0. Introduction
C0.1
(C0.1) Give a general description and introduction to your organization.
Aurubis AG is the world’s leading provider of non-ferrous metals. The company processes complex metal concentrates, copper scrap and metal-bearing recycling materialsinto metals of the highest quality. Among other items, Aurubis produces more than 1 million t of copper cathodes per year, and from them diverse copper products, such aswire rod and shapes, rolled products, strip, and specialty wire and profiles made of copper and copper alloys. In addition, Aurubis is the world’s largest copper recycler. Withits wide range of services, Aurubis is a forerunner in the industry. Its main area of expertise is the processing and optimal utilization of concentrates with complex qualities.Consequently, it has a broad product portfolio. The portfolio includes precious metals, selenium, lead, nickel and a series of other products such as sulfuric acid and ironsilicate. Aurubis has production sites in Europe and the USA and an extensive service and sales system for copper products in Europe, Asia and North America. The largestproduction centers are in Germany, Belgium and Bulgaria. The Aurubis Group is managed centrally from the corporate and administrative headquarters in Hamburg, wherekey production facilities are also concentrated. 6,673 employees worked for the Aurubis Group worldwide as of September 30, 2019. Of this number, 57 % worked at theGerman plants and 43 % worked in other countries. Customers of Aurubis include companies in the semis industry, the electrical engineering, electronics and chemicalindustries, as well as suppliers of the renewable energies, construction and automotive sectors. Aurubis is oriented to growth and to increasing corporate value. The mainfocuses of our strategy are on expanding our leading market position as an integrated copper and metal producer, entering new markets by offering metals for industries ofthe future, utilizing growth opportunities and practicing a responsible attitude when dealing with people, resources and the environment. Aurubis AG was founded inHamburg in 1866 under the name Norddeutsche Affinerie AG. Following various changes in the ownership structure, an IPO was carried out in 1998. The company wasrenamed Aurubis as a result of a resolution passed at the company’s Annual General Meeting on February 26, 2009. Aurubis shares are part of the Prime Standard Segmentof the Deutsche Börse and are listed in the MDAX and the Global Challenges Index (GCX).
C0.2
(C0.2) State the start and end date of the year for which you are reporting data.
Start date End date Indicate if you are providing emissions data for past reportingyears
Select the number of past reporting years you will be providing emissions datafor
Reportingyear
January 12019
December 312019
Please select <Not Applicable>
C0.3
(C0.3) Select the countries/areas for which you will be supplying data.BelgiumBulgariaFinlandGermanyItalyNetherlandsUnited States of America
C0.4
(C0.4) Select the currency used for all financial information disclosed throughout your response.EUR
C0.5
(C0.5) Select the option that describes the reporting boundary for which climate-related impacts on your business are being reported. Note that this option shouldalign with your chosen approach for consolidating your GHG inventory.Operational control
C-MM0.7
CDP Page of 411

(C-MM0.7) Which part of the metals and mining value chain does your organization operate in?
Row 1
MiningPlease select
Processing metalsCopperGoldPlatinum group metalsSilverNickelZincLeadOther non-ferrous metals, please specify (Selenium Tellurium Tin )
C1. Governance
C1.1
(C1.1) Is there board-level oversight of climate-related issues within your organization?Yes
C1.1a
(C1.1a) Identify the position(s) (do not include any names) of the individual(s) on the board with responsibility for climate-related issues.
Position ofindividual(s)
Please explain
ChiefExecutiveOfficer (CEO)
Energy and climate related targets are part of the sustainability strategy. The sustainability strategy is reviewed and has to be approved by the CEO. The CEO oversees major capital expendituresfor energy investments, e.g. the 21,7 Mio. € for the district heating project in Hamburg. There are several reports on energy and climate targets that require approval by the CEO, e.g. the CDPquestionnaire.
C1.1b
CDP Page of 412

(C1.1b) Provide further details on the board’s oversight of climate-related issues.
Frequencywith whichclimate-relatedissues are ascheduledagenda item
Governancemechanisms intowhich climate-related issues areintegrated
Scope ofboard-leveloversight
Please explain
Scheduled –some meetings
Reviewing andguiding strategyReviewing andguiding major plansof actionReviewing andguiding riskmanagementpoliciesReviewing andguiding annualbudgetsReviewing andguiding businessplansSettingperformanceobjectivesMonitoringimplementation andperformance ofobjectivesOverseeing majorcapitalexpenditures,acquisitions anddivestituresMonitoring andoverseeingprogress againstgoals and targetsfor addressingclimate-relatedissues
<NotApplicable>
Energy and climate related targets are part of the sustainability strategy. The sustainability strategy is reviewed and has to be approved by the CEO. Thesustainability strategy is part of the groups business strategy. An example of how a governance mechanism selected contributes to the boards oversight is that theCEO oversees major capital expenditures for energy investments, e.g. the 3,5 Mio. € for the district heating project in Hamburg. There are several reports onenergy and climate targets that require approval by the CEO, e.g. the CDP questionnaire. Furthermore, climate related risks are monitored and reported quarterlyto the board. Weekly discussions are held (among other core activities) on exposure to climate related costs, with a discussion of mitigation actions.
C1.2
(C1.2) Provide the highest management-level position(s) or committee(s) with responsibility for climate-related issues.
Name of the position(s) and/orcommittee(s)
Reporting line Responsibility Coverage ofresponsibility
Frequency of reporting to the board on climate-relatedissues
President <NotApplicable>
Both assessing and managing climate-related risks andopportunities
<Not Applicable> More frequently than quarterly
Environment/ Sustainability manager <NotApplicable>
Assessing climate-related risks and opportunities <Not Applicable> More frequently than quarterly
C1.2a
CDP Page of 413

(C1.2a) Describe where in the organizational structure this/these position(s) and/or committees lie, what their associated responsibilities are, and how climate-related issues are monitored (do not include the names of individuals).
Senior Vice President Corporate Energy & Climate Affairs and Energy Managers: The development and implementation of the group-wide energy strategy is the centralresponsibility of the head of Corporate Energy & Climate Affairs, who reports directly to the CEO. This includes the local energy supply and purchasing strategy, CO2management and the coordination of the local energy management systems and the energy efficiency network. Such composition ensures an appropriate overview for theCEO related to important and emerging climate topics and enables short decision paths. In weekly Jour Fixes status of measures are reported, for example progress inenergy efficiency projects, by the team of six Energy Managers. Planned local investments with effects on energy consumption, energy efficiency and CO2 emissions arecoordinated together with the plant managers and/or energy officers.
Vice President Environmental Protection and Environment Managers: The Senior Vice President Operations and the Vice President of Corporate EnvironmentalProtection are responsible for the strategic positioning of environmental protection in the Group. Corporate Environmental Protection reports directly to the Senior VicePresident Operations. Such composition ensures that the Senior Vice President Operations has appropriate overview of relevant standards and can ensure adherence tolegal environmental requirements. Standards are implemented by the head of Corporate Environmental Protection together with the plant managers at the sites. Togetherwith the sites’ environmental officers, Corporate Environmental Protection supervises adherence to the legal environmental requirements, regulatory provisions, standardsand business demands. Environment Managers request environmental KPI (including carbon emissions and energy consumption)on a yearly basis from all plants forreporting and monitoring.
Important current issues and developments are reported more frequently to the Executive Board.
Sustainability managers: Sustainability is organized within the company in Investor Relations & Corporate Communications. The Vice President Investor Relations &Corporate Communications reports directly to the Executive Board. Sustainability Management serves as the interface between the headquarters and the sites andcoordinates all of the processes related to this topic. It is also responsible for continuously reviewing and developing the Sustainability Strategy at the same time. TheSustainability Management cooperates with the respective divisions and departments in the Aurubis Group and assists with the operative implementation of sustainabilitymeasures. The targets and measures are monitored and reviewed in close coordination with the involved departments and the Executive Board. Climate Change targets arepart of the Sustainability Strategy. The Supervisory Board is informed monthly about current sustainability developments.
Executive Director Corporate Risk Management: The Executive Director Corporate Risk Management is responsible for managing the corporate risk management, whichnaturally includes risk reporting as well. Standard risk reporting, takes place bottom-up each quarter using a uniform, group-wide reporting format. Climate-related risks arealso recorded in this way in order to obtain a comprehensive picture of the risks and possible interdependencies and connections with other types of risk. Within this reportingformat, the identified risks and especially risks beyond a defined threshold are explained and evaluated on the basis of their probability of occurrence and their businesssignificance. Measures to manage them are then individually outlined.
C1.3
(C1.3) Do you provide incentives for the management of climate-related issues, including the attainment of targets?
Provide incentives for the management of climate-related issues Comment
Row 1 Yes
C1.3a
(C1.3a) Provide further details on the incentives provided for the management of climate-related issues (do not include the names of individuals).
Entitled to incentive Type ofincentive
Activityinventivized
Comment
President Monetaryreward
Efficiency project The Senior Vice President Corporate Energy and Climate Affairs has yearly target agreements, which form the basis for the additional rewards. Energyefficiency is included in these targets due to its great importance for Aurubis. This also covers the emission reduction targets, projects and initiatives.
President Monetaryreward
Emissionsreduction target
The Vice President Corporate Environmental Protection has yearly target agreements, which form the basis for additional rewards. In these targets forenvironmental managers, Environmental Key Performance Indicators are of great importance and are therefore included.
Energy manager Monetaryreward
Efficiency target Managers have yearly target agreements, which form the basis for additional rewards. Energy efficiency is included in these targets due to its greatimportance. This covers the project management of the initiatives mentioned in CC 4.3a
Environment/Sustainabilitymanager
Non-monetaryreward
Other (pleasespecify)(Compliance withsustainabilitystrategy)
Managers have yearly target agreements, which form the basis for additional recognition. In these targets for sustainability managers, compliance withthe Sustainability Strategy is of great importance.
All employees Monetaryreward
Emissionsreduction projectEnergy reductiontargetEfficiency projectBehavior changerelated indicatorSupply chainengagement
At Aurubis AG, there is a company suggestion scheme (Betriebliches Vorschlagswesen, BVW). This allows employees to submit their suggestions andideas. If the ideas are successfully implemented, employees receive monetary compensation. These suggestions include any ideas that contribute toimprovements, for example in the area of occupational health and safety, health and environmental protection, resource efficiency or the effectiveness ofsocial institutions.
CDP Page of 414

C2. Risks and opportunities
C2.1
(C2.1) Does your organization have a process for identifying, assessing, and responding to climate-related risks and opportunities?Yes
C2.1a
(C2.1a) How does your organization define short-, medium- and long-term time horizons?
From (years) To (years) Comment
Short-term 0 1
Medium-term 1 3
Long-term 3 10
C2.1b
(C2.1b) How does your organization define substantive financial or strategic impact on your business?
A risk that is clustered with a high probability of occurrence and will have a financial impact exceeding 50 million € is classified as a high risk (substantive financial impact).
In case such a risk appears on the risk portfolio and would be conflicting with existing strategic targets, we would counter this risk and redefine strategic targets, if necessary.If a new risk is identified that could have a significant impact on earnings or bears reputational risks, it must be immediately reported to the Board of Executive Directors.
In general, Aurubis Group defines strategic impact as an impact which limits or extends future possibilities for strategic actions and therefore may require strategyadjustments.
C2.2
(C2.2) Describe your process(es) for identifying, assessing and responding to climate-related risks and opportunities.
Value chain stage(s) coveredDirect operations
Risk management processIntegrated into multi-disciplinary company-wide risk management process
Frequency of assessmentMore than once a year
Time horizon(s) coveredShort-termMedium-termLong-term
Description of processRisk management officers have been appointed for all sites, business sectors and central functions, and they form a network within the Group. The Group headquarters inHamburg manages the network. The RMS is documented in a corporate policy. Standard risk reporting takes place bottom-up each quarter using a uniform, group-widereporting format. Within this format the identified risks and risks beyond a defined threshold are explained and evaluated on the basis of their probability of occurrence andtheir business significance, and measures to manage them are outlined. The risks registered with Group headquarters are qualitatively aggregated into significant riskclusters by Corporate Risk Management and reported to the entire Executive Board. The report also establishes the basis for the report to the Audit Committee of theSupervisory Board ("Audit Committee") as well as external risk reporting. In the report to the Executive Board and the Audit Committee, the qualitatively aggregated riskclusters are assessed with due regard to risk management measures (net perspective) based on their probability of occurrence and the potential effect on earnings pursuantto the spreads included in the table, and are classified as low, medium or high. Risks are clustered according to their potential effect on earnings, determined by theprobability of occurrence and financial impact of occurrence. A risk that is clustered with a high probability of occurrence and will have a financial impact exceeding 50 million€ is classified as a high risk (substantive financial impact). One relevant risk issue is energy that amongst others identifies the risk of increasing carbon costs due to politics’goal to comply with the Paris Agreement to combat climate change. Also, customer’s demand for transparent goals and strategies regarding effective production processes,energy and carbon efficiency is incorporated in the risk management and countered by reporting to CDP. On top of this exercise a strategic risk portfolio is set up andupdated once a year in close cooperation with Corporate Development / Strategy. The focus of this strategic risk portfolio is on long-term risks. All risks that are somehowconnected to climate change are clearly indicated in this portfolio.
C2.2a
CDP Page of 415

(C2.2a) Which risk types are considered in your organization's climate-related risk assessments?
Relevance&inclusion
Please explain
Currentregulation
Relevant,alwaysincluded
Inclusion in risk assessment: Aurubis systematically includes regulation risks into the risk assessment process. Aurubis actively takes part in the political dialogue to counter the challengesthat regularly arise from changes to regulatory requirements. Corporate Energy and Climate Affairs and Corporate External Affairs monitor the regulatory situation and create regularupdates in exchange with trade associations. Based on this is a quarterly risk assessment done to quantify the impacts and estimate the likelihood. Example: One example are financialburdens resulting from changes in potential cost drivers such as the EU Emission Trading Scheme (ETS). Aurubis is covered by the EU ETS for six installations throughout the EU, withtotal direct emissions amount of ~ 460.000 t CO2e in 2019. Other Burdens resulting from changes in potential cost drivers such as the German Renewable Energys Act (EEG), theemissions trade, grid charges and the eco-tax are quantified in the climate-related risk assessments in order to the possible loss of exemptions due to not qualifying or drastic changes inregulation. However we have climate-related risk assessments that analyze the maximal magnitude of risks, if total exemption cases are lost.
Emergingregulation
Relevant,alwaysincluded
Inclusion in risk assessment: Aurubis assesses and values the risk quarterly and actively takes part in the political dialogue to counter the challenges that regularly arise from changes toregulatory requirements. Corporate Energy and Climate Affairs and Corporate External Affairs monitor the regulatory situation and create regular updates in exchange with tradeassociations. Aurubis is covered by the EU ETS for six installations throughout the EU, with total direct emissions amount of ~ 440.000 t CO2e in 2019. Example: The fundamentalretention of the special Carbon Leakage status for certain sectors starting in 2021 with regard to the allocation of free Emission Trading allowances and CO2 electricity price compensationstands out politically. The completion of the decision-making for the CO2 electricity price compensation is still pending. However, we expect to see a rise in CO2 costs due to increases inCO2 prices resulting from the supply shortage of available CO2 certificates in the coming trading period as well policy actions like the market stabilization reserve.
Technology Relevant,sometimesincluded
Inclusion in risk assessment: Aurubis assesses and values the risk quarterly. However, it has to be stated that Aurubis currently cannot offset its own CO2 emissions against the amount ofCO2 reduction resulting from projects like “Industrial heat”. Due to rising burdens by CO2, Aurubis evaluates alternative low or zero carbon technologies as alternatives. Example: Aurubisstarted initiatives for decarbonization (e.g. industrial heat utilization or power to steam) that normally do not fulfil the financial requirements for project approval of Aurubis. But due to theassessment of future demands in a low carbon future, decisions are made to approve these projects, by taking into account these climate related risks (higher CO2 costs, fluctuatingelectricity supply by renewables).
Legal Relevant,alwaysincluded
Inclusion in risk assessment: The violation of laws can have serious consequences for Aurubis as a Group and also for its employees and business partners. Therefore, we consistentlyfollow all legal requirements. Significant compliance risks are identified, analyzed and communicated by Compliance Management. We counter legal and tax risks with organizationalprocedures and clear management structures. There is always a risk that environmental or regulatory provisions could become more stringent, leading to added costs or limitations inproduct fabrication and marketing. Example: For the climate-related risks, assessments are conducted by using scenario analysis of changing legislations and resulting increased burdens.These Burdens resulting from changes in potential cost drivers such as the German Renewable Energys Act (EEG), the emissions trade, grid charges and the eco-tax are quantified in theclimate-related risk assessments in order to the possible loss of exemptions due to not qualifying or drastic changes in regulation.
Market Notrelevant,explanationprovided
Reason for non-inclusion: As copper is a commodity with worldwide equal prices, at the moment, customers do not pay more for premium products like “green copper”. However,increasing demands for transparent goals and strategies with regard to effective production processes, energy and CO2 efficiency could represent an influence on future copper productsales, particularly in terms of customer acquisition and retention. In addition, due to megatrends like e-mobility, renewable energy production, digitization a rising demand for copper isexpected for the future. We monitor customer expectations through close contact and exchange with customers and general market surveys. Several customers ask us to answer CDPClimate Change questionnaire. As counter steps we do the annual climate reporting and the evaluation of this reporting by means of the CDP.
Reputation Relevant,alwaysincluded
Inclusion in risk assessment: Aurubis systematically includes reputation risks into the risk assessment process. The growing interest and increasing requirements from the surroundingenvironment validate our actions, as Aurubis is an energy intensive company emitting more than 1,44 Mio. t CO2 (direct and indirect) in 2019. Our responsible departments monitor theexpectations of different stakeholders closely and engage in dialogues. Our external affairs, sustainability, communication and environmental departments monitor the reputation especiallyin the local surrounding of the plants and reports the risk assessment to the risk management. We work for a good relation to the local authorities. Therefore we work together with the localauthorities in initiatives (like Hamburger Klimabündnis ) and monitor emissions more than legally required. Additionally, we engage in projects like low carbon industrial heat for municipalheat supply. For example, meanwhile our customers are attaching more value to topics such as environmentally sound products, climate protection, modern production processes and aresponsible and reliable supply of raw materials. In addition to investors, our customers are also paying heightened attention to whether Aurubis participates in climate reportings such asthe “CDP” (formerly Carbon Disclosure Project).
Acutephysical
Relevant,alwaysincluded
Inclusion in risk assessment: Aurubis systematically includes acute physical risks into the risk assessment process. At certain times, today’s climate and weather conditions have aneconomic impact on companies such as Aurubis. During every winter season, when acute extreme weather conditions could occur at our site in Hamburg, a special seasonal team “IceAge Team” assesses weather risks by analyzing weather reports and develop alternative solutions with potential service providers for the case that the sea routes are not usable becauseof certain weather conditions. Furthermore, we are monitoring for some sites the water levels and temperatures of nearby rivers (e.g. Rhine in Emmerich or Elbe in Hamburg) due to theavailability of sufficient cooling water. In cases of warm water or low tides we are going to start up alternative cooling concepts. Example: Occasionally, weather and climate disrupt thesmooth operation of the supply chain in raw material procurement, such as when shipping lines carrying vital supplies of anodes and cathodes have to keep their vessels tied up becauseof hurricanes in the Atlantic. Another scenario is when storms and rain make it impossible to unload copper concentrate at Brunsbüttel, the port of discharge at the mouth of the Elbe Riverused by Aurubis Hamburg. These settings can result in delays and shortfalls in supply, and Logistics has to come up with an answer so that production does not grind to a halt.
Chronicphysical
Relevant,alwaysincluded
Inclusion in risk assessment: Aurubis systematically includes chronic physical risks into the risk assessment process. As we purchase concentrates from all over the world, climate changerelated impacts on transportation routes (rise of sea level, extreme weather conditions, etc.) can be one of several risks for securing our raw materials supply. We deal with logistics risksby implementing a thorough, multi-step acceptance process for service providers, by avoiding single sourcing as far as possible, and by preventively developing back-up solutions. Wehave an international network of qualified service providers at our disposal and, for instance, prevent weather-related risks in the transport chain by minimizing contingency risks throughcontractual arrangements that provide for appropriate alternatives. Example: Water related risks are also substantial for mines and one of the reasons for negative impacts on production.Our diversified supplier base regarding different countries and region reduces this risk. Environmental impact is one of our criteria in our business partner screening to minimizesustainability risks in our supply chain.
C2.3
(C2.3) Have you identified any inherent climate-related risks with the potential to have a substantive financial or strategic impact on your business?Yes
C2.3a
(C2.3a) Provide details of risks identified with the potential to have a substantive financial or strategic impact on your business.
IdentifierRisk 1
Where in the value chain does the risk driver occur?Direct operations
Risk type & Primary climate-related risk driver
Current regulation Carbon pricing mechanisms
Primary potential financial impactIncreased indirect (operating) costs
Climate risk type mapped to traditional financial services industry risk classification<Not Applicable>
CDP Page of 416

Company-specific descriptionAll companies that emit carbon dioxide must have the corresponding rights for this. Six of our European sites are in the scope of the EU-ETS, covering 86% of total Scope 1emissions. These local additional CO costs reduce the competitiveness of European industry in an international comparison. To balance these effects, so-called carbonleakage sectors were established, including the copper industry. This status currently softens the effect of the general reduction of allocated CO₂ certificates to a greatextent. In order to protect the copper industry from disadvantages in international competition, the European Union (EU) has already authorized limited compensation forelectricity price increases stemming from CO₂ emissions trading. Some EU member states, including Germany, have adopted corresponding funding guidelines. Due to EUregulations for the copper industry, however, the compensation approved in Germany, where about 60% of our production facilities are located, is only 50 % effective. Thisleads to a significant remaining load due to indirect CO₂costs, despite our existing carbon leakage protection. The copper production and processing industry is expected tocontinue receiving free allocations of emission trading allowances for direct CO2 emissions between 2021 and 2030 due to its carbon leakage status. However, taking intoaccount the political goals of the Paris Agreement, we expect a decline in the free allocation of allowances. The CO2 price increased substantially again in the past year.The supply of CO2 certificates is set to be significantly reduced in the coming trading period, which should raise prices considerably. The political decision-making processregarding the form and amount of compensation for indirect CO2 costs in electricity as of 2021 has started. The copper sector needs to remain eligible for compensation asa matter of principle. The completion of the decision-making for indirect compensation process is still pending. However, we expect to see a rise in CO₂costs due toincreases in CO₂prices resulting from the supply shortage of available CO₂certificates in the coming trading period (2021–2030). This circumstance was envisaged bypoliticians with the goal of complying with the Paris climate accord. In addition to the European regulations, an increase in the CO₂ price is also being discussed inGermany. We expect costs to increase in the medium term overall, which could lead to significant strains.
Time horizonShort-term
LikelihoodLikely
Magnitude of impactHigh
Are you able to provide a potential financial impact figure?Yes, an estimated range
Potential financial impact figure (currency)<Not Applicable>
Potential financial impact figure – minimum (currency)1000000
Potential financial impact figure – maximum (currency)50000000
Explanation of financial impact figureThe potential financial impact of critical developments due to changes in ETS legislation is registered by our risk management in a risk cluster as “medium”. According toour risk cluster stated in the Annual Report 2018/19 page 96, a medium risk means the additional operational costs will exceed € 1 million and could even reach levels ofover € 50 million, depending on probability and underlying context. Carbon price forecasts and a prognosis of Aurubis’ emission balance have been taken into account.
Cost of response to risk2200000
Description of response and explanation of cost calculationOur objective is to help shape the legal conditions for environmentally sound copper production in Europe with our knowledge and many years of experience. The areas ofraw materials, energy and environmental protection and the reduction of trade restrictions are at the forefront of our dialogue with policymakers. Our partners are membersof the European Parliament, the German Bundestag, representatives of the European Commission (EC), federal and state ministries and civil society groups. As inprevious years, in 2019 Aurubis continued to regularly participate in public consultations, either directly or indirectly through associations. During the reporting period, thistook place via the German Federal Ministry for Economic Affairs and Energy on the electricity market law, on the EC’s Circular Economy Package and on the plannedreform of the EU ETS. Aurubis also actively takes part in the political dialogue to counter the challenges that regularly arise from changes to regulatory requirements. Forexample, in Germany we participate in the Energy Efficiency Platform led and initiated by the BMWi in 2014. Working groups meet regularly on topics like energymanagement. The development of joint solutions is discussed together with the relevant stakeholders from business, civil society, science, public departments and thefederal states. Situation: The EU ETS leads to significant additional indirect CO costs, despite the trading allowances for direct CO2 emissions provided to the copperindustry. However, considering the political goals of the Paris Agreement, we expect a decline in the free allocation of allowances. The supply of CO2 certificates is set to besignificantly reduced in the coming trading period, which should raise prices considerably. Task: Although the European Commission is striving to reduce the number ofsectors with carbon leakage status, the copper sector must still be eligible for compensation. Action: In 2019 Aurubis continued to participate in public consultations, e.g. viathe German Federal Ministry for Economic Affairs and Energy on the planned reform of the EU ETS. Result: The political decision-making process regarding thecompensation for indirect CO2 costs in electricity as of 2021 has started and we see ourselves in a good position to help ensure that the copper industry stays eligible forcompensation/trading allowances. How the figure was calculated: Cost of Energy and Climate Department, that manages these issues.
Comment
IdentifierRisk 2
Where in the value chain does the risk driver occur?Downstream
Risk type & Primary climate-related risk driver
Reputation Increased stakeholder concern or negative stakeholder feedback
Primary potential financial impactDecreased revenues due to reduced demand for products and services
Climate risk type mapped to traditional financial services industry risk classification<Not Applicable>
Company-specific descriptionThe public is more aware now than ever as to whether a company engages in responsible business practices. When compared within the global industry, our efforts havebeen successful and we hold a leading position in energy efficiency. However, as we increase productivity and efficiency, we also reach our technical limits. Efficiencyenhancements that have already been achieved don’t serve as a blueprint for future development because the more steps that have already been taken in energy
CDP Page of 417

efficiency, the more difficult it is to optimize energy demand further. Because there are technological limits to reducing energy consumption and emissions, a continued highlevel of investment leads to only marginal improvements compared to past years. Environmental protection already accounts for a large proportion of energy consumption atAurubis, as the rising use of complex recycling raw materials with comparatively low copper content requires a higher amount of energy. At out plant in Lünen 30% of ourelectricity consumption is caused by environmental protection measures. This target conflict is not apparent at first sight, but states a big challenge for Aurubis.
Time horizonLong-term
LikelihoodUnlikely
Magnitude of impactMedium-low
Are you able to provide a potential financial impact figure?Yes, an estimated range
Potential financial impact figure (currency)<Not Applicable>
Potential financial impact figure – minimum (currency)1000000
Potential financial impact figure – maximum (currency)5000000
Explanation of financial impact figureReputation loss can result from various risk drivers and thus financial implications could reach 1 Mio € or more. The impact is estimated because the risk is substantial andwe observe risks with a financial impact of more than 1 Mio. €. The actual impact is not predictable because of many variable components.
Cost of response to risk10000
Description of response and explanation of cost calculationAurubis regularly participates in public consultations, either directly or indirectly through associations. One example is the participation in the CDP, without this participationthe reputation and transparency would drop down. Transparency underpins our aim to successfully manage Aurubis as a company that lives by its sustainability credentialsand communicates this stance appropriately. This includes the diverse aspects of our supply chains, our strategy with regard to the environment, resources, the people atthe heart of our daily work at Aurubis and our partners. Transparency helps us both in terms of our business and our sustainability targets. Transparent communicationmakes this possible – for customers, suppliers, investors, the people living near our facilities and, last but not least, for us – the people at Aurubis. (NachhaltigkeitsberichtS.10) One example of how Aurubis engages in matters of transparency is the participation in CDP reporting since 2014. Additionally on customer's request we take part inthe EcoVadis Supplier's Platform and are rated on our environmental, social and governance performance. For our performance in 2018 we got the Gold Status ( like only5% of all participants of EcoVadis). How figure in „Cost of management“ was calculated: Situation: The public is more aware now than ever as to whether a companyengages in sustainable business practices, that consider among other things climate activities. Misconduct or negligence can lead to a loss of trust and thus customers.Task: Aurubis has to determine in exchange with its stakeholders which sustainability initiatives are important and then decide which initiatives to participate in and to whatextent and with what objectives the participation should take place. Action: Aurubis has been participating in CDP since 2014 and at a later stage also joined EcoVadis.Result: In 2019 Aurubis managed to participate in CDP and EcoVadis, both times achieving a rating that was well above the average. This further solidified the company’simage as an outperformer in terms of sustainability and climate reduction. No additional costs for management, as they are already part of organization. However,participating in the annual CDP report costs the participation fee, which doesn’t exceed € 10,000.
Comment
IdentifierRisk 3
Where in the value chain does the risk driver occur?Direct operations
Risk type & Primary climate-related risk driver
Acute physical Increased severity and frequency of extreme weather events such as cyclones and floods
Primary potential financial impactOther, please specify (Delays in delivery or failure to deliver)
Climate risk type mapped to traditional financial services industry risk classification<Not Applicable>
Company-specific descriptionAt certain times, today’s climate and weather conditions have an economic impact on companies such as Aurubis. Occasionally, weather and climate disrupt the smoothoperation of the supply chain in raw material procurement, such as when shipping lines carrying vital supplies of anodes and cathodes have to keep their vessels tied upbecause of hurricanes in the Atlantic. Another scenario is when storms and rain make it impossible to unload copper concentrate at Brunsbüttel, the port of discharge at themouth of the Elbe River used by Aurubis Hamburg. The yearly shipped amount of copper concentrate is 1 .1 Mio. tons. Therefore, each day of supply disruption 3,000 tonsof copper concentrate could not be processed. Furthermore, each day supply disruption leads therefore to a loss of ca. 1,100 tons of copper production. These settings canresult in delays and shortfalls in supply, and Logistics has to come up with an answer so that production does not grind to a halt.
Time horizonLong-term
LikelihoodAbout as likely as not
Magnitude of impactMedium-low
Are you able to provide a potential financial impact figure?Yes, an estimated range
CDP Page of 418

Potential financial impact figure (currency)<Not Applicable>
Potential financial impact figure – minimum (currency)1000000
Potential financial impact figure – maximum (currency)50000000
Explanation of financial impact figureThe financial implications of a delay in supply are hard to quantify, according to our risk cluster a potential more extensive disruption in supply causing a standstill isclassified as medium. According to our risk cluster stated in the Annual Report 2018/19 page 96, a medium risk means the additional operational costs will exceed € 1million and could even reach levels of over € 50 million, depending on probability and underlying.
Cost of response to risk0
Description of response and explanation of cost calculationOne management method to mitigate climate risks is the establishment of the “Ice Age Team” at Aurubis Hamburg in 2009. Situation: Aurubis is dependent on the supply ofraw materials by its suppliers. Occasionally, weather and climate disrupt the smooth operation of the supply chain in raw material procurement, such as when shipping linescarrying vital supplies of anodes and cathodes have to keep their vessels tied up because of hurricanes in the Atlantic. Task: Aurubis must structure its purchasing in sucha way that it can react flexibly to individual delivery failures and that the management of capacities is neither too conservative nor too excessive. Action: During the winterseason, this team monitors weather scenarios and the logistical implications for the site. Every October, they start their work by analyzing the previous winter's data anddevelop alternative solutions with potential service providers for the case that the sea routes are not usable because of certain weather conditions. The team also discussesthe correct stock of copper concentrate during the winter months, which ensures that production won’t be interrupted but also doesn’t exceed the capacities of storage. Also,Aurubis Hamburg has been cooperating more closely with the German weather service and the Hamburg Climate Institute in recent years to understand better how certainweather conditions develop. The Ice Age Team also makes sure that from November to March of each and every winter, an ice-going tugboat is made available exclusivelyto Aurubis within 24 hours upon request, and this vessel can break the ice in the channels and push or tow a loaded lighter (an unpowered barge). Result: The existence ofthe Ice Age Team has prevented Aurubis from being confronted with delivery difficulties in calendar year 2019 due to weather or climate conditions. How figure in „Cost ofmanagement“ was calculated: The management of this risk causes no additional costs, because the Ice Age Team consists of staff from different Aurubis departments andis thereby already covered by the organization.
Comment
C2.4
(C2.4) Have you identified any climate-related opportunities with the potential to have a substantive financial or strategic impact on your business?Yes
C2.4a
(C2.4a) Provide details of opportunities identified with the potential to have a substantive financial or strategic impact on your business.
IdentifierOpp1
Where in the value chain does the opportunity occur?Please select
Opportunity typeEnergy source
Primary climate-related opportunity driverUse of lower-emission sources of energy
Primary potential financial impactReduced indirect (operating) costs
Company-specific descriptionThe EU and its member states are setting targets for enhancing energy efficiency and reducing carbon emissions across all sectors. There is an increasing pressure tothink of new projects that are able to link sectors and their potential to contribute to the climate targets. Aurubis is able to extract residual heat from its production processes.The use of residual heat replaces fossil fuels in the heat and steam production and therefore not only increases the level of energy efficiency, but also reduces carbonemissions. In October 2018, Aurubis commissioned a 3.7-km-long pipeline that transfers excess heat from our Hamburg plant to our partner enercity AG, who then suppliesthe neighbourhood HafenCity East with heat. We avoid 20,000 t of CO2 per year as a result. For this purpose, Aurubis extracts heat that is formed when sulfur dioxide – aby-product of copper smelting – is converted to sulfuric acid. This industrial waste heat is nearly free of CO2 and its utilization reduces CO2 emissions by more than 20,000t per year. About half of this reduction results from the replacement of natural gas used to produce steam on the Aurubis plant premises, while the other half is saved bydelivering the waste heat to enercity AG. In Hafencity East alone, about 4,500 t of CO2 will be saved each year in the final expansion (target 2029). The supply of residualheat to the HafenCity East ramped up end of 2018 and is expected to increase due to the construction of new buildings. The internal use was ramped up in mid of 2019. Thefirst stage of the industrial heat project was honoured with several awards, e.g. dena Energy Efficiency Award, German Renewables Award 2018 etc. With reduction of20,000 t CO2 annually, this project has a potential to reduce up to 140,000 t. That alone accounts for over 90 % of the voluntary CO2 reduction commitment that Hamburgcompanies have agreed on. Another example of project which contributed to reduction of carbon emissions is Aurubis power-to-steam plant (electrode boiler), which wentonline in 2019. It can reduce CO2 emissions by up to 4,000 t per year by using renewable energies. Aurubis achieves large part of this reduction outside of the plantboundaries. This means that it is only offset against Aurubis' CO2 emissions to a limited extent. The plant transforms the power supply system’s excess electricity, which isproduced from renewable energies, into steam.
Time horizonShort-term
LikelihoodVirtually certain
CDP Page of 419

Magnitude of impactMedium-high
Are you able to provide a potential financial impact figure?Yes, a single figure estimate
Potential financial impact figure (currency)250000
Potential financial impact figure – minimum (currency)<Not Applicable>
Potential financial impact figure – maximum (currency)<Not Applicable>
Explanation of financial impact figureReplacing fossil fuels via residual heat utilization constitutes an economic counter value. One part of the recovered waste heat is used in the "Hafencity East" in Hamburg.The other part is used to substitute the use of natural gas for heat production at our site. By saving natural gas we save up to 10.000 tCO₂ at our plant. The current CO₂price is 25€/t. Total savings amount up to 250.000 €/a. In addition, it is a reduction of operational costs.
Cost to realize opportunity20000000
Strategy to realize opportunity and explanation of cost calculationReplacing fossil fuels via residual heat utilization constitutes an economic counter value. One part of the recovered waste heat is used in the "Hafencity East" in Hamburg.The other part is used to substitute the use of natural gas for heat production at our site. Situation: The EU and its member states are setting targets for enhancing energyefficiency and reducing carbon emissions across all sectors. Task: There is an increasing pressure to think of new projects that are able to link sectors and their potential tocontribute to the climate targets. Action: Aurubis is able to extract residual heat from its production processes. The use of residual heat replaces fossil fuels in the heat andsteam production and therefore not only increases the level of energy efficiency, but also reduces carbon emissions. Aurubis takes a close look at all types of waste heatproduced from its processes. In Aurubis Hamburg plant 87% of process steam needs are covered by waste heat. Aurubis joined forces with energy service providerenercity AG to launch Germany’s largest industrial heat project and we are now supplying the Hamburg neighbourhood HafenCity East with industrial heat from Aurubis.Result: This award-winning project saves around 20,000 t of carbon dioxide (CO2) emissions per year through the reuse of heat. About half of the reduction results fromavoiding the use of natural gas to produce steam on our plant premises; we save the other half by delivering the waste heat to enercity AG. Furthermore, our contact acidplant no longer has to be cooled with river water, so we use about 12 million m3 less cooling water. The total potential heat volume that could be extracted at Aurubisamounts to up to 500 million kWh, which could cover more than a tenth of Hamburg’s district heating needs and prevent about 140,000 t of CO2. Furthermore, a power-to-steam facility (electrode boiler) was installed at the Aurubis Hamburg plant. During periods of surplus renewable energy in the grid, the facility converts the energy intosteam for internal processes, e.g. for drying of Cu concentrates. Cost calculation: Aurubis invested roughly € 20 million to convert the facilities and move the heat pipeline tothe plant boundary. Aurubis received funding for about 30 % of its investments from the German Federal Ministry for Economic Affairs and Energy (BMWi) via theDevelopment Loan Corporation (KfW).
Comment
IdentifierOpp2
Where in the value chain does the opportunity occur?Direct operations
Opportunity typeResource efficiency
Primary climate-related opportunity driverUse of recycling
Primary potential financial impactReduced direct costs
Company-specific descriptionMetals are an important prerequisite for technical progress as well as a high standard of living. Given a constantly increasing demand paired with a limited availability ofresources on the other site, metal recycling plays an important role as raw material source. Aurubis is the worldwide leading recycler of copper and complex secondary rawmaterials. In light of the rising importance of resource efficiency regarding sustainability, we expect demand for recycling solutions to continue growing. This is alsosupported and promoted by increasingly strict national and international legislation. Thanks to our multi-metal recycling activities and proximity to our copper productcustomers, we consider ourselves to be in a good position to offer expanded closing-the-loop solutions. Due to higher consumption levels and shorter product lifecycles, thesupply of recycling raw materials is also growing more quickly. In order to utilize the rising volume of secondary raw materials from the IT and telecommunications sectors,for instance, we are expanding the processing capacities for these types of e-scrap, working on new technologies and investing in state-of-the-art facilities. Aurubis AG hasacquired the recycling company Metallo - closing of the transaction took place on May 29, 2020. As a result, Aurubis has now more than 1 million tons of recycling capacityfor secondary material. The input material portfolio is diverse. It extends from production waste such as clean wire scrap, stamping waste and copper cable to end-of-liferecycling raw materials. These include old gutters, pipes, electronic scrap and used electrical appliances. However, we do not rely on the circular economy for copperalone. Nearly all the other metals from the recycling materials are converted into marketable products at Aurubis. Roughly 50 % of our precious metal output comes fromrecycling. Complex recycling material input in the Kayser Recycling System (KRS) at the Lunen site reached 259,000 t in fiscal year 2018/19 (previous year: 267,000 t)
Time horizonShort-term
LikelihoodVirtually certain
Magnitude of impactMedium-high
Are you able to provide a potential financial impact figure?Yes, a single figure estimate
Potential financial impact figure (currency)1000000000
Potential financial impact figure – minimum (currency)<Not Applicable>
CDP Page of 4110

Potential financial impact figure – maximum (currency)<Not Applicable>
Explanation of financial impact figureThe Aurubis' revenues from precious metals amounted to 2,865 Mio € in fiscal year 2018/19. Revenue development significantly depends on metal price development. Thisrevenue results mainly from processing of concentrates and the outcome of the recycling of complex materials. Roughly 50 % of our precious metal output derives fromrecycling materials. . Therefore potential financial impact is more than 1,000 Mio € on revenue.
Cost to realize opportunity380000000
Strategy to realize opportunity and explanation of cost calculationOur strategic reorientation to becoming a multi-metal company implies that we are investing more in recycling processes for precious metals and non-ferrous metals.Situation: Metals are an important prerequisite for technical progress as well as a high standard of living. Given a constantly increasing demand paired with a limitedavailability of resources on the other site, metal recycling plays an important role as raw material source. Aurubis is the worldwide leading recycler of copper and complexsecondary raw materials. In light of the rising importance of resource efficiency regarding sustainability, we expect demand for recycling solutions to continue growing. Thisis also supported and promoted by increasingly strict national and international legislation. Task: In the metal industry, recycling is an established prerequisite for efficientand sustainable business activity. Given that copper can be recycled over and over again without loss of quality, recycling is particularly important for Aurubis. Action: Ourstrategic reorientation to becoming a multi-metal company implies that we are investing more in recycling processes for precious metals and non-ferrous metals.Consequently, we have set the target in both the Corporate Strategy and the Sustainability Strategy to extract many metals besides copper through recycling. In this way,we contribute to a circular economy and thus to the conservation of natural resources beyond our key expertise in copper recycling. Result: The Aurubis recycling centre inLünen is home to the Kayser Recycling System (KRS), which produces converter copper as well as a complex, zinc-bearing residue. Our long-term partner for this so-called KRS oxide is Grillo-Werke AG, which guarantees environmentally sound recycling and produces zinc sulfate from the KRS oxide. The zinc sulfate is used in the fibre,feed and fertilizer industries. Other elements are separated at Grillo and disposed of appropriately. Aurubis takes back the resulting residue, which contains copper, tin andlead, thus closing the recovered material cycle. This cooperation between Aurubis and the Grillo-Werke AG was awarded the second prize in the Responsible CareCompetition 2017. The prize is issued by the German chemical industry association “Verband der Chemischen Industrie (VCI)”.
CommentCost to realize opportunity: On Mai 29, 2020, Aurubis acquired the Belgian-Spanish recycling company Metallo Group for a purchase price of € 380 million. Integration ofMetallo facilitates implementation of the growth strategy while making an important contribution to the circular economy. Metallo specializes in processing recyclingmaterials with low metal contents, with a focus on tin, lead, nickel, zinc, and copper. Metallo has a zero waste business model, meaning it is able to convert all scrapmaterials into valuable output, making the company one of the frontrunners in metal recycling.
IdentifierOpp3
Where in the value chain does the opportunity occur?Direct operations
Opportunity typeResource efficiency
Primary climate-related opportunity driverUse of recycling
Primary potential financial impactReduced direct costs
Company-specific descriptionIn the discussion about climate change the aspect of resource efficiency is more important than ever. The responsible handling of natural resources is not only vital ineconomic but also in environmental matters. It is important that products are recycled over and over again at the end of their lifecycles. This ensures that valuable rawmaterials are used, resources are conserved and environmental impacts are prevented. Therefore, the direct return of valuable production scrap back into production is animportant component to implement a resource efficient economy. Aurubis fabricates about 1.08 million t of copper cathodes with a purity level of 99.99% per year. Thanksto Aurubis' distinct expertise in recycling, more than one third of these cathodes come from reprocessed copper containing recycling materials. In addition to coppercathodes, Aurubis offers its customers processed copper in form of preliminary products such as wire rod, shapes, pre-rolled strip, specialty wire and alloys.
Time horizonShort-term
LikelihoodVirtually certain
Magnitude of impactMedium-high
Are you able to provide a potential financial impact figure?Yes, a single figure estimate
Potential financial impact figure (currency)29500000
Potential financial impact figure – minimum (currency)<Not Applicable>
Potential financial impact figure – maximum (currency)<Not Applicable>
Explanation of financial impact figureMore than 358 thousand tonnes or more than 33.33% of Aurubis Group cathode output come from reprocessed copper containing scrap. Taking into account Aurubiscopper premium of 96 USD/t in calendar year 2019, we are speaking here about more than 29.5 Mio. € on additional revenue. In addition to copper cathodes, Aurubisoffers its customers processed copper in form of preliminary products such as wire rod, shapes, pre-rolled strip, specialty wire and alloys. Moreover additional financialimpact results from scrap refining charges.
Cost to realize opportunity0
Strategy to realize opportunity and explanation of cost calculationIn the discussion about climate change the aspect of resource efficiency is more important than ever. The responsible handling of natural resources is not only vital in
CDP Page of 4111

economic but also in environmental matters. Situation: It is important that products are recycled over and over again at the end of their lifecycles. This ensures that valuableraw materials are used, resources are conserved and environmental impacts are prevented. Task: Therefore, the direct return of valuable production scrap back intoproduction is an important component to implement a resource efficient economy. Action: Establishing and developing "closing-the-loop" systems as a result of new orintensified cooperation with original equipment manufacturers, retailers or copper product customers is one of the measures defined in the Aurubis Sustainability Strategy2018-2023. Result: Aurubis’ business model allows bringing copper scrap back into the production cycle without any detours or as we call it closing-the-loop. Moreprecisely, Aurubis is able to close three loops. Firstly, Aurubis closes the internal loop between different production areas. Production scrap and intermediate products thatoccur during the fabrication of copper products are directly sent to our smelters to be used in the production of new cathodes. Secondly, Aurubis is working closely togetherwith direct costumers and offers to collect their production scrap and returns it to the production process of copper and copper products. In this way, customers becomesuppliers at the same time. Our partners include renowned companies like ABB based in Switzerland. The third loop is our multi-metal recycling, that makes end-of-lifeproducts usable for the production of new products again. In addition to the raw materials recovered in production, the close cooperation with our customers enables thelogical recycling of products that have served their purpose. The long partnership between Deutsche Telekom AG and Aurubis’ subsidiary CABLO Metall-Recycling undHandel GmbH is testament to this. Aurubis receives old cables with a copper content of around 50 % as waste from one of Deutsche Telekom’s partners, TEQPORTServices GmbH, and processes them using green, expert methods to produce high purity copper. The target is to increase the number of "closing-the-loop" systems withdirect and indirect product customers from the metal value chain at least by 10 by 2022/23 (base FY: 2017/18).
CommentCost calculation: The management of this risk causes no additional costs, because the costs are already covered by budgets of the organizations’ business units.
C3. Business Strategy
C3.1
(C3.1) Have climate-related risks and opportunities influenced your organization’s strategy and/or financial planning?Yes
C3.1a
(C3.1a) Does your organization use climate-related scenario analysis to inform its strategy?Yes, quantitative
C3.1b
(C3.1b) Provide details of your organization’s use of climate-related scenario analysis.
Climate-relatedscenariosandmodelsapplied
Details
IEA 450 Selection of the scenario: Aurubis participated actively in the development of the BDI’s study “Climate paths for Germany”. The cross-sectoral debates pointed out, that only a global approach tocombat climate change is suitable to meet the 2° target. Which is why the IEA 450 scenario and its price projections were used for further analysis. Aim of the analysis was to investigate industrialprocesses and the industrial energy consumption regarding the challenges of a 2° scenario. Therefore, we gave input about our operations and productions and possible ways to decarbonize these.Time horizons considered/areas of organization considered: The IEA 450 scenario models a 2°C future until 2050. The inherent energy transformation from fossil to renewable, the vitally neededsignificant energy efficiency enhancements and revolution in industrial processes will have an impact on our production and our business model in the next 30 years. Results summary: The Studyresults were reviewed in Corporate Energy & Climate Affairs and were also used as in input during the development of the Business Strategy „Growth, Efficiency, and Responsibility” at Aurubis. For anenergy intensive company like Aurubis the main result of the 2° scenario is a significant increase of the carbon price. While the study showed that the 2° target is only achievable when climate actiontakes place globally, the more realistic scenario is a higher ambition level in Europe compared to the rest of the world. Influence of scenario analysis on business objectives and strategy: To projectpossible carbon prices Aurubis discussed intensively with other industry partners in the course of the development of Study “Climate Paths for Germany”. BCG projected, depending on the differentparameters a price of up to 124€/ tCO2 in 2050. Energy & Climate Affairs adopted this price into its scenario analysis. For 2030 we adopted the target carbon price of the EU Commission of 30€/ tCO2.With these assumptions we projected the inherent cost burden for Aurubis. Case study Situation: The inherent energy transformation from fossil to renewable, the vitally needed significant energyefficiency enhancements and revolution in industrial processes will have an impact on our production and our business model. Task: Two main action approaches were derived from this: Primarily,Aurubis’ carbon emissions must be reduced. Additionally, Aurubis' engagement with policy makers has to point out the necessity to provide Carbon Leakage protection for sectors that competeinternationally. Action: 1. An example how the business strategy has been directly influenced by the scenario analysis is the carbon reduction target set in our sustainability strategy that is part of ourbusiness strategy. 2. We are also using scenario analysis to assess future development of the EV sector, because it has direct impact on such commodity segments as metals and mining. Anotherfield, where we are using scenario analysis is around the growth of the recycling sector. Result: 1. We aim to reduce our CO2 by > 100,000 t by FY 2022/23 (base FY: 2012/13). The carbon reductiontarget was approved by the CEO. The target and inherent measures are monitored and reviewed in close coordination among the relevant departments and the Executive Board. The anticipation ofincreasing carbon prices as a result of political goals to comply with the Paris Agreement is published in our Annual Report 2018/2019. 2. An example where the business strategy has been directlyinfluenced by the scenario analysis is the target for strategic growth in our secondary business – 100 % volume growth in direct sourcing of complex recycling materials from collection points until fiscalyear 2022/23 (Baseline: fiscal year 2016/17).
C3.1d
CDP Page of 4112

(C3.1d) Describe where and how climate-related risks and opportunities have influenced your strategy.
Have climate-related risksandopportunitiesinfluencedyour strategyin this area?
Description of influence
Productsandservices
Yes How strategy has been influenced: As an integrated copper producer, Aurubis has set the objective of producing even more copper from secondary materials, especially complexrecycling raw materials. Aurubis already produces more than one out of three cathodes from recycling materials, and the trend is rising. Time horizon: Aurubis aims to increase directsourcing of complex recycling materials from collection points: 100 % volume growth by FY 2022/23 (base year: 2016/17). Situation: In the discussion about climate change the aspectof resource efficiency is more important than ever. The responsible handling of natural resources is not only vital in economic but also in environmental matters. It is important thatproducts are recycled over and over again at the end of their lifecycles. This ensures that valuable raw materials are used, resources are conserved and environmental impacts areprevented. Task: Therefore, the direct return of valuable production scrap back into production is an important component to implement a resource efficient economy. Action:Establishing and developing "closing-the-loop" systems as a result of new or intensified cooperation with original equipment manufacturers, retailers or copper product customers is oneof the measures defined in the Aurubis Sustainability Strategy 2018-2023. Result: The target is to increase the number of "closing-the-loop" systems with direct and indirect productcustomers from the metal value chain at least by 10 by 2022/23 (base FY: 2017/18). Aurubis’ business model allows bringing copper scrap back into the production cycle without anydetours or as we call it closing-the-loop. Firstly, Aurubis closes the internal loop between different production areas. Production scrap and intermediate products that occur during thefabrication of copper products are directly sent to our smelters to be used in the production of new cathodes. Secondly, Aurubis is working closely together with direct costumers andoffers to collect their production scrap and returns it to the production process of copper and copper products. In this way, customers become suppliers at the same time. Our partnersinclude renowned companies like ABB based in Switzerland. The third loop is our multi-metal recycling, that makes end-of-life products usable for the production of new products again.
Supplychainand/orvaluechain
Yes How strategy has been influenced: Thanks to our multi-metal recycling activities and proximity to our copper product customers, we consider ourselves to be in a position to offerexpanded closing-the-loop solutions. Establishing and developing "closing-the-loop" systems as a result of new or intensified cooperation with original equipment manufacturers, retailersor copper product customers is one of the measures defined in the Aurubis Sustainability Strategy 2018-2023. The target is to increase the number of "closing-the-loop" systems withdirect and indirect product customers from the metal value chain at least by 10 by 2022/23 (base FY: 2017/18). Time horizon: The target is to increase the number of "closing-the-loop"systems with direct and indirect product customers from the metal value chain at least by 10 by 2022/23 (base FY: 2017/18). Situation: In the discussion about climate change the aspectof resource efficiency is more important than ever. The responsible handling of natural resources is not only vital in economic but also in environmental matters. It is important thatproducts are recycled over and over again at the end of their lifecycles. This ensures that valuable raw materials are used, resources are conserved and environmental impacts areprevented. Task: Therefore, the direct return of valuable production scrap back into production is an important component to implement a resource efficient economy. Action:Establishing and developing "closing-the-loop" systems as a result of new or intensified cooperation with original equipment manufacturers, retailers or copper product customers is oneof the measures defined in the Aurubis Sustainability Strategy 2018-2023.
Investmentin R&D
Yes How strategy has been influenced: The Aurubis Group’s R&D expenditures in fiscal year 2018/19 amounted to € 16 million. A significant part of these expenditures was spent to preventnegative environmental impacts further develop our metallurgical processes and the development of the new material with the longer lifespan for the area of power electronics. Timehorizon: Until the middle of calendar year 2019, work of the Research and Development Department was focused on further developing metallurgical processes, especially with respectto the flexibility and productivity of the complex raw materials and recycling materials we use.
Operations Yes How strategy has been influenced: Climate change makes it even more important to balance economic interests, ecology and social aspects. Aurubis’ Sustainability Strategy reflects allof these aspects: ensuring economic stability, promoting innovation, advancing social responsibility, increasing resource efficiency and reducing CO2 emissions Our operations havebeen influenced by climate change with the reduction of carbon emissions.Time horizon: We have set the target of further increasing our energy efficiency and reducing CO2 emissionswherever possible. Aurubis hopes to reduce its CO2 emissions by 100,000 t, compared to fiscal year 2012/13, by implementing projects until 2023. Situation: The inherent energytransformation from fossil to renewable, the vitally needed significant energy efficiency enhancements and revolution in industrial processes will have an impact on our production andour business model. Task: Two main action approaches were derived from this: Primarily, Aurubis’ carbon emissions must be reduced. Additionally, Aurubis' engagement with policymakers has to point out the necessity to provide Carbon Leakage protection for sectors that compete internationally. Action: An example how the business strategy has been directlyinfluenced by the scenario analysis is the carbon reduction target set in our sustainability strategy that is part of our business strategy. Result: We aim to reduce our CO2 by > 100,000 tby FY 2022/23 (base FY: 2012/13). The carbon reduction target was approved by the CEO. The target and inherent measures are monitored and reviewed in close coordination amongthe relevant departments and the Executive Board. The anticipation of increasing carbon prices as a result of political goals to comply with the Paris Agreement is published in ourAnnual Report 2018/2019
C3.1e
(C3.1e) Describe where and how climate-related risks and opportunities have influenced your financial planning.
Financialplanningelementsthat havebeeninfluenced
Description of influence
Row1
RevenuesDirectcostsAccess tocapital
Both primary and secondary raw materials are becoming more complex, in that their copper contents are decreasing and the concentrations of tramp elements and impurities are increasing. Aparticular strength of Aurubis already consists of processing complex primary and secondary raw materials. Indeed, the company’s strategy is dedicated to expanding this concept andcontributes to achieving efficient and resource-friendly production processes for the raw materials of the future. If we build up additional competencies in this area, this could positively influencethe Aurubis Group’s revenues especially in the precious metals sector (€ 2,865 Mio. in FY 18/19). Case study Situation: The EU and its member states are setting targets for enhancing energyefficiency and reducing carbon emissions across all sectors. Task: There is an increasing pressure to think of new projects that are able to link sectors and their potential to contribute to theclimate targets. Action: Aurubis is able to extract residual heat from its production processes. The use of residual heat replaces fossil fuels in the heat and steam production and therefore not onlyincreases the level of energy efficiency, but also reduces carbon emissions. Aurubis takes a close look at all types of waste heat produced from its processes. In Aurubis Hamburg plant 87% ofprocess steam needs are covered by waste heat. Aurubis joined forces with energy service provider enercity AG to launch Germany’s largest industrial heat project and we are now supplying theHamburg neighbourhood HafenCity East with industrial heat from Aurubis. Result: Replacing fossil fuels via residual heat utilization constitutes an economic counter value. One part of therecovered waste heat in the district heating project initiated by Aurubis, enercity AG and the city of Hamburg is used to substitute the use of natural gas for heat production at our site. By savingnatural gas, we save up to 10,000 t CO2 at our plant. The current CO2 price is 25 €/t. Total savings amount to up to 250,000 €/a. Aurubis' and enercity AG project delivers CO2-free waste heatfor Hafencity East in Hamburg. The two participating companies invested over € 20 million each, 30 to 40 percent of which was publicly funded. Aurubis received funding from the GermanReconstruction Loan Corporation (KfW), while enercity AG received support from the European Regional Development Fund (ERDF) and the KfW. The funding was initiated by the GermanFederal Ministry for Economic Affairs and Energy (BMWi) and the Hamburg Authority for Environment and Energy (BUE). In 2019 Aurubis inaugurated a state-of-the-art power-to-steam plant inits headquarters in Hamburg. This plant transforms power supply system’s excess electricity from renewable energies into steam, which is utilized in production. This steam can be utilized in themulti-metal production processes – to dry copper concentrates, for instance – and thus replaces some of the steam that has to be produced with fossil fuels. Aurubis invested ca. 3.5 million Eurofor its power-to-steam plant. The Federal Ministry for Economic Affairs and Energy provided 10 % of the funds used to construct the power-to-steam plant as part of NEW 4.0. Aurubis participatesin the project NEW 4.0. among others, which is funded by the German Federal Ministry for Economic Affairs and Energy. The goal of the project is to supply the entire region of Hamburg andSchleswig-Holstein with regenerative electricity in a safe, cost-effective, and environmentally sound manner.
C3.1f
(C3.1f) Provide any additional information on how climate-related risks and opportunities have influenced your strategy and financial planning (optional).
CDP Page of 4113

C4. Targets and performance
C4.1
(C4.1) Did you have an emissions target that was active in the reporting year?Absolute target
C4.1a
(C4.1a) Provide details of your absolute emissions target(s) and progress made against those targets.
Target reference numberAbs 1
Year target was set2013
Target coverageCompany-wide
Scope(s) (or Scope 3 category)Scope 1+2 (market-based)
Base year2013
Covered emissions in base year (metric tons CO2e)1162321
Covered emissions in base year as % of total base year emissions in selected Scope(s) (or Scope 3 category)100
Target year2022
Targeted reduction from base year (%)8.6
Covered emissions in target year (metric tons CO2e) [auto-calculated]1062361.394
Covered emissions in reporting year (metric tons CO2e)1444347
% of target achieved [auto-calculated]-282.13996761852
Target status in reporting yearUnderway
Is this a science-based target?No, but we anticipate setting one in the next 2 years
Please explain (including target coverage)The absolute reduction target in the medium term is primarily an energy efficiency target which has been translated into tons of CO2. In fiscal year 2013 we launched ourGroup wide Sustainabilty Strategy, which aims to reduce CO2 emissions by 100.000 tCO2 by 2022/2023 (updated in 2018 in line with the Vision 2025). The program isbeing implemented through concrete Projects at individual sites.
C4.2
(C4.2) Did you have any other climate-related targets that were active in the reporting year?No other climate-related targets
C4.3
(C4.3) Did you have emissions reduction initiatives that were active within the reporting year? Note that this can include those in the planning and/orimplementation phases.Yes
C4.3a
CDP Page of 4114

(C4.3a) Identify the total number of initiatives at each stage of development, and for those in the implementation stages, the estimated CO2e savings.
Number of initiatives Total estimated annual CO2e savings in metric tonnes CO2e (only for rows marked *)
Under investigation 1 120000
To be implemented* 3 1651
Implementation commenced* 1 20000
Implemented* 4 3758
Not to be implemented 0 0
C4.3b
(C4.3b) Provide details on the initiatives implemented in the reporting year in the table below.
Initiative category & Initiative type
Low-carbon energy consumption Other, please specify (Waste heat recovery and utilization to replace steam (generated by natural gas).)
Estimated annual CO2e savings (metric tonnes CO2e)20000
Scope(s)Scope 1
Voluntary/MandatoryVoluntary
Annual monetary savings (unit currency – as specified in C0.4)500000
Investment required (unit currency – as specified in C0.4)4000000
Payback period4-10 years
Estimated lifetime of the initiative16-20 years
CommentThis is the internal use of the in 2018 implemented heat recovery project, that will generate savings from 2019 on. There are additional income by sale of the industrial heat.The savings only reflect the savings by CO2 emission reduction (20,000 t CO2 x 25 €/t CO2). Contract is running 20 years, therefore the lifetime is set to 20 years.
C4.3c
(C4.3c) What methods do you use to drive investment in emissions reduction activities?
Method Comment
Internal price oncarbon
When investments in process optimization or new facilities reduce emissions, they are valued with Aa CO2 price forecast. The resulting savings is are taken into account for investmentcalculations and are therefore a driver for investment decisions. For example 1.000 MWh savings of natural gas lead to 25.000 € savings (at a natural gas price of 25 €/MWh) andadditionally to reductions of 200 tons CO2 emissions, what leads to another 5.000 € savings. Therefore, CO2 is with 17% a substantial driver of fuel savings.
Compliance withregulatoryrequirements/standards
Investments in emissions reductions are done in alignment with EU-ETS reduction targets (at the moment only binding target) to avoid the obligation for additional certificate purchase.
Internalincentives/recognitionprograms
New ideas could be submitted via a company suggestion system and in case of implementation they are honoured with a bonus depending on the savings. Furthermore, certain managershave individual bonus payouts depending on climate related targets that also consist emission reductions.
C4.5
(C4.5) Do you classify any of your existing goods and/or services as low-carbon products or do they enable a third party to avoid GHG emissions?Yes
C4.5a
CDP Page of 4115

(C4.5a) Provide details of your products and/or services that you classify as low-carbon products or that enable a third party to avoid GHG emissions.
Level of aggregationGroup of products
Description of product/Group of productsWe produce our main product, copper, from copper concentrates and recycling materials. It is an ideal metal for reprocessing, as it isn’t fully used up but can be returned tothe cycle as often as desired without a loss of quality. Copper therefore fulfills sustainability and resource efficiency requirements to a large extent. Looking forward,Europe’s sustainable energy future depends on a partnership between energy efficiency and renewable energy. The more efficiently energy services are delivered, thefaster renewable energy can become an effective and significant contributor in primary energy production. Copper is an essential material in building the energy systems ofthe future. It plays an important role in renewable energy systems, such as solar, wind, tidal, hydro, biomass, and geothermal. Copper is the most highly rated thermal andelectrical conductor among the metals used in infrastructure and product design. Power systems utilising copper generate, transmit and use energy with higher efficiency,thus reducing greenhouse gas emissions and optimising life cycle costs.
Are these low-carbon product(s) or do they enable avoided emissions?Low-carbon product and avoided emissions
Taxonomy, project or methodology used to classify product(s) as low-carbon or to calculate avoided emissionsOther, please specify (Life Cycle Assessment (LCA))
% revenue from low carbon product(s) in the reporting year57
% of total portfolio value<Not Applicable>
Asset classes/ product types<Not Applicable>
Comment57% of our revenues in fiscal year 18/19 were generated by copper product Groups.
Level of aggregationGroup of products
Description of product/Group of productsThe copper content in copper cathodes derived from recycled materials
Are these low-carbon product(s) or do they enable avoided emissions?Low-carbon product and avoided emissions
Taxonomy, project or methodology used to classify product(s) as low-carbon or to calculate avoided emissionsOther, please specify (Life Cycle Assessment (LCA))
% revenue from low carbon product(s) in the reporting year35
% of total portfolio value<Not Applicable>
Asset classes/ product types<Not Applicable>
Comment35% of the copper content in copper cathodes derived from recycled materials in FY 18/19. 19% of our total revenues are derived from copper cathodes.
C5. Emissions methodology
C5.1
CDP Page of 4116
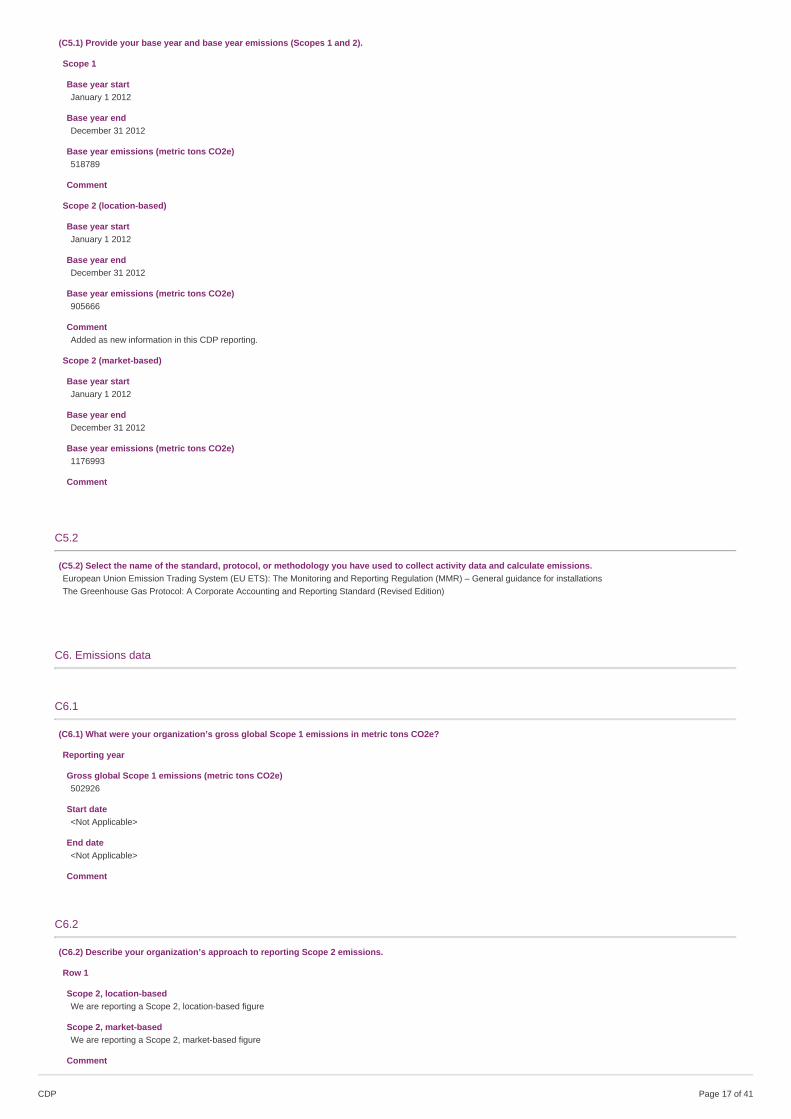
(C5.1) Provide your base year and base year emissions (Scopes 1 and 2).
Scope 1
Base year startJanuary 1 2012
Base year endDecember 31 2012
Base year emissions (metric tons CO2e)518789
Comment
Scope 2 (location-based)
Base year startJanuary 1 2012
Base year endDecember 31 2012
Base year emissions (metric tons CO2e)905666
CommentAdded as new information in this CDP reporting.
Scope 2 (market-based)
Base year startJanuary 1 2012
Base year endDecember 31 2012
Base year emissions (metric tons CO2e)1176993
Comment
C5.2
(C5.2) Select the name of the standard, protocol, or methodology you have used to collect activity data and calculate emissions.European Union Emission Trading System (EU ETS): The Monitoring and Reporting Regulation (MMR) – General guidance for installationsThe Greenhouse Gas Protocol: A Corporate Accounting and Reporting Standard (Revised Edition)
C6. Emissions data
C6.1
(C6.1) What were your organization’s gross global Scope 1 emissions in metric tons CO2e?
Reporting year
Gross global Scope 1 emissions (metric tons CO2e)502926
Start date<Not Applicable>
End date<Not Applicable>
Comment
C6.2
(C6.2) Describe your organization’s approach to reporting Scope 2 emissions.
Row 1
Scope 2, location-based We are reporting a Scope 2, location-based figure
Scope 2, market-basedWe are reporting a Scope 2, market-based figure
Comment
CDP Page of 4117

C6.3
(C6.3) What were your organization’s gross global Scope 2 emissions in metric tons CO2e?
Reporting year
Scope 2, location-based757564
Scope 2, market-based (if applicable)941421
Start date<Not Applicable>
End date<Not Applicable>
Comment
C6.4
(C6.4) Are there any sources (e.g. facilities, specific GHGs, activities, geographies, etc.) of Scope 1 and Scope 2 emissions that are within your selected reportingboundary which are not included in your disclosure?Yes
C6.4a
(C6.4a) Provide details of the sources of Scope 1 and Scope 2 emissions that are within your selected reporting boundary which are not included in yourdisclosure.
SourceEmissions from driving vehicles
Relevance of Scope 1 emissions from this sourceEmissions are not relevant
Relevance of location-based Scope 2 emissions from this sourceNo emissions from this source
Relevance of market-based Scope 2 emissions from this source (if applicable)No emissions from this source
Explain why this source is excludedNot relevant, because below 1% of global emissions
C6.5
(C6.5) Account for your organization’s gross global Scope 3 emissions, disclosing and explaining any exclusions.
Purchased goods and services
Evaluation statusRelevant, calculated
Metric tonnes CO2e1203886
Emissions calculation methodologyCalculation based on Greenhouse Gas Protocol Scope 3 Standard, using specific regional emission factors for primary raw materials from LCA databases, and hybridphysical/financial model for other materials.
Percentage of emissions calculated using data obtained from suppliers or value chain partners
Please explain
Capital goods
Evaluation statusRelevant, calculated
Metric tonnes CO2e111027
Emissions calculation methodologyCalculation based on Greenhouse Gas Protocol Scope 3 Standard, using monetary-based emission factors.
Percentage of emissions calculated using data obtained from suppliers or value chain partners
Please explain
CDP Page of 4118

Fuel-and-energy-related activities (not included in Scope 1 or 2)
Evaluation statusRelevant, calculated
Metric tonnes CO2e155512
Emissions calculation methodologyCalculation based on Greenhouse Gas Protocol Scope 3 Standard, using physical emission factors. Including upstream (WTT) emissions of all fuels balanced under Scope1, as well as upstream (WTT) emissions of purchased electricity.
Percentage of emissions calculated using data obtained from suppliers or value chain partners
Please explain
Upstream transportation and distribution
Evaluation statusRelevant, calculated
Metric tonnes CO2e239505
Emissions calculation methodologyCalculation based on Greenhouse Gas Protocol Scope 3 Standard, using physical emission factors. Including transport of primary and secondary input materials andintralogistics.
Percentage of emissions calculated using data obtained from suppliers or value chain partners
Please explain
Waste generated in operations
Evaluation statusNot relevant, calculated
Metric tonnes CO2e5048
Emissions calculation methodologyCalculation based on Greenhouse Gas Protocol Scope 3 Standard, using physical emission factors. Differentiates between deposited/burned waste and recycled materials.
Percentage of emissions calculated using data obtained from suppliers or value chain partners
Please explain
Business travel
Evaluation statusNot relevant, calculated
Metric tonnes CO2e1898
Emissions calculation methodologyCalculation based on Greenhouse Gas Protocol Scope 3 Standard. Using physical emission factors and reported data from service providers.
Percentage of emissions calculated using data obtained from suppliers or value chain partners
Please explain
Employee commuting
Evaluation statusRelevant, calculated
Metric tonnes CO2e11317
Emissions calculation methodologyCalculation based on Greenhouse Gas Protocol Scope 3 Standard. Using physical emission factors and average distances and modal splits.
Percentage of emissions calculated using data obtained from suppliers or value chain partners
Please explain
Upstream leased assets
Evaluation statusNot relevant, explanation provided
Metric tonnes CO2e<Not Applicable>
Emissions calculation methodology<Not Applicable>
Percentage of emissions calculated using data obtained from suppliers or value chain partners<Not Applicable>
Please explainThere are no significant upstream leased assets to be accounted for.
CDP Page of 4119

Downstream transportation and distribution
Evaluation statusRelevant, calculated
Metric tonnes CO2e139446
Emissions calculation methodologyCalculation based on Greenhouse Gas Protocol Scope 3 Standard, using physical emission factors per transport mode. Including transport of main- and by-products.
Percentage of emissions calculated using data obtained from suppliers or value chain partners
Please explain
Processing of sold products
Evaluation statusNot relevant, explanation provided
Metric tonnes CO2e<Not Applicable>
Emissions calculation methodology<Not Applicable>
Percentage of emissions calculated using data obtained from suppliers or value chain partners<Not Applicable>
Please explainAurubis is a producer of base materials. Due to the nature of our products and the innumerable variants of processing and end-of-life treatment, it is impossible to makevalid assumptions about the related emissions. It is therefore regarded as not relevant based on the criteria established by the Greenhouse Gas Protocol Standard.
Use of sold products
Evaluation statusNot relevant, explanation provided
Metric tonnes CO2e<Not Applicable>
Emissions calculation methodology<Not Applicable>
Percentage of emissions calculated using data obtained from suppliers or value chain partners<Not Applicable>
Please explainAurubis is a producer of base materials that do not cause any direct use phase emissions.
End of life treatment of sold products
Evaluation statusNot relevant, explanation provided
Metric tonnes CO2e<Not Applicable>
Emissions calculation methodology<Not Applicable>
Percentage of emissions calculated using data obtained from suppliers or value chain partners<Not Applicable>
Please explainAurubis is a producer of base materials. Due to the nature of our products and the innumerable variants of processing and end-of-life treatment, it is impossible to makevalid assumptions about the related emissions. It is therefore regarded as not relevant based on the criteria established by the Greenhouse Gas Protocol Standard
Downstream leased assets
Evaluation statusNot relevant, explanation provided
Metric tonnes CO2e<Not Applicable>
Emissions calculation methodology<Not Applicable>
Percentage of emissions calculated using data obtained from suppliers or value chain partners<Not Applicable>
Please explainThere are no significant downstream leased assets to be accounted for.
CDP Page of 4120

Franchises
Evaluation statusNot relevant, explanation provided
Metric tonnes CO2e<Not Applicable>
Emissions calculation methodology<Not Applicable>
Percentage of emissions calculated using data obtained from suppliers or value chain partners<Not Applicable>
Please explainThere are no franchises to be accounted for.
Investments
Evaluation statusNot relevant, explanation provided
Metric tonnes CO2e<Not Applicable>
Emissions calculation methodology<Not Applicable>
Percentage of emissions calculated using data obtained from suppliers or value chain partners<Not Applicable>
Please explainThere are no significant investments that are not already covered in the other scopes and categories.
Other (upstream)
Evaluation status
Metric tonnes CO2e<Not Applicable>
Emissions calculation methodology<Not Applicable>
Percentage of emissions calculated using data obtained from suppliers or value chain partners<Not Applicable>
Please explain
Other (downstream)
Evaluation status
Metric tonnes CO2e<Not Applicable>
Emissions calculation methodology<Not Applicable>
Percentage of emissions calculated using data obtained from suppliers or value chain partners<Not Applicable>
Please explain
C6.7
(C6.7) Are carbon dioxide emissions from biogenic carbon relevant to your organization?No
C6.10
CDP Page of 4121

(C6.10) Describe your gross global combined Scope 1 and 2 emissions for the reporting year in metric tons CO2e per unit currency total revenue and provide anyadditional intensity metrics that are appropriate to your business operations.
Intensity figure0.00121
Metric numerator (Gross global combined Scope 1 and 2 emissions, metric tons CO2e)1444347
Metric denominatorunit total revenue
Metric denominator: Unit total11897000000
Scope 2 figure usedMarket-based
% change from previous year18
Direction of changeDecreased
Reason for changeDue to overall emission reduction and increasing revenues the intensity figure decreased. For changes of overall emissions please see C7.9a
Intensity figure210.76
Metric numerator (Gross global combined Scope 1 and 2 emissions, metric tons CO2e)1444347
Metric denominatorfull time equivalent (FTE) employee
Metric denominator: Unit total6853
Scope 2 figure usedMarket-based
% change from previous year16.3
Direction of changeDecreased
Reason for changeDue to overall emission reduction the intensity figure decreased. For changes of overall emissions please see C7.9a
C7. Emissions breakdowns
C7.1
(C7.1) Does your organization break down its Scope 1 emissions by greenhouse gas type?No
C7.2
(C7.2) Break down your total gross global Scope 1 emissions by country/region.
Country/Region Scope 1 emissions (metric tons CO2e)
United States of America 40425
EU28 462501
C7.3
(C7.3) Indicate which gross global Scope 1 emissions breakdowns you are able to provide.By facility
C7.3b
CDP Page of 4122

(C7.3b) Break down your total gross global Scope 1 emissions by business facility.
Facility Scope 1 emissions (metric tons CO2e) Latitude Longitude
Hamburg, Germany 156601 53.521576 10.03331
Pirdop, Bulgaria 56706 42.703374 24.177048
Lünen, Germany 161113 51.60646 7.50755
Olen, Belgium 42107 51.177305 4.879092
Stolberg, Germany 3504 50.759048 6.234986
Buffalo, USA 40425 42.948404 -78.892807
Zutphen, Netherlands 4353 52.157565 6.206821
Pori, Finland 7308 61.462226 21.861253
Avellino, Italy 16108 40.914388 14.790612
CABLO Metall-Recycling und Handel GmbH, Fehrbellin, Deutschland 40 52.79407 12.76509
E.R.N., Hamburg, Germany 26 53.526343 10.029339
Retorte, Hamburg, Germany 337 49.49038 11.24973
Peute Baustoffe, Hamburg, Germany 9 53.51133 10.05728
Deutsche Giessdraht, Emmerich, Germany 14290 51.82784 6.26501
C-CE7.4/C-CH7.4/C-CO7.4/C-EU7.4/C-MM7.4/C-OG7.4/C-ST7.4/C-TO7.4/C-TS7.4
(C-CE7.4/C-CH7.4/C-CO7.4/C-EU7.4/C-MM7.4/C-OG7.4/C-ST7.4/C-TO7.4/C-TS7.4) Break down your organization’s total gross global Scope 1 emissions by sectorproduction activity in metric tons CO2e.
Gross Scope 1 emissions, metric tons CO2e Net Scope 1 emissions , metric tons CO2e Comment
Cement production activities <Not Applicable> <Not Applicable> <Not Applicable>
Chemicals production activities <Not Applicable> <Not Applicable> <Not Applicable>
Coal production activities <Not Applicable> <Not Applicable> <Not Applicable>
Electric utility activities <Not Applicable> <Not Applicable> <Not Applicable>
Metals and mining production activities 502926 <Not Applicable>
Oil and gas production activities (upstream) <Not Applicable> <Not Applicable> <Not Applicable>
Oil and gas production activities (midstream) <Not Applicable> <Not Applicable> <Not Applicable>
Oil and gas production activities (downstream) <Not Applicable> <Not Applicable> <Not Applicable>
Steel production activities <Not Applicable> <Not Applicable> <Not Applicable>
Transport OEM activities <Not Applicable> <Not Applicable> <Not Applicable>
Transport services activities <Not Applicable> <Not Applicable> <Not Applicable>
C7.5
(C7.5) Break down your total gross global Scope 2 emissions by country/region.
Country/Region Scope 2, location-based(metric tons CO2e)
Scope 2, market-based(metric tons CO2e)
Purchased and consumed electricity,heat, steam or cooling (MWh)
Purchased and consumed low-carbon electricity, heat, steam or coolingaccounted for in Scope 2 market-based approach (MWh)
United States ofAmerica
11800 19953 22349 126642
EU28 745764 921468 1437891 0
C7.6
(C7.6) Indicate which gross global Scope 2 emissions breakdowns you are able to provide.By facility
C7.6b
CDP Page of 4123

(C7.6b) Break down your total gross global Scope 2 emissions by business facility.
Facility Scope 2, location-based (metric tons CO2e) Scope 2, market-based (metric tons CO2e)
Hamburg, Germany 277057 480312
Pirdop, Bulgaria 288593 177981
Lünen, Germany 81385 113274
Olen, Belgium 35331 82080
Stolberg, Germany 16183 20896
Buffalo, USA 11800 19953
Zutphen, Netherlands 23963 18982
Pori, Finland 4391 8169
Avellino, Italy 5692 4627
Cablo, Germany 5749 8015
E.R.N, Germany 96 133
Retorte, Germany 843 1175
Peute Baustoffe, Germany 190 265
Emmerich, Germany 6292 5557
C-CE7.7/C-CH7.7/C-CO7.7/C-MM7.7/C-OG7.7/C-ST7.7/C-TO7.7/C-TS7.7
(C-CE7.7/C-CH7.7/C-CO7.7/C-MM7.7/C-OG7.7/C-ST7.7/C-TO7.7/C-TS7.7) Break down your organization’s total gross global Scope 2 emissions by sector productionactivity in metric tons CO2e.
Scope 2, location-based, metric tons CO2e Scope 2, market-based (if applicable), metric tons CO2e Comment
Cement production activities <Not Applicable> <Not Applicable> <Not Applicable>
Chemicals production activities <Not Applicable> <Not Applicable> <Not Applicable>
Coal production activities <Not Applicable> <Not Applicable> <Not Applicable>
Metals and mining production activities 757564 941421
Oil and gas production activities (upstream) <Not Applicable> <Not Applicable> <Not Applicable>
Oil and gas production activities (midstream) <Not Applicable> <Not Applicable> <Not Applicable>
Oil and gas production activities (downstream) <Not Applicable> <Not Applicable> <Not Applicable>
Steel production activities <Not Applicable> <Not Applicable> <Not Applicable>
Transport OEM activities <Not Applicable> <Not Applicable> <Not Applicable>
Transport services activities <Not Applicable> <Not Applicable> <Not Applicable>
C7.9
(C7.9) How do your gross global emissions (Scope 1 and 2 combined) for the reporting year compare to those of the previous reporting year?Decreased
C7.9a
(C7.9a) Identify the reasons for any change in your gross global emissions (Scope 1 and 2 combined), and for each of them specify how your emissions compareto the previous year.
Change in emissions (metric tonsCO2e)
Direction ofchange
Emissions value(percentage)
Please explain calculation
Change in renewable energyconsumption
0 No change 0 No change
Other emissions reduction activities 17358 Decreased 1.2 Optimization measures, please see implemented CO2 reductionmeasures
Divestment 0 No change 0 No change
Acquisitions 0 No change 0 No change
Mergers 0 No change 0 No change
Change in output 64054 Decreased 4.4
Change in methodology 0 No change 0 No change
Change in boundary 0 No change 0 No change
Change in physical operating conditions 0 No change 0 No change
Unidentified 0 No change 0 No change
Other 69990 Increased 4.8
C7.9b
CDP Page of 4124

(C7.9b) Are your emissions performance calculations in C7.9 and C7.9a based on a location-based Scope 2 emissions figure or a market-based Scope 2emissions figure?Market-based
C8. Energy
C8.1
(C8.1) What percentage of your total operational spend in the reporting year was on energy?More than 0% but less than or equal to 5%
C8.2
(C8.2) Select which energy-related activities your organization has undertaken.
Indicate whether your organization undertook this energy-related activity in the reporting year
Consumption of fuel (excluding feedstocks) Yes
Consumption of purchased or acquired electricity Yes
Consumption of purchased or acquired heat No
Consumption of purchased or acquired steam Yes
Consumption of purchased or acquired cooling No
Generation of electricity, heat, steam, or cooling Yes
C8.2a
(C8.2a) Report your organization’s energy consumption totals (excluding feedstocks) in MWh.
Heating value MWh from renewable sources MWh from non-renewable sources Total (renewable and non-renewable) MWh
Consumption of fuel (excluding feedstock) HHV (higher heating value) 2888 1642741 1645629
Consumption of purchased or acquired electricity <Not Applicable> 126642 1460239 1586882
Consumption of purchased or acquired heat <Not Applicable> <Not Applicable> <Not Applicable> <Not Applicable>
Consumption of purchased or acquired steam <Not Applicable> 0 4962 4962
Consumption of purchased or acquired cooling <Not Applicable> <Not Applicable> <Not Applicable> <Not Applicable>
Consumption of self-generated non-fuel renewable energy <Not Applicable> 22006 <Not Applicable> 22006
Total energy consumption <Not Applicable> 151536 3107943 3259478
C-MM8.2a
(C-MM8.2a) Report your organization’s energy consumption totals (excluding feedstocks) for metals and mining production activities in MWh.
Heating value Total MWh
Consumption of fuel (excluding feedstocks) HHV (higher heating value) 1645629
Consumption of purchased or acquired electricity <Not Applicable> 1586882
Consumption of purchased or acquired heat <Not Applicable> <Not Applicable>
Consumption of purchased or acquired steam <Not Applicable> 4962
Consumption of purchased or acquired cooling <Not Applicable> <Not Applicable>
Consumption of self-generated non-fuel renewable energy <Not Applicable> 22006
Total energy consumption <Not Applicable> 3259478
C8.2b
(C8.2b) Select the applications of your organization’s consumption of fuel.
Indicate whether your organization undertakes this fuel application
Consumption of fuel for the generation of electricity No
Consumption of fuel for the generation of heat Yes
Consumption of fuel for the generation of steam Yes
Consumption of fuel for the generation of cooling No
Consumption of fuel for co-generation or tri-generation No
CDP Page of 4125

C8.2c
(C8.2c) State how much fuel in MWh your organization has consumed (excluding feedstocks) by fuel type.
Fuels (excluding feedstocks)Natural Gas
Heating valueHHV (higher heating value)
Total fuel MWh consumed by the organization1169820
MWh fuel consumed for self-generation of electricity<Not Applicable>
MWh fuel consumed for self-generation of heat0
MWh fuel consumed for self-generation of steam79138
MWh fuel consumed for self-generation of cooling<Not Applicable>
MWh fuel consumed for self-cogeneration or self-trigeneration<Not Applicable>
Emission factor55.7
Unitkg CO2 per GJ
Emissions factor sourceNational Emission factor of Diesel, in Germany for example we use th DEHSt list of Standard factors provided by the national agency (source:https://www.dehst.de/DE/service/archivsuche/archiv/SharedDocs/downloads/DE/Berichterstattung_2005-2007/EB2007_Stoffliste.html)
Comment
Fuels (excluding feedstocks)Liquefied Petroleum Gas (LPG)
Heating valueHHV (higher heating value)
Total fuel MWh consumed by the organization39834
MWh fuel consumed for self-generation of electricity<Not Applicable>
MWh fuel consumed for self-generation of heat0
MWh fuel consumed for self-generation of steam0
MWh fuel consumed for self-generation of cooling<Not Applicable>
MWh fuel consumed for self-cogeneration or self-trigeneration<Not Applicable>
Emission factor64
Unitkg CO2 per GJ
Emissions factor sourceNational Emission factor of Diesel, in Germany for example we use th DEHSt list of Standard factors provided by the national agency (source:https://www.dehst.de/DE/service/archivsuche/archiv/SharedDocs/downloads/DE/Berichterstattung_2005-2007/EB2007_Stoffliste.html)
Comment
Fuels (excluding feedstocks)Diesel
Heating valueHHV (higher heating value)
Total fuel MWh consumed by the organization16327
MWh fuel consumed for self-generation of electricity<Not Applicable>
CDP Page of 4126

MWh fuel consumed for self-generation of heat0
MWh fuel consumed for self-generation of steam0
MWh fuel consumed for self-generation of cooling<Not Applicable>
MWh fuel consumed for self-cogeneration or self-trigeneration<Not Applicable>
Emission factor74.1
Unitkg CO2 per GJ
Emissions factor sourceNational Emission factor of Diesel, in Germany for example we use th DEHSt list of Standard factors provided by the national agency (source:https://www.dehst.de/DE/service/archivsuche/archiv/SharedDocs/downloads/DE/Berichterstattung_2005-2007/EB2007_Stoffliste.html)
Comment
Fuels (excluding feedstocks)Distillate Oil
Heating valueHHV (higher heating value)
Total fuel MWh consumed by the organization5836
MWh fuel consumed for self-generation of electricity<Not Applicable>
MWh fuel consumed for self-generation of heat0
MWh fuel consumed for self-generation of steam0
MWh fuel consumed for self-generation of cooling<Not Applicable>
MWh fuel consumed for self-cogeneration or self-trigeneration<Not Applicable>
Emission factor73.75
Unitkg CO2 per GJ
Emissions factor sourceNational Emission factors of Heizöl EL, in Germany for example we use the DEHSt list of Standard factors provided by the national agency (source:https://www.dehst.de/SharedDocs/downloads/DE/stationaere_anlagen/Emissionsbericht_Leitfaden_Anhang4.pdf?__blob=publicationFile&v=3 )
Comment
Fuels (excluding feedstocks)Residual Fuel Oil
Heating valueHHV (higher heating value)
Total fuel MWh consumed by the organization300982
MWh fuel consumed for self-generation of electricity<Not Applicable>
MWh fuel consumed for self-generation of heat0
MWh fuel consumed for self-generation of steam0
MWh fuel consumed for self-generation of cooling<Not Applicable>
MWh fuel consumed for self-cogeneration or self-trigeneration<Not Applicable>
Emission factor78
Unitkg CO2 per GJ
Emissions factor source
CDP Page of 4127

Individual National Emission factors of Coke. Verified by an external auditor during regular audits. In Lünen und Hamburg for example coke is being sampled to determinethe emission factor. If the fuel is used at several sites, the average emission factor is started.
Comment
Fuels (excluding feedstocks)Coking Coal
Heating valueHHV (higher heating value)
Total fuel MWh consumed by the organization78550
MWh fuel consumed for self-generation of electricity<Not Applicable>
MWh fuel consumed for self-generation of heat0
MWh fuel consumed for self-generation of steam0
MWh fuel consumed for self-generation of cooling<Not Applicable>
MWh fuel consumed for self-cogeneration or self-trigeneration<Not Applicable>
Emission factor111.5
Unitkg CO2 per GJ
Emissions factor sourceIndividual National Emission factors of Coke. Verified by an external auditor during regular audits. In Lünen und Hamburg for example coke is being sampled to determinethe emission factor. If the fuel is used at several sites, the average emission factor is started.
Comment
Fuels (excluding feedstocks)Landfill Gas
Heating valueHHV (higher heating value)
Total fuel MWh consumed by the organization2888
MWh fuel consumed for self-generation of electricity<Not Applicable>
MWh fuel consumed for self-generation of heat0
MWh fuel consumed for self-generation of steam0
MWh fuel consumed for self-generation of cooling<Not Applicable>
MWh fuel consumed for self-cogeneration or self-trigeneration<Not Applicable>
Emission factor0
Unitkg CO2 per GJ
Emissions factor sourceLandfill gas is a biogenenic fuel
Comment
Fuels (excluding feedstocks)Butane
Heating valueHHV (higher heating value)
Total fuel MWh consumed by the organization31393
MWh fuel consumed for self-generation of electricity<Not Applicable>
MWh fuel consumed for self-generation of heat0
CDP Page of 4128

MWh fuel consumed for self-generation of steam0
MWh fuel consumed for self-generation of cooling<Not Applicable>
MWh fuel consumed for self-cogeneration or self-trigeneration<Not Applicable>
Emission factor66.27
Unitkg CO2 per GJ
Emissions factor sourceIndividual National Emission factors of Butane. Verified by an external auditor during regular audits. If the fuel is used at several sites, the average emission factor is stated.
Comment
C8.2d
(C8.2d) Provide details on the electricity, heat, steam, and cooling your organization has generated and consumed in the reporting year.
Total Gross generation(MWh)
Generation that is consumed by theorganization (MWh)
Gross generation from renewable sources(MWh)
Generation from renewable sources that is consumed by theorganization (MWh)
Electricity 22006 22006 22006 22006
Heat 0 0 0 0
Steam 306383 306383 227245 227245
Cooling 0 0 0 0
C-MM8.2d
(C-MM8.2d) Provide details on the electricity, heat, steam, and cooling your organization has generated and consumed for metals and mining productionactivities.
Total gross generation (MWh) inside metals and mining sector boundary Generation that is consumed (MWh) inside metals and mining sector boundary
Electricity 22006 22006
Heat 0 0
Steam 306383 306383
Cooling 0 0
C8.2e
(C8.2e) Provide details on the electricity, heat, steam, and/or cooling amounts that were accounted for at a zero emission factor in the market-based Scope 2figure reported in C6.3.
Sourcing methodPower purchase agreement (PPA) with a grid-connected generator without energy attribute certificates
Low-carbon technology typeHydropower
Country/region of consumption of low-carbon electricity, heat, steam or coolingUnited States of America
MWh consumed accounted for at a zero emission factor126642
Comment
C9. Additional metrics
C9.1
(C9.1) Provide any additional climate-related metrics relevant to your business.
CDP Page of 4129

C-MM9.3b
CDP Page of 4130

(C-MM9.3b) Provide details on the commodities relevant to the metals production activities of your organization.
Output productCopper
Capacity (metric tons)1304881
Production (metric tons)1304881
Annual production in copper-equivalent units (thousand tons)1304
Scope 1 emissions (metric tons CO2e)416527
Scope 2 emissions (metric tons CO2e)853647
Scope 2 emissions approachMarket-based
Pricing methodology for-copper equivalent figureProduction represents copper output from our smelter sites. Scope 1 Emissions Copper output: Scope 1 emission, (Hamburg, Lünen, Olen, Pirdop) = 416,527 tCO2 Scope2 Emissions Copper Output: Scope 2 (Hamburg, Lünen, Olen, Pirdop) = 853,647 tCO2
CommentWith our current production output we use nearly 100% of our capacity.
Output productOther non-ferrous metals (Please specify) (Copper fabrication sites)
Capacity (metric tons)380565
Production (metric tons)380565
Annual production in copper-equivalent units (thousand tons)380
Scope 1 emissions (metric tons CO2e)85988
Scope 2 emissions (metric tons CO2e)78185
Scope 2 emissions approachMarket-based
Pricing methodology for-copper equivalent figureOutput "Copper Fabrication Sites" includes copper products like rod and flat rolled products. Scope 1 Emissions Output Copper Fabrication Sites: Scope 1 emissions (Pori,Zutphen, Stolberg, Buffalo, Deutsche Giessdraht, Avellino) = 85,988 tCO2 Scope 2 Emissions Output Copper Fabrication Sites: Scope 2 emissions (Pori, Zutphen, Stolberg,Buffalo, Deutsche Giessdraht, Avellino) = 78,185 tCO2
CommentWith our current production output we use nearly 100% of our capacity.
Output productOther non-ferrous metals (Please specify) (Production sites other than copper)
Capacity (metric tons)655965
Production (metric tons)655965
Annual production in copper-equivalent units (thousand tons)656
Scope 1 emissions (metric tons CO2e)411
Scope 2 emissions (metric tons CO2e)9589
Scope 2 emissions approachMarket-based
Pricing methodology for-copper equivalent figureOutput "Production Sites Other Than Copper" include products as: Selenium, Brass and Aluminium granulates, Iron Silicate, etc. which are produced at our sites. Scope 1Emissions Output "Production Sites Other Than Copper": Scope 1 emissions (Cablo, Retorte, E.R.N., Peute) = 411 tCO2 Scope 2 Emissions Output "Production Sites OtherThan Copper": Scope 2 emissions (Cablo, Retorte, E.R.N., Peute) = 9589 tCO2
CommentWith our current production output we use nearly 100% of our capacity.
CDP Page of 4131

C-CE9.6/C-CG9.6/C-CH9.6/C-CN9.6/C-CO9.6/C-EU9.6/C-MM9.6/C-OG9.6/C-RE9.6/C-ST9.6/C-TO9.6/C-TS9.6
(C-CE9.6/C-CG9.6/C-CH9.6/C-CN9.6/C-CO9.6/C-EU9.6/C-MM9.6/C-OG9.6/C-RE9.6/C-ST9.6/C-TO9.6/C-TS9.6) Does your organization invest in research anddevelopment (R&D) of low-carbon products or services related to your sector activities?
Investment in low-carbon R&D Comment
Row 1 Yes
C-MM9.6a
(C-MM9.6a) Provide details of your organization’s investments in low-carbon R&D for metals and mining production activities over the last three years.
Technology area Stage of development in the reporting year Average % of total R&D investment over the last 3 years R&D investment figure in the reporting year (optional) Comment
Please select <Not Applicable> Please select
C10. Verification
C10.1
(C10.1) Indicate the verification/assurance status that applies to your reported emissions.
Verification/assurance status
Scope 1 Third-party verification or assurance process in place
Scope 2 (location-based or market-based) Third-party verification or assurance process in place
Scope 3 No third-party verification or assurance
C10.1a
(C10.1a) Provide further details of the verification/assurance undertaken for your Scope 1 emissions, and attach the relevant statements.
Verification or assurance cycle in placeAnnual process
Status in the current reporting yearComplete
Type of verification or assuranceReasonable assurance
Attach the statementCDP-verification-Aurubis Bulgaria 2019.pdfCDP_Statement_aurubis_lünen_2019_rev1.pdfCDP_Statement_aurubis_hh_2019_rev1.pdfCDP_Statement_aurubis_dg_2019.pdf
Page/ section referenceAll papers are only for justification of Scope 1 emissions.
Relevant standardEuropean Union Emissions Trading System (EU ETS)
Proportion of reported emissions verified (%)77
C10.1b
CDP Page of 4132

(C10.1b) Provide further details of the verification/assurance undertaken for your Scope 2 emissions and attach the relevant statements.
Scope 2 approachScope 2 market-based
Verification or assurance cycle in placeAnnual process
Status in the current reporting yearComplete
Type of verification or assuranceReasonable assurance
Attach the statementCDP Bestätigung_Aurubis AG_signed-2020.pdf
Page/ section referenceThe paper is only for justification of Scope 2 emissions.
Relevant standardISAE3000
Proportion of reported emissions verified (%)67
C10.2
(C10.2) Do you verify any climate-related information reported in your CDP disclosure other than the emissions figures reported in C6.1, C6.3, and C6.5?In progress
C11. Carbon pricing
C11.1
(C11.1) Are any of your operations or activities regulated by a carbon pricing system (i.e. ETS, Cap & Trade or Carbon Tax)?Yes
C11.1a
(C11.1a) Select the carbon pricing regulation(s) which impacts your operations.EU ETS
C11.1b
(C11.1b) Complete the following table for each of the emissions trading schemes you are regulated by.
EU ETS
% of Scope 1 emissions covered by the ETS85.7
% of Scope 2 emissions covered by the ETS
Period start dateJanuary 1 2019
Period end dateDecember 31 2019
Allowances allocated807014
Allowances purchased0
Verified Scope 1 emissions in metric tons CO2e430809
Verified Scope 2 emissions in metric tons CO2e
Details of ownershipFacilities we own and operate
Comment
CDP Page of 4133

C11.1d
(C11.1d) What is your strategy for complying with the systems you are regulated by or anticipate being regulated by?
By operating state-of-the-art, innovative plant technologies, Aurubis holds a leading position in climate and environmental protection in primary and secondary copperproduction. Today, continued high capital expenditure for environmental protection leads to relatively small improvements, as a leading global environmental standard hasalready been achieved and there are technological boundaries in some instances, as in the case of emission reduction. Case study
Situation: Aurubis is since 2013 part of the EU-ETS. We have been one of the forerunners in adapting to new emission-lowering technologies. We have started early on toinvest in efficient technologies and continue to further optimize our processes also in the future. Task: For us, as an multi metal producer we are in a price taking position,additional costs cannot be handed to customers. Action: Therefore, investing into energy efficiency is an important aspect of our strategy, since it helps us to maintain ourcurrent competitive position. Furthermore, the system of the EU-ETS is set-up in a way that producers, who use their energy multiple times, benefit from certificates theywould otherwise need to produce the energy. ResultsAdditional costs are not only caused by the Emission Trading Scheme, but also from the administrative burdenconnected to it, as well as increased electricity prices through the included CO2-component. Especially for us as an energy intensive industry these also make up a big shareof costs as well, because only 50% of our indirect carbon costs are compensated. Therefore, it is of our own interest to further reduce emissions. The certificates that we getare needed to cover part of the additional electricity costs, which cannot be handed down the value chain.
C11.2
(C11.2) Has your organization originated or purchased any project-based carbon credits within the reporting period?No
C11.3
(C11.3) Does your organization use an internal price on carbon?Yes
C11.3a
(C11.3a) Provide details of how your organization uses an internal price on carbon.
Objective for implementing an internal carbon priceNavigate GHG regulationsStakeholder expectationsChange internal behaviorDrive energy efficiencyDrive low-carbon investmentStress test investmentsIdentify and seize low-carbon opportunities
GHG ScopeScope 1Scope 2
ApplicationThe internal price of carbon is used for our medium-term planning of energy prices as well as the medium-term planning of our CO2 Strategy.
Actual price(s) used (Currency /metric ton)25
Variance of price(s) usedFor short term projections the current EEX Price of carbon is used. For projections until 2030 the 2030 target price of the EU Commission is used, which is 30€.
Type of internal carbon priceImplicit price
Impact & implicationAurubis is since 2013 part of the EU-ETS. The EU-ETS means direct and indirect carbon costs for Aurubis. With an implicit carbon price we are able to describe this costburden today, but also in the future. All new projects with relevance to the energy supply and consumption are checked by Corporate Energy and Climate Affairs and/or theresponsible energy departments on site. Within the assessment of the project, carbon costs are considered, either as direct costs or as indirect costs in the electricity priceor both.
C12. Engagement
C12.1
CDP Page of 4134

(C12.1) Do you engage with your value chain on climate-related issues?Yes, our customersYes, other partners in the value chain
C12.1b
(C12.1b) Give details of your climate-related engagement strategy with your customers.
Type of engagementCollaboration & innovation
Details of engagementOther, please specify
% of customers by number20
% of customer - related Scope 3 emissions as reported in C6.511.5
Portfolio coverage (total or outstanding)<Not Applicable>
Please explain the rationale for selecting this group of customers and scope of engagementAurubis’ customers are generally companies in the processing industry. When copper is processed to fabricate final products, production waste and residues accumulate.This includes materials with very high copper contents, such as turnings and millings. Residue fractions, such as slags and industrial residues, result from other processingmethods. Aurubis offers its customers collection options for most production residues and wastes and guarantees professional, environmentally sound recycling conformingto the highest standards. Aurubis is in a position to reintroduce a large variety of metallic scrap to the material cycle. In this way, Aurubis customers can obtain the copperagain within a short time and use it in their own production.
Impact of engagement, including measures of successOur multi-metal recycling ensures that the material cycle for copper and other metals is closed. Copper used in products can be recycled over and over again. This ensuresthat valuable raw materials are used, resources are conserved and environmental impacts are minimized. To measure the success of this engagement we monitor the levelof target achievement of our Sustainability Goal to establish a "closing the loop" system with a minimum of five customers until 2018. With the implementation of the"closing-the-Loop" System our Scope 3 emissions can be reduced. For example, the emissions caused by upstream transportion of raw materials which account for 10% ofour total Scope 3 emissions can be reduced by this approach.
C12.1d
(C12.1d) Give details of your climate-related engagement strategy with other partners in the value chain.
Strategy for prioritizing engagement:
Climate protection is established in the Aurubis Sustainability Strategy. Responsibility in the supply chain was identified as an important issue during the SustainabilityStrategy development process. We are intensifying the dialogue along the value chain to strengthen environmental and social standards. We also prioritize engagements inthe field of climate friendly mobility management with regard to the following criteria:
- Contribution to a successful business (identification of relevant mobility figures as basis of improvement measures, reducing mobility costs and increasing efficiency)
- Benefit for the employees of the sites (loyalty and motivation, health promotion, safe work route)
- Benefit for people and the environment located in the region of the sites (environmental and climate protection)
Methods of engagement:
We try to minimize transports in the supply chain. We maintain for example a dialogue with suppliers and customers to tap additional logistics synergies. We are engaged ininitiatives and decided to commit to the “Partnership for Air Quality and Low-emission Mobility”, a way to reduce emissions caused by employees and initiated by the city ofHamburg, which was signed by Aurubis and 11 other companies in September 2012. The objective of the partnership is to reduce nitrogen dioxide emissions, which arecaused by private transport in particular. As part of the air quality partnership, an action week was held with the employees at the Hamburg site, during which a number ofideas were developed and steps were coordinated. The newly developed concepts whose implementation is being reviewed include an offer for e-bike leasing, theconstruction of a bike shelter at the nearby Veddel train station and better access to the plant with public transportation options or a company bus shuttle. In 2016, Aurubisalso started participating in a project, sponsored by the Federal Ministry for the Environment, Nature Conservation, Building and Nuclear Safety, called MOBIL.PRO.FIT. Partof the strategic approach is the participation of Aurubis managers in workshops regarding mobility-relevant topics. To transfer this new knowledge into a company-specificand emission-reducing mobility management model, external consultants and company representatives work closely together. This project aims to develop efficient andclimate-friendly mobility management within the participating companies. An important part of this project is acquiring an analysis of commuting habits of employees to pointout room for improvement in the form of going to work by bike, public transportation or forming carpools. This way Aurubis as a company and its employees work together toreduce the emissions of commuting as a part of the climate change strategy. The project fits perfectly into the Aurubis Sustainability Strategy because it is a clear objective ofAurubis that every employee should live the Sustainability Strategy each day and contribute to implementing the agreed measures and targets. Measures of success Aurubiswill be certified as a “MOBIL.PRO.FIT-business” if the company achieves all contract-specific requirements. A committee of organization implementing the MOBIL.PRO.FITproject will therefore visit the company and examine if the required measures have been taken. Aurubis managers already participated in workshops. In addition, they will beinvolved further with this project. In September 2016, Aurubis Hamburg opened the "4. Aktionswoche der Luftgütepartner Hamburgs" for promoting low-emission mobility.
C12.3
CDP Page of 4135

(C12.3) Do you engage in activities that could either directly or indirectly influence public policy on climate-related issues through any of the following?Direct engagement with policy makersTrade associationsFunding research organizations
C12.3a
(C12.3a) On what issues have you been engaging directly with policy makers?
Focus oflegislation
Corporateposition
Details of engagement Proposed legislative solution
Cap andtrade
Supportwith minorexceptions
Aurubis contributes constructively tothe policy dialogue at Member Stateand EU institution level and at eachstage of policy development, such asstakeholder consultation, amendmentdiscussions, policy reviews etc.,directly as well as through associationssuch as IFIEC, Eurometaux, ECI,Agoria, WVM, etc.
The price taker characteristic of exchange-traded commodities such as copper should be recognized as an eligibility criterion to receive the highestdegree of carbon leakage protection, by receiving full free allocation for direct emissions and full compensation in all Member States, for indirectemissions at the best performance level, in a predictable way. This carbon leakage protection will ensure that the investments to expand productionand to innovate further will continue to be made in the most energy-efficient European plants. These plants produce products in the mostenvironmentally friendly way possible to help the decarbonization of European society and the world.
Energyefficiency
Supportwith minorexceptions
Aurubis participates in intensediscussions regarding theimplementation of article 8 of theEuropean Energy Efficiency Directive(EED) into national law and thepractical implementation, especially inGermany (EDL-G), via position papers,direct engagement with policymakersand national authorities.
EU energy efficiency directive requires companies in article 8 to perform energy audits unless they are small/medium enterprises (SMEs). Owing tothe definition of the Commission, subsidiaries of the Group are not accepted as SMEs even though their energy consumption is insignificant. Thiscould result in a disproportionate amount of audits to be performed across Europe and hence defies the intention of the Commission to generate aninstrument that benefits industry without burdening it unnecessarily with administration. In Aurubis' opinion, this should be considered in the revisionof the directive or should be harmonized via national legislation in coordination with the EU.
Other,pleasespecify(CircularEconomy)
Support The European Commission publisheda Circular Economy Package (CEP) inDecember 2015, which includes threevery concrete revisions of keylegislations the Waste Framework, thePackaging and the LandfillingDirective, as well as a comprehensiveAction Plan setting out furthermeasures until 2018. In generalAurubis very much supports theCircular Economy Package as it willfoster recycling and requests acoherent harmonised implementationby Member States (MS) to avoidinconsistencies for companies who arepresent in various European Union MS.
Aurubis supports the idea of strengthening eco-design measures towards more Circular Economy and the request to Circular Europe Network todevelop standards for product recyclability. - Aurubis asks for measures to stop illegal shipments of electrical waste to non-EU countries. - In theframework of the circular economy, some call for banning or substituting hazardous materials to reduce their presence in material loops andrecycled materials. In the context of metals recycling however it is often complex or even currently impossible to substitute them as metals haveunique properties which support given functionalities. As new metals cannot be invented substituting a metal is often done by using another metal.In this respect Aurubis supports the Action Plan which proposes the analysis of policy options to address the interface between chemicals, productsand waste legislation. - Applying a strictly hazard-based REACH authorization process for substances commonly present in metalproduction/recycling could then lead to a decrease in the amount of waste recycled in Europe and would most likely trigger disposal and landfill or(illegal) shipment of valuable materials outside the EU. - Aurubis supports the new definition of “final recycling process” which comprises all steps ofthe recycling value chain as well as we support the proposal for EU standards of material efficient recycling of electronic waste. - Aurubis welcomesthe general requirements for Extended Producer Responsibility (EPR) as a step towards more transparency and efficiency of the EPR schemesespecially on household electronic goods. - Aurubis strongly recommends to secure regular monitoring of end-of-waste export flows and to avoidthe proliferation of national end-of-waste status which would trigger confusion and challenges to control the validity of the status. - In general: TheAction Plan contains 54 measures throughout the life cycle from production to waste disposal. It is important to achieve a proper implementation ofthe action plan and revisions of the Directive.
C12.3b
(C12.3b) Are you on the board of any trade associations or do you provide funding beyond membership?Yes
C12.3c
CDP Page of 4136

(C12.3c) Enter the details of those trade associations that are likely to take a position on climate change legislation.
Trade associationEurometaux
Is your position on climate change consistent with theirs?Consistent
Please explain the trade association’s positionEurometaux consistently strives to ensure a balance between energy, climate and industrial policies for the best performing company level. Furthermore, Eurometauxsupports sustainability, the circular economy and increased Recycling.
How have you influenced, or are you attempting to influence their position?Aurubis is represented in the governing body of Eurometaux and is the Chair of the Energy and Climate Change committee. Additionally, Aurubis is the Chair of theSustainability committee promoting topics such as the circular economy and recycling. Aurubis actively participates in enforcing Eurometaux's climate change agenda,which is raising the bar for all EM members on the issues of decarbonization, sustainability, circular economy and innovation, by leading a continuous and constructivedialogue with EU institutions to maintain the competitiveness of energy-intensive industries in Europe.
Trade associationEuropean Copper Institute
Is your position on climate change consistent with theirs?Consistent
Please explain the trade association’s positionECI Annual Report 2015: The copper industry needs transparent, long-term energy and climate change policies that will deliver competitively priced energy. Reforms to theEmissions Trading Scheme must address the competitiveness gap faced by the EU’s energy-intensive industries. The ambitious outcomes from COP21 must not result inundue costs for Europe’s best performers. Continued recognition that the copper sector is a price taker, due to commodity prices being global, must be taken into accountwhen determining the risk of carbon leakage. Finally, a more harmonized, EU-wide scheme needs to provide full compensation for both direct and indirect emissions basedon actual production levels.
How have you influenced, or are you attempting to influence their position?Aurubis is represented on the Board of Directors of ECI and therefore is able to contribute to the strategic Position on climate change. Additionally, Aurubis experts in thedomains of energy and climate change strongly influence this position by participating in the relevant thematic workshops organized by ECI.
Trade associationInternational Copper Association
Is your position on climate change consistent with theirs?Consistent
Please explain the trade association’s positionEurope’s copper industry shares the EC’s vision for a low-carbon economy and will pursue it with all of the resources at its disposal. The Support of EC and otherpolicymakers is needed for a reasoned balance between the energy needed to manufacture the building blocks of that new economy and the overarching goals for reducedenergy demand and carbon emissions.
How have you influenced, or are you attempting to influence their position?Aurubis is represented on the Board of Directors of ICA and therefore is able to contribute to the strategic position on climate change. Additionally, Aurubis experts in thedomains of energy and climate change strongly influence this position by participating in the relevant thematic workshops organized by ECI.
Trade associationWirtschaftsvereinigung Metalle
Is your position on climate change consistent with theirs?Consistent
Please explain the trade association’s positionThe Non-Ferrous metals industry believes that society, economy and politics have a responsibility to make the energy transition a success and climate protection aseffective and economically efficient as possible. This is only feasible together with the industry.
How have you influenced, or are you attempting to influence their position?Aurubis as a member of the Executive Committee contributes actively in shaping the association's position.
C12.3d
(C12.3d) Do you publicly disclose a list of all research organizations that you fund?No
C12.3f
(C12.3f) What processes do you have in place to ensure that all of your direct and indirect activities that influence policy are consistent with your overall climatechange strategy?
Within the Aurubis Group, we coordinate our political activities on a monthly basis in a routine meeting led by our CEO. The participants are the members of the ExecutiveBoard and Energy & Climate Affairs as well as the Sustainability Manager, the Corporate Environmental Department and heads of corporate functions involved in politicalissues. The aim of the call is to report on relevant political developments and streamline our positions for the Aurubis strategy.
CDP Page of 4137

C12.4
(C12.4) Have you published information about your organization’s response to climate change and GHG emissions performance for this reporting year in placesother than in your CDP response? If so, please attach the publication(s).
PublicationIn mainstream reports
StatusComplete
Attach the documentaurubis_annual-report_fy_18_19_2019_12_11.pdf
Page/Section referenceNumerbers on p. 47, further information p. 37,45,98.
Content elementsStrategyRisks & opportunitiesEmissions figuresOther metrics
Comment
PublicationIn voluntary sustainability report
StatusComplete
Attach the documentaurubis_sustainabilityreport_2017_18.pdf
Page/Section referencep.32
Content elementsStrategyEmissions figures
Comment
PublicationIn voluntary communications
StatusComplete
Attach the document2019_aurubis_ag_environmental_statement_en.pdf
Page/Section referencep.25
Content elementsEmissions figuresOther metrics
Comment
C15. Signoff
C-FI
(C-FI) Use this field to provide any additional information or context that you feel is relevant to your organization's response. Please note that this field is optionaland is not scored.
C15.1
(C15.1) Provide details for the person that has signed off (approved) your CDP climate change response.
Job title Corresponding job category
Row 1 CEO Chief Executive Officer (CEO)
CDP Page of 4138

SC. Supply chain module
SC0.0
(SC0.0) If you would like to do so, please provide a separate introduction to this module.
SC0.1
(SC0.1) What is your company’s annual revenue for the stated reporting period?
Annual Revenue
Row 1 11897000000
SC0.2
(SC0.2) Do you have an ISIN for your company that you would be willing to share with CDP?Yes
SC0.2a
(SC0.2a) Please use the table below to share your ISIN.
ISIN country code (2 letters) ISIN numeric identifier and single check digit (10 numbers overall)
Row 1 DE 0006766504
SC1.1
(SC1.1) Allocate your emissions to your customers listed below according to the goods or services you have sold them in this reporting period.
SC1.2
(SC1.2) Where published information has been used in completing SC1.1, please provide a reference(s).
SC1.3
(SC1.3) What are the challenges in allocating emissions to different customers, and what would help you to overcome these challenges?
Allocation challenges Please explain what would help you overcome these challenges
Diversity of product lines makes accurately accounting foreach product/product line cost ineffective
The establishment of a common approach to enable the private sector to assess, display and benchmark the environmental performance of products,services and companies based on the comprehensive assessment of environmental Impacts over the life-cycle.
SC1.4
(SC1.4) Do you plan to develop your capabilities to allocate emissions to your customers in the future?Yes
SC1.4a
CDP Page of 4139

(SC1.4a) Describe how you plan to develop your capabilities.
Aurubis continues its involvement in the Environmental Footprint project. With the development of the environmental footprint, the EU Commission wants to create aconsistent method for calculating the environmental performance of products and organizations throughout Europe, assess them and facilitate comparisons. In 2013 theCommission published the Environmental Footprint (EF) methodology to measure and communicate the life cycle environmental performance of products (ProductEnvironmental Footprint, PEF) and organizations (Organisational Environmental Footprint, OEF) , and launched a pilot phase. Aurubis was active in both areas. Aurubis tooka leading role in the OEF pilot on “Copper Production”, which was coordinated by the research center of the EU Commission (Joint Research Center, JRC). For the PEF pilotphase, Aurubis worked together with the European organization Eurometaux, the European Copper Institute and other companies from the non-ferrous metals and steelindustries on the pilot project “Metal Sheet Metal for Various Applications”. In 2017 we finalised the OEF sector-specific rules for copper production and tested how tocommunicate Environmental Footprint information to stakeholders and the effectiveness of the communication vehicle. The OEF sector rules for copper production have beensuccessfully approved by the Steering Committee on 15 February 2018. The Copper OEF develops a harmonized method to measure and communicate the life cycleenvironmental performance of copper producing companies, and well demonstrates the positive aspects of copper metallurgy and multi-metal recycling. The PEF categoryrules for metal sheet have been also finalised and were approved in November 2018. The Environmental Footprint pilot phase ended in April 2018 and a transition phase isnow established until possible adoption of policies implementing the Product Environmental Footprint (PEF) and Organisation Environmental Footprint (OEF) methods.Aurubis will continue to contribute to the further developments of the EF methodology during the transition phase. As part of its commitment to sustainable Development, thecopper industry is committed to providing data and information to enable users of copper to evaluate its impacts and benefits across the life cycle, from raw materialextraction to end-of life recycling. Aurubis has been involved for many years in life cycle assessment of copper cathode and contributed to the generation of cradle-to-gate lifecycle inventory (LCI) that evaluates the environmental impacts associated with global copper cathode production ( in cooperation with the International CopperAssociation).The latest update of the environmental profile of global copper cathode has been released by the International Copper Association at the beginning of 2018. Aurubis has also performed life cycle assessment studies with the purpose to conduct Environmental product declarations (EPD) on the basis of EN 15804 and ISO 14025for copper and copper alloys sheets used for architectural applications.The Environmental Product Declarations ( EPD) for six Aurubis Nordic products of copper /copperalloys sheets are published by the Institut Bauen und Umwelt e.V.. A challenge remains: the yearly update of the database.
SC2.1
(SC2.1) Please propose any mutually beneficial climate-related projects you could collaborate on with specific CDP Supply Chain members.
SC2.2
(SC2.2) Have requests or initiatives by CDP Supply Chain members prompted your organization to take organizational-level emissions reduction initiatives?Please select
SC3.1
(SC3.1) Do you want to enroll in the 2020-2021 CDP Action Exchange initiative?No
SC3.2
(SC3.2) Is your company a participating supplier in CDP’s 2019-2020 Action Exchange initiative?No
SC4.1
(SC4.1) Are you providing product level data for your organization’s goods or services?Yes, I will provide data
SC4.1a
(SC4.1a) Give the overall percentage of total emissions, for all Scopes, that are covered by these products.
SC4.2a
CDP Page of 4140

(SC4.2a) Complete the following table for the goods/services for which you want to provide data.
Name of good/ serviceCopper Production
Description of good/ serviceCopper production refers to primary and secondary copper production at the Hamburg, Lünen, Olen, and Pirdop sites. The product level data refers to the Scope 1emissions.
Type of productFinal
SKU (Stock Keeping Unit)tons
Total emissions in kg CO2e per unit210
±% change from previous figure supplied
Date of previous figure supplied
Explanation of change
Methods used to estimate lifecycle emissionsPlease select
SC4.2b
(SC4.2b) Complete the following table with data for lifecycle stages of your goods and/or services.
SC4.2c
(SC4.2c) Please detail emissions reduction initiatives completed or planned for this product.
Name of good/ service Initiative ID Description of initiative Completed or planned Emission reductions in kg CO2e per unit
SC4.2d
(SC4.2d) Have any of the initiatives described in SC4.2c been driven by requesting CDP Supply Chain members?Please select
Submit your response
In which language are you submitting your response?English
Please confirm how your response should be handled by CDP
I am submitting to Public or Non-Public Submission Are you ready to submit the additional Supply Chain Questions?
I am submitting my response InvestorsCustomers
Public Yes, submit Supply Chain Questions now
Please confirm belowI have read and accept the applicable Terms
CDP Page of 4141