near-surface s-wave and p-wave seismic velocities of ... · black mingo formation and (5 ... wooden...
TRANSCRIPT

Near-Surface S-wave and P-wave Seismic Velocities of Primary Geological Formations on the Piedmont and Atlantic Coastal Plain of South Carolina, USA by Jack K. Odum, Robert A. Williams, William J. Stephenson, and David M. Worley
Open-File Report 03-043
U,S. Hwy. 17site 7
Vpm/s
Vsm/s
0
10
20
30
* Poor data and norev ers e profile resultsin a non-realisticv elocity..
818
281
247
2894 *?
125
USNSNsite 9
Vpm/s
Vsm/s
0
10
20
30
40
50
450 200272
7921893
834
T pf
Ilse de Palmsite 8
Vpm/s
Vsm/s
0
10
20
30
948
1573
154
497 Ta
The Citadelsite 6
Vpm /s
Vsm /s
70
60
80
0
10
20
30
40
50
306
1737
170
199
492
795
Ta
T pf
Velocity Columns for Multiple Formation Sites
af
Qwc?
Qws+
Qwc
Qhs
T pcTa?
This report is preliminary and has not been reviewed for conformity with U.S. Geological Survey editorial standards or with the North American Stratigraphic Code. Any use of trade, firm, or product names is for descriptive purposes only and does not imply endorsement by the U.S. Government.
U.S. DEPARTMENT OF THE INTERIOR
U.S. GEOLOGICAL SURVEY Golden, Colorado
Near-Surface S-wave and P-wave Velocities of Primary Geological Formations on the Piedmont and Atlantic Coastal Plain of South Carolina, USA
by Jack K. Odum, Robert A. Williams, William J. Stephenson, and David M. Worley1
INTRODUCTION Numerous studies over the last few decades have clearly established that shear-wave seismic velocity (VS)- in the upper 30 to 60 m can greatly influence the amplification and duration of earthquake ground motion observed at the surface (e.g. Bocherdt et al., 1979; Joyner et al., 1981; Seed et al., 1988). The acquisition and determination of near-surface seismic velocities are also motivated by their use in the National Earthquake Hazards Reduction Program (NEHRP) model code provisions which place a special significance on shallow Vs (Building Seismic Safety Council, 1997).
Using seismic refraction/reflection profiling techniques, we acquired and determined shear-wave (VS) and compressional-wave (VP) velocities at nine locations in southeast South Carolina (specific site locations are referenced by number and plotted on Figure 1A). The sites sampled during this reconnaissance survey were selected on the premise that they were generally representative of near-surface materials associated with the primary geologic units located within the Piedmont and Atlantic Coastal Plain areas of South Carolina. Stratigraphic units sampled (Figure 1A) include: (1) Paleozoic rocks of the Carolina Slate Group at the Lake Murray spillway near Columbia, S.C., (2) the Cretaceous Tuscaloosa Formation at Ft. Jackson near Columbia, S.C., (3) the upper Cretaceous Peedee Formation at Deep Creek School, (4) the lower Tertiary Black Mingo Formation and (5) the lower Tertiary Santee Limestone. In and around Charleston, S.C. several sites that sampled the upper Tertiary Cooper Group (Ashley and Parkers Ferry Formations) and overlying Quaternary deposits include: (6) The Citadel, (9) USNSN installation site, (7) U.S. Highway 17 and (8) Pleistocene to Holocene strata at Isle of Palms north of Charleston, S.C. The U.S. Nuclear Regulatory Commission (NRC), through a joint NRC/USGS interagency agreement, provided funding for this project.
Results of this study were used to constrain shallow (<100 meter) VS velocity models in a larger-scope analysis that estimated the seismic site response of Atlantic and Gulf of Mexico Coastal Plain and Mississippi Embayment regions of the southeastern United States (Mueller, 2000). In this region 0-15 kilometers of unconsolidated to weakly consolidated Cretaceous and younger sediments overlie Paleozoic bedrock. In an independent but related study, Wheeler and Cramer (2000) estimated site amplification for a proposed bridge near Charleston, S.C. Their analysis compared the amplifications that would result from various hypothetical stratigraphic columns reaching from the surface down to the metamorphic and igneous rock basement at a depth of approximately 3 km.
1
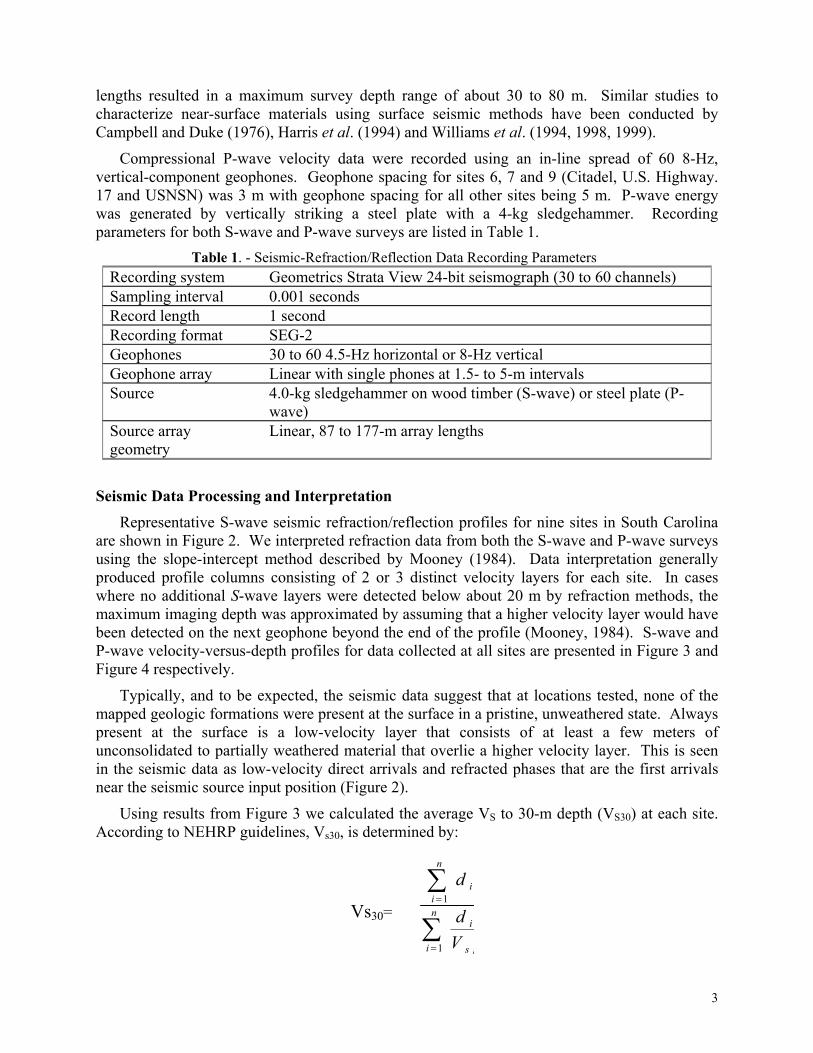
GEOLOGIC SETTING AND SITE STRATIGRAPHY The regional coverage of this survey included portions of two distinctive geographic
provinces, the Piedmont and the Coastal Plain. The Piedmont province lies between the more mountainous (<300-m elevation) Blue Ridge region of western South Carolina and the “Fall Line” (represented approximately by the heavy yellow dashed line on Figure 1A); whereas the area from the “Fall Line” to the Atlantic Ocean forms the landward portion of the Coastal Plain (see cross section A-A’ on Figure 1B). The physiographic feature termed the “Fall Line” marks the geographical location where folded, faulted and recrystallized basement rock (red and purple map colors on Figure 1A) are on-lapped and buried beneath the relatively undeformed sedimentary rocks (Cretaceous and Tertiary rocks (greens and oranges, respectively, on Figure 1 A)) and soils of the Coastal Plain province. The sedimentary deposits of the Coastal Plain province are typically unconsolidated, soft, and more easily eroded than the more resistant granites, gneisses and schist exposed in the Piedmont area. As defined by Cooke (1936), the boundary between the two provinces is characterized by a series of waterfalls and rapids where streams flowing off of the resistant Piedmont rocks cut deeper valleys into the softer Coastal Plain sediments (whence the term “Fall Line”). The basement rock surface underlying the Piedmont region and beneath the Coastal Plain sedimentary strata is a weathered, dissected and gently undulating peneplain (see Figure 1B cross-section A-A’).
The Coastal Plain province extends from the Atlantic Ocean inland for a distance of 190 to
240 km where it thins and disappears in the vicinity of “Fall Line” at an elevation of approximately 100 m. This province consists of a seaward-thickening wedge of relatively undeformed and predominantly weakly-lithified to unconsolidated sedimentary units that range in age from Upper Cretaceous to Holocene (90 ma to less than 10 ka). In the vicinity of Charleston, S.C., these units are approximately 1.2 km thick (Bonini and Woollard, 1960). For a more in-depth discussion of the pre-Cretaceous (Jurassic, Triassic and basement complex rocks) that underlie the Charleston, S.C. area (none of which are exposed and therefore not sampled during this survey), the reader is referred to Wheeler and Cramer (2000).
Coastal Plain sedimentary units relevant to this study (those that are exposed at or near the
surface) comprise a sequence of 12 formations (and/or groups) that unconformably overly basement rock. The oldest units (upper Cretaceous) are exposed to the west within the Piedmont region and successively younger units are found exposed eastward with Holocene units occurring in the coastal regions (see Figures 1A and B, geologic map and cross-section). Figure 1C presents a generalized stratigraphic column for the study area (modified from Cooke, 1936). On this figure, formations and/or groups highlighted in yellow represent stratigraphic units from which P- and S-wave velocities were obtained. Listed in the appendix are generalized descriptions of surveyed units, referenced to the site location numbers on Figure 1A. SEISMIC DATA ACQUISITION
Shear-wave (S) data were recorded using a linear array of 30 to 60, 4.5-Hz horizontal-component geophones spaced 1.5- or 5-m apart. The geophones are single component and oriented perpendicular to the profile direction. The S-wave seismic source consisted of a wooden timber with steel caps placed on pavement or soil beneath the wheels of the vehicle at right angles to the direction of the profile. Reversed polarity seismic energy was produced by striking opposite ends of the timber with a 4-kg sledgehammer. A set of reversed seismic S-wave profiles ranging in length from 87 to 177 m was collected at each site. The S-wave profile
2

3
1
6
7
8
9
`
`
A`
A
Tm Miocene sandy phosphatic marl, shaley (Hawthorn Group)
Qa Surface soils and fill, Pleistocene and Holocene of alluvial and marine origin
Tp Pliocene sandy shell marl
Eocene upper units- calcilutite and limestones (Cooper Gp - Parkers Ferry Fm. )Santee Ls.
Kul Cretaceous- predominantly clean to silty sands and pure clay (Tuscaloosa Fm.)Pc Precambrian- metamorphosed early Paleozoic and older sedimentary and
volcanic rocks and granitic intrusions (Carolina Slate Group)
Te2
Eocene lower units-clayey to sandy siltstone and limestone (Wilcox Group, BlackMingo Fm.)
To Oligocene massive phosphatic marl (Cooper Group-Ashley Fm.)
Generalized Geologic Units
Tm
TmTe1Te2
4
Te 1
Te2
Te2
Figure 1A.
Te1
Kup Cretaceous- calcareous clayey sands and limestone (Peedee Fm.)

Atlantic Coast MarginC o a s t a l P l a i n
CarolinaSlateBelt
Columbia,S.C.
Charleston,S.C.
A A`
Meters500
10001500
2000
B.
C.
Piedmon
t{
PREC
AMBI
ANC
RET
ACEO
US
PALE
O-
CEN
EEO
CEN
EO
LIG
OC
ENE
PLIO
-C
ENE
QU
AT.
Periodor
Series
MIO
-C
ENE
South CarolinaEastern Generalized
Goose Creek Fm.
Chandler Bridge Fm.
McBeanFm.
Warley HillFm.
CongrareeFm.
*Marks Head +Edisto Fm.
Unnamedalluvium and marine
AshleyFormation
SanteeLimestone
BlackMingoGroup
Peedee Fm.
Tuscaloosa Fm.
Igneous andMetamorphic
Rocks
CooperG
roup
Figure 1. (A) Index geologic map of south-easternSouth Carolina modified from the 1989 AAPGGeologic Highway Map, Mid-Atlantic Region. Circlednumbers indicate locations where shallow shear andcompressional wave velocity data was acquired.Dashed yellow line indicates the approximate positionof the “Fall Line”. (B) Cross-section A-A'.(C) Generalized stratigraphic column for South Carolinacoastal plain and piedmont. Ruled areas indicate nostrata for that time period. Yellow high-lighted areasidentify formational units upon which P- and S-wavevelocities were measured at the surface using therefraction/reflection method. Column modified fromCooke (1936).Black Creek
Group
Parkers FerryFormation
“Fall Line”
lengths resulted in a maximum survey depth range of about 30 to 80 m. Similar studies to characterize near-surface materials using surface seismic methods have been conducted by Campbell and Duke (1976), Harris et al. (1994) and Williams et al. (1994, 1998, 1999).
Compressional P-wave velocity data were recorded using an in-line spread of 60 8-Hz, vertical-component geophones. Geophone spacing for sites 6, 7 and 9 (Citadel, U.S. Highway. 17 and USNSN) was 3 m with geophone spacing for all other sites being 5 m. P-wave energy was generated by vertically striking a steel plate with a 4-kg sledgehammer. Recording parameters for both S-wave and P-wave surveys are listed in Table 1. Table 1. - Seismic-Refraction/Reflection Data Recording Parameters
Recording system Geometrics Strata View 24-bit seismograph (30 to 60 channels) Sampling interval 0.001 seconds Record length 1 second Recording format SEG-2 Geophones 30 to 60 4.5-Hz horizontal or 8-Hz vertical Geophone array Linear with single phones at 1.5- to 5-m intervals Source 4.0-kg sledgehammer on wood timber (S-wave) or steel plate (P-
wave) Source array geometry
Linear, 87 to 177-m array lengths
Seismic Data Processing and Interpretation Representative S-wave seismic refraction/reflection profiles for nine sites in South Carolina
are shown in Figure 2. We interpreted refraction data from both the S-wave and P-wave surveys using the slope-intercept method described by Mooney (1984). Data interpretation generally produced profile columns consisting of 2 or 3 distinct velocity layers for each site. In cases where no additional S-wave layers were detected below about 20 m by refraction methods, the maximum imaging depth was approximated by assuming that a higher velocity layer would have been detected on the next geophone beyond the end of the profile (Mooney, 1984). S-wave and P-wave velocity-versus-depth profiles for data collected at all sites are presented in Figure 3 and Figure 4 respectively.
Typically, and to be expected, the seismic data suggest that at locations tested, none of the mapped geologic formations were present at the surface in a pristine, unweathered state. Always present at the surface is a low-velocity layer that consists of at least a few meters of unconsolidated to partially weathered material that overlie a higher velocity layer. This is seen in the seismic data as low-velocity direct arrivals and refracted phases that are the first arrivals near the seismic source input position (Figure 2).
Using results from Figure 3 we calculated the average VS to 30-m depth (VS30) at each site. According to NEHRP guidelines, Vs30, is determined by:
∑
∑
=
=n
i is
i
n
ii
Vd
d
1
1Vs30=
3

Figure 2. Representative shear (S)-wave seismic refraction/reflection profiles from each of the 9 sites in South Carolina. Red lines on seismic data highlight refractions phases with the seismic velocity for that phase annotated above the red line.

0
5
10
15
20
25
30
35
0 500 1000 1500 2000 2500 3000
S-wave Velocity (m/s)
Dep
th (m
)Santee Ls (5)
Ft. Jackson (2)
Deep Creek (3)
Black Mingo (4)
Lake Murray (1)
USNSN (9)
US Hwy 17 (7)
Isle of Palms (8)
The Citadel (6)
Figure 3. S-wave velocity versus depth profiles for each of the nine sites studied in South Carolina. Numbers in legend are referenced to site locations on Figure 1 A.
Table 3. South Carolina site locations, surficial geology, and S-wave velocity measurements.
Site Name Latitude oNorth
Longitude oWest
Surficial Geology
Vs30 (m/s)
NEHRP Soil
Profile Type
Highest Vs in the upper 50 m (m/s) Description
Lake Murray Spillway 35.052 81.210 fill, Pz 661 C*/A 2674; @23 m Carolina Slate Group (Pz) Fort Jackson 34.028 90.912 Ku 465 C 866; @27 m Tuscaloosa Fm Deep Creek School. 33.699 79.351 Q?, Ku 246 D 710; @22 m Q over Peedee Fm Black Mingo 33.551 79.933 Q, Tl 477 C 855; @9 m Q over Eocene Wilcox Grp Santee Ls. 33.235 80.433 Tl 583 C 932; @7 m Santee Limestone The Citadel, Charles. 32.798 79.958 Q, Tu 248 D 795; @78 m Q over Tu (Cooper Group) US Hwy. 17, Charles. 32.785 79.955 fill, Q 182 D 247; @11 m Q over Tu (Cooper Group) Isle of Palms 32.795 79.775 Qh, Tu 179 E 497; @23 m Q over Tu (Cooper Group) USNSN 33.106 80.178 Q, Tu 464 C 792; @10 m Q over Tu (Cooper Group) Q – Quaternary; Tu – upper Tertiary; Tl – lower Tertiary; Ku – upper; Cretaceous; Pz – Paleozoic;; [C*/A] is text for explanation of dual classification.
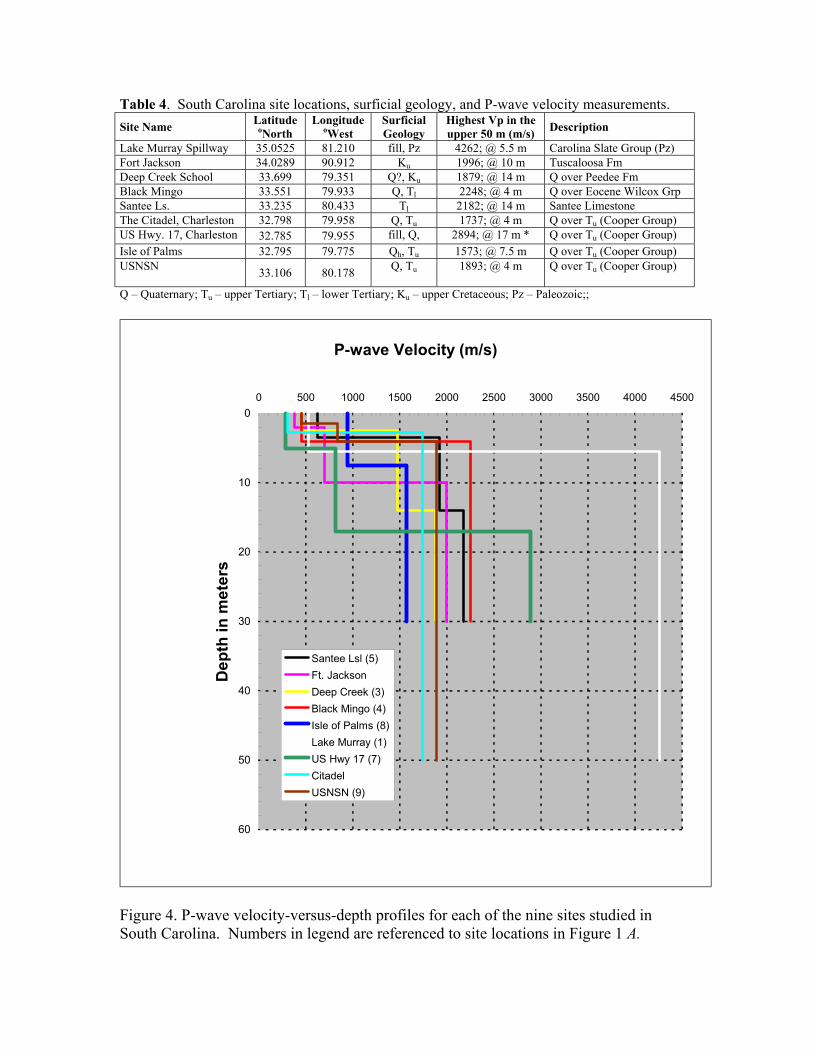
Table 4. South Carolina site locations, surficial geology, and P-wave velocity measurements. Site Name Latitude
oNorth Longitude
oWest Surficial Geology
Highest Vp in the upper 50 m (m/s) Description
Lake Murray Spillway 35.0525 81.210 fill, Pz 4262; @ 5.5 m Carolina Slate Group (Pz) Fort Jackson 34.0289 90.912 Ku 1996; @ 10 m Tuscaloosa Fm Deep Creek School 33.699 79.351 Q?, Ku 1879; @ 14 m Q over Peedee Fm Black Mingo 33.551 79.933 Q, Tl 2248; @ 4 m Q over Eocene Wilcox Grp Santee Ls. 33.235 80.433 Tl 2182; @ 14 m Santee Limestone The Citadel, Charleston 32.798 79.958 Q, Tu 1737; @ 4 m Q over Tu (Cooper Group) US Hwy. 17, Charleston 32.785 79.955 fill, Q, 2894; @ 17 m * Q over Tu (Cooper Group) Isle of Palms 32.795 79.775 Qh, Tu 1573; @ 7.5 m Q over Tu (Cooper Group) USNSN 33.106 80.178 Q, Tu 1893; @ 4 m Q over Tu (Cooper Group)
Q – Quaternary; Tu – upper Tertiary; Tl – lower Tertiary; Ku – upper Cretaceous; Pz – Paleozoic;;
P-wave Velocity (m/s)
0
10
20
30
40
50
60
0 500 1000 1500 2000 2500 3000 3500 4000 4500
Dep
th in
met
ers
Santee Lsl (5)Ft. JacksonDeep Creek (3)Black Mingo (4)Isle of Palms (8)Lake Murray (1)US Hwy 17 (7)CitadelUSNSN (9)
Figure 4. P-wave velocity-versus-depth profiles for each of the nine sites studied in South Carolina. Numbers in legend are referenced to site locations in Figure 1 A.

where di is the thickness of the ith layer between 0 and 30 m and Vsi is the velocity of the ith layer (Building Seismic Safety Council, 1997). Table 2 shows the NEHRP classification code as it is defined in terms of VS.
Table 2. - Site Categories in New Building Codes (NEHRP 1994; UBC 1997) Soil Profile
Type Rock/Soil Description Average S-wave Velocity (m/s)
top 30 m A Hard rock > 1500 B Rock 760 – 1500 C Very dense soil/soft rock 360 – 760 D Stiff soil 180 – 360 E Soft soil < 180 F Special soils requiring
site-specific evaluation
Tables 3 and 4 present interpreted S- and P-wave results and provide information on site location coordinates, geologic map unit symbols and descriptions (see Figures 1A and C) and both the average and range of interpreted velocity values. Table 3 also contains calculated VS30 and NEHRP soil profile type classification codes (see Table 2 for explanation). In some cases, values listed in the “Highest Vs in the upper 50 m” column on Table 3 and Figures 2 and 3 differ from velocities shown on the Figure 2 refraction/reflection profiles. This happens because the data in Table 3 are calculated averages derived from both the Figure 2 profiles and from the reverse profiles obtained at each site (not shown).
DISCUSSION OF SITE VELOCITIES The histogram chart (Figure 5) illustrates the VS range for each successively higher velocity
layer identified by site. For three sites (The Citadel, USNSN and Ft. Jackson), a very thin surface layer, generally less than 2 m thick, was identified. If this layer was incorporated into the next higher velocity layer, the overall thickness of the V1 layer at all nine sites surveyed would range from 6.5 m to 22 m. All interpreted velocity layer values (including layers less than 2 m thick) are shown in Figure 5. When viewing Figure 5, it should be noted that the age of surface mapped (and underlying) geologic units increases from left to right.
All velocity layer interpretations are based on reversed profiles, except for the U.S. Highway 17 site (Figure 1A #7) where space limitations prevented the acquisition of a far offset reverse profile on the south end of the array. These individual layer results, including the very thin surface unit discussed above, are graphed as side-by-side P- and S-wave velocity columns in Figures 6 and 7. In general, unit thickness and degree of velocity contrast between layers is clearly evident in Figures 3, 4, 6 and 7.
Typical of data collected from these types of stratigraphic formations, the thicknesses of the P- and S-wave velocity layers differ. This difference is in part a result of the influence that the water table and vadose zone have on the propagation of P-wave energy. Shear-wave energy propagation for the most part is unaffected by the water table and we can, therefore, assume for discussion that the various near-surface (upper 50 m) velocity layers represent changes in
4

0
1000
2000
3000
shea
r-w
ave
velo
city
in
m/s
V1 surface velocity) 125 154 170 261 251 238 208 240 239
V2 247 497 199 792 932 855 710 392 1184
V3 492 551 2674
V4 795 866
US Hwy 17
Isle de Palm Citidal USNSN Santee
Ls.Black Mingo
Deep Creek
Ft. Jackson
Lake Murray
Figure 5. Histogram displaying the relationship of the surficial (V1) layer (regardless of thickness) to the underlying higher velocity layers for each site. In general, the geologic age of the bedrock units sampled at each site increases from left to right.

lithology and/or physical properties. Because VS layer contrasts are of primary importance to the engineering community and in seismological modeling of site response, the following discussion will focus on the S-wave information with comments on P-wave data inserted where appropriate.
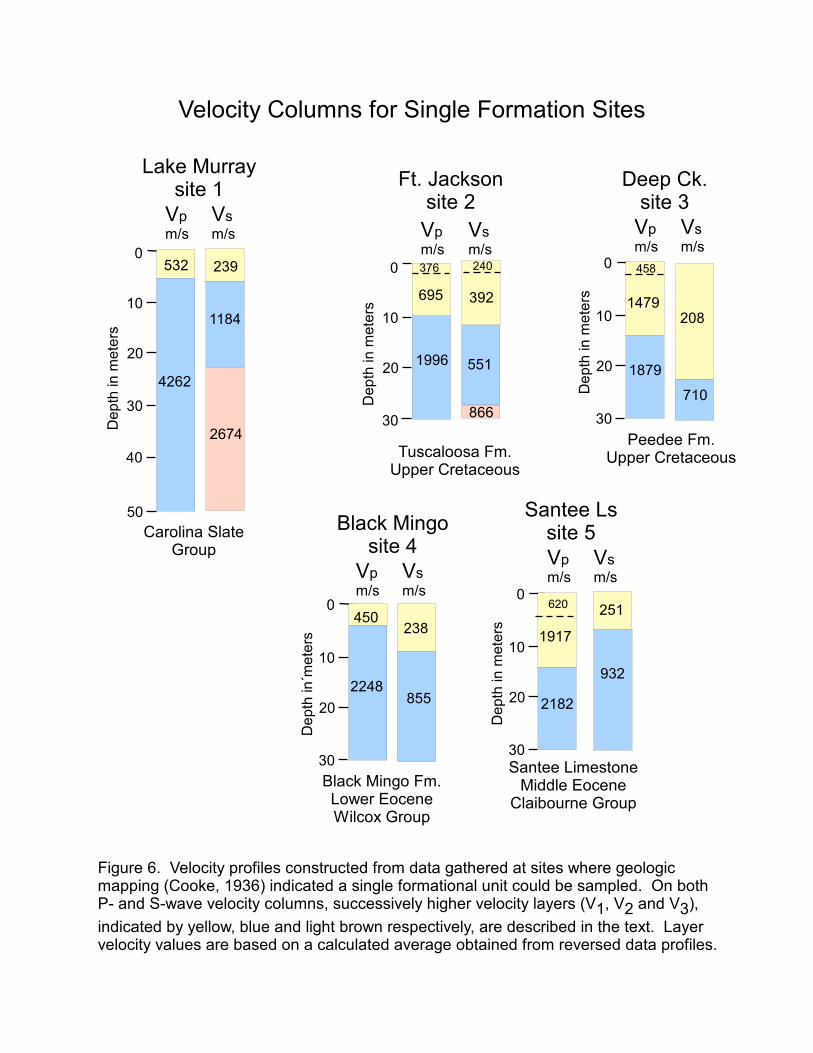
Although multiple velocity layers were determined at all sites, the sites themselves fall into two groups. The first group consists of sites where only a single geologically mapped formation was sampled (Lake Murray (1), Ft. Jackson (2), Deep Creek (3), Black Mingo (4) and Santee Ls. (5)). Velocity columns for this group are presented in Figure 6. On the P and S-wave velocity columns for this group, the velocity layers (V1, V2 and V3) are indicated by yellow, blue and light brown respectively.
The second group consists of sites where multiple geologic formations of various ages (Holocene and older) were sampled and are located in and around the Charleston, S.C. region. Velocity column data for these sites (Citadel (6), U.S. Hwy. 17 (7), Isle de Palm (8) and USNSN (9)) is presented in Figure 7. Based on existing geologic maps, cross sections and personal communication (Weems, 2002), we have tentatively correlated some of the S-wave velocity layers in this group with specific geologic formations.
Single Geologic Unit Sites (see Figure 6)
Lake Murray, site 1 We interpret three distinct S-wave velocity layers at this site. The V1 layer (0-7 m) velocity is interpreted to be surface soil and loose debris partially accumulated during the construction of the Lake Murray dam spillway. The intermediate velocity layer (7-23 m) is interpreted to correlate with weathered and fractured Carolina Slate Group bedrock. We interpret the higher velocity layer (23-50 m) to represent a transition to more competent bedrock. The VS30 NEHRP soil profile type classification determined for this site is “C” (see Tables 2 and 3). This VS30 value strongly reflects the influence of the thick V1 and V2 layers that predominantly consist of soil, rock rubble and transitionally weathered bedrock. If the 7 m thick V1 layer (interpreted to be soil and loose debris) were discarded and the VS30 NEHRP soil profile type classification was calculated using the V2 and V3 layer velocities, a classification type “A” (hard rock) would be determined.
Bonini and Woollard (1960) determined a P-wave velocity range of 4,700 to 5,500 m/s for Carolina Slate Group rocks (predominantly composed of metamorphic gneiss, schist and volcanic rock) exposed along the “Fall Line” near our site. They also stated that often three distinct velocity layers were observed, which they interpreted to represent a weathered zone (approximately 0-9 m thick with an average velocity of 1,190 m/s) underlain by a transitional zone (approximately 22 m thick with an average velocity of 2,970 m/s) over fresh bedrock. From our data (#1, Figure 1 A), we interpret a 5-m-thick V1 layer with a velocity of 532 m/s and a V2 layer from 5-50 m with a velocity of 4,262 m/s. Our calculated V1 layer value reflects the presence of soil and fractured debris in the near surface. The V2 velocity layer has a value that falls midway between the transitional and fresh bedrock values cited by Bonini and Woollard (1960).
5
Ft. Jacksonsite 2Vpm/s
Vsm/s
0
10
20
30
Dep
thin
met
ers
376
1996
240
392
551
695
866
Lake Murraysite 1
Vpm/s
Vsm/s
0
10
20
30
40
50
Dep
thin
met
ers
532
4262
239
1184
2674
Carolina SlateGroup
Deep Ck.site 3
Vpm/s
Vsm/s
0
10
20
30
Dep
thin
met
ers 1479
1879
208
710
458
Santee Lssite 5Vpm/s
Vsm/s
0
10
20
30
Dep
thin
met
ers
1917
2182
251
932
620
Santee LimestoneMiddle Eocene
Claibourne Group
Black Mingosite 4
Vpm/s
Vsm/s
0
10
20
30
Dep
thin
met
ers
Black Mingo Fm.Lower EoceneWilcox Group
450
2248
238
855`
Tuscaloosa Fm.Upper Cretaceous
Peedee Fm.Upper Cretaceous
Figure 6. Velocity profiles constructed from data gathered at sites where geologicmapping (Cooke, 1936) indicated a single formational unit could be sampled. On bothP- and S-wave velocity columns, successively higher velocity layers (V1, V2 and V3),indicated by yellow, blue and light brown respectively, are described in the text. Layervelocity values are based on a calculated average obtained from reversed data profiles.
Velocity Columns for Single Formation Sites
U,S. Hwy. 17site 7
Vpm/s
Vsm/s
0
10
20
30
Dep
thin
met
ers
* Poor data and noreverse profile resultsin a non-realisticvelocity..
818
281
247
2894*?
125
USNSNsite 9
Vpm/s
Vsm/s
0
10
20
30
40
50
Dep
thin
met
ers
450 200272
7921893
834
Tpf
Ilse de Palmsite 8
Vpm/s
Vsm/s
0
10
20
30
Dep
thin
met
ers 948
1573
154
497 Ta
The Citadelsite 6
Vpm/s
Vsm/s
70
60
80
0
10
20
30
40
50
Dep
thin
met
ers
306
1737
170
199
492
795
Ta
Tpf
Velocity Columns for Multiple Formation Sites
af
Qwc?
Qws+
Qwc
Qhs
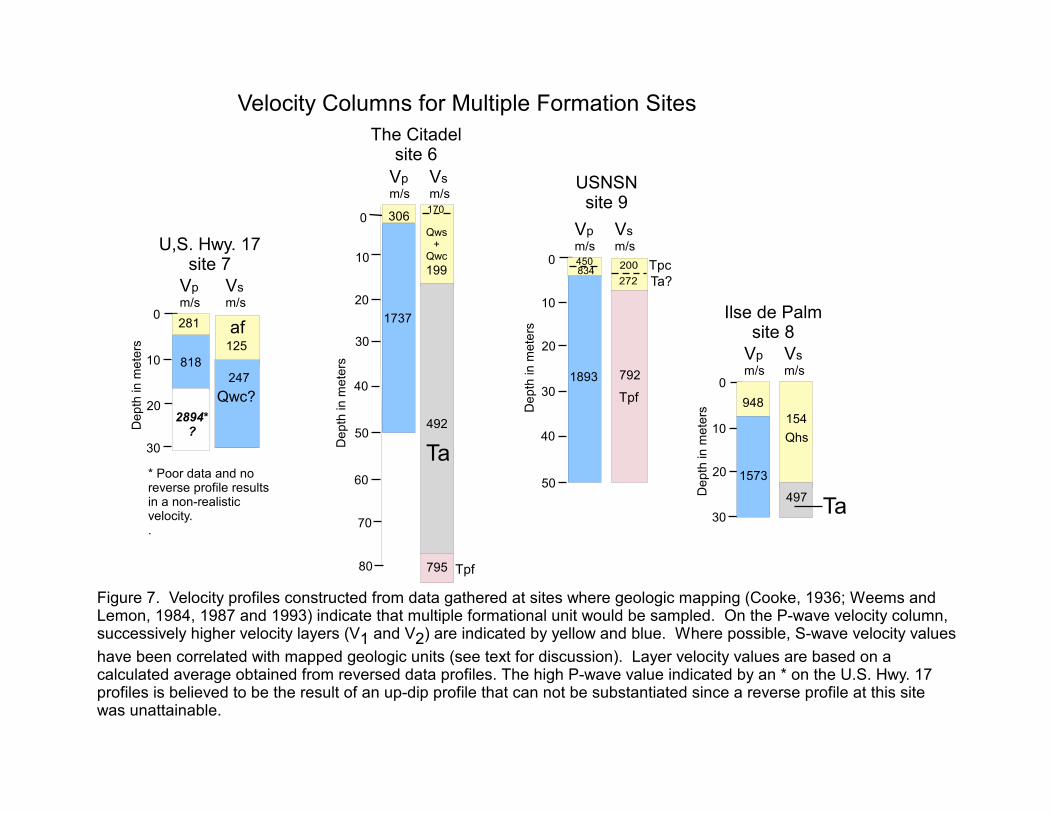
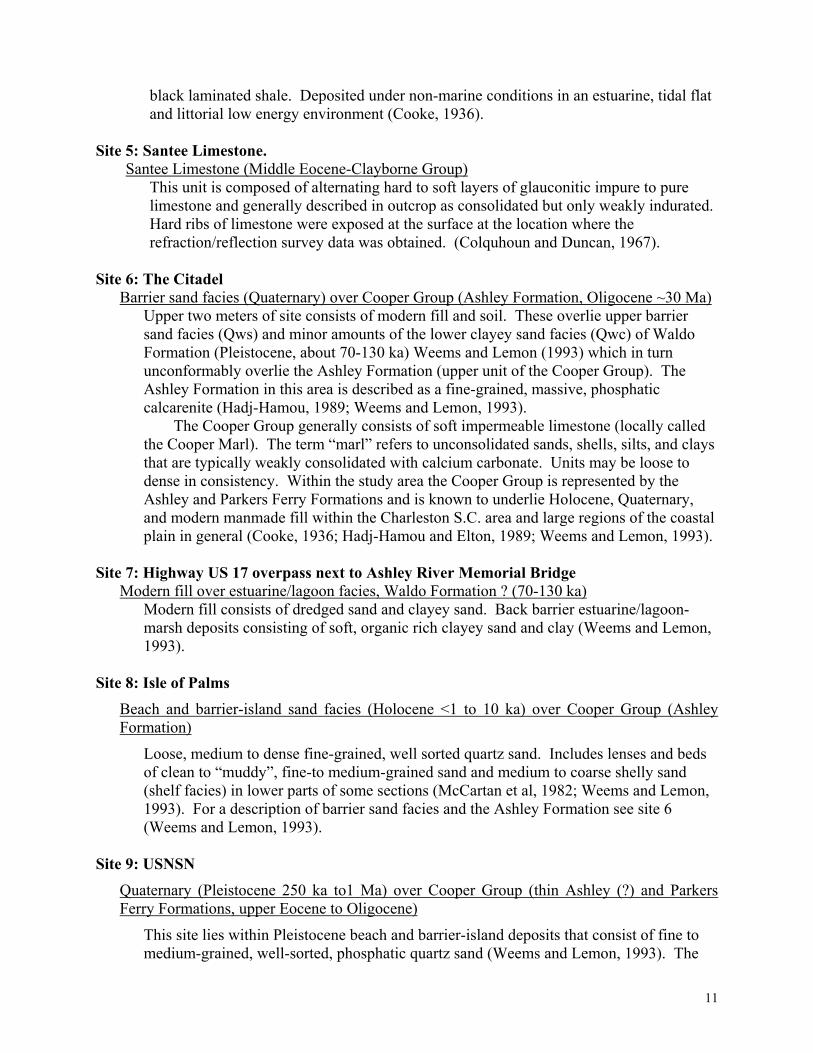
Figure 7. Velocity profiles constructed from data gathered at sites where geologic mapping (Cooke, 1936; Weems andLemon, 1984, 1987 and 1993) indicate that multiple formational unit would be sampled. On the P-wave velocity column,successively higher velocity layers (V1 and V2) are indicated by yellow and blue. Where possible, S-wave velocity valueshave been correlated with mapped geologic units (see text for discussion). Layer velocity values are based on acalculated average obtained from reversed data profiles. The high P-wave value indicated by an * on the U.S. Hwy. 17profiles is believed to be the result of an up-dip profile that can not be substantiated since a reverse profile at this sitewas unattainable.
TpcTa?

Ft. Jackson, site 2 This site, located southeast of the “Fall Line” (#2 on Figure 1A), sampled the upper Cretaceous Tuscaloosa Formation, which lies unconformably upon the Carolina Slate Group and is the oldest outcropping sedimentary unit in the Coastal Plain province of South Carolina. This formation was deposited under non-marine fluvial conditions and is described by Cooke (1936) as containing a variety of interbedded lithologies.
Both the P- and S-wave data show a low-velocity layer in the upper 2 m of the site. The near-surface material at this site consists of unconsolidated very fine to medium, loose, permeable sand, locally derived from the Tuscaloosa Formation (Paradesse et al, 1953). The two-meter-thick low-velocity (P-wave=376 m/s and S-wave=240 m/s) layer is interpreted to correlate with this mantle of colluvial and eolian material (see Figure 6). The next interpreted velocity boundary occurs at a depth of 10 m for P-wave and 12 m for S-wave. This V2 layer probably represents a weathered transitional zone. The V4 S-wave velocity layer identified at a depth of 27 m may represent a change in formation and/or a facies change (i.e. channel fill, dense clay unit). The VS30 NEHRP soil profile type classification for this site is “C”.
Deep Creek, site 3
The youngest of the upper Cretaceous units, the Peedee Formation, was deposited in an open marine environment and consists of interbedded clayey sand, impure limestone and massive dark clays (Cooke, 1936). Both S- and P-wave velocity data (Figures 3 and 4) show two distinct layers. Figure 4 (P-wave data) shows a relatively thin surficial layer. The S-wave column shows a thick (22 m) V1 layer with a relatively low velocity (208 m/s) in comparison to the previously discussed upper Cretaceous site. Possible explanations for the relatively slow velocity of this thick layer are deep weathering and/or strata with physical properties that produce a slower than anticipated velocity. The higher-velocity layer is inferred to represent fresh, (or at least relatively less weathered) competent bedrock. Although this site has a V2 layer velocity that correlates with a very dense soil/soft rock classification, the very thick (22 m) V1 layer with a relatively low velocity (208 m/s) results in a VS30 NEHRP soil profile type classification of “D”, indicating that this site has the properties of a stiff soil.
Black Mingo, site 4
The Paleocene to lower Eocene Black Mingo Formation is part of the regionally widespread Wilcox Group, which is found throughout the Atlantic Coast, Gulf Coast and Mississippi Embayment states. Although the Black Mingo Formation and the previously discussed Peedee Formation were deposited under similar environmental conditions, this unit is described by Cooke (1936) as predominantly consisting of partly lithified to weakly consolidated pebbly sandstone interbedded with laminated to hard fossiliferous shale. Even though the site surface conditions were that of an unconsolidated pebbly sand the calculated S-wave low-velocity V1 layer thickness was considerably thinner in comparison to what was determined for the Peedee Formation site (#3). Additionally, when compared to the older Peedee Formation, both P- and S-wave V2 velocities are higher, reflecting the more lithified nature of this unit. The S-wave V2 layer velocity (855 m/s) is the second highest recorded for sedimentary units and is less than 10% slower than the V2 velocity recorded for the Santee Limestone. The VS30 NEHRP soil profile type classification for this site is “C”, a very dense soil/soft rock.
6
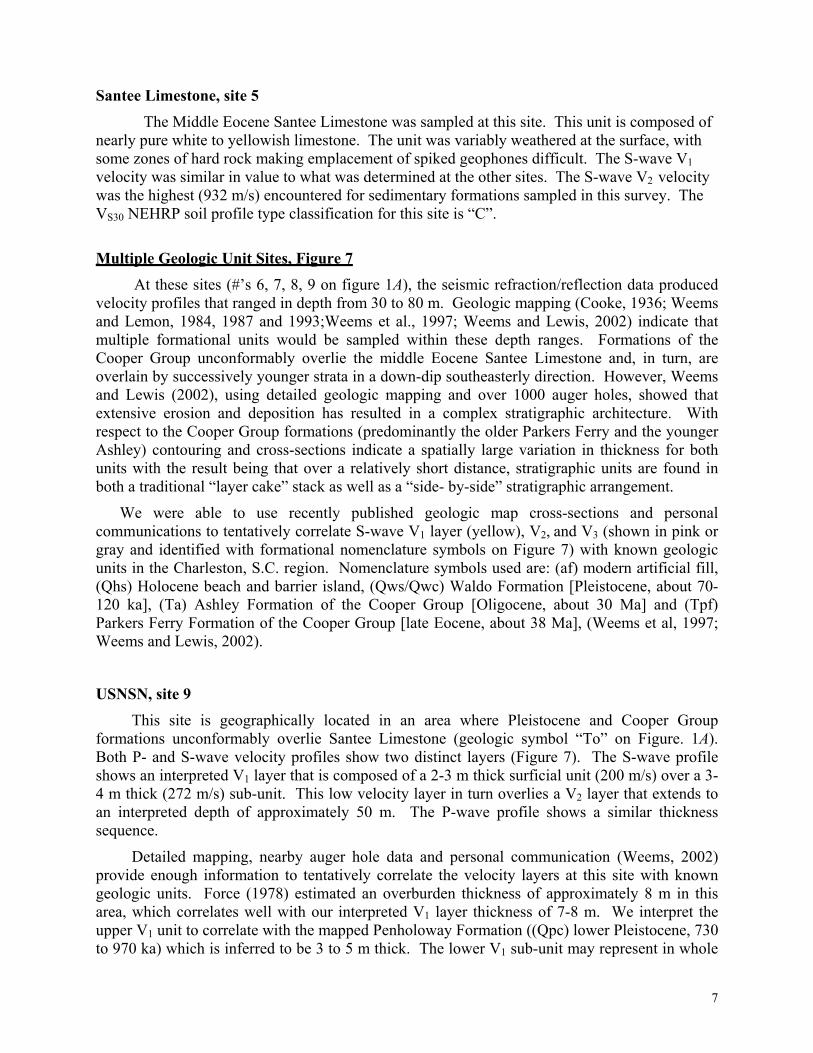
Santee Limestone, site 5 The Middle Eocene Santee Limestone was sampled at this site. This unit is composed of nearly pure white to yellowish limestone. The unit was variably weathered at the surface, with some zones of hard rock making emplacement of spiked geophones difficult. The S-wave V1 velocity was similar in value to what was determined at the other sites. The S-wave V2 velocity was the highest (932 m/s) encountered for sedimentary formations sampled in this survey. The VS30 NEHRP soil profile type classification for this site is “C”.
Multiple Geologic Unit Sites, Figure 7 At these sites (#’s 6, 7, 8, 9 on figure 1A), the seismic refraction/reflection data produced velocity profiles that ranged in depth from 30 to 80 m. Geologic mapping (Cooke, 1936; Weems and Lemon, 1984, 1987 and 1993;Weems et al., 1997; Weems and Lewis, 2002) indicate that multiple formational units would be sampled within these depth ranges. Formations of the Cooper Group unconformably overlie the middle Eocene Santee Limestone and, in turn, are overlain by successively younger strata in a down-dip southeasterly direction. However, Weems and Lewis (2002), using detailed geologic mapping and over 1000 auger holes, showed that extensive erosion and deposition has resulted in a complex stratigraphic architecture. With respect to the Cooper Group formations (predominantly the older Parkers Ferry and the younger Ashley) contouring and cross-sections indicate a spatially large variation in thickness for both units with the result being that over a relatively short distance, stratigraphic units are found in both a traditional “layer cake” stack as well as a “side- by-side” stratigraphic arrangement.
We were able to use recently published geologic map cross-sections and personal communications to tentatively correlate S-wave V1 layer (yellow), V2, and V3 (shown in pink or gray and identified with formational nomenclature symbols on Figure 7) with known geologic units in the Charleston, S.C. region. Nomenclature symbols used are: (af) modern artificial fill, (Qhs) Holocene beach and barrier island, (Qws/Qwc) Waldo Formation [Pleistocene, about 70-120 ka], (Ta) Ashley Formation of the Cooper Group [Oligocene, about 30 Ma] and (Tpf) Parkers Ferry Formation of the Cooper Group [late Eocene, about 38 Ma], (Weems et al, 1997; Weems and Lewis, 2002).
USNSN, site 9
This site is geographically located in an area where Pleistocene and Cooper Group formations unconformably overlie Santee Limestone (geologic symbol “To” on Figure. 1A). Both P- and S-wave velocity profiles show two distinct layers (Figure 7). The S-wave profile shows an interpreted V1 layer that is composed of a 2-3 m thick surficial unit (200 m/s) over a 3-4 m thick (272 m/s) sub-unit. This low velocity layer in turn overlies a V2 layer that extends to an interpreted depth of approximately 50 m. The P-wave profile shows a similar thickness sequence.
Detailed mapping, nearby auger hole data and personal communication (Weems, 2002) provide enough information to tentatively correlate the velocity layers at this site with known geologic units. Force (1978) estimated an overburden thickness of approximately 8 m in this area, which correlates well with our interpreted V1 layer thickness of 7-8 m. We interpret the upper V1 unit to correlate with the mapped Penholoway Formation ((Qpc) lower Pleistocene, 730 to 970 ka) which is inferred to be 3 to 5 m thick. The lower V1 sub-unit may represent in whole
7

or in part: (1) a facies change in the Qpc, (2) thin weathered Cooper Group Ashley Formation (Ta) or (3) weathered Parkers Ferry Formation (Tpc, Weems et al., 1997). The V2 layer (792 m/s) is inferred to correlate with the Parkers Ferry Formation (upper Eocene) consisting of a dense calcilutite to very fine-grained calcarenite (Weems et al., 1997). VS30 NEHRP soil profile type classification is “C” (very dense soil/soft rock).
The Citadel, site 6 High quality S-wave data to a depth of approximately 80 m was acquired at this site located just beyond the northeast boundary of The Citadel, Charleston, S.C. (Figure 1A). From the S-wave column (Figure 7), we observed that the upper low-velocity V1 layer consists of a thin 1.5 m thick surficial unit of loose soil (170 m/s) above the primary unit (199 m/s) which is approximately 17 m thick. This layer overlies a 50 m thick V2 layer with a velocity of 492 m/s. A high amplitude reflection indicates a V3 (795 m/s) layer starting at about 78 m depth.
Based upon information from auger hole sampling (Hadj-Hamou and Elton, 1989) and a projected geologic cross-section (Weems and Lemon (1993), a near-surface stratigraphy of approximately 17 m of predominantly loose to medium dense sand over Cooper Group formations is expected in the vicinity of our refraction/reflection profile. The expected contact depth matches closely with the S-wave V1 layer thickness (17 m) determined by our survey. We correlate the S-wave V1 layer with the upper barrier sand facies (Qws) and minor amounts of the lower clayey sand facies (Qwc) of Waldo Formation (Pleistocene, about 70-130 ka) (Weems and Lemon, 1993). The S-wave V2 layer (492 m/s) correlates with the Ashley Formation of the Cooper Croup (see Figure 1C). Based upon similarity in S-wave velocity, 795 m/s for the USNSN site 9 and 792 m/s for The Citadel V3 layer (see S-wave profiles Figure 7), stratigraphic position, and personal communication (Weems, 2002), we interpret the deepest velocity layer at The Citadel site to correlate with the Parkers Ferry Formation. The VS30 NEHRP soil profile type classification is “C” (very dense soil/soft rock).
Isle de Palm, site 8 This site location is near the center of a barrier island approximately 16 km east of Charleston, S.C. (see Figure 1 A). Both P- and S-wave velocity profiles show a distinct two-layer stratigraphy within the interpreted depth range of 30 m (Figure. 7). From the S-wave profile, the relatively thick V1 low velocity layer (154 m/s) is interpreted to correlate with mapped Holocene beach and barrier island sands ((Qhs) Weems and Lemon, 1993). The S-wave V2 layer velocity (497 m/s) is nearly identical to the V2 velocity determined at The Citadel site. Based on similarity in velocity, stratigraphic position and a geologic cross-section, this layer is correlated with the Cooper Group Ashley Formation. (Figures 1C and 7). Although the V2 layer velocity at this site is relatively high, the influence of the 22 m thick V1 layer lowers the VS30 NEHRP soil profile type classification to “E” (soft soil).
U.S. Hwy 17, site 7 This site is located beneath an elevated bridge span of U.S. Highway 17 on the northeast side of the Ashley River (Figure 1 A). Due to high levels of cultural noise and limited space, which prevented the acquisition of a far offset reverse profile, data quality is fair to poor (Figure 2). Three velocity layers are identified on the P-wave profile (Figure 7). It is believed that the unreasonably high V3 layer velocity of 2894 m/s, faster than any other P-wave velocity (except at the Lake Murray metamorphic rock site) determined at this site, results from an up-dipping interface related to the presence of an ancestral Ashley River channel margin (indicated in
8
geologic cross-section, Weems and Lemon, 1993) which is now buried under the modern artificial fill. In this area, artificial filling operations began as early as 1680 and continued intermittently into the 20th century in an effort to wrest more land from the sea (Mazyck, 1885; Hadj-Hamou and Elton, 1989).
The S-wave column shows two velocity layers (Figure 7). We interpret the approximately 11 m thick V1 layer (125 m/s), the slowest S-wave velocity determined during the study, to correlate with artificial fill. The calculated thickness of the V1 layer matches closely with mapped thickness of artificial fill for this location (Weems and Lemon, 1993). Geologic mapping (Weems and Lemon, 1993) indicates that in this area, which is outside of the modern river channel, the Cooper Group formations are overlain by facies of the Waldo Formation ((Qwc and Qws) Pleistocene, about 70-130 ka). Based upon the location of our survey with respect to a geologic cross-section, we tentatively correlate the V2 layer at this site with the lower clayey sand facies (Qwc) of the Waldo Formation. Calculations using the interpreted V1 layer thickness of 11 m result in a VS30 value of 181 m/s; barely placing this site into a NEHRP soil profile type “D” classification (Tables 2 and 3). However, because a change of less then five percent (5%) in V1 layer thickness (i.e. a change from 11 to 11.5 m) would result in a NEHRP soil profile type “E” classification, we feel that it would be more realistic to initially view the mapped artificial fill sites as type “E” until more extensive site specific geophysical and engineering test data is acquired.
CONCLUSION
The P- and S-wave data acquired during this reconnaissance survey generally sampled increasingly younger geologic strata along a southeast-trending transect crossing the piedmont and Atlantic Coastal plain provinces of southeast South Carolina. Stratigraphic units tested range in age and composition from Paleozoic basement rocks of the Carolina Slate Group (metamorphosed sedimentary and volcanic rocks and intruded granites) to Holocene barrier island sands. Other than the Carolina Slate Group rocks (Lake Murray site), all sampled units sampled are sedimentary deposits.
Seismic refraction/reflection techniques produced S-wave data down to depths ranging from 30 to 80 m and identified in most cases two or three distinct velocity layers. Based upon reflection analysis, no “hidden” lower velocity layers beneath higher velocity layers were detected at these sites. At all sites (except the U.S. Highway 17 site where a substantial thickness of artificial fill is sampled), the upper most V1 layer is interpreted to represent weathered (developed soil horizons) and transitional strength lithologies. Collectively V1 layer thickness ranged from approximately 6.5 to 22 m and showed a velocity range of 125 m/s (artificial fill) to 367 m/s (upper Cretaceous Tuscaloosa Fm.). Excluding the Carolina Slate Group site (Lake Murray spillway), the overall average S-wave V1 layer velocity is 225 m/s. For sites where the V1 layer thickness was greater than 12 m, the V1 layer played a dominant role in determining the NEHRP soil profile type classification regardless of the underlying V2 layer velocity. This was especially evident at the Deep Creek site (Peedee Formation-upper Cretaceous) where a NEHRP classification of “D” was determined even though the interpreted V2 layer velocity was 710 m/s. For all other sites where a single formational unit was sampled (Figure. 6), NEHRP soil type classification was determined to be “C”.
In general, at the four sites where multiple geologic formations were sampled (figure7) to a maximum depth of 80 m, analysis shows an increase of V2 layer velocity with increase in
9

formational age. Three of four sites sampled Cooper Group (Parkers Ferry and Ashley Formations, upper Eocene to middle Oligocene respectively) strata. Calculated NEHRP soil type classifications ranged from a strong “C” (very dense soil/soft rock) at the USNSN site to an “E” (soft soil) classification for the unconsolidated sand (Holocene) at the Isle de Palm. In general this range in classification values can be correlated directly to the stratigraphy at each individual site. The solid “C” classification at the USNSN site probably results from erosion having removed much of the softer overlying Ashley Formation. This results in a relatively thin V1 layer consisting of lower Pleistocene ((Tpc) clayey sand) and remnant Ashley Formation (?) resting upon higher-velocity Parkers Ferry Formation. At the Citadel site, the “D” (stiff soil) classification results from the presence of an 18-m-thick V1 layer composed of unconsolidated to weakly lithified upper Pleistocene sands and clayey sands above the Ashley Formation.
Our results show that the non-invasive seismic-refraction/reflection method is an important tool in earthquake engineering. Information derived from the refraction/reflection data can be used to estimate site-response effects in the frequency range of ground motion that results in near-surface material destabilization and, ultimately, to building and infrastructure damage.
ACKNOWLEDGMENTS We wish to thank Chuck Mueller for his comments and suggestions. The U. S. Nuclear Regulatory Commission (NRC) through a joint NRC/USGS interagency agreement provided funding for this project.
APPENDIX-- Site descriptions of geologic units
Site 1: Murray Dam spillway Carolina Slate Group (Precambrian to Paleozoic)
Consists of metamorphosed sedimentary and volcanic rocks along with intruded granite masses (Overstreet and Bell, 1965).
Site 2: Fort Jackson military base, Columbia S.C.
Tuscaloosa Formation (middle to Upper Cretaceous) also known in some literature sources as the Middendorf Formation In the near surface this formation is predominantly unconsolidated. The unit was
deposited in a non-marine fluvial environment and consists of lenses and layers of sand to silty sand with interbeds of very pure clay (floodplain) and cross-bedded, channel fill sand (Pooser and Johnson, 1961).
Site 3: Deep Creek School
Peedee Formation (Upper Cretaceous) At this site the formation consists of massive dark green to gray glauconitic sand interbedded with impure limestone. Deposition occurred predominantly in an open marine environment (Cooke, 1936).
Site 4: Black Mingo
Black Mingo Formation (Lower Eocene-Wilcox Group) Partly indurated, fine-grained white to yellow sand and sugary sandstone and bioclastic limestone. Cementation is calcareous to siliceous. Upper units are underlain by gray to
10
black laminated shale. Deposited under non-marine conditions in an estuarine, tidal flat and littorial low energy environment (Cooke, 1936).
Site 5: Santee Limestone.
Santee Limestone (Middle Eocene-Clayborne Group) This unit is composed of alternating hard to soft layers of glauconitic impure to pure limestone and generally described in outcrop as consolidated but only weakly indurated. Hard ribs of limestone were exposed at the surface at the location where the refraction/reflection survey data was obtained. (Colquhoun and Duncan, 1967).
Site 6: The Citadel
Barrier sand facies (Quaternary) over Cooper Group (Ashley Formation, Oligocene ~30 Ma) Upper two meters of site consists of modern fill and soil. These overlie upper barrier sand facies (Qws) and minor amounts of the lower clayey sand facies (Qwc) of Waldo Formation (Pleistocene, about 70-130 ka) Weems and Lemon (1993) which in turn unconformably overlie the Ashley Formation (upper unit of the Cooper Group). The Ashley Formation in this area is described as a fine-grained, massive, phosphatic calcarenite (Hadj-Hamou, 1989; Weems and Lemon, 1993).
The Cooper Group generally consists of soft impermeable limestone (locally called the Cooper Marl). The term “marl” refers to unconsolidated sands, shells, silts, and clays that are typically weakly consolidated with calcium carbonate. Units may be loose to dense in consistency. Within the study area the Cooper Group is represented by the Ashley and Parkers Ferry Formations and is known to underlie Holocene, Quaternary, and modern manmade fill within the Charleston S.C. area and large regions of the coastal plain in general (Cooke, 1936; Hadj-Hamou and Elton, 1989; Weems and Lemon, 1993).
Site 7: Highway US 17 overpass next to Ashley River Memorial Bridge
Modern fill over estuarine/lagoon facies, Waldo Formation ? (70-130 ka) Modern fill consists of dredged sand and clayey sand. Back barrier estuarine/lagoon-marsh deposits consisting of soft, organic rich clayey sand and clay (Weems and Lemon, 1993).
Site 8: Isle of Palms
Beach and barrier-island sand facies (Holocene <1 to 10 ka) over Cooper Group (Ashley Formation)
Loose, medium to dense fine-grained, well sorted quartz sand. Includes lenses and beds of clean to “muddy”, fine-to medium-grained sand and medium to coarse shelly sand (shelf facies) in lower parts of some sections (McCartan et al, 1982; Weems and Lemon, 1993). For a description of barrier sand facies and the Ashley Formation see site 6 (Weems and Lemon, 1993).
Site 9: USNSN Quaternary (Pleistocene 250 ka to1 Ma) over Cooper Group (thin Ashley (?) and Parkers Ferry Formations, upper Eocene to Oligocene)
This site lies within Pleistocene beach and barrier-island deposits that consist of fine to medium-grained, well-sorted, phosphatic quartz sand (Weems and Lemon, 1993). The
11

Parkers Ferry Formation is a calcilutite to very fine-grained calcarenite that is very dense. For a detailed description of Cooper Group formations the reader is referred to Weems et al., 1997, and Weems and Lewis, 2002). Overburden map of Force (1978) and personal communication (Weems, 2002) indicated approximately 10 m of Quaternary strata over very thin Ashley over Parkers Ferry Formations at this site.
REFERENCE CITED AAPG, 1989, Geological Highway Map Mid-Atlantic Region: published by the American
Association of Petroleum Geologist
Bonini, W.E. and Woollard, G.P., 1960, Subsurface geology of North and South Carolina coastal plain from seismic data: American Association of Petroleum Geologists Bulletin, v. 44, no. 3, p. 298-315.
Borcherdt, R.D., Gibbs, J.F., and Fumal, T.E., 1979, Progress on ground motion predictions for
the San Francisco Bay region, California: in Progress on Seismic Zonation in the San Francisco Bay Region, E. E. Brabb (Editor), U.S. Geological. Survey Circular 807, p. 13-25.
Building Seismic Safety Council, 1997, NEHRP recommended provisions for seismic
regulations for new buildings: Part 1-Provisions (FEMA Federal Emergency Management Agency 302), 290 pp.
Campbell, K. W., and Duke, C. M., 1976, Correlations among seismic velocity, depth and geology in the Los Angeles area: School of Engineering and Applied Science, UCLS, UCLA-ENG-7662
Colquhoun, D.J. and Duncan, D.A., 1967, Geology of the Eutawville quadrangle, South
Carolina: MS-12, scale 1:62,500, Division of Geology, South Carolina State Development Board
Cooke, C.W., 1936, Geology of the coastal plain of South Carolina: U.S. Geological Survey
Bulletin 867, p. 196. Dutton, C.E., 1889, The Charleston earthquake of August 31, 1886, in Ninth Annual Report of
the Director, 1887-1888: U.S. Geological Survey, Denver, CO, p. 203-528. Force, L., M., 1978, Geological studies of the Charleston, South Carolina, area-thickness of
overburden map: U.S. Geological Survey Miscellaneous Field Studies Map MF-1021 B, Scale 1:250,000.
12

Hadj-Hamou, Tarik and Elton, D.J., 1989, A liquefaction susceptibility map for peninsular Charleston, South Carolina: Association of Engineering Geology Bulletin, v. 26, no. 3, p. 309-333.
Harris, J., Street, R., Kiefer, D., Allen, D., and Wang, Z., 1994, Modeling site response in the Paducah, Kentucky, area: Earthquake Spectra, v. 10, p.519-538.
Joyner, W.B., Warrick, R.E., and Fumal, T.E., 1981, The effect of Quaternary alluvium on
strong ground motion in the Coyote Lake, California earthquake of 1979: Seismological Society of America Bulletin, v.71, p. 1333-1349.
Mazyck, A., 1885, Charleston in 1885: Walker, Evans, and Cogswell, Charleston, S. C., 95 pp. McCartan, Lucy, Lemon, E.M. Jr., Weems, R.E., 1982, Generalized geologic map of the
Charleston, South Carolina, area: U.S. Geological Survey Open-File Report 82-187, scale 1:575,000.
Mooney, H. M., 1984, Handbook of Geophysical Exploration, Volume 1, Seismic, Bison
Instruments, Inc. Mueller, Charles, 2000, Site response in the Atlantic and Gulf of Mexico Coastal Plains and
Mississippi Embayment: Proceedings of the Sixth International Conference on Seismic Zonation, November 12-15, 2000, Palm Springs, CA, Earthquake Engineering Research Institute CD-Rom
Overstreet, W.C. and Bell, Henry III, 1965, The crystalline rocks of South Carolina: U.S.
Geological Survey Bulletin 1183, p.126. Paradesse, W., McCauley, J.F., and Colquhoun, D.J., 1953, The geology of the Blythwood
quadrangle, South Carolina: Division of Geology, State Development Board, South Carolina, Map MS-13, Scale1:24,000.
Pooser, W.K. and Johnson, H.S., 1961, Geology of the Fort Jackson north quadrangle, South
Carolina: Division of Geology, South Carolina. State Development Board, Map MS-3, Scale 1:24,000.
Seed, H.B., Romo, M.P., Sun, J.I., Jaime, A., Lysmer, J., 1988, The Mexico earthquake of
September 19, 1985—relationships between soil conditions and earthquake ground motions: Earthquake Spectra, v. 4, p. 687-729.
Weems,, R.E., and Lemon, E. M. Jr., 1993, Geology of the Cainhoy, Charleston, Fort Moultrie,
and North Charleston Quadrangles, Charleston and Berkeley Counties: South Carolina: U.S. Geological Survey Map I-1935, Scale 1:24,000
13

Weems, R.E., Lemon, E.M, and Nelson, M.S., 1997, Geology of the Pringletown, Ridgeville, Summervill. and Summerville Northwest 7.5-minute quadrangles, Berkeley, Charleston, and
Dorchester Counties, South Carolina: U. S. Geological Survey Miscellaneous Investigations Series Map-I 2502, Scale 1:24,000.
Weems, R.E. and Lewis, C.W., 2002, Structural and tectonic setting of the Charleston, South Carolina, region, evidence from the Tertiary stratigraphic record: Geological Society of
America Bulletin, v 114, no. 1, p. 24-42. Wheeler, R.L. and Cramer, C.H., 2000, Preliminary estimate of the amplification of possible
earthquake ground motion at a site in Charleston County, South Carolina: U.S. Geological Survey Open-File Report 00-0484, 32 p.
Williams, R. A., Cranswick, E., King, K. W., Carver, D. L., and Worley, D.M., 1994, Site-
response models from high-resolution seismic reflection and refraction data recorded in Santa Cruz, California: in The Loma Prieta, California, Earthquake of October 17, 1989-Strong Ground Motion, R. G. Borcherdt, (Editor), U.S. Geological Survey Professional Paper 1551-A, A217-242.
Williams, R.A., Stephenson, W.J. and Odum, J.K., 1998, Surface-seismic imaging for NEHRP soil
profile classifications and earthquake hazards in urban areas: Geotechnical Special Publication No. 75: Geotechnical Earthquake Engineering and Soil Dynamics III, v. 1, Dakoulas, P., Yegian, M., and Holz, R. D., (Editors), American Society of Civil Engineers, Proceedings of a
Specialty Conference, Seattle, WA. p. 166-177. Williams, R.A., Stephenson, W.J, Frankel, A.D. and Odum, J.K., 1999, Surface seismic measurements of near-surface P-and S-wave seismic velocities at earthquake recording stations, Seattle, Washington: Earthquake Spectra, v. 15, no. 3, p. 565-584. Woolery, E., Street, R., Wang, Z., and J. Harris, 2000, NEHRP soil classifications and 1-D site
effects in the upper Mississippi Embayment, Seismological Research Letters, v. 71, no. 1, p. 114.
14