neacrp lmfbr benchmark calculation intercomparison for ... · neacrp lmfbr benchmark calculation...
TRANSCRIPT

NEACRP LMFBR BENCHMARK CALCULATION
INTERCOMPARISON FOR FUEL BURN-UP
* ENEAJCASACCIA S.P. Anguillarese Km 1+300
00060 - CASACCIA (Roma) I T A L I E
** C.E.A. - DRNRISPCIlLEPh Centre dlEtudes Nucldaires de CADARACHE
B d t e Postale NO1 13115 - SAINT-PAUL-LEZ-DURANCE
F R A N C E
Cadarache, October 1984
92010001

"NEACRP LMFBR Benchmark Calculation
Intercomparison for fuel Burn-up"
ABSTRACT :
The present document summarizes the results and the
discussion relating to the burn-up benchmark exercise proposed
by NEACRP for a large LMFBR.
Nine different organisations participated and eleven
solutions were submitted.
The main results and their implications were discussed
at a meeting hold in Cadarache, April 28-30, 1982.
RESUME :
Ce document r6sume les r6sultats et les discussions
relatives A un Benchmark de calcul pour 1'6volution d'un
r6acteur rapide de grande taille.
Neuf organisations diff6rentes y ont particip6, et
1 1 solutions ont 6t6 soumises.
L'ensemble des principaux r6sultats et leurs implications
ont 6t6 discut6es 2 la r6union qui s'est tenue A Cadarache du 28 au 30.04.1982.

TABLE OF CONTENT
GENERAL COMMENTS......................................... 1
PART I : NUMERICAL RESULTS............................. 3
Tables 1-13 : Requested results . . . . . . . . . . . . . . 4
Tab les 14-44 : S e n s i t i v i t y c o e f f i c i e n t s
f o r r e a c t i v i t y loss. . . . . . . . . . . . 25
Tables 45-50 : S e n s i t i v i t y c o e f f i c i e n t s
f o r i s o t o p e build-up ........... 58
0 PART I1 : ANALYSIS OF THE DATA.......................... 66
- PART I11 : BEGINNING OF CYCLE PARAMETERS :
a) Comparison of p r e s e n t c a l c u l a t i o n s and
those r e p o r t e d i n t h e O r i g i n a l Benchmark
Study... ..............................a*.. 87
b ) I-group c r o s s - s e c t i o n s by zone............ 92
APPENDIX I : Proposa l f o r burn-up c a l c u l a t i o n s
a p p l i e d t o t h e NEACRP F a s t Breeder
Benchmark................................. 9 5
- ................ APPENDIX 11 : S o l u t i o n s and p a r t i c i p a n t s 105
.w

GENERAL COMMENTS
- The reactivity loss per cycle and its components. - The internal and external breeding gains. - The Pu balance for the different zones. - The sodium void effect variation. - The irradiated fuel composition after a given in-pile
residence time.
The aim of the exercLse wa3 tto ppovide a comparSson of the multigroup data used by various l;ahora,torfes and concernjng isotopes specifically involyed. in fuel burn-up problems, fission products (FP) and actinides.
The present comparison concerns calculations of integral
parameters according to an approach similar to the one previously
used for the "fresh core" study and which is summarized in the
Proceedings of the NEACRP/IAEA Specialist Meeting on the Inter-
national Comparison Calculation of a Large Sodium Cooled Fast
Breeder Reactor, Feb. 1978 (ANL-80-78, NEACRP-L-243). The quan-
tities of interest were, in the present case :
The results obtained and some supplementary sensitivity
studies, performed to improve the understanding of the main
tendencies, are given as Part I of the present document. In
Part 11, a summary is given of the analysis of these results,
which includes also the informations exchanged after the meeting
and which were requested in particular to clarify some main
points raised during the discussions. Finally Part 111 is
devoted to an up-date of the beginning-of-cycle(EOC) data. A.T,D
Butland provided a comparison of present calculations of BOC
parameters and those reported in the original benchmark study.
The basic data sets used are summarized in Appendix 11.
The main conclusions of the meeting were related to the
present state of lumped fission product cross-sections used for
LMFBR studies. There is evidence that the spread on these cross-

sections j.5 $till fqirly high,, due to the fact that the different
laboratories use different strategies to define this type of
cross-sections. IP particular, the role of the fission product
migration is still to be clarified and, from another side, global fission product cross-section adjustments, based on irradiated
fuel experiments, indicated significat bias on the calculated
lumped fission product cross-sections. Finally, part of the J
spread observed can also be traced back to spectral effects, to ?.
which fission product cross-sections are fairly sensitive.
As far as the reactivity loss due to the heavy isotope
density variations, it seems that the present data accuracies
(often inside the target specified bv the various laboratories)
are such that a not negligible uncertainty sLould be associated
to this data, of the order of + 0,s % A K / K or more. - *
Finally, for what concerns the higher actinide data and
the impact of their uiicertainties, it seems that no definite
suggestion can be n z ~ e m the need for higher accuracy. The problem of Np-237 (n, 2n) cross-section, leading t~ the lcroduction
of Pu-236, is more related to the reaction branching ratio, which
is presently being assessed by different laboratories. However,
comparison with experimental data (from irradiated fuel expe-
riments in particular) should confirm that the type of spread
observed in the benchmark, is also representative of the observed
calculation/experiment discrepancies. -
PART I
NUMERICAL RESULTS
The following tables summarize the results obtained.
Solution labels are defined in Appendix 11.
Tables 1-13 present the main requested results. For what
concerns their definition, see benchmark specifications in
Appendix I.
Tables 14-44 give some simplified sensitivity values related
to the reactivity loss, using one group data and 1D diffusion
perturbation calculations.
Tables 45-50 give the sensitivity coefficients for some
isotope build-up, to the data of the other isotopes.
For these last two series of tables, comments on their
use are given at the beginning of each series.

TABLES 1 - 13 u REQUESTED RESULTS

REACTOR TOTAL INNER CORE OUTER CORE
- - - - - - - - - EOC-BOC - - - - - - -
BOC . - - - - - - - -
-0,04581
-0.04557
-0.0392 1
-0.03983
-0.03413
-0.03042
-0.03255
-0.02186
-0.02562
-0.02709
-0,03355
- - - - - - - -.
-0,03415
0.:00784
. - - - - - - - -. EOC-BOC - - - - - - -
BOC . - - - - - - - - . -0.02403
-0,01933
-0.02546
-0.01547
-0.00544
-0.01211
-0.02019
-0.01144 I
- - - - - - - - EOC-BOC - - - - - - -
80C - - - - - - - -
-0.12080
-0.12464
-0. 12500
-0.12867
-0.12032
-0.09868
-0.09035
-0.07763
-0.07892
-0.08083
-0.09474
- - - - - - - - .
-0.10369
0.02046
. - - - - - - -.
ORGANIZ - - - - - - - - .
EOC
- - - - - - - - . 0.68447
0.69453
0.68900
0.69283
0.67600
0.67031
0.68861
0.67647
0.67500
0.67006
0.67300
- - - - - - - - - 0.68093
0.00917
- - - - - - - - -
- - - - - - - -
EOC
- - - - - - - -
0.25197
0.25402
0.23800
0.25361
.0.25150
0.25119
0.25612
0.25449
0.25526
0.25110
0.25800
- - - - - - - -.
0.28230
0.00524
. - - - - - - - -
ANL
AUSTRAL
CEA-2
ENEA
EIR-1
JAERI
KFK- 1
KFK-2
KFK-3
UKAEA
USSR
TABLE 1 ; BREEDING RATIO

AXIAL BLANKET
ORGANIZ
BOC EOC
- - -. - - - - .
0 . 1 5 9 0 1
0 . 1 5 6 3 2
0 . 1 6 0 0 0
0 15873
0 . 1 5 0 9 0
0 . 1 6 1 $ 4
0 . 1 6 2 6 2
0. 16126
0 16537
0 . 1 6 3 5 4
O.161OO
0 . 1 5 9 9 9
0 . 0 0 3 8 9
EOC-BOC BOC
- - - -. . . -,
0 . 2 3 6 6 9
0 . 2 3 1 8 3
0 . 2 4 1 0 0
0 . 2 3 5 2 7
0 . 2 1 7 4 0
0 .23113
0 . 2 2 9 7 8
0 .22297
0 . 2 2 7 1 9
0 . 2 3 3 6 0
0 . 2 2 8 0 0
EOC EOC-BOC
BOC BOC
ANL
AUSTRAL
CEA-2
ENEA
E I R - 1
J A E R I
KFK- 1
KFK-2
KFK-3
UKAEA
USSR
- - - - . . .
MEAN
S T . OEV
TABLE 1 ( c o n t i n u e d )

ORGANIZ
- - - - - - - - -
ANL
AUSTRAL.
CEA-2
ENEA
EIR-1
JAERI
KFK- 1
KFK-2
KFK-3
UKAEA
USSR
- - - - - - - - -
MEAN
ST. OEV.
, - - - - - - - - -.
INTERNAL
EOC
. - - - - - - - -
-0.02990
-0.02618
-0.08710
-0,02571
-0.04620
-0.05010
-0.02906
-0.04536
-0.04330
-0.05323
-0.03410
- - - - - - - - .
-0.04275
0.01773
- - - - - - - . IOC-ROC . - - - - - -
BOC . - - - - - -.
).21522
). 10709
) ,25300
). 20279
).27586
) . 29635
).28740
).35959
1.34632
).32226
1.29253
- - - - - - -
I. 26895
b.07243
BLANKET
. - - - - - - - - .
EOC
. - - - - - - - - .
0.37300
0.36803
0.38160
0.37320
0.35240
0.37170
0.36496
0.36457
0.36722
0.37431
0.37080
- - - - - - - - -
0.36925
0.00740
- - - - - - - - -
TABLE 2 : BREEDING GAIN
BOC
0.378C
0.3845
0.3064
0.3856
0.3285
0.3386
0.3632
0.3259
0.3355
0.3318
0.3598
- - - - - - -
0.3488
0.0266
EOC
0.3431C
0.3418:
0.2945C
0.3475C
0.3062C
0.3216C
0.33589
0 .31921
0.32393
0.32109
0.33680
- - - - - - - -
0.32652
0.01642
C49/F49
...---..-.
BOC EOC
0 . 3 0 0 6 1 0 . 2 9 4 1 9
0 . 3 0 5 6 2 0 . 3 0 0 4 5
0 . 3 1 4 5 0 0 . 3 1 0 0 0
0 . 3 0 7 6 1 0 .29945
0 . 3 0 7 9 3 0 . 3 0 2 1 9
0 . 3 2 2 8 2 0 . 3 1 7 2 3
0 . 2 9 9 5 8 0 . 2 9 2 1 6
0 . 2 9 3 2 4 0 . 2 8 7 8 6
0.0 0.0
0 . 3 0 0 1 3 0 . 2 9 7 1 2
0 . 3 0 1 9 0 0 . 2 9 6 3 0
--..-----.
0 . 3 0 5 3 9 0 . 2 9 9 6 9
0 . 0 0 8 4 6 0 . 0 0 8 6 2
ORGANIZ . - -. . - - -.
BOC
.-.---...
EOC
..--.-...
0 . 1 6 3 4 9
0 . 1 6 6 6 8
0 . 1 6 2 0 0
0 . 1 6 5 9 4
0 . 1 6 1 5 0
0 . 1 6 1 2 1
0 . 1 6 3 1 8
0. 16366
0.0
0 , 1 5 9 3 7
0 1 6 1 4 0
.----..--
0 . 1 6 2 8 4
0 . 0 0 2 2 4
.---.-...
EOC-BOC - - - - - - -
BOC
----..----
EOC-BOC - . . . - - - BOC
--....----
- 0 , 0 0 5 9 6
- 0 , 0 0 4 7 8
0 . 0 0 0 6 2
- 0 , 0 0 8 4 8
- 0 , 0 0 5 4 8
- 0 , 0 0 4 4 5
0 . 0 0 3 8 8
0 . 0 0 4 4 2
0.0
-0.00400
- 0 . 0 0 1 8 6
-.....---.
- 0 0 0 2 3 1
0 : 0 0 4 3 0
I --,...---. 1
EOC-BOC -. . - - -.
BOC
ANL
AUSTRAL
CEA-2
ENEA
E I R - 1
JAERI
KFK- 1
KFK-2
KFK-3
UKAEA
USSR
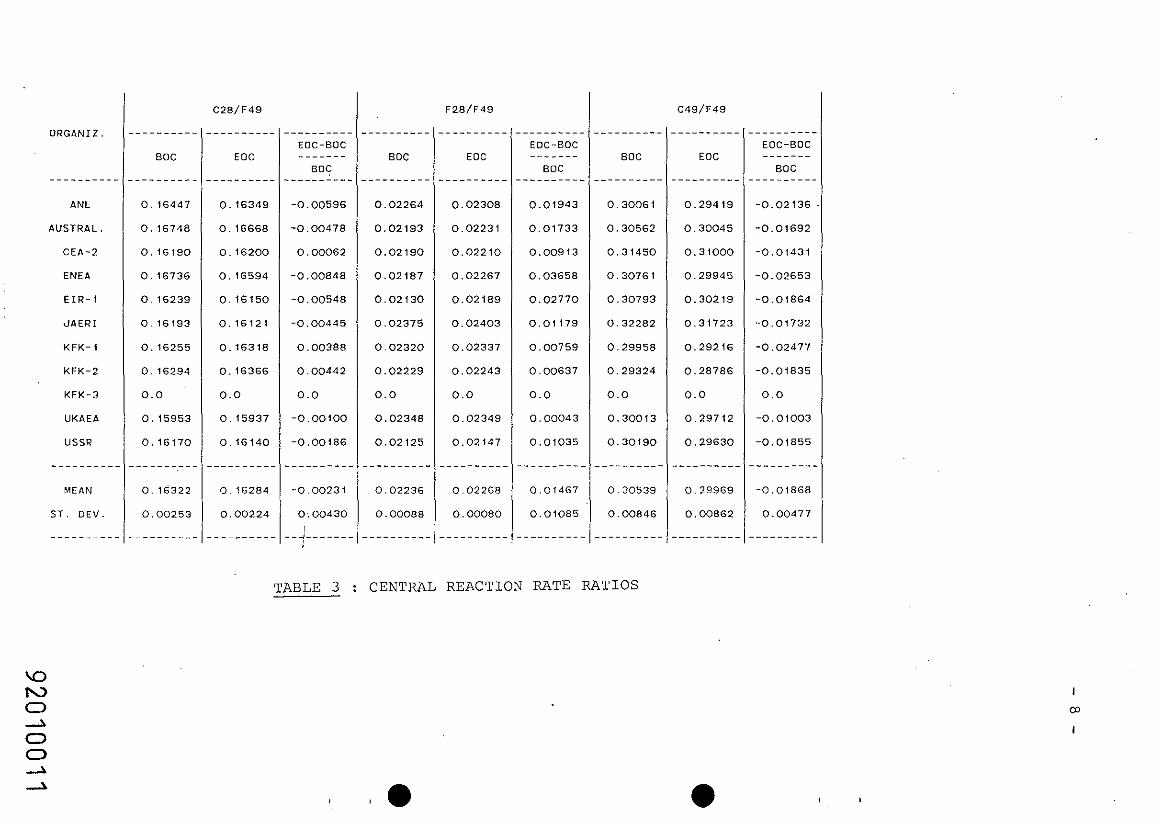
TABLE 3 : CENTRAL REACTION RATE RATIOS

O R G A N I Z
ANL
AUSTRAL.
CEA-2
ENEA
E I R - 1
J A E R I
KFK- 1
KFK-2
KFK-3
UKAEA
USSR
----------
MEAN
S T . OEV.
----------
SODIUM V O I D
EOC

O R G A N I Z .
ANL
A U S T R A L .
C E A - 2
E N E A
E I R - 1
J A E R I
K F K - 1
K F K - 2
K F K - 3
UKAEP
U S S R
MEAN
S T . O E V .
GKEFF ( 1 ) : g l o b a l r e a c t i v i t y l o s s p e r . c y c l e GKEFF (2 ) : r e a c t i v i t y g a i n due t o Pu build-up i n t h e b l a n k e t s GKEFF (3 ) : r e a c t i v i t y l o s s due t o FP bui ld-up GKEFF ( 4 ) : r e a c t i v i t y v a r i a t i o n due t o t h e c o r e heavy i s o t b p e
burn-up
* A l l Np-239 decays t o Pu-239 (Data o b t a i n e d wi th no Np-239 decaying t o Pu-239, a r e a l s o a v a i l a b l e )

3
. ORGANIZ. - - - - - - - - - - C ANL
AUSTRAL.
CEA-2
ENEA
EIR-1
JAERI
KFK- 1
KFK-2
KFK-3
UKAEA
USSR
MEAN
ST. DEV
. - - - - - - - -
RU- 1.01
. - - - - - - - -
0.74899
0.57165
0.67600
0 .82270
0 .57280
0 .76060
0.73740
0.73398
0 . 0
0.0
0.78300
RH- 103
. - - - - - - - -
0.72620
0.76572
0.67600
0.68680
0.76270
0.72290
0.70999
0 .66391
0.0
0.0
0.70700
- - - - - - - - . 0.71347
0.0354 1
- - - - - - - -.
. - - - - - - - - .
SM- 149
- - - - - - - - .
2.50820
1 ,67200
2.25000
2.87470
1.63410
2.35150
2.44010
2.349 10
0.0
0.0
3.37000
- - - - - - - - -
2.38330
0.53864
- - - - - - - - -
TABLE 6 : FISSION-PRODUCT ONE GROUP CROSS-SECTION
* KFK-1 : In this table correspond to KARLSRUHE-4
** KFK-2 : In this table correspond to KARLSRUHE-5

O R G A N I Z
-..--...-.
A N L
AUSTRAL
C E A - 2
E N E A
E I R - 1
J A E R I
K F K - 1
K F K - 2
K F K - 3
UKAEA
U S S R
---..-----
MEAN
ST DEV
-....-----
TABLE 6 : (Con t inued)

ORGANIZ.
ANL
AUSTRAL.
CEA-2
ENEA
EIR-1
JAERI
KFK- 1
KFK-2
KFK-3
UKAEA
USSR
NO- 143
0 .35102
0 .33300
0 .23900
0 .35520
0 .35040
0 .32970
0 .33290
0 .33710
0 . 0
0 . 0
0 .32200
. - - - - - - - - .
MO- 100
. - - - - - - - - .
0.09188
0 .09100
0 .09680
0 .09617
0 .08960
' 0 .09470
0 .08950
0 .10670
0.0
0.0
0 .07500
- - - - - - - - -
0.09237
0 .00840
TABLE 6 : (Continued)
F.P. : Pseudo F i s s i o n Product one group c ros s - sec t ion - ( a ) Based on t h e main 2 3 f i s s i o n produc t i s o t o p e s , which
r e p r e s e n t s 22 mass c h a i n s by us ing cumulat ive y i e l d s

O R G A N I Z .
ANL
AUSTRAL
CE A - 2
ENEA
E I R - 1
J A E R I
KFK- 1
K F K - 2
K F K - 3
UKAEA
USSR
MEAN
S T . O E V .
TABLE 7 CORE CENTER AVERAGE ONE GROUP FISSION CROSS-SECTION OF
MAJOR ACTINIDES

.A:
O R G A N I Z .
. - - - - - - -. . .
A N L
A U S T R A L .
C E A - 2
E N E A
E I R - 1
J A E R I
K F K - 1
K F K - 2
K F K - 3
UKAEA
U S S R
M E A N I
TABLE 7 : (Continued)

O R G A N I Z
. ANL
AUSTRAL
C E A - 2
ENEA
E I R - 1
J A E R I
K F K - 1
K F K - 2
K F K - 3
UKAEA
U S S R
..........
M E A N
S T O E V .
TABLE 8 : CORE CENTER AVERAGE ONE GROUP CAPTURE CROSS-SECTION
OF MAJOR ACTINIDES

ORGANIZ .
ANL
AUSTRAL.
CEA-2
ENEA
E I R - 1
J A E R I
KFK- 1
K F K - 2
K F K - 3
UKAEA
USSR
----------
MEAN
S T . D E V .
TABLE 8 : (Continued)
O R G A N I Z .
..........
A N L
A U S T R A L .
CE A-2
ENEA
E I R - 1
J A E R I
K F K - 1
K F K - 2
K F K - 3
UKAEA
U S S R
MEAN
S T . O E V
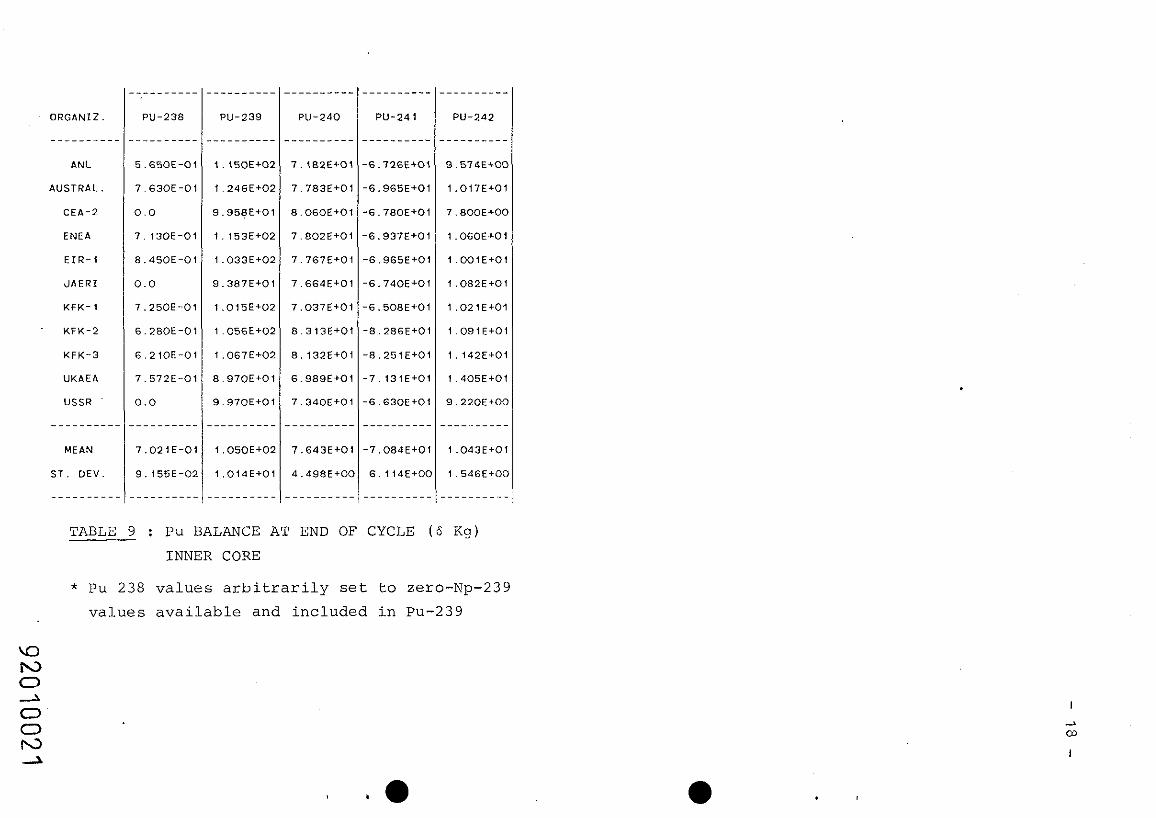
TABLE 9 : Pu BALANCE AT END OF CYCLE ( 6 Kg)
INNER CORE
* Pu 238 v a l u e s a r b i t r a r i l y set t o zero-Np-239
v a l u e s a v a i l a b l e and i n c l u d e d i n Pu-239

- ANL
AUSTRAL.
C E A - 2
ENEA
E I R - 1
J A E R I
KFK- 1
K F K - 2
K F K - 3
UKAEA
USSR
----------
MEAN
S T . D E V .
TABLE 1 0 : Pu BALANCE AT END OF CYCLE ( 6 Kg)
OUTER CORE
* see T a b l e 9

O R G A N I Z .
ANL
A U S T R A L .
C E A - 2
ENEA
E I R - 1
J A E R I
K F K - 1
K F K - 2
K F K - 3
UKAEA
USSR
MEAN
S T . D E V .
TABLE 1 1 : Pu BALANCE AT END OF CYCLE ( 6 Kg)
AXIAL BLANKET
* see T a b l e 9

..-. , % '&GANIZ. . .
- - - - - - - - -
- - ANL , .' , -AUSTRAL.
C E A - 2
ENEA
E I R - 1
J A E R I
KFK- 1
K F K - 2
K F K - 3
UKAEA
USSR
- - - - - - - - -
MEAN
S T . D E V .
TABLE 12 : Pu BALANCE AT END OF CYCLE (6 Kg)
RADIAL BLANKET
* see Table 9
O R G A N I Z
.......
ANL
AUSTRAL
C E A - 2
ENEA
E I R - 1
J A E R I
K F K - I
K F K - 2
K F K - 3
UKAEA
U S S R
.......
MEAN
S T . OEV
.......
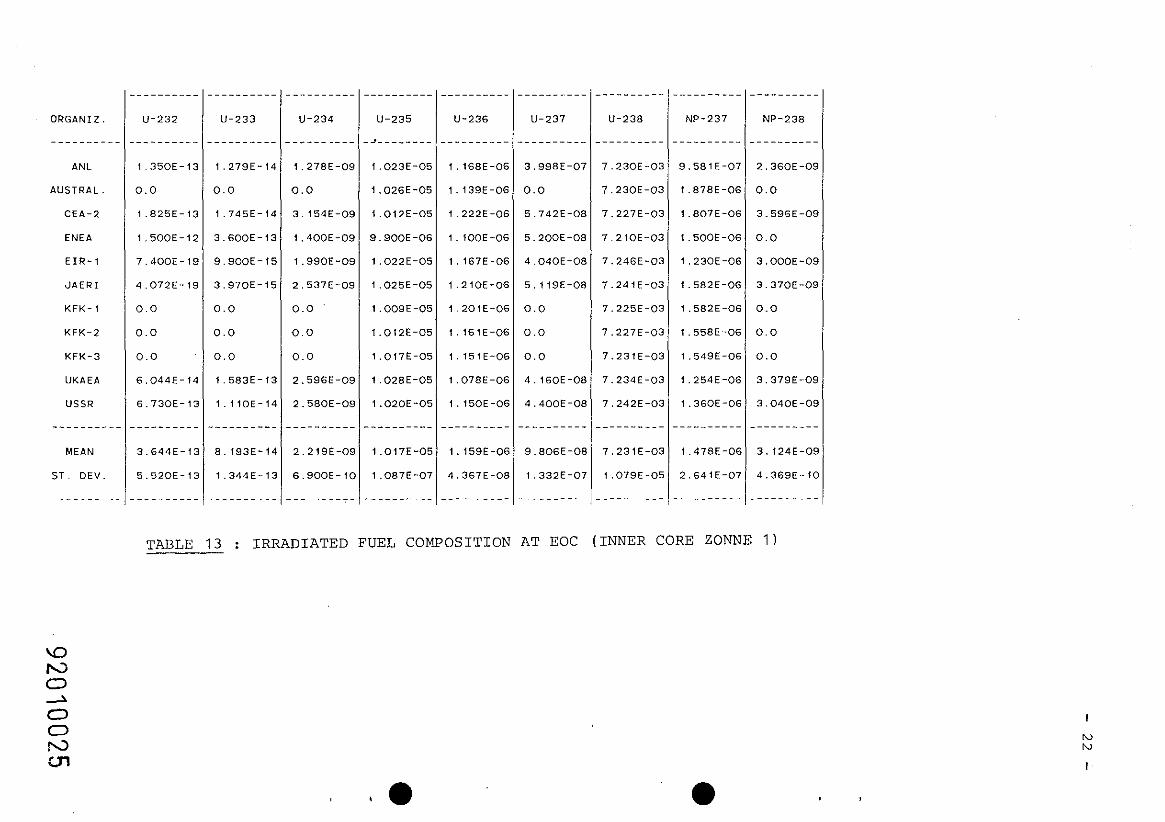
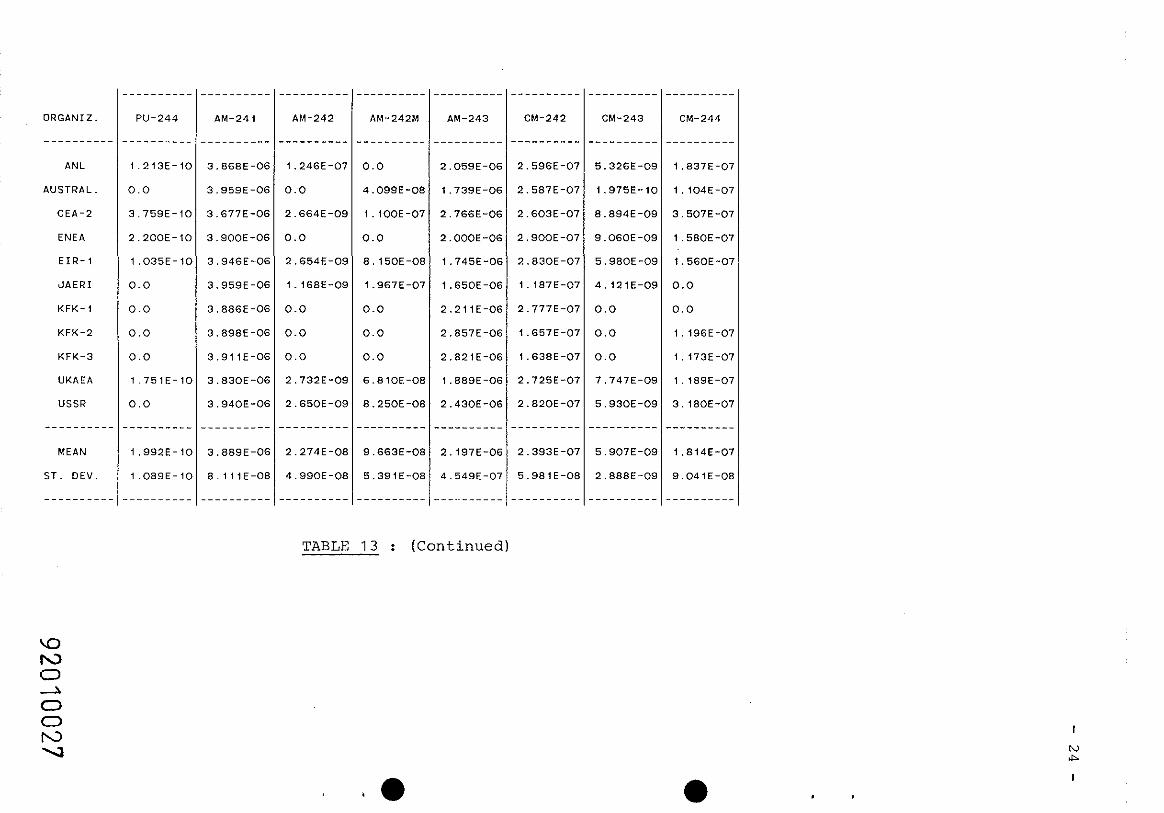
TABLE 13 : IRRADIATED FUEL COMPOSITION AT EOC ( INNER CORE ZONNE 1 )

QRGANIZ.
- - - - - - - - -
ANL
AUSTRAL.
CEA-2
ENEA
E I R - 1
J A E R I
KFK- 1
KFK-2
KFK-3
UKAEA
USSR
MEAN
S T . DEV
TABLE 13 : (Continued)
O R G A N I Z
ANL
A U S T R A L .
C E A - 2
ENEA
E I R - 1
J A E R I
K F K - 1
K F K - 2
K F K - 3
UKAEA
U S S R
MEAN
S T . OEV
TABLE 1 3 : (Continued)

SENSITIVITY COEFFICIENTS FOR REACTIVITY LOSS

In the following tables, some sensitivity calculation
results are summarized, relevant to the reactivity loss
break down.
Reactivity loss was recalculated in 1D first order pertur-
bation using 1 group cross-section o and v u f (constant for a all zones) for Pu239, Pu240, Pu241 and U238 and oc of FP and
the 6N (number of nuclei) obtained from tables 9-10 and 12 2 (Pu isotopes), and FP nuclei successively supplied .
Table 14 is the reactivity summary. These results should
be compared to those of table 5 (KEFF(1) values) having in
mind that :
a) no axial blanket contribution is present,
b) (n, 2n) effects have been negleeted and,
C) FOP calculations are shown instead of direct
calculations.
Tables 15 - 44 presents a reactivity breakdown by isotope and cross-section type with respect to each individual solution.
For each isotope, the following reactivity variation
components are provided :
where index o indicated each partecipant taken as reference
and index i indicates all the other partecipants.
. . ./. . . * 6N of U238 was assumed to be constant (CEA value) for all participant.

m 7
ORGANIZ - - - - - - - -
ANL
AUSTRAL
CEA-2
ENEA
EIR-1
dAERI
KFK- 1
KFK-2
KFK-3
UKAEA
USSR
- - - - - - - - .
FIS PROD
- - - - - - - - - -0.02383
-0 .02168
-0,01875
-0.02339
-0 .01720
-0 ,021 10
-0.02491
-0.02484
-0.02477
-0.02252
0.0
- - - - - - - - -
-0 .02230
0.00265
. - - - - - - - - .
SUM
. - - - - - - - - .
-0,01684
-0.01338
-0 ,01481
-0.01694
-0.01297
-0 ,01499
-0.01972
-0.02234
-0.02192
-0 .01640
0 . 0
- - - - - - - - -
-0.01703
0 .00331
TABLE 14 : BREAKDOWN BY ISOTOPE CONTRIBUTION OF KEFF (1 )
VALUES (see remark paq 1

- - - - . - - -
ANL
AUSTRAL.
CEA-2
ENEA
EIR-1
JAERI
KFK- 1
KFK-2
KFK-3
UKAEA
USSR
MEAN
S T . D E V .
DELTA N
0.0
0.0
0.0
0 .0
0 .0
0.0
0 .0
0 .0
0.0
0.0
0 .0
U-238 DATA EFFECTS
TOT. EFF .
-. . - - - - - -
0.0
0.00042
-0.00066
0.00032
0.00018
-0.00039
-0.00019
-0.00010
-0.00005
-0.00066
0.0
PU-239 DATA EFFECTS
DELTA N
-. - -. . -. -
0.0
0.00166
-0.00242
0.00010
-0.00201
-0.00362
-0.00218
-0.00146
-0.00116
0.00107
0.0
TABLE 15 : A p WITH RESPECT TO ANL SOLUTION

ORGANIZ.
- - - - - - - - -
ANL
AUSTRAL.
CEA-2
ENEA
EIR-1
JAERI
KFK- 1
KFK-2
KFK-3
UKAEA
USSR
- - - - - - - - - .
MEAN
ST. DEV.
---------.
U-238 DATA EFFECTS
TABLE 16 : A
- - - - - - - - . TOT. EFF.
- - - - - - - -.
-0.00042
0 .0
-0.00109
-0.00010
-0.00025
-0.0008 1
-0.0006 1
-0.00053
-0.00047
-0.00108
0 .0
- - - - - - - - -
-O.OOO6O
0.00034
PU-239 DATA EFFECTS
DELTA N
. - - - - - - - - .
-0.00165
0.0
-0.00406
-0.00156
-0.00366
-0.00526
-0.00383
-0.003 1 1
-0.0028 1
-0.00058
0.0
- - - - - - - - -
-0.00295
0.00146
. - - - - - -.
DEL.FI5
. - - - - - - -
0. OOOC
0.0
0.001C
0.0002
-0.0002
-0. OOOC
-0.0003
-0.0002
-0.0002
0.0002
0.0
- - - - - - -
0.0000
0.0004
- - - - - - -
WITH RESPECT TO AUSTRALIAN SOLUTION
TOT. EFf
. - - - - - - .
-0.001€
0.0
-0.004:
-0.0017
-0.003:
-0.005i
-0.0035
-0.0028
-0.0025
-0.0006
0.0
- - - - - - -
-0.0029
0.0015
D R G A N I Z .
ANL
AUSTRAL.
C E A - 2
ENEA
E I R - 1
J A E R I
K F K - 1
K F K - 2
K F K - 3
UKAEA
USSR
MEAN
S T . D E V .
. . - - - -. -
DELTA N
EFFECTS
. - - - - - - - -. .
0 E L . F I S S
0.00006
-O.OOOO7
0.0
- 0 . 0 0 0 1 5
- 0 . 0 0 0 2 2
0 . 0 0 0 3 5
0 . 0 0 0 3 0
0 . 0 0 0 1 7
0 . 0 0 0 1 5
0 . 0 0 0 2 2
0.0
0.00009
0 . 0 0 0 2 0
. - - - -. - -. . .
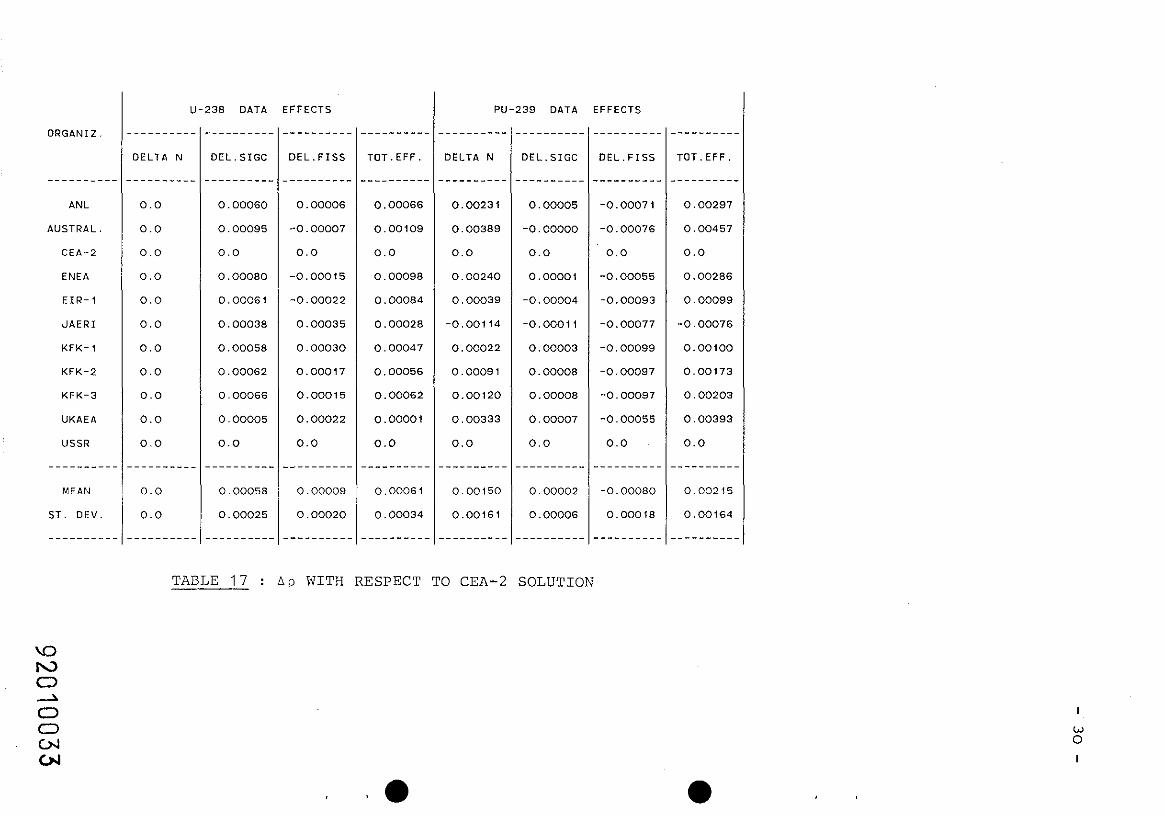
P U - 2 3 9 DATA EFFECTS
TABLE 1 7 : A p WITH RESPECT TO CEA-2 SOLUTION

,-: . , ORGANIZ.
----------
ANL
AUSTRAL.
CEA-2
ENEA
EIR-1
JAERI
KFK- 1
KFK-2
KFK-3
UKAEA
USSR
MEAN
ST. DEV
138 DATA EFFECTS
DEL. S I G C
. - - - - - - - -.
-0.00019
0.00016
-O.OOO8O
0.0
-0.00019
-0.0004 1
-0.00022
-0.00018
-0.00013
-0.00075
0.0
TOT. EFF . - - - - - - - - . -0.00032
0.00010
-0.00098
0.0
-0.00014
-0.00071
-0.0005 1
-0.00042
-0.00037
-0.00098
0.0
-0.00048
0.00036
PU-239 DATA
DELTA N
. - - - - - - - - .
-0.00010
0.00154
-0.00248
0.0
-0.00208
-0.00366
-0.00225
-0,00154
-0.00124
0.00096
0 .0
EFFECTS
- - - - - - -.
DEL.FI$
- - - - - - - -
-0.0001
-0.000:
0.000E
0 .0
-0.0004
-0.0042
-0.0005
-0.0005
-0.0005
-0. OOOC
0.0
- - - - - - - -
-0.0002
0.0003
- - - - - - - -
TOT. EFF.
TABLE 18 : A p WITH RESPECT TO ENEA SOLUTION

U - 2 3 8 DATA EFFECTS P U - 2 3 9 DATA EFFECTS
O R G A N I Z .
T O T . EFF .
ANL
AUSTRAL.
CEA-2
ENEA
E I R - 1
J A E R I
KFK- 1
KFK-2
K F K - 3
UKAEA
USSR
MEAN
S T . D E V .
TABLE 1 9 : A p WITH RESPECT TO E I R - 1 SOLUTION

ORGANIZ.
ANL
AUSTRAL.
CEA-2
ENEA
E I R - 1
JAERI
KFK- 1
KFK-2
KFK-3
UKAEA
USSR
- - - - - - - - - .
MEAN
ST. OEV.
DEI
. ---.
0.
0.
0.
0.
0.
0.
0.
0.
0.
0.
0.
. ----
0.
0.
,
U-238 OATA EFFECTS
OEL. SIGC
. - - - - - - - -,
0 . 0 0 0 2 2
0 . 0 0 0 5 7
- 0 . 0 0 0 3 8
0 . 0 0 0 4 1
0 . 0 0 0 2 2
0.0
0 . 0 0 0 1 9
O.OOO23
0 . 0 0 0 2 8
-0 .00034
0.0
- - - - - - - -.
0 . 0 0 0 1 6
O.OOO32
TOT. EFF . - - - - - - - - .
0 . 0 0 0 3 9
0 . 0 0 0 8 1
-0 .00028
0 . 0 0 0 7 1
0 . 0 0 0 5 6
0.0
0 . 0 0 0 2 0
0 .00028
O.OOO34.
- 0 . 0 0 0 2 7
0.0
- - - - - - - - -
0 . 0 0 0 3 0
0 . 0 0 0 3 8
PU-239 OATA EFFECTS
. - - - - - - - - . DELTA N
. - - - - - - - - .
0 . 0 0 3 5 8
0 .00522
0 . 0 0 1 1 9
0 .00368
0 . 0 0 1 5 9
0.0
0 . 0 0 1 4 2
0 . 0 0 2 1 3
0 . 0 0 2 4 3
0 . 0 0 4 6 4
0.0
- - - - - - - - - 0 .00287
0 . 0 0 1 4 6
- - - - - - - - -
TABLE 2 0 : A p WITH RESPECT TO J A E R I SOLUTION
IDT. EFF .

O R G A N I Z .
ANL
A U S T R A L .
C E A - 2
ENEA
E I R - 1
J A E R I
KFK- 1
K F K - 2
K F K - 3
UKAEA
USSR
U - 2 3 8 OATA E F F E C T S
TABLE 21
P U - 2 3 9 OATA E F F E C T S
DELTA N
. - - - - - - - -
I E L . F I S S
: A p WITH RESPECT TO KFK-1 SOLUTION
I O T . E F F .

ORGANIZ
- - - - - - -
ANL
AUSTRAL
CEA-2
ENEA
E I R - 1
JAERI
KFK- 1
KFK-2
KFK-3
UKAEA
USSR
- - - - - - -.
MEAN
S T . OEV.
- - - - - - - -
OEL. F I S S
- - - - - - - -. - 0 . 0 0 0 1 1
-O.OOOZ4
- 0 . 0 0 0 1 7
-O.OOO32
- 0 . 0 0 0 3 9
0 . 0 0 0 1 8
0 . 0 0 0 1 3
0 .0
- 0 . 0 0 0 0 2
0 . 0 0 0 0 5
0.0
PU-239 DATA EFFECTS
OELTA N
0 . 0 0 1 4 9
0 . 0 0 3 1 8
- 0 . 0 0 0 9 7
0 . 0 0 1 5 9
-0.OOOS6
- 0 . 0 0 2 1 9
- 0 . 0 0 0 7 4
0 . 0
0 . 0 0 0 3 1
0 . 0 0 2 5 8
0 .0
- - - - - - - - -
0 . 0 0 0 5 2
0 . 0 0 1 7 9
VITH RESPECT TO KFK-2 SOLUTION


DRGANIZ
ANL
AUSTRAL.
CEA-2
ENEA
E I R - 1
JAERI
KFK- 1
KFK-2
KFK-3
UKAEA
USSR
----------
MEAN
ST. OEV.
----------
DELTA N
U-238 DATA PU-239 DATA
- - - - - - - - -
DELTA N
- - - - - - - - -
-0 .00107
0 . 0 0 0 5 8
-0 .00346
-0 .00097
- 0 . 0 0 3 0 6
-0 .00466
- 0 , 0 0 3 2 4
-0 .00252
-0 .00222
0.0
0.0
- - - - - - - - - - 0 . 0 0 2 2 9
0 . 0 0 1 5 8
- - - - - - - - -
FFECTS
- - - - - - - - .
DEL.FISS
- - - - - - - - -
-0 .00020
- 0 . 0 0 0 2 7
0 . 0 0 0 7 1
0 .00001
- 0 . 0 0 0 4 8
-0 .00028
-O.OOO56
-0 .00054
- 0 . 0 0 0 5 4
0.0
0.0
- - - - - - - - -
-0 .00024
0 . 0 0 0 4 1
- - - - - - - - -
TABLE 24 : A p WITH RESPECT TO UKAEA SOLUTION

FFECTS P U - 2 4 1 DATA EFFECTS P U - 2 4 0 DATA
- - - - - - - - -
TOT. E F F .
- - - - - -. . .
0.0
0 . 0 0 0 1 5
0 . 0 0 0 1 1
- 0 . 0 0 0 2 4
0 . 0 0 0 1 3
-O.OOOO9
-0. 0 0 0 2 9
0 . 0 0 1 0 2
0.00095
- 0 . 0 0 0 1 1
0.0
DELTA N
- -. . . - - - -
0.0
0 . 0 0 0 0 5
0.00006
0 . 0 0 0 0 5
0 . 0 0 0 0 5
0 . 0 0 0 0 3
-0.0000 1
0.00008
0.00006
- 0 . 0 0 0 0 2
0.0
- - -. . - - - -
0 . 0 0 0 0 4
0 . 0 0 0 0 3
DELTA N TOT. EFF .
ANL
AUSTRAL.
C E A - 2
ENEA
E I R - 1
J A E R I
K F K - 1
K F K - 2
K F K - 3
UKAEA
USSR
MEAN
S T . D E V .
TABLE 2 5 : A p WITH R E S P E C T TO ANL S O L U T I O N

ORGANIZ.
ANL
AUSTRAL.
CEA-2
ENEA
EIR-1
JAERI
KFK- 1
KFK-2
KFK-3
UKAEA
USSR
MEAN
ST. O E V .
- - - - - - - -
PU-240 DATA EFFECTS
- - - - - - - -
TOT. EFF . - - - - - - - - -0.00015
0.0
-O.OOOO4
-0.00039
-0.00002
-0.00023
-0.00043
0.00087
0.00080
-0.00025
0.0
- - - - - - - - .
0.00002
0.00048
- - - - - - - - .
PU-241 DATA EFFECTS
- - - - - - - -.
DELTA N
- - - - - - - - - 0.00067
0.0
0.00062
0.00005
-0.00010
0.00052
0.00135
-0.00360
-0.00352
-0.00047
0.0
- - - - - - - - -
-O.OOO5O
0.00181
- - - - - - - - -
. - - - - - - - - .
DEL .S IGC
- - - - - - - - . -O.OOOO3
0.0
-0.00003
0.00005
0.00002
0.00013
0.00005
0.00054
0.00055
0.00053
0.0
- - - - - - - - -
0.00020
0.00026
- - - - - - - - -
TABLE 26 : A p WITH RESPECT TO AUSTRALIAN SOLUTION
a
. - - - - - - - -
TOT. EFF . . - - - - - - - -
0.00086
0.0
0.00131
0.00034
-0.00023
0.00059
0.00151
-0.00331
-0.00325
-0.0002 1
0.0

P U - 2 4 0 DATA EFFECTS P U - 2 4 1 DATA EFFECTS
O R G A N I Z .
ANL
AUSTRAL.
CEA-2
ENEA
E I R - I
J A E R I
K F K - I
K F K - 2
K F K - 3
UKAEA
USSR
MEAN
S T . DEV
DELTA N
- - - - - - - - .
-O.OOOO7
- 0 . 0 0 0 0 2
0.0
- 0 . 0 0 0 0 2
- 0 . 0 0 0 0 2
-O.OOOO3
-O.OOOO8
0 . 0 0 0 0 2
0.00000
-O.OOOO9
0.0
. . . . - - - -.
-O.OOOO3
0 . 0 0 0 0 4
TABLE 2 7 : i p WITH
----------
DELTA N D E L . S I G C
-----.-..-
0 . 0 0 0 0 5 -0.00000
-0.00060 0 . 0 0 0 0 3
0.0 0.0
- 0 . 0 0 0 5 5 0 . 0 0 0 0 8
- 0 . 0 0 0 6 9 0 . 0 0 0 0 6
- 0 . 0 0 0 0 9 0 . 0 0 0 1 6
0 . 0 0 0 7 1 0 . 0 0 0 0 8
- 0 . 0 0 4 0 7 0 . 0 0 0 5 5
- 0 . 0 0 3 9 9 0 . 0 0 0 5 6
- 0 . 0 0 1 0 5 0 . 0 0 0 5 5
0.0 0.0
-...-.--..
- 0 . 0 0 1 1 4 0 . 0 0 0 2 3
0 . 0 0 1 7 1 0 . 0 0 0 2 5
?ESPECT TO CEA-2 SOLUTION

>-3
ORGANIZ.
- - - - - - - - -
ANL
AUSTRAL.
CEA-2
ENEA
E I R - 1
JAERI
KFK-1
KFK-2
KFK-3
UKAEA
USSR
MEAN
ST . DEV.
----------
P U - 2 4 0 DATA EFFECTS
DELTA N
. - - - - - - - -
- 0 . 0 0 0 0 2
- 0 . 0 0 0 0 0
0 . 0 0 0 0 1
0.0
- 0 . 0 0 0 0 0
- 0 . 0 0 0 0 1
-O.OOOO3
0 . 0 0 0 0 2
0 . 0 0 0 0 1
-O.OOOO3
0.0
TABLE 2 8 :
PU-241 DATA EFFECTS
IELTA N
. - - - - - - - -
0 . 0 0 0 6 1
- 0 . 0 0 0 0 5
0 . 0 0 0 5 6
0.0
. 0 . 0 0 0 1 5
0 . 0 0 0 4 6
0 . 0 0 1 2 8
.O. 0 0 3 6 0
0 . 0 0 3 5 2
O.OOO52
0.0
WITH RESPECT TO ENEA SOLUTION

P U - 2 4 0 DATA EFFECTS P U - 2 4 1 DATA EFFECTS
O R G A N I Z . - - - - - - - -.
DELTA N
. . - -. - - - -
O.OOO77
0 . 0 0 0 1 0
O.OOO72
0 . 0 0 0 1 5
0.0
0 . 0 0 0 6 2
0 . 0 0 1 4 6
- 0 . 0 0 3 5 3
- 0 . 0 0 3 4 4
- 0 . 0 0 0 3 8
0.0
DELTA N
- - - . . - -. .
-O.OOOO5
-0.00000
0 . 0 0 0 0 2
0.00000
0.0
-0.0000 1
-O.OOOO7
0 . 0 0 0 0 4
0 . 0 0 0 0 2
-O.OOOO7
0.0
TOT. E F F .
. - - - - - - - -
- 0 . 0 0 0 1 3
0 . 0 0 0 0 2
- 0 . 0 0 0 0 2
- 0 . 0 0 0 3 7
0.0
- 0 . 0 0 0 2 1
- 0 . 0 0 0 4 1
0 . 0 0 0 8 9
0 . 0 0 0 8 2
-O.OOOZ3
0.0
- - -. . . . . .
ANL
AUSTRAL.
C E A - 2
ENEA
E I R - 1
J A E R I
K F K - 1
K F K - 2
K F K - 3
UKAEA
USSR
MEAN / - 0 . 0 0 0 0 1
S T . OEV.
TABLE 2 9 A p W I T H RESPECT TO E I R - 1 SOLUTION

ORGANIZ.
- - - - - - - - .
ANL
AUSTRAL.
CEA-2
ENEA
E I R - 1
J A E R I
KFK-1
KFK-2
KFK-3
UKAEA
USSR
t
P U - 2 4 0 DATA EFFECTS
DELTA N
-O.OOOO3
0 . 0 0 0 0 1
0 . 0 0 0 0 2
0.00001
0 . 0 0 0 0 1
0.0
-O.OOOO4
0 . 0 0 0 0 4
0 . 0 0 0 0 2
-O.OOOO4
0.0
- - - - - - - - -
0.00000
0 . 0 0 0 0 3
. - - - - - - -
DEL .F IS
. - - - - - - -
-0. OOOC
0. OOOC
0 . 0 0 0 3
0 . 0 0 0 4
0.0000
0.0
0 . 0 0 0 1
-0.0000
-0.0000
0.0000
0.0
- - - - - - -
0 . 0 0 0 1
0 . 0 0 0 1
PU-241 DATA EFFECTS
TABLE 30 : A p WITH RESPECT TO J A E R I SOLUTION


ORGANIZ .
- - - - - - - - - .
ANL
AUSTRAL.
CEA-2
ENEA
E I R - 1
JAERI
KFK- 1
KFK-2
KFK-3
UKAEA
USSR
1
PU-240 DATA EFFECTS
. . . - - - - - -
DELTA N
. -. - . - - - - ,
- 0 . 0 0 0 2 1
- 0 . 0 0 0 1 0
- 0 . 0 0 0 0 5
-O.OOOO9
-0 .00009
- 0 . 0 0 0 1 2
- 0 . 0 0 0 2 5
0.0
-0. 0 0 0 0 5
-0 .00025
0.0
- - - - - - - - -
-0 .00013
0 . 0 0 0 0 8
PU-241 DATA EFFECTS
- - - - - - - -
DELTA N
- - - - - - - -
0 . 0 0 4 2 1
0 . 0 0 3 5 6
0 . 0 0 4 1 7
0 . 0 0 3 6 1
0 . 0 0 3 4 6
0 . 0 0 4 0 7
0 . 0 0 4 8 9
0.0
0 .00008
0 . 0 0 3 0 9
0.0
. - - - - - - - -
0 . 0 0 3 4 6
0 . 0 0 1 3 7
. - - - - - - - -
TABLE 32 : A p WITH RESPECT TO KFK-2 SOLUTION

O R G A N I Z .
ANL
AUSTRAL.
C E A - 2
ENEA
E I R - 1
J A E R I
K F K - 1
K F K - 2
K F K - 3
UKAEA
USSR
- - - - - - . .
MEAN
S T . OEV
P U - 2 4 0 OATA EFFECTS P U - 2 4 1 OATA EFFECTS
- - - - - - - - -
DELTA N
...-..---
- 0 . 0 0 0 1 7
- 0 . 0 0 0 0 5
-0.00000
- 0 . 0 0 0 0 5
- 0 . 0 0 0 0 5
- 0 . 0 0 0 0 8
- 0 . 0 0 0 2 0
0 . 0 0 0 0 4
0.0
- 0 . 0 0 0 2 1
0.0
-----..--
- 0 . 0 0 0 0 8
O.OOOO9
----.-...
DELTA N
- - - -------
0 E L . S I G C
----.---..
-0.00080
- 0 . 0 0 0 6 8
- 0 . 0 0 0 5 8
- 0 . 0 0 0 6 6
-0.00068
-0.00089
- 0 . 0 0 0 9 6
0.00000
0.0
- 0 0 0 0 9 6
0.0
---------.
- 0 . 0 0 0 6 9
0 . 0 0 0 2 9
---------.
TABLE 33 : A p WITH RESPECT TO K F K - 3 SOLUTION
. - - - - - - - -
TOT. E F F .

I
I *
I PU-240 DATA EFFECTS
DRGANIZ. ---------
- - - - - - - - - .
ANL
AUSTRAL.
CEA-2
ENEA
EIR-1
JAERI
KFK-1
KFK-2
KFK-3
UKAEA
USSR
MEAN
ST. DEV
DELTA N
. - - - - - - - -
0.00001
0.00005
0.00006
0.00005
0.00005
0.00004
0.00000
0.00008
0.00007
0.0
0 .0
, - - - - - - - -.
DEL. S I G C
- - - - - - - -.
0.00014
0.00024
0.00033
0.00025
0.00024
0.00005
-0.00000
O.OOO82
0.00082
0 .0
0 .0
- - - - - - - - -
0.00032
0.00030
I PU-241 DATA EFFECTS
TOT.EFF. DELTA N
---------- ----------
0.00011 0.00113
0.00025 0.00047
0.00022 0.00108
-0.00013 0.00052
0.00023 0.00037
0.00002 0.00098
-0.00018 0.00180
0.00112 -0.00309
0.00106 -0.00300
0.0 0 .0
0.0 0.0
--------- ----------
0.00030 0 .00003
0.00047 0.00180
--------- ----------
TABLE 34 : A p WITH RESPECT TO UKAEA SOLUTION

ORGANIZ.
ANL
AUSTRAL.
CEA-2
ENEA
EIR-1
JAERI
KFK- 1
KFK-2
KFK-3
UKAEA
USSR
MEhN
ST. OEV.
FIS. PROD. OATA EFFECTS
DELTA N
- - - - - - - - -
0.0
-O.OOOO4
0.00054
0.00101
0.00023
0.00328
0.00005
0.00017
0.00028
0.00016
0.0
- - . - - - - - -
0.00063
0 0 0 1 0 4
TOT. EFF.
TABLE 35 : A p WITH RESPECT TO ANL SOLUTION

ANL
AUSTRAL.
CEA-2
ENEA
E I R - 1
JAERI
KFK-1
KFK-2
KFK-3
UKAEA
USSR
- - - - - - - - - .
MEAN
ST. DEV.
. - - - - - - - -
DELTA N
. - - - - - - - -
0 . 0 0 0 0 4
0.0
0 . 0 0 0 5 2
0 . 0 0 0 9 5
0 . 0 0 0 2 4
0 . 0 0 3 0 2
0 . 0 0 0 0 8
0 . 0 0 0 1 9
0 . 0 0 0 2 9
0 . 0 0 0 1 8
0 .0
- - - - - - - - ,
0 . 0 0 0 6 1
0 . 0 0 0 9 4
- - - - - - - - .
F I S . PROD. DATA EFFECTS
. - - - - - - - -
DEL. SIGC
. - - - - - - - -
- 0 . 0 0 2 1 9
0.0
0 . 0 0 2 4 7
- 0 . 0 0 2 7 7
0 . 0 0 4 2 9
- 0 . 0 0 2 8 3
- 0 . 0 0 3 3 2
- 0 . 0 0 3 3 7
- 0 . 0 0 3 4 2
- 0 . 0 0 1 0 3
0.0
TABLE 36 : A p WITH RESPECT TO AUSTRALIAN SOLUTION

ORGANIZ.
ANL
AUSTRAL.
CE A-2
ENEA
E I R - 1
JAERI
KFK- 1
KFK-2
KFK-3
UKAEA
USSR
- - - - - - - -.
MEAN
ST. DEV.
F I S . PROD. DATA EFFECTS
TOT. EFF.
..----.-.
DELTA N
---------
- 0 . 0 0 0 4 3
- 0 . 0 0 0 4 6
0 .0
0 . 0 0 0 3 8
- 0 . 0 0 0 2 5
0 . 0 0 2 2 1
- 0 . 0 0 0 3 9
- 0 . 0 0 0 3 0
- 0 . 0 0 0 2 0
- 0 . 0 0 0 3 0
0.0
----..-..
0 . 0 0 0 0 3
0 .OOO86
---------
TABLE 37 : A p WITH RESPECT TO CEA-2 SOLUTION
.---.---.-
DEL.SIGC
----.-----
-0.00454
- 0 , 0 0 2 4 1
0 .0
- 0 . 0 0 5 1 1
0 , 0 0 1 7 7
- 0 . 0 0 5 1 7
- 0 0 0 5 6 5
- 0 . 0 0 5 7 0
- 0 , 0 0 5 7 5
-0 .00341
0.0
---..---..
- 0 . 0 0 4 0 0
0 . 0 0 2 4 4
----------

F I S . PROD. DATA EFFECTS
DRGANIZ.
ANL
AUSTRAL.
CEA-2
ENEA
E I R - 1
JAERI
KFK- 1
KFK-2
KFK-3
UKAEA
USSR
MEAN
ST. DEV
- - - - - - - - -
DELTA N
. - - - - - - - -
- 0 . 0 0 1 0 3
- 0 . 0 0 1 0 7
- 0 . 0 0 0 4 8
0.0
-O.OOO8O
0 . 0 0 2 3 3
- 0 . 0 0 0 9 8
- 0 . 0 0 0 8 6
- 0 . 0 0 0 7 4
- 0 . 0 0 0 8 6
0.0
- - - - - - - - .
- 0 . 0 0 0 5 0
0 . 0 0 1 0 8
- - - - - - - -.
. - - - - - - - -,
OEL. SIGC
. - - - - - - - -.
0 . 0 0 0 5 6
0 . 0 0 2 6 5
0 . 0 0 5 0 1
0 . 0
0 . 0 0 6 7 5
- 0 . 0 0 0 0 5
- 0 . 0 0 0 5 2
- 0 . 0 0 0 5 7
-O.OOO62
0 . 0 0 1 6 7
0.0
TAE - ILE - IH RESPECT TO ENEA SOLUTION
I F I S . PROD. DATA EFFECTS
DELTA N
ANL
AUSTRAL
C E A - 2
ENEA
E I R - 1
J A E R I
K F K - 1
K F K - 2
K F K - 3
UKAEA
USSR
MEAN
S T . DEV
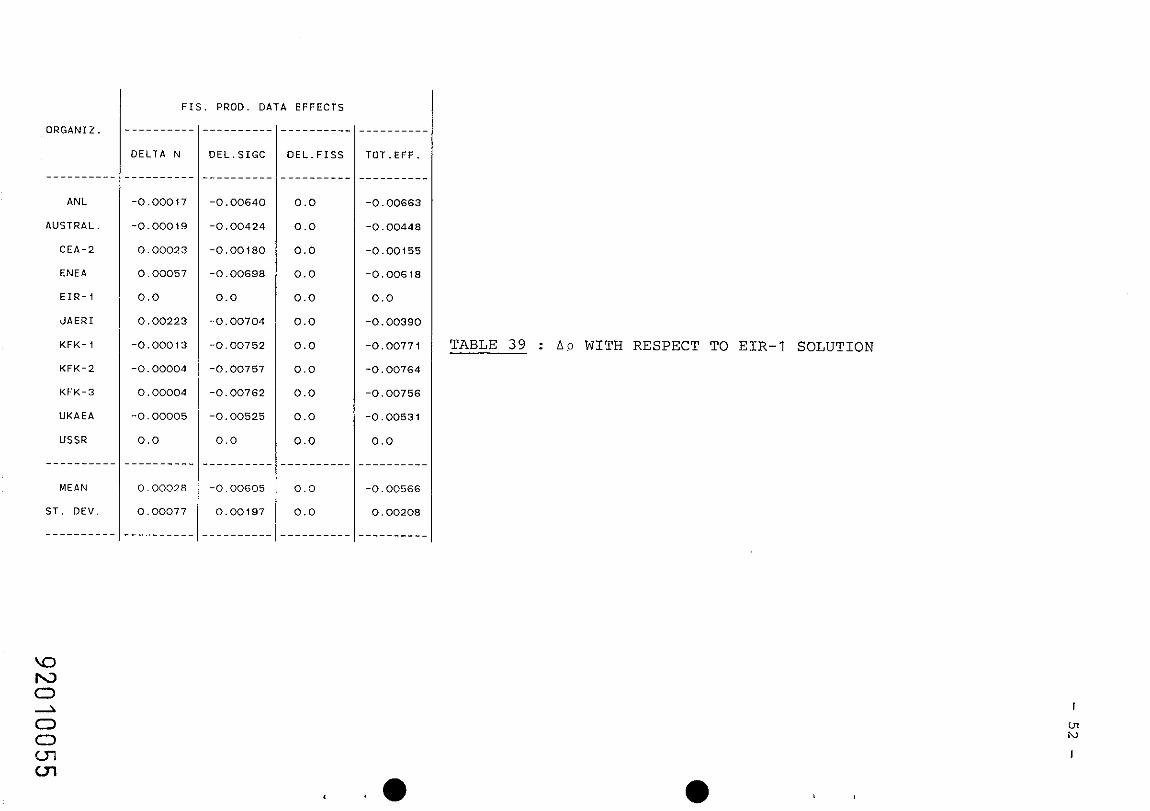
TOT. E F F .
TABLE 39 : A p WITH RESPECT TO EIR-1 SOLUTION

'
F I S . PROD. DATA EFFECTS
----------
ANL
AUSTRAL.
CEA-2
ENEA
E IR-1
JAERI
KFK-1
KFK-2
KFK-3
UKPiEA
USSR
----------
MEAN
ST. DEV.
----------
- - - - - - - - . DELTA N
- - - - - - -. . -0 ,00337
- 0 . 0 0 3 4 1
-0 .00282
- 0 . 0 0 2 3 4
- 0 . 0 0 3 1 4
0.0
- 0 . 0 0 3 3 2
- 0 . 0 0 3 2 0
- 0 . 0 0 3 0 8
-O.OO3ZO
0.0
- - - - - - - - -
- 0 . 0 0 3 1 0
0 . 0 0 0 3 4
- - - - - - - - -
- - - - - - - -.
DEL. F I S S
' a
. - - - - - - - - .
TOT. EFF . - - - - - - - - .
-0 .00273
-O.OOO!i8
0 . 0 0 2 3 5
- 0 . 0 0 2 2 8
0 . 0 0 3 9 0
0.0
-0 .0038 1
-0 .00374
- 0 . 0 0 3 6 6
- 0 . 0 0 1 4 1
0.0
- - - - - - - - -
-0 .00133
0 . 0 0 2 7 8
TABLE 4 0 : A p W I T H RESPECT TO J A E R I SOLUTION

F I S . PROD. DATA EFFECTS
ANL
AUSTRAL
C E A - 2
ENEA
E I R - 1
J A E R I
K F K - 1
K F K - 2
K F K - 3
UKAEA
USSR
MEAN
S T . OEV.
D E L T A N TOT. EFF .
- - - - - - - -.
0 . 0 0 1 0 8
0 . 0 0 3 2 3
0 . 0 0 6 1 6
0 . 0 0 1 5 2
0 . 0 0 7 7 1
0 . 0 0 3 8 1
0.0
0 . 0 0 0 0 7
0 . 0 0 0 1 4
0 . 0 0 2 3 9
0.0
TABLE 41 : A p WITH RESPECT TO KFK-1 SOLUTION
<-
DRGANIZ.
- - - - - - - - .
ANL
AUSTRAL.
CEA-2
ENEA
E I R - 1
JAERI
KFK- 1
KFK-2
KFK-3
UKAEA
USSR
I
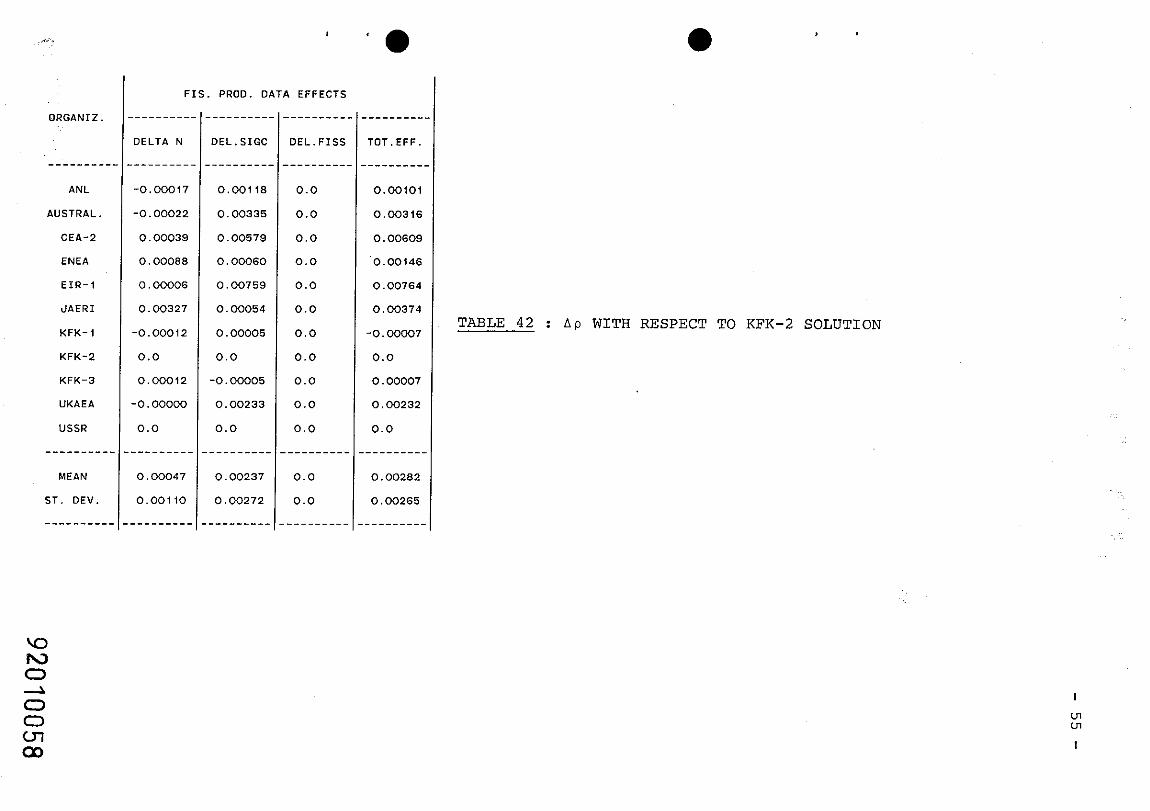
F I S . PROD. DATA EFFECTS
DELTA N
TABLE 42 : A p WITH RESPECT TO KFK-2 SOLUTION

ORGANIZ.
ANL
AUSTRAL.
CE A-2
ENEA
E I R - 1
J A E R I
KFK-1
KFK-2
K F K - 3
UKAEA
USSR
MEAN
S T . D E V .
F I S . PROD. DATA EFFECTS
DELTA N
TABLE 4 3 : A p WITH RESPECT TO K F K - 3 SOLUTION

4 , DRGANIZ.
- - - - - - - - -
ANL
AUSTRAL.
CEA-2
ENEA
EIR-1
JAERI
KFK- 1
KFK-2
KFK-3
UKAEA
USSR
----------
MEAN
ST. DEV.
--------.-
. - - - - - - - -
DELTA N
-0.00015
-0.000 19
0.00036
0.00080
0.00006
0.00297
-0.0001 1
0.00000
0.00011
0.0
0.0
F I S . PROD. DATA EFFECTS
TOT. EFF . - - - - - - - -
-0.00131
0.00083
0.00377
-0.00087
0.0053 1
0.00141
-0.00239
-0.00232
-0.00225
0.0
0.0
- - - - - - - - . 0.00024
0.0028 1
- - - - - - - -.
TABLE 4 4 : A p WITH RESPECT TO UKAEA SOLUTION

TABLES 4 5 - 50
SENSITIVITY COEFFICIENTS FOR ISOTOPE BUILD-UP

In the following tables sensitivity coefficients are
provided for the zero-dimensional burn-up calculation (see
table 131.
The following isotopes build-up was considered : Np237,
Pu236, Pu238, Am243, Cm242 and Cm244.
ij The sensitivity coefficients Sk for reaction k of isotope
j on isotope i build-up, can be exploited in the following way :
i j where the Sk coefficients are given in tables 45-50.
Finally, it should be noted that the coefficients were
obtained with the hypothesis of constant flux during the cycle.

BENCHMARK BURN-UP
TABLEAU DES S E N S I B I L I T E S DE N P - 2 3 7
' N * I S O T * NBE ATOMES * NBE ATDMES * PS * S E N S I B I L I T E S * * I N I T I A L + F I N A L F I N * TOTALE * L BETA - + L BETA * * L ALFA * S I G CAPT ' S I G N . 2 N * S I G F I S S *
TABLE 4 5

BENCHMARK BURN-UP
TABLEAU DES SENSIBILITES DE PU-236
* N * ISOT * N8E ATDMES * NEE ATOMES * PS * SENSIBILITES * * t * I N I T I A L * FINAL * F I N * TDTALE * L BETA - * L BETA + * L ALFA * SIG CAPT * SIG N.2N * S I G F ISS *
* 19 * PU40 " 2 ,20800-04 * 2 .61720-04 * 0.0 * 3 .71860-04 * 0.0 * 0.0 * 3 .30D-04 * 4 . 7 1 0 - 0 5 * - 6 . 2 2 0 - 0 9 * - 5 . 2 3 D - 0 6 * ' 2 0 ' PU41 + 1 .16500-04 * 8 . 4 1 2 3 0 - 0 5 * 0 .0 * 9.9820D-04 * 1.14D-03 * 0.0 * 0.0 *-2.36D-05 * - 7 . 6 1 0 - 0 8 * - 1 . 2 0 0 - 0 4 * * 2 1 * PO42 * 2 .79000-05 * 3 .19500-05 * 0.0 * 1.78281)-08 * 0.0 * 0.0 * 2 .370-09 * -2 .46D-11 * 1.56D-08 * - 1 . 4 5 D - 1 0 * * 22 * PU43 * 0.0 * 2.8227DL09 * 0.0 * 1.93250-12 * 1.93D-12 * 0.0 * 0.0 * 0.0 * 0.0 * 0.0 t
* 23 ' PU44 * 0.0 * 3 .7589D-10 * 0.0 * 9 . 9 3 7 3 0 - 2 0 * 0.0 " 0.0 * 1.01D-19 * 0.0 * 0.0 * - 1 . 8 8 0 - 2 1 * ................................................................................................................................
* 24 * AM41 * 0.0 * 3 .67660-06 * 0.0 * 1.0510D-03 * 0.0 * 0 .0 * 1.16D-03 *-9.91D-05 * -5 .57D-08 ' -1 .470-05 * * 25 * AM42 * 0 .0 * 2 .66410-09 * 0.0 * 8 . 2 2 8 7 0 - 0 9 * 1 .080-07 * -9.97D-08 * 0.0 * 0.0 * 0.0 * 1 . 1 0 0 - 2 3 * + 26 * AM2M * 0.0 * 1.1002D-07 * 0.0 * 9 .5854D-11 * 0.0 * 1 .060-10 * 0.0 * - 1 . 5 4 0 - 1 2 * 0.0 * -8 .60D-12 '
\O * 27 ' AM43 * 0.0 * 2 .76570-06 * 0.0 * 3 .75330-10 * 0.0 * 0.0 * 4 .45D-13 * 3 .77D-10 * 0.0 * -1 .81D-12 * * 2 8 ' AM44 * 0.0 * 1 .24720-09 * 0.0 * 3.8925D-12 * 3.89D-12 * 0.0 * 0.0 * 0.0 * 0.0 * 0.0
20 I*+*t*tt***************,***********t****************L**********************************f***************************************:
* 2 9 * CM42 * 0.0 * 2.6028D-07 * 0.0 * 4 .70830-07 * 0.0 * 0.0 * 5 .070-07 *-8.090'09 * -2 .03D-14 * - 2 . 8 1 0 - 0 8 * + 3 0 T C M 4 3 * 0 .0 * 8 .89390-09 * 0.0 * 1.0559D-13 * 0.0 * 0.0 * 5 .160-14 * 6 .10D-14 * 0.0 * - 6 . 9 5 0 - 1 5 * * 3 1 ' CM44 * 0.0 * 3 .50660-07 * 0.0 * 3.7737D-10 * 0.0 * 0.0 * 3 .89D-10 * 0.0 * -1 .16D-15 * - 1 , 1 8 0 - 1 1
0 ................................................................................................................................
0 0\ P TABLE 46

BENCHMARK BURN-UP
TARLEAU OES S E N S I B I L I T E S OE P U - 2 3 8
* N + I snr + NEE ATOMES * NBE ATOMES * PS * SENSIBILITES * I N I T I A L + F I N A L " F I N * TDTALE ' L BETA - * L BETA + * L ALFA * S I G CAPT + S I G N . 2 N * S I G F I S S *
TABLE 47


BENCHMARK BURN-UP
TABLEAU DES S E N S I B I L I T E S DE C M - 2 4 2
* N * I S D T ' NBE ATDMES * NBE ATDMES * PS * S E N S I B I L I T E S w I N I T I A L * F I N A L * F I N * TDTALE ' L BETA - + L BETA + ' L ALFA * S I G CAPT * S I G N . 2 N * S I G F I S S *
TABLE 4 9

BENCHMARK BURN-UP
TABLEAU DES S E N S I B I L I T E S DE CM-244
* N * I S D T * NSE ATDMES * NBE ATDMES * PS * S E N S I B I L I T E S * * * * I N I T I A L * F INAL * F I N * TDTALE * L BETA - * L BETA + * L ALFA * S I G CAPT * S I G N . 2 N * S I G F I S S *
TABLE 5 0

PART I1
ANALYSIS OF THE DA'I'A
1 - INTRODUCTION
. Some major f e a t u r e s of t h e resu1t.s p r e s e n t ~ d i n PART I a r e
ana lysed i n what fo l lows . Reference 1 g i v e s t h e s p e c i f i c a t i o n s
of t h e burn-up e x e r c i c e and Reference 2 g i v e s t h e g e n e r a l
s p e c i f i c a t i o n s of t h e LMFBR benchmark model.
I n p a r t i c u l a r , t h e r e a c t i v i t y l o s s f o r t h e proposed f u e l
c y c l e (320 d a y s ) , and t h e i s o t o p e build-up have been ana lysed ,
by means of some s i m p l i f i e d s e n s i t i v i t y c a l c u l a t i o n s . The sp read
of t h e r e s u l t s ob ta ined i s compared t o same t a r g e t accuracy
requirements . When p o s s i b l e , b a s i c d a t a accuracy i s ana lysed ,
u s ing t h e one-group averaged c r o s s - s e c t i o n s , provided by t h e
benchmark p a r t i c i p a n t s .
I n t e r n a l b reed ing g a i n and sodium void e f f e c t e v o l u t i o n
from t h e beginning t o t h e end-of-cycle va lue a r e a l s o b r i e f l y
ana lysed .
2 - REQUIREMENTS OF DATA ACCURACY
Before ana lys ing t h e benchmark c a l c u l a t i o n r e s u l t s it i s
u s e f u l t o r e c a l l some of t h e d a t a caccuracy requirements t h a t
have been made f o r t h e so -ca l l ed major and minor a c t i n i d e s i n
t h e These requirements have been made i n g e n e r a l w i th
r e s p e c t t o c o r e i n t e g r a l parameter t a r g e t accuracy requirements
( s e e e . g . r e f /3/ and / 4 / , bu t t hey have been s p e c i f i e d a l s o
d i r e c t l y i n connect ion wi th f u e l burn-up requierements / 4 , 5 , 6 , 7 /

Moreover, t h e p r e s e n t s t a t e of t h e a r t has been reviewed
i n d e t a i l i n r e f . /8/ and /9 / . For what concerns f i s s i o n produc t
d a t a , t h e proceedings of t h e S p e c i a l i s t s meeting on neu t ron
c r o s s - s e c t i o n s of f i s s ion -p roduc t n u c l e i , he ld i n BOLOGNA,
December 12-14, 1979, r e f . / lo/ , summarize most of t h e p r e s e n t
s t a t e of t h e a r t . For what concerns t h e heavy i s o t o p e d a t a ,
t a b l e 11.1 sumnarizes some of t h e r e q u i r e d a c c u r a c i e s , some i n d i -
c a t i o n s of t h e p r e s e n t u n c e r t a i n t i e s and t h e spread of t h e
one-group d a t a s u p p l i e d by t h e benchmark p a r t i c i p a n t s . The c ros s -
s e c t i o n s t aken i n t o account a r e t h e cap tu re and f i s s i o n c r o s s -
s e c t i o n s . The (n ,2n) d a t a w i l l be p re sen ted s e p a r a t e l y . Some
of t h e b a s i s f o r t h e d a t a accuracy requirements a r e a l s o pre-
s e n t e d i n t a b l e 11.1, a s they s t a t e d by d i f f e r e n t a u t h o r s . Table 11.2
summarized s i m i l a r d a t a concerning t h e pseudo- f i s s ion produc t
c r o s s - s e c t i o n d a t a .
3 - REACTIVITY LOSS RESULTS
The model and t h e d e s c r i p t i o n of t h e burn-up problem have
been s p e c i f i e d i n r e f . /1/ and /2/.
One f o r t h e requirement f o r t h e p a r t i c i p a n t s was t o supply
t h e r e a c t i v i t y l o s s breakdown i n t o t h e components :
p1 : r e a c t i v i t y v a r i a t i o n due t o c o r e heavy i s o t o p e concen-
t r a t i o n v a r i a t i o n ,
p 2 : r e a c t i v i t y l o s s due t o f i s s i o n produc t bu i l -up ,
p 3 : r e a c t i v i t y g a i n due t o heavy i s o t o p e bui ld-up i n t h e
b l anke t s .
Obviously, t h e t o t a l r e a c t i v i t y l o s s p i s given by :
The r e s u l t s of t h e benchmark c a l c u l a t i o n a r e given i n
t a b l e 11.3.
. . ./. . .

To analyse these results, a simplified one-group sensitivity
calculation was performed, based on perturbation theroy at
first order.
3.1 - Reactivity variation due to core heavy isotopes
The simplified sensitivity study was based on the
following expression :
(only U-238, Pu-239 and Pu-241 were considered in
the sum over the isotope index i). To analyse the origin of
the spread of the results of table 11.3,the following expression
was used :
i i The bF and ba are straightforward coefficients.
i i i i The 6 (vof) /vof and &(aa) /aa values can be obtained
from the data in table I. The 6(6Ni)/6Ni values can be related
to data uncertainties by means of time dependent perturbation
expressions /11/ :
Where the build-up of isotope i is affected by the
uncertainties of cross-sections type K of isotope j.
The main sensitivity coefficients s.. relevant to 1 l k
the U-238, Pu-239 and Pu-241 isotope density variations were
calculated and are given in table 11.4.
Usinq expression (2), and the one-group data spread
of table I, we were able to reproduce fairly well the standard
deviation obtained using the direct Keff calculation results
of table 11.3 : - + 0.4 % AK/K against the - + 0.5 % AK/K value of table 11.3.

It was possible to point out the relative contribution
of the different data uncertainties to the overall data uncer-
tainty. The results are given in table 11.5.
For the benchmark data, the major role is played by
U-238 oc and Pu-240 oc spread, followed by the of spread of
Pu-241 and Fu-239. To check if the data of the benchmark where
representative of a more general situation, we also used the
required data accuracies of table I. In this case, the standard
deviation on p l would have been similar by slightly higher
(2 0.5 % A K / K ) , and the relative contribution of separate data
would have been different, as it is indicated in table V. The
major role is played by oc of U-238 and, complementary, by
Pu-239 of and it seems that a very stringent requirement is
actually needed only for the of of Pu-241, but that a semewhat
more relaxed requirement (+ - 5 + 8 % ) is needed for the o& of
Pu-240 and Pu-241.
We have made a further test on the fuel burn-up
reactivity effect p l in a large LMFBR of the SUPER PHENIX type,
with a fuel cycle of 480 days and using two different hypothesis
on the origin of the Plutonium (gas-graphite or PWR reactors).
Using the two set of uncertainties on data, one from benchmark
data spread and the other from the most severe data accuracy
requirements of table I, we obtained the results of table VI,
which confirm the results of the benchmark calculations and
the conolusions drawn above.
In summary, even stringent data requirements on heavy
isotopes, cannot reduce the uncertainty of the componen of
the reactivity loss due to heavy isotope concentration variations
to less than s - + 0.5 + 0.7 % AK/K. To reduce this uncertainty,
it would be essential a further reduction on the oc of U-238
accuracy requirements, wich seems at present difficult to be
met.

3.2 - Reactivity loss due to FF build-up
One of the fairly surprising result of the benchmark
calculations, is related to the relatively high spread of the
results for the FF componentof the reactivity loss, p2.
Table 11.2 indicates a standard deviation, with respect
to the mean value, of the one-group capture cross-section •’of - the pseudo-fission product of - + 16.2 %. The individual values
of the uEP of the pseudo FP are shown in table 11.7. In the same FP
table uc , weighted in a SPXl type spectrum are also presented.
'Ehese last values were requested to the participants
to provide 1 group data all weighted in the same spectrum. In
the same table data provided by M. Guppelaar and based both on
the RCN-2A library and on ENDF/B-V, are shown.
One the basis of these data, following comments can
be made :
- The pseudo fission product one group cross section depends on the criteria used to produce it. In fact several
procedures can be used, in particular for what concerns global
adjustments and the effect of FP migration (see table 1 1 . 8 ) .
In particular the global adjustment performed at CEA resulted FP
in a significantly (% 6 % ) lower u . C
a M. Gruppelaar evaluated that, assuming that the stable
and long-lived isotopes of Br, Kr, I and Xe have disappeared, a
uFP reduction of 5 % is found. This reduction increases to about C 12 % in the limit of immediate release of all gaseous and volatile
nuclides and their decay products (e.g. Cs-133, Cs-135).

- The origin of isolated FP data and yield values so play a role. However the yield origin is fairly constan
and comparisons shown at the Bologna Meeting /lo/ indicated that
large discrepancies on isolated isotopes often compensate to
a large extent.
- There are certainly spectral effects which also explain part of the observed discrepancies on the 1 group LFP
cross sections. In fact, we observe a discrepancy, between ANL
and CEA data, of 24,3 % if both calculations use their respective
spectrum and cross sections, which reduces to 17 % if the 1
group data are calculated using the same spectrum (see second
raw of table 11.7). This fact is related to the large sensiti-
vity of the 1 group LFP oEP to core cross sections, in particular
scattering and absorption data, as it is shown by the sensiti-
vity coefficients of table 11.9.
For what concerns the reactivity loss values, table
IT.3 results indicate a spread on the mean value of p2, corres-
pondig to a standard deviation of - + 16 %. Since in principale
the discrepancies of p2 should be attributed mainly to the
discrapancy in the oc of FP, this result seems consistent.
Howewer, a closer look to the data shows that the
discrepancy on the one-group oEP plays a role, and here again
there is evidence for important spectral effiects. For example,
the discrepancy between the ANL and the CEA-2 solutions on p2 FP is + 24 %. This effect is + 12.7 %, and the discrepancy on oc
can be due to :
1) pseudo-fission product cross-section characteristics
(sepctral shape of ozP , inelastic cross-sections) and low energy spectrum ; or,
2) to effects on p 2 due to the other cross-sections.

However sensitivity calculations based on generalized
perturbation theory indicate that, e.g. the effects on p 2 due
to U-238, Pu-239, Oxygen, stainless-steel and Na cross-sections
variations of 10 % should be of the following order of magnitude
(values of 6p2/p2 in percentage) :
These effects are fairly small and should not
contribute in a significant way to explain the above mentioned
effect. Further investigation would then be needed in this
field, in particular related :
Effect due to 10 % variation of :
.
a a a scatt.
1 ) to the spectral shape of the a FP used by the C
participants ;
2) possible effects due to FP inelastic cross-sections.
For what concerns this last effect, ANL indicated a 16 %
contribution to p2 due to inelastic FP cross sections, and the
corresponding value calculated at CEA was of 18 % in rather
good agreement. The UK result on this effect is % 23 % .
It is worth noting that, if the benchmark results are a
SS
- 0.5 + 1.2
. confirmed, they would show some differences with the conclusions
U-238
- 3.4
+ 1.0
of the BOLOGNA Meeting /lo/ and would cast same doubts on the
present ability to predict p 2 with an accuracy of - + 10 % .
Oxygen
0
+ 2.2
Pu-239
- 2.6 + 1.0
As a final remark, we think useful to remind that at
CEA, a - + 16 % uncertainty on p 2 is announced at present on design
calculations, based on the combination of the following main
uncertainties (partially correlated) :
Na
0
+ 1.0
yield : - + 8 %
migration of gaseous FP : - + 3 %
4 - SODIUM-VOID RESULTS
Sodium-void reactivity coefficient evolution with burn-up
is presented in table 11-10. The spread of the results at EOC is
very similar to that, already small, obtahned for BOC data
(a 8 % ) . In this way, the results of ref. /1/ are confirmed,
as it is confirmed the result of some integral experiment
analysis, in which the E-C/C on the sodium-void effect was
found independent from, e.g. the Pu-240 content of the core /12/
It is also confirmed that the oEP uncertainty affects the
Na void effect in a relatively small way (according to ref /13/,
+ 30 % on - FP c would produce - + 1.7 % on the non-leakage component
of the Na void in a large LMFBR) .
However, some remarks can ben made to explain some of the
most discrepant results.
The average percentage value of the increase of the Na
void effect is = + 22 %. Some solutions (CEA, JAERI) exibit a
lower value. This result could be correlated to a low ozP value.
In fact, this is the case only for the CEA solution. A further
explanation can be found in the hardening of spectrum at EOC
which makes the positive Na void component more positive.
Actually, the F8/F5 ratio shows the smaller increase, between
BOC and EOC, in the case of the CEA and JAERI solutions.
Furthermore, both solutions were characterized by a steep slope
of the adjoint function at high energies /I/. All these',factors
explain the lower increase of the Na void effect between BOC
and EOC.

5 - OTHER INTEGRAL PARAMETERS
For this preliminary analysis, we should indicate that other
integral parameters considered in the intercomparison, like
reactions rate ratios, were not affected strongly by burn-up
and no unforeseen supplementary uncertainties did show-up. As
an example, the internal breeding gain value, which was affected -
at BOC by an absolute spread of approximately - + 0.03, has a similar sprad at EOC (or slightly less).
b - ACTINIDE BUILD-UP
As a part of the benchmark exercise, a simplified burn-up
calculation was requested, concerning the higher transactinides.
Some of the results are summarized in table 11.10, where the
results obtained for the buil-up of Np-237, Pu-236, Pu-238,
Pu-242, Am-241, Am-243, Cm-242 and Cm-244, are compared.
The dispersion of the data obtained is often of the order
of magnitude of some target accuracy requirements /6,7/.
However, the case of Pu-236 is worth noting. The build-up
of this isotope is directly related to the 2 3 7 ~ p (n, 2n) data.
On this data, a large spread of values is presently
observed and this is reflected in the large dispersion obtained
among the benchmark results (.L - + 180 % ) . The branding ratio for
the 237~p (n, 2n) 2 3 9 ~ ~ reaction is certainly a source of uncer-
tainty, together with the (n,2n) cross section value.
For all the previously mentioned isotopes, a sensitivity
analysis was performed based on expressions of the type of ( 3 ) ,
and some results are shown in table 11.12.

Am-243
This data is strongly dependent on Pu-242 oc. A - + 20 %
dispersion on this data is observed among the benchmark parti-
cipants, and this correlates well with the s - + 22 % standard
deviation observed.
A - + 12 % contribution to the observed standard deviation
on the isotope buil-up ( % - + 26 % ) is due to Am-241 oc observed
dispersion among participants. A complementary role is played
by A B of Pu-241 (sensitivity coefficient s = 0.98), and ha of
Cm-242 (sensitivity coefficient s = 0.39).
Cm-244
The uncertainties on o of Pu-242 and wc of Am-243 are the C
most important contributors. If the observed spread of the
benchmark data (incomplete in the case of Am-243 a,) is used,
an approximate 24 % contribution of the total s 40 % observed
deviation is found. More complete data on oc of Am-243 would
be needed in this case.
Pu-238
In absence of detailed data on (n,2n) and h data, the
observed standard deviation (s - + 16 % ) is obtained if one uses
the supplied data dispersion for oc of N2237 (+ - 9 % ) , for oc
of Am-241 (+ 13 % ) , and estimated uncertainties of - + 30 % on
the (n,2n) values of U-238 and Pu-239 and - + 10 % on ha of
CM-242.

KEFERENCE S
Appendix I of the present document.
L.G. LESAGE et al, ANL-80-78 (NEACRP-L-243), ( 1 980).
J. ROWLANDS, Int. Conf. on Neutron Physics and Nucl.
Data Harwell, (1978) .
P. HAMMER, Int. Conf. Nucl. Data and Technology,
Knoxville (1979) .
P. HAMMER, Int. Conf. on Neutron Physics and Nucl.
Data, Harwell, (1978) .
B. PATRICK and H. SOWERBY,
NEANDC-174A, (1980).
L. USACHEV et al, Int. Conf. on Neutron Physics and
Nucl. Data, Harwell, (1978) .
H. KUSTERS, Int. Conf. Data and Technology,
Knoxville, (1979) .
J. HIROTA and H. MITANI.
Annals of Nucl. en. - 7, 439, (1980).
Proc. Spec. Meeting on Neutron Cross-Sections of
Fission Product Nuclei, Bologna, (1979). In particular,
Report of Working-Group 1.
See for example, A. GANDINI, M. SALVATORES and
L. TONDINELLI, Nucl. Sci. Eng. - 62, 339, (1977).
F. LYON et al, Int. Conf. on Fast Reactor Physics,
~ix-en-Provence (1 97 9)
A. BULTAND, Int. Conf.
Aix-en-Provence, (1979
on Fast Reactor Physics,
) .

Achie-red accuracy (present Spread of Benchmark one-group 3equired accurzcy ( l o ) uncer ta in ty) , (o f ten quoted da ta ( l o ) , ( ~ r o m references 11 I
a t i'u) 18; and 191)
I 0 f l 1 I I
( a ) J. ?o>:lends, E a r ~ e l l 1978, Ref. 131 ( b ) ?. e , iiarwell 1978, Ref. 1.51 ( c ) 3. Pe t r ick end H. Sowerby, MZANDC (174A), Ref. 161 ( 6 ) ?. Z x z e r , Knoxville 1979, Ref:14[ ( e ) L. Useci;ev, Harwell 1978, Ref. 171 (f) J. Hirota end H. M i t z n i , Annals of Nucl. En. 1, 439, 1980, Ref. 191 ( g ) H. KGsters, Yaoxville 1979, Ref. 181
TABLE TT. 1

1 I Achieved accuracy ( p r e s e n t S p e a d of Benchcark one-group I so tope Required accuracy ( l o ) u n c e r t a i n t y ) , ( o f t e n quoted d a t a ( l o ) , (i3-OX r e f e r e n c e s 1 1 1
et 10) !
( 2 ) Control-rod r e g i r e m e n t : 25% (+0.5% + 1% i n Kerf f o r i r r a d i a t e d . l f u e 1 ) . ~ e c a y h e e t : 2 + 5% ('9) ?5$ cn 6ecay h e a t ; i nhe ren t s o w c e t20% ; in terna l . b reed ing @ i n t0 .02 ( c ) ? r c h c t i o n of : ?u-236, h - 2 4 1 , Ax-243, Cm-242, Cn-244 : t 1 ~ 0 % ( 2 a ) . Production o f Pu-238 : -+20%. a decay b e e t : 25% (d) Z e z t i s - i t y l o s s p e r cyc le : +0.5$ AK/K ( i n c l u d i n g FP e f f e c t s ) . (Uncer t a in ty i n c o r e c r i t i c s -? mss f o r h ighe r
A , ,ransectinides : i 0 . 2 $ A K / X end t0.01)0 4 i n i n t e r n a l breeding &?.in)
( e ) ihilci-c;, r e ~ i r e m e n t s f o r : PU-236 t30% (iiron v a r i o u s f a s t r e a c t o r f u e l c y c l e ~ a r t i c d a r i t i e s ) ( t a r g e t accuracy) PJ-238 +20%
Pu-240 t 5 % h - 2 4 1 t 4% PG-242 t ~ c % h - 2 b l i 5 % 10.-243 +20% Cm-242 t20% CX-244 ~ 4 0 %
TABLE 11.1 ' ( f o l l o w e d )
ORGANIZ
Pseudo FP one-group
a C
ANL
AUSTRAL.
CEA- 2
ENEA
EIR-1
JAERI
KFK-1
KFK-2
KFK- 3
UKAEA
USSR ------------- - MEAN
ST. DEV.
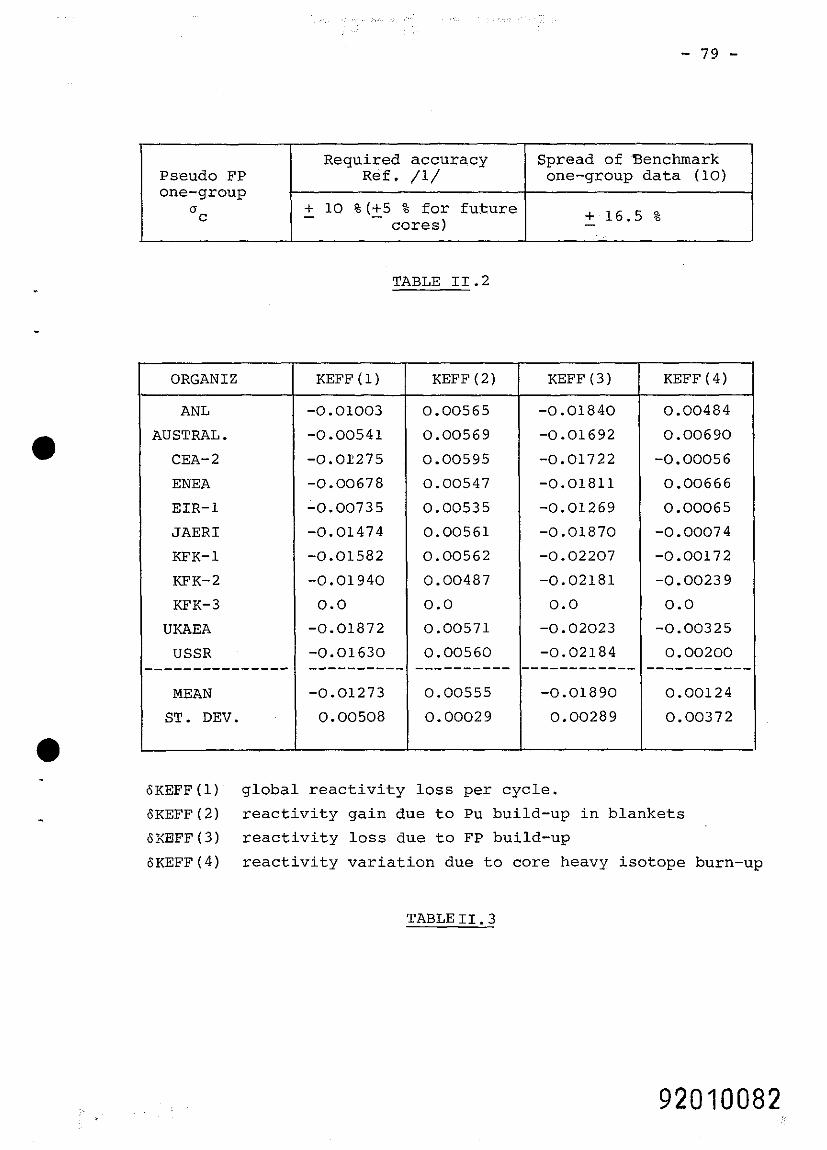
TABLE I I .2
Required accuracy Ref. /1/
+ 10 %(+5 % for future - - cores)
KEFF (2)
Spread of Benchmark one-group data (10)
- + 16.5 %
KEFF ( 3 )
~KEFF(~) global reactivity loss per cycle.
6KEFF(2) reactivity gain due to Pu build-up in blankets
6XBFF(3) reactivity loss due to FP build-up
6KEFF(4) reactivity variation due to core heavy isotope burn-up
TABLE 11.3
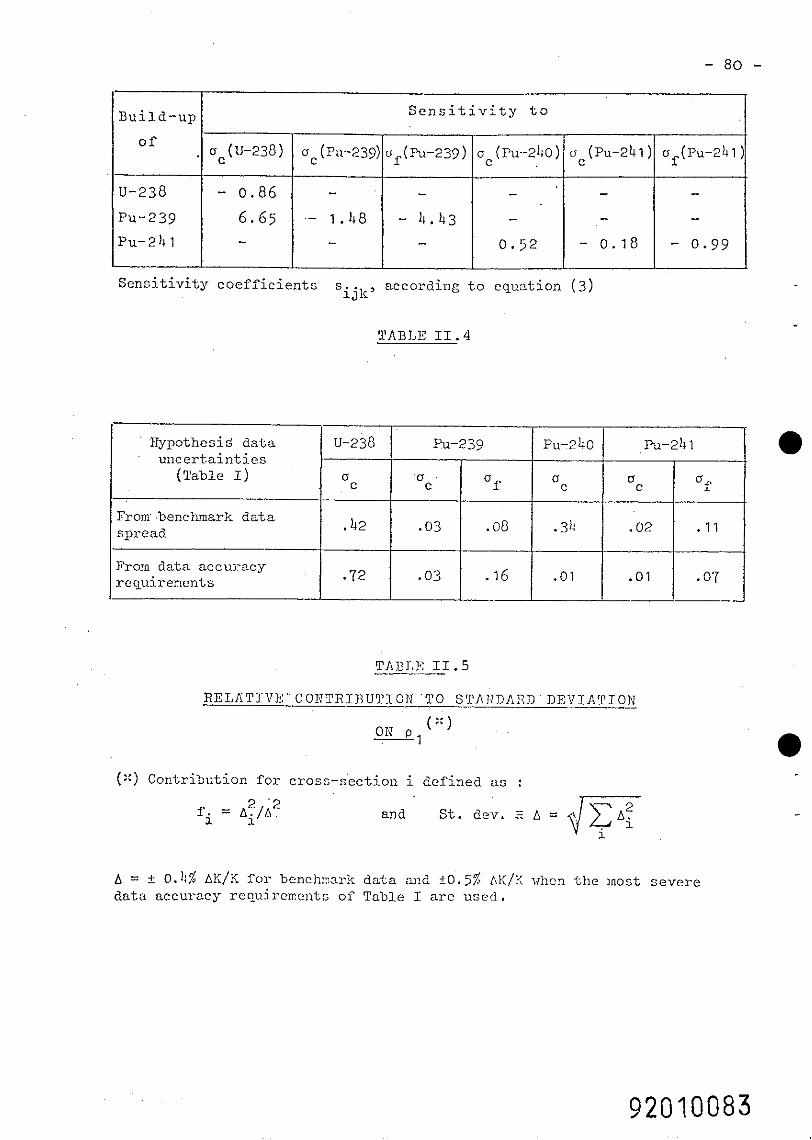
Sens i t i v i ty coe f f i c i en t s ' i j k Y according t o equation ( 3 )
TABLE 1 1 . 4
B u i l d - u p S e n s i t i v i t y t o
RELATIVE' C O I ~ T R I R U T I O N TO S T A I J D A R D D E V I A T I O N
.IIypothesiS da ta unce r t a in t i e s
(Table I )
From -benchmark da ta spread
Fro~n data accui-ac y requirements
( ) Contribution f o r cross-sect ion i defined a s :
and S t . dev. E A = ., dV
U-238
u C
.42
. 72
A = + 0.4% AK/K f o r benchmark da ta and 20.5% A K / K vhcn t h e most severe data accuracy rcouirements of Table I a r e used.
Pu-239 Pu-240
u C
. 314
.O1
u C
.03
.03
u f
.08
- 1 6
Pu-2111
u C
.02
. O I
u f
.ll
.07

Type o f f u e l
Gas-Graph
o r i g i n
o r i g i n
-
Hypothesis of d a t a uncc!rtain- tics (Table I)
From benchmark
Accuracy Req.
From benchmark
Accuracy Req. -
TABLE II,6
RELATIVE COI~TRIDUTION TO STANDARD DEVIhTION
( s e e f o o t n o t e t o Table V.
S t andard d e v i a t i o n s (depehding on h y p o t h c s i s o f d a t a u n c e r t a i n t i e s ) on I :
TABLE 11 .7
PSEUDO-FISSION PRODUCT 0 ( b n r n s / f i s s i o n ) - C-
( a ) w c i g l i t c d i n t h e b e n c h m a r k s p e c t r u m
( b ) v c i g h t c d i n a SPXl t y p e c e n t r a l spectrum.
( c ) P e t t e n d a t a p r o v i d e d b y M . GRUPPELAAR. The two v a l u e s p r o v i d e d a r e d e r i v e d f r o m RCN-2A a n d ENDF/B l i b r a r i e s f o r i s o l a t e d FP. The d a t a a p p l y t o f i s s i o n p r o d u c t s f r o m Pu-239 : t h e y i e l d s u s e d i n t h e b u r n - up c a l c u l a t i o n ( 4 1 MWdIkg) a r e t h e same as t h o s e a d o p t e d i n ENDF/B-V
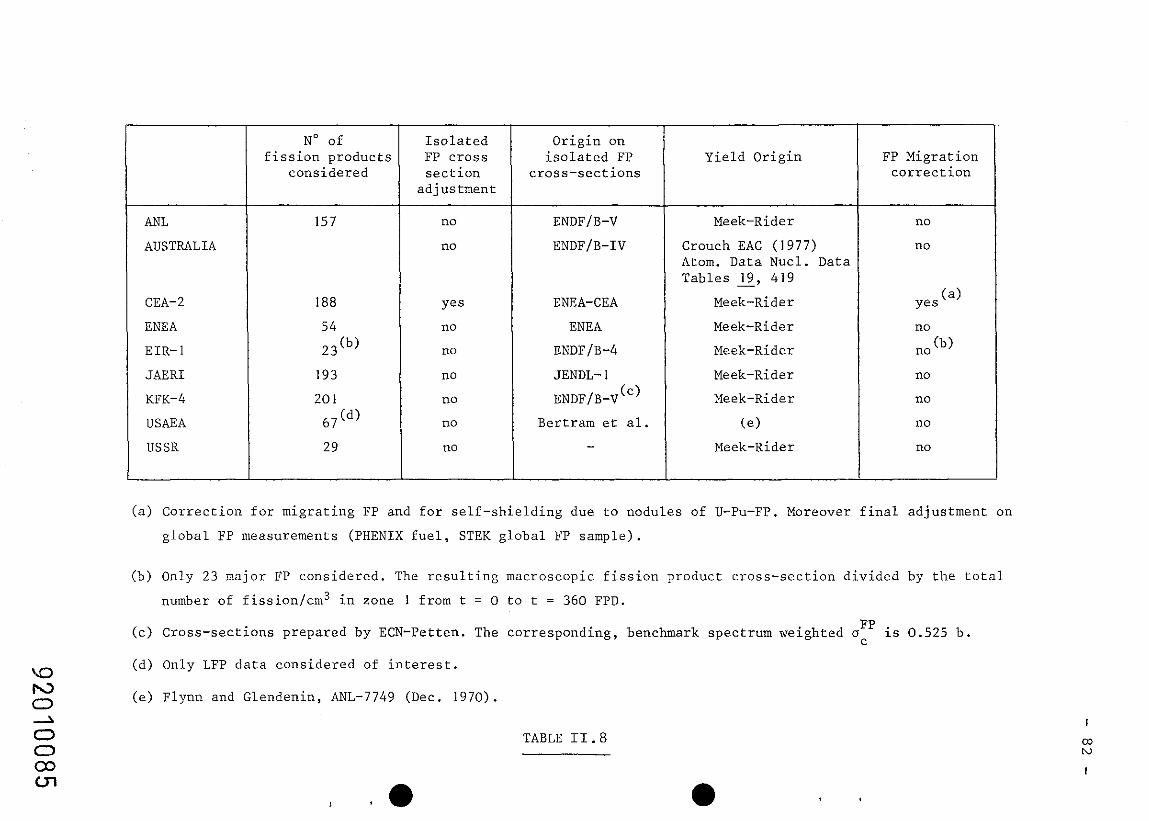
ANL
AUSTRALIA
CEA-2
ENEA
EIR- 1
JAERI
KFK-4
USAEA
USSR
No of fission products
considered
Isolated FP cross section
adjustment
Origin on isolated FP
cross-sections
ENEA-CEA
ENE A
ENDFIB-4
JENDL- I
ENDFIB-v (c)
Bertram et al.
-
Yield Origin
Meek-Rider
Crouch EAC (1977) Atom. Data Nucl. Data Tables 19, 419 -
Meek-Rider
Meek-Rider
Meek-Rider
Meek-Rider
Meek-Rider
(e)
Meek-Rider
FP Migration correction
(a) Correction for migrating FP and for self-shielding due to nodules of U-Pu-FP. Moreover final adjustment on
global FP measurements (PHENIX fuel, STEK global FP sample).
(b) Only 23 major FP considered. The resulting macroscopic fission product cross-section divided by the total
number of fission/cm3 in zone 1 from t = 0 to t = 360 FPD.
(c) Cross-sections prepared by ECN-Petten. The corresponding, benchmark spectrum weighted oFP is 0.525 b. C
'Q (d) Only LFP data considered of interest.
to 0 (e) Flynn and Glendenin, ANL-7749 (Dec. 1970).
TABLE 11.8

T A B L E
S e n s i t i v i t y c o e f f i c i e n t s ( 6 R / R ) / ( 6 Z / Z ) f o r
- G r o u p s t r u c t u r e u p p e r b o u n d a r y : 1 4 . 5 M e V .
- G r o u p s t r u c t u r e w i d t h : Group ' 1 Au = 1 . 3 7 ; g r o u p s 2 - 2 0 ; A U = 0 . 5
g r o u p 2 1 Au = 1 ; g r o u p . 2 2 Au = I . 5 ; g r o u p s 2 3 - 2 4 Au = 2 ;
g r o u p 2 5 t h e r m a l .

DRGANIZ-.
- APJL
AUSTRAL.
CEA-2
E N C A
ETR-1
JAERI
KFK-1
K F K - 2
KFK-3
UKAEA
IIEAId
ST, CEV.
II i I IER CORT: SO1)IIII.I V O I D WORT11
( b K / K )
EOC-3OC ------- COC
0.26295
0.23297
6.15299
0.26255
0 .25412
0 .30074
O,ZL733S
0.23210
0.0
0 .22157
0 .22759
O.O3455

ORGANIZ . ANL
AUSTRAL.
CEA-2
ENEA
E I R - 1
J A E R I
KFK- 1
KFK-2
KFK-3
UK A 3 A
U S S R ----------- MEAN
S T . DEV.
TABLE 1 1 . 1 1
HIGHER A C T I N I D E BUILD-UP

Build- up of
Np-23'
Pu-23L
Pu-23t
-
Pu-2l12
lim-2111
hn-243
cm-2h2
cm-2104
( o b t a i n e d w i t h t h e h y p o t e s i s of cons t an t f l u x , no t power, dur ing t h e c y c l e )
TABLE 1 1 . 1 2
PART I11
BEGINNING OF CYCLE PAMETERS
a) Comparison of Present Calculations and those Reported
in the Original Benchmark Study by . . A.T.D. Butland
The results for the original benchmark were taken from
Reference 1.
The changes in the data libraries and processing programs
are summarised in Table 111.1. It will >be seen that most of the
organisations made some changes, the most significant being
the ANL change from ENDF/B-IV to ENDF/B-V, the CNEN change 2 2 from MC -1 to MC -2 and the change in the Japanese data
library.
The more important reactor parameters calculated have been
compared in Tables III.2/111.6.
The spread in the calculated breeding parameters has
increased somewhat, particularly for the breeding gain, where
the CEA value has decreased by 15 %. Nevertheless the new
situation is consistent with the generally quoted target
accuracies of - + 2 % on the total reactor breeding ratio and
+ 0.03 on the total reactor breeding gain. -
The spread in the calculated eigenvalue has not changed
very much, but the use of the ENDF/B-V library by ANL has
resulted in an increase of 0.94 %. At the time of the original
benchmark study ANL were recommending an increase of 1.5 % in
eigenvalues calculated using ENDF/B-IV, this recommended increase
is now about 0.5 %, so their final recommended value has not
changed. The reduction in the eigenvalue calculated by ENEA 2 2 with ENDF/B-IV results from the use of MC -2 as opposed to MC -1,
whilst the increase in the kfk-1 value results from the use of
new U238 inelastic data.

It was concluded at the time of the original benchmark
study that the main source of the spread in the predicted
eigenvalues was the calculated difference in U238 capture.
These data are tabulated relative to Pu239 fission in Table 5.
It can be seen that the changes in this calculated ratio have
matched the changes in the eigenvalue.
Ignoring those calculations using ENDF/B-IV data, and
applying the recommended bias of about + 0.5 % to the ANL
result, the spread in the calculated eigenvalue (1.00712 - 1.02199) is somewhat larger than might be hoped for with a
generally quoted target accuracy of - + 0.5 %.
The spread in the calculated inner core sodium void effect a
has increased fairly markedly due to the increase in the
Japanese result. But the Japanese have stated that their new
data library overestimates the sodium void effect by a 20 %
when compared with experiment. The Americans have also stated
that they make a reduction of 15 % in sodium void effects
calculated with ENDF/B-V. When these bias factor are applied
the spread in the new results for the benchmark is very
similar to that seen in the original results, which is con-
sistent with the - + 15 % target accuracy generally quoted for
the maximum positive sodium void effect, especially when
those results produced using ENDF/B-IV data are ignored.
It should be added that the new USSR values are generally
in the direction of reducing the spread of the calculated - results.
For what concerns Beff, the only significant revised data
concerns the the ANL calculation. Using the same fluxes and
cross-sections (from ENDF/B-V), the Beff calculated with ENDF/B-IV
and V are as follows : Beff (ENDF/B-V) = 3.7764-3
'eff (ENDF/B-IV) = 3.8725-3.
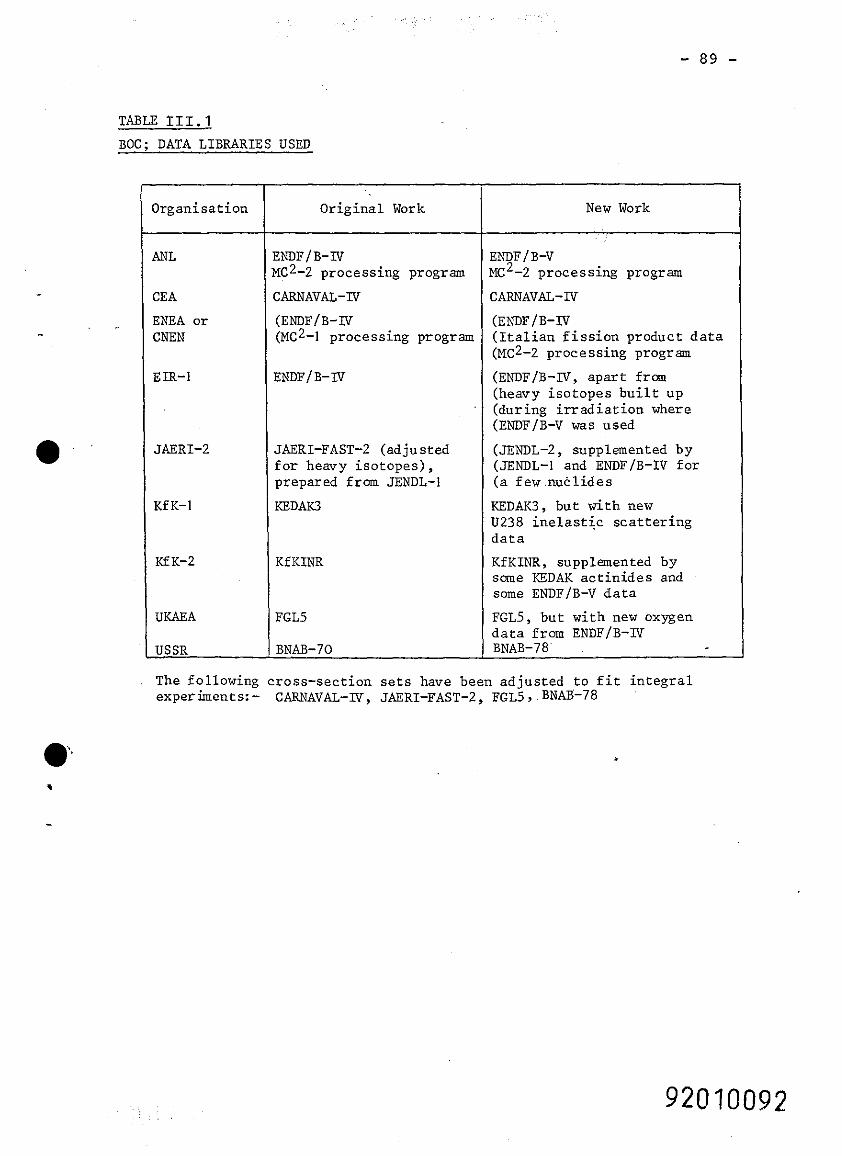
TABLE 111.1
BOC; DATA LIBRARIES USED
Organisa t ion
ANL
CE A
ENEA o r CNEN
EIR-I
JAERI-2
Kf K-I
KFK-2
UKAEA
USSR
The fol lowing cross-sec t ion s e t s have been ad jus t ed t o f i t i n t e g r a l experiments: - CARNAVAL-IV, JAERI-FAST-2, FGL5, BNAB-78
Or ig ina l Work
ENDFIB-IV MC~-2 processing program
CARNAVAL-IV
(ENDFIB-IV (MC~-1 processing program
ENDFIB-IV
JAERI-FAST-2 (adjus ted f o r heavy i so topes ) , prepared from JENDL-I
KEDAW
Kf KINR
FGL5
BNAB-70
New Work
ENDF I B-v Mc2-2 processing program
CARNAVAL-IV
(ENDFIB-IV ( I t a l i a n f i s s i o n product d a t a (McZ-2 processing program
(ENDFIB-IV, a p a r t from (heavy i so topes b u i l t up (during i r r a d i a t i o n where (ENDFIB-V was used
(JENDL-2, supplemented by (JENDL-I and ENDFIB-IV f o r ( a few nuc l ides
KEDAK3, but wi th new U238 i n e l a s t i c s c a t t e r i n g d a t a
KfKINR, supplemented by some KEDAK a c t i n i d e s and some ENDFIB-V d a t a
FGL5, bu t with new oxygen d a t a from ENDFIB-IV BNAB-78

TABLE I I1 .2
BOC; TOTAL REACTOR BREEDING RATIO
O r g a n i s a t i o n O r i g i n a l Va lue I ANL CEA-2 ENE A EIR-I JAERI KfK-I Kf K-2
TABLE 111.3
BOC; TOTAL REACTOR BREEDING GAIN
1 O r g a n i s a t i o n 1 O r i g i n a l Va lue I
ANL CEA-2 ENEA EIR-I JAERI KfK-I Kf K-2 UKAEA USSR
New Va lue
1.39877 I .3926O 1.40386 1 .34770 1.36046 1.38608 1 .35096 I .35911 1.371
% Change
New V a l u e I I Change

TABLE 111.4
BOC ; E IGENVALUE
O r g a n i s a t i o n I O r i g i n a l V a l u e I New Value 1 % Change I ANL CEA-2 ENEA EIR-1 JAERI-2 KfK-1 Kf K-2 UKAEA USSR 1
TABLE 111.5
BOC; (U238 C A P T U R E / P ~ ~ ~ ~ FISSION) CENTRAL REACTION RATE RATIO
I O r g a n i s a t i o n I O r i g i n a l Va lue 1 New Value I % Change 1
ANL 0.16650 / 0.16447 1 - 1.2% / CEA-2 1 0.16200 0.161 90 - 0.06% I ENE A EIR-I JAERI Kf K-I Kf K-2 UKAEA USSR
TABLE 111.6
BOC; INNER CORE SODIUM VOID EFFECT
O r g a n i s a t i o n
ANL CEA-2 ENEA EIR-I JAERI Kt- K-I Kf K-2 UKAEA USSR
O r i g i n a l Value
0.02360 0.02161 0.02282 0.02428 0.02359 0.02126 0.01 930 0.02047 0.01830
New Value % Change
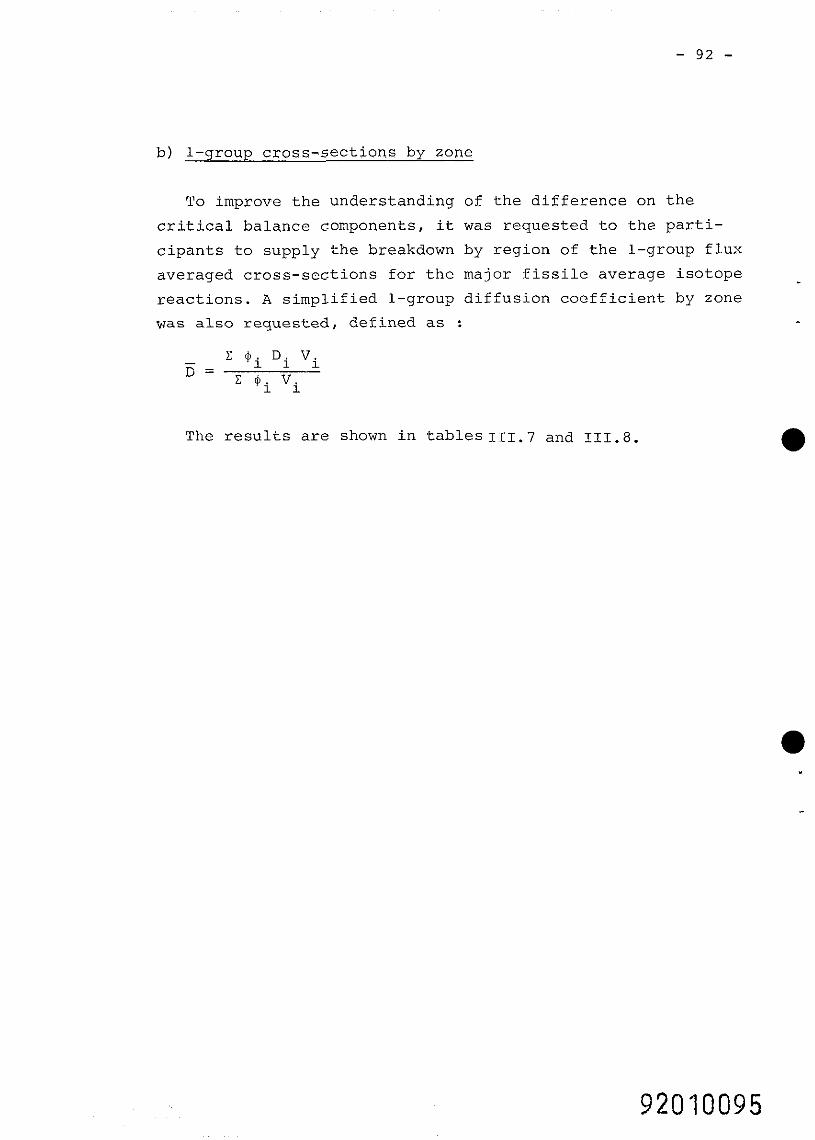
b) 1-group cross-sections by zone
To improve the understanding of the difference on the
critical balance components, it was requested to the parti-
cipants to supply the breakdown by region of the 1-group flux
averaged cross-sections for the major fissile average isotope
reactions. A simplified 1-group diffusion coefficient by zone
was also requested, defined as :
The results are shown in tables111.7 and 111.8.

Inne r core I
.
ANL
CEA-2
EMEA
EIR-1
JAERI
KFK-2
UKAEA
O u t e r core
TABLE 1 1 1 . 7
- D
1 . 3 8 6
1 . 4 0 5
1 . 3 7 5
1 . 3 0 7
1 . 3 6 6
1 . 3 9 0
1 . 2 2
U-238
" c
0 . 3 0 9
(2.297
0 .311
0 . 3 0 5
0 . 3 0 2
0 . 3 0 9
0 . 2 9 6

ANL
CEA- 2
ENEA
EIR-1
J A E R I
KFK-2
UKAEA
R a d i a l B l a n k e t
TABLE 1 1 1 . 8
A x i a l B l a n k e t

APPENDTX I
PROPOSAL, FOR BURN-UP CALCULATIONS
APPLIED TO THE NEACRP FAST BREEDER BENCHMARK
1 - INTRODUCTION
According to what was decided at the 22nd NEACRP meeting
in Paris (October 1 9 7 9 ) , this paper presents a proposal for
simple burn-up calculations applied to the ANL fast breeder
Benchmark (1) .
The aim of such an exercise is to provide a comparison
of the multigroup data used by various laboratories for what
concerns isotopes specifically involved in fuel burn-up
problems : Fission Products P . and Actinides.
This comparison will be performed through calculations of
integral parameters according to an approach similar to the
one previously used for the "fresh core" study (1). The integral
quantities of interest in the present case are :
- core parameter variations due to the fuel burn-up, - irradiated fuel composition after a given in pile
residence t.ime.
As far as the core parameters are concerned, the following
characteristics will be investigated by comparing the end-of-
cycle values to the "fresh core" ones :
- reactivity loss per cycle,
- the internal and external breeding gains, - radial and axial fission rate distributions,
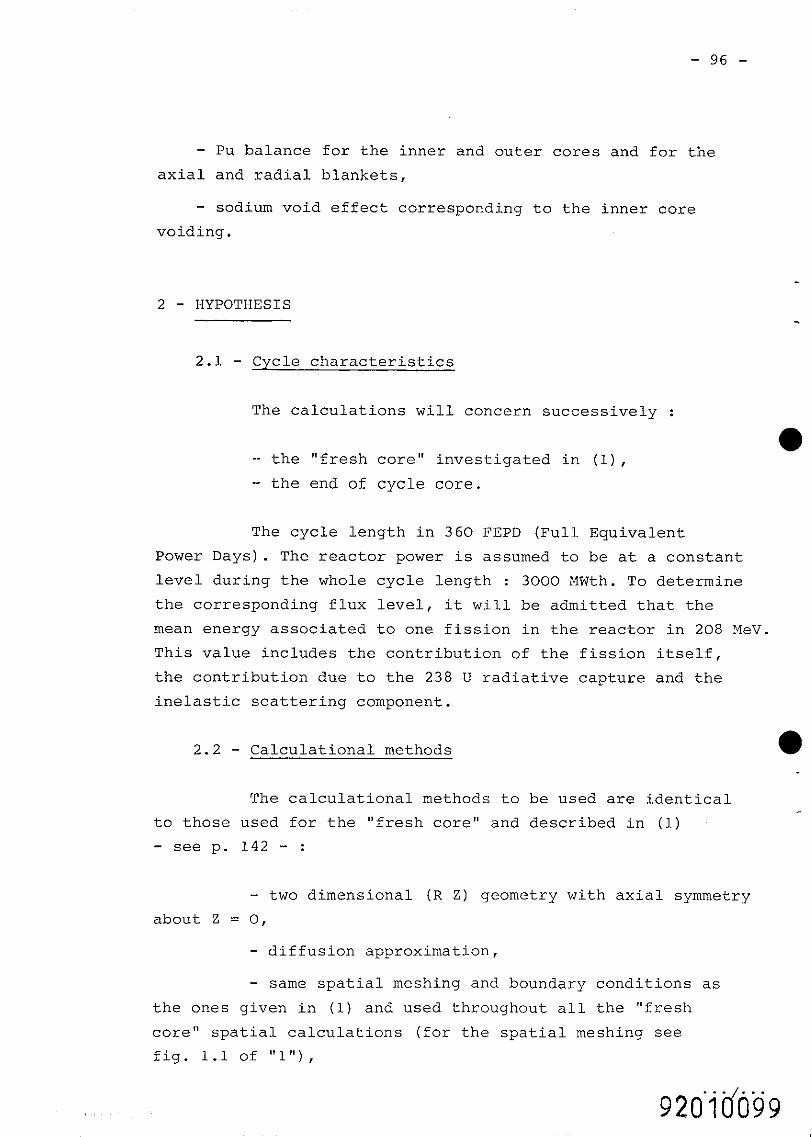
- Pu balance for the inner and outer cores and for the axial and radial blankets,
- sodium void effect corresponding to the inner core voiding.
2 - HYPOTHESIS
2.1 - Cycle characteristics
The calculations will concern successively :
-- the "fresh core" investigated in (l), - the end of cycle core.
The cycle length in 360 FEPD (Full Equivalent
Power Days). The reactor power is assumed to be at a constant
level during the whole cycle length : 3000 MWth. To determine
the corresponding flux level, it will be admitted that the
mean energy associated to one fission in the reactor in 208 XeV
This value includes the contribution of the fission itself,
the contribution due to the 238 U radiative capture and the
inelastic scattering component.
2.2 - Calculational methods
The calculational methods to be used are identical
to those used for the "fresh core" and described in (1)
- see p. 142 - :
- two dimensional ( R Z ) geometry with axial symmetry
about Z = 0,
- diffusion approximation,
- same spatial meshing and boundary conditions as the ones given in (1) and used throughout all the "fresh
core" spatial calculations (for the spatial meshing see
fig. 1.1 of "l"),

- multigroup data consistent with the data used for the fresh core conftyuration ca,l,culations, All the new isotopes
introduced with 'che burn-up calcuXations will be assumed to
be at llOO•‹K.
2.3 - Fresh core
The fresh core results, which are used here as
reference values with respect to the end of cycle core charac-
teristics, have already been calculated in (1). The results
which are needed for the present study are :
a) For the reference configuration (configuration 1
of (I), see p. 145 fig. A.l).
a.1 - Keff, a.2 - Reactor breeding ratio. as defined in
a.3 - Regional components of the (1) p. 156
breeding ratio,
a.4 - Internal breeding gain. as defined in (1)
a.5 - Blanket breeding gain. p. 161
a.6 - Total breeding gain. a.7 - Total radial and axial fission rate distri-
butions normalized such that the fission/cm3
sec is 1 at the core center.
a.8 - Radial and axial fission rate distributions for 239 Pu and 238 U separately with the same
normalization as for the total fission rate
distributions.
a.9 - Central reaction rate ratios. Per atom ratios of 238 capture to 239 Pu fission, 238 U
fission to 239 Pu fission, and 239 Pu capture
to 239 Pu fission at the core center.

b) Inner core sodium void worth (configuration 2
results, see (1) p. 147).
2.4 - End of cycle core
2.4.1 - End of cycle compositions -
The end of cycle core and blanket compositions will . be calculated according to the following procedure :
- the reactor will be divided into 25 zones according to the fig. 1,
- for each reactor zone, the end of cycle composition will be determined with 0 dimension calculations using the
spectrum and level corresponding to the flux averaged over
the zone and calculated for the fresh core reference configuration,
- for the end of cycle core parameter calculations, the isotopes the concentrations of which must be calculated
are :
. the pseudo fission product which represents the global capture due to the F.P. for fast breeders using
the mixed oxide fuel,
. the following heavy isotopes : 235 U, 236 U, 237 Np, 238 Pu,
238 U, 239 Np, 239 Pu, 240 Pu, 241 Pu, 242 Pu,
241 Am.
For the sake of simplicity, it will be admitted
here that all the 238 Pu obtained is issued only from the
235 U chain.
2.4.2 - Required results
- Using the fresh core flux spectrum at the core center, one will determine the one group cross-sections for
the following isotopes :

- F.P. (capture cross secti,on$) i 105 Pd, 101 Ru, 103 Rh,
99 Tc, 107 Pd, 149 Sm, 151 Sm, 147 Pn, 97 Mo, 145 Nd,
133 Cs, 135 Cs, 109 Ag, 103 Ru? 102 Ru, 153 Eu, 143 Nd,
104 Ru? 95 Mo, 100 Mo, 141 Pr, 155 Eu, 93 Zr.
- Pseudo fission product (capture cross section).
Heavy isotopes (capture and fission cros sections) :
235 U, 236 U, 237 Np, 238 Pu, 238 U, 239 Np, 239 Pu,
240 pu, 241 Pu, 242 Pu, 241 Am.
- The spatial calculations will be performed using the end of cycle compositions determined as described in •˜ 2.4.1 ;
but without recalculating nex multigroup data for the sake of
simplicity, excepted for the sodium void effect (see hereafber).
The results to be edited are :
Keff (1) corresponding to the end of cycle compo-
sitions for the whole reactor,
Keff (2) corresponding to the fresh core compositions
for the core zones and the end of cycle blanket compositions
for the blanket zones,
Keff (3) corresponding to the fresch core composi-
tions as to the heavy isotopes and including the pseudo P.F.
build up of each core zone, and to the fresh blanket compositions
for the blanket zones,
Keff (4) corresponding to end of cycle heavy isotope
composition for each core zone but without pseudo F.P. and to
the fresh:.:.blanket composition for the blanket zones.
These Keff values will provide :
The global reactivity loss per cycle :
'eff (1) - K~~~ for configuration 1
Keff for configuration 1
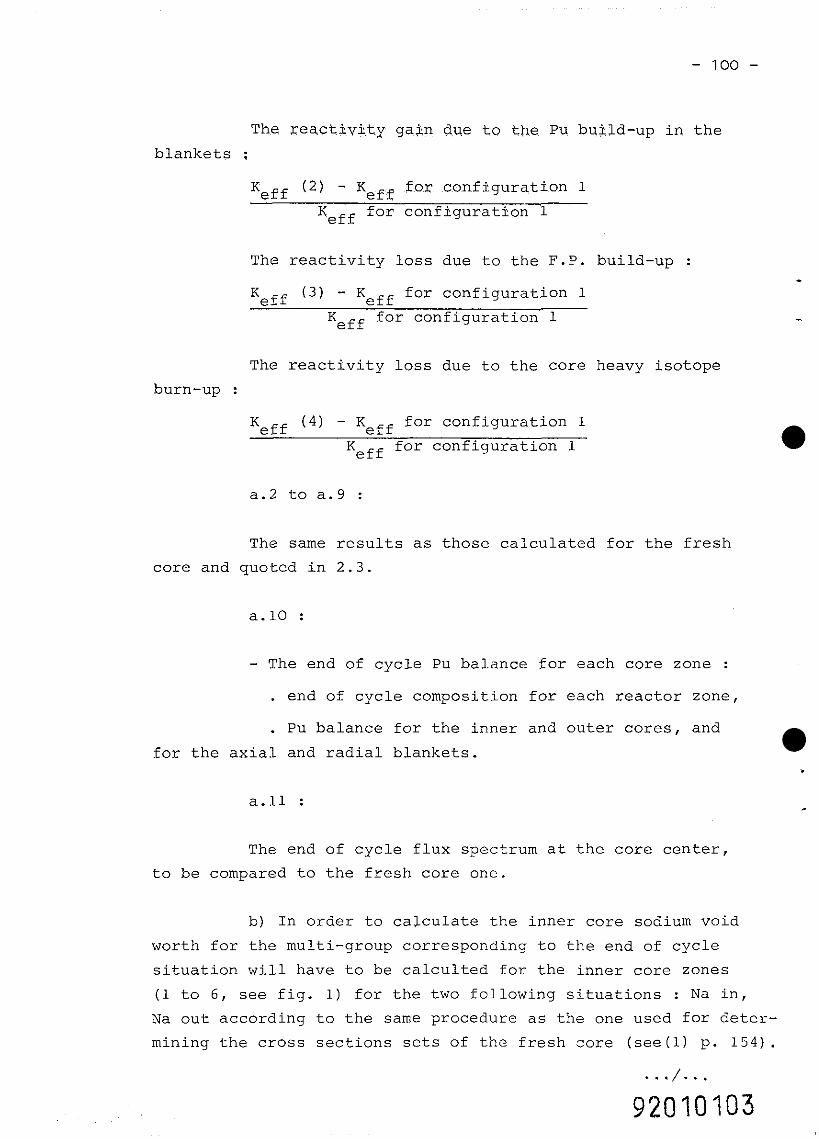
The reactivity ga$n due to the Pu build-up in the
blankets ;
'eff (2) - K~~~ for configuration 1 Keff for conflguration 1
The reactivity loss due to the F.P. build-up :
Keff ( 3 ) - Keff for configuration 1 Keff for configuration 1
The reactivity loss due to the core heavy isotope
burn-up :
Keff ( 4 ) - K~~~ for configuration 1
Keff for configuration 1
The same results as those calculated for the fresh
core and quoted in 2.3.
- The end of cycle Pu balance for each core zone : . end of cycle composition for each reactor zone, . Pu balance for the inner and outer cores, and
for the axial and radial blankets.
The end of cycle flux spectrum at the core center,
to be compared to the fresh core one.
b) In order to calculate the inner core sodium void
worth for the multi-group corresponding to the end of cycle
situation will have to be calculted for the inner core zones
(1 to 6, see fig. 1) for the two following situations : Na in,
Na out according to the same procedure as the one used for deter-
mining the cross sections sets of the fresh core (see(1) p. 154).


The i n n e r c o r e $odium void e f f e c t corresponding t o end
of c y c l e s i tua t%.on j;$ then c a l c u l a t e d accord ing t o t h e same
procedure a s t h e one used f o r t h e f r e s h c o r e ( s e e (1) p.157) ,
3 - IRRADIATED FUEL COMPOSITION -
For t h e i n n e r c o r e zone 1 ( s e e f i g . 1) a complete 0 . dimon- - s i o n c a l c u l a t i o n of t h e a c t i n i d e concen t r a t i on ( i . e . i n c l u d i n g
a l l t h e a c t i n i d e i s o t o p e s from 232 U t o 244 cm) a t t h e end 05
c y c l e w i l l be made us ing t h e zone 1 f r e s h co re averaged f l u x
(spectrum and l e v e l ) . The f i n a l c o n c e n t r a t i o n s of t h e s e i s o t o p e s
w i l l be d d i t e d . A t y p i c a l example of t h e a c t i n i d e cha in wich
can be used i s given on f i g . 2 .
a

(1) Proceedings of the NFACRPIXAEA Specfalists Meeting on the
Tnternational Comparfson Calculation df a Large Sddium-
Cooled F'ast Breeder Reactor at Argonne National Laboratory
on February 7-9, 1978.
L.G. LESAGE, R.D. Mc KNIGHT, D.C. WADE, K.E. FREESE, and
P.J. COLLINS.


Solution ,Label
ANL
AUSTRALIA
CEA-2
ENEA
EIR-1
JAERI
KFK- 1
KFK-2
KFK-3
UDAEA
USSR - -
APPENDIX XI
SOLUTIONS AND PARTICIPANTS
Country
USA
Australia
France
Italy
Switzerland
Japan
Federal Republi~ of Germany
id
id
United kingdom
USSR
Belgium
OECD
Data set (a)
ENDF/B-V
ENDF/B-IV
ARNAVAL IV
ENDB/B-IV
ENDF/B-IV
JENDL-1
KEDAK-3 (C,<
XFKINR
KFKINR (a)
FGL-5
BNAB-78 - -
Adjusted Solutfon author! and Meeting Attendees
H.HENRYSON, 11, J.R. LIAW
G.S. ROBINSON
L . MART IN-DEIDIEF G. PALMIOTTI, B. RUELLE, M. SALVATORES
P. AZZONI, R. MARTINELLI M. MARVASI, D. CEPRAGA M. PANINI
P. STILLER, W. HEER
M. NAKAGAWA H. YOSHIDA
C. BROEDERS, S SKI
A.T.D.BUTLAND, J. ROWLANDS, C.J. DEAN, C. R. EATON
Yu. KAZANSKIJ
K. DE WOUTERS
M.L. BARGELLINI
(a) FP data set origin given in table VIII, Part 11.
(b) Oxygen from ENDF/B-IV
(c) Revised KEDAK-3 values, slightly modified with respect to solution reported in ANL-80-78.
(d) see following table.

Library group number -
KFKINR
X
- X
-- --
Basic library data additional data:
KBDAK actinides
KEDAK fission products 2 )
ENDFIB-V group constants 3)
(R-2)-calculation Group number
KFKINR KFKINR
One-group calculations -- Spectrum zone-averaged Group number
Spectrum fundamental mode calculations for inner core Group number
Collapsed data: macroscopic group constants. Group number
Collapsed data: differential data from KEDAR
Applied code MIGROS 3 DXBURN DXBURN DXRURN
I) The KAlUSRUHE-I Solution in ANL-80-78is not identical with this library. The normalized inelastic scattering matrix of $38 has been recalculated. ,
2) K E D M evaluations by ECN-Petten 1
3) Group constant calculations by ECN-Petten
Summary of Karlsruhe solutions