ne thining in community corrections · ne thining in community corrections ... the criminal justice...
TRANSCRIPT

New Thinking in Community CorrectionsDECEMBER 2016 • NO. 3
VE RI TAS HARVARD Kennedy SchoolProgram in Criminal JusticePolicy and Management
Building Trust and Legitimacy Within Community Corrections Wendy Still, Barbara Broderick and Steven Raphael
Executive Session on Community CorrectionsThis is one in a series of papers that will be published as a result of the Executive Session on Community Corrections.
The Executive Sessions at Harvard Kennedy School bring together individuals of independent standing who take joint responsibility for rethinking and improving society’s responses to an issue. Members are selected based on their experiences, their reputation for thoughtfulness and their potential for helping to disseminate the work of the Session.
Members of the Executive Session on Community Corrections have come together with the aim of developing a new paradigm for correctional policy at a historic time for criminal justice reform. The Executive Session works to explore the role of community corrections and communities in the interest of justice and public safety.
Learn more about the Executive Session on Community Corrections at:
NIJ’s website: www.NIJ.gov, keywords “Executive Session Community Corrections”
Harvard’s website: http://www.hks.harvard.edu/criminaljustice/communitycorrections
Corrections in the United States
Over the past three decades, the U.S. incarceration
rate has increased to historic highs, while crime
rates have dropped significantly. Today, the U.S.
incarcerates more people than any other nation
in the world. In addition to the 2.3 million people
incarcerated in our nation’s jails and prisons, 4
million individuals are on probation or parole
at any given time. The individuals on probation
and parole — who represent the community
corrections system in America — are the largest
part of the correctional system. Yet, this aspect
of corrections has been largely absent from the
national conversation surrounding incarceration
rates and criminal justice reform — this despite
the fact that community corrections presents the
most obvious alternative to incarceration for many
and perhaps the best opportunity for reforming
the criminal justice system in ways that will
promote public safety, efficiency and fairness.
Similar to the growth of prison populations during
the past three decades, the number of individuals
on probation in the United States has also grown.
While there were 492 people on probation for every
100,000 U.S. residents in 1980, this figure peaked in

2 | New Thinking in Community Corrections
2007 at 1,425, and by 2014 had declined
slightly to 1,214 (see figure 1). With
nearly 4 million people on probation
at any given time, this represents the
largest correctional population in the
nation. Interestingly, long-term trends
in crime rates and arrests for serious
offenses should have militated toward
a smaller probation population. Arrests
for serious offenses are at historic lows,
especially for the relatively young.
Figures 2 and 3 compare the likelihood
of being arrested in 1980 and 2012, by
age, for violent and property index
offenses. While arrests for violent and
property offenses are somewhat higher
for individuals over 30, we observe
pronounced decreases in arrest rates
for younger individuals in the highest
risk age ranges. However, arrests for drug offenses
are up, way up, for all ages (figure 4) as are overall
arrests for non-index crimes (figure 5). On net, the
aggregate age-arrest profile changes very little
as increases in less serious arrests have offset the
decrease in arrests for more serious crime (figure 6).
With lower crime rates, these higher arrest rates for
lesser offenses likely reflect shifts in enforcement.
In conjunction with stiffer sentencing and net
widening in the application of probation sentences,
the proportion of U.S. residents on probation has
grown alongside the prison incarceration rate.
Figure 1. Correctional populations in the United States, per 100,000 U.S. residents, 1980-2014
Number per 100,000 residents
Probation Prison Parole Jail
0
500
1,000
1,500
1980 1990 2000 2010Year
Source: Bureau of Justice Statistics, Key Statistics at a Glance, accessed June 30, 2016, at www.bjs.gov/index.cfm?ty=kfdetail&iid=487.
Cite this paper as: Still, Wendy, Barbara Broderick and Steven Raphael. Building Trust and Legitimacy Within Community Corrections. New Thinking in Community Corrections Bulletin. Washington, D.C.: U.S. Department of Justice, National Institute of Justice, 2016. NCJ 249946.
Today, many states and the federal government
are reevaluating sentencing practices with the
goal of using incarceration more sparingly. Some
jurisdictions have scaled back their use of prisons
through shorter sentences and greater use of
alternative sanctions (for example, electronic
monitoring, probation, short sentences to county
jails). These reforms have been motivated in part
by cost and population pressures. California
provides perhaps the most salient example of a
state being forced by a federal court to reduce its
prison population to remedy overcrowded prison
conditions. Notably, at least nine other states face
capacity problems that would violate the conditions
placed on California’s prison system by a federal
court, suggesting that other states face the risk of
losing partial control of their prison systems through

Building Trust and Legitimacy Within Community Corrections | 3
prison overcrowding lawsuits. Beyond
such instances, other state reforms
have been motivated by concerns
regarding the differential impacts
of the criminal justice system on
minority communities, evidence of
diminishing returns to scale in terms
of the effectiveness of prison as a crime
control tool, and a notable shift in
public opinion regarding the proper
role and scale of the U.S. criminal
justice system.
Figure 2. Arrest rates for violent index offenses, by age, 1980 and 2012
Arrests per 100,000
1980 2012
0
200
400
600
800
10 20 30 40 50 60
Age
Source: Snyder, Howard N., and Joseph Mulako-Wangota, Arrest Data Analysis Tool, accessed June 30, 2016, at www.bjs.gov, Bureau of Justice Statistics, Washington, DC.
Figure 3. Arrest rates for property index offenses, by age, 1980 and 2012
Arrests per 100,000
0
1,000
2,000
3,000
4,000
10 20 30 40 50 60
1980 2012
Age
Source: Snyder, Howard N., and Joseph Mulako-Wangota, Arrest Data Analysis Tool, accessed June 30, 2016, at www.bjs.gov, Bureau of Justice Statistics, Washington, DC.
A New Focus on Community Corrections
To use incarceration more sparingly,
many jurisdictions are considering
g r e a t e r u s e o f c o m m u n i t y
corrections, probation diversions
in particular, for many individuals
who would otherwise have been
sentenced to incarceration. A shift
from incarceration to community
corrections could present numerous
opportunities for reform of the criminal
justice system as well as significant
challenges. This paper will discuss the
need for a new model for community
corrections that can improve public
safety while recognizing that people
on probation and parole are members
of the communities in which they live
and are supervised. A shift away from
incarceration will likely increase the
average severity of probation caseloads
and add considerably to the workload

4 | New Thinking in Community Corrections
of probation departments across the
country absent profound changes to
current practice.
We believe that substantial diversion
f rom pr ison sentences towa rd
community corrections is certainly
possible, likely to be more effective
in the long run, less socially harmful
than current practices, and may
even be cheaper. That being said,
such a change would require that
we deploy community corrections
resources with greater strategy and
efficiency. This means evaluating
how we do business today, investing
in practices that are proven to work,
and abandoning practices that are
ineffective. It also means strategically
directing resources for monitoring
and enforcement efforts to those
individuals who need them the
most. A more effective community
corrections system also will require a
shift in incentives, both for probation
departments as well as for those under
supervision.
Figure 4. Arrest rates for drug offenses, by age, 1980 and 2012
Arrests per 100,000
0
500
1,000
1,500
2,000
2,500
10 20 30 40 50 60
1980 2012
Age
Source: Snyder, Howard N., and Joseph Mulako-Wangota, Arrest Data Analysis Tool, accessed June 30, 2016, at www.bjs.gov, Bureau of Justice Statistics, Washington, DC.
Figure 5. Arrest rates for all non-index offenses, 1980 and 2012
Arrests per 100,000
1980 2012
Age
0
5,000
10,000
15,000
10 20 30 40 50 60
Source: Snyder, Howard N., and Joseph Mulako-Wangota, Arrest Data Analysis Tool, accessed June 30, 2016, at www.bjs.gov, Bureau of Justice Statistics, Washington, DC.
Six general principles form the bedrock
of this new model for community
corrections:
• Treat each individual on
community corrections with
dignity and respect. Recognize
our common human capacity both

Building Trust and Legitimacy Within Community Corrections | 5
to make mistakes and to make a change for the
better.
• Realign incentives in the criminal justice
system. Cost considerations at the local level
should not systematically favor incarceration over
alternative sanctions.
• Impose the least restrictive sanctions necessary,
and minimize the collateral consequences
associated with criminal processing and
conviction.
• Restore communities, and facilitate their
health and safety in a holistic way.
• Reduce institutional bias and work to ensure
that all individuals receive fair, equal access to
the justice system.
• Evaluate what we do, invest in more practices
that work, and abandon practices that do not.
From these principles follow several
concrete policy recommendations
that form the foundation of a new
model for community corrections.
These principles are enumerated
and explained below, grouped by
the objective to which they are most
closely related.
1. Treat each individual on community corrections with dignity and respect. Recognize our common human capacity both to make mistakes and to make a change for the better.
Common humanity and respect
must be the starting point for any
successful corrections model. This
mutual respect is the foundation for
the wellness of officers, the success of individuals on
our caseloads, and the trust and healing of victims.
Faith in people’s ability to change is foundational
to what we do, and much of our program support
is designed to facilitate changed behavior in
the individuals under supervision. Our focus is
rehabilitative, rather than punitive, and we strive to
facilitate improved outcomes both for people on our
caseloads and for their communities.
Recognizing that we all make mistakes yet are
capable of change for the better would give rise to
incentives that are (1) clear and predictable and
(2) graduated and fairly calibrated to the behaviors
we wish to encourage and those we wish to
discourage. Communicated clearly and acted upon
with certainty, a fair and certain incentive structure
ties an individual’s progress through community
corrections to their personal choices. Moreover,
Figure 6. Arrest rates for any reason, by age, 1980 and 2012
Arrests per 100,000
0
5,000
10,000
15,000
10 20 30 40 50 60
1980 2012
Age
Source: Snyder, Howard N., and Joseph Mulako-Wangota, Arrest Data Analysis Tool, accessed June 30, 2016, at www.bjs.gov, Bureau of Justice Statistics, Washington, DC.

6 | New Thinking in Community Corrections
graduating rewards and sanctions to reflect the
magnitude of one’s progress ensures that we do not
over-reward or over-penalize and, in the process,
short-circuit one’s rehabilitation.
There are numerous examples of incentives that
have been structured to reward positive and
discourage negative behavior, with appropriate and
proportionate consequences.
Examples include:
• Short or flash incarceration (currently in use in
California and extensively in the HOPE program
in Honolulu) for noncompliance has and can be
used as an effective deterrent.
• Altering the schedule of random drug testing
(moving toward lower or higher frequency)
can be used to reward compliance or intensify
scrutiny for those who continue to use.
• Fine structures can be tied to behavior, with fines
that decline (or previous balances forgiven) with
better behavior.
• Early release from probation can be granted for
those who signal true desistance or a very low
likelihood of further offending.
The final bullet point illustrates one of the hidden
benefits of a clear incentive structure that should
be taken advantage of in all community corrections
settings.1 In particular, a clear set of incentives that
require effort on the part of the person on probation
or parole can serve to triage a caseload beyond the
information available in a standard risk assessment.2
With this additional information, systems can better
target programming resources and monitoring
efforts toward those who pose higher risk of failure.
Moreover, better triaging would permit earlier
discharge of individuals who are unlikely to offend
in the future.
Take for example research f indings on the
relationship between time since conviction and
criminal desistance. Several facts have emerged
from this research. First, the likelihood of being
rearrested drops with time since conviction, with
particularly high risk early on. Second, roughly a
third of those with felony convictions will have no
further interaction with the criminal justice system.
Third, it appears to be the case that with time, the
offending rate of those with criminal histories
eventually declines to the rate of those who have
never been to prison. At present, there are only a
few research papers that attempt to estimate this
threshold. However, the findings to date suggest that
within seven to 10 years, the arrest and conviction
rates of those with felony convictions fall to that of
the general population.3
Assume for the moment that those who do not
reoffend for seven years are fundamentally different
from other convicted people who are placed in
community corrections supervision. Criminologists
refer to such individuals as immediate desistors. If
we knew who these individuals were, we could
concentrate our monitoring resources elsewhere
and focus more traditional workforce development
efforts on this very low-risk group, and for a much
shorter time. If we rely solely on recidivism outcomes
and time since release, we will have to wait seven to
10 years to identify such individuals. However, what
if we could use a clear set of incentives to identify
these individuals sooner? More specifically, could we

Building Trust and Legitimacy Within Community Corrections | 7
create a structure that would allow these compliant
immediate desistors to credibly identify themselves?
This line of thinking was recently articulated in
an article by the criminologists Shawn Bushway
and Robert Apel (2012). The authors argue that
policymakers should strive to create avenues
through which immediate desistors can signal to
corrections officials, parole and probation officers,
or employers that they are low risk and deserving of
early release, greater latitude while in community
corrections, or better chances at procuring
employment. Of course, the avenues for providing
such a signal must be costly to the individual who is
incarcerated, on probation or recently released from
incarceration. If not, all releasees would signal that
they were immediate desistors and attempt to reap
the benefits associated with the label (and ultimately
undermine the credibility of the signal). Alternatively,
if acquiring the signal requires real effort on the part
of the person in question (for example, participation
and successful completion of an education program,
honest efforts and success at complying with the
requirements of a transitional jobs program), only
those who are truly willing and able will send the
signal in question.
One potentially fruitful source of a credible signal
that has been overlooked by researchers concerns
successful program completion. Bushway and Apel
argue that many reentry programs, transitional
employment programs in particular,4 generate
substantial value in improving information about
individual recidivism risk precisely through the
signals that a successful program completion
sends. While comparing recidivism outcomes for
program completers to those who do not complete
the program is likely to provide biased estimates of
the effectiveness of the program due to selection,
selective sorting of those in community corrections
is exactly what we need to effectively triage caseloads.
With this in mind, we should harness the value of
such service providers as screeners and identifiers
of good bets for less restrictive conditions or perhaps
for early release from conditional supervision. One
can certainly imagine many arrangements that
may allow those who have decided to pursue a law-
abiding path to self-identify. For example, completion
of a demanding job-training program, substantive
educational achievements, demonstrable good
behavior while incarcerated, demonstrable efforts
and success at victim restitution, and abstaining
from drug use may all serve such a role.
Across all jurisdictions, our focus should be
on achieving better outcomes. The structure of
supervision — both in the community and in
incarcerative settings — should be based on
how best to rehabilitate people involved with the
criminal justice system in order to have healthier
communities and healthier community members.
By providing opportunities and incentives for positive
behavioral changes while holding individuals
accountable, and using what individuals reveal about
themselves to better triage community corrections
populations, community corrections systems can
deploy their resources with greater efficacy.
2. Realign incentives in the criminal justice system. Cost considerations at the local level should not systematically favor incarceration over alternative sanctions.
Counties across the country face incentives for
sending convicted people to prison whenever
8 | New Thinking in Community Corrections
possible. In many instances, this leads to prison
spells for relatively low-risk individuals who could
be successfully managed in the community at lower
social cost.5 At the county level, a local person who
has been convicted and sent to state prison becomes
the state’s financial problem. The marginal cost to
the county of committing an additional incarcerated
person is effectively zero, while the marginal benefit
(in terms of criminal incapacitation and savings
in policing and monitoring) can only be positive.
While others may bear significant costs, the local
jurisdiction does not.
We know that the actual budgetary costs of a prison
sentence exceed the costs of sentencing someone to
probation. The net social costs of these alternatives
depend on the extent to which incarceration would
prevent recidivism. It is certainly the case for some
individuals convicted of crime that the added costs
associated with incarcerating that person are worth
it once one takes into account the crimes that are
prevented as a result. However, for lower risk people
who can be successfully managed in the community,
the net social costs of less-restrictive sentencing are
likely to be lower relative to a prison term.
We should strive to align local cost incentives with
the actual net social costs of alternative forms of
punishment. If counties were made to face some
portion of the marginal costs generated by each
prison admission, one might expect local officials
to be more selective in whom they send to prison
and for how long. In legal parlance, wobblers are
offenses that can be charged either as misdemeanors
or felonies, with only the latter eligible for prison
time. If local officials face some portion of the costs
of sending someone to prison, wobblers may be more
likely to be charged as misdemeanors. Moreover,
those individuals who appear to be wobbling
between a sentence of probation and prison (of
course, a broader definition of a wobbler) may be
more likely to receive the probation sentence when
the county stands either to lose (if faced with a tax) or
gain (if presented with the prospect of sharing in the
resultant cost savings) from such a sentence.
The recent experience of California illustrates both
the great heterogeneity across counties in their use
of state prison systems as well as the existing room
to bring down prison populations by getting the
incentives right. California’s prison realignment
reform, implemented in October 2011, stopped
the practice of revoking people on parole back to
prison for technical violations and diverted other
people convicted of low-level offenses to serve their
sentences in local jails or in some form of community
corrections-based alternative sanctions. Prior to the
passage of this reform, the rate at which counties
incarcerated their residents in state prisons varied
dramatically, from below 200 per 100,000 residents
in counties such as San Francisco to more than 800
and even 1,000 per 100,000 in counties in the state’s
Central Valley. Figure 7 presents a scatter plot of
the change in each county’s prison incarceration
rate between June 2011 (four months prior to
the reform) and June 2012 (nine months into the
reform period) against each county’s pre-reform
incarceration rate in June 2011. The pattern in the
figure is very clear. Those counties that experienced
the greatest reduction in their incarceration rates
as a result of the reform are the counties with the

Building Trust and Legitimacy Within Community Corrections | 9
highest pre-reform incarceration
rates. Since the reform essentially
scaled back the incarceration
of people convicted of low-level
crimes, this is clear evidence that
the high-incarceration counties
tend to punish low-level people
with prison with relatively greater
frequency.6
A side f rom demonst rat i ng
r o om for de c l i ne, re c ent
reforms in California have also
demonstrated that counties can
be quite responsive to both fiscal
carrots and sticks. Reform to the
state’s juvenile justice system
provides a vivid example of the
latter. In 1996, the state legislature
passed a bill that greatly increased the monthly
costs for juvenile admissions to the California Youth
Authority (CYA), the agency that ran the state’s
juvenile corrections facilities at the time. Prior to
this legislation, counties paid $25 per month per
CYA ward. Starting in 1997, the monthly payment
increased to $150 per month for youth adjudicated
for serious crimes. For youth adjudicated for less
serious crimes, counties were required to pay from
50 to 100 percent of the custody costs to the state.
Subsequent legislation passed in 1998 capped the
counties’ maximum annual per-ward payment at
$31,200. Nonetheless, for all juvenile commitments,
and especially for less serious crimes, the increased
costs to counties created by the reform were quite
substantial (California Youth Authority, 2000).
Figure 8 displays annual admissions to CYA
institutions between 1980 and 2009. A vertical line
is drawn indicating the last year (1996) preceding
the increase in county costs for youth commitments.
The results of the reform are self-evident. There is
an immediate and sustained drop in admissions
to CYA beginning in 1997. To be sure, there have
been other reforms over the years that have
reduced youth admissions and the population of
incarcerated youth further. Additional legislation
passed in 1996 facilitated the transfer of incarcerated
youth convicted in criminal court to adult prisons
if they would not complete their sentences before
age 21. In addition, a state ballot initiative passed
in 2000 increased the proportion of youth charged
with serious crimes tried in adult criminal courts
to those receiving lengthy sentences and admitted
directly into adult prisons. However, these
Figure 7. Change in county-level incarceration rates from June 2011 to September 2012 compared to the county’s incarceration rate in June 2011 for California counties
Change in incarceration rate, June 2011 to September 2012
Incarceration rate, June 2011
-200
-160
-180
-120
-140
-100
-60
-80
-20
-40
0
0 200 400 600 800 1,000 1,200
Source: Lofstrom, Magnus, and Steven Raphael. (2015). “Incarceration and Crime: Evidence From California’s Realignment Sentencing Reform.” IZA Working Paper #7838. Bonn, Germany: IZA.

10 | New Thinking in Community Corrections
provisions apply to a small proportion
of convicted youth in the state, with the
lion’s share of the declining admissions
evident in figure 8 driven by the new
costs of admissions faced by counties.
E v i d e n c e o f t h e c o u n t i e s ’
responsiveness to positive incentives
can also be found in the evaluation of
the California Community Corrections
Performance Incentives Act of 2009
(California Administrative Office
of the Courts, 2012). The act created
a mechanism by which the state
shares with the county any cost
savings associated with reductions
in incarceration driven by lower rates of probation
failures. The county probation department must
employ evidence-based community supervision
practices and bring down probation failure rates
and admission to prison to below a benchmark
rate measured for the three-year period preceding
the legislation’s passage. In the three years since
implementation, probation failure rates have
declined by 33 percent.
These policy examples suggest a reform option for
reducing incarceration and fostering efficiency
in the use of existing prison capacity. A change in
policy that ensures that counties have some “skin
in the game” is likely to unleash efforts at the local
level to be more sparing in the use of incarceration,
especially for relatively low-risk individuals. Of
course, one would not want to punish poorer
counties with an intergovernmental finance
structure that charges higher fees to areas with
demographics and other local conditions that lead to
higher crime rates. However, some creative thinking
could certainly generate schemes that better target
incentives regarding marginal cases and that
perhaps combine an implicit tax on counties with a
corresponding transfer that leaves county budgets
whole while discouraging excessive admissions to
the state prisons.
For instance, the CYA fee structure in the example
above nominally increased the cost for the most
serious individuals. In other words, the state still
picked up the tab for those committing the most
serious offenses where diversion to an alternative
non-incarceration punishment was simply out of
the question. One could imagine a scheme that
levied differential tax rates that increase as offense
severity (and perhaps the severity of an individual’s
criminal history) decreases and that increase for
offenses where there is the greatest degree of cross-
jurisdiction heterogeneity in the proportion of
people sent to prison.
Figure 8. Annual admissions to California Youth Authority state institutions, 1980-2009
Annual admissions to California Youth Authority
0
500
1,000
1,500
2,000
2,500
3,000
3,500
4,000
4,500
1980 1985 1990 1995 2000 2005
< Last year before cost-sharing requirement imposed on counties
Source: Raphael, Steven, and Michael Stoll. (2013). Why Are So Many Americans in Prison? New York, NY: Russell Sage Foundation.
Building Trust and Legitimacy Within Community Corrections | 11
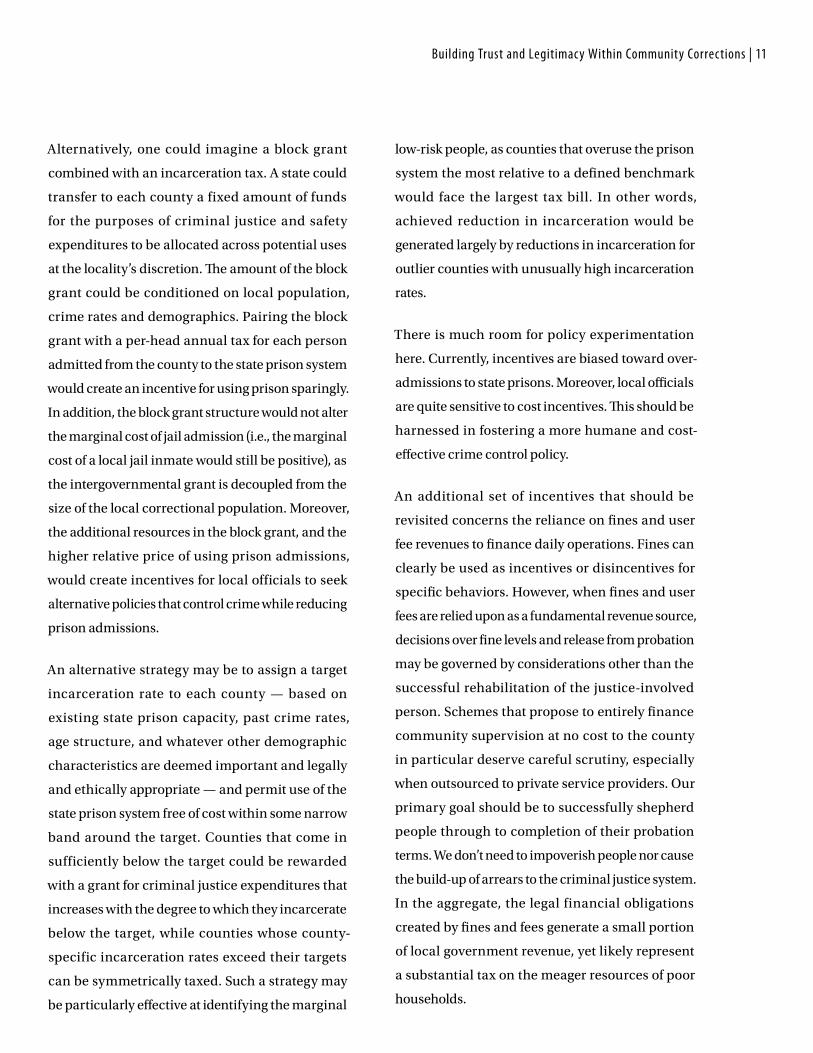
Alternatively, one could imagine a block grant
combined with an incarceration tax. A state could
transfer to each county a fixed amount of funds
for the purposes of criminal justice and safety
expenditures to be allocated across potential uses
at the locality’s discretion. The amount of the block
grant could be conditioned on local population,
crime rates and demographics. Pairing the block
grant with a per-head annual tax for each person
admitted from the county to the state prison system
would create an incentive for using prison sparingly.
In addition, the block grant structure would not alter
the marginal cost of jail admission (i.e., the marginal
cost of a local jail inmate would still be positive), as
the intergovernmental grant is decoupled from the
size of the local correctional population. Moreover,
the additional resources in the block grant, and the
higher relative price of using prison admissions,
would create incentives for local officials to seek
alternative policies that control crime while reducing
prison admissions.
An alternative strategy may be to assign a target
incarceration rate to each county — based on
existing state prison capacity, past crime rates,
age structure, and whatever other demographic
characteristics are deemed important and legally
and ethically appropriate — and permit use of the
state prison system free of cost within some narrow
band around the target. Counties that come in
sufficiently below the target could be rewarded
with a grant for criminal justice expenditures that
increases with the degree to which they incarcerate
below the target, while counties whose county-
specific incarceration rates exceed their targets
can be symmetrically taxed. Such a strategy may
be particularly effective at identifying the marginal
low-risk people, as counties that overuse the prison
system the most relative to a defined benchmark
would face the largest tax bill. In other words,
achieved reduction in incarceration would be
generated largely by reductions in incarceration for
outlier counties with unusually high incarceration
rates.
There is much room for policy experimentation
here. Currently, incentives are biased toward over-
admissions to state prisons. Moreover, local officials
are quite sensitive to cost incentives. This should be
harnessed in fostering a more humane and cost-
effective crime control policy.
An additional set of incentives that should be
revisited concerns the reliance on fines and user
fee revenues to finance daily operations. Fines can
clearly be used as incentives or disincentives for
specific behaviors. However, when fines and user
fees are relied upon as a fundamental revenue source,
decisions over fine levels and release from probation
may be governed by considerations other than the
successful rehabilitation of the justice-involved
person. Schemes that propose to entirely finance
community supervision at no cost to the county
in particular deserve careful scrutiny, especially
when outsourced to private service providers. Our
primary goal should be to successfully shepherd
people through to completion of their probation
terms. We don’t need to impoverish people nor cause
the build-up of arrears to the criminal justice system.
In the aggregate, the legal financial obligations
created by fines and fees generate a small portion
of local government revenue, yet likely represent
a substantial tax on the meager resources of poor
households.
12 | New Thinking in Community Corrections
A recent study of 15 states by the Brennan Center
for Justice documents the reach and cumulative
effects of fines and user fees on individuals who
become involved with the criminal justice system
(Bannon, Negrecha and Diller, 2010). In addition
to documenting a wide range of user fees and
fines that add considerably to the debts of people
recently released from prison as well as those on
probation, the study notes the extensive use of
criminal justice resources (for example, probation
and parole officer time, the issuing of warrants,
court hearings, and incarceration as punishment
for failure to pay) devoted to collecting outstanding
criminal justice debts. In many instances, sanctions
for failure to pay are in direct conflict with efforts
toward productive reentry into society. For example,
several states revoke driver’s licenses for failure to
pay, a sanction that likely has a negative effect on
future employment prospects. Moreover, many
states use outstanding debt as a criterion in deciding
whether to release someone from parole or probation
supervision, surely bloating caseloads beyond
what is needed for maintaining public safety. The
incentives that over-reliance on fines and user fees
create for community corrections systems, as well
as for people under community supervision, require
careful reevaluation.
To the best of our knowledge, it is impossible to
tally total fines and fees paid by the poor and the
outstanding legal financial obligations in the
U.S., let alone the distribution of the arrearages
across households and individuals of different
socioeconomic status levels.7 Given the observable
differences in who is involved with the criminal
justice system, however, we would guess that
the distribution of outstanding legal financial
obligations is heavily skewed toward low-income
minority males and disproportionately impacts
the budgets of low-income minority households.
We can, however, provide a rough estimate of
annual payments for fines and fees collected by
various levels of government using the 2012 Census
of Governments: State and Local Finances data
collected by the U.S. Census Bureau. The data include
revenue and expenditure totals by category for each
municipality in the country. Revenue category “U30:
Fines and Forfeits” provides our proxy.8 This revenue
source totaled $5.6 billion for municipalities and
townships in 2012, and $2.8 billion for counties,
giving total fine and forfeit revenue of $8.4 billion
to county and local governments. States report an
additional $6.8 billion in fine and forfeit revenue.
Hence, we observe total fine and forfeit revenue of
$15.3 billion for fiscal year 2012.9
Is this a large amount? This depends, of course,
on the extent to which this is generated from
sanctioning low-income households. Assuming
that most of this burden falls on poor households,
one might compare these fine and fee revenues to
various income sources. For example, the Brookings
Tax Policy Center estimates that in 2012 roughly 57
percent of Earned Income Tax Credit (EITC) benefits
were accrued in households with cash incomes of
$20,000 or less.10 With total EITC expenditures of
roughly $60 billion, this implies an income transfer
to these low-income households of roughly $34.2
billion. Hence, the fine-and-fees total amounts
to roughly 45 percent of the income transferred
to poor households11 via the EITC and roughly 25
percent of EITC expenditures more generally. We

Building Trust and Legitimacy Within Community Corrections | 13
could alternatively compare fine and fee revenue
totals to total incomes for low-income households.
The Census Bureau estimates a mean household
income for the bottom quartile of households in
2012 of $11,490.12 With 24.4 million households in
the bottom quintile, this implies a total income of
roughly $281.4 billion. Fine and forfeit revenues
amount to 5.4 percent of total income for bottom-
quintile households.
To be sure, we can only speculate about who pays
these fines and fees. It is certainly the case that
some of this revenue is generated by fines and fees
levied on higher income households. Moreover,
we should note that as a proportion of total local
government revenues, fines and forfeits constitute
a minor revenue source (though as the recent
case of Ferguson illustrates, this is not always the
case).13 Nonetheless, given the socioeconomic
and demographic characteristics of who becomes
involved with the criminal justice system, these
fines and fees must certainly fall disproportionately
on poor households. The expansion of the criminal
justice system along with the increasing use of
these fines — likely driven, in part, by the costs of
this expansion — are imposing a significant and
regressive implicit tax. In imagining the future
of community corrections, we should strive to
not increase socioeconomic inequality through
regressive taxation in the pursuit of public safety.
3. Impose the least restrictive sanctions necessary, and minimize the collateral consequences associated with criminal processing and conviction.
We should limit the use of incarceration (both
pre- and post-trial) to those who cannot be safely
supervised in the community. The collateral
consequences of a criminal conviction and, in
particular, a spell of incarceration are many. Some of
the socioeconomic domains explored by researchers
include the following.14
Post-release employment prospects
Holzer, Raphael and Stoll (2006) document an
extreme reluctance among employers with regard
to their willingness to hire formerly incarcerated
people. In addition, Raphael (2011) documents that
a high proportion of employers of relatively less
skilled workers in California indicate that they are
legally proscribed from employing people convicted
of felonies. The audit research by Pager (2007) and
Pager, Western and Bonikowski (2009) documents
that this stated employer reluctance translates into
large differences in job offer rates, with particularly
low job offer rates for African-Americans with
criminal records. Western (2002) finds that prior
incarceration has long-term negative effects on
future employment and earnings.
Health consequences for formerly incarcerated people and the communities from which they come
Schnittker, Massoglia and Uggen (2011) provide a
recent survey of research linking mass incarceration
to health outcomes and health disparities. Some of
the research reviewed actually finds that a spell in
prison improves access to health care, as many of
those who are incarcerated lack health insurance
and likely underutilize the health resources that
are available to them. However, there are also key
research studies that find evidence of within-prison
transmission of infectious disease (hepatitis in
particular) and transmission of infectious disease

14 | New Thinking in Community Corrections
through various channels in the communities from
which incarcerated individuals disproportionately
come. Moreover, Schnittker, Massoglia and Uggen
(2011) review several studies finding evidence of
unusually high levels of disability and stress-related
illness among formerly incarcerated individuals. To
be sure, the health effects of the massive increase
in incarceration rates extend beyond direct effects
on currently and formerly incarcerated people.
Wildeman (2012) finds discretely higher infant
mortality rates among newborns with incarcerated
fathers who have no pre-incarceration history of
domestic abuse. Moreover, the increased stress
and reduced resources associated with having
an incarcerated partner, son or father may be a
factor in the relatively poor cardiovascular health
outcomes for African-American women (Hedwig
and Wildeman, 2013).
The children of the incarcerated
More than 50 percent of men in state prison and 60
percent of women in state prison are the parents
of children younger than 18 years of age (Glaze
and Maruschak, 2010). Among the age groups that
make up the bulk of the prison population (25 to
34 and 35 to 44), the proportion that are parents is
considerably higher, with the figure reaching 80
percent among women in state prison between
ages 25 and 34. Wildeman (2009) provides the most
authoritative assessment of the risk of experiencing a
parental incarceration for children born in 1978 and
1990. For the 1990 birth cohort, 1 in 4 black children
and 1 in 25 white children experienced a parental
incarceration by the age of 14. Among black children
born to high school dropout parents, half experience
a parental incarceration by this age. A parental
incarceration certainly impacts the material well-
being of children. Johnson (2009) analyzes how the
household incomes and poverty rates of children
born between 1985 and 2000 were impacted by
paternal incarceration using longitudinal data. In
the year prior to a father’s incarceration, average
annual household income in 1997 dollars stood
at $38,960. During the period of incarceration,
average annual household income dropped by
nearly $9,000. Concurrently, the proportion of these
children living in households below the poverty line
is 22 percent prior to the father’s incarceration and
nearly 31 percent during the father’s incarceration.
There is also evidence of increased behavioral
problems among children with an incarcerated
parent. Wildeman (2010) analyzes the effect of
parental incarceration on aggressive behavior
among very young children. The author finds that
aggressive behavior increases among young boys
with incarcerated fathers. Moreover, this increase in
externalizing behavior is concentrated among young
children of men who have not committed violent acts
and who are not abusive within their households.
To be sure, one would expect heterogeneity in the
effect of parental incarceration. In some instances, a
parent’s removal from the home may be stabilizing
and salutary to the extent that the parent is abusive,
or the parent’s absence may tax the household’s
resources. In addition, research on this topic faces
the fundamental challenge of contending with the
myriad factors that likely influence child outcomes
and that are correlated with a parental incarceration
(for example, poverty, drug use and exposure to
violence). In fact, Wakefield and Wildeman (2014)
provide evidence of such heterogeneity. This being
said, our criminal justice system has expanded over

Building Trust and Legitimacy Within Community Corrections | 15
the past three decades toward punishing less serious
offenses more severely. In essence, the disruptions
caused by incarceration impact more children than
ever before.
Political participation
In many states, individuals with an active criminal
justice status are denied the franchise of voting.
According to a report by The Sentencing Project
(2016), 48 states and the District of Columbia prohibit
voting while incarcerated. In addition, 34 of these
states do not allow those on parole to vote, and 30
states prohibit voting among those on probation.
Four states prohibit voting among all people
convicted of felonies, even after having completed
their sentences.15 The Sentencing Project estimates
that 1 in 40 adults is unable to vote either due to
current involvement with the criminal justice system
or due to a lifetime ban for a prior felony conviction.
Roughly 8 percent of adult African-Americans
are currently disenfranchised, and in three
states, over 20 percent of adult African-Americans
are disenfranchised. There is at least one study
(Uggen and Manza, 2002) that finds evidence that
disenfranchisement of people convicted of felonies
may alter electoral outcomes in very close races.
Racial inequality
As is evident in each domain discussed here,
the disproportionate representation of African-
Americans in the nation’s prisons and jails,
African-American males in particular, translates
directly into racial disparities in the collateral
consequences of incarceration growth. Given the
order of magnitude of incarceration growth over the
past three decades, the criminal justice system has
become a very important factor in aggravating racial
inequality across multiple domains.
The above list largely ref lects the longer term
effects of a conviction and a spell of incarceration
operating through social stigma as well as the effects
of being physically removed from society during
formative years when others are establishing lives
for themselves. However, there is some suggestive
evidence that the process itself unleashed by a felony
arrest and charge is disruptive and creates problems
that then need to be remedied by community
corrections. For example, many researchers
studying the employment consequences of having
served a prison sentence have documented a strange
pattern in administrative employment data. To
be specific, starting three to four quarters before
one’s admission to prison, several researchers have
documented a decline in quarterly employment
rates and earnings in several states (see Kling, 2006;
Pettit and Lyons, 2007; Sabol, 2007). One theory
consistent with this pattern is that some personal
crisis causes both job loss and criminal activity. Or a
lost job may have propelled the individual toward the
felony that resulted in a prison spell. An alternative
interpretation of this pattern is that the arrest itself,
and all that follows prior to a prison admission,
has a negative effect on labor force participation,
employment and earnings.
In fact, a recent study by Charles Loeffler at the
University of Pennsylvania suggests that the latter
explanation is the correct one. Loeff ler (2013)
matched conviction and arrest data from the Circuit
Court of Cook County, Illinois, to quarterly earnings
data from the state’s unemployment insurance
system. Focusing specifically on individuals who

16 | New Thinking in Community Corrections
were ultimately sentenced to prison, Loeff ler
analyzes how quarterly employment rates (measured
as having any positive earnings in a formal job
during the quarter) evolve in the time period leading
up to incarceration. Loeffler’s innovation is that he
is able to observe the date of arrest for the offense
leading to the prison sentence, and thus can assess
whether the extent to which the employment decline
documented by many researchers pre-dates that
actual offense generating the arrest.
Loeff ler’s findings are succinctly displayed in
figure 9. The figure shows the employment rates
of soon-to-be incarcerated people in the quarters
approaching their quarter of incarceration (set to
zero along the horizontal axis) as well as the quarter
approaching the arrest for the conviction resulting
in the prison sentence (also set to zero but measured
by the lighter shaded line). There are
several notable patterns in this figure.
First, the employment rates of these
individuals are dismally low, with
never much more than 25 percent
registering positive earnings in the 15
quarters preceding their incarceration.
Second, the employment patterns prior
to incarceration are consistent with the
findings from prior research, showing
substantial declines in employment
especially during the year prior to
the prison admission. Finally, nearly
all the employment decline follows
the date of arrest (or alternatively, we
see little decline in the measured
employment rate in the quarters prior
to being arrested). Hence, the steep
pre-incarceration rate declines in employment
appear to be driven by the processing of the felony
(i.e., the pretrial detention, court hearings, etc.).
While we are unaware of a comparable analysis
of individuals who are ultimately sentenced
to probation, one would imagine that pretrial
detention and court proceedings may hinder
employment among those charged with serious
offenses who are ultimately sentenced to jail, to
jail with probation, or to a straight probation term.
We tabulated data from the State Court Processing
Statistics 1990 to 2002 Felony Defendants database
to gauge the extent to which felony defendants who
are ultimately sentenced to probation fail to make
bail, be released on their own recognizance, or be
released under some form of supervised release
program. Roughly 53 percent of those charged with
Figure 9. Path of employment rates in quarters leading up to arrest and quarters leading up to admissions to prison, estimated in Loeffler, 2013
Percent with non-zero reported earnings
Time from sentence to imprisonment Time from arrest leading to imprisonment
Synthetic time
0
5
10
15
20
25
30
0-1-2-3-4-5-6-7-8-9-10-11-12-13-14-15
Source: Loeffler, Charles E. (2013). “Pre-Imprisonment Employment Drops: Another Instance of the Ashenfelter Dip?” Working Paper. Philadelphia, PA: University of Pennsylvania.

Building Trust and Legitimacy Within Community Corrections | 17
felonies who are ultimately convicted (of either a
felony or misdemeanor) are placed under local
probation jurisdiction (sometimes following a short
jail sentence). Of these, 34 percent are detained
pretrial.
An arrest and pretrial detention spell are
certainly likely to interrupt one’s life and create
an employment need, and perhaps a housing
need, that then must be remedied by the charged
person and in many instances their probation
officer. Moreover, a criminal conviction may have
long-lasting implications for future employment
prospects. With these collateral costs in mind, we
should limit the use of incarceration to those who
cannot be safely supervised in the community. This
stems from both our respect for the individual as
a community member and our commitment to
maximize the return on investment for each taxpayer
dollar. Incarceration is the most costly sanction, and
it is often not our most effective option because so
many jails and prisons do not have the extensive
rehabilitative programming necessary to meet all
the needs of their inmates. When incarceration must
be used, research tells us that short incarceration
spells, implemented with swiftness and certainty,
have greater impact than longer terms.16 Therefore,
we should work with our partner agencies to ensure
that sanctions are neither more severe nor greater in
length than they need to be to effectively achieve our
rehabilitative goals for an individual person.
In selectively using incarceration, we also believe
that this should apply to pretrial detention as well as
post-adjudication incarceration spells. Greater use of
validated risk assessment tools pretrial, and perhaps
more active monitoring of pretrial defendants
coupled with expanded use of supervised pretrial
release may minimize the adverse effects of case
processing on employment.
4. Restore communities, and facilitate their health and safety in a holistic way.
We must recognize that people charged with crimes
are community members and that our ultimate goal
is to restore these individuals to productive roles.
This community perspective requires us to view
public safety differently. Typical views of public
safety have considered keeping the community
safe as a function of protecting it from people who
commit crime, rather than recognizing that nearly
all people charged with crimes will eventually
return to community settings and become a part of
those settings. We are concerned with the justice-
involved person, not just as an individual but as a
community member and potential neighbor. In this
view, the health and safety of the community are
inseparable from the health and safety of the person
on our caseload.
In order to assist the individual in taking on
productive roles in their family, neighborhood
and larger community, we reiterate that we need
to reduce the collateral consequences of criminal
convictions, as well as barriers to reintegration and
rehabilitation, when public safety is not otherwise
compromised. We know that even those who are
rejoining the community in a healthy way face
many barriers to obtaining housing, social services
and employment. Improved access to each of these
would increase public safety by helping individuals
build positive roles in their communities. Currently,

18 | New Thinking in Community Corrections
these barriers are both too high and too long lasting.
We know from Blumstein’s research (Blumstein
and Nakamura, 2009) on survival rates that an
individual’s risk of reoffending falls dramatically
after 10 or five or even three years, and yet people
who have been law-abiding citizens for a decade or
more still face difficulty obtaining work, housing
and social services.17 Community corrections should
serve as ambassadors to the business community
to help them view justice-involved individuals
differently. Moreover, if we are able to establish
credible screening practices whereby our clientele
may credibly signal their desistance from crime as is
discussed above, we can serve this intermediary role
for many in community corrections with confidence.
Internally, we should consider whether and how
formerly justice-involved people could use their
talents and experience in our own organizations.
When we consider the person under supervision
as a member of their community, rather than a
person who the community should be protected
from, it becomes clear that avoiding disruption
to employment, schooling, housing and families
will improve outcomes and save taxpayer dollars.
Therefore, we should adopt the lowest possible
sanction, and engage in restorative justice practices
where possible, to avoid such disruption and prevent
the individual from having to “reenter” their
community at all.
As such, we should offer opportunities for diversion,
starting at the point of arrest, based on an individual’s
amenability and qualifications for diversion, to
maximize alternatives to incarceration that protect the
public while holding individuals accountable. Models
of community courts and other restorative justice
practices have proved effective at providing services
while avoiding the cost and collateral consequences
of more traditional sanctions. By providing
alternative sanctions in community settings, we have
access to a broad range of services that can meet the
criminogenic needs of a particular individual without
being reliant on incarceration methods.
Include survivors and families
Because we strive to make communities whole, we
also recognize that survivors of crime are an integral
part of the justice process. Survivors have a role not
only in the procedural aspects of justice, through
restorative practices or providing impact statements,
but also as members of communities who also need
to be healthy and safe. We need to do right by the
survivors while being fair with people who commit
crimes. The latter requires that services should be
provided to help them rebuild strong and healthy lives.
Families of people charged with crimes, particularly
children, often suffer along with their family member
while the family member is involved in the criminal
justice system. Children of incarcerated parents are
at 2.5 to 3 times greater risk of becoming involved
with the criminal justice system themselves. In
this way, ensuring fair and effective treatment
not only impacts the life of the currently justice-
involved person but also the lives of the next
generation. We should recognize and strive to break
the intergenerational cycle of crime and incarceration
by strengthening families and addressing their
needs throughout the justice process. This requires
an approach that is responsive to families’ needs
and supports healthy family connections rather
than hindering them. Examples include adjusting

Building Trust and Legitimacy Within Community Corrections | 19
visitation and housing restrictions, as well as
providing supports to the individuals under our
supervision. Here again, we aim to provide the
lowest sanction that is safely possible, so that there
is as little negative disruption in the lives of families
as possible. Likewise, measures such as employment
training, education, public assistance, and the
removal of barriers to employment and housing
are all measures that can increase public safety by
helping justice-involved people build healthy lives
and take on supportive roles within their families.
5. Reduce institutional bias and work to ensure that all individuals receive fair, equal access to the justice system.
We recognize that a key aspect of treating individuals
with respect, dignity and a sense of community
is working to counteract injustices, rather than
perpetuating them. A key aim is to reduce
institutional bias and ensure that all individuals
receive fair, equal access to the justice system,
including opportunities for diversion and alternatives
to incarceration.
Part of the problem of institutional bias is that
each segment of the justice system can become
siloed, thereby worsening bias as an individual
moves deeper into the justice system. We know
that from the earliest points, the justice system has
disproportionate minority contact. From the pretrial
process onward, there are structural deficits that
perpetuate unnecessary disparities, especially for
low-income and minority communities.
We strive to lead organizations that will not only be
cognizant of such bias but work to combat it, both
within our own organizations and through our
collaboration with partners. To do so, we must have
strong, effective interagency collaboration to facilitate
a system-wide perspective. From that vantage point,
we can see certain values that should stretch
throughout the system if in fact our collective goal is
to facilitate the health and safety of our communities.
6. Evaluate what we do, invest more in practices that work, and abandon practices that do not.
Since our focus is on facilitating positive outcomes,
and to be prudent stewards of taxpayer dollars, we
should rely on data-driven decision-making and
evidence-based practices in order to provide the
most effective and efficient resources to people on
our caseloads, as well as to victims and communities.
We should implement science-based, data-driven
approaches, which yield better outcomes and reduce
future victimization over a punitive approach. As
part of this, decisions for sanctions, supervision level
and interventions should be based on an individual’s
risk level and treatment needs. If we don’t have the
ability to do some kind of assessment to determine
what problems that person is presenting with and
what needs they have, we will not be able to effect
any kind of change in that person’s life. Again, as
prudent stewards of public resources, we should
ensure that our resources are being applied to those
who pose the greatest risk to public safety, but also in
the most effective manner possible. Evidence-based
assessments provide the data with which we can do
such targeting of resources.
A focus on outcomes does not simply mean reduction
in recidivism or victimization, although those are
important goals. Inherent in achieving them, though,
are more basic outcomes in the lives of people involved

20 | New Thinking in Community Corrections
SUMMARY OF CORE PRINCIPLES AND PROPOSED POLICY SUGGESTIONSPrinciple 1: Treat each individual on community corrections with dignity and respect. Recognize our common human capacity both to make mistakes and to make a change for the better.
• Create a set of incentives that is (1) clear and predictable, yet (2) graduated and fairly calibrated to the behaviors we wish to encourage and those we wish to discourage.
• Create mechanisms that permit those who are highly likely to be immediate desistors to credibly signal who they are.
Principle 2: Realign incentives in the criminal justice system. Cost considerations at the local level should not systematically favor incarceration over alternative sanctions.
• Cost incentives faced by local criminal justice systems (counties) should reflect actual social cost differentials associated with alternative sanctions.
• User fees and fines that arrest the rehabilitation and reentry process should be reevaluated or abandoned.
• Revenue incentives should not drive probation and parole release decisions.
Principle 3: Impose the least restrictive sanctions necessary, and minimize the collateral consequences associated with criminal processing and conviction.
• Limit the use of incarceration to those who cannot be safely monitored in the community.
• Base decisions for sanctions, supervision level and interventions on an individual’s risk level and treatment needs.
Principle 4: Restore communities, and facilitate their health and safety in a holistic way.
• Reduce the collateral consequences of criminal convictions, as well as barriers to reintegration and rehabilitation, when public safety is not otherwise compromised.
• Avoid disruption to employment, schooling, housing and families to improve outcomes and save taxpayer dollars.
• Offer opportunities for diversion, starting at the point of arrest, based on an individual’s amenability and qualifications for diversion — to maximize alternatives to incarceration that protect the public while holding individuals accountable.
• Recognize that survivors of crime are an integral part of the justice process.
• Recognize and strive to break the intergenerational cycle of crime and incarceration by strengthening families and addressing their needs throughout the justice process.
Principle 5: Reduce institutional bias and work to ensure that all individuals receive fair, equal access to the justice system.
• Reduce institutional bias and ensure that all individuals receive fair, equal access to the justice system, including opportunities for diversion and alternatives to incarceration.
• Build strong, effective interagency collaboration to facilitate a system-wide perspective.
Principle 6: Evaluate what we do, invest more in practices that work, and abandon practices that do not.
• Implement science-based, data-driven approaches, which yield better outcomes and reduce future victimization over a punitive approach.

Building Trust and Legitimacy Within Community Corrections | 21
in the criminal justice system. Housing, employment,
physical and mental health, and positive relationships
are all components of a productive and crime-free
life. Policies that limit access to social services on the
basis of criminal convictions are destructive to public
safety because they remove crucial sources of support
for justice-involved people who are in the process of
rebuilding their lives. These collateral consequences
also go against our first core value of the dignity of
individuals and their ability to change.
Endnotes
1. The following few paragraphs draw heavily from
Raphael (2014).
2. There are several static and dynamic risk factors
that are significantly predictive of future offending.
However, measures of goodness of fit for several
standard risk assessment tools reveal that these
actuarial predictions are far from deterministic. In
other words, within each risk category there is a fair
amount of unexplained variation in actual future
offending. With this in mind, the information that
is revealed by one’s behavior over time provides a
chance to improve our assessment of the likelihood
of future offending.
3. See Blumstein and Nakamura (2009) and
Kurlycheck, Bushway and Brame (2012).
4. There is a growing body of experimental impact
evaluations (i.e., randomized control trials)
of various programs designed to improve the
employment prospects of former prisoners and
other high-risk individuals with an eye on reducing
recidivism (see Raphael, 2014). The results from these
evaluations are mixed, with some showing promise
and others showing disappointingly little impact
on future criminal offending. Nonexperimental
studies that simply compare program participants
to nonparticipants generally show large differences
in recidivism, with participants faring considerably
better. Such differences are also observed within the
programs subject to randomized control evaluations.
For example, of those participants in New York’s
CEO program who worked four quarters and were
successfully placed in an unsubsidized job, only 10
percent were arrested, convicted or incarcerated
within a year. Among those who did not perform so
well on the program, 44 percent recidivated (Bushway
and Apel, 2012). From the standpoint of a program-
effect evaluator, such a difference might be written
off as due to unobserved differences in motivation
between those who complete the program and those
who do not. However, at a minimum, those who
successfully completed the program are revealing
that they as a group disproportionately comprise
immediate desistors.
5. The following draws heavily from Raphael and
Stoll (2014).
6. In a regression analysis of pre-reform county
incarceration rates in California, differences in crime
rates explain very little of the cross-county variation
in the use of the prison system. On the other hand,
penal ideology as measured by the proportion of
local voters supporting sentencing reform initiatives
and local poverty rates are very strong predictors.
This analysis suggests that relatively conservative
counties with high poverty rates are the most likely
to send their offenders to state prison in California,
holding constant the effects of violent and property
crime (Lofstrom and Raphael, 2015).

22 | New Thinking in Community Corrections
7. The following few paragraphs draw heavily from
Lofstrom and Raphael (2016).
8. The U.S. Census Bureau Government Finance
and Employment Classification Manual (accessed
September 25, 2015, at http://www.census.gov/
govs/classification/index.html) defined category
U30, Fines and Forfeits as “Revenue from penalties
imposed for violations of law; civil penalties (e.g.,
for violating court orders); court fees if levied upon
conviction of a crime or violation; court-ordered
restitutions to crime victims where government
actually collects the monies; and forfeits of deposits
held for performance guarantees or against loss
or damage (such as forfeited bail and collateral).”
This category excludes “Penalties relating to tax
delinquency (report at appropriate Tax code); library
fines (report at All Other General Current Charges,
code A89); and sale of confiscated property (use
Miscellaneous General Revenue, NEC, code U99).”
9. Note, these revenues do not include transfers to
the state from civil forfeiture proceedings whereby
property alleged to be involved in the commission
of a crime is confiscated by local, state and federal
law enforcement and sold at auction. This would
certainly add to the total financial burden imposed
on low-income communities. The revenue category
(U99, Miscellaneous General Revenue) is too
broad and inclusive to infer the value of resources
transferred through civil forfeiture.
10. See T07-0275 - Tax Benefits of the Earned Income
Tax Credit, Distribution of Federal Tax Change
by Cash Income Class, 2012, accessed October 2,
2015, at http://www.taxpolicycenter.org/numbers/
displayatab.cfm?Docid=1937.
11. The federal poverty income threshold for a family
of four in 2012 was $23,050.
12. See Income and Poverty in the United States: 2013,
accessed October 3, 2015, at https://www.census.gov/
content/dam/Census/library/publications/2014/
demo/p60-249.pdf.
13. Local government revenues in 2012 were roughly
$1.1 trillion without intergovernmental grant
revenues from the states and the federal government
and $1.6 trillion with these intergovernmental
transfers.
14. The following discussion draws heavily from
chapter 8 of Raphael and Stoll (2013).
15. Although Governor McAuliffe restored voting
rights to those with former felony convictions
using his clemency power in 2016, Virginia’s laws
governing disenfranchisement remain unchanged.
16. See Hawken and Kleiman (2009) for the evaluation
of the HOPE program in Hawaii.
17. See Blumstein and Cohen (1987).
References
Bannon, Alicia, Mitali Nagrecha and Rebekah Dillar
(2010). Criminal Justice Debt: A Barrier to Reentry.
New York, NY: Brennan Center for Justice, New York
University School of Law.
Blumstein, Alfred, and Jacqueline Cohen (1987).
“Characterizing Criminal Careers.” Science,
238(4818): 985-991.
Building Trust and Legitimacy Within Community Corrections | 23
Blumstein, Alfred, and Kiminoro Nakamura (2009).
“Redemption in the Presence of Widespread Criminal
Background Checks.” Criminology, 47(2): 327-359.
Bushway, Shawn, and Robert Apel (2012). “A
Signaling Perspective on Employment-Based
Reentry Programming: Training Completion as a
Desistance Signal.” Criminology and Public Policy,
11(1): 21-50.
California Administrative Office of the Courts (2012).
SB 678 Year 2 Report: Implementation of the California
Community Corrections Performance Incentives Act
of 2009. San Francisco, CA: Administrative Office of
the Courts, Criminal Justice Court Services Office.
California Youth Authority (2000). Population
and Facilities Management Master Plan 2001-2006,
accessed September 10, 2012, at http://www.cdcr.
ca.gov/Reports_Research/docs/research/five_year.
pdf.
Glaze, Lauren E., and Laura M. Maruschak
(2010). Parents in Prison and Their Minor Children.
Washington, DC: U.S. Department of Justice, Bureau
of Justice Statistics.
Hawken, Angela, and Mark Kleiman (2009).
“Managing Drug Involved Probationers with Swift
and Certain Sanctions: Evaluating Hawaii’s HOPE.”
Final report to the U.S. Department of Justice for
award number 2007-IJ-CX-0033.
Hedwig, Lee, and Christopher Wildeman (2013).
“Things Fall Apart: Health Consequences of Mass
Imprisonment for African American Women.”
Review of Black Political Economy, 40(1): 39-52.
Holzer, Harry, Steven Raphael and Michael Stoll
(2006). “Perceived Criminality, Criminal Background
Checks and the Racial Hiring Practices of Employers.”
Journal of Law and Economics, 49(2): 451-480.
Johnson, Rucker (2009). “Ever-Increasing Levels of
Parental Incarceration and the Consequences for
Children.” In Steven Raphael and Michael Stoll (Eds.),
Do Prisons Make Us Safer? The Benefits and Costs of
the Prison Boom (pp. 177-206). New York, NY: Russell
Sage Foundation.
Kling, Jeffrey R. (2006). “Incarceration Length,
Employment, and Earnings.” American Economic
Review, 96(3): 863-876.
Kurlycheck, Megan, Shawn Bushway and Robert
Brame (2012). “Long-Term Crime Desistance and
Recidivism Patterns: Evidence from the Essex
County Convicted Felon Study.” Criminology, 50(1):
71-104.
Loeffler, Charles E. (2013). “Pre-Imprisonment
Employment Drops: Another Instance of the
Ashenfelter Dip?” Working Paper. Philadelphia, PA:
University of Pennsylvania.
Lofstrom, Magnus, and Steven Raphael (2015).
“Incarceration and Crime: Evidence from California’s
Public Safety Realignment.” IZA Working Paper
#7838. Bonn, Germany: IZA.
Lofstrom, Magnus, and Steven Raphael (2016).
“Crime, t he Criminal Just ice System, and
Socioeconomic Inequality.” Journal of Economic
Perspectives, 30(2): 103-126.

24 | New Thinking in Community Corrections
Pager, Devah (2007). Marked: Race, Crime and
Finding Work in an Era of Mass Incarceration.
Chicago, IL: University of Chicago Press.
Pager, Devah, Bruce Western and Bart Bonikowski
(2009). “Discrimination in a Low-Wage Labor Market:
A Field Experiment.” American Sociological Review,
74: 777-799.
Pettit, Becky, and Christopher Lyons (2007). “Status
and the Stigma of Incarceration: The Labor Market
Effects of Incarceration by Race, Class, and Criminal
Involvement.” In Shawn Bushway, Michael Stoll and
David Weiman (Eds.), Barriers to Reentry? The Labor
Market for Released Prisoners in Post-Industrial
America (pp. 206-226). New York, NY: Russell Sage
Foundation.
Raphael, Steven (2011). “Improving Employment
Prospects for Former Prison Inmates: Challenges
and Policy.” In Phillip J. Cook, Jens Ludwig and
Justin McCrary (Eds.), Controlling Crime: Strategies
and Tradeoffs (pp. 521-572). Chicago, IL: University
of Chicago Press.
Raphael, Steven (2014). The New Scarlet Letter?
Negotiating the U.S. Labor Market with a Criminal
Record. Kalamazoo, MI: W.E. Upjohn Institute for
Employment Research.
Raphael, Steven and Michael Stoll (2013). Why Are
So Many Americans in Prison? New York, NY: Russell
Sage Foundation.
Raphael, Steven and Michael Stoll (2014). A
New Approach to Reducing Incarceration While
Maintaining Low Rates of Crime. Hamilton Project
Report. Washington, DC: The Brookings Institution.
Sabol, William J. (2007). “Local Labor-Market
Cond it ions a nd Post-Pr ison Employ ment
Experiences of Offenders Released from Ohio State
Prisons.” In Shawn Bushway, Michael Stoll and
David Weiman (Eds), Barriers to Reentry? The Labor
Market for Released Prisoners in Post-Industrial
America (pp. 257-303). New York, NY: Russell Sage
Foundation.
Schnittker, Jason, Michael Massoglia and
Christopher Uggen (2011). “Incarceration and the
Health of the African-American Community.” Du
Bois Review, 8: 133-141.
T he S ent enc i n g P r oje c t (2 016). Fe l on y
Disenfranchisement: A Primer. Washington, DC: The
Sentencing Project.
Snyder, Howard N., and Joseph Mulako-Wangota.
Arrest Data Analysis Tool, accessed June 30, 2016, at
www.bjs.gov. Washington, DC: U.S. Department of
Justice, Bureau of Justice Statistics.
Uggen, Christopher, and Jeff Manza (2002).
“Democ r at ic Cont r ac t ion? T he Pol it ic a l
Consequences of Felon Disenfranchisement in the
United States.” American Sociological Review, 67:
777-803.
Wakefield, Sara, and Christopher Wildeman (2014).
Children of the Prison Boom: Mass Incarceration and
the Future of American Inequality. New York, NY:
Oxford University Press.
Western, Bruce (2002). “The Impact of Incarceration
on Wage Mobility and Inequality.” American Journal
of Sociology, 67(4): 526-546.

Building Trust and Legitimacy Within Community Corrections | 25
Wi ldema n, Chr istopher (2009). “Pa renta l
Imprisonment, the Prison Boom, and the
Concentration of Childhood Disadvantage.”
Demography 46: 265-280.
W i ldema n, Ch r istopher (2010). “Pater na l
Incarceration and Children’s Physically Aggressive
Behaviors: Evidence from the Fragile Families and
Child Wellbeing Study.” Social Forces 89: 285-310.
Wildeman, Christopher (2012). “Imprisonment and
Infant Mortality.” Social Problems, 59: 228-257.
Author Note
Wendy Still is the Chief Probation Officer in Alameda
County, California.
Barbara Broderick is the Chief Probation Officer in
the Maricopa County Adult Probation Department.
Steven Raphael is a Professor in the Goldman School
of Public Policy, University of California, Berkeley.
Findings and conclusions in this publication are those of the authors and do not necessarily reflect the official position or policies of the U.S. Department of Justice.


U.S. Department of Justice
Office of Justice Programs
National Institute of Justice
8660 Cherry Lane
Laurel, MD 20707-4651
Official BusinessPenalty for Private Use $300
PRESORTED STANDARDPOSTAGE & FEES PAID
DOJ/NIJ/GPOPERMIT NO. G – 26
Members of the Executive Session on Community Corrections
Molly Baldwin, Founder and CEO, Roca, Inc.
Kendra Bradner (Facilitator), Project Coordinator, Program in Criminal Justice Policy and Management, Harvard Kennedy School
Barbara Broderick, Chief Probation Officer, Maricopa County Adult Probation Department
Douglas Burris, Chief Probation Officer, United States District Court, The Eastern District of Missouri, Probation
John Chisholm, District Attorney, Milwaukee County District Attorney’s Office
George Gascón, District Attorney, San Francisco District Attorney’s Office
Adam Gelb, Director, Public Safety Performance Project, The Pew Charitable Trusts
Susan Herman, Deputy Commissioner for Collaborative Policing, New York City Police Department
Michael Jacobson, Director, Institute for State and Local Governance; Professor, Sociology Department, Graduate Center, City University of New York
Sharon Keller, Presiding Judge, Texas Court of Criminal Appeals
Marc Levin, Policy Director, Right on Crime; Director, Center for Effective Justice, Texas Public Policy FoundationGlenn E. Martin, President and Founder, JustLeadershipUSA
Anne Milgram, Senior Fellow, New York University School of Law
Jason Myers, Sheriff, Marion County Sheriff’s Office
Michael Nail, Commissioner, Georgia Department of Community Supervision
James Pugel, Chief Deputy Sheriff, Washington King County Sheriff’s Department
Steven Raphael, Professor, Goldman School of Public Policy, University of California, Berkeley
Nancy Rodriguez, Director, National Institute of Justice
Vincent N. Schiraldi, Senior Research Fellow, Program in Criminal Justice Policy and Management, Harvard Kennedy School
Sandra Susan Smith, Associate Professor, Department of Sociology, University of California, Berkeley
Amy Solomon, Director of Policy, Office of Justice Programs, U.S. Department of Justice; Director, Federal Interagency Reentry Council
Wendy S. Still, Chief Probation Officer, Alameda County, CaliforniaJohn Tilley, Secretary, Kentucky Justice and Public Safety Cabinet
Steven W. Tompkins, Sheriff, Massachusetts Suffolk County Sheriff’s Department
Harold Dean Trulear, Director, Healing Communities; Associate Professor of Applied Theology, Howard University School of Divinity
Vesla Weaver, Assistant Professor of African American Studies and Political Science, Yale University, Institution for Social and Policy Studies
Bruce Western, Faculty Chair, Program in Criminal Justice Policy and Management, Harvard Kennedy School; Daniel and Florence Guggenheim Professor of Criminal Justice, Harvard University
John Wetzel, Secretary of Corrections, Pennsylvania Department of Corrections
Ana Yáñez-Correa, Program Officer for Criminal Justice, Public Welfare Foundation
Learn more about the Executive Session at:
www.NIJ.gov, keywords “Executive Session Community Corrections” www.hks.harvard.edu, keywords “Executive Session Community Corrections”
NCJ 249946
*NCJ~249946*