nbs tfchnlcal 632 - nist · frequency stability specification and ... contracted with the national...
TRANSCRIPT

NBS TfCHNlCAL NOTE 632

Frequency Stability Specification and Measurement: High Frequency and Microwave Signals
J.H. Shoaf D. Halford A S Risley
Time and Frequency Division Institute for Basic Standards National Bureau of Srandards Boulder, Colorado 80302
NBS Technical notes are designed to supplement the Bureau’s regular publications program. They provide a meam for making available ecientific data that are of transient or limited interest. Technical Notes may be listed or referred to in the open literature.
US. DEPARTMENT OF COMMERCE, Peter G. Peterson, Secretary NATIONAL BUREAU OF STANDARDS, Lawrence M. Kurhner, Acting Director
Issued January 1973

National Bureau of Standude Technical Note632 Nat. Ban %and.(Usb Tech. Note 632, 70 p p s (January 1973)
CODEN NBTNAE
For male by the hperintendcnt of Docomentr, U.S. Government Printing OBiec, Wamhington, D. C. 20402 (Order by SD Catalog NO. C13.46632).

1 . 2 .
3 .
4 .
5 . 6 .
C ONT ENT S
INTRODUCTION AND BACKGROUND . . . . . . . . . . . TERMINOLOGY FOR SPECIFICATION O F FREQUENCY STABILITY . . . . . . . . . . . . . . . . . . . . . . . . . . OPERATIONAL SYSTEMS FOR MEASUREMENT O F FREQUENCY STABILITY AT NBS (HIGH FREQUENCY REGION.) . . . . . . . . . . . . . . . . . . . . . . . . . . . 3 . 1 . Frequency Domain Measurements . . . . . . . . . . . 3.2. Time Domain Measurements . . . . . . . . . . . . . 3 . 3 . Differential Phase Noise Measurements . . . . . . . OPERATIONAL SYSTEMS FOR MEASUREMENT OF FREQUENCY STABILITY AT NBS (MICROWAVE REGION) . 4 . 1 . Discussion of the Measurement System . . . . . . . . 4 . 2 . Description of the Measurement System . . . . . . . 4.3. Calibration Procedure . . . . . . . . . . . . . . . . . 4.4. Measurement Procedure . . . . . . . . . . . . . . . 4.5. Additional Techniques for Frequency Stability
Measurement Systems at X-Band . . . . . . . . . . . SUMMARY . . . . . . . . . . . . . . . . . . . . . . . . . . REFERENCES . . . . . . . . . . . . . . . . . . . . . . . .
Page
1
2
5
6
12
16
18
18
22
23
24
28
28
3 3
APPENDIX A. Glossary of Symbols . . . . . . . . . . . . . . . 35
APPENDIX B. Stability Measure Conversion Chart . . . . . . . 38
APPENDIX C. Translation of Data f r o m Frequency Domain into Time Domain Performance . . . . . . . . . . . 39
APPENDIX D. Spectral Densities: Frequency Domain Measures of Stability . . . . . . . . . . . . . . . 40
APPENDIX E. A Sample Calculation of Script . . . . . . . . 47 . 50 L APPENDIX F. A Sample Calculation of Allan Variance. "y (7) .
APPENDIX G. Computing Counter a (7) Program . . . . . . . 52
APPENDIX H. Some Important References . . . . . . . . . . . . BIBLIOGRAPHY . . . . . . . . . . . . . . . . . . . . . . . . . 5 6
Y 53
TABLE 1. Worksheet for Calculation of S (f) . . . . . . . . . 26 6#
iii

LIST OF FIGURES
Page
Figure 1. Typical Frequency Domain Measurement of Frequency Stability (Phase Sensitive Mode) . . . . 6
Figure 2. Stepped Gain Operational Amplifier . . . . . . . . . 8
Figure 3. Low Noise Amplifier. . . . . . . . . . . . . . . . . 8
Figure 4. Adjustable RC Filter. . . . . . . . . . . . . . . . . 9
Figure 5. Battery Bias Box . . . . . . . . . . . . . . . . . . 9
Figure 6. Plot of Script ;2 versus Frequency f . . . . . . . . 11
Figure 7. Typical Time Domain Measurement of Frequency Stability (Frequency Sensitive Mode) . . . . . . . . 12
Figure 8. Plot of Sigma versus Tau . . . . . . . . . . . . . . 14
Figure 9. Frequency Stability Measurement Utilizing a Computing Counter. . . . . . . . . . . . . . . . . . 15
Figure 10. Differential Phase Noi se Measurement . . . . . . . 16
Figure 11. Adjustable Phase Shifter (5-MHZ Delay Line) . . . . 16
Figure 12. Photograph of Single Oscillator Frequency Stability Measurement System . . . . . . . . . . . . . . . . 20
Figure 13. Single Oscillator Frequency Stability Measurement System . . . . . . . . . . . . . . . . . . . . . . . . 21
Figure 14. Frequency Domain Plot of X-Band Gunn Diode Oscillator Signal Source (Single Oscillator Method). 27
Figure 15. Frequency Stability Measurement System (Phase- Lock Servo Loop) . . . . . . . . . . . . . . . . . . 29
Figure 16. Frequency Stability Measurement System (Offset- Frequency Phase-Lock Servo Loop). . . . . . . . . 30
Figure 17. Frequency Stability Measurement System (Large 31 Frequency-Offset Phase-Lock Servo Loop) . . . . .
Figure 18. Time Domain Plot of X-Band Gunn Diode Oscillator Signal Source. . . . . . . . . . . . . . . . . . . . . 32
iv

FREQUENCY STABILITY SPECIFICATION AND MEASUREMENT: HIGH FREQUENCY AND MICROWAVE SIGNALS*
John H. Shoaf, Donald Halford, and A. S. Risley
Atomic Frequency and Time Standards P rogram Areas National Bureau of Standards
Boulder, Colorado 80302 USA
This report gives concise definitions for specifying frequency stability for measurements in the frequency domain and t ime domain. of measurement techniques are recommended. ment systems in the high frequency and microwave regions a re described in adequate detail so that the systems may be duplicated.
Standards of terminology and Measure-
Key Words: Allan variance; Frequency stability measure- ments ; Measurement system des c ription; Phase noise; Spectral density; Stability definitions; Terminology standards.
1. INTRODUCTION AND BACKGROUND
At the beginning of FY-71 the Department of Defense Joint
Services Calibration Coordinating Group (DoD/CCG), J. L. Hayes
(Chairman), Metrology Engineering Center, Pomona, California,
contracted with the National Bureau of Standards (NBS) to
write a paper pertaining to the specification and measurement
of frequency stability.
DoD/CCG Time and Frequency Working Group.
of this group a r e Peter Strucker (Chairman), Metrology Engineering
Center, Pomona, California; J. M. Rivamonte, U. S. Army Metrology
and Calibration Center, Redstone Arsenal, Alabama; and E. L.
Kirkpatrick, Aerospace Guidance and Metrology Center, Newark Air
Force Station, Newark, Ohio.
*Contribution of the National Bureau of Standards, not subject to c opy r i g ht .
The project was under the jurisdiction of the
The current members

The f i r s t year 's work (FY-71) culminated as NBS Report 9794 [ 11.
The second year 's work (FY-72) extended the frequency range to include
a working measurement system a t X-band. The results of work done in
both FY-71 and FY-72 a r e documented in this paper.
The purpose of the project i s to establish recommended standards
of terminology and measurement techniques for frequency stability.
Emphasis i s placed on details of useful working systems (apparatus)
that could be duplicated by others in the field of frequency stability
measurements.
facilitate interpretation of stability specifications and to enable one to
communicate and compare experimental results more readily.
authoritative paper [ 23 by the Institute of Electrical and Electronics
Engineers (IEEE) Subcommittee on Frequency Stability is used exten-
sively a s the prime reference in the preparation of this report. This
report presents the description and performance of frequency stability
measurement systems capable of precise measurements on state-of-the-
a r t sources.
enable a person to readily understand the principle of operation.
Uniformity of data presentation is s t ressed in order to
An
Sufficient theory of the measurement systems i s given to
2. TERMINOLOGY FOR SPECIFICATION O F FREQUENCY STABILITY
The t e r m frequency stability encompasses the concepts of random
noise, intended and incidental modulation, and any other fluctuations of
the output frequency of a device.
totally) concerned with random fluctuations cor responding to Fourier
frequencies in the 10 to 10 hertz range. The measurement of f r e -
quency stability can be accomplished in both the frequency domain (e. g . ,
spectrum analysis) and the t ime domain (e. g . , gated frequency counter).
In this report we a r e mainly (but not
0 6
2

In the aforementioned manuscripts El], [ 2 ] the authors chose to use
two independent definitions, each related to different useful methods of
measurement. (See Appendix A for a Glossary of Symbols. ) The frequency domain definition of frequency stability is the
one- sided spectral density of the fractional frequency fluctuations, Sy(f),
where y e 6v/ ~ 0 . The fractional frequency fluctuation spectral density
Sy(f) is not t‘o be confused with the radio frequency power spectral
density S n r e s of frequency stability [2] . (There is some discussion of this in
Appendix D. ) Phase noise spectral density plots [i. e. , S
a r e a common alternative method of data presentation.
density of phase fluctuations is related to S (f) by
nor with S (u) , which a r e not good pr imary meas- 6V d X a U ) ,
(f) versus fl 6$
The spectral
Y
The t ime domain definition of frequency stability uses the type of
sample variance called the Allan variance [3 J of y:
especially useful in practice. It is denoted by:
2
Y 0 (7) =
The bar over th
The particular Allan variance with N = 2 and T = r is found to be
(3 1
y indicates that y h s been averaged ove a specified
The angular brackets indicate an average of the quan- time interval 7.
tity over time. (See example in Appendix F. )
3

In the t ime domain we a r e concerned with the measurement 2 Q of Allan variances at different t ime intervals.
versus 7 ("sigma versus tau") on a log-log scale a r e commonly used
Plots of [O ( T ) ] Y
for data presentation.
late f rom frequency domain measures to t ime domain measures (and
often conversely) is found in Appendix B.
tion is given in Appendix C.
A convenient char t which enables one to trans-
An example of this t ransla-
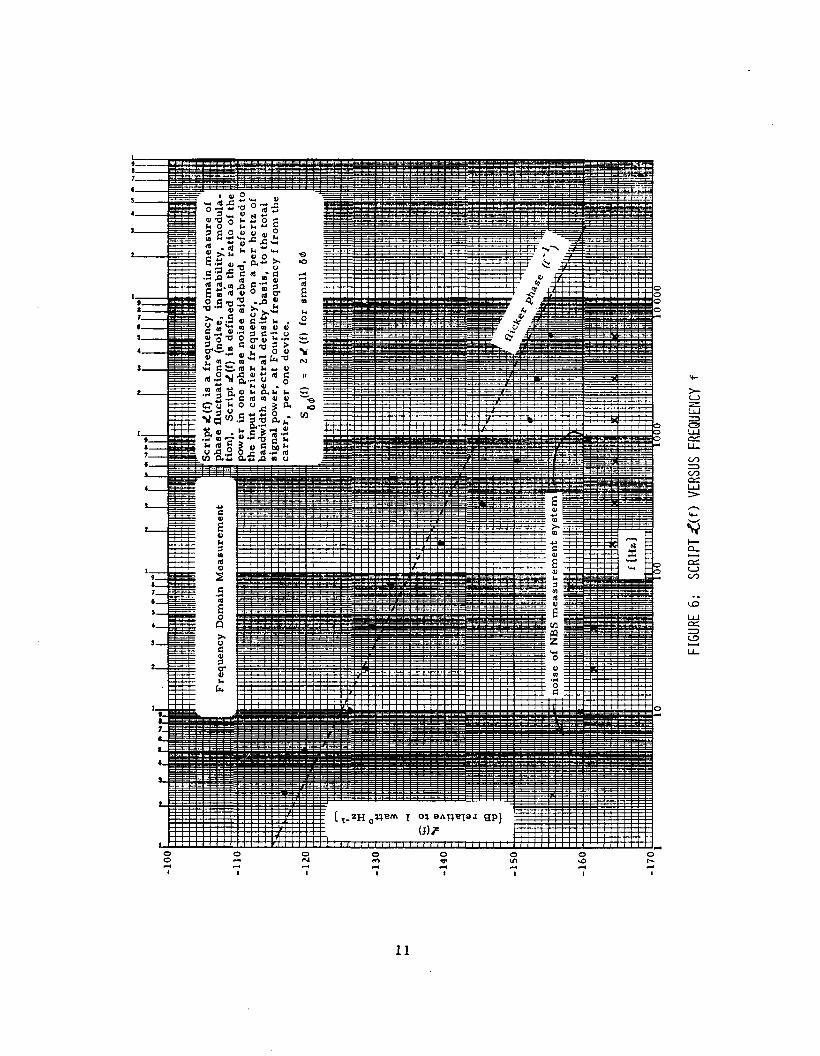
Script &(f) is a frequency domain measure of phase fluctuations
(noise, instability, modulation) used at NBS.
the ratio of the power in one phase noise sideband, referred to the input
Script &(f) is defined as
c a r r i e r frequency, on a per hertz of bandwidth spectral density basis,
to the total signal power, a t Fourier frequency f f rom the c a r r i e r , pe r
one device. (See Appendix D. )
(4) Power density (one phase modulation sideband)
d(f) Power (total signal)
Fo r small &$,
A practical system fo r the measurement of Script Z(f) o r S
described in detail la ter .
(f) will be 69
It seems appropriate here to discuss briefly the types of noise
that affect the output frequency of a l l known signal sources. The noises
can be characterized by their frequency dependence.
Common Name
White Phase Noise
Flicker Phase Noise
White Frequency Noise (Random walk of phase)
f0
f -
f - 2 f0
Flicker Frequency Noise f -3 f -
4

3. OPERATIONAL SYSTEMS FOR MEASUREMENT O F FREQUENCY STABILITY AT NBS
(HIGH FREQUENCY REGION)
John H. Shoaf and Donald Halford
Most conventional systems for measurement of frequency stability
until recently have utilized t ime domain techniques primarily.
indicated previously, in order to have a comprehensive and sufficient
measure of frequency stability, it is p re fe r r ed that the measurements
involve both frequency and t ime domain techniques.
As
Fortunately, frequency domain and time domain methods for
measuring frequency stability require similar apparatus except that:
to make measurements in the frequency domain you must have a
frequency window (spectrum analyzer) following the detector; for the
t ime domain you must have a t ime window (gated counter) following the
detector.
It w a s the introduction of good double-balanced mixers that per -
mitted measurement of frequency stability by improved techniques [4]-[7 J ,
[ 113. The double-balanced mixer , considered as a phase sensitive de-
tector , makes possible meaningful frequency stability measurements of
high-quality signal sources in both the frequency domain and the t ime
domain.
measurement system which is reasonable in cost.
The resul ts are quantitative and may be obtained f rom a
The frequency stability measurement systems described below
The functional block diagrams in have been used at NBS since 1967.
f igures 1, 7, 9, and 10 a r e re fer red to in the detailed descriptions of the
par t icular systems. The c a r r i e r frequency range 10 Ha to 10 Ha is
easily covered with these techniques.
3 9
5

MIXER
P A 0
3.1. Frequency Domain Measurements
r------ 1 OSCILLATOR
COMPUTER I I
7 5 0 v H
VERY LOOSE PHASE LOCK ( 6 LOOP. VOLTAGE V A R I E S I
6 1
CHART RECORDER I
I I
I
I
~
CONVERTER
SPECTRUM L _ _ _ _ _ _ _ _ J ANALYZER
FREQUENCY OOMAIN I
PRINTER
T I M E OOMAIN ( O P T I O N A L )
I COUNTER I
FIGURE 1: TYPICAL FREQUENCY DOMAIN MEASUREMENT OF FREQUENCY STABILITY (PHASE SEJSITIVE MODE)
OSCILLATOR UNDER TEST REFERENCE OSCILLATOR OF H I G H SPECTRAL P U R I T Y (VARACTOR TUNING) ADJUSTABLE ATTENUATOR T Y P I C A L L Y 1OdB)
NBS LOU-NOISE dc A M P L I F I E R (SEE F I G U R E 3 ) OPERATIONAL A M P L I F I E R ( S E E F I Q U R E 2) BATTERY B I A S BOX (SEE F IGURE 5 ) SPECTRUM ANALYZER (LOU FREQUENCY, H I G H RESOLUTION)
OOUBLE-BALANCEO M I X E R !SCHOTTKY B A R R I E R O I o o E s )
(Figures 1, 7, and 10 show circuit values appropriate fo r
measuring high quality 5-MHz quartz crystal oscillators. )
Figure 1 i l lustrates the measurement system typically used at
NBS for frequency domain measurements. It should be noted that t ime
domain data can also be obtained simultaneously, although usually this
system is used only for frequency domain measurements.
domain measurements it is often more convenient to use a slightly
(For t ime
6

modified measurement setup to be described later. ) In this frequency
domain setup the oscillator under test is fed into one side of a low-noise
double-balanced mixer which utilizes Schottky ba r r i e r diodes.
reference oscillator is fed into the other side of the mixer through an
attenuator, typically 10 dB.
detector so that when the two signals a r e identical in frequency and a r e
in phase quadrature the output is approximately zero volts dc.
this output is sent back to the reference oscillator via the varactor
tuning, phase lock is achieved. As with any feedback system, ca re must
be observed to avoid instabilities, e. g. , servo loop oscillations. The
phase-lock loop contains proper termination a t the output of the mixer
followed by operational amplifiers with adjustable gain.
constant of the loop may be adjusted as needed by varying the amplifier
gain within the loop and by use of the RC fil ter (fig. 4) indicated in the
diagram. Finally, a battery bias box is included a t the varactor input
in order to operate in a suitably l inear portion of the varactor 's
frequency versus voltage curve.
The
The mixer acts a s a phase sensitive
When
The time
A very loose phase-lock loop is indicated inasmuch as the voltage
var ies as phase (in short term), and in this frequency domain measure-
ment we are observing the small phase variations directly.
phrase very loose phase-lock loop, we mean that the bandwidth of the
servo response is small compared to the lowest frequency f at which
we wish to measure (i. e . , the response time is very slow). Operational
amplifiers are arranged in a circuit as shown in figure 2 for convenience
of adjusting the gain and for self-contained battery supply voltage.
Special NBS low-noise dc amplifiers used in certain precision measure-
ments a r e shown in figure 3.
chassis the adjustable RC o r CR f i l ters utilizing low-noise components,
with rotary switches for various combinations of R and C (see fig. 4).
By the
At NBS we have arranged in a small
7
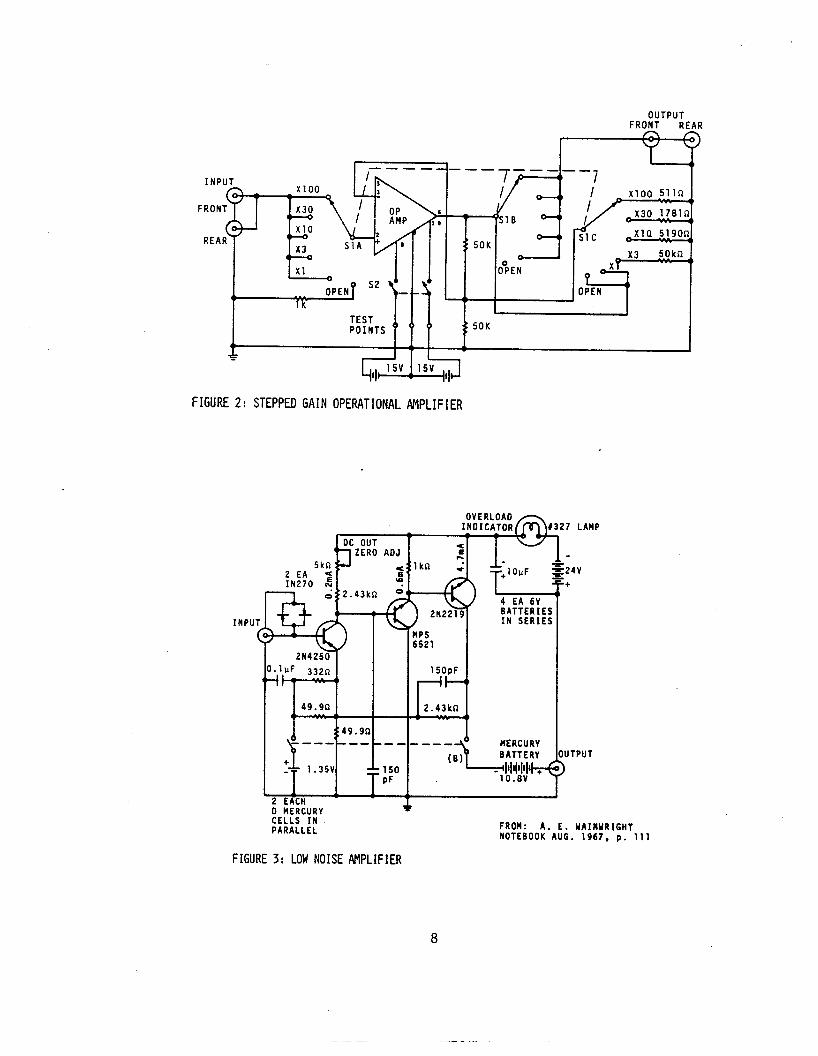
FIGURE 2 : STEPPED GAIN OPERATIONAL AMPLIFIER
' LAMP
E24V - -+ 1
OUTPUT >
Y A I N Y R I G H T . 1967. p . 1 1 1
8

INDUT
OUTPUT
FIGURE 4: ADJUSTABLE RC FILTER 5 1 : F I L T E R HOOE SWITCH (ROTARY. 3 WAFER) 5 2 : RESISTOR SWITCH (ROTARY SHORTING TYPE) s3: CAPACITOR SUITCH ( R O T A R ~ , PROGRESSIVE SHORTING)
1 . 4 V MERCURY C E L L S
REAR
* e FRONT FRONT
+ REAR REAR
I NON-SHORTING OPE% 1 S W I T C H
FIGURE 5: BATTERY BIAS BOX
1 . O p F l k n
THE U N I T S ARE B U I L T ON SEPARATE C H A S S I S AND CONNECTED I N SERIES TO F A C I L I T A T E F I N E ADJUSTMENT BETWEEN S T E P VOLTAGES
9

The battery bias box i s arranged with vernier a s shown in figure 5 ,
facilitating fine frequency adjustments via the varactor frequency adjust-
ment in one oscillator.
information relevant to stability (frequency domain).
sideband levels a r e read out in rms volts on the analyzer set to certain
chosen values of frequency, f. Fo r typical high quality signal sources
this corresponds to measuring only those phase noise sidebands which
a r e separated f rom the c a r r i e r by the various f intervals chosen.
Script d ( f ) may be calculated with the assumption that both sources
contribute equally; however, if one source were the major contributor,
then the noise of that source would be no worse than 3 dB greater than
the value of Script f (f) so calculated.
A sample calculation may be found in Appendix E.
A wave analyzer is used to obtain the noise plot
The phase noise
A typical plot is shown in figure 6.
10
0 0 r(
I
0 N
I CI
0 9 r(
I
11
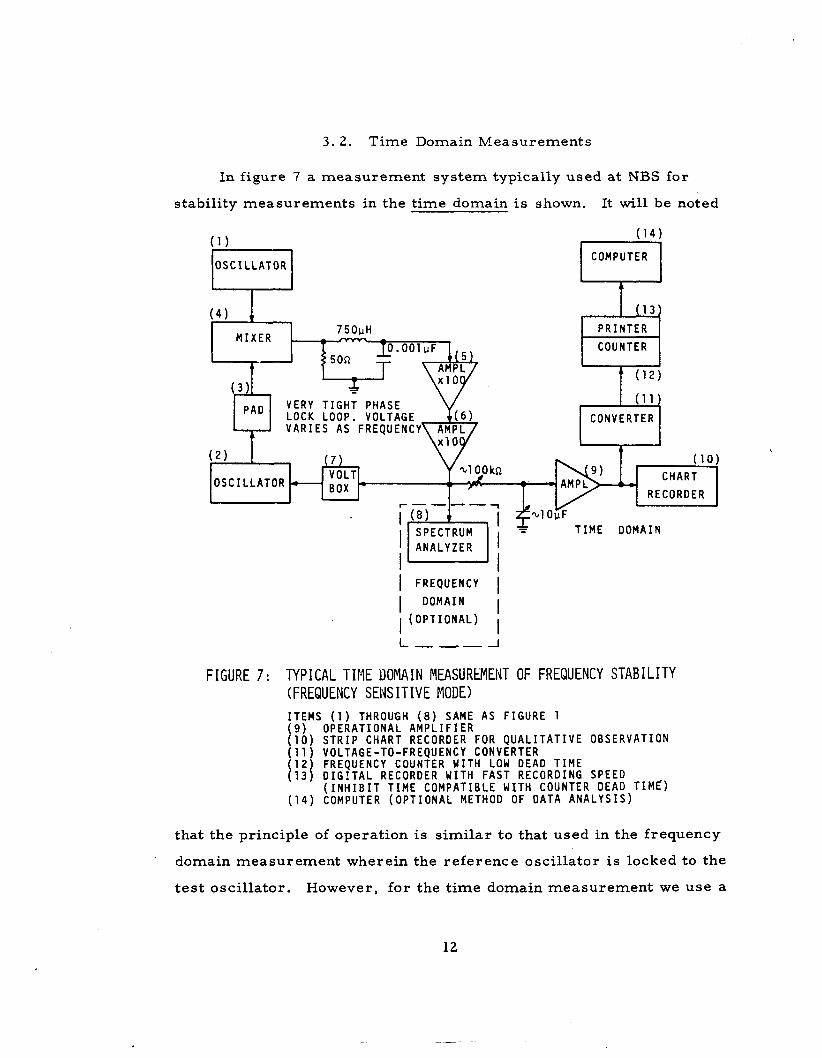
3 . 2 . Time Domain Measurements
In figure 7 a measurement system typically used a t NBS for
stability measurements in the t ime domain is shown. It will be noted
( 1 1 COMPUTER 1
( 4 ) (13 , '
7 5 0 p H P R I N T E R
COUNTER M I X E R , -
CONVERTER
T I M E D O M A I N
I FREQUENCY I I D O M A I N I I ( O P T I O N A L ) I
FIGURE 7: TYPICAL TI I IE DOMAIN MEASURtMEtJT OF FREQUENCY STABILITY (FREQUENCY SENSITIVE MODE) I T E M S ( 1 ) THROUGH ( 8 ) SAME A S F I G U R E 1 ( 9 ) OPERATIONAL AMPLIFIER (10) S T R I P C H A R T RECORDER FOR Q U A L I T A T I V E O B S E R V A T I O N (11) VOLTAGE-TO-FREQUENCY CONVERTER
1 2 ) FREQUENCY COUNTER W I T H LOW OEAD T I M E 1 3 ) D I G ! T A L RECORDER W I T H F A S T R E C O R D I N G S P E E D
( I N H I B I T T I M E C O M P A T I B L E W I T H COUNTER D E A D T I M E ' ) ( 1 4 ) ~ O M P U T E R (OPTIONAL METHOD OF D A T A ANALYSIS)
that the principle of operation is s imilar to that used in the frequency
domain measurement wherein the reference oscillator i s locked to the
t e s t oscillator. However, for the t ime domain measurement we use a
12

very tight phase-lock loop and the correct ion voltage at the oscillator
var ies as frequency.
that the bandwidth of the servo response is relatively large (i. e . , the
response t ime i s much smaller than the smallest t ime interval T a t
which we wish to measure) .
potentially present in tight phase-lock loop systems.
convenient setup for observing frequency fluctuations in longer t e rm.
However, with the t ime constant appropriately adjusted and the means
for taking sufficiently fast samples the system is readily used for short
t e r m measurements , a s well as for the longer t e r m measurements , in
the t ime domain.
o r s t r ip char t recorder may be used.
the system at NBS utilizes a voltage-to-frequency converter , a frequency
counter, and a printer capable of recording rapid samples of data with
very short dead t ime.
a program designed to compute the appropriate Allan variance [ Z ] , [3] .
In our computer program log 0 versus log T along with the associated
confidence in the o a r e automatically plotted on microfilm. For small
batches of data a desk calculator could be used and the computer analysis
would not be necessary. An example of a specific Allan variance compu-
tation is shown in Appendix F.
shown in figure 8.
character is t ic of the types of noise indicated.
By the phrase very tight phase-lock loop, we mean
Caution--there a r e problems which a r e
This is a very
For qualitative observations any suitable oscilloscope
F o r quantitative measurements
The data a r e analyzed typically by computer via
A typical plot of log 0 versus log T is
The dashed lines indicate the slopes which a r e
13

0
I I I I 0 4
0 0 m 2 4
=> 4 I-
C-(
v,
LL
14

The convenience of obtaining time domain data has been greatly
enhanced by utilizing recently developed counters [ 8 ] which a r e program-
able to automatically compute a versus 7. A block diagram (fig. 9 )
shows the measurement setup using a computing counter programed fo r
a y ( ~ ) . The program which was used i s given in Appendix G.
Certain limitations of deadtime are inherent in the use of this time
domain method. However, in general (except for very short T ) ,
frequency stability in the time domain may be measured quickly and
accurately using a computing counter. .
WIDE-BAN0 F I L T E R COMPUTING - P R I N T E R COUNTER M I X E R
S I G N A L SOURCE
S I G N A L SOURCE
FIGURE 9 : FREQUMCY STABILITY MEASUREMErJT UTILIZING A COMPUTER COUhTER
15

3. 3 . Differential Phase Noise Measurements
( 1 5 ) 9
An additional useful system illustrated in figure 10 i s used for
differential phase noise measurements of various discrete components
which a r e frequently used in stability measurement systems.
system only one frequency source is used.
In this
Its output is split so that
. . . 11 I M I X E R ( 1 3 )
7 5 0 p H
P R I N T E R
COUNTER ( 1 2 )
par t
D E V I C E OR COMPONENT UNDER T E S T
of the signal passes through the component to be tested.
- S H I F T E R
lREFERENCr O S C I L L A T O R COMPUTER
1 0 )
FREQUENCY D O M A I N T I M E D O M A I N
FIGURE 10: DIFFERENTIAL PHASE NOISE MEASUREJIENT I T E M S ( 1 ) THROUGH ( 1 4 ) SAME AS F I G U R E S 1 AND 7 ( 1 5 ) ANY D E V I C E OR COMPONENT UPON W H I C H N O I S E MEASUREMENTS ARE D E S I R E D
( 1 6 ) NBS A D J U S T A B L E P H A S E ( A M P L I F I E R S . F I L T E R S , C A P A C I T O R S , C A B L E S . P A D S . E T C . )
S H I F T E R , 5MHz ( S E E F I G U R E 1 1 )
The signal is adjusted via a phase shifter (fig. 11) so that it is in phase
quadrature with the other par t of the original signal and is down-
converted in the Schottky ba r r i e r diode mixer a s described in the other
f
FIGURE 11: ADJUSTABLE PHASE SHIFTER (5MHz DELAY LINE) R G 1 7 4 / U C A B L E WAS U S E D FOR E A C H SEGMENT OF P H A S E S H I F T C A L C U L A T E D A T - 1 0 cm P E R D E G R E E A T 5 M H z .
16

systems.
included for convenience.
signal i s amplified in special low-noise, low-level dc amplif iers and
observed on the spectrum analyzer. Script d(f) values a r e calculated
at various frequency values, f , and plotted.
shown in Appendix E.
The switchable 5 0 0 load in figure 11 is not essential but is
A low-pass filter is included before the
A sample calculation is
The measurement system noise level (e. g. , see fig. 6) is easily
evaluated.
shown in figure 10,let the "device under test" be a short length of coaxial
cable (which i s itself not a source of noise). The smal l amount of noise
observed on the spectrum analyzer represents the sys tem noise, mainly
due to the mixer (4) o r the first amplifier (5).
sys tem noise i s then the procedure given in Appendix E.
Using the differential phase noise measurement system
The calculation of the
17

4. OPERATIONAL SYSTEMS FOR MEASUREMENT O F FREQUENCY STABILITY AT NBS
(MICROWAVE REGION)
John H. Shoaf and A. S. Risley
Thorough investigation of stability measurement techniques in
the X-band region revealed that a method different f rom that described
above for HF measurements was desirable in most cases. The recom-
mended measurement system i s described he re in detail.
techniques of stability measurements in X-band wi l l be discussed in
less detail later. The recommended system* is a single-oscillator
system as shown in the photograph (fig. 12)
(fig. 1 3 ) .
Ondria [ lo] .
Other
and in the block diagram
Pr ime references a r e papers by Ashley et al.[9] and
4.1. Discussion of the Measurement System
The single-oscillator frequency stability measurement system is
basically a frequency modulation (FM) demodulator. That is, it can
retr ieve f rom the modulated c a r r i e r the signal with which the c a r r i e r
was originally frequency modulated.
An important consideration when making measurements is that of
maintaining the quadrature condition- -a 90° average phase difference
between the signals in the reference channel and the signal channel a s
seen a t the mixer.
during the course of a measurement the average phase difference wi l l
fluctuate a few degrees about the desired 90' setting.
recommended that an occasional check of the quadrature condition be
Unfortunately, there is a fairly high probability that
Therefore, it is
* The recommended system is discussed he re as a frequency domain measurement. However, t ime domain measurements can also be made.
18

made.
quadrature condition- -in long term- -is established and maintained by
phase-locking one source to the other. A similar procedure could be
used here , but we consider it to be unnecessary in practice. )
(In a two-oscillator system of measurement discussed la ter the
In practice, there is a low frequency limit to the usefulness of
this method fo r the measurement of FM noise.
values of f .ranging f rom as high as 500 Hz to as low a s 2 . 5 Hz.
We have seen limiting
The single-oscillator system and the two-oscillator system each
has an upper frequency limit; i. e . , a value of f above which frequency
stability measurements cannot meaningfully be made. For the single - oscil lator system this upper limit is f = Wc, where W is the 3-dB
resonance linewidth of the loaded discriminator cavity. In the NBS
single-oscillator system, measurements were made at values of f as
h i g h a s 100 kHz.
C
19

,
20

i e - m Y L
t
u v) 0
21

4.2 . Description of the Measurement System
A description of the single-oscillator measuring system may
readily be followed by referr ing to the block diagram (fig. 1 3 ) .
X-band source under tes t is connected at the left-hand side of the sys-
tem.
(2 ) before it is split via a 3-dB directional coupler ( 3 ).
noted that isolators { 11, (41, (71, Ell}, and c14) a r e used at severa l
points throughout the system as a means of preventing any serious
reflections which might otherwise exist. ) Part of the signal enters the
reference channel (upper a r m ) , passing through a phase shifter f 6 ) via
a variable attenuator {5) and eventually through a 90' twist into the
balanced mixer (8).
channel (lower arm), passing through a three-port circulator (9 ] con-
nected to a discriminator cavity (10) at one port. A variable attenuator
f 12) is also in the signal channel before the signal reaches the balanced
mixer.
(17).
to facilitate detection of resonance tuning of the cavity.
via a detector f15 3 with a dc voltmeter readout {16].
The
The signal passes through an isolator { l ] and variable attenuator
(It should be
The other par t of the signal enters the signal
The output of the mixer goes to either of two spectrum analyzers
A 10-dB directional coupler (13 ) i s utilized in the signal channel
This is observed
The only component in the system which is not readily available
commercially as a stock i tem is the discriminator cavity {lo) .
TEO1 right circular one-port cavity. The coarse tuning is accomplished
by means of a movable end wall.
which can be moved coaxially in the cavity.
should be such that the cavity frequency changes no more than 1.5 MHz
for 0.05 inch (- 1 mil l imeter) change in depth of insertion. At any
desired frequency the coupling of the cavity should be such that the
absorption i s very nearly complete.
s ee reference [4].
sensitivity but adequately low for sufficient bandwidth.
It is a
The fine tuner is a smal l diameter rod
The diameter of the rod
For further discussion of coupling
The cavity Q needs to be high enough for good
The cavity used
22

in the frequency stability measurement system described here has an
unloaded Q of approximately 20,000. Additional details a r e available
upon request f rom the authors.
4. 3. Calibration Procedure
Initial calibration of the measurement system is necessary in
o rde r to assign an absolute scale to the stability measurements.
facilitate calibration, a sinusoidally-modulated X-band source is used to
drive the system. The frequency-modulated signal i s observed on an R F
power spectral density analyzer and the modulation level is adjusted to a
value sufficient to completely suppress the X-band ca r r i e r .
oidal modulation, the f i r s t c a r r i e r null corresponds to a modulation
index of 2.4. Modulation at 5 kHz w a s found to be convenient to use
because of the particular dispersion and bandwidth settings which were
available on the particular spectrum analyzer used to display the c a r r i e r
suppression. The detailed procedure for obtaining the calibration factor
follows.
T o
For sinus-
(a) With the discriminator cavity (103 far off resonance, set the
level of the X-band signal (as de te rmbed with a dc voltmeter {16) at the
detector (15 1) to a convenient value and record the value.
variable attenuator {2] should be used for this adjustment.
venient level may be chosen provided an equal amount of power also Will
be available f rom the signal source which is to be evaluated.
The first
Any con-
(b) Adjust the cavity to resonance. The dc voltmeter at the
detector is used to determine resonance. Place the dc voltmeter at the
output of the mixer {8) and adjust the phase shifter { 6 ] in the reference
channel until the dc output a t the mixer is zero (phase quadrature).
Remove the dc voltmeter and connect the output of the mixer to a spectrum
analyzer 117’) tuned to the modulation frequency, 5 kHz.
voltage reading (Vrms) 0- the spectrum analyzer.
Record the rms
2 3

(c) It is now possible to calculate the calibration factor K.
‘* ”rms V K = ,
rms
where (A vIrms i s the r m s frequency deviation of the c a r r i e r due to
intentional frequency modulation.
equation
This deviation is calculated using the
where (A”)peak is the product of the modulation index with the frequency
of sinusoidal modulation, i. e . , 2.4 X 5 kHz = 12.025 kHz. Therefore the
calibration factor in our case is
0.707(12.025 kHz) - 8.51 kHz
rms - v rms V K =
4.4 Measurement Procedure
The procedure fo r obtaining data for the spectral density plot is
quite similar to the calibration procedure except that the X-band c a r r i e r
is not subjected to intentional modulation. - (a) W i t h the cavity f a r off resonance, set the level at the detector
to the same value obtained during calibration.
a tor f 2 ] fo r this adjustment.
a r e set to zero.
(b)
Use the variable attenu-
The other variable attenuators [5], f 121
Adjust the cavity to the resonant frequency of the X-band
Adjust the phase shifter so that the dc output a t the mixer is source.
zero.
record rms voltage readings ( v ’ the spectrum analyzer.
obtain useful readings at large Fourier frequencies.
Attach the spectrum analyzer to the output of the mixer and
) for various frequency settings of rms A low noise amplifier may be necessary to
A second reading
24

(v"
uated in the signal channel.
background noise - not attributable to actual phase noise on the car r ie r .
) should be taken at each value of f with the signal strongly atten- rms This i s to record the residual additive
This attenuation is accomplished by inserting - all (> 20 dB) of the attenu-
ation in the variable attenuator {12].
( c ) In order to calculate values of S (f) for plotting a t various 6 @
Four ie r frequencies it is convenient t o make a tabulation of results.
example of some typical results is given below in Table 1.
relations a r e used:
An
The following
V rms rms rms
= v X K rms 6 v rms
(hvrms B s (f) =
6 V
where B is the bandwidth a t which the readings were made on the
spectrum analyzer, and
Values of S
figure 14.
(f) which were calculated this way (Table 1) a r e plotted in & @
25

5 x l o 3
3 2.5 x 10
3 1 x 10
640
320
210
150
90
40
20
10
TABLE 1
Worksheet for Calculation of S (f) 6@-
8.51 X 10' Hz 3 Calibration factor K 0 .88 V
= 9. 67 X 10 Hz/V
7
(74 dB)t
6. 2 X l o 6 (68 dB)
1.0 x 10 (60 dB)
4.1 x 10 (56 dB)
1.0 x 10 (50 dB)
4.4 x 10 (46 dB)
2.2 x 10 (44 dB)
8. 1 X 10 (39 dB)
1. 6 X 10 (32 dB)
2.5 X 10
6
5
5
4
4
3
3
40 0 (26 dB)
100 (20 dB)
B (Hz 1
100
100
100
10
10
10
10
1
1
1
1
V rms (PVI
6 60
7 80
1000
1200
460
5 80
680
230
300
45 0
700
6. 38
7.54
9. 67
11. 6
4.45
5.61
6.58
2.22
2.90
4.35
6.77
40. 7
56.9
93.5
135.0
19. 8
31. 5
43. 3
4.93
8.41
18. 9
45. 8
2 -1 *Sd6(f) is tabulated in decibels re la t ive to 1 radian Hz t d B relative to 1 Hz
1 1 dB relative to 1 Hz2 Hz-
2
0.41 (-3.9 dB)$
0.57 (-2.4 dB)
0.94 (-0. 3 dB)
1.4 (1.5 dB)
2.0 (3.0 dB)
3.2 (5. 1 dB)
4 .3 (6. 3 dB)
4.9 (6.9 dB)
8 . 4 (9. 3 dB)
19.0 (12. 8 dB)
46.0 (16. 6 dB)
S6*(f)
(dB 1 * -77.9
- 7 0 . 4
-60. 3
-54.5
-47.0
-40.9
-37.7
-32. 1
-22.7
- 13.2
- 3.4
2 6

0
0
0
0
0
0
0
0 0
w
27

4.5. Additional Techniques for Frequency Stability Measurements a t X-Band
It has been found convenient and desirable, under certain
circumstances, to use other techniques for measuring frequency stabil-
ity at X-band.
frequency-locking techniques similar to those used at H F can be used.
(See figs. 15, 16, and 17. ) Good wide-band double-balanced mixers
with coaxial connectors a r e available [ 11 ] which permit many of the
measurements to be performed without use of waveguide components.
Where two X-band sources a r e available, phase- o r
The measurement setup as shown in the block diagram of f igure 9
can also be used at microwave frequencies utilizing a computing counter
for time domain measurements.
stability have been made on stabilized X-band sources [ 12 3. domain data obtained via the computing counter have been compared
with frequency domain data obtained via several methods.
Extensive measurements of frequency
Time
An example shown in Appendix C translates the frequency domain
data of figure 14 into estimated t ime domain performance shown in
figure 18.
directly via a computing counter (see fig. 9).
In the same figure we have plotted time domain data taken
5 . SUMMARY
Terminology and concise definitions for the specification of
frequency stability have been given.
measurement systems were described in detail for both high frequency
and X-band signals. Ekperimental resul ts are compared using various
systems.
Recommended techniques and
Examples of computations are also included.
A. E. Wainwright, Howard E. Bell, and David W. Allan have
assis ted in the development of the measurement systems reported here .
Their contributions a r e gratefully acknowledged. The authors appreci-
a te the assistance of Mrs. E. Helfrich in the preparation of the manu-
script . 28

I
29

n N 2 A
0 e w c3
I- A 0 > z 0
+ u W cz cz 0 V
a
U
I p: W x
r c(
N N I I 5: E
I "
30

+ o v,>
X a 0 0 LD
m
x m
N b, X v ,
> & o w v,
31

0
I I
I I I I I I 6 I I I I I I I
0 1 I
32

6. REFERENCES
[ 11 Shoaf, John H., Specification and measurement of frequency stability, NBS Report 9794, 7 September 1971 (supersedes report dated 30 June 1971), sponsored by Army/Navy/Air Force Joint Technical Coordinating Group for Metrology and Calibration.
[ 2 ] Barnes, J. A., Chi, A. R., Cutler, L. S., et a l . , Characteri- zation of frequency stability, NBS Technical Note 394 (October 1970); also published in IEEE Trans. on Instr . and Meas. IM-20, No. 2, pp. 105-120 (May 1971).
[ 3 ] Allan, D. W . , Statistics of atomic frequency standards, Proc. IEEE54 , - No. 2, pp. 221-230 (February 1966).
[4 ] Van Duzer, V. , Short-term stability measurements, Proc . of the IEEE-NASA Symposium on the Definition and Measurement of Short-Term Frequency Stability, NASA SP-80, pp. 269-272 (1965).
[ 5 ] Meyer, D. G., A t e s t se t for measurement of phase noise on high quality signal sources , IEEE Trans. on Instr. and Meas. IM-19, No. 4, pp. 215-227 (November 1970).
[6] Shields, R. B., Review of the specification and measurement of short- term stability, Microwave Journal, pp. 49-55 (June 1969).
[7] Cutler, L. S . , and Searle, C. L., Some aspects of the theory and measurement of frequency fluctuations in frequency standards, Proc. IEEE - 54, No. 2, pp. 136-154 (February 1966).
[8] Hewlett-Packard, Computing counter applications l ibrary, Nos. 7, 22, 27, 29 (1970).
[9] Ashley, J. R. , Sear les , C. B. , and Palka, F. M. , The measure- ment of oscillator noise at microwave frequencies, IEEE Trans . on Microwave Theory and Techniques MTT-16, No. 9, pp. 753-760 (September 19 68).
[ l o ] Ondria, John, A microwave system for measurements of AM and FM noise spectra , IEEE Trans. on Microwave Theory and Techniques MTT-16, No. 9 , pp. 767-781 (September 1968).
33

[11] Reeve, G. R., Signal detection systems, NBS Report 9767 (October 19 67), sponsored by Army/Navy/Air Force JTCG-METCAL/CCG on Contract 69-25b.
[ 123 Risley, A. S. , et al. , Frequency stabilization of X-band sources for use in frequency synthesis into the infrared, t o be published.
3 4

APPENDIX A
Glossary of Symbols
A
B Pt P
a B
f
f h
h a
K
d (f)
M
N
Ptotal
r
Peak-to-peak voltage of a beat frequency a t output of mixer
High frequency cutoff f (bandwidth) h
Analysis bandwidth (frequency window) of the spectrum analyzer
Fourier frequency of fluctuations
Defined a s B, high frequency cutoff (bandwidth)
Coefficient of f" in spectral density representation
Calibration factor used in the single oscillator stability measurement system for microwave frequencies, K = ( A v ) / V
Integers (used a s index of summation)
rms rms
Frequency domain measure of phase fluctuations; Script f (f) is defined a s the ratio of
Power density (one phase modulation sideband) Power (total signal)
,
For small 66, S6@(f) w 2 f (f)
Total number of data values available (usually M >>N)
Number of data values used in obtaining a sample variance
Total power of signal
Parameter r e iated
Spectral density of
Spectral density of
Spectral density of
to dead t ime; r 3 T / T
frequency fluctuations
voltage fluctuations 2
( f ) = 7 = S (f)T s Jf) "0
6@ f Y f phase fluctuations; S
35
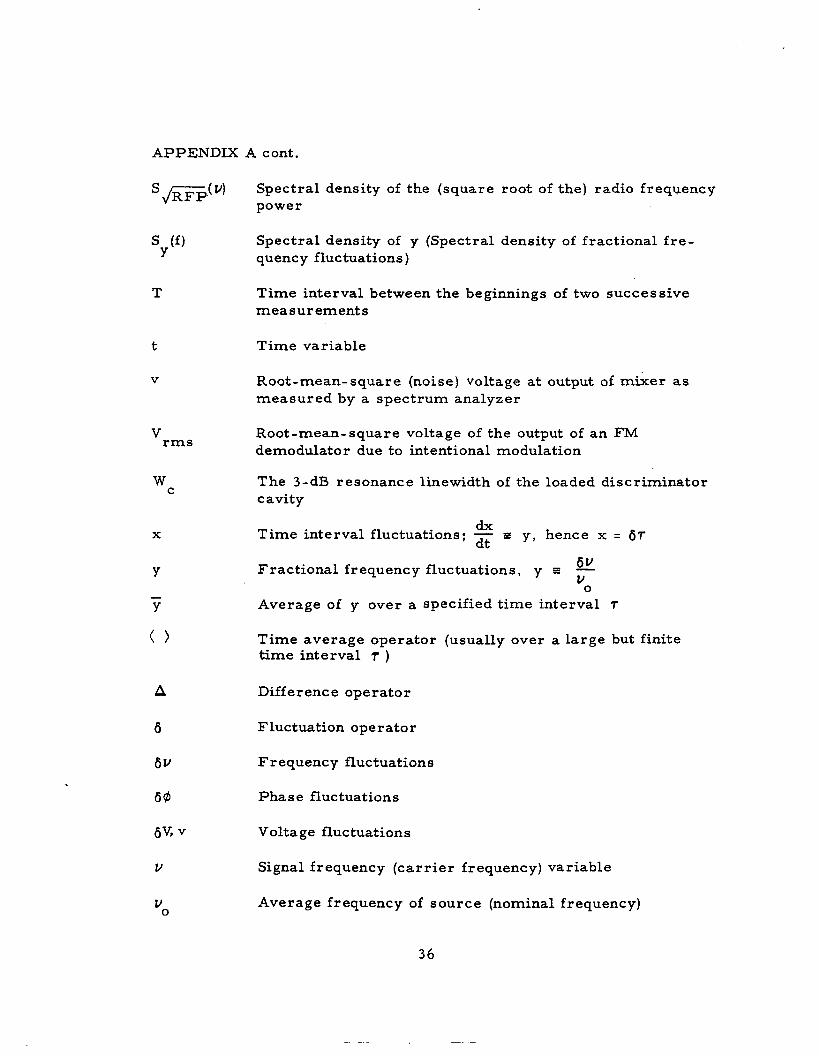
APPENDIX A cont.
Spectral density of the (square root of the) radio frequency power J F P ( V )
s (f) Spectral density of y (Spectral density of fractional f re - Y quency fluctuations)
T Time interval between the beginnings of two successive measurements
t Time variable
V Root-mean-square (noise) voltage at outFut of mixer as measured by a spectrum analyzer
Root-mean-square voltage of the output of an FM demodulator due to intentional modulation rms V
The 3-dB resonance linewidth of the loaded discriminator cavity
C W
X
Y - Y
0
A
&
U
VO
dx dt
Time interval fluctuations; - I y, hence x = &T
6 V Fractional frequency fluctuations, y I - Average of y over a specified t ime interval 7
VO
Time average operator (usually over a large but finite t ime interval r )
Difference operator
Fluctuation operator
Frequency fluctuations
Phase fluctuations
Voltage fluctuations
Signal frequency (car r ie r frequency) variable
Average frequency of source (nominal frequency)
36

APPENDIX A cont.
a
2 a (7)
Y
w
Square root of a variance
Specific Allan variance where N = 2 , T = T
Sample variance of N averages of y(t), each of duration r and repeated every T units of t ime (Allan variance) measured in a post-detection noise bandwidth of f h
Sampling t ime interval
Post-detection averaging time of the spectrum analyzer
Signal angular frequency ( ca r r i e r angular frequency), n = 2 T Y
Fourier angular frequency of fluctuations, o I 2nf
37

APPENDIX B
z - c
z
4 2
N
E '
38

APPENDIX C
Translation of Data f rom Frequency Domain Into Time Domain Performance Using the Conversion Chart
Referring to the frequency domain plot in figure 14 it is - 3 determined that S (f) indicates approximate f behavior over the
total range plotted. Therefore S (f) is nearly proportional to f 6 V
(i. e., flicker frequency noise). At f = 1000 Hz, Sav(f) is equal to
-0.3 dB relative to 1 Hz (see Table 1). The c a r r i e r frequency, vo, is
9.5 GHz.
-1 6@
0 3 -20 - 1 (C1)
Sgv(f)
uO
Hz) 1.04 X 10 Hz , 9 2 = - s (f) = - -
( 9 . 5 X 10 Hz) Y 2
for f = 1000 Hz.
- 1 h s (f) = - (see conversion chart) Y f
3 h = S (f) x f = (1.04 x 10⁻²⁰H~-1) x (10 Hz! = 10.4 x -1 Y
(C3)
2 Y
- 2In2 = 10.4 X 10 -18 X 1.39 = 14.5 X 10 -18 -1 0 (7) = h
(C4)
For a flicker frequency noise the re is no 7 dependence.
at this calculated value is plotted on the same graph as data taken directly
in the t ime domain (fig. 18).
A dashed line
39

APPENDIX D
Spectral Densities: Frequency Domain Measures of Stability
Donald Halford
Stabilities in the frequency domain a r e commonly specified a s
spectral densities.
tensively in the preparation of this report .
concept is simple and very useful, but c a r e must be exercised in its
use.
densities which a r e used in this paper. In this Appendix, we state and
explain some of the simple, often-needed relations among these four
often-used types of spectral densities.
We have used the concept of spectral density ex-
The spectral density
There a r e at least four different, but related, types of spectral
The four types which we have used, and which a r e most relevant
to frequency and phase fluctuations, a r e
Spectral density of fractional frequency fluctuations
(noise, instability, modulation). The dimensionality
is HZ-'. The range of f is f rom zero to infinity.
Spectral density of frequency fluctuations (noise,
instability, modulation). The dimensionality is Hz
per Hz.
2
The range of f is f rom zero to infinity.
Spectral density of phase fluctuations (noise, insta-
bility, modulation).
per Hz.
2 The dimensionality i s rad
The range of f is f rom zero to infinity.
Script f ( f ) is a frequency domain measure of phase
fluctuations (noise , instability, modulation). Script
f(f) is defined as the ratio of the power in one phase
noise sideband, re fer red to the input c a r r i e r fre-
quency, on a per hertz of bandwidth spectral density
basis, to the total signal power, at Fourier frequency
f f r o m the signal's average frequency v , per one 0
. 40

APPENDIX D cont.
- 1 device. The dimensionality is Hz . The .range
of f is f rom minus v to plus infinity. 0
Each of these spectral densities i s one-sided and is on a.per
This means that the total mean- her tz of bandwidth derrsity basis.
square fluctuation (the total variance) of frequency, for example, is
given mathematically by
and, as another example, since Script f ( f ) is a normalized density,
that
t o o
s.(f) df
- vo is equal to unity.
Two-sided spectral densities a r e defined such that the range of
integration is f rom minus infinity to plus infinity.
noise as t reated in this paper , our one-sided spectral density is twice
a s large a s the corresponding two-sided spectral density.
For specification of
That is,
too too foo
1 df. Two-sided One- Sided
]df = 2 [ S f -M CSTwo-Sided J 0 0
Two- sided spectral densities a r e useful mainly in pure mathematical
analysis.
experimental work.
t r a l densities.
We recommend and use one- sided spectral densities for
References [ l ] and [ 2 ] also use one-sided spec-
4 1

APPENDIX D cont.
We use the definition
6 V y I -, vO
and it follows that
To relate frequency, angular frequency, and phase we use
(D4) d @(t) 2r[v(t) J = Q(t) = - dt '
This may be regarded as a definition of instantaneous frequency v(t). F r o m equation (D4), a direct resul t of t ransform theory is
Script f ( f ) can be related in a simple way to S ( f ) , but only fo r
the condition that the phase fluctuations occurring a t ra tes f and fas te r
a r e small compared to one radian.
must be used to relate Script d(f) to S (f) . Fortunately, the t t smal l
angle conditiontf is often met in random noise problems. Specifically
we use
6@
Otherwise Bessel function algebra
6@
42

APPENDIX D cont.
pro vi ded that
Fo r the types of signals under discussion and for If I < v , we 0
use a s a good approximation
( v ) , with i ts frequency Script f ( f ) is the normalized version of S
parameter f referenced to the signal's average frequency u origin such that f equals v -
JKFF a s the
0
vO-
Some Mathematics of Phase Sideband Power a s Related to Phase
Fluctuations: A simple derivation of equation (D6) is possible. We
combine the derivation with an example which i l lustrates the operation
of a double-balanced mixer a s a phase detector.
sinusoidal 5 -MHz signals (having negligible amplitude modulation)
feeding the two input ports of a double-balanced mixer.
signals a r e slightly out of zero beat, a slow sinusoidal beat with a
period of several seconds a t the output of the mixer i s measured to
have a peak-to-peak swing of A
Consider two
When the two
PtP'

APPENDIX D cont.
Without changing their amplitudes, the two signals a r e retuned
T / 2 out of phase to be a t zero beat and in phase quadrature (that is,
with each other), and the output of the mixer is a small fluctuating volt-
age centered on zero volts.
compared to Aptp/2, the phase quadrature condition is being closely
maintained, and the "small angle condition" is being met.
Provided this fluctuating voltage is small
Phase fluctuations 6@ between the two signals of phases @ and 2
a1, respectively, where
will give r i s e to voltage fluctuations gV a t the output of the mixer
where we have used radian measure for phase angles, and we have
used
sin 6@ M b @
for small 6@ (6@ <c 1 rad). We solve equation (D10) for 6@, square
both sides and take a time average
If we interpret the mean-square fluctuations of 6@ and of 6V,
respectively, in equation (D12) in a spectral density fashion, we may
write
44

APPENDIX D cont.
where we have used
which is valid for the sinusoidal beat signal.
For the types of signals under consideration, by definition the
two phase noise sidebands (lower sideband and upper sideband, a t -f
and t f f rom v respectively) of a signal a r e coherent with each other.
As already expressed in equation (DB), they a r e of equal intensity also.
The operation of the mixer when it is driven at quadrature is such that
the amplitudes of the two phase sidebands add linearly in the output of
the mixer , resulting in four t imes as much power in the output a s
would be present if only one of the phase sidebands were allowed to
contribute to the output of the mixer. Hence for If 1 < v we obtain
0'
0
and, using the definition of Script f (f) ,
provided the phase quadrature condition i s approximately valid.
45

APPENDIX D cont.
The phase quadrature condition will be met for a t ime interval at least
T long, provided
2 (f ' )df ' << 1 rad ,
(2777)-
and hence equation (D16) is useful for values of f a t least a s low as
(2nT)-l. Equations (D16) and (D17) correspond to equations (D6) and
(D7) respectively.
46

APPENDIX E
A Sample Calculation of Script f
Script f (f) i s easily measured using a double-balanced mixer
a s a phase sensitive dctector, together with a spectrum analyzer which
can measure a t the frequency f. Equation (El) is valid for the case
where the reference signal has negligible phase noise compared to the
t e s t signal.
However, eq (E2) is the valid equation when we have two equally noisy
signals (test and reference) driving the mixer .
In case the device being measured has amplification of t imes n
(i. e. , frequency multiplication or frequency synthesis), the definition
of Script f ( f ) requires that the factor n appear in eqs ( E l ) and (E2).
Fo r example, a frequency synthesizer with out?ut at 45.55 MHz, and
with i ts input driven a t 5 MHz, i s characterized by n equal 9.11
corresponding to a phase fluctuations increase expressed in decibels of
19.2 dB.
2
(E31 2 10 log n = 20 log n = 20 log 9 . 11 = 19.2 dB.
Both ( E l ) and (E2) require that the beat signal out of the mixer be
sinusoidal when the two input signals a r e slightly out of zero beat.
peak-to-peak amplitude of the beat i s A
The
PtP'
47

APPENDIX E cont.
Fo r convenience of computation and plotting it often is advanta-
geous to set the beat frequency voltage (before locking) to some special
voltage such a s - volts (0 . 316 V) peak-to-peak a t the mixer output.
Then (after lock) with the output of the phase detector expressed in rms
nanovolts per root her tz , direct plotting is facilitated for Script f (f) in
decibels versus frequency in hertz.
nanovolts per root hertz correspond to -110, -130, and -150 dB
respectively.
shown below.
m
In this case 1000, 100, and 10
A sample calculation demonstrating this convenience is
Given: 1 A = 0.316V ( i . e . , - Pt P
(E5 1 - 1 / 2 v = 100 nV. Hz rms
a t f equal to 20 Hz for a pair of equally noisy devices having no frequency
multiplication (n = 1): 3
a t f equal to 20 He. Or, using logarithms:
48

APPENDIX E cont.
two units = 2o log l o ( Aptp ) (E9 1
- 5, V . Hz = 20 loglo = 20(-7 t 0 .5 ) = -130 dB (E101 ( l o - '/2 V)
at f equal to 20 Hz.
If the phase noise were t o follow flicker law ( l / f ) , at f equal to
1 Hz the mean square noise would be 20 times worse ( 1 3 dB greater) .
That is
d ( l Hz) = -130 dB t 1 3 dB = -117 dB. (El 1)
49

APPENDIX F
2 A SamDle Calculation of Allan Variance. rr (7)
M-1 2 2 ('k+i-'k)) c ('kt1 - - 2 'k)
2(M- 1) (7) E (0 ( N = 2 , T = 7,T))=
Y Y k= 1
in the example below:
Number of data values available, M = 9
Number of differences averaged, M - 1 = 8
Sampling t ime interval 7 = 1s
Data values Fir st differences First differences squared
89 2 809 823 79 8 67 1 644 883 903 67 7
- 83 14
- 25 - 127 - 27
2 39 20
-226 M- 1
6889 19 6 625
16129 7 29
57121 400
51076
= 133165 - 2 1 ('kt1 - 'k) k= 1
Based on these data:
133165 = 8322.81, 2 = 2(8)
[0;(7)]'= 4- = 91.23, N = 2, T = T = 1 s. (F3)
In this example, the data values may be understood to be expressed in
par ts in 10 . 12
50

APPENDIX F cont.
Using the same data a s in the above example it is possible to
calculate the Allan variance for T = 2 s by averaging pa i rs of adjacent
data values and using these averaged values as new data values to
proceed with the calculation a s before.
obtained for T = 3 s by averaging three adjacent data values in a similar
manner , e tc . , for la rger values of T.
Allan variance values may be
Ideally the calculation i s done via a computer and a la rge
number, M, of data values should be used.
values a r e used in the NBS computer program. )
dence of the calculated Allan variance improves nominally a s the square
root of the number, M, of data values used. For’ M = 2 5 6 , the confi-
dence of the Allan variance i s not expected to be bet ter than approxi-
(Typically M = 2 5 6 data
The statist ical confi-
1 X 100% i% in the r m s sense. The use of M >> 1 Jz- mately
i s logically s imi la r to the use of B - 7 >> 1 in spectrum analysis
measurements , where B i s the analysis bandwidth (frequency window)
of the spectrum.analyzer, and T i s the post-detection averaging t ime
of the spectrum analyzer.
a a
a
a
5 1

APPENDIX G
COMPUTING COUNTER 0 (7 ) PROGRAM Y
USING AN EFFICIENT OVERLAPPING ESTIMATOR
David W. Allan
MANUAL (19) REPEAT
Enter car r ie r or basic frequency (20) X FER PROGRAM A -
e C b X (21) N X Y
(22) N X Y [skip to ( 3 3 ) i f program is already in]
(23) t (add) LEARN
C L E M x 4
b*x MODULE or PLUG-IN A
a x * X FER PROGRAM
MODULE or PLUG-IN
a*Y - (subtract) 4 X Y
x (multiply) e bXY + (add)
(26) axY 4
(30) + (divide)
( 3 1 ) DISPLAY x
(32) P A U S E
( 3 3 ) RUN
( 3 4 ) START
Program will automatically r e peat unless righthand PAUSE switch is in H A L T position
Sample time (computing counter "measurement time") T - r = 0 . 0 0 3 seconds (compute t cycle time)
N = 2
Number set on variance. For required.
repeat loop corresponds to the number of estimates of the good confidence levels 100 or more estimates usually a r e
52

1.
2.
3 .
4.
5.
6.
7.
APPENDIX H
Some Important References
Measurement and Specification of Frequency Stability
General References
November o r December of even-numbered years - IEEE Transactions on Instrumentation and Measurement (Conference on Precis ion Electromagnetic Measurements, held every two years).
February 1966 Proceedings of the IEEE, Special Issue on Frequency Stability (IEEE-NASA Symposium). Very useful.
Proceedings of the IEEE-NASA Symposium on the Definition and Measurement of Short-Term Frequency Stability a t Goddard Space Flight Center, Greenbelt, Maryland, November 23-24, 1964. Prepared by Goddard Space Flight Center (Scientific & Technical Information Division, National Aeronautics and Space Administra- tion, Washington, D. C. , 1965). Copies available for $1.75 f rom the U. S. Government Printing Office, Washington, D. C. 20402.
The annual Proceedings of the Symposium on Frequency Cofitrol (Fort Momouth) . The Proceedings a r e not edited nor reviewed.
J. A. Barnes, A. R. Chi, L. S. Cutler, et a l . , l lCharacterization of Frequency Stability, also published in IEEE Trans. on Instr. and Meas. IM-20, No. 2, pp. 105-120 (May 1971). This is the most definitive discussion to date of the characterization and measurement of frequency stability It was prepared by the Subcommittee on Frequency Stability of the Institute of Electrical and Electronic Engineers.
NBS Technical Note 394 (October 1970);
September 1968 IEEE Transactions on Microwave Theory and Techniques, Special Iss.ue on Noise.
Frequency and Time Standards, Application Note 52, Hewlett- Packard Company (November 1965).
53

APPENDIX H cont.
Some Specific Papers
8.
9.
10.
11.
12.
13.
D. W. Allan, "Statistics of Atomic Frequency Standards, Proc. IEEE, vol. 54, pp. 221-230, February 1966. A thorough understanding of this paper is important fo r everyone who wishes to measure and quote performance of frequency standards in the t ime domain, e. g., cr versus T plots. The data analysis must take into account the number of samples taken and how they a r e used.
David W. Allan, B. E. Blair , D. D. Davis, and H. E. Machlan, "Precision and Accuracy of Remote Synchroniza- tion via Portable Clocks, Loran C, and Network Television Broadcasts, I f Proc. 25th Annual Symposium on Frequency Control, Fort Monmouth, N. J. , pp. 195-208, April 1971.
J. R. Ashley, C. B. Searles, and F. M. Palka, "The Measurement of Oscillator Noise a t Microwave Frequencies, IEEE Trans. on Microwave Theory and Techniques MTT- 16, No. 9 , pp. 753-760, September 1968.
E. J. Baghdady, R. N. Lincoln, and B. D. Nelin, "Short- T e rm Frequency Stability: Characterization, Theory , and Measurement, I f Proc. IEEE, vol. 53, pp. 704-722, July 1965. Among many other topics, the possible problem of AM noise is discussed.
Helmut B randenbe r ge r , F r ede r ic Hadorn, Donald Halfo rd, and John H. Shoaf, "High Quality Quartz Crystal Oscillators: Frequency Domain and Time Domain Stability, Proc. 25th Annual Symposium on Frequency Control, For t Monmouth, N. J . , pp. 226-230 April 1971. An example of 1970 "state- of-the-art" measurements.
L. S. Cutler, "Present Status in Short T e r m Frequency Stability, I t Frequency, vol. 5 , pp. 13- 15 , September-October 1967. This is a well-written, concise progress report with indications for future effort. Caution: His examples I and I1 were not in fact state-of-the-art, while example I V has some factor-of-ten typographical e r r o r s as given.
5 4

APPENDIX H cont.
14.
15.
16.
17.
18.
19.
20.
21.
22.
L. S. Cutler and C. L. Sear le , I1Some Aspects of the Theory and Measurement of Frequency Fluctuations in Frequency Standards, I ‘ Proc . IEEE, vol. 54, pp. 136- 154, February 1966. ematics , and measurement techniques- -with physical insight into the noise processes of practical concern.
This is a useful t reatment of some of the theory, math-
W. A. Edson, “Noise in Oscil lators, Proc . IRE, vol. 48, pp. 1452-1466, August 1960. This paper is an “old classic. I f
C. Finnie, R. Sydnor, and A. Sward, “HydrogenMaser Frequency Standard, I f Proc. 25th Annual Symposium on Frequency Control, For t Monmouth, N. J . , pp. 348-351, April 197 1. State-of-the-art H m a s e r stability.
D. J. Glaze, “Improvements in Atomic Beam Frequency Standards at the National Bureau of Standards, I ’ IEEE Trans . on Ins t r . andMeas . IM-19, No. 3 , pp. 156-160, August 1970.
D. B. Leeson, “A Simple Model of Feedback Oscillator Noise Spectrum, ‘ I Proc. IEEE (Let te rs ) , vol. 54, pp. 329- 330, February 1966. manner.
Descriptive, in a simple, practical
J. A. Mullen, “Background Noise in Nonlinear Oscil lators, I ’
Proc. IRE, vol. 48, pp. 1467-1473, August 1960. An “old classic. I f
J. G. Ondria, “A Microwave System for Measurements of AM and FM Noise Spectra, I f IEEE Trans . on Microwave Theory and Techniques MTT-16, No. 9 , pp. 767-781, September 1968.
H. P. Stratemeyer , “The Stability of Standard-Frequency Oscillators, I f General Radio Experimenter , vol. 38, pp. 1 - 16, June 1964. Easy reading.
V. Van Duzer, “Short-Term Stability Measurements , IEEE - NASA Symposium on Short - T e r m Frequency Stability, Washington, D. C. : U. S. Government Printing Office, pp. 269- 272, NASA-SP80. The basic method described by Van Duzer is simple, elegant, easily instrumented, easily modified, extremely versati le, and capable of the best resolution which is attained at today‘ s state-of-the-art.
5 5

BIBLIOGRAPHY
1. D. W. Allan, "Statistics of Atomic Frequency Standards, I ( Proc . IEEE, vol. 54, pp. 221-230, February 1966.
2. David W. Allan, B. E. Blair , D. D. Davis, and H. E. Machlan, "Precision and Accuracy of Remote Synchronization via Portable Clocks, Loran C, and Network Television Broadcasts, Proc. 25th Annual Symposium on Frequency Control, Fo r t Monmouth, N. J . , pp. 195-208, April 1971.
3. David W. Allan, James E. Gray, and H. E. Machlan, The National Bureau of Standards Atomic Time Scales: Generation, Dissemination, Stability, and Accuracy, ' I IEEE Trans . on Instrumentation and Measurement LM-21, No. 4, pp. 388-391, November 1972.
4. David W. Allan, H. E. Machlan, and James Marshall , "Time Transfer Using Nearly Simultaneous Reception Times of a Common Transmission, I t Proc . 26th Annual Symposium on Frequency Control, Fo r t Monmouth, N. J. , pp. 309 - 3 16, June 1972.
5. A. E. Anderson and H. P. Brower, "A Tunable Phase Detector for Short-Term Frequency Measurement, Symposium on the Definition and Measurement of Short-Term Frequency Stability, NASA SP-80, pp. 295-302, 1965.
Proc. IEEE-NASA
6. J. R. Ashley and C. B. Sear les , IIMicrowave Oscillator Noise Reduction by a Transmission Stabilizing Cavity, IEEE Trans. on Microwave Theory and Techniques MTT-16, J$o. 9, pp. 743-748, September 1968.
7. J. R. Ashley, C. B. Sear les , and F. M. Palka, "The Measurement of Oscillator Noise at Microwave Frequencies, I t IEEE Trans. on Microwave Theory and Techniques MTT-16, No. 9, pp. 753-760, September 19 68.
8. W. Atkinson and L. Fey, "Statistical Aspects of Clock E r r o r s , ' I
NBS Report 6085, January 5, 1960.
9. W. R. Atkinson, L. Fey, and J. Newman, "Spectrum Analysis Of Extremely Low Frequency Variations of Quartz Oscil lators, ' I
Proc. IEEE (Correspondence), vol. 51, p. 379, February 1963.
56

BIBLIOGRAPHY cont.
10.
1 I.
12.
13.
14.
15.
16.
17.
18.
19.
E. J. Baghdady, R. D. Lincoln, and B. D. Nel in , "Short-Term Frequency Stability: Theory, Measurement, and Status, I 1 Proc. IEEE-NASA Symposium on Shor t -Term Frequency Stability, NASASP-80, pp. 65-87, 1965; a lso Proc. IEEE, vol. 53, pp. 704-722, 2110-2111, 1965.
J.. J. Bagnall, J r . , "The Effect of Noise on an Oscillator Controlled by a P r imary Reference, NEREM 1959 Record, pp. 84-86.
J. A. Barnes, "Studies of Frequency Stability, NBS Report 9739, August 15, 1969.
J. A. Barnes, "Frequency Measurement E r r o r s of Pass ive Resonators Caused by Frequency-Modulated Exciting Signals, IEEE Trans. on Instrumentation and Measurement IM-19, No. 3, pp. 147-152, August 1970.
J. A. Barnes, "Atomic Timekeeping and the Statistics of Precision Signal Generators, I ' Proc. IEEE, vol. 54, pp. 207-220, February 1966.
J. A. Barnes, "Tables of Bias Functions, B1 and B2, f o r Variances Based on Finite Samples of P r o c e s s e s with Power Law Spectral Densities, I r NBS Technical Note 375, January 1969.
J. A. Barnes and D. W. Allan, "A Statistical Model of Flicker Noise, I f Proc. IEEE, vol. 54, pp. 176-178, February 1966.
J. A. Barnes and D. W. Allan, "Effects of Long-Term Stability on the Definition and Measurement of Shor t -Term Stability, Proc. IEEE-NASA Symposium on Short-Term Frequency Stability, NASA SP-80, pp. 119-123, 1965.
J. A. Barnes, A. R. Chi, L. S. Cutler, et a l . , "Characterization of Frequency Stability, ' I NBS Technical Note 394, October 1970; a lso published in IEEE Trans. on Instrumentation and Measure- ment IM-20, No. 2, pp. 105-120, May 1971.
J. A. Barnes and L. E. Heim, "A High-Resolution Ammonia Mase r Spectrum Analyzer, No. 1, pp. 4-8, June 1961; a lso NBS Report 6098, April 29, 1960.
IRE Trans. on Instrumentation 1-10.
57

BIBLIOGRAPHY cont.
20.
21.
22.
23.
24.
25.
26.
27.
28.
29.
30.
J. A. Barnes and R. C. Mockler, "The Power Spectrum and Its Importance in P rec i se Frequency Measurements , Instrumentation 1-9, pp. 149- 155, September 1960.
IRE Trans . on
Richard A. Baugh, "Low Noise Frequency Multiplication, I ' Proc. 26th Annual Symposium on Frequency Control, For t Monmouth, N. J . , pp. 50-54, June 1972.
J. S. Bendat, Principles and Applications of Random Noise Theory. New York: John Wiley and Sons, p. 79, 1958.
W. R. Bennett, Electrical Noise. New York: McGraw-Hill, 1960.
W. R. Bennett, "Methods of Solving Noise Problems, Proc. IRE, vol. 44, pp. 609-638 (Eq. 223 ff. ), May 1956.
I. Berstein and G. Gorelik, IIFrequency Modulation Noise in Oscillators, I t Proc. IRE (Correspondence), vol. 45, p. 94, January 1957.
C. Bingham, M. D. Godfrey, and J. W. Tukey, ltModern Techniques of Power Spectrum Estimation, vol. 15, pp. 56-66, June 1967.
IEEE Trans. AU,
R. B. Blackman and J. W. Tukey, The Measurement of Power Spectra. New York: Dover, 1958.
Helmut Brandenberger, F rede r i c Hadorn, Donald Halford, and John H. Shoaf, "High Quality Quartz Crys ta l Oscillators: Frequency Domain and Time Domain Stability, Proc . 25th Annual Symposium on Frequency Control, Fo r t Monmouth, N. J . , pp. 226-230, April 1971.
E. 0. Brigham and R. E. Morrow, "The Fast Fourier Transforlx," IEEE Spectrum, vol. 4, pp. 63-70, December 1967.
J. R. Buck and D. J. Healey, ID, "Calibration of Shor t -Term Frequency Stability Measuring Apparatus, vol. 54, p. 305, February 1966.
Proc. IEEE L.,
5 8

BIBLIOGRAPHY cont.
31.
32.
33.
34.
35.
36.
37.
38.
39.
40.
41.
J. R. Buck and D. J. Healey, LT.I, "Short T e r m Frequency Stability Measurement of Crystal Controlled X-Band Source, I ' Proc. IEEE-NASA Symposium on Short-Term Frequency Stability, NASA SP-80, pp. 201-209, 1965.
J. R. Buck, D. J. Healey, III, and M. Meiseles, "Measurement of Phase Stability of Quartz Crystal Oscil lators fo r Airborne Radar Applications, I f IEEE International Conv. Rec. , pt. 8, pp. 34-42, March 1964.
G. A. Campbell and R . M. Fos te r , Fourier Integrals for Prac t ica l Applications. Princeton, N . J . : D. Van Nostrand, 1948.
R. A. Campbell, "Stability Measurement Techniques in the Frequency Domain, Ir Proc. IEEE-NASA Symposium on the Definition and Measurement of Short-Term Frequency Stability, NASA SP-80, pp. 231-235, 1965.
E. R. Chenette, '!Low Noise Trans is tor Amplifiers, Solid State Design, vol. 5 , pp. 27-30, February 1964.
J. Chramiec, "Noise Proper t ies of a Superregenerative Pa rame t r i c Amplifier, P r o c IEEE, vol. 54, p. 704, April 1966.
E. L. Crow, I'The Statistical Construction of a Single Standard f rom Several Available Standards, I 1 IEEE Trans. on Instrumenta- tion and Measurement IM-13, pp. 180-185, December 1964.
L. S. Cutler, "Some Aspects of the Theory and Measurement of Frequency Fluctuations in Frequency Standards, I ' Proc. IEEE-NASA Symposium on the Definition and Measurement of Short-Term Frequency Stability, NASA SP-80, pp. 89- 100, 1965.
L. S. Cutler, "Present Status in Short T e r m Frequency Stability, Frequency, vol. 5, pp. 13- 15, September-October 1967.
L. S. Cutler and C. L. Searle , "Some Aspects of the Theory and Measurement of Frequency Fluctuations in Frequency Standards, ' I
Proc. IEEE, vol. 54, pp. 136-154, February 1966.
W. B. Davenport and W. L. Root, Random Signals and Noise. New York: McGraw Hill, Ch. 6, 1958.
59

BIBLIOGRAPHY cont.
42.
43.
44.
45.
46.
47.
48.
49.
5 0 .
5 1.
M. M. Driscoll, ffTwoStage Self-Limiting Series Mode Type Quartz Crystal Oscillator Exhibiting Improved Short-Term Frequency Stability, Proc. 26th Annual Symposium on F r e - quency Control, For t Monmouth, N. J . , pp. 43-49, June 1972.
E. V. Dvornikov, E. A. Mavrin, and N. V. Morkovin,. "A High- Stability Transistorized Crystal Oscillator, Eksperim. (USSR), No. 4, July-August 1963. F o r English translation see Instr. Exper. Tech. (USSR), pp. 672-674, July- August 19 63.
Pr ibory i Tekhn.
W. A. Edson, "Noise in Oscillators, Proc. IRE, vol. 48, pp. 1454- 1466, August 19 60.
W. A. Edson, "Progress and Problems in Short T e r m Stability, ' I Proc. 19th Annual Symposium on Frequency Control, For t Monmouth, N. J . , pp. 43-48, 20-22 April 1965.
R. Esposito and J. A. Mullen, 'INoise in Oscillators with General Tank Circuits, I f IRE International Cod . Rec., pt. 4, pp. 202-208, March 1961.
C. Finnie, R. Sydnor, and A. Sward, "Hydrogen Maser Frequency Standard, Proc. 25th Annual Symposium on Frequency Control, For t Monmouth, N. J . , pp. 348-351, April 1971.
L. Fey, W. R. Atkinson, and J. Newman, "Obscurities of Oscillator Noise, Proc. IEEE (Correspondence), vol. 52, pp. 104- 105, January 19 64.
E. A. Gerber and R. A. Sykes, "State of the Art--Quartz Crystal Units and Oscillators, Proc. IEEE, vol. 54, pp. 103-116, February 1966.
E. A. Gerber and R. A. Sykes, "Quartz Frequency Standards, I' Proc. IEEE, vol. 55, pp. 783-791, June 1967.
D. J. Glaze, "Improvements in Atomic Eeam Frequency Standards at the National Bureau of Standards, I t IEEE Trans. on Instrumentation and Measurement IM- 19, No. 3, pp. 15 6- 160, August 1970.
60

BIBLIOGRAPHY cont.
52.
53.
54.
55.
5 6.
57.
5 8.
59.
60.
61.
62.
M. J . E. Golay, "Monochromaticity and Noise in a Regenerative Electr ical Oscillator, Proc. IRE, vol. 48, pp. 1473- 1477, August 1960.
C. H. Grauling, Jr. and D. J. Healey, III, "Instrumentation for Measurement of the Short-Term Frequency Stability of Microwave S o u r c e s J t t Proc. IEEE, vol. 54, pp. 249-257, February 1966.
P. Grivet and A. Blaquigre, !'Nonlinear Effects of Noise in Electronic Clocks, I t Proc. IEEE, vol. 51, pp. 1606-1614, November 1963.
J. D. Hadad, "Basic Relation Between the Frequency Stability Specification and the Application, on the Definition and Measurement of Shor t -Term Frequency Stability, NASA SP-80, pp. 11-18, 1965.
Proc . IEEE-NASA Symposium
E. Hafner, "The Effects of Noise on Crys ta l Oscil lators, I t Proc. IEEE, p. 179, February 1966.
Donald Halford, "A General Mechanical Model for If 1" Spectral Density Random Noise with Special Reference to Fl icker Noise l/lfI," Proc. IEEE, vol. 56, No. 2, pp. 251-258, March 1968.
Donald Halford, A. E. Wainwright, and James A. Barnes, "Flicker Noise of Phase in R F Amplifiers and Frequency Multipliers: Characterization, Cause, and Cure, ' ' (Summary) Proc. 22nd Annual Symposium on Frequency Control, Fo r t Monmouth, N. J. , pp. 340-341, April 1968.
D. J. Healey, In, "Flicker of Frequency and Phase and White Frequency and Phase Fluctuations in Frequency Sources, 26th Annual Symposium on Frequency Control, Fort Monmouth, N . J . , pp. 43-49, June 1972.
Proc.
Helmut Hellwig, "Frequency Standards and Clocks: A Tutorial Introduction, I t NBS Technical Note 616, April 1972.
Hewlett-Packard, "Frequency and Time Standards, I t Application Note 52, 1965.
Hewlett-Packard, "Precision Frequency Measurements , Application Note 11 6, July 19 69.
61
BIBLIOGRAPHY cont.
6 3 .
64.
65.
66.
67!
68.
69.
70.
7 1.
72.
73.
Hewlett-Packard, ttComputing Counter Applications Library, NOS. 7, 22, 27, 29; 1970.
R. H. Holman and L. J. Paciorek, "Short-Term Stability Measurement Techniques and Results, Proc. IEEE-NASA Symposium on the Definition and Measurement of Short-Term Frequency Stability, NASA SP-80, pp. 237-252, 1965.
S. L. Johnson, B. H. Smith, and D. A. Calder, "Noise Spectrum Characterist ics of Low-Noise Microwave Tubes and Solid-state Devices," Proc. IEEE, vol. 5 4 , pp. 258-265, February 1966.
P. Kartaschoff, "Shot-Effect Influence on the Frequency of an Oscillator Locked to an Atomic Beam Resonator, I t Proc. IEEE-NASA Symposium on the Definition and Measurement of Short-Term Frequency Stability, NASA SP-80 , pp. 303-308, 1965.
R. F. Lacey, A. L. Helgesson, and J. H. Holloway, "Short-Term Stability of Passive Atomic Frequency Standards, II Proc. IEEE, vol. 54, pp. 170-176, February 1960.
R. W. Larson, "Power Spectrum of Oscillator and Frequency Multiplier Phase Jitter, Proc. IEEE, vol. 54, p. 796, May 1966.
D. B. Leeson, "A Simple Model of Feedback Oscillator Noise Spectrum, Proc. IEEE L., vol. 5 4 , pp. 329-330, February 1966.
D. B. Leeson and G. F. Johnson, "Short-Term Stability for a Doppler Radar: Requirements, Measurements, and Techniques, I '
Proc. IEEE, vol. 54, pp. 244-248, February 1966.
R. M. Lerner , "The Effects of Noise on the Frequency Stability of a Linear Oscillator, '' Proc. Natl. Electr. Conf., vol. 7 , pp. 275-280, 1951.
L. Malling , "Phas e - Stable 0 scillato r s for Space Communications, including the Relationship between the Phase Noise, the Spectrum, the Short-Term Stability, and the Q of the Oscillator, Proc. IRE, V O ~ . 50, PP. 1656-1664, July 1962.
J. C. McDade, "Measurement of Additive Phase Noise Contributed by the Step-Recovery Diode in a Frequency Multiplier, I t Proc. IEEE L., vol. 54, pp. 292-294, February 1966.
62

BIBLIOGRAPHY cont.
74.
75.
76.
77.
78.
79.
80.
81.
82.
D. G. Meyer, "A Test Set f o r Measurement of Phase Noise on High Quality Signal Sources, I ' IEEE Trans. on Instrumentation and Measurement IM-19, No. 4, pp. 215-227, November 1970.
A. H. Morgan and J. A. Barnes, I'Short-Time Stability of a Quartz-Crystal Oscillator as Measured with an Ammonia Maser , Proc. IRE (Letter) , vol. 47, No. 10, p. 1782, October 1959.
J. A. Mullen, "Background Noise in Nonlinear Oscil lators, Proc. IRE,vol. 48, pp. 1467-1473, August 1960.
J. A. Mullen, "Background Noise in Oscillators with R. F. Pushing, 'I J. Electronics and Control, vol. 10, pp. 127-138, February 1961.
Takanori Okoshi, Sumihisa Hashiguchi, and Michio Kotani, "A New Method of Measuring Microwave Oscillator Noises (Long-Line Method), l r Electronics and Communications in Japan, vol. 53-B, NO. 8, pp. 80-85, 1970.
J. G. Ondria, "AMicrowave System for Measurements of AM and FM Noise Spectra, ' ' IEEE Trans. on Microwave Theory and Techniques MTT- 16, pp. 767-781, September 1968.
R. E. Paradysz and W. L. Smith, "Measurement of FM Noise Spectra of Low-Noise VHF Crystal Controlled Oscil lators, IEEE Trans. on Instrumentation and Measurement IM- 15, pp. 202- 211, December 1966.
Max E. Peterson, "The Design and Performance of an U l t r a LOW- Noise Digital Frequency Synthesizer for Use in V L F Receivers, " Proc, 26th Annual Symposium on Frequency Control, For t Monmouth, N . J . , pp. 55-70, June 1972.
V. Prabhu, "Noise Performance of Abrupt- Junction Varactor Frequency Multipliers, 'I Proc. IEEE L . , vol. 54, pp. 285-287, February 1966.
6 3

BIBLIOGRAPHY cont.
a3.
84.
85.
86.
87.
88.
89.
89.
90.
91.
J. Rarity, L. Saporta, and G. Weiss, "Study of Short T e r m Stability of Crystal Oscillators, New York University, New York, N. Y . , Tech. Rpt. Cont. DA36-03-9-SE-87450, DA Project 319-99- 15-02, 02-02.
G. R. Reeve, "Signal Detection Systems, NBS Report 9767, October 1967, sponsored by Army/Navy/Air Force JTCG-METCAL/CCG on Contract 69 -25b.
K. H. Sann, "The Measurement of Near -Carr ie r Noise in Microwave Amplifiers, IEEE Trans . on Microwave Theory and Techniques MTT-16, No. 9 , pp. 761-766, September 1968.
W i l l i a m K. Saunders, "Short T e r m Frequency Stability in Coherent Radar Applications, I t Proc. 26th Annual Symposium on Frequency Control, Fo r t Monmouth, N. J . , pp. 21-28, June 1972.
C. L. Searle, R. D. Posner , R. S . Badessa, and V. J. Bates, "Computer- Aided Calculation of Frequency, Proc. IEEE-NASA Synzposium on the Definition and Measurement of Short-Term Frequency Stability, NASA SP-80, pp. 273-277, November 1964.
R. B. Shields, "Review of the Specification and Measurement of Short-Term Stability, Microwave Journal, pp. 49-55, June 1969.
W. L. Smith and W. J. Spencer, ' 'Quartz Crystal Controlled Oscillators, B. T. L., Final Report, Cont. DA 36-039 SC-85373, Dept. of the Army, Proj. 3G-26-05-001-01, March 15, 1963.
W. J. Spencer and W. L. Smith, "Precision Crys ta l Frequency Standards, Proc. 15th Annual Symposium on Frequency Control, For t Monmouth, N. J . , pp. 139- 155, 1961.
S . R. Stein and J. P. Turneaure, "A Superconducting-Cavity- Stabilised Oscillator of High Stability, Electronics Let te rs , vol. 8, No. 13, pp. 321-323, June 1972.
J. L. Stewart, "Frequency Modulation Noise in Oscil lators, Proc. IRE, vol. 44, pp. 372-376, March 1956.
64

BIBLIOGRAPHY cont.
9 2,
9 3.
94.
95.
9 6.
97.
9 8..
9 9 .
100.
10 I,
H. L. Stover, "Theoretical Explanation for the Output Spectra of Unlocked Driven Oscillators, I ' Proc. IEEE L. , vol. 54, pp. 310- 311, February 1966.
H. P. Stratemeyer, "The Stability of Standard- Frequency Oscillators, If General Radio Experimenter, vol. 38, pp.. 1-16, June 1964.
R. Sydnor, J. J. Caldwell, and B. E. Rose, "Frequency Stability Requirements for Space Communications and Tracking Systems, Proc. IEEE, vol. 54, pp. 231-236, February 1966.
R. A. Sykes, W. L. Smith, and W. J. Spencer, "Performance of Precis ion Quartz-Crystal Controlled Frequency Generators, I f
IRE Trans. on Instrumentation 1-11, pp. 243-247, December 1962.
V. Troitsky, "Certain Problems of the Theory of Fluctuations in Oscillators. The Influence of Flicker Noise, Izv. Vysshikh Uchebn. Zavedenii, Radiofiz., vol. 1, pp. 20-33, 1958.
A. Tykulsky, "Spectral Measurements of Oscil lators , ' I Proc. IEEE L. , vol. 54, p. 306, February 1966.
V. V a n Duzer, "Short-Term Stability Measurements, Proc. IEEE-NASA Symposium on the Definition and Measurement of Short-Term Frequency Stability, NASA SP-80, pp. 269-272, 1965.
R.F.C. Vessot, L. F. Mueller, and J. Vanier, "A Cross- Correlation Technique for Measuring the Shor t -Term Proper t ies of Stable Oscillators, Proc. IEEE-NASA Symposium on the Definition and Measurement of Short-Term Frequency Stability, NASA SP-80, pp. 111-118, 1965.
R. F. C. Vessot, L. Mueller, and J. Vanier, "The Specification of Oscillator Character is t ics f rom Measurements made in the Frequency Domain, Proc. IEEE, p. 199, February 1966.
A. L. Whitwell and A. N. Williams, "A Microwave Technique fo r Determining Noise Spectra at Frequencies Close to the C a r r i e r , I t
Microwave J . , vol. 2 , pp. 27-32, November 1959.
* * *
65

NBS TECHNICAL PUBLICATIONS PERIODICALS
JOURNAL OF RESEARCH reports National Bureau of Standards research and development in phFics, mathematics, and chemistry. Comprehensive scientific papers give complete details of the work, including laboratory data, experimental procedures, and theoretical and mathematical analyses. Illustrated with photographs, drawings, and charts. Includes listings of other NBS papers as issued.
Published in two sections, available separately:
Physics and Chemistry Papers of interest primarily to scientists working in these fields. This section covers a broad range of physical and chemical research, with major emphasis on standards of physical measurement, fundamental constants, and properties of matter. Issued six times a year. Annual subscription: Domestic, $9.50; $2.25 additional for foreign mailing.
0 Mathematical Sciences Studies and compilations designed mainly for the mathematician and theoretical physicist. Topics in mathematical statistics, theory of experiment design, numerical analysis, theoretical physics and chrmis- try, logical design and programming of computers and computer systems. Short numerical tables. Issued quarterly. Annual subscription : Domestic, $5.00 ; $1.25 additional for forei*gn mailing.
TECHNICAL NEWS BULLETIN The best single source of information concerning the Bureau’s measurement, research, developmental, co- operative, and publication activities, this monthly publication is designed for the industry-orieated individual whose daily work involves intimate contact with science and technology-for engineers, chemists, physicists, research managers, product-development managers, and company executives. Includes listing of all NBS papers as issued. Annual subscription: Do- mestic, $3.00: $1 .OO additional for foreign mailing.
Bibliographic Subscription Services The following current-awareness and literature- survey bibliographies are issued periodically by the Bureau: Cryogenic Data Center Current Awareness Service (weekly), Liquefied Natural Gas (quarterly), Superconducting Devices and Materials (quarterly), and Electromagnetic Metrolo<gy Current Awareness Service (month- ly). Available only from NBS Boulder Labora- tories. Ordering and cost information may be obtained from the Program Information Office, National Bureau of Standards, Boulder, Colo- rado 80302.
WOWPERIODICALS Applied Mathematics Series. Mathematical tables, manuals, and studies. Building Science Series. Research results, t a t methods, and performance criteria of building ma- terials, components, system, and structures. Handbooks. Recommended codes of engineering and industrial practice (including safety codes) de- veloped in cooperation with interested industries, professional organizations, and regulatory bodies. Special Publications. Proceedings of NBS confer- ences, bibliographies, annual reports, wall charts, pamphlets, etc. Monographs. Major contributions to the technical literature on various subjecfs related to the Bureau’s scientific and technical activities. National Standard Reference Data Series. NSRDS provides quantitative data on the physical and chemical properties of materials, compiled from the world’s literature and critically evaluated. Product Standards. Provide requirements for sizes, types, quality, and methods for testing various indm- trial products. These standards are developed CO- operatively with interested Government and industry groups and provide the basis €or common understand- ing of product characteristics for both buyen and sellers. Their use is voluntary. Technical Notes. This series consists of communi- cations and reports (covering both other-agency and NBS-sponsored work) of limited or transitoly intemt. Federal Information Processing Standards Publications. This series is the official publication within the Federal Government for information on standards adopted and promulgated under the Public Law 89-306, and Bureau of the Budget Circular A-86 entitled, Standardization of Data Elements and Codes in Data Systems. Consumer Information Series. Practical infoma- tion, based on NBS research and experience, cover- ing areas of interest to the consumer. Easily under- standable language and illustrations provide useful back<ground knowledge for shopping in today’s tech- nological marketplace.
CATALOPS OF NBS PUBLICATIONS NBS Special Publication 305, Publications of the NBS. 1966-1967. When ordering, include Catalog No. C13.10:305. Price $2.00; 50 cents addi- tional for foreign mailing. NRS Special Publication 305, Supplement 1, Publications of the NBS, 1968-1969. When order- ing, include Catalog No. C 13.10: 305/Suppl. 1. Price $4.50 ; $1.25 additional for foreign mailing. NBS Special Publication 305, Supplement 2, Publications of the NBS, 1970. When order- ing, include Catalog No. C13.10: 305/Suppl. 2. Price $3.25; 85 cents additional for foreign mailing.
Order NBS publications f except Bibliographic Subscription Services) from : Superintendent of Documents, Government Printing Office, Wash- ington, D.C. 20402.