nb private equity partners investor presentation 2021 year
TRANSCRIPT
September 2021
NB Private Equity Partners Investor Presentation2021 Year to Date UpdateInvesting in private companies to generate long-term growth
2
THIS PRESENTATION MAY CONTAIN FORWARD LOOKING STATEMENTS
THIS PRESENTATION HAS BEEN CREATED WITH THE BEST AVAILABLE INFORMATION AT THIS TIME. INFORMATIONFLOW IN THE PRIVATE EQUITY ASSET CLASS OFTEN LAGS FOR SEVERAL MONTHS. THE PRESENTATION MAYCONTAIN FORWARD LOOKING STATEMENTS, PROJECTIONS AND PRO FORMA INFORMATION BASED UPON THATAVAILABLE INFORMATION. THERE CAN BE NO ASSURANCE THAT THOSE STATEMENTS, PROJECTIONS AND PROFORMA NUMBERS WILL BE CORRECT; ALL OF THEM ARE SUBJECT TO CHANGE AS THE UNDERLYING INFORMATIONDEVELOPS.THE INFORMATION IN THIS PRESENTATION IS BASED ON THE 31 AUGUST 2021 MONTHLY NAV UPDATE, UNLESS OTHERWISE NOTED.
3
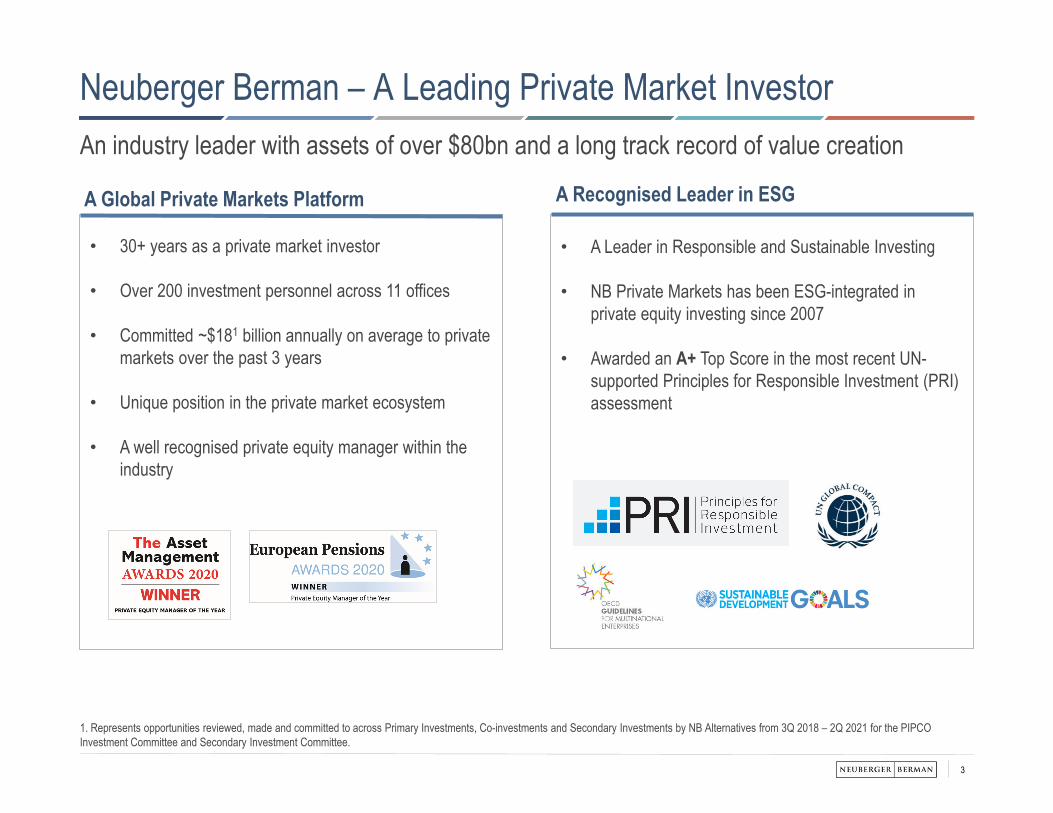
Neuberger Berman – A Leading Private Market Investor An industry leader with assets of over $80bn and a long track record of value creation
1. Represents opportunities reviewed, made and committed to across Primary Investments, Co-investments and Secondary Investments by NB Alternatives from 3Q 2018 – 2Q 2021 for the PIPCO Investment Committee and Secondary Investment Committee.
• 30+ years as a private market investor
• Over 200 investment personnel across 11 offices
• Committed ~$181 billion annually on average to private markets over the past 3 years
• Unique position in the private market ecosystem
• A well recognised private equity manager within the industry
• A Leader in Responsible and Sustainable Investing
• NB Private Markets has been ESG-integrated in private equity investing since 2007
• Awarded an A+ Top Score in the most recent UN-supported Principles for Responsible Investment (PRI) assessment
A Global Private Markets Platform A Recognised Leader in ESG
4
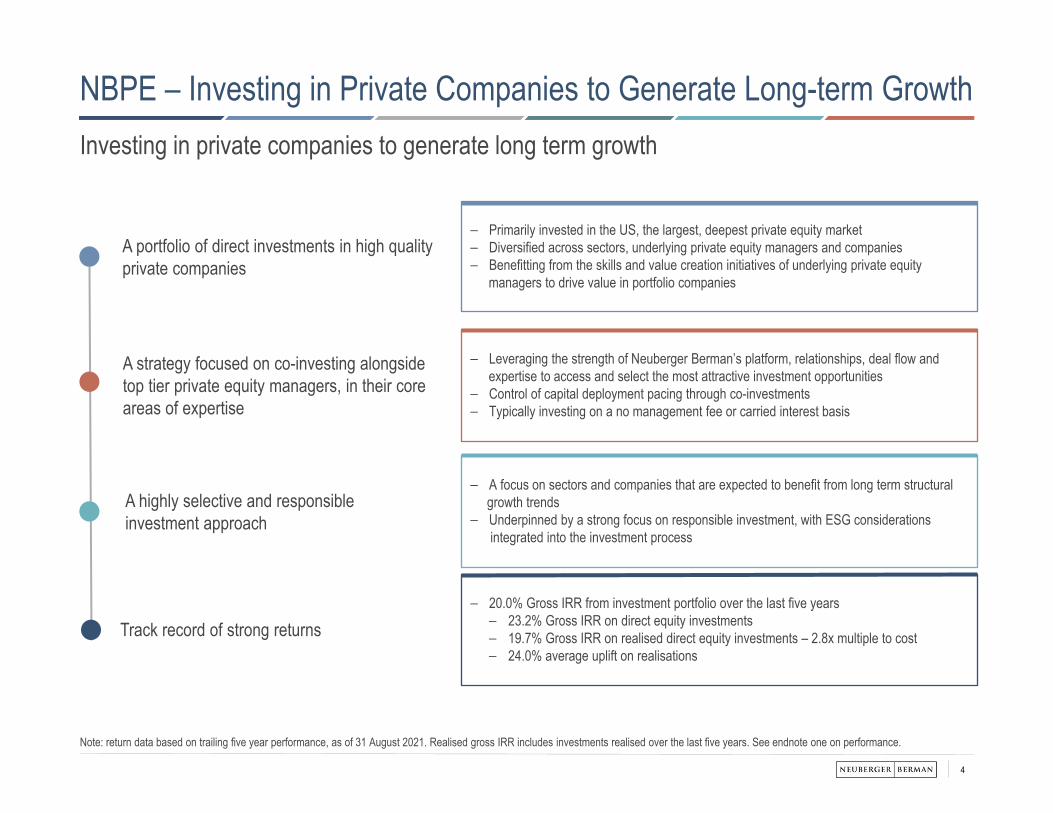
NBPE – Investing in Private Companies to Generate Long-term GrowthInvesting in private companies to generate long term growth
Note: return data based on trailing five year performance, as of 31 August 2021. Realised gross IRR includes investments realised over the last five years. See endnote one on performance.
A portfolio of direct investments in high quality private companies
– Primarily invested in the US, the largest, deepest private equity market – Diversified across sectors, underlying private equity managers and companies– Benefitting from the skills and value creation initiatives of underlying private equity
managers to drive value in portfolio companies
A strategy focused on co-investing alongside top tier private equity managers, in their core areas of expertise
– Leveraging the strength of Neuberger Berman’s platform, relationships, deal flow and expertise to access and select the most attractive investment opportunities
– Control of capital deployment pacing through co-investments – Typically investing on a no management fee or carried interest basis
– A focus on sectors and companies that are expected to benefit from long term structural growth trends
– Underpinned by a strong focus on responsible investment, with ESG considerationsintegrated into the investment process
A highly selective and responsible investment approach
Track record of strong returns– 20.0% Gross IRR from investment portfolio over the last five years– 23.2% Gross IRR on direct equity investments– 19.7% Gross IRR on realised direct equity investments – 2.8x multiple to cost– 24.0% average uplift on realisations
5
NBPE Invests with Premier Private Equity Managers
What We Look For:
Right firm for the right
opportunity
Active, actionable
value creation plan
Demonstrated
experience through
cycles
As of 31 August 2021. Represents private equity sponsors of investments made over the last five years.
NBPE has made 72 investments alongside 46 sponsors over the past five years
Representative GP Partners
6
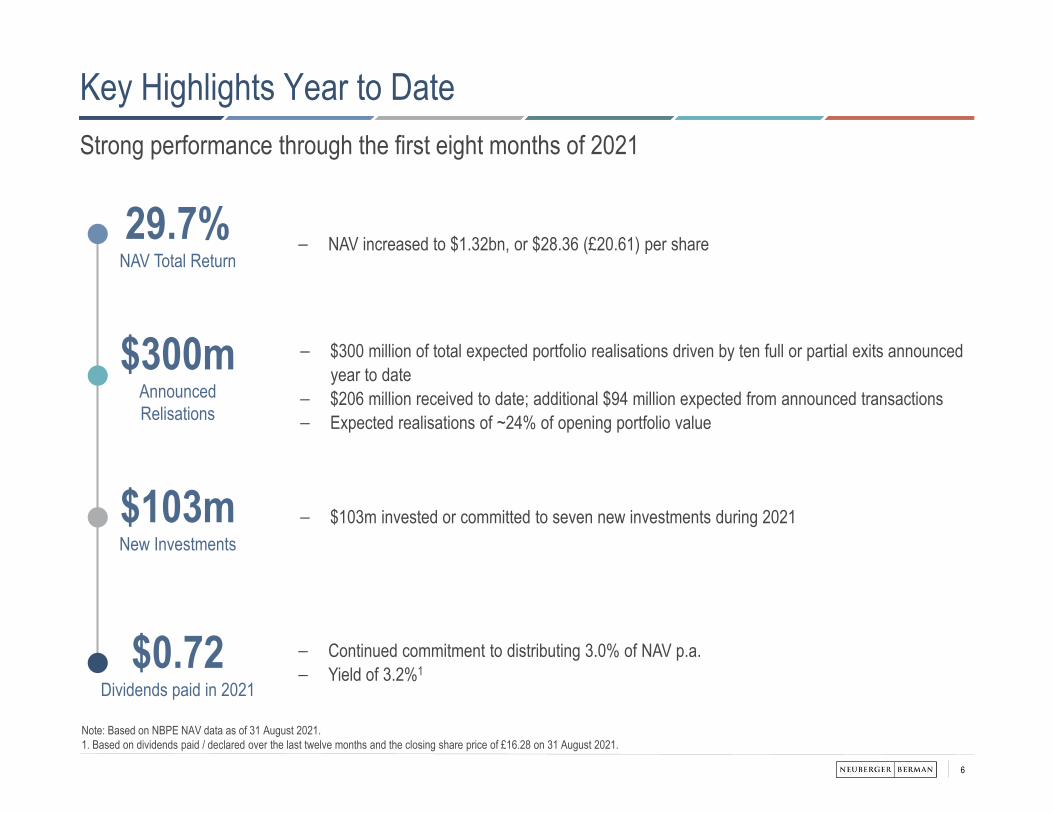
Key Highlights Year to DateStrong performance through the first eight months of 2021
– NAV increased to $1.32bn, or $28.36 (£20.61) per share29.7%NAV Total Return
– $300 million of total expected portfolio realisations driven by ten full or partial exits announced year to date
– $206 million received to date; additional $94 million expected from announced transactions– Expected realisations of ~24% of opening portfolio value
$300mAnnouncedRelisations
– $103m invested or committed to seven new investments during 2021$103mNew Investments
– Continued commitment to distributing 3.0% of NAV p.a.– Yield of 3.2%1$0.72
Dividends paid in 2021
Note: Based on NBPE NAV data as of 31 August 2021.1. Based on dividends paid / declared over the last twelve months and the closing share price of £16.28 on 31 August 2021.
7
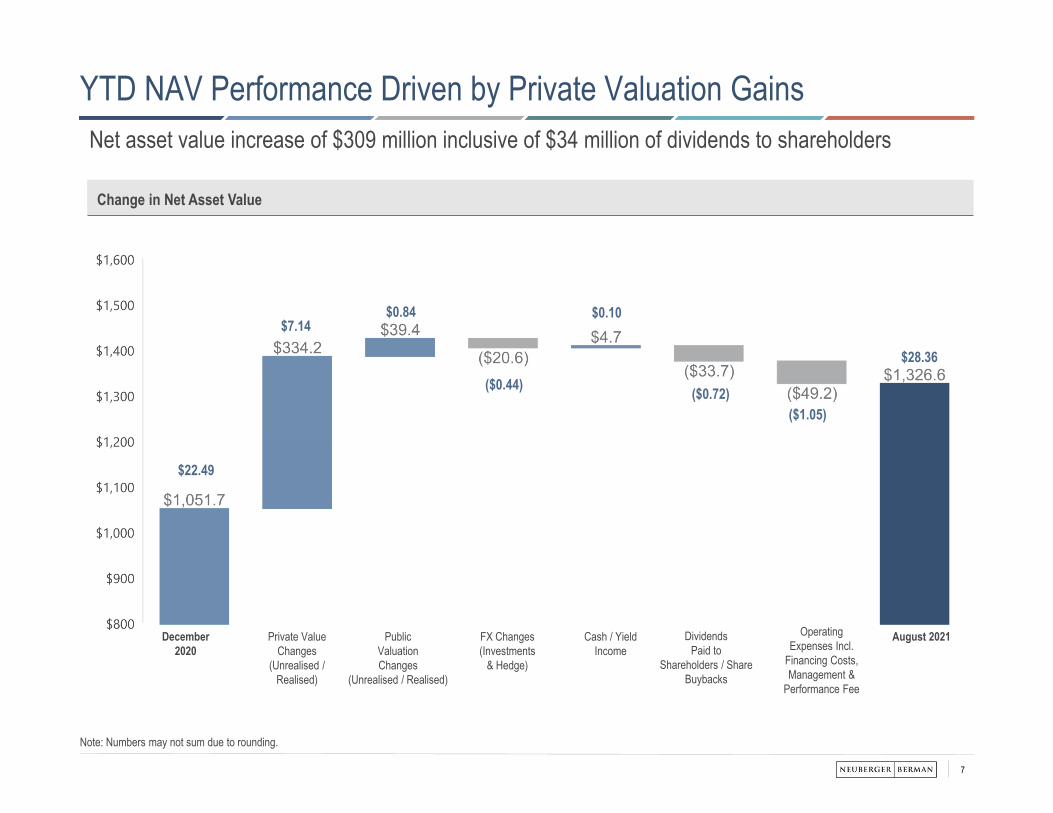
YTD NAV Performance Driven by Private Valuation Gains
Change in Net Asset Value
Net asset value increase of $309 million inclusive of $34 million of dividends to shareholders
December 2020
Private Value Changes
(Unrealised / Realised)
PublicValuation Changes
(Unrealised / Realised)
FX Changes (Investments
& Hedge)
Cash / Yield Income
DividendsPaid to
Shareholders / Share Buybacks
August 2021Operating Expenses Incl.
Financing Costs,Management &
Performance Fee
$22.49
$7.14$0.84
($0.44)
$0.10
($0.72)
$28.36
($1.05)
Note: Numbers may not sum due to rounding.
8
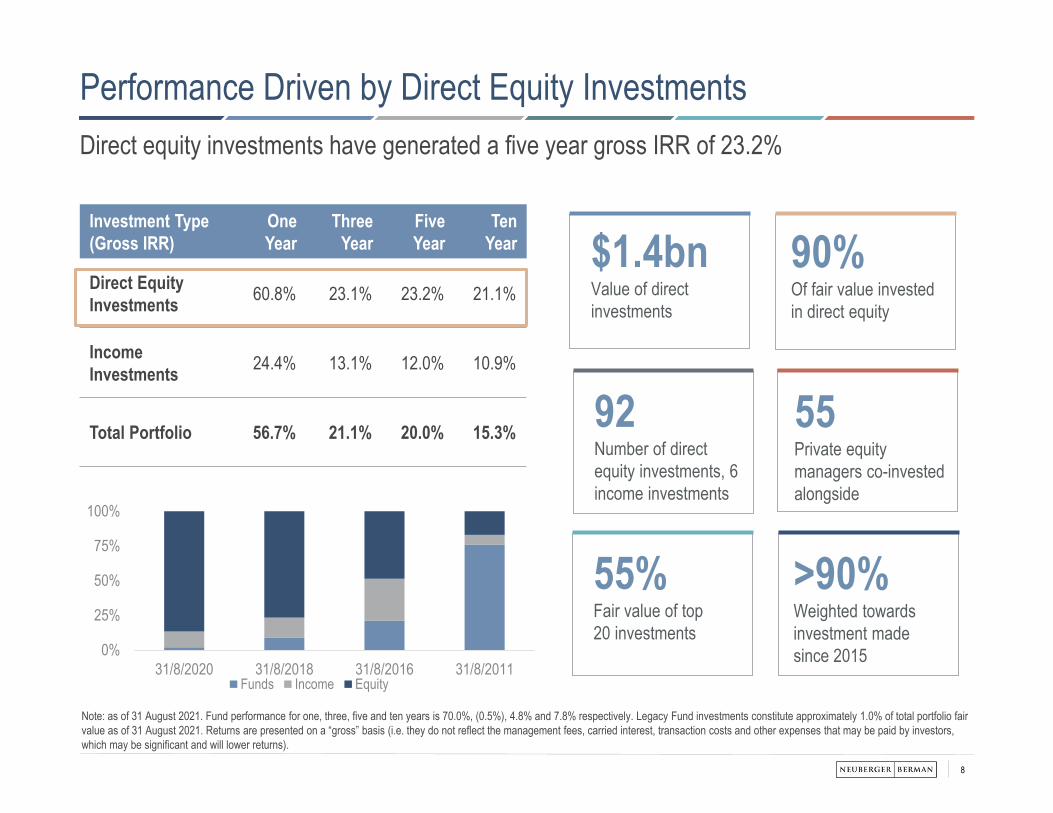
Note: as of 31 August 2021. Fund performance for one, three, five and ten years is 70.0%, (0.5%), 4.8% and 7.8% respectively. Legacy Fund investments constitute approximately 1.0% of total portfolio fair value as of 31 August 2021. Returns are presented on a “gross” basis (i.e. they do not reflect the management fees, carried interest, transaction costs and other expenses that may be paid by investors, which may be significant and will lower returns).
Performance Driven by Direct Equity InvestmentsDirect equity investments have generated a five year gross IRR of 23.2%
Investment Type (Gross IRR)
One Year
Three Year
Five Year
Ten Year
Direct EquityInvestments 60.8% 23.1% 23.2% 21.1%
IncomeInvestments 24.4% 13.1% 12.0% 10.9%
Total Portfolio 56.7% 21.1% 20.0% 15.3%
$1.4bnValue of direct investments
90%Of fair value invested in direct equity
92Number of direct equity investments, 6 income investments
55%Fair value of top 20 investments
>90%Weighted towards investment made since 2015
55Private equity managers co-investedalongside
0%
25%
50%
75%
100%
31/8/2020 31/8/2018 31/8/2016 31/8/2011Funds Income Equity
9
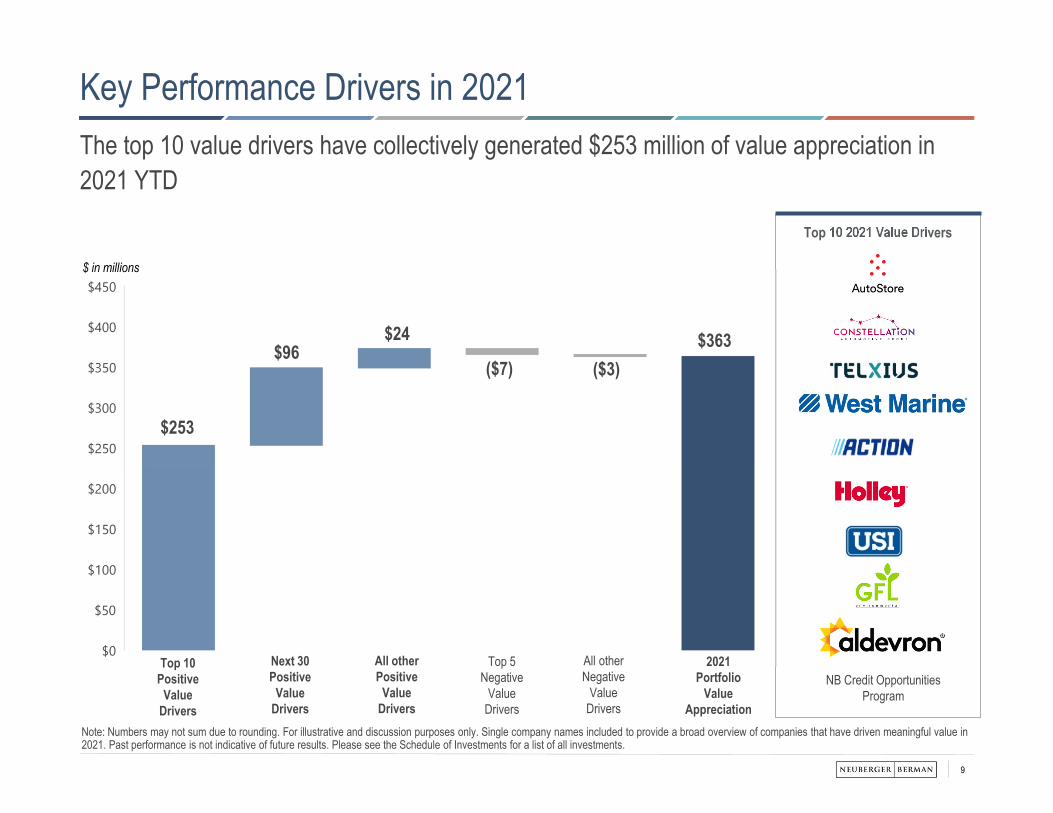
Top 10 2021 Value Drivers
Key Performance Drivers in 2021The top 10 value drivers have collectively generated $253 million of value appreciation in 2021 YTD
Top 10 Positive
Value Drivers
Next 30Positive
Value Drivers
All other Positive
Value Drivers
Top 5Negative
Value Drivers
All other Negative
Value Drivers
2021Portfolio
Value Appreciation
Note: Numbers may not sum due to rounding. For illustrative and discussion purposes only. Single company names included to provide a broad overview of companies that have driven meaningful value in 2021. Past performance is not indicative of future results. Please see the Schedule of Investments for a list of all investments.
$253
$96$24
($7) ($3)$363
$ in millions
NB Credit Opportunities Program

10
75%Estimated uplift from December 2020 value
3.3xTotal expected multiple of invested capital*
$300 Million of Announced Realisations in 2021$206 million of proceeds received; additional $94 million of proceeds expected from announced transactions. In addition, Agiliti completed an IPO on the NYSE during April
Announced Transactions & IPO2:
Company
2021 Announced Transactions & IPO:
$170mEstimated NAV gain vs December 2020
Note: The investments discussed do not represent all past investments. It should not be assumed that an investment listed was or will be profitable. The information supplied about the investment is intended to show investment process and not performance.*Excludes Agiliti IPO and Holley IPOs.
NYSE: AGTI
11
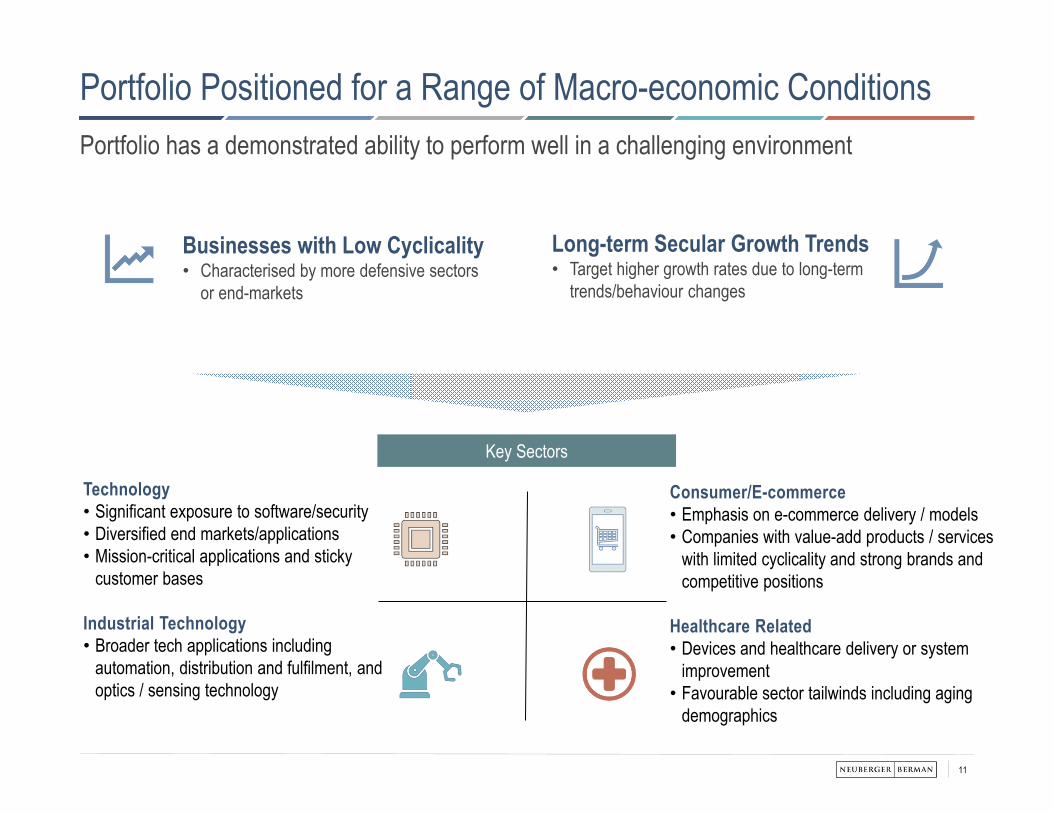
Portfolio Positioned for a Range of Macro-economic ConditionsPortfolio has a demonstrated ability to perform well in a challenging environment
Long-term Secular Growth Trends• Target higher growth rates due to long-term
trends/behaviour changes
Key Sectors
Businesses with Low Cyclicality• Characterised by more defensive sectors
or end-markets
Technology• Significant exposure to software/security• Diversified end markets/applications• Mission-critical applications and sticky
customer bases
Industrial Technology• Broader tech applications including
automation, distribution and fulfilment, and optics / sensing technology
Consumer/E-commerce• Emphasis on e-commerce delivery / models• Companies with value-add products / services
with limited cyclicality and strong brands and competitive positions
Healthcare Related• Devices and healthcare delivery or system
improvement• Favourable sector tailwinds including aging
demographics
12
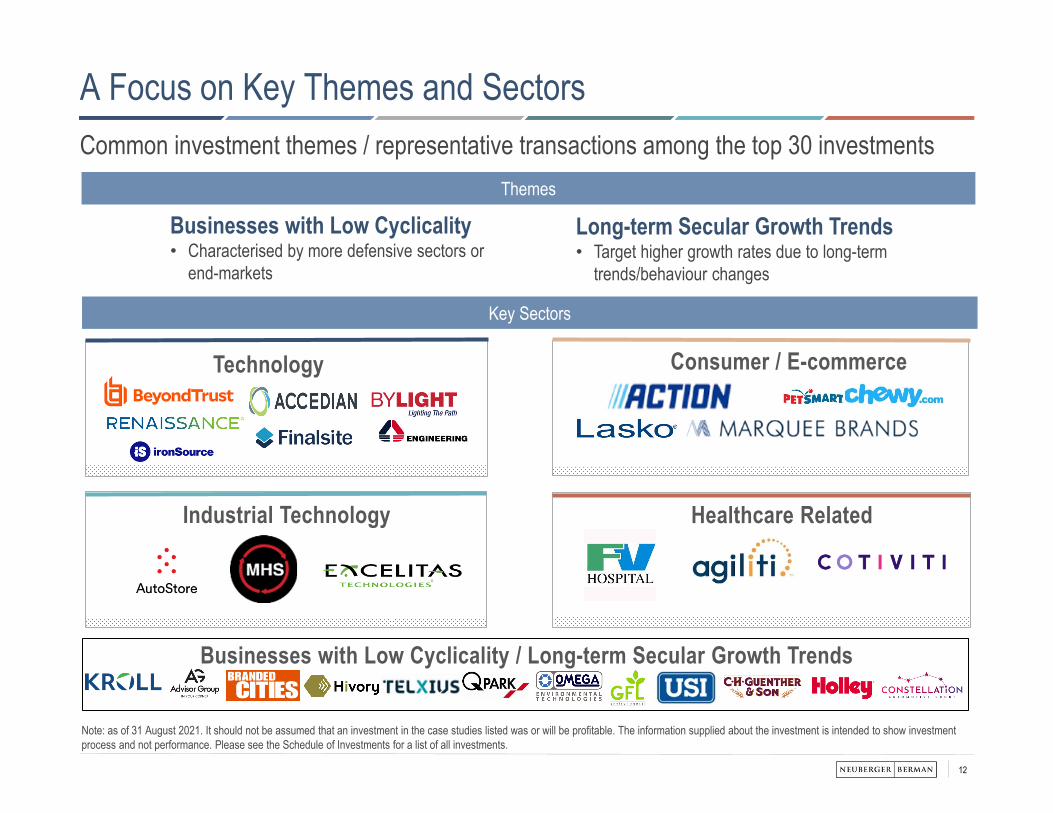
Note: as of 31 August 2021. It should not be assumed that an investment in the case studies listed was or will be profitable. The information supplied about the investment is intended to show investment process and not performance. Please see the Schedule of Investments for a list of all investments.
A Focus on Key Themes and SectorsCommon investment themes / representative transactions among the top 30 investments
Technology
Industrial Technology
Consumer / E-commerce
Healthcare Related
Long-term Secular Growth Trends• Target higher growth rates due to long-term
trends/behaviour changes
Businesses with Low Cyclicality• Characterised by more defensive sectors or
end-markets
Key Sectors
Themes
Businesses with Low Cyclicality / Long-term Secular Growth Trends
13
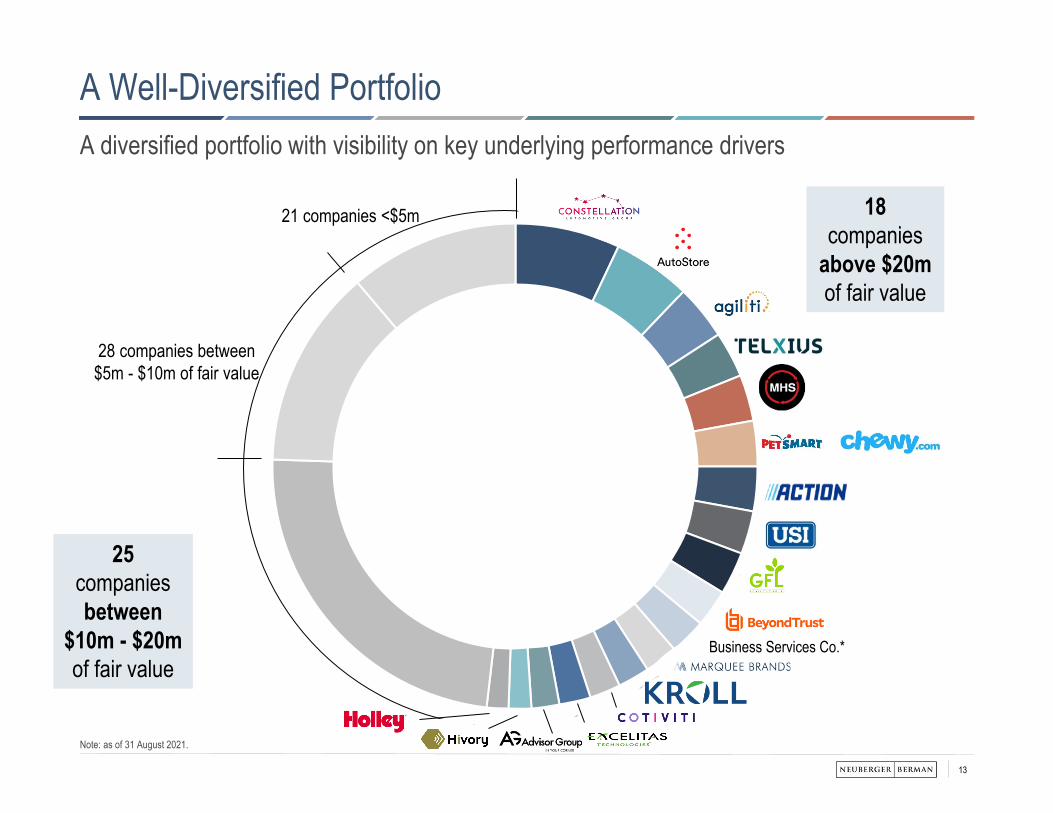
Note: as of 31 August 2021.
A Well-Diversified PortfolioA diversified portfolio with visibility on key underlying performance drivers
18companies
above $20m of fair value
25companies between
$10m - $20m of fair value
28 companies between $5m - $10m of fair value
21 companies <$5m
Business Services Co.*
14
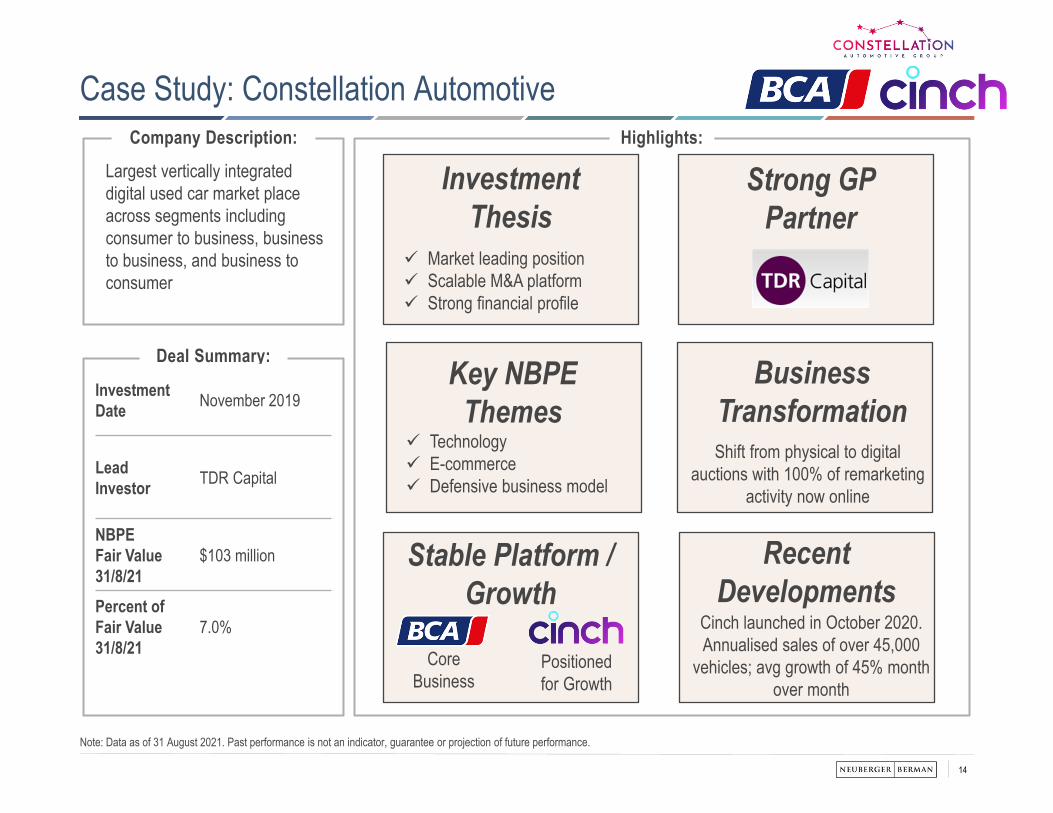
Case Study: Constellation Automotive
Largest vertically integrated digital used car market place across segments including consumer to business, business to business, and business to consumer
Deal Summary:
Investment Date November 2019
Lead Investor TDR Capital
NBPE Fair Value31/8/21
$103 million
Percent of Fair Value31/8/21
7.0%
Company Description:
Strong GP Partner
Recent Developments
Cinch launched in October 2020. Annualised sales of over 45,000
vehicles; avg growth of 45% month over month
Market leading position Scalable M&A platform Strong financial profile
Investment Thesis
Highlights:
Core Business
Stable Platform / Growth
Key NBPEThemes
Note: Data as of 31 August 2021. Past performance is not an indicator, guarantee or projection of future performance.
Business TransformationShift from physical to digital
auctions with 100% of remarketing activity now online
Technology E-commerce Defensive business model
Positioned for Growth
15
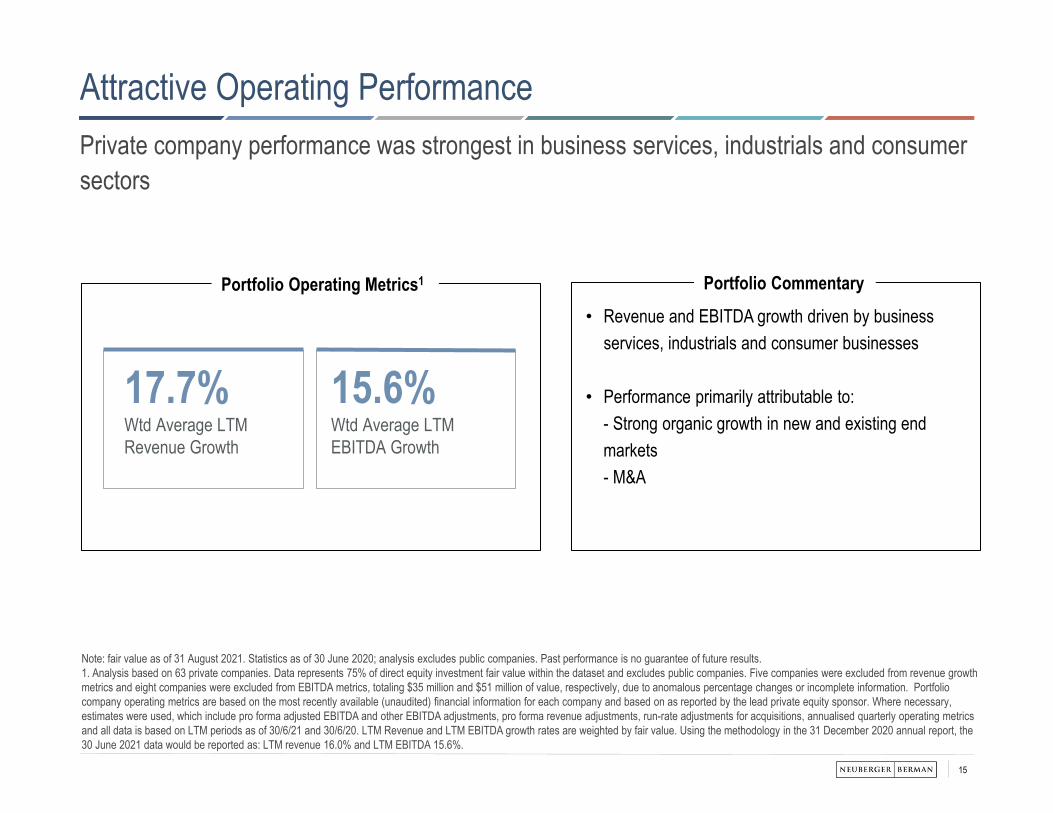
Attractive Operating Performance
Note: fair value as of 31 August 2021. Statistics as of 30 June 2020; analysis excludes public companies. Past performance is no guarantee of future results.1. Analysis based on 63 private companies. Data represents 75% of direct equity investment fair value within the dataset and excludes public companies. Five companies were excluded from revenue growth metrics and eight companies were excluded from EBITDA metrics, totaling $35 million and $51 million of value, respectively, due to anomalous percentage changes or incomplete information. Portfolio company operating metrics are based on the most recently available (unaudited) financial information for each company and based on as reported by the lead private equity sponsor. Where necessary, estimates were used, which include pro forma adjusted EBITDA and other EBITDA adjustments, pro forma revenue adjustments, run-rate adjustments for acquisitions, annualised quarterly operating metrics and all data is based on LTM periods as of 30/6/21 and 30/6/20. LTM Revenue and LTM EBITDA growth rates are weighted by fair value. Using the methodology in the 31 December 2020 annual report, the 30 June 2021 data would be reported as: LTM revenue 16.0% and LTM EBITDA 15.6%.
17.7%Wtd Average LTM Revenue Growth
15.6%Wtd Average LTM EBITDA Growth
Portfolio Operating Metrics1
Private company performance was strongest in business services, industrials and consumer sectors
• Revenue and EBITDA growth driven by business services, industrials and consumer businesses
• Performance primarily attributable to:- Strong organic growth in new and existing end markets- M&A
Portfolio Commentary
16
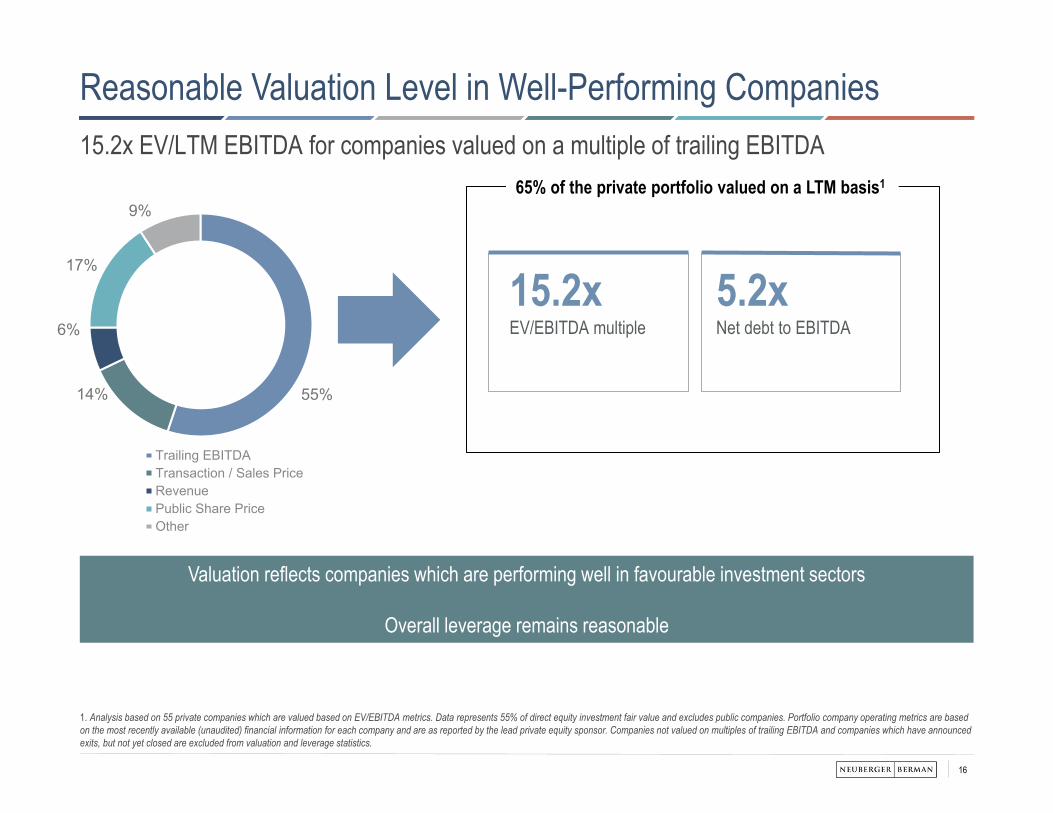
Reasonable Valuation Level in Well-Performing Companies
1. Analysis based on 55 private companies which are valued based on EV/EBITDA metrics. Data represents 55% of direct equity investment fair value and excludes public companies. Portfolio company operating metrics are based on the most recently available (unaudited) financial information for each company and are as reported by the lead private equity sponsor. Companies not valued on multiples of trailing EBITDA and companies which have announced exits, but not yet closed are excluded from valuation and leverage statistics.
55%14%
6%
17%
9%
Trailing EBITDATransaction / Sales PriceRevenuePublic Share PriceOther
15.2xEV/EBITDA multiple
5.2xNet debt to EBITDA
65% of the private portfolio valued on a LTM basis1
15.2x EV/LTM EBITDA for companies valued on a multiple of trailing EBITDA
Valuation reflects companies which are performing well in favourable investment sectors
Overall leverage remains reasonable
17
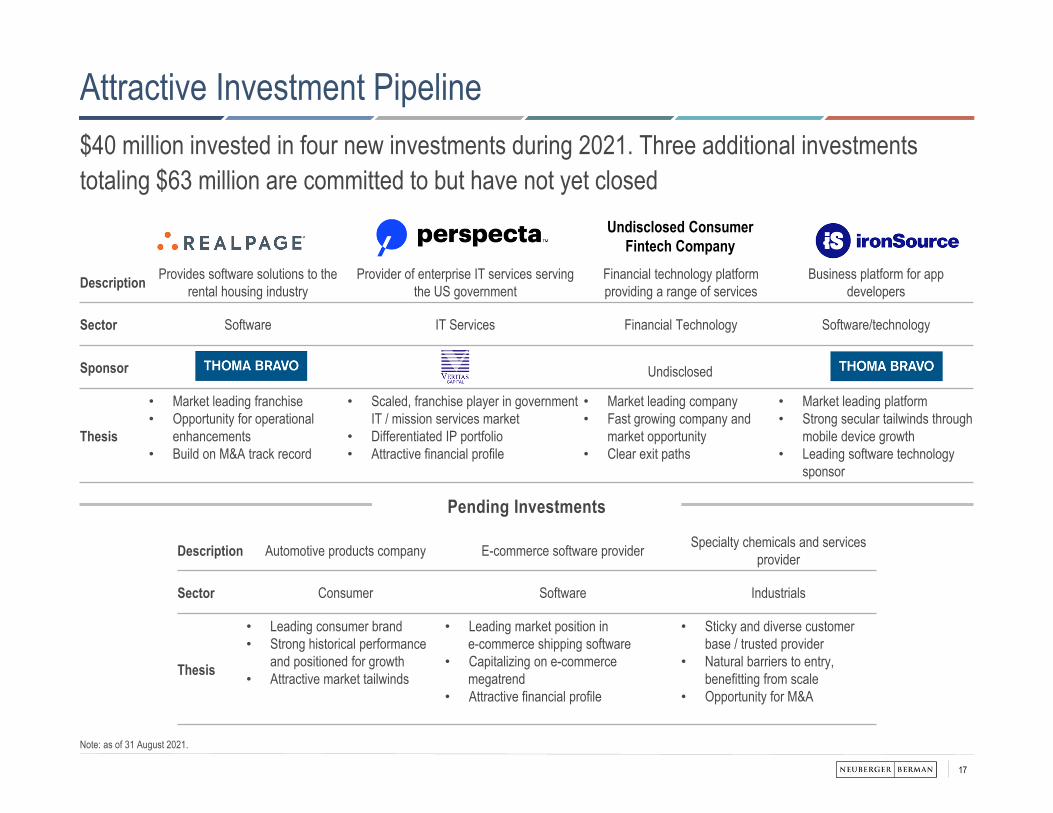
$40 million invested in four new investments during 2021. Three additional investments totaling $63 million are committed to but have not yet closed
Note: as of 31 August 2021.
Attractive Investment Pipeline
Description Provides software solutions to the rental housing industry
Provider of enterprise IT services serving the US government
Financial technology platform providing a range of services
Business platform for app developers
Sector Software IT Services Financial Technology Software/technology
Sponsor
Thesis
• Market leading franchise• Opportunity for operational
enhancements• Build on M&A track record
• Scaled, franchise player in government IT / mission services market
• Differentiated IP portfolio• Attractive financial profile
• Market leading company• Fast growing company and
market opportunity• Clear exit paths
• Market leading platform• Strong secular tailwinds through
mobile device growth• Leading software technology
sponsor
Undisclosed Consumer Fintech Company
Undisclosed
Description Automotive products company E-commerce software provider Specialty chemicals and services provider
Sector Consumer Software Industrials
Thesis
• Leading consumer brand• Strong historical performance
and positioned for growth• Attractive market tailwinds
• Leading market position in e-commerce shipping software
• Capitalizing on e-commerce megatrend
• Attractive financial profile
• Sticky and diverse customer base / trusted provider
• Natural barriers to entry, benefitting from scale
• Opportunity for M&A
Pending Investments
18
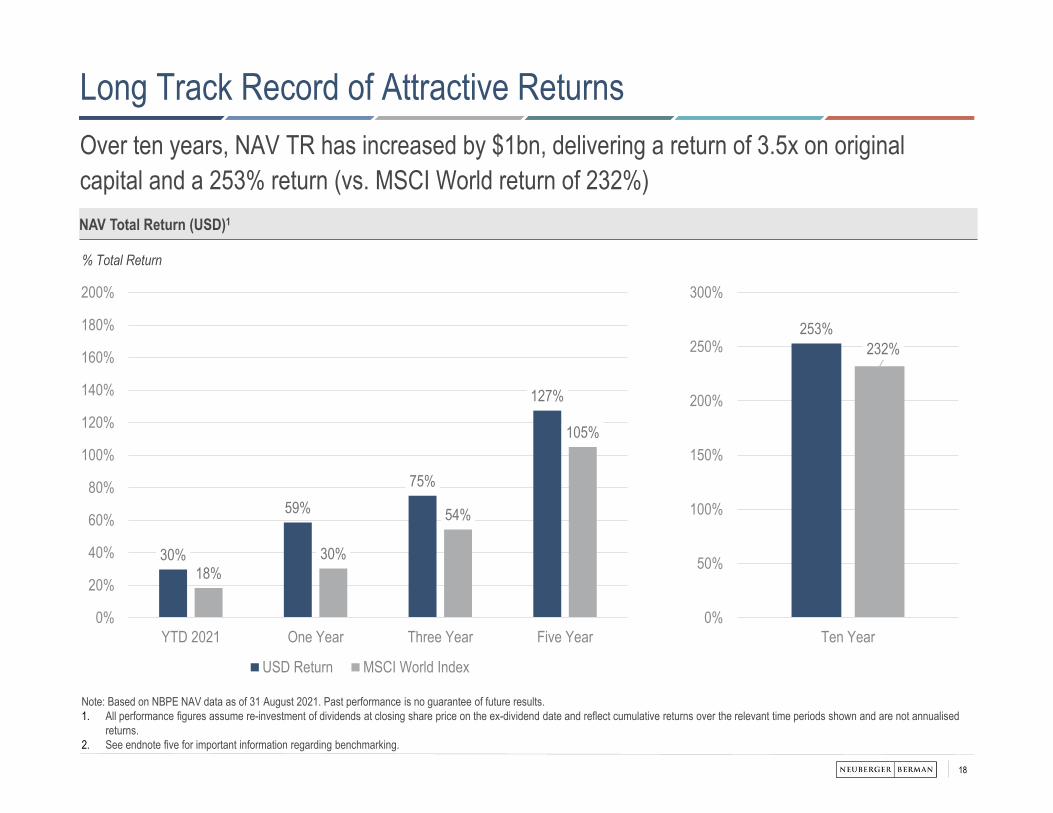
Note: Based on NBPE NAV data as of 31 August 2021. Past performance is no guarantee of future results.1. All performance figures assume re-investment of dividends at closing share price on the ex-dividend date and reflect cumulative returns over the relevant time periods shown and are not annualised
returns.2. See endnote five for important information regarding benchmarking.
Long Track Record of Attractive Returns
% Total Return
NAV Total Return (USD)1
30%
59%75%
127%
18%30%
54%
105%
0%
20%
40%
60%
80%
100%
120%
140%
160%
180%
200%
YTD 2021 One Year Three Year Five Year
USD Return MSCI World Index
253%232%
0%
50%
100%
150%
200%
250%
300%
Ten Year
USD Return MSCI World Index
Over ten years, NAV TR has increased by $1bn, delivering a return of 3.5x on original capital and a 253% return (vs. MSCI World return of 232%)
19
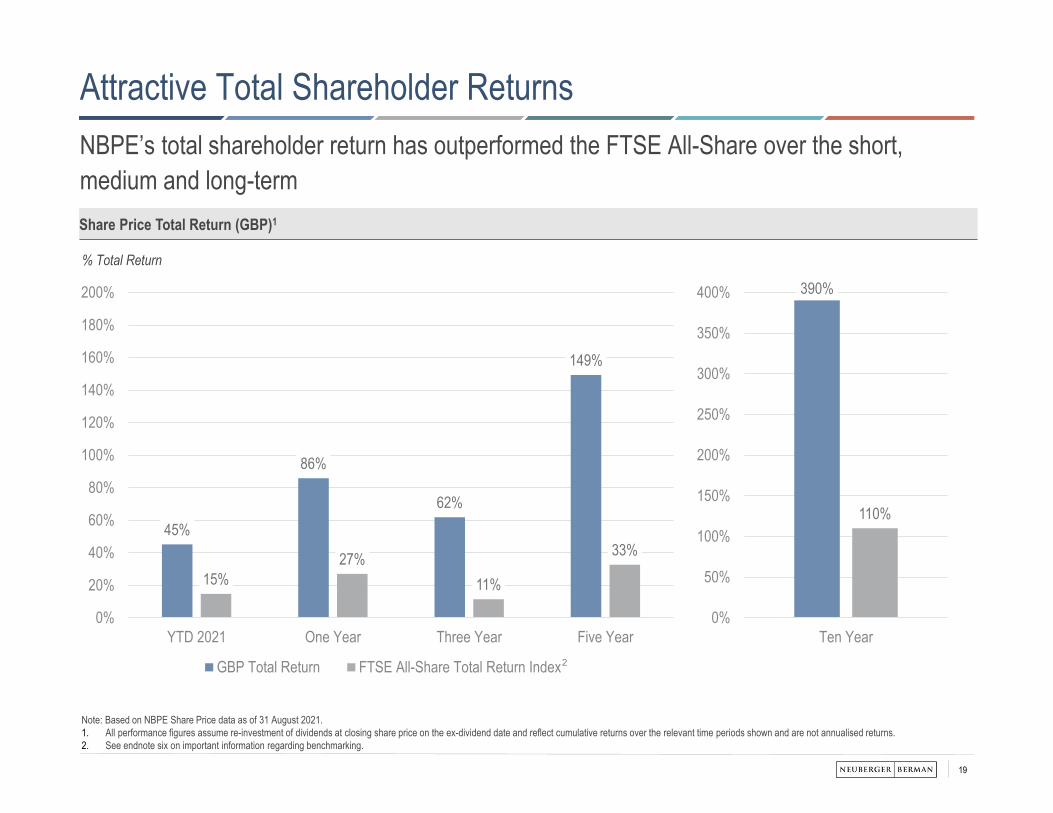
Note: Based on NBPE Share Price data as of 31 August 2021. 1. All performance figures assume re-investment of dividends at closing share price on the ex-dividend date and reflect cumulative returns over the relevant time periods shown and are not annualised returns.2. See endnote six on important information regarding benchmarking.
Attractive Total Shareholder Returns NBPE’s total shareholder return has outperformed the FTSE All-Share over the short, medium and long-term
% Total Return
Share Price Total Return (GBP)1
45%
86%
62%
149%
15%27%
11%
33%
0%
20%
40%
60%
80%
100%
120%
140%
160%
180%
200%
YTD 2021 One Year Three Year Five Year
GBP Total Return FTSE All-Share Total Return Index
390%
110%
0%
50%
100%
150%
200%
250%
300%
350%
400%
Ten Year
USD Return FTSE All-Share Index2
20
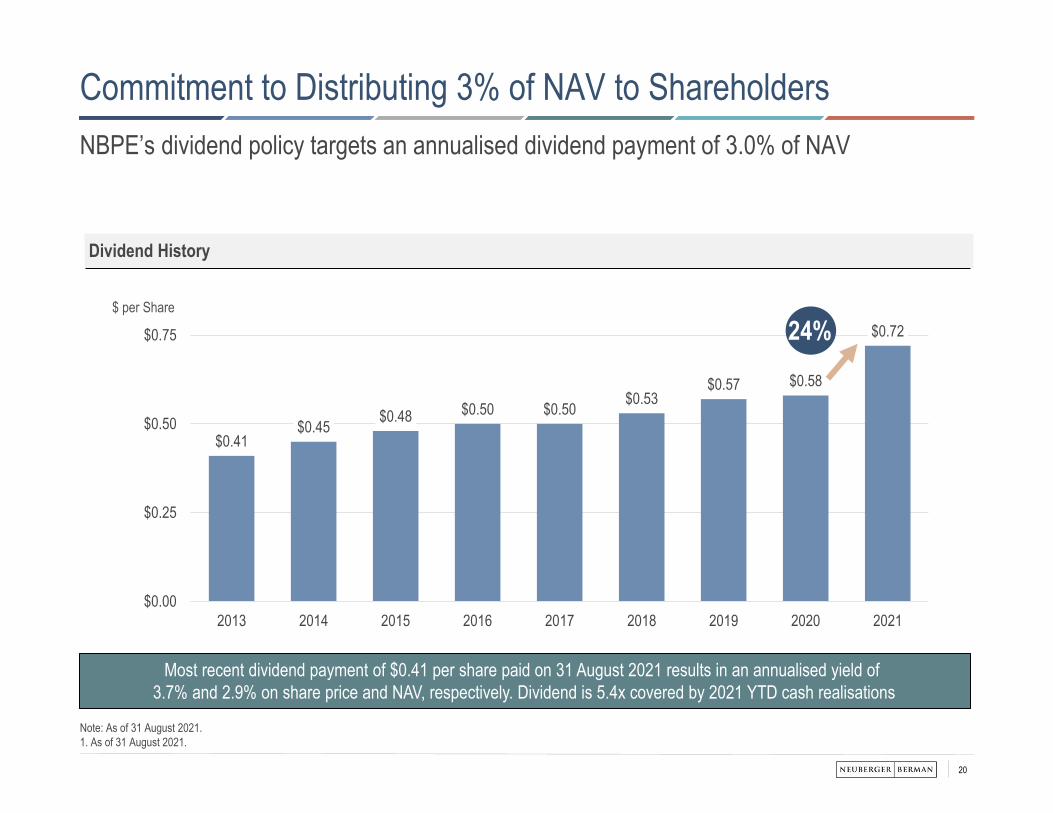
Commitment to Distributing 3% of NAV to ShareholdersNBPE’s dividend policy targets an annualised dividend payment of 3.0% of NAV
Note: As of 31 August 2021.1. As of 31 August 2021.
Dividend History
$0.41$0.45 $0.48 $0.50 $0.50 $0.53
$0.57 $0.58
$0.72
$0.00
$0.25
$0.50
$0.75
2013 2014 2015 2016 2017 2018 2019 2020 2021
$ per Share
24%
Most recent dividend payment of $0.41 per share paid on 31 August 2021 results in an annualised yield of 3.7% and 2.9% on share price and NAV, respectively. Dividend is 5.4x covered by 2021 YTD cash realisations
21
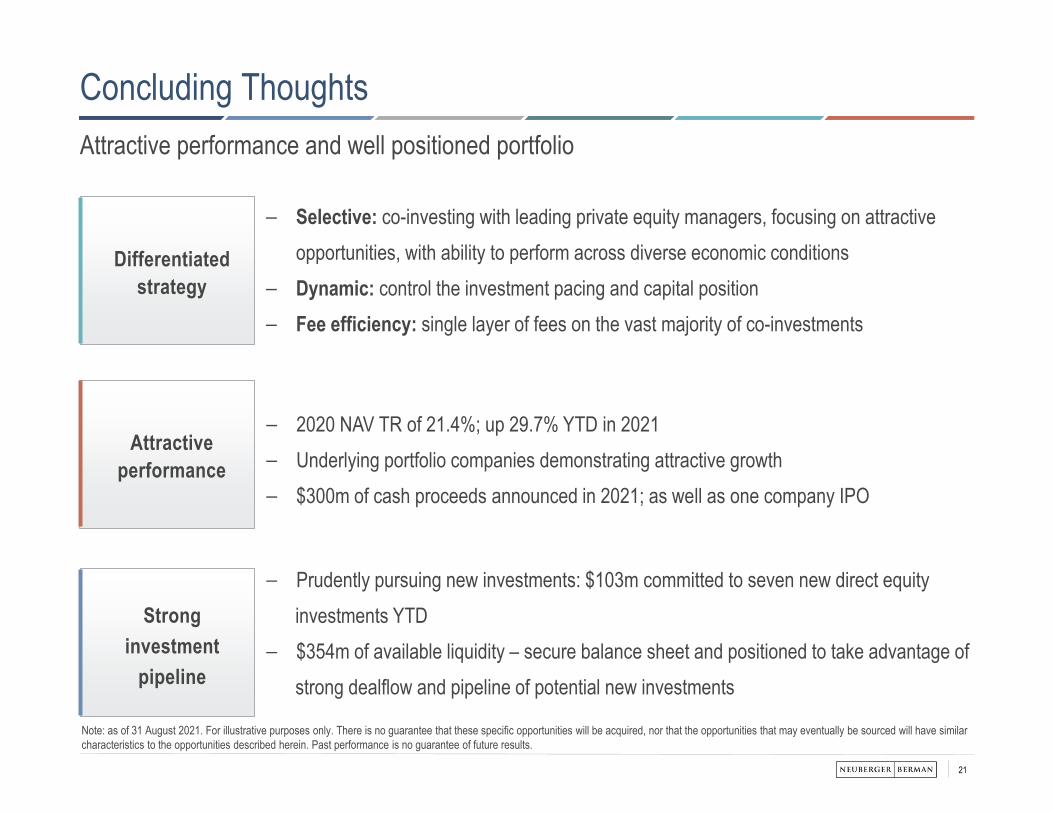
Concluding ThoughtsAttractive performance and well positioned portfolio
Attractive performance
– 2020 NAV TR of 21.4%; up 29.7% YTD in 2021 – Underlying portfolio companies demonstrating attractive growth– $300m of cash proceeds announced in 2021; as well as one company IPO
Strong investment
pipeline
– Prudently pursuing new investments: $103m committed to seven new direct equity investments YTD
– $354m of available liquidity – secure balance sheet and positioned to take advantage of strong dealflow and pipeline of potential new investments
Differentiated strategy
– Selective: co-investing with leading private equity managers, focusing on attractiveopportunities, with ability to perform across diverse economic conditions
– Dynamic: control the investment pacing and capital position – Fee efficiency: single layer of fees on the vast majority of co-investments
Note: as of 31 August 2021. For illustrative purposes only. There is no guarantee that these specific opportunities will be acquired, nor that the opportunities that may eventually be sourced will have similar characteristics to the opportunities described herein. Past performance is no guarantee of future results.
Supplementary information Neuberger Berman – a leading investor in private markets
23
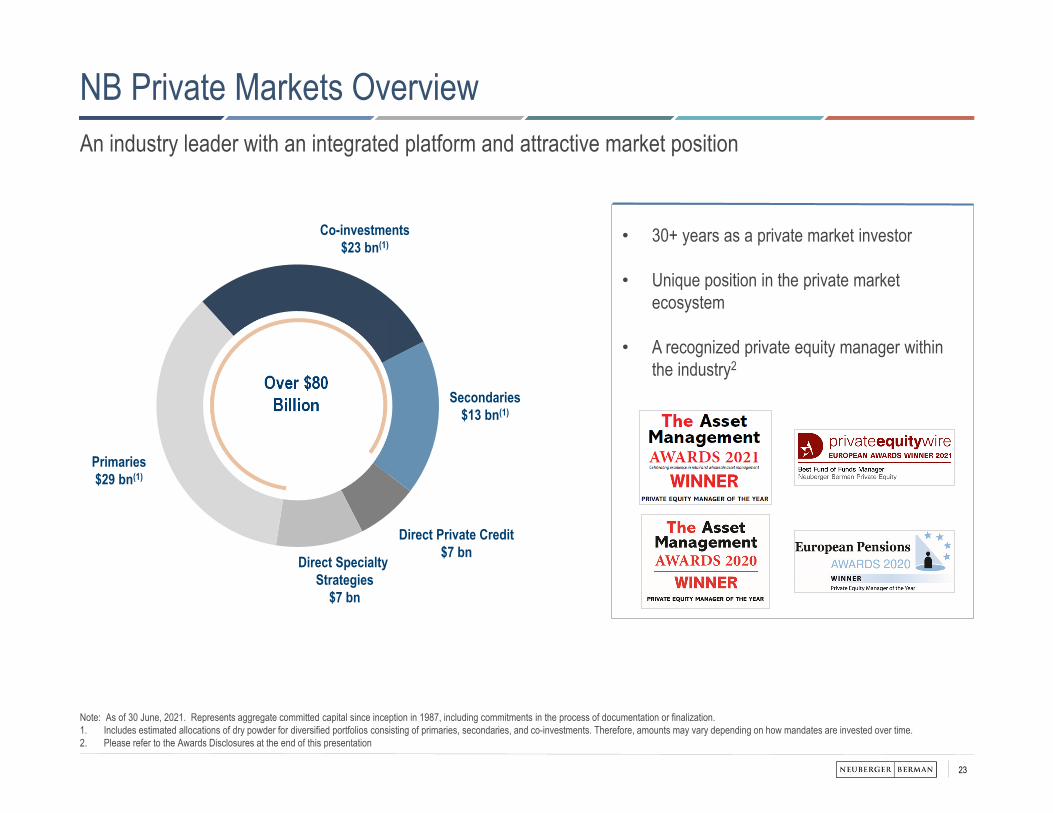
NB Private Markets OverviewAn industry leader with an integrated platform and attractive market position
Note: As of 30 June, 2021. Represents aggregate committed capital since inception in 1987, including commitments in the process of documentation or finalization.1. Includes estimated allocations of dry powder for diversified portfolios consisting of primaries, secondaries, and co-investments. Therefore, amounts may vary depending on how mandates are invested over time.2. Please refer to the Awards Disclosures at the end of this presentation
• 30+ years as a private market investor
• Unique position in the private market ecosystem
• A recognized private equity manager within the industry2
Direct Private Credit$7 bn
Primaries$29 bn(1)
Co-investments$23 bn(1)
Secondaries$13 bn(1)
Direct Specialty Strategies
$7 bn
Over $80 Billion
24
Source: NB Alternatives Advisers LLC. 1. As of March 31, 2021.2. Represents active portfolio companies for PIPCO and Secondaries through March 31, 2021.3. Includes Limited Partner Advisory Committee seats and observer seats for PIPCO and Secondaries since inception as of June 30, 2021. 4. Represents opportunities reviewed, made and committed to across primaries, co-investments and secondaries by NB Alternatives from 3Q 2018 – 2Q 2021 for PIPCO and Secondaries.
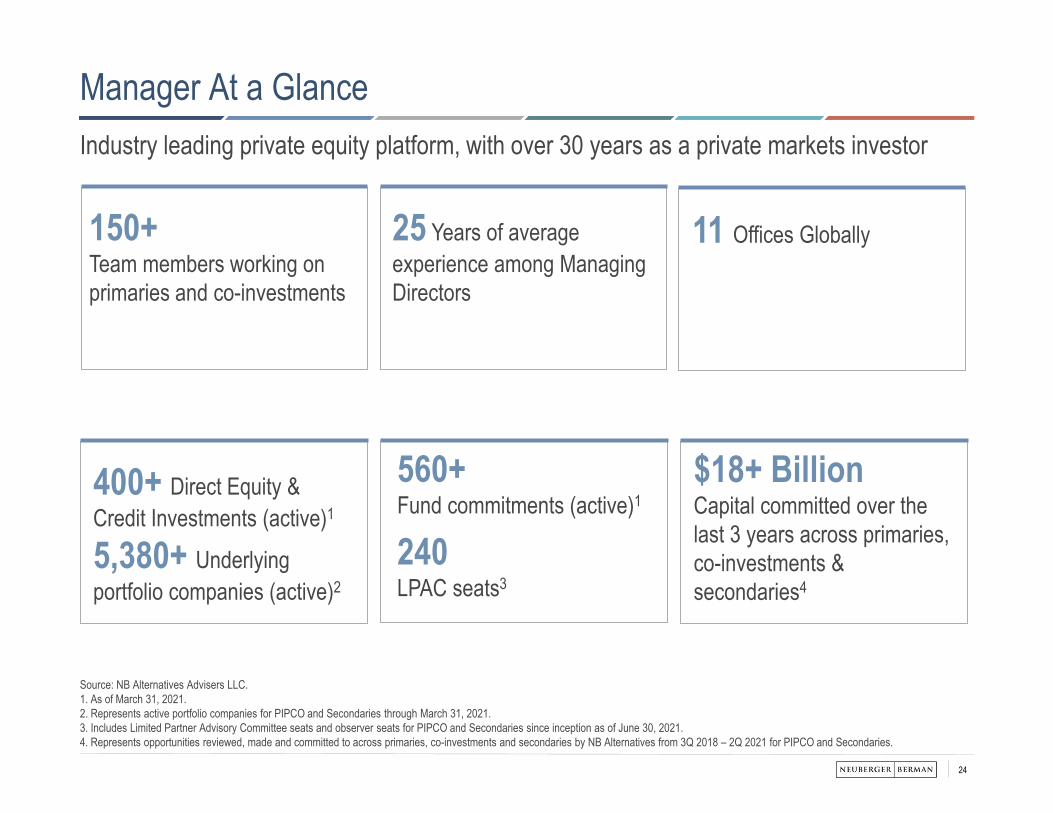
400+ Direct Equity & Credit Investments (active)1
5,380+ Underlying portfolio companies (active)2
560+Fund commitments (active)1
240LPAC seats3
150+Team members working on primaries and co-investments
11 Offices Globally
$18+ BillionCapital committed over the last 3 years across primaries, co-investments & secondaries4
Manager At a GlanceIndustry leading private equity platform, with over 30 years as a private markets investor
25 Years of average experience among Managing Directors
Supplementary Information A responsible and sustainable investor
26
Responsible and Sustainable Investment Policy
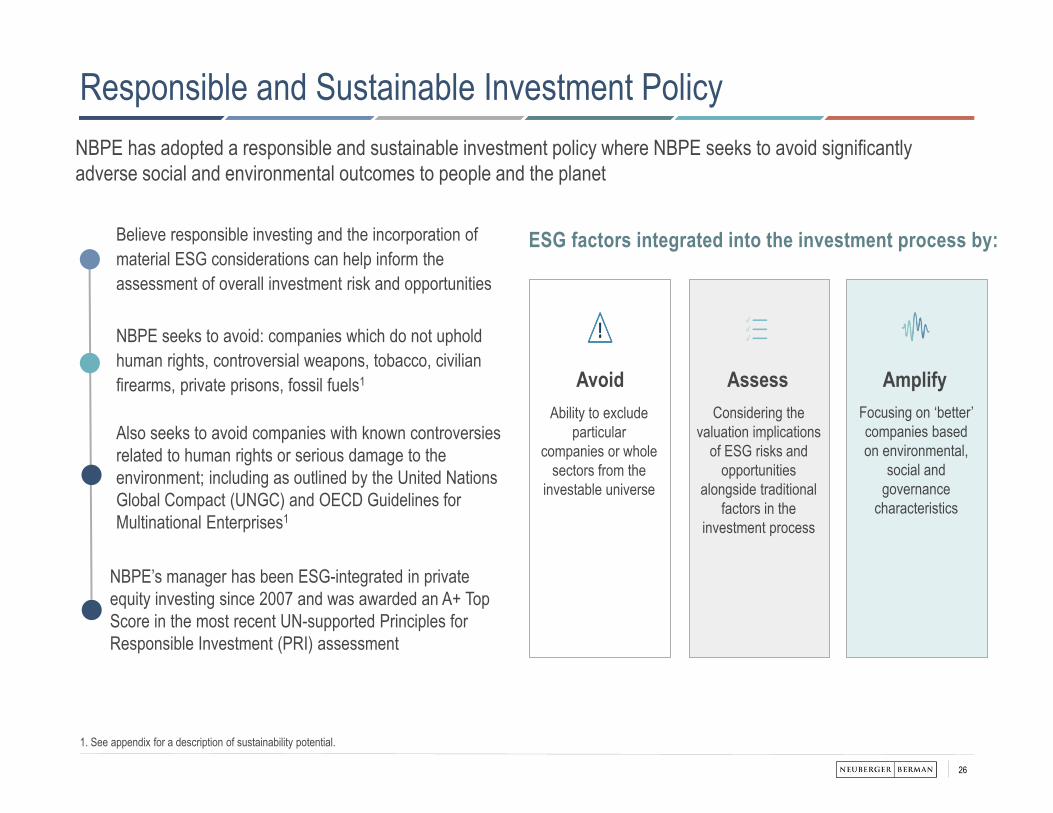
NBPE seeks to avoid: companies which do not uphold human rights, controversial weapons, tobacco, civilian firearms, private prisons, fossil fuels1
NBPE’s manager has been ESG-integrated in private equity investing since 2007 and was awarded an A+ Top Score in the most recent UN-supported Principles for Responsible Investment (PRI) assessment
Believe responsible investing and the incorporation of material ESG considerations can help inform the assessment of overall investment risk and opportunities
1. See appendix for a description of sustainability potential.
NBPE has adopted a responsible and sustainable investment policy where NBPE seeks to avoid significantly adverse social and environmental outcomes to people and the planet
Also seeks to avoid companies with known controversies related to human rights or serious damage to the environment; including as outlined by the United Nations Global Compact (UNGC) and OECD Guidelines for Multinational Enterprises1
AssessAvoidAbility to exclude
particular companies or whole
sectors from the investable universe
Considering the valuation implications
of ESG risks and opportunities
alongside traditional factors in the
investment process
Focusing on ‘better’ companies based on environmental,
social and governance
characteristics
Amplify
ESG factors integrated into the investment process by:
27
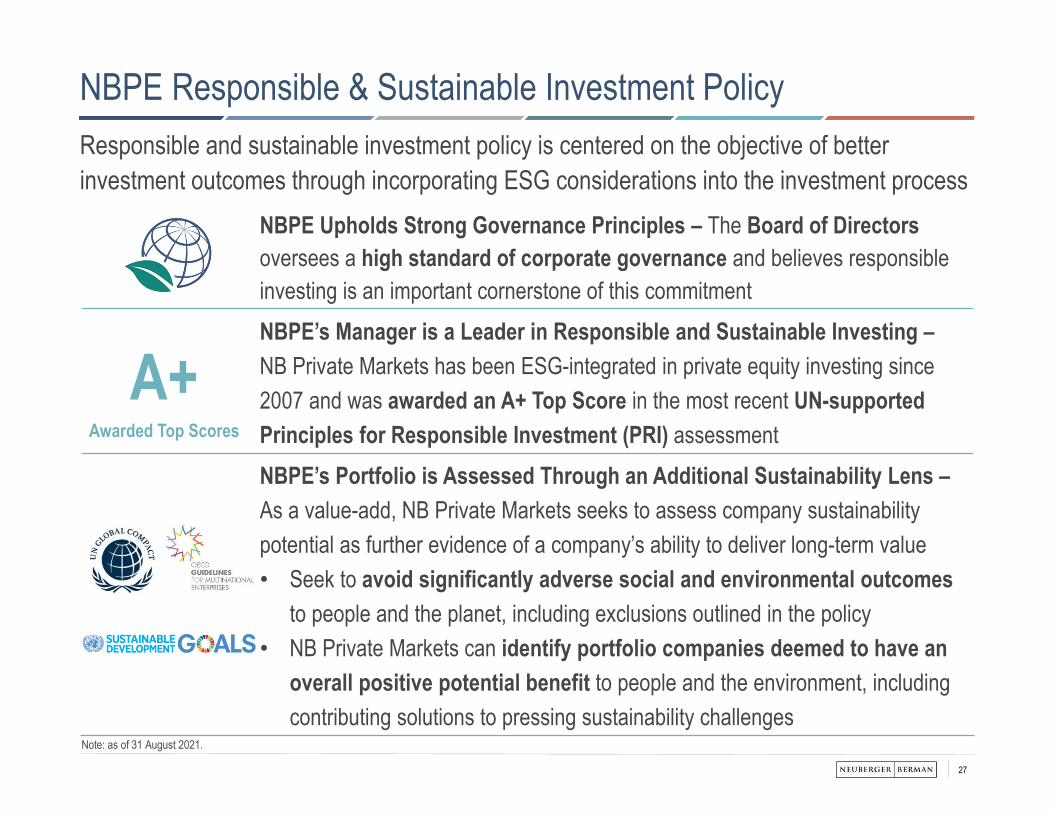
NBPE Upholds Strong Governance Principles – The Board of Directors oversees a high standard of corporate governance and believes responsible investing is an important cornerstone of this commitmentNBPE’s Manager is a Leader in Responsible and Sustainable Investing –NB Private Markets has been ESG-integrated in private equity investing since 2007 and was awarded an A+ Top Score in the most recent UN-supported Principles for Responsible Investment (PRI) assessmentNBPE’s Portfolio is Assessed Through an Additional Sustainability Lens –As a value-add, NB Private Markets seeks to assess company sustainability potential as further evidence of a company’s ability to deliver long-term value• Seek to avoid significantly adverse social and environmental outcomes
to people and the planet, including exclusions outlined in the policy• NB Private Markets can identify portfolio companies deemed to have an
overall positive potential benefit to people and the environment, including contributing solutions to pressing sustainability challenges
Note: as of 31 August 2021.
NBPE Responsible & Sustainable Investment PolicyResponsible and sustainable investment policy is centered on the objective of better investment outcomes through incorporating ESG considerations into the investment process
A+Awarded Top Scores
28
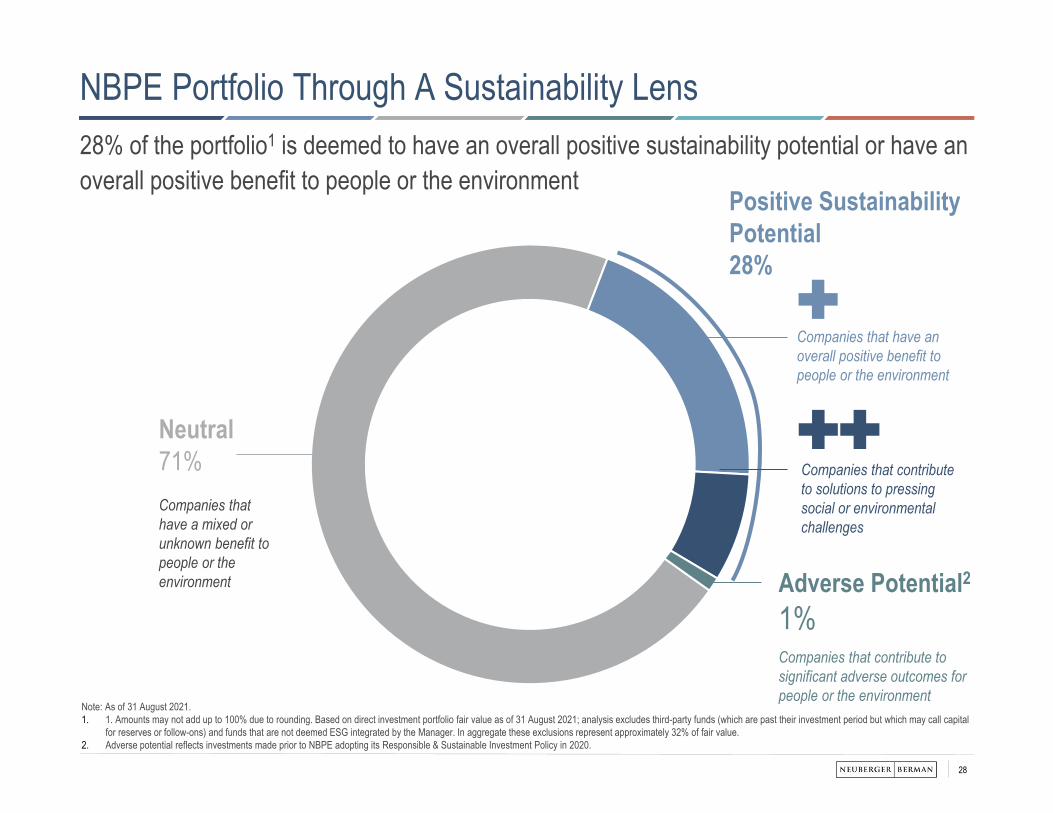
Note: As of 31 August 2021.1. 1. Amounts may not add up to 100% due to rounding. Based on direct investment portfolio fair value as of 31 August 2021; analysis excludes third-party funds (which are past their investment period but which may call capital
for reserves or follow-ons) and funds that are not deemed ESG integrated by the Manager. In aggregate these exclusions represent approximately 32% of fair value.2. Adverse potential reflects investments made prior to NBPE adopting its Responsible & Sustainable Investment Policy in 2020.
NBPE Portfolio Through A Sustainability Lens28% of the portfolio1 is deemed to have an overall positive sustainability potential or have an overall positive benefit to people or the environment
Positive Sustainability Potential28%
Neutral71%
Adverse Potential21%
Companies that have a mixed or unknown benefit to people or the environment
Companies that contribute to significant adverse outcomes for people or the environment
Companies that have an overall positive benefit to people or the environment
Companies that contribute to solutions to pressing social or environmental challenges

Supplementary Information Portfolio
30
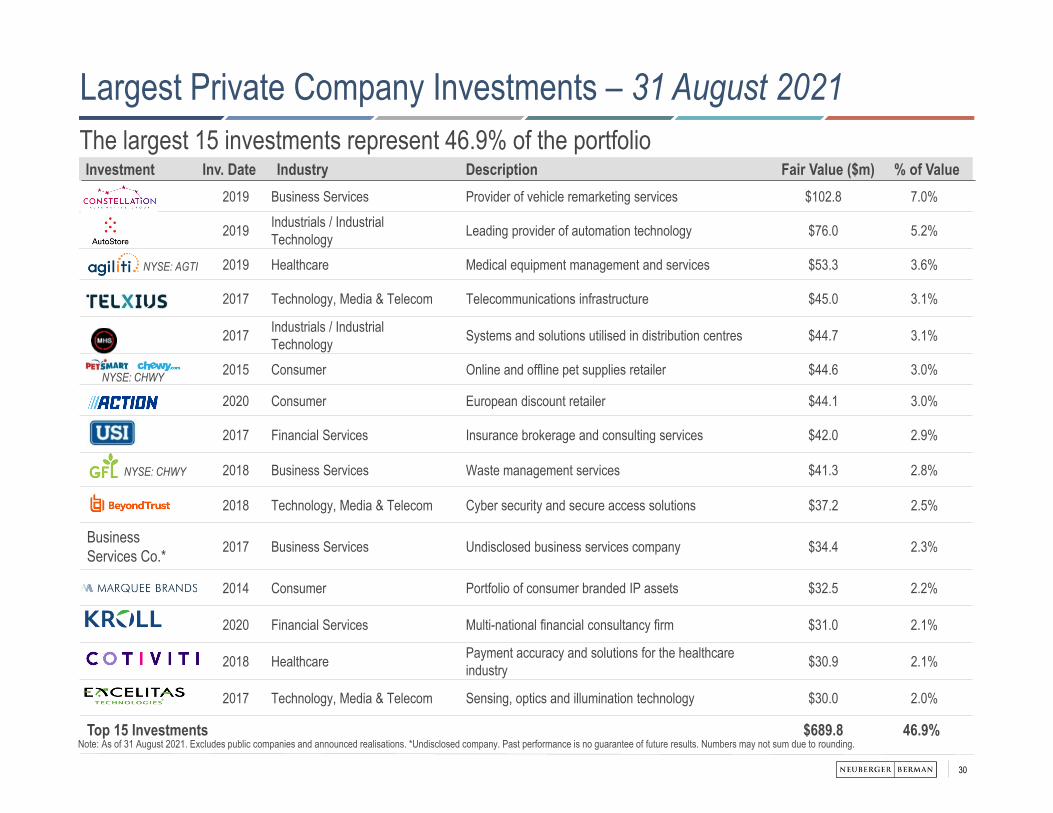
Investment Inv. Date Industry Description Fair Value ($m) % of Value2019 Business Services Provider of vehicle remarketing services $102.8 7.0%
2019 Industrials / Industrial Technology Leading provider of automation technology $76.0 5.2%
2019 Healthcare Medical equipment management and services $53.3 3.6%
2017 Technology, Media & Telecom Telecommunications infrastructure $45.0 3.1%
2017 Industrials / Industrial Technology Systems and solutions utilised in distribution centres $44.7 3.1%
2015 Consumer Online and offline pet supplies retailer $44.6 3.0%
2020 Consumer European discount retailer $44.1 3.0%
2017 Financial Services Insurance brokerage and consulting services $42.0 2.9%
2018 Business Services Waste management services $41.3 2.8%
2018 Technology, Media & Telecom Cyber security and secure access solutions $37.2 2.5%
Business Services Co.* 2017 Business Services Undisclosed business services company $34.4 2.3%
2014 Consumer Portfolio of consumer branded IP assets $32.5 2.2%
2020 Financial Services Multi-national financial consultancy firm $31.0 2.1%
2018 Healthcare Payment accuracy and solutions for the healthcare industry $30.9 2.1%
2017 Technology, Media & Telecom Sensing, optics and illumination technology $30.0 2.0%
Top 15 Investments $689.8 46.9%Note: As of 31 August 2021. Excludes public companies and announced realisations. *Undisclosed company. Past performance is no guarantee of future results. Numbers may not sum due to rounding.
Largest Private Company Investments – 31 August 2021The largest 15 investments represent 46.9% of the portfolio
NYSE: AGTI
NYSE: CHWY
NYSE: CHWY
31
0%
10%
20%
30%
40%
50%
60%
70%
80%
90%
100%
0.0x
0.5x
1.0x
1.5x
2.0x
2.5x
3.0x
3.5x
2010 2011 2012 2013 2014 2015 2016 2017 2018 2019 2020
IRRMultiple
Realised Unrealised IRR
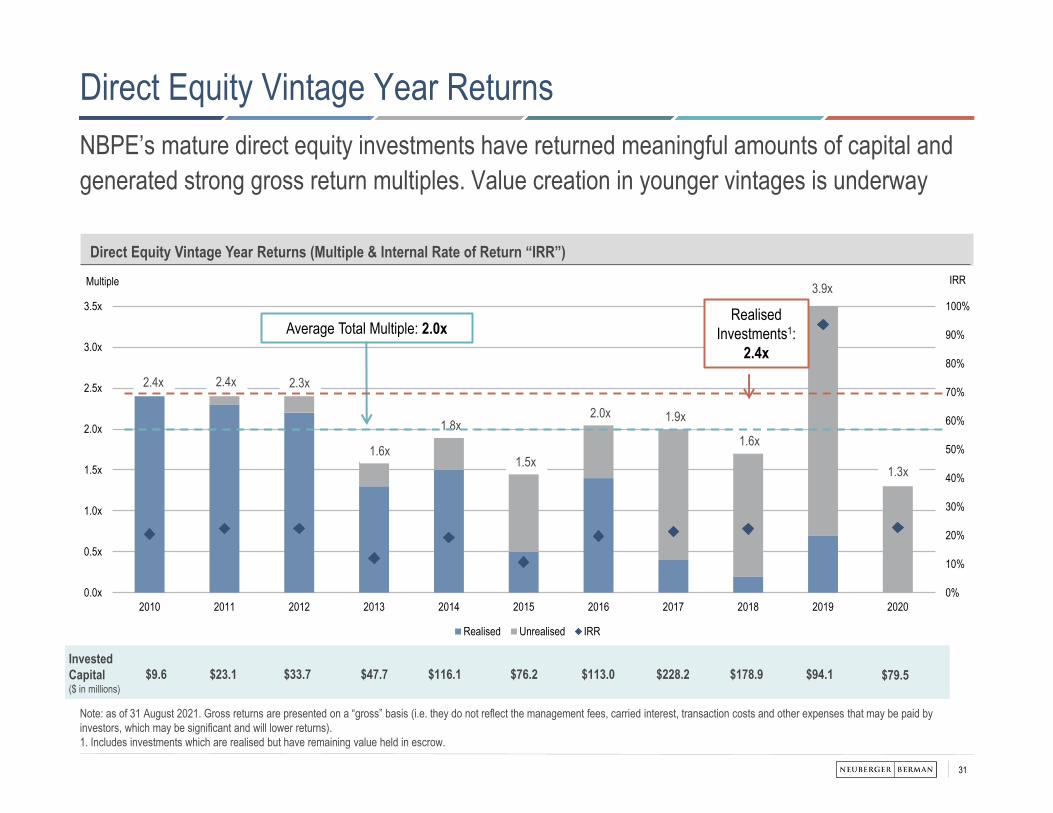
Direct Equity Vintage Year ReturnsNBPE’s mature direct equity investments have returned meaningful amounts of capital and generated strong gross return multiples. Value creation in younger vintages is underway
Note: as of 31 August 2021. Gross returns are presented on a “gross” basis (i.e. they do not reflect the management fees, carried interest, transaction costs and other expenses that may be paid by investors, which may be significant and will lower returns).1. Includes investments which are realised but have remaining value held in escrow.
Direct Equity Vintage Year Returns (Multiple & Internal Rate of Return “IRR”)
$9.6 $23.1 $33.7 $47.7 $116.1 $76.2 $113.0 $228.2 $178.9 $94.1Invested Capital($ in millions)
2.4x 2.4x 2.3x
1.6x
1.8x
1.5x
2.0x 1.9x
1.6x
3.9x
Average Total Multiple: 2.0xRealised
Investments1: 2.4x
1.3x
$79.5
Supplementary Information Balance sheet, dividend and capital position
33
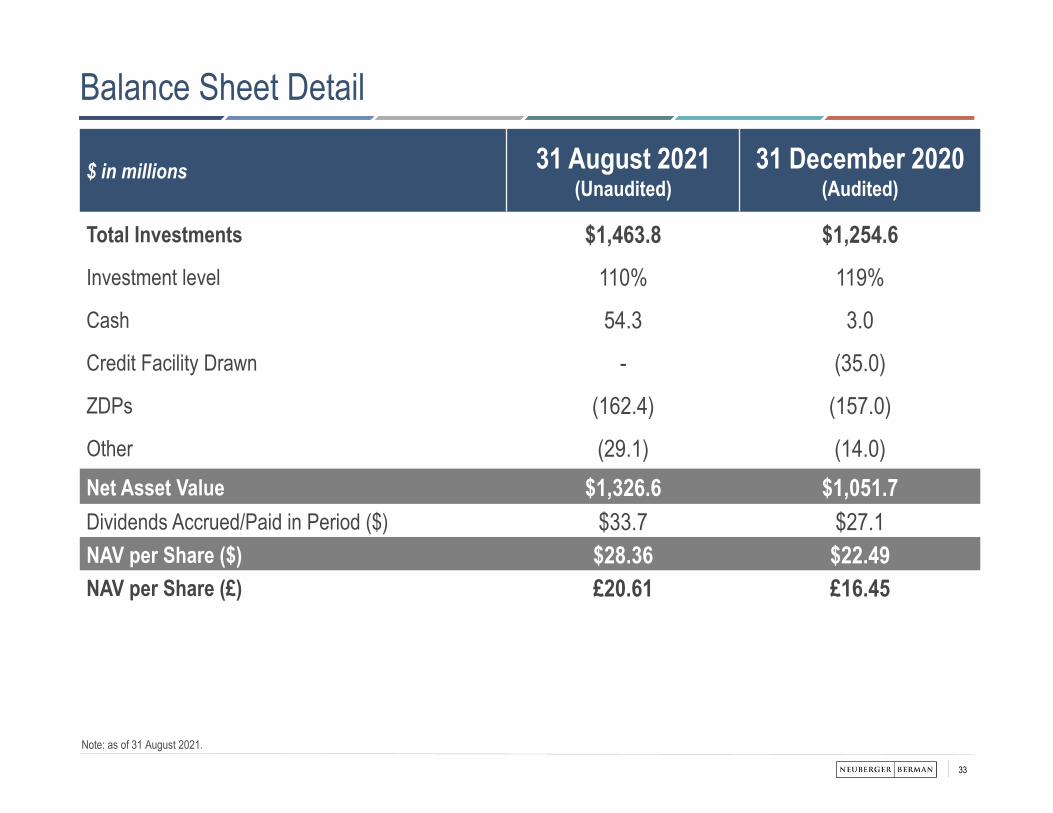
Note: as of 31 August 2021.
$ in millions 31 August 2021(Unaudited)
31 December 2020(Audited)
Total Investments $1,463.8 $1,254.6Investment level 110% 119%
Cash 54.3 3.0
Credit Facility Drawn - (35.0)
ZDPs (162.4) (157.0)
Other (29.1) (14.0)Net Asset Value $1,326.6 $1,051.7Dividends Accrued/Paid in Period ($) $33.7 $27.1NAV per Share ($) $28.36 $22.49NAV per Share (£) £20.61 £16.45
Balance Sheet Detail
Supplementary Information Fees and charges
35
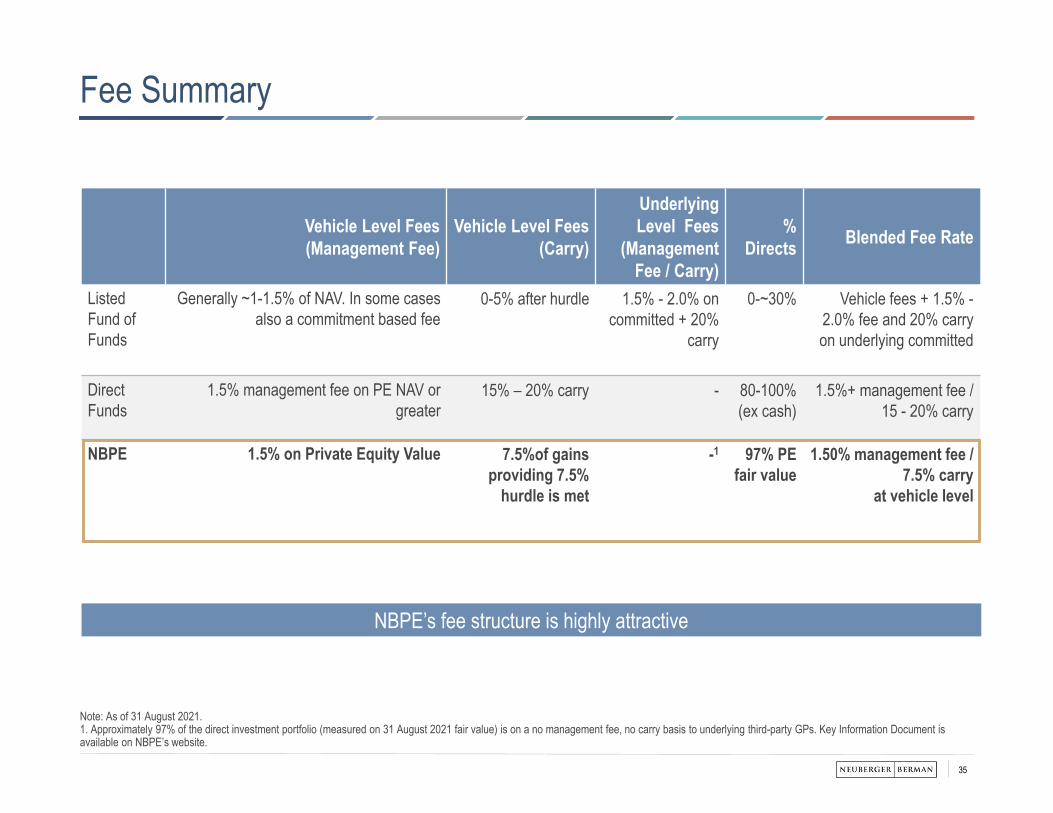
Fee Summary
Vehicle Level Fees (Management Fee)
Vehicle Level Fees (Carry)
Underlying Level Fees
(Management Fee / Carry)
% Directs Blended Fee Rate
Listed Fund of Funds
Generally ~1-1.5% of NAV. In some cases also a commitment based fee
0-5% after hurdle 1.5% - 2.0% on committed + 20%
carry
0-~30% Vehicle fees + 1.5% -2.0% fee and 20% carry on underlying committed
Direct Funds
1.5% management fee on PE NAV or greater
15% – 20% carry - 80-100%(ex cash)
1.5%+ management fee / 15 - 20% carry
NBPE 1.5% on Private Equity Value 7.5%of gains providing 7.5%
hurdle is met
-1 97% PE fair value
1.50% management fee / 7.5% carry
at vehicle level
NBPE’s fee structure is highly attractive
Note: As of 31 August 2021.1. Approximately 97% of the direct investment portfolio (measured on 31 August 2021 fair value) is on a no management fee, no carry basis to underlying third-party GPs. Key Information Document is available on NBPE’s website.
36
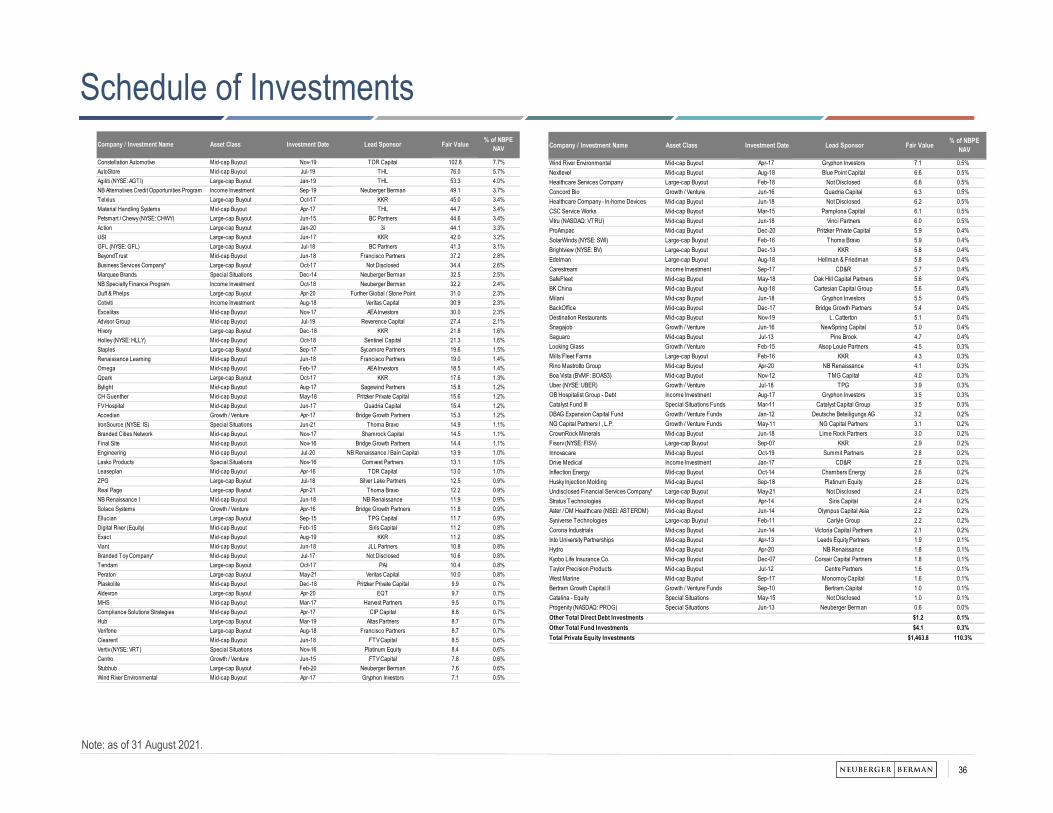
Schedule of Investments
Note: as of 31 August 2021.
Company / Investment Name Asset Class Investment Date Lead Sponsor Fair Value % of NBPE NAV
Wind River Environmental Mid-cap Buyout Apr-17 Gryphon Investors 7.1 0.5%Nextlevel Mid-cap Buyout Aug-18 Blue Point Capital 6.6 0.5%Healthcare Services Company Large-cap Buyout Feb-18 Not Disclosed 6.6 0.5%Concord Bio Growth / Venture Jun-16 Quadria Capital 6.3 0.5%Healthcare Company - In-home Devices Mid-cap Buyout Jun-18 Not Disclosed 6.2 0.5%CSC Service Works Mid-cap Buyout Mar-15 Pamplona Capital 6.1 0.5%Vitru (NASDAQ: VTRU) Mid-cap Buyout Jun-18 Vinci Partners 6.0 0.5%ProAmpac Mid-cap Buyout Dec-20 Pritzker Private Capital 5.9 0.4%SolarWinds (NYSE: SWI) Large-cap Buyout Feb-16 Thoma Bravo 5.9 0.4%Brightview (NYSE: BV) Large-cap Buyout Dec-13 KKR 5.8 0.4%Edelman Large-cap Buyout Aug-18 Hellman & Friedman 5.8 0.4%Carestream Income Investment Sep-17 CD&R 5.7 0.4%SafeFleet Mid-cap Buyout May-18 Oak Hill Capital Partners 5.6 0.4%BK China Mid-cap Buyout Aug-18 Cartesian Capital Group 5.6 0.4%Milani Mid-cap Buyout Jun-18 Gryphon Investors 5.5 0.4%BackOffice Mid-cap Buyout Dec-17 Bridge Growth Partners 5.4 0.4%Destination Restaurants Mid-cap Buyout Nov-19 L. Catterton 5.1 0.4%Snagajob Growth / Venture Jun-16 NewSpring Capital 5.0 0.4%Saguaro Mid-cap Buyout Jul-13 Pine Brook 4.7 0.4%Looking Glass Growth / Venture Feb-15 Alsop Louie Partners 4.5 0.3%Mills Fleet Farms Large-cap Buyout Feb-16 KKR 4.3 0.3%Rino Mastrotto Group Mid-cap Buyout Apr-20 NB Renaissance 4.1 0.3%Boa Vista (BVMF: BOAS3) Mid-cap Buyout Nov-12 TMG Capital 4.0 0.3%Uber (NYSE: UBER) Growth / Venture Jul-18 TPG 3.9 0.3%OB Hospitalist Group - Debt Income Investment Aug-17 Gryphon Investors 3.5 0.3%Catalyst Fund III Special Situations Funds Mar-11 Catalyst Capital Group 3.5 0.3%DBAG Expansion Capital Fund Growth / Venture Funds Jan-12 Deutsche Beteiligungs AG 3.2 0.2%NG Capital Partners I , L.P. Growth / Venture Funds May-11 NG Capital Partners 3.1 0.2%CrownRock Minerals Mid-cap Buyout Jun-18 Lime Rock Partners 3.0 0.2%Fiserv (NYSE: FISV) Large-cap Buyout Sep-07 KKR 2.9 0.2%Innovacare Mid-cap Buyout Oct-19 Summit Partners 2.8 0.2%Drive Medical Income Investment Jan-17 CD&R 2.8 0.2%Inflection Energy Mid-cap Buyout Oct-14 Chambers Energy 2.6 0.2%Husky Injection Molding Mid-cap Buyout Sep-18 Platinum Equity 2.6 0.2%Undisclosed Financial Services Company* Large-cap Buyout May-21 Not Disclosed 2.4 0.2%Stratus Technologies Mid-cap Buyout Apr-14 Siris Capital 2.4 0.2%Aster / DM Healthcare (NSEI: ASTERDM) Mid-cap Buyout Jun-14 Olympus Capital Asia 2.2 0.2%Syniverse Technologies Large-cap Buyout Feb-11 Carlyle Group 2.2 0.2%Corona Industrials Mid-cap Buyout Jun-14 Victoria Capital Partners 2.1 0.2%Into University Partnerships Mid-cap Buyout Apr-13 Leeds Equity Partners 1.9 0.1%Hydro Mid-cap Buyout Apr-20 NB Renaissance 1.8 0.1%Kyobo Life Insurance Co. Mid-cap Buyout Dec-07 Corsair Capital Partners 1.8 0.1%Taylor Precision Products Mid-cap Buyout Jul-12 Centre Partners 1.6 0.1%West Marine Mid-cap Buyout Sep-17 Monomoy Capital 1.6 0.1%Bertram Growth Capital II Growth / Venture Funds Sep-10 Bertram Capital 1.0 0.1%Catalina - Equity Special Situations May-15 Not Disclosed 1.0 0.1%Progenity (NASDAQ: PROG) Special Situations Jun-13 Neuberger Berman 0.6 0.0%Other Total Direct Debt Investments $1.2 0.1%Other Total Fund Investments $4.1 0.3%Total Private Equity Investments $1,463.8 110.3%
Company / Investment Name Asset Class Investment Date Lead Sponsor Fair Value % of NBPE NAV
Constellation Automotive Mid-cap Buyout Nov-19 TDR Capital 102.8 7.7%AutoStore Mid-cap Buyout Jul-19 THL 76.0 5.7%Agiliti (NYSE: AGTI) Large-cap Buyout Jan-19 THL 53.3 4.0%NB Alternatives Credit Opportunities Program Income Investment Sep-19 Neuberger Berman 49.1 3.7%Telxius Large-cap Buyout Oct-17 KKR 45.0 3.4%Material Handling Systems Mid-cap Buyout Apr-17 THL 44.7 3.4%Petsmart / Chewy (NYSE: CHWY) Large-cap Buyout Jun-15 BC Partners 44.6 3.4%Action Large-cap Buyout Jan-20 3i 44.1 3.3%USI Large-cap Buyout Jun-17 KKR 42.0 3.2%GFL (NYSE: GFL) Large-cap Buyout Jul-18 BC Partners 41.3 3.1%BeyondTrust Mid-cap Buyout Jun-18 Francisco Partners 37.2 2.8%Business Services Company* Large-cap Buyout Oct-17 Not Disclosed 34.4 2.6%Marquee Brands Special Situations Dec-14 Neuberger Berman 32.5 2.5%NB Specialty Finance Program Income Investment Oct-18 Neuberger Berman 32.2 2.4%Duff & Phelps Large-cap Buyout Apr-20 Further Global / Stone Point 31.0 2.3%Cotiviti Income Investment Aug-18 Veritas Capital 30.9 2.3%Excelitas Mid-cap Buyout Nov-17 AEA Investors 30.0 2.3%Advisor Group Mid-cap Buyout Jul-19 Reverence Capital 27.4 2.1%Hivory Large-cap Buyout Dec-18 KKR 21.8 1.6%Holley (NYSE: HLLY) Mid-cap Buyout Oct-18 Sentinel Capital 21.3 1.6%Staples Large-cap Buyout Sep-17 Sycamore Partners 19.6 1.5%Renaissance Learning Mid-cap Buyout Jun-18 Francisco Partners 19.0 1.4%Omega Mid-cap Buyout Feb-17 AEA Investors 18.5 1.4%Qpark Large-cap Buyout Oct-17 KKR 17.6 1.3%Bylight Mid-cap Buyout Aug-17 Sagewind Partners 15.8 1.2%CH Guenther Mid-cap Buyout May-18 Pritzker Private Capital 15.6 1.2%FV Hospital Mid-cap Buyout Jun-17 Quadria Capital 15.4 1.2%Accedian Growth / Venture Apr-17 Bridge Growth Partners 15.3 1.2%IronSource (NYSE: IS) Special Situations Jun-21 Thoma Bravo 14.9 1.1%Branded Cities Network Mid-cap Buyout Nov-17 Shamrock Capital 14.5 1.1%Final Site Mid-cap Buyout Nov-16 Bridge Growth Partners 14.4 1.1%Engineering Mid-cap Buyout Jul-20 NB Renaissance / Bain Capital 13.9 1.0%Lasko Products Special Situations Nov-16 Comvest Partners 13.1 1.0%Leaseplan Mid-cap Buyout Apr-16 TDR Capital 13.0 1.0%ZPG Large-cap Buyout Jul-18 Silver Lake Partners 12.5 0.9%Real Page Large-cap Buyout Apr-21 Thoma Bravo 12.2 0.9%NB Renaissance I Mid-cap Buyout Jun-18 NB Renaissance 11.9 0.9%Solace Systems Growth / Venture Apr-16 Bridge Growth Partners 11.8 0.9%Ellucian Large-cap Buyout Sep-15 TPG Capital 11.7 0.9%Digital River (Equity) Mid-cap Buyout Feb-15 Siris Capital 11.2 0.8%Exact Mid-cap Buyout Aug-19 KKR 11.2 0.8%Viant Mid-cap Buyout Jun-18 JLL Partners 10.8 0.8%Branded Toy Company* Mid-cap Buyout Jul-17 Not Disclosed 10.6 0.8%Tendam Large-cap Buyout Oct-17 PAI 10.4 0.8%Peraton Large-cap Buyout May-21 Veritas Capital 10.0 0.8%Plaskolite Mid-cap Buyout Dec-18 Pritzker Private Capital 9.9 0.7%Aldevron Large-cap Buyout Apr-20 EQT 9.7 0.7%MHS Mid-cap Buyout Mar-17 Harvest Partners 9.5 0.7%Compliance Solutions Strategies Mid-cap Buyout Apr-17 CIP Capital 8.8 0.7%Hub Large-cap Buyout Mar-19 Altas Partners 8.7 0.7%Verifone Large-cap Buyout Aug-18 Francisco Partners 8.7 0.7%Clearent Mid-cap Buyout Jun-18 FTV Capital 8.5 0.6%Vertiv (NYSE: VRT) Special Situations Nov-16 Platinum Equity 8.4 0.6%Centro Growth / Venture Jun-15 FTV Capital 7.8 0.6%Stubhub Large-cap Buyout Feb-20 Neuberger Berman 7.6 0.6%Wind River Environmental Mid-cap Buyout Apr-17 Gryphon Investors 7.1 0.5%
37
Appendix – Sustainability Potential of Investments
As of August 2021.
Sustainability Potential of Investments: Companies may have a range of effects on employees, the community, and the environment through their operations and products andservices. The Manager believes that companies that exhibit leadership in managing material environmental, social, and governance considerations, are also often more resilient, competitively positioned, and exhibit lower risk profiles. Furthermore, companies that contribute positively to solutions addressing sustainability challenges are by their nature, essential. These business models may benefit from macroeconomic and demographic trends while also contributing meaningfully to addressing global social and environmental challenges, such as outlined by the United Nations Sustainable Development Goals (“UN SDGs”). Sustainable companies, by their nature, seek to manage risks, not only related to adverse social outcomes, but also ones that might harm their license to operate.
The Investment Manager defines sustainability potential as: Adverse sustainability potential as companies whose operations or products/services contribute to significant adverse outcomes for people or the environment, such as outlined by
the United Nations Global Compact (“UNGC”), United Nations Guiding Principles (“UNGP”), and OECD Guidelines for Multinational Enterprises (“OECD Guidelines”); Positive sustainability potential as companies that have an overall positive benefit to people or the environment, such as outlined by the UNGC, UNGP, OECD Guidelines for
Multinational Enterprises; Significantly positive sustainability potential as companies whose products or services offer solutions to long-term sustainability challenges such as outlined by the UN SDGs.
The Investment Manager strives to identify and invest in companies that are deemed to have positive sustainability potential while avoiding exposure to companies that have known ESG-related controversies or business models deemed to have adverse sustainability potential as defined by the Exclusions outlined herein.

Endnotes
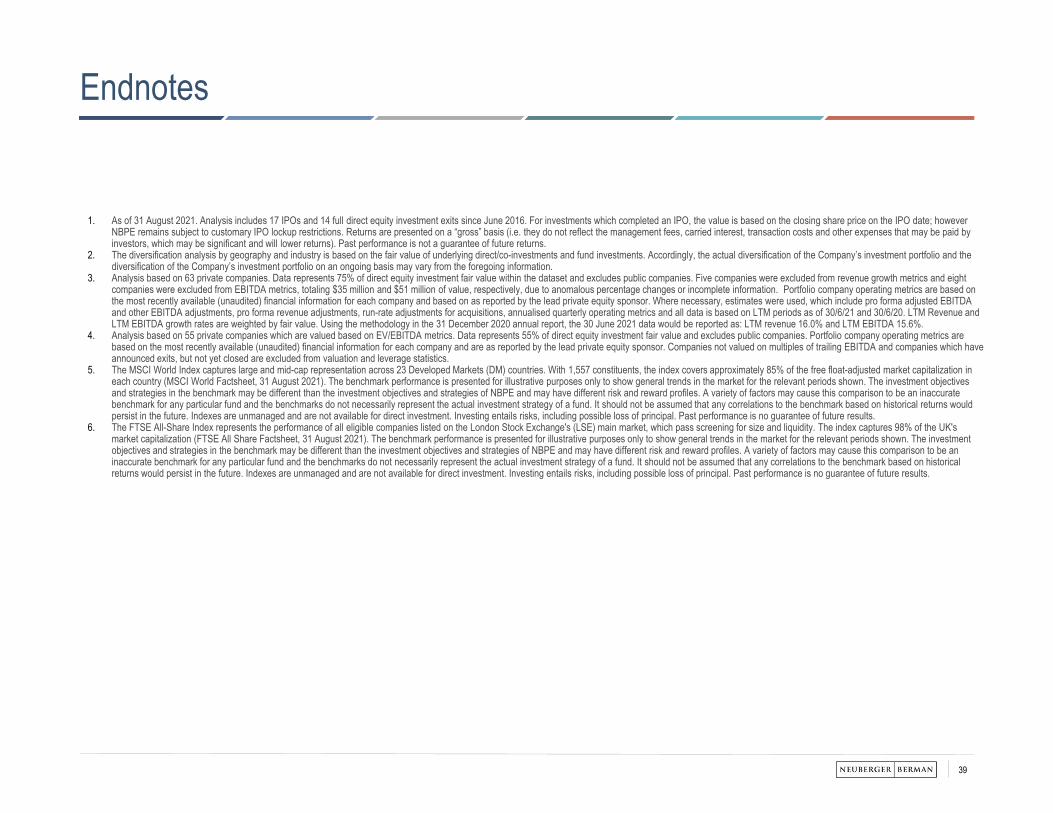
39
1. As of 31 August 2021. Analysis includes 17 IPOs and 14 full direct equity investment exits since June 2016. For investments which completed an IPO, the value is based on the closing share price on the IPO date; however NBPE remains subject to customary IPO lockup restrictions. Returns are presented on a “gross” basis (i.e. they do not reflect the management fees, carried interest, transaction costs and other expenses that may be paid by investors, which may be significant and will lower returns). Past performance is not a guarantee of future returns.
2. The diversification analysis by geography and industry is based on the fair value of underlying direct/co-investments and fund investments. Accordingly, the actual diversification of the Company’s investment portfolio and the diversification of the Company’s investment portfolio on an ongoing basis may vary from the foregoing information.
3. Analysis based on 63 private companies. Data represents 75% of direct equity investment fair value within the dataset and excludes public companies. Five companies were excluded from revenue growth metrics and eight companies were excluded from EBITDA metrics, totaling $35 million and $51 million of value, respectively, due to anomalous percentage changes or incomplete information. Portfolio company operating metrics are based on the most recently available (unaudited) financial information for each company and based on as reported by the lead private equity sponsor. Where necessary, estimates were used, which include pro forma adjusted EBITDA and other EBITDA adjustments, pro forma revenue adjustments, run-rate adjustments for acquisitions, annualised quarterly operating metrics and all data is based on LTM periods as of 30/6/21 and 30/6/20. LTM Revenue and LTM EBITDA growth rates are weighted by fair value. Using the methodology in the 31 December 2020 annual report, the 30 June 2021 data would be reported as: LTM revenue 16.0% and LTM EBITDA 15.6%.
4. Analysis based on 55 private companies which are valued based on EV/EBITDA metrics. Data represents 55% of direct equity investment fair value and excludes public companies. Portfolio company operating metrics are based on the most recently available (unaudited) financial information for each company and are as reported by the lead private equity sponsor. Companies not valued on multiples of trailing EBITDA and companies which have announced exits, but not yet closed are excluded from valuation and leverage statistics.
5. The MSCI World Index captures large and mid-cap representation across 23 Developed Markets (DM) countries. With 1,557 constituents, the index covers approximately 85% of the free float-adjusted market capitalization in each country (MSCI World Factsheet, 31 August 2021). The benchmark performance is presented for illustrative purposes only to show general trends in the market for the relevant periods shown. The investment objectives and strategies in the benchmark may be different than the investment objectives and strategies of NBPE and may have different risk and reward profiles. A variety of factors may cause this comparison to be an inaccurate benchmark for any particular fund and the benchmarks do not necessarily represent the actual investment strategy of a fund. It should not be assumed that any correlations to the benchmark based on historical returns would persist in the future. Indexes are unmanaged and are not available for direct investment. Investing entails risks, including possible loss of principal. Past performance is no guarantee of future results.
6. The FTSE All-Share Index represents the performance of all eligible companies listed on the London Stock Exchange's (LSE) main market, which pass screening for size and liquidity. The index captures 98% of the UK's market capitalization (FTSE All Share Factsheet, 31 August 2021). The benchmark performance is presented for illustrative purposes only to show general trends in the market for the relevant periods shown. The investment objectives and strategies in the benchmark may be different than the investment objectives and strategies of NBPE and may have different risk and reward profiles. A variety of factors may cause this comparison to be an inaccurate benchmark for any particular fund and the benchmarks do not necessarily represent the actual investment strategy of a fund. It should not be assumed that any correlations to the benchmark based on historical returns would persist in the future. Indexes are unmanaged and are not available for direct investment. Investing entails risks, including possible loss of principal. Past performance is no guarantee of future results.
Endnotes

Disclaimers
41
BY ACCEPTING AND READING THIS DOCUMENT AND/OR ATTENDING THE PRESENTATION TO WHICH THIS DOCUMENT RELATES YOU WILL BE DEEMED TO HAVE REPRESENTED, WARRANTED AND UNDERTAKEN FOR THE BENEFIT OF NBPE, THE INVESTMENT MANAGER, NEUBERGER BERMAN AND OTHERS THAT (A) YOU ARE OUTSIDE OF THE UNITED STATES AND ARE AN "INVESTMENT PROFESSIONAL" (AS DEFINED ABOVE), (B) YOU HAVE READ AND AGREE TO COMPLY WITH THE CONTENTS OF THIS NOTICE, YOU WILL KEEP THE INFORMATION IN THE INVESTOR MATERIALS AND DELIVERED DURING ANY PRESENTATION OR CONTAINTED IN ANY ACCOMPANYING DOCUMENT AND ALL INFORMATION ABOUT NEUBERGER BERMAN CONFIDENTIAL, AND WILL NOT REPRODUCE OR DISTRIBUTE, IN WHOLE OR IN PART, (DIRECTLY OR INDIRECTLY) ANY SUCH INFORMATION, UNTIL SUCH INFORMATION HAS BEEN MADE PUBLICLY AVAILABLE AND TAKE ALL REASONABLE STEPS TO PRESERVE SUCH CONFIDENTIALITY, AND (C) YOU ARE PERMITTED, IN ACCORDANCE WITH APPLICABLE LAWS, TO RECEIVE SUCH INFORMATION.ALL INVESTMENTS ARE SUBJECT TO RISK. PAST PERFORMANCE IS NOT INDICATIVE OF, OR A GUARANTEE OF, FUTURE PERFORMANCE. PROSPECTIVE INVESTORS ARE ADVISED TO SEEK EXPERT LEGAL, FINANCIAL, TAX AND OTHER PROFESSIONAL ADVICE BEFORE MAKING ANY INVESTMENT DECISION. THE VALUE OF INVESTMENTS MAY FLUCTUATE. RESULTS ACHIEVED IN THE PAST NOT INDICATIVE OF, OR A GUARANTEE OF, FUTURE RESULTS. ANY OF OUR OPINIONS EXPRESSED HEREIN ARE OUR CURRENT OPINIONS ONLY AND MAY BE SUBJECT TO CHANGE. STATEMENTS MADE HEREIN ARE AS OF THE DATE OF THIS DOCUMENT AND SHOULD NOT BE RELIED UPON AS OF ANY SUBSEQUENT DATE. PAST PERFORMANCE IS NOT INDICATIVE OF, OR A GUARANTEE OF, FUTURE PERFORMANCE.THIS DOCUMENT IS ISSUED BY NBPE WHOSE REGISTERED ADDRESS IS AT P.O. BOX 226, FLOOR 2 TRAFALGAR COURT, LES BANQUES ST PETER PORT, GUERNSEY GY1 4LY.
Legal Disclaimer
42
THIS DOCUMENT, ANY PRESENTATION MADE IN CONJUNCTION WITH THIS DOCUMENT AND ANY ACCOMPANYING MATERIALS (THE "INVESTOR MATERIALS") ARE STRICTLY CONFIDENTIAL AND MAY NOT BE COPIED, DISTRIBUTED, PUBLISHED OR REPRODUCED IN WHOLEOR IN PART, OR DISCLOSED OR DISTRIBUTED BY RECIPIENTS TO ANY OTHER PERSON. ANY RECIPIENT OF THE INVESTOR MATERIALS AGREES TO KEEP PERMANENTLY CONFIDENTIAL ALL INFORMATION THEREIN NOT ALREADY IN THE PUBLIC DOMAIN.
The Investor Materials are not for release, publication or distribution (directly or indirectly) in or into the United States, Canada, Australia, Japan, the Republic of South Africa or to any "US person" as defined in Regulation S under the United States Securities Act of 1933, as amended (the "SecuritiesAct") or into any other jurisdiction where applicable laws prohibit their release, distribution or publication. They do not constitute an offer of securities for sale anywhere in the world, including in or into the United States, Canada, Australia Japan or the Republic of South Africa. No recipient maydistribute, or make available, the Investor Materials(directly or indirectly) to any other person. Recipients of the Investor Materials should inform themselves about and observe any applicable legal requirements in their jurisdictions. In particular, the distribution of the Investor Materials may in certainjurisdictions be restricted by law. Accordingly, recipients represent that they are able to receive the Investor Materials without contravention of any applicable legal or regulatory restrictions in the jurisdiction in which they reside or conduct business.
The Investor Materials have been prepared by NB Private Equity Partners Limited ("NBPE") and NB Alternatives Advisers LLC (the "Investment Manager"). No member of the Neuberger Berman Group nor any of their respective directors, officers, employees, advisors, representatives, or otheragents makes or has been authorised to make any representation or warranties (express or implied) in relation to NBPE or as to the truth, accuracy or completeness of the Investor Materials, or any other written or oral statement provided, or any information on which the Investor Materials is based(including, without limitation, information obtained from third parties) or any other information or representations supplied or made in connection with the Investor Materials or as to the reasonableness of any projections which the Investor Materials contain. The aforementioned persons disclaim anyand all responsibility and liability whatsoever, whether arising in tort, contract or otherwise, for any errors, omissions or inaccuracies in such information or opinions or for any loss, cost or damage suffered or incurred howsoever arising, directly or indirectly, from any use of the Investor Materials ortheir contents by the recipient or any other person or otherwise in connection with the Investor Materials. Persons receiving or reviewing the Investor Materials must make all trading and investment decisions in reliance on their own judgement. No statement in the Investor Materials is intended to benor may be construed as a profit forecast.
In particular, no representation or warranty is given as to the achievement or reasonableness of, and no reliance should be placed on any projections, targets, estimates or forecasts contained in the Investor Materials and nothing in the Investor Materials is or should be relied on as a promise orrepresentation as to the future. The name "Neuberger Berman" is used interchangeably throughout these materials for a number of entities that are part of, or are associated with, the Neuberger Berman Group and when used in this notice includes all such entities.
This Investor Materials do not constitute a prospectus or offering memorandum or an offer in respect of any securities and are not intended to provide the basis for any decision in respect of NBPE or other evaluation of any securities of NBPE or any other entity and should not be considered as arecommendation that any investor should subscribe for or purchase any such securities or engage in any investment activity (as defined in the Financial Services and Markets Act 2000 (“FSMA”)) in any jurisdiction nor shall they, or any part of them, or the fact of their distribution in any mannerwhatsoever form the basis of, or be relied on in connection with, any contract or investment decision whatsoever, in any jurisdiction. Neither the issue of the Investor Materials nor any part of their contents constitutes an offer to sell or invitation to purchase any securities of NBPE or any other entity orany persons holding securities of NBPE and no information set out in the Investor Materials or referred to in other written or oral information is intended to form the basis of any contract of sale, investment decision or any decision to purchase any securities referred to in it.
The information contained in the Investor Materials is given as at the date of its publication (unless otherwise marked) and is subject to updating, revision and amendment. No reliance may be placed for any purpose whatsoever on the information of opinions contained in the Investor Materials or ontheir completeness, accuracy or fairness. The contents of the Investor Materials have not been approved by any competent regulatory or supervisory authority. The Investor Materials are not intended to be complete or to constitute all of the information necessary to adequately evaluate theconsequences of investing in NBPE. The contents of the Investor Materials have not been verified and the Investor Materials have not been approved (in whole or any part) by any competent regulatory or supervisory authority.
The Investor Materials are made available for information purposes only. The Investor Materials, which are not a prospectus or listing particulars or an admission document, do not contain any representations, do not constitute or form part of any offer or invitation to sell or transfer, or to underwrite,subscribe for or acquire, any shares or other securities, and do not constitute or form any part of any solicitation of any such offer or invitation, nor shall they are or any part of them or the fact of their distribution form the basis of or be relied upon in connection with any contract therefore, and do notconstitute a recommendation regarding the securities of NBPE.Neither NBPE nor Neuberger Berman gives any undertaking to provide the recipient with access to any additional information, or to update the Investor Materials or any additional information, or to correct any inaccuracies in them which may become apparent and the distribution of the InvestorMaterials shall not be deemed to be any form of commitment on the part of NBPE, the Investment Manager or Neuberger Berman to proceed with any transaction.
Legal Disclaimer
43
THE PROMOTION OF NBPE AND THE DISTRIBUTION OF THE INVESTOR MATERIALS IN THE UNITED KINGDOM IS RESTRICTED BY LAW. ACCORDINGLY, THIS COMMUNICATION IS DIRECTED ONLY AT (I) PERSONS OUTSIDE THE UNITED KINGDOM TO WHOM IT IS LAWFUL TO COMMUNICATE TO, OR (II) PERSONS HAVING PROFESSIONAL EXPERIENCE IN MATTERS RELATING TO INVESTMENTS WHO FALL WITHIN THE DEFINITION OF "INVESTMENT PROFESSIONALS" IN ARTICLE 19(5) OF THE FINANCIAL SERVICES AND MARKETS ACT 2000 (FINANCIAL PROMOTION) ORDER 2005 (AS AMENDED), OR (III) HIGH NET WORTH COMPANIES, UNINCORPORATED ASSOCIATIONS AND PARTNERSHIPS AND TRUSTEES OF HIGH VALUE TRUSTS AS DESCRIBED IN ARTICLE 49(2) OF THE FINANCIAL SERVICES AND MARKETS ACT 2000 (FINANCIAL PROMOTION) ORDER 2005 (AS AMENDED); PROVIDED THAT IN THE CASE OF PERSONS FALLING INTO CATEGORIES (II) OR (III), THE COMMUNICATION IS ONLY DIRECTED AT PERSONS WHO ARE ALSO "QUALIFIED INVESTORS" AS DEFINED IN SECTION 86 OF THE FINANCIAL SERVICES AND MARKETS ACT 2000 (EACH A "RELEVANT PERSON"). ANY INVESTMENT OR INVESTMENT ACTIVITY TO WHICH THIS COMMUNICATION RELATES IS AVAILABLE ONLY TO AND WILL BE ENGAGED IN ONLY WITH SUCH RELEVANT PERSONS. PERSONS WITHIN THE UNITED KINGDOM WHO RECEIVE THIS COMMUNICATION (OTHER THAN PERSONS FALLING WITHIN (II) AND (III) ABOVE) SHOULD NOT RELY ON OR ACT UPON THIS COMMUNICATION. YOU REPRESENT AND AGREE THAT YOU ARE A RELEVANT PERSON.NBPE HAS NOT BEEN, AND HAS NO INTENTION TO BE, REGISTERED UNDER THE U.S. INVESTMENT COMPANY ACT OF 1940, AS AMENDED (THE "INVESTMENT COMPANY ACT") AND INVESTORS ARE NOT AND WILL NOT BE ENTITLED TO THE BENEFITS OF THAT ACT. THE SECURITIES DESCRIBED IN THIS DOCUMENT HAVE NOT BEEN AND WILL NOT BE REGISTERED UNDER THE SECURITIES ACT OR THE LAWS OF ANY STATE OF THE UNITED STATES. CONSEQUENTLY, SUCH SECURITIES MAY NOT BE OFFERED OR SOLD IN THE UNITED STATES OR TO U.S. PERSONS (AS SUCH TERM IS DEFINED IN REGULATION S UNDER THE SECURITIES ACT) UNLESS SUCH SECURITIES ARE REGISTERED UNDER THE SECURITIES ACT OR AN EXEMPTION FROM THE REGISTRATION REQUIREMENT OF THE SECURITIES ACT IS AVAILABLE. NO PUBLIC OFFERING OF THE SECURITIES IS BEING MADE IN THE UNITED STATES.PROSPECTIVE INVESTORS SHOULD TAKE NOTE THAT ANY SECURITIES MAY NOT BE ACQUIRED BY INVESTORS USING ASSETS OF ANY RETIREMENT PLAN OR PENSION PLAN THAT IS SUBJECT TO PART 4 OF SUBTITLE B OF TITLE I OF THE UNITED STATES EMPLOYEE RETIREMENT INCOME SECURITY ACT OF 1974, AS AMENDED ("ERISA") OR SECTION 4975 OF THE UNITED STATES INTERNAL REVENUE CODE OF 1986, AS AMENDED (THE "CODE"), ENTITIES WHOSE UNDERLYING ASSETS ARE CONSIDERED TO INCLUDE "PLAN ASSETS" OF ANY SUCH RETIREMENT PLAN OR PENSION PLAN, OR ANY GOVERNMENTAL PLAN, CHURCH PLAN, NON-U.S. PLAN OR OTHER INVESTOR SUBJECT TO ANY STATE, LOCAL, NON-U.S. OR OTHER LAWS OR REGULATIONS SIMILAR TO TITLE I OR ERISA OR SECTION 4975 OF THE CODE OR THAT WOULD HAVE THE EFFECT OF THE REGULATIONS ISSUED BY THE UNITED STATES DEPARTMENT OF LABOR SET FORTH AT 29 CFR SECTION 2510.3-101, AS MODIFIED BY SECTION 3(42) OF ERISA.THE MERITS OR SUITABILITY OF ANY SECURITIES MUST BE INDEPENDENTLY DETERMINED BY THE RECIPIENT ON THE BASIS OF ITS OWN INVESTIGATION AND EVALUATION OF NBPE, THE INVESTMENT MANAGER, AND NEUBERGER BERMAN. ANY SUCH DETERMINATION SHOULD INVOLVE, AMONG OTHER THINGS, AN ASSESSMENT OF THE LEGAL, TAX, ACCOUNTING, REGULATORY, FINANCIAL, CREDIT AND OTHER RELATED ASPECTS OF THE SECURITIES. RECIPIENTS OF THIS DOCUMENT AND THE PRESENTATION ARE RECOMMENDED TO SEEK THEIR OWN INDEPENDENT LEGAL, TAX, FINANCIAL AND OTHER ADVICE AND SHOULD RELY SOLELY ON THEIR OWN JUDGMENT, REVIEW AND ANALYSIS IN EVALUATING NBPE, THE INVESTMENT MANAGER, AND NEUBERGER BERMAN, AND THEIR BUSINESS AND AFFAIRS.THIS INVESTOR MATERIALS MAY CONTAIN CERTAIN FORWARD-LOOKING STATEMENTS. FORWARD-LOOKING STATEMENTS RELATE TO EXPECTATIONS, BELIEFS, PROJECTIONS, FUTURE PLANS AND STRATEGIES, ANTICIPATED EVENTS OR TRENDS AND SIMILAR EXPRESSIONS CONCERNING MATTERS THAT ARE NOT HISTORICAL FACTS. IN SOME CASES, FORWARD-LOOKING STATEMENTS CAN BE INDENTIFIED BY TERMS SUCH AS "ANTICIPATE", BELIEVE", "COULD", "ESTIMATE", "EXPECT", "INTEND", "MAY", "PLAN", "POTENTIAL", "SHOULD", "WILL", AND "WOULD", OR THE NEGATIVE OF THOSE TERMS OR OTHER COMPARABLE TERMINOLOGY. THE FORWARD- LOOKING STATEMENTS ARE BASED ON NBPE’S AND/OR NEUBERGER BERMAN'S BELIEFS, ASSUMPTIONS AND EXPECTATIONS OF FUTURE PERFORMANCE AND MARKET DEVELOPMENTS, TAKING INTO ACCOUNT ALL INFORMATION CURRENTLY AVAILABLE AND ARE INTENDED ONLY TO ILLUSTRATE HYPOTHETICAL RESULTS UNDER THOSE BELIEFS, ASSUMPTIONS AND EXPECTATIONS (NOT ALL OF WHICH WILL BE SPECIFIED HEREIN), NOT ALL RELEVANT EVENTS OR CONDITIONS MAY HAVE BEEN CONSIDERED IN DEVELOPING SUCH BELIEFS, ASSUMPTIONS AND EXPECTATIONS. THESE BELIEFS, ASSUMPTIONS, AND EXPECTATIONS CAN CHANGE AS A RESULT OF MANY POSSIBLE EVENTS OR FACTORS, NOT ALL OF WHICH ARE KNOWN OR ARE WITHIN NBPE’S OR NEUBERGER BERMAN’S CONTROL. IF A CHANGE OCCURS, NBPE’S BUSINESS, FINANCIAL CONDITION, LIQUIDITY AND RESULTS OF OPERATIONS MAY VARY MATERIALLY FROM THOSE EXPRESSED IN FORWARD-LOOKING STATEMENTS. SOME OF THE FACTORS THAT COULD CAUSE ACTUAL RESULTS TO VARY FROM THOSE EXPRESSED IN FORWARD-LOOKING STATEMENTS, INCLUDE, BUT ARE NOT LIMITED TO: THE FACTORS DESCRIBED IN THE INVESTOR MATERIALS; THE RATE AT WHICH NBPE DEPLOYS ITS CAPITAL IN INVESTMENTS AND ACHIEVES EXPECTED RATES OF RETURN; NBPE’S AND THE INVESTMENT MANAGER’S ABILITY TO EXECUTE NBPE'S INVESTMENT STRATEGY, INCLUDING THROUGH THE IDENTIFICATION OF A SUFFICIENT NUMBER OF APPROPRIATE INVESTMENTS; THE CONTINUATION OF THE INVESTMENT MANAGER AS MANAGER OF NBPE'S INVESTMENTS, THE CONTINUED AFFILIATION WITH NEUBERGER BERMAN OF ITS KEY INVESTMENT PROFESSIONALS; NBPE’S FINANCIAL CONDITION AND LIQUIDITY; CHANGES IN THE VALUES OF OR RETURNS ON INVESTMENTS THAT THE NBPE MAKES; CHANGES IN FINANCIAL MARKETS, INTEREST RATES OR INDUSTRY, GENERAL ECONOMIC OR POLITICAL CONDITIONS; AND THE GENERAL VOLATILITY OF THE CAPITAL MARKETS AND THE MARKET PRICE OF NBPE’S SHARES.BY THEIR NATURE, FORWARD-LOOKING STATEMENTS INVOLVE KNOWN AND UNKNOWN RISKS AND UNCERTAINTIES BECAUSE THEY RELATE TO EVENTS, AND DEPEND ON CIRCUMSTANCES THAT MAY OR MAY NOT OCCUR IN THE FUTURE. FORWARD-LOOKING STATEMENTS ARE NOT GUARANTEES OF FUTURE PERFORMANCE. ANY FORWARD-LOOKING STATEMENTS ARE ONLY MADE AS AT THE DATE OF THE INVESTOR MATERIALS, AND NEITHER NBPE NOR THE INVESTMENT MANAGER ASSUMES ANY OBLIGATION TO UPDATE FORWARD-LOOKING STATEMENTS SET FORTH IN THE INVESTOR MATERIALS WHETHER AS A RESULT OF NEW INFORMATION, FUTURE EVENTS, OR OTHERWISE, EXCEPT AS REQUIRED BY LAW OR OTHER APPLICABLE REGULATION. IN LIGHT OF THESE RISKS, UNCERTAINTIES, AND ASSUMPTIONS, THE EVENTS DESCRIBED BY ANY SUCH FORWARD-LOOKING STATEMENTS MIGHT NOT OCCUR. NBPE QUALIFIES ANY AND ALL OF THEIR FORWARD-LOOKING STATEMENTS BY THESE CAUTIONARY FACTORS. PLEASE KEEP THIS CAUTIONARY NOTE IN MIND WHILE CONSIDERING THE INVESTOR MATERIALS.
Legal Disclaimer