nb private equity partners 2015 investor...• share price cumulative total return1 • calendar...
TRANSCRIPT
Financial Information as of 31 March 2015 unless otherwise indicated
NB Private Equity PartnersApril 2015
NB Private Equity Partners (“NBPE”) Overview
Providing investors the opportunity for…
… both capital appreciation and current income…
…through investments in private equity-backed companies…
…benefiting from the attractiveness of private markets…
…and our Manager’s information and sourcing advantages.
NBPE is a closed end investment company providing investors with diversified exposure to the private equity asset class
1
CAPITAL APPRECIATION
STRONG BALANCE SHEET
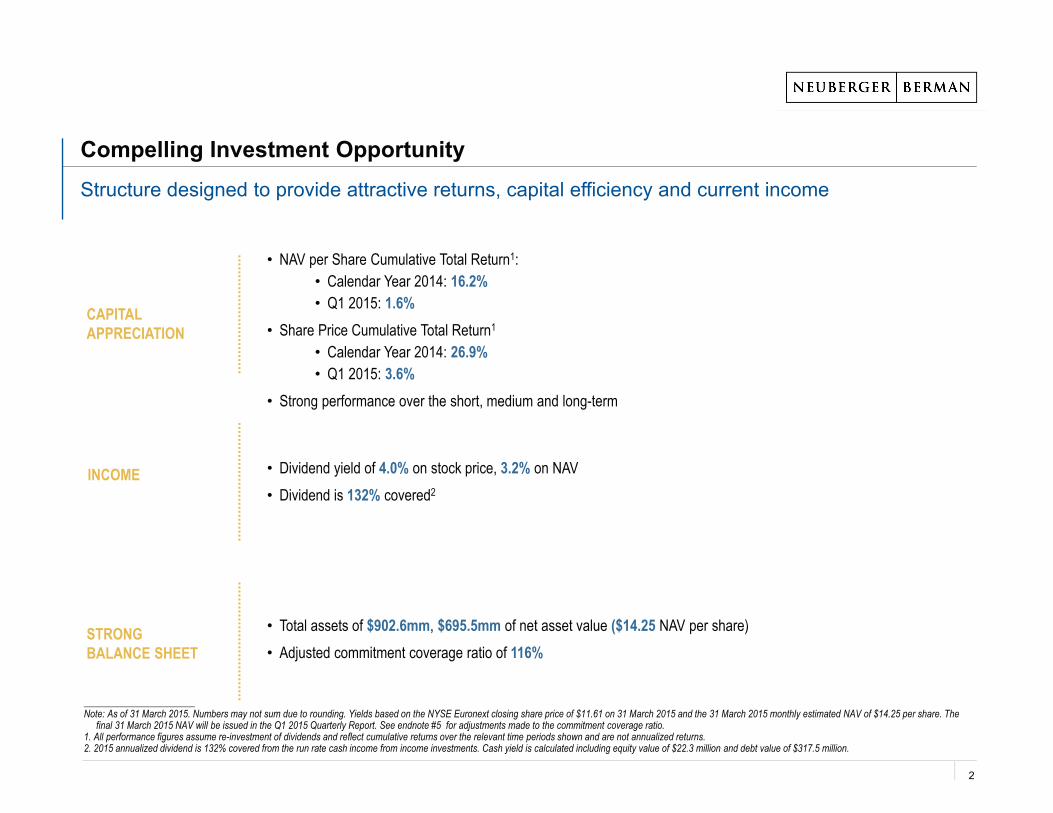
Structure designed to provide attractive returns, capital efficiency and current income
Compelling Investment Opportunity
• Total assets of $902.6mm, $695.5mm of net asset value ($14.25 NAV per share)• Adjusted commitment coverage ratio of 116%
• NAV per Share Cumulative Total Return1:• Calendar Year 2014: 16.2%• Q1 2015: 1.6%
• Share Price Cumulative Total Return1
• Calendar Year 2014: 26.9%• Q1 2015: 3.6%
• Strong performance over the short, medium and long-term
_______________________Note: As of 31 March 2015. Numbers may not sum due to rounding. Yields based on the NYSE Euronext closing share price of $11.61 on 31 March 2015 and the 31 March 2015 monthly estimated NAV of $14.25 per share. The
final 31 March 2015 NAV will be issued in the Q1 2015 Quarterly Report. See endnote #5 for adjustments made to the commitment coverage ratio. 1. All performance figures assume re-investment of dividends and reflect cumulative returns over the relevant time periods shown and are not annualized returns.2. 2015 annualized dividend is 132% covered from the run rate cash income from income investments. Cash yield is calculated including equity value of $22.3 million and debt value of $317.5 million.
INCOME • Dividend yield of 4.0% on stock price, 3.2% on NAV• Dividend is 132% covered2
2

NBPE OVERVIEW
_______________________Note: as of 31 March 2015. This is intended as a broad overview of the Investment Managers’ style, philosophy and process and is subject to change without notice. 1. Total yield to maturity excludes equity value, cash yield includes equity value.
NBPEFocus
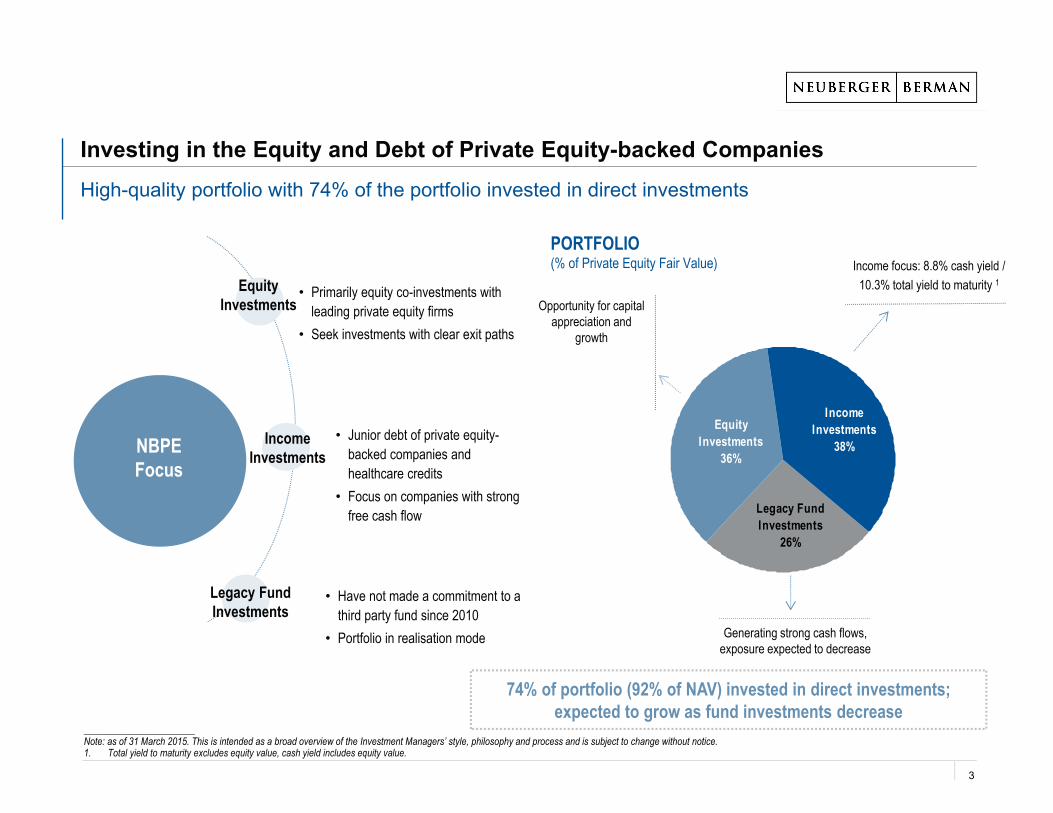
• Primarily equity co-investments with leading private equity firms
• Seek investments with clear exit paths
• Have not made a commitment to a third party fund since 2010
• Portfolio in realisation mode
• Junior debt of private equity-backed companies and healthcare credits
• Focus on companies with strong free cash flow
Equity Investments
IncomeInvestments
Legacy Fund Investments
Investing in the Equity and Debt of Private Equity-backed CompaniesHigh-quality portfolio with 74% of the portfolio invested in direct investments
Legacy Fund Investments
26%
Equity Investments
36%
Income Investments
38%
Generating strong cash flows, exposure expected to decrease
Opportunity for capital appreciation and
growth
Income focus: 8.8% cash yield /10.3% total yield to maturity 1
74% of portfolio (92% of NAV) invested in direct investments; expected to grow as fund investments decrease
PORTFOLIO(% of Private Equity Fair Value)
3
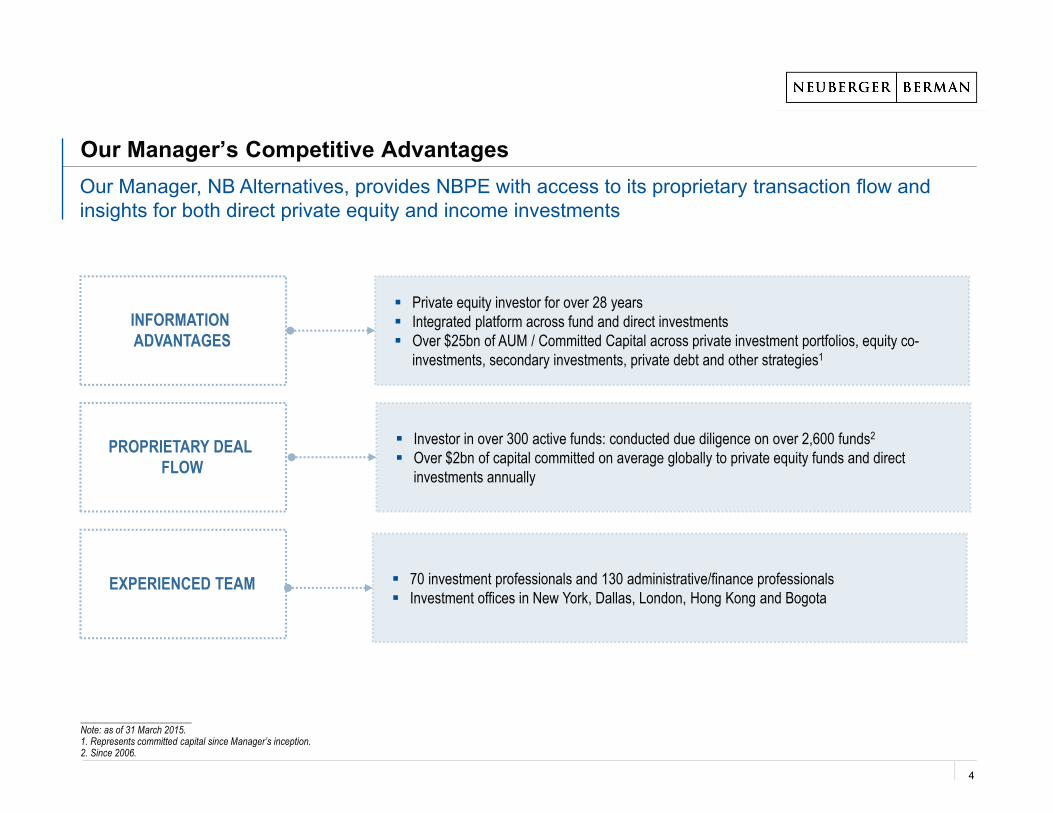
Our Manager’s Competitive AdvantagesOur Manager, NB Alternatives, provides NBPE with access to its proprietary transaction flow and insights for both direct private equity and income investments
INFORMATION ADVANTAGES
Private equity investor for over 28 years Integrated platform across fund and direct investments Over $25bn of AUM / Committed Capital across private investment portfolios, equity co-
investments, secondary investments, private debt and other strategies1
PROPRIETARY DEAL FLOW
Investor in over 300 active funds: conducted due diligence on over 2,600 funds2
Over $2bn of capital committed on average globally to private equity funds and direct investments annually
EXPERIENCED TEAM 70 investment professionals and 130 administrative/finance professionals Investment offices in New York, Dallas, London, Hong Kong and Bogota
_______________________Note: as of 31 March 2015.1. Represents committed capital since Manager’s inception.2. Since 2006.
4
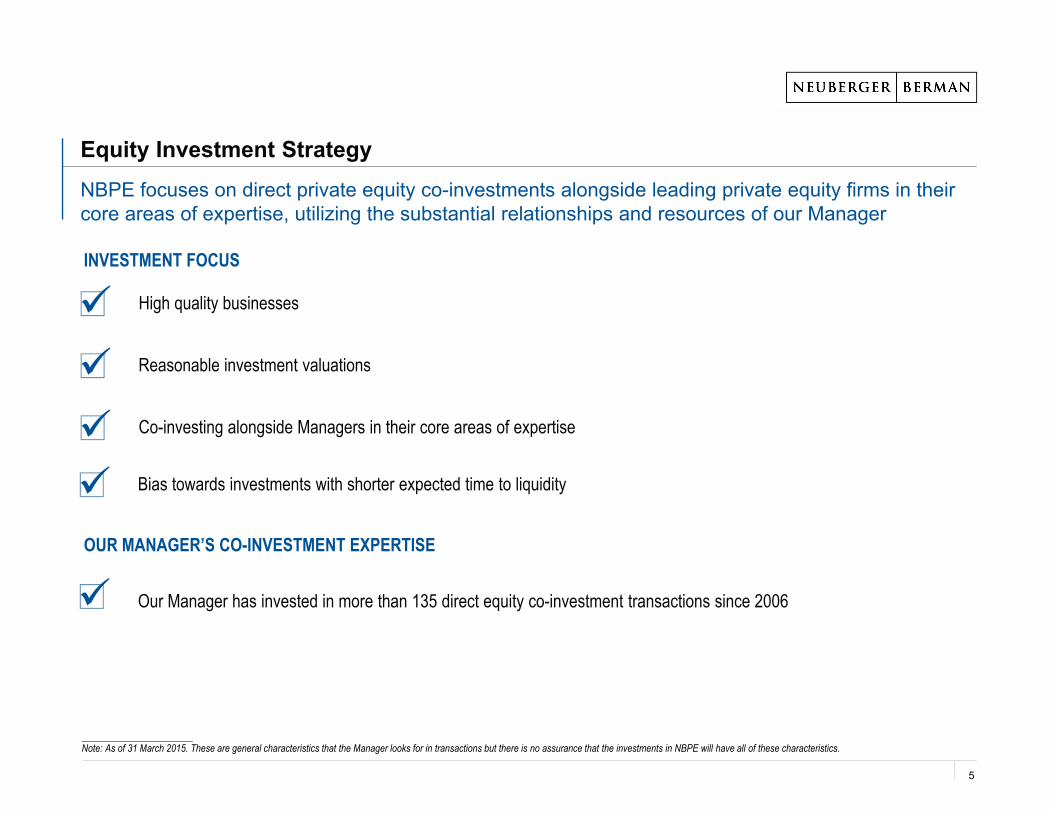
Equity Investment Strategy
High quality businessesReasonable investment valuationsCo-investing alongside Managers in their core areas of expertise
INVESTMENT FOCUS
NBPE focuses on direct private equity co-investments alongside leading private equity firms in their core areas of expertise, utilizing the substantial relationships and resources of our Manager
_______________________Note: As of 31 March 2015. These are general characteristics that the Manager looks for in transactions but there is no assurance that the investments in NBPE will have all of these characteristics.
OUR MANAGER’S CO-INVESTMENT EXPERTISE
Our Manager has invested in more than 135 direct equity co-investment transactions since 2006
Bias towards investments with shorter expected time to liquidity
5
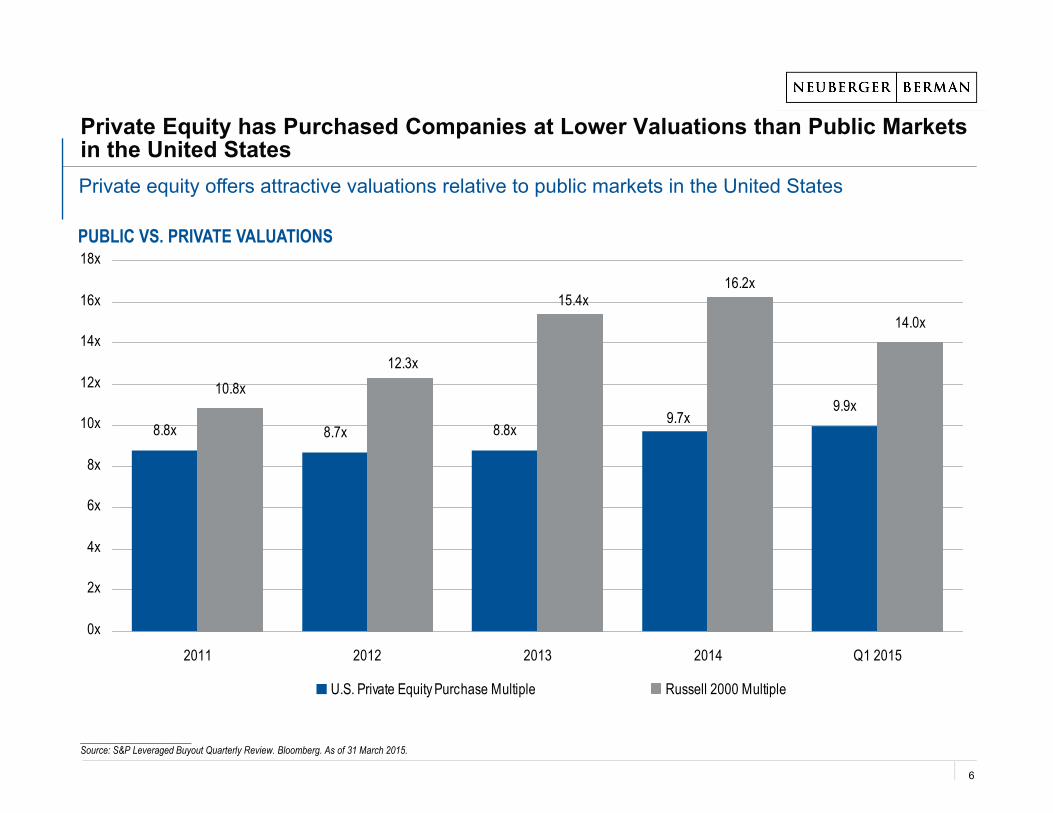
8.8x 8.7x 8.8x9.9x
10.8x
14.0x
9.7x
12.3x
15.4x16.2x
0x
2x
4x
6x
8x
10x
12x
14x
16x
18x
2011 2012 2013 2014 Q1 2015
U.S. Private Equity Purchase Multiple Russell 2000 Multiple
Private Equity has Purchased Companies at Lower Valuations than Public Markets in the United States
PUBLIC VS. PRIVATE VALUATIONS
_______________________Source: S&P Leveraged Buyout Quarterly Review. Bloomberg. As of 31 March 2015.
Private equity offers attractive valuations relative to public markets in the United States
6
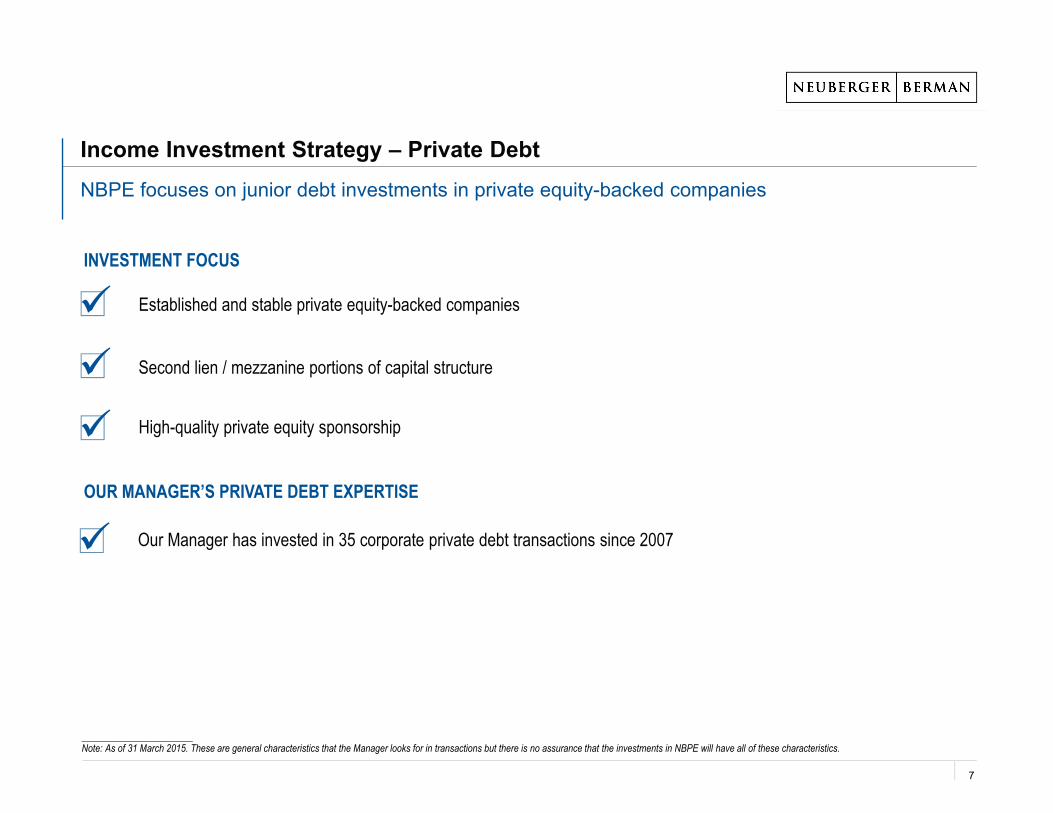
Income Investment Strategy – Private Debt
Established and stable private equity-backed companiesSecond lien / mezzanine portions of capital structureHigh-quality private equity sponsorship
INVESTMENT FOCUS
NBPE focuses on junior debt investments in private equity-backed companies
_______________________Note: As of 31 March 2015. These are general characteristics that the Manager looks for in transactions but there is no assurance that the investments in NBPE will have all of these characteristics.
OUR MANAGER’S PRIVATE DEBT EXPERTISE
Our Manager has invested in 35 corporate private debt transactions since 2007
7
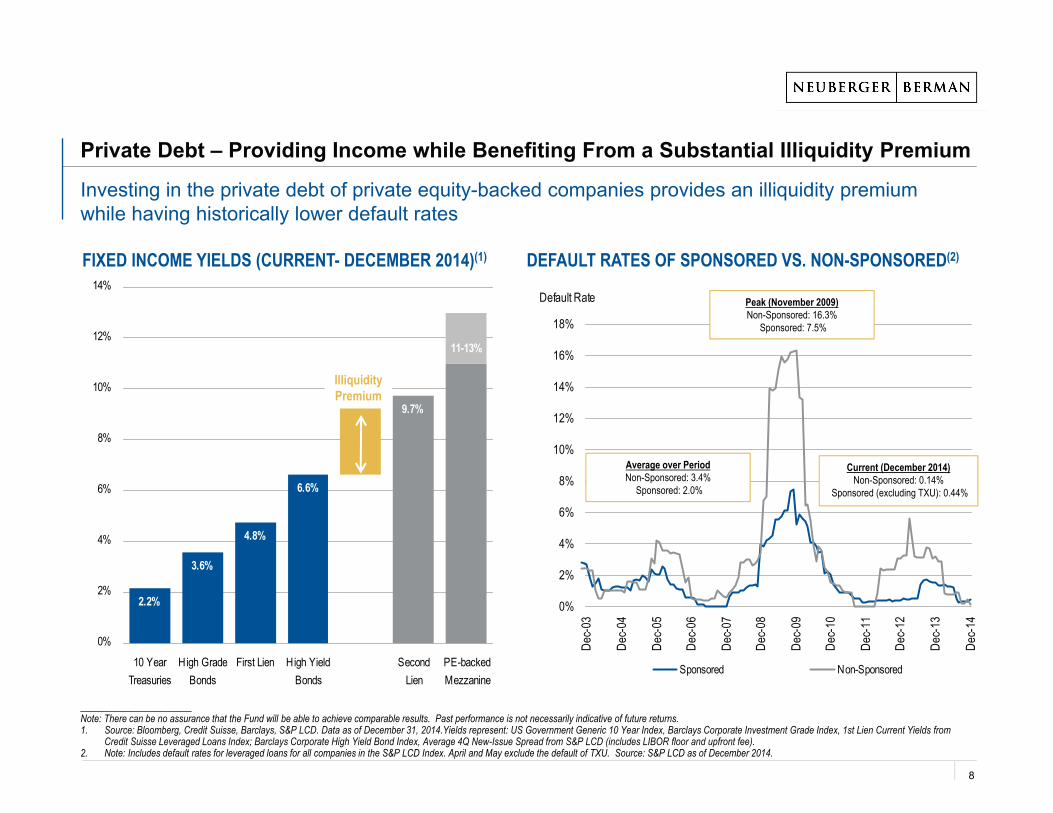
6.6%
4.8%
9.7%
3.6%
2.2%
11-13%
0%
2%
4%
6%
8%
10%
12%
14%
10 YearTreasuries
High GradeBonds
First Lien High YieldBonds
SecondLien
PE-backedMezzanine
FIXED INCOME YIELDS (CURRENT- DECEMBER 2014)(1)
Private Debt – Providing Income while Benefiting From a Substantial Illiquidity Premium
Investing in the private debt of private equity-backed companies provides an illiquidity premium while having historically lower default rates
_______________________Note: There can be no assurance that the Fund will be able to achieve comparable results. Past performance is not necessarily indicative of future returns.1. Source: Bloomberg, Credit Suisse, Barclays, S&P LCD. Data as of December 31, 2014.Yields represent: US Government Generic 10 Year Index, Barclays Corporate Investment Grade Index, 1st Lien Current Yields from
Credit Suisse Leveraged Loans Index; Barclays Corporate High Yield Bond Index, Average 4Q New-Issue Spread from S&P LCD (includes LIBOR floor and upfront fee). 2. Note: Includes default rates for leveraged loans for all companies in the S&P LCD Index. April and May exclude the default of TXU. Source: S&P LCD as of December 2014.
IlliquidityPremium
DEFAULT RATES OF SPONSORED VS. NON-SPONSORED(2)
0%
2%
4%
6%
8%
10%
12%
14%
16%
18%
Dec-0
3
Dec-0
4
Dec-0
5
Dec-0
6
Dec-0
7
Dec-0
8
Dec-0
9
Dec-1
0
Dec-1
1
Dec-1
2
Dec-1
3
Dec-1
4
Default Rate
Sponsored Non-Sponsored
Average over PeriodNon-Sponsored: 3.4%
Sponsored: 2.0%
Peak (November 2009)Non-Sponsored: 16.3%
Sponsored: 7.5%
Current (December 2014)Non-Sponsored: 0.14%
Sponsored (excluding TXU): 0.44%
8
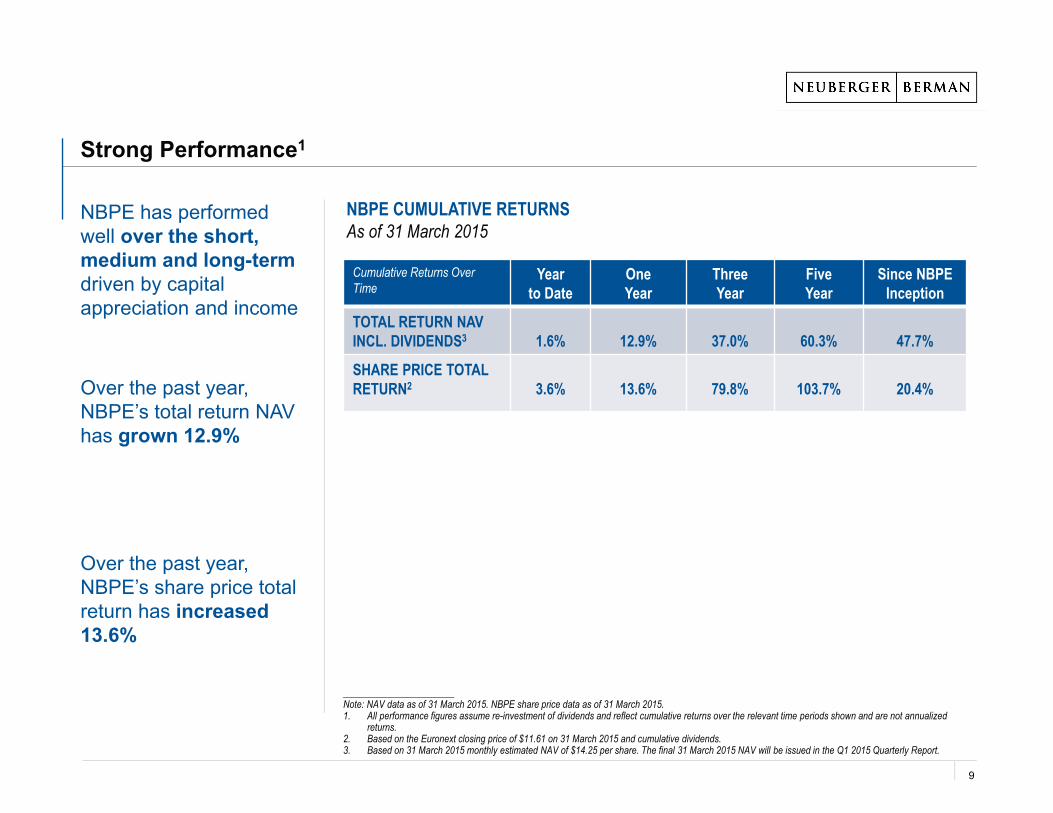
Strong Performance1
NBPE has performed well over the short, medium and long-term driven by capital appreciation and income
Over the past year, NBPE’s total return NAV has grown 12.9%
Over the past year, NBPE’s share price total return has increased 13.6%
NBPE CUMULATIVE RETURNS As of 31 March 2015
_______________________Note: NAV data as of 31 March 2015. NBPE share price data as of 31 March 2015. 1. All performance figures assume re-investment of dividends and reflect cumulative returns over the relevant time periods shown and are not annualized
returns.2. Based on the Euronext closing price of $11.61 on 31 March 2015 and cumulative dividends.3. Based on 31 March 2015 monthly estimated NAV of $14.25 per share. The final 31 March 2015 NAV will be issued in the Q1 2015 Quarterly Report.
Cumulative Returns Over Time
Year to Date
One Year
Three Year
Five Year
Since NBPE Inception
TOTAL RETURN NAV INCL. DIVIDENDS3 1.6% 12.9% 37.0% 60.3% 47.7%
SHARE PRICE TOTAL RETURN2 3.6% 13.6% 79.8% 103.7% 20.4%
9
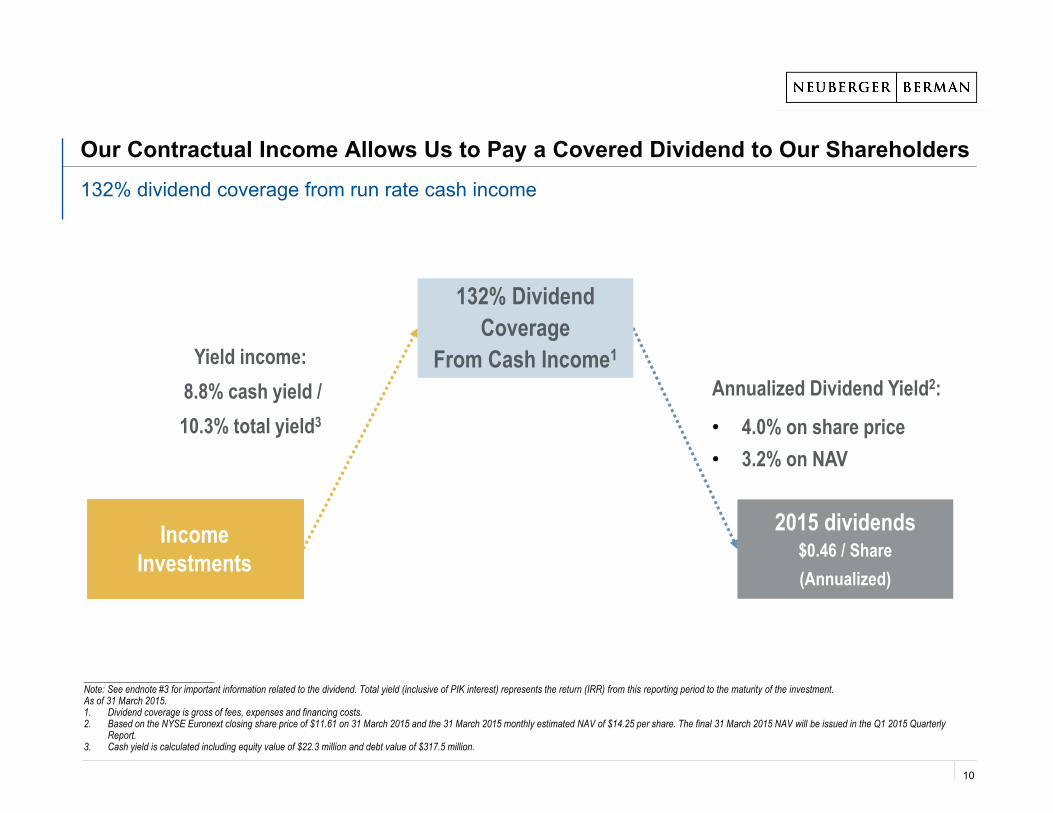
Our Contractual Income Allows Us to Pay a Covered Dividend to Our Shareholders
___________________________Note: See endnote #3 for important information related to the dividend. Total yield (inclusive of PIK interest) represents the return (IRR) from this reporting period to the maturity of the investment.As of 31 March 2015.1. Dividend coverage is gross of fees, expenses and financing costs.2. Based on the NYSE Euronext closing share price of $11.61 on 31 March 2015 and the 31 March 2015 monthly estimated NAV of $14.25 per share. The final 31 March 2015 NAV will be issued in the Q1 2015 Quarterly
Report.3. Cash yield is calculated including equity value of $22.3 million and debt value of $317.5 million.
Yield income:8.8% cash yield /10.3% total yield3
IncomeInvestments
132% Dividend Coverage
From Cash Income1
132% Dividend Coverage
From Cash Income1
2015 dividends$0.46 / Share(Annualized)
2015 dividends$0.46 / Share(Annualized)
Annualized Dividend Yield2:
• 4.0% on share price • 3.2% on NAV
132% dividend coverage from run rate cash income
10
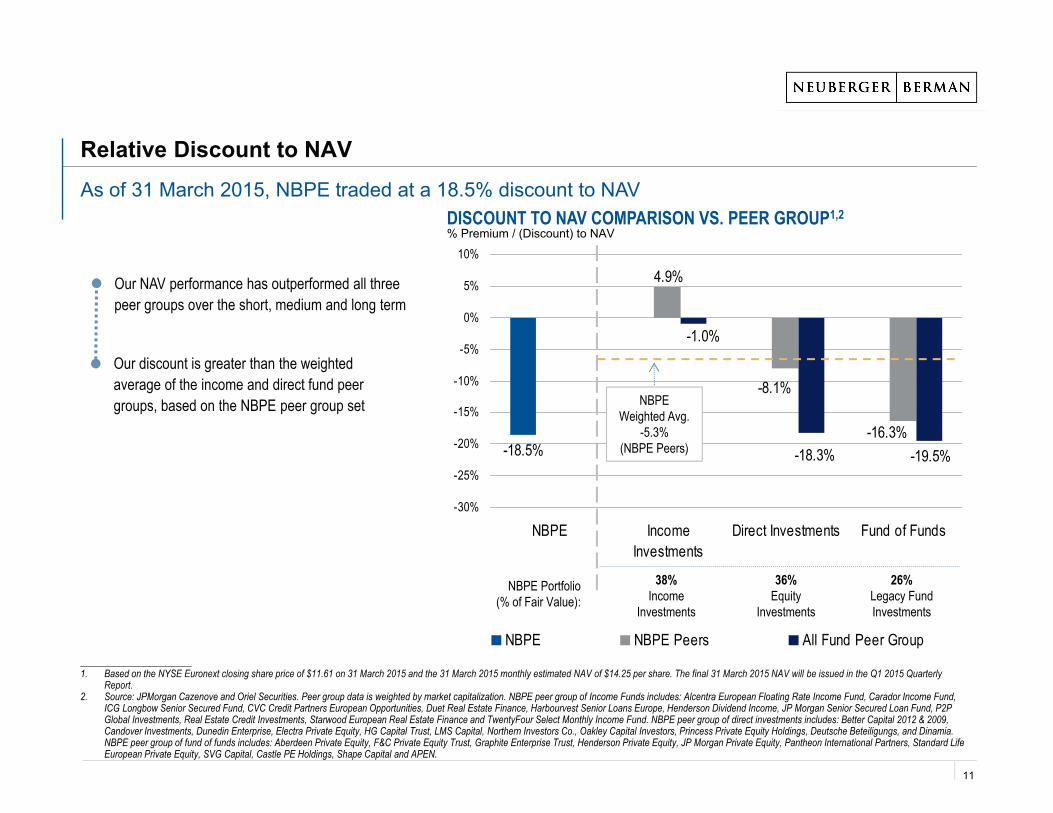
-18.5%
-8.1%
-16.3%
4.9%
-18.3%
-1.0%
-19.5%
-30%
-25%
-20%
-15%
-10%
-5%
0%
5%
10%
NBPE IncomeInvestments
Direct Investments Fund of Funds
NBPE NBPE Peers All Fund Peer Group
Relative Discount to NAVAs of 31 March 2015, NBPE traded at a 18.5% discount to NAV
_______________________1. Based on the NYSE Euronext closing share price of $11.61 on 31 March 2015 and the 31 March 2015 monthly estimated NAV of $14.25 per share. The final 31 March 2015 NAV will be issued in the Q1 2015 Quarterly
Report.2. Source: JPMorgan Cazenove and Oriel Securities. Peer group data is weighted by market capitalization. NBPE peer group of Income Funds includes: Alcentra European Floating Rate Income Fund, Carador Income Fund,
ICG Longbow Senior Secured Fund, CVC Credit Partners European Opportunities, Duet Real Estate Finance, Harbourvest Senior Loans Europe, Henderson Dividend Income, JP Morgan Senior Secured Loan Fund, P2P Global Investments, Real Estate Credit Investments, Starwood European Real Estate Finance and TwentyFour Select Monthly Income Fund. NBPE peer group of direct investments includes: Better Capital 2012 & 2009, Candover Investments, Dunedin Enterprise, Electra Private Equity, HG Capital Trust, LMS Capital, Northern Investors Co., Oakley Capital Investors, Princess Private Equity Holdings, Deutsche Beteiligungs, and Dinamia. NBPE peer group of fund of funds includes: Aberdeen Private Equity, F&C Private Equity Trust, Graphite Enterprise Trust, Henderson Private Equity, JP Morgan Private Equity, Pantheon International Partners, Standard Life European Private Equity, SVG Capital, Castle PE Holdings, Shape Capital and APEN.
DISCOUNT TO NAV COMPARISON VS. PEER GROUP1,2% Premium / (Discount) to NAV
NBPE Portfolio (% of Fair Value):
38%Income
Investments
36%Equity
Investments
26%Legacy Fund Investments
Our discount is greater than the weighted average of the income and direct fund peer groups, based on the NBPE peer group set
Our NAV performance has outperformed all three peer groups over the short, medium and long term
NBPE Weighted Avg.
-5.3%(NBPE Peers)
11

PORTFOLIO UPDATE
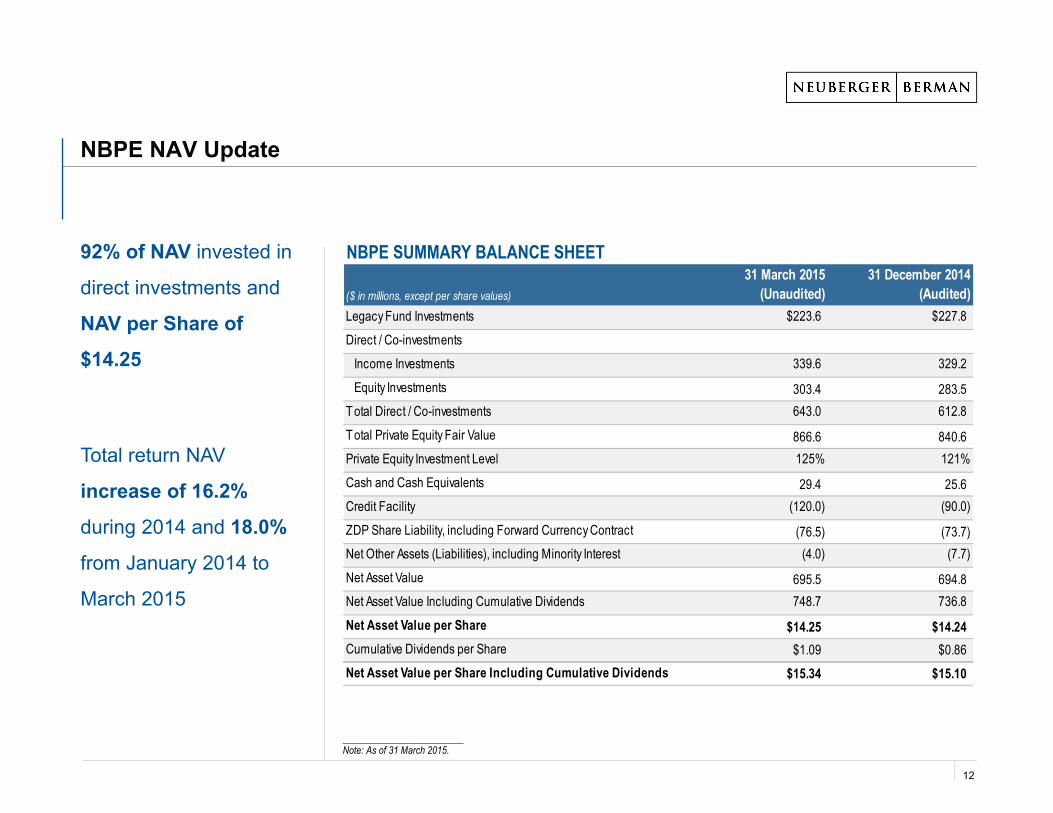
NBPE NAV Update
92% of NAV invested in
direct investments and
NAV per Share of
$14.25
Total return NAV
increase of 16.2%
during 2014 and 18.0%
from January 2014 to
March 2015
_________________________Note: As of 31 March 2015.
NBPE SUMMARY BALANCE SHEET
($ in millions, except per share values)
31 March 2015 (Unaudited)
31 December 2014 (Audited)
Legacy Fund Investments $223.6 $227.8Direct / Co-investments
Income Investments 339.6 329.2Equity Investments 303.4 283.5
Total Direct / Co-investments 643.0 612.8Total Private Equity Fair Value 866.6 840.6Private Equity Investment Level 125% 121%Cash and Cash Equivalents 29.4 25.6Credit Facility (120.0) (90.0)ZDP Share Liability, including Forward Currency Contract (76.5) (73.7)Net Other Assets (Liabilities), including Minority Interest (4.0) (7.7)Net Asset Value 695.5 694.8Net Asset Value Including Cumulative Dividends 748.7 736.8Net Asset Value per Share $14.25 $14.24Cumulative Dividends per Share $1.09 $0.86Net Asset Value per Share Including Cumulative Dividends $15.34 $15.10
12
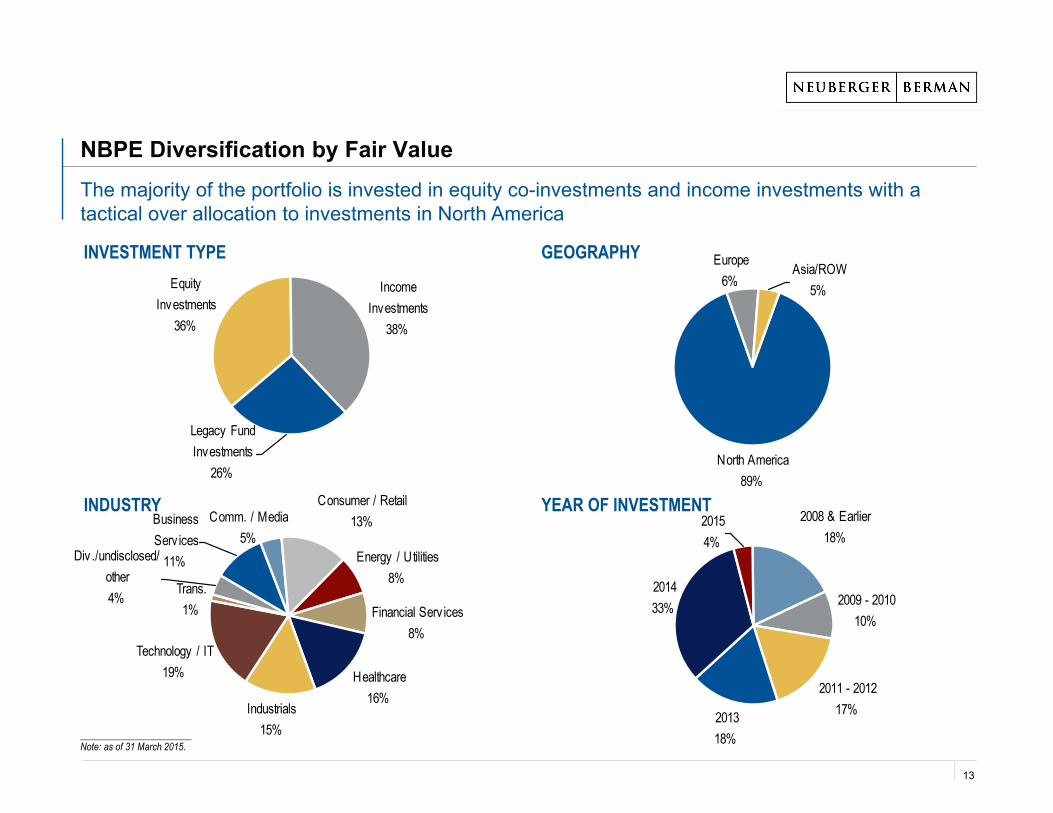
NBPE Diversification by Fair ValueThe majority of the portfolio is invested in equity co-investments and income investments with a tactical over allocation to investments in North America
_______________________Note: as of 31 March 2015.
2011 - 201217%2013
18%
2009 - 201010%
2008 & Earlier18%
201433%
20154%
INDUSTRY
Legacy Fund Investments
26%
Equity Investments
36%
Income Investments
38%
INVESTMENT TYPEAsia/ROW
5%
North America89%
Europe6%
GEOGRAPHY
Consumer / Retail13%
Healthcare16%
Industrials15%
Comm. / Media5%
Business Serv ices
11%
Technology / IT19%
Div./undisclosed/ other4% Trans.
1% Financial Serv ices8%
Energy / Utilities8%
YEAR OF INVESTMENT
13
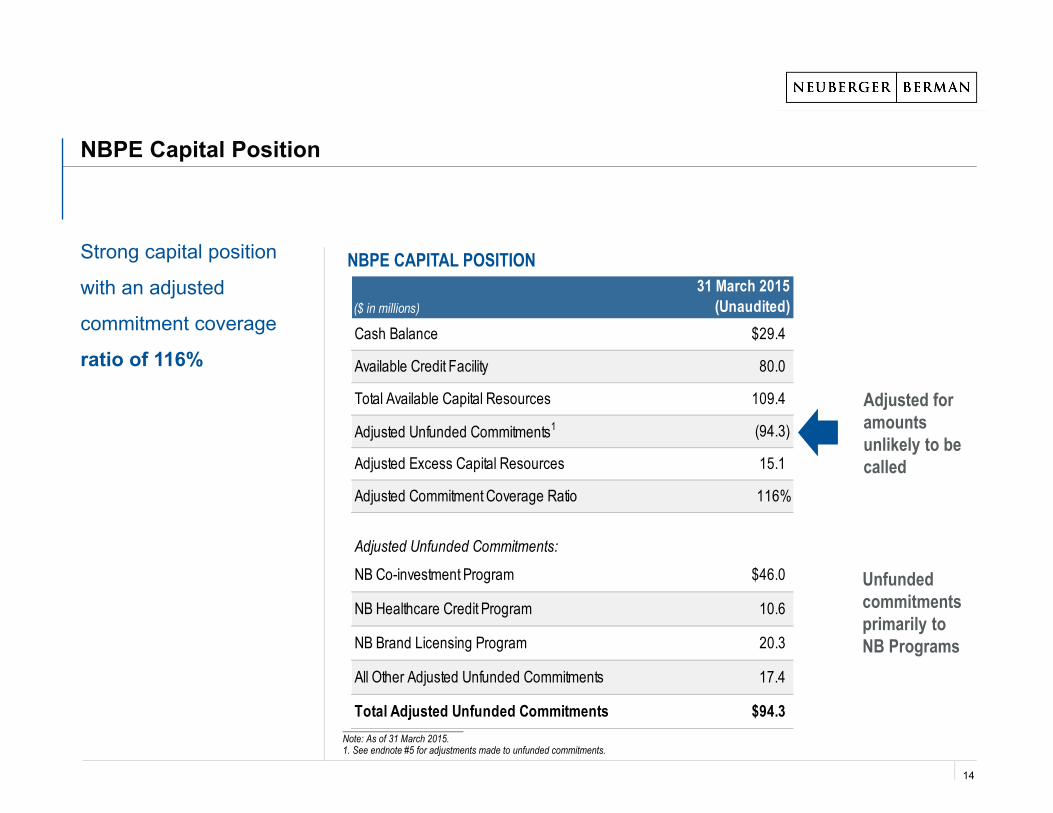
NBPE Capital Position
Strong capital position
with an adjusted
commitment coverage
ratio of 116%
_________________________Note: As of 31 March 2015. 1. See endnote #5 for adjustments made to unfunded commitments.
NBPE CAPITAL POSITION
Adjusted for amounts unlikely to be called
Unfunded commitments primarily to NB Programs
($ in millions)31 March 2015
(Unaudited)Cash Balance $29.4
Available Credit Facility 80.0
Total Available Capital Resources 109.4
Adjusted Unfunded Commitments1 (94.3)
Adjusted Excess Capital Resources 15.1
Adjusted Commitment Coverage Ratio 116%
Adjusted Unfunded Commitments:
NB Co-investment Program $46.0
NB Healthcare Credit Program 10.6
NB Brand Licensing Program 20.3
All Other Adjusted Unfunded Commitments 17.4
Total Adjusted Unfunded Commitments $94.3
14
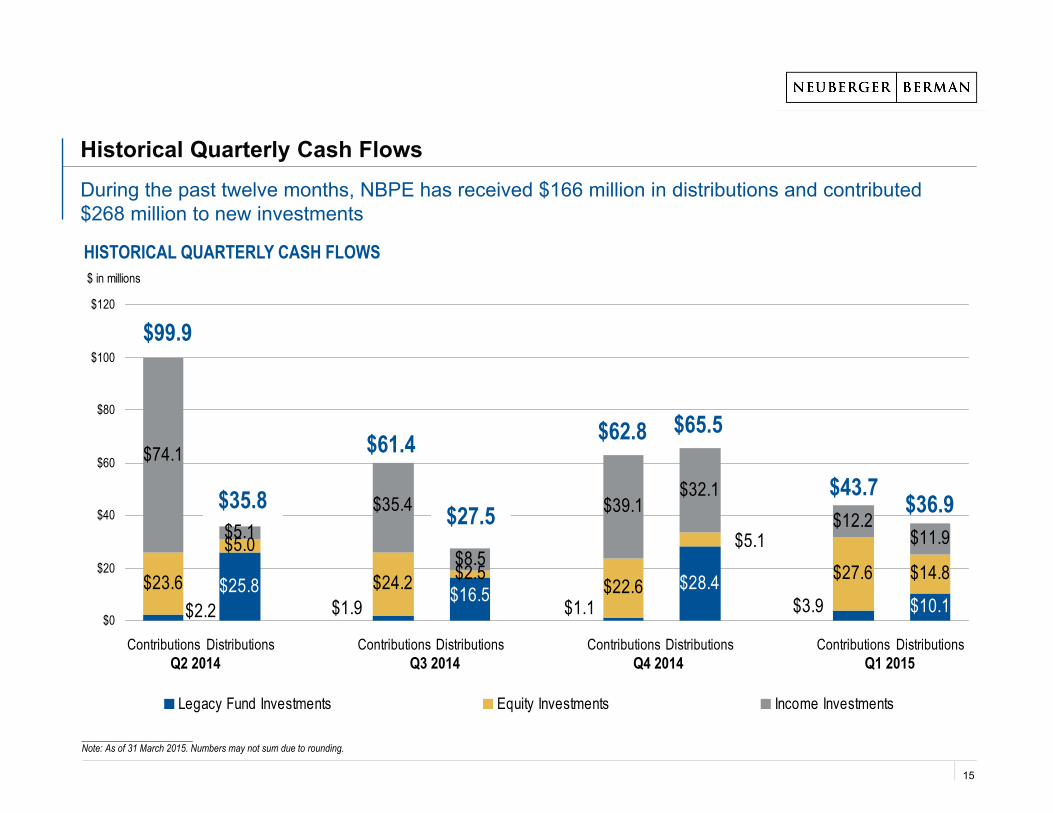
Historical Quarterly Cash FlowsDuring the past twelve months, NBPE has received $166 million in distributions and contributed $268 million to new investments
$23.6
$5.0
$24.2 $2.5$22.6
$27.6 $14.8
$74.1
$5.1$35.4
$8.5
$39.1$32.1
$12.2$11.9
$3.9$1.9 $1.1$16.5$2.2
$25.8 $28.4$10.1
$5.1
$0
$20
$40
$60
$80
$100
$120
Contributions Distributions Contributions Distributions Contributions Distributions Contributions Distributions
$ in millions
Legacy Fund Investments Equity Investments Income Investments
HISTORICAL QUARTERLY CASH FLOWS
_______________________Note: As of 31 March 2015. Numbers may not sum due to rounding.
$35.8 $27.5 $36.9
Q2 2014 Q3 2014 Q4 2014 Q1 2015
$99.9
$61.4
$43.7
$65.5$62.8
15
Realisation Events – Equity InvestmentsAttractive realisation events during 2014 and the first three months of 2015
___________________________Note: As of 31 March 2015. Numbers may not sum due to rounding. 1. The transactions above are illustrative realisation events during the year and do not represent all the realisation activity of NBPE.2. Data as of 31 December 2014. Uplift includes year to date realisations and represents proceeds received relative to the carrying value the quarter prior to the announcement of the transaction.
Company Description: Provider of breakdown assistance services in the UK
Partial RealisationJanuary 2015
Thesis: Strong brand, downside protection and opportunity to grow business in higher margin areas
Result: NBPE received $6.2mm in proceeds from a partial sale of RAC. Post transaction, the investment represents 0 – 1% of NBPE NAV
Partial RealisationFebruary 2015
Company Description: Distribution and technology solutions for the travel industry
Thesis: Market leader with significant margin expansion opportunity
Result: NBPE received $3.8mm in proceeds from the partial sale of public stock through a secondary offering. Post transaction, the investment represents 4 – 5% of NBPE NAV
NBPE has received $43.8mm of distributions from liquidity events during 2014 and 2015
Buyout realisations (equity investments and funds) with an average uplift of 22%2
REALISATION ACTIVITY: EQUITY INVESTMENTS
16
New Equity Investments1
Representative new investments during 2014 and the first three months of 2015
___________________________Note: As of 31 March 2015. Numbers may not sum due to rounding.1. The transactions above are illustrative new investments during the year and do not represent all the new investment activity of NBPE.
Company Description: Provider of end-to-end outsourced commerce, payments, and marketing solutions
February 2015(1 – 2% of NAV)
Thesis: Industry leading product with strong value proposition; highly recurring revenue base; strong cash flow characteristics
Company Description: Provider of outsourced route services to the laundry and air vending markets
Thesis: Market leader; fair valuation multiple; multiple avenues for growth; diversified customer base with broad geographic footprint; strong free cash flow profileMarch 2015
(0 – 1% of NAV)
NEW EQUITY INVESTMENTS
$90.8mm funded during 2014 to 18 new equity investments. During the first three months of 2015, NBPE funded $27.6mm to four new equity investments
New investments across industrials, technology, consumer products and healthcare industries
Sponsor: Siris Capital
Sponsor: Pamplona Capital
17
NBPE’s Investment in Marquee BrandsMarquee Brands seeks to identify, acquire and license intellectual property of consumer brands
OVERVIEW
FIRST BRAND ACQUISITION
Founded in 1936 and among the original Italian luxury brands
Produced fashion footwear for a global consumer base throughout its nearly 80 years
Rich heritage and classic style
Seeks to acquire the intellectual property of consumer brands, license the brand to product and retail partners and collect royalty payments in return
Targets brands with strong consumer awareness and seeks to grow the brand through geographic, channel and product category expansion
Relatively low acquisition multiples
Guaranteed minimum royalties provide downside protection and visibility
Strong free cash flow profile
NBPE committed $30mm to Marquee Brands
18
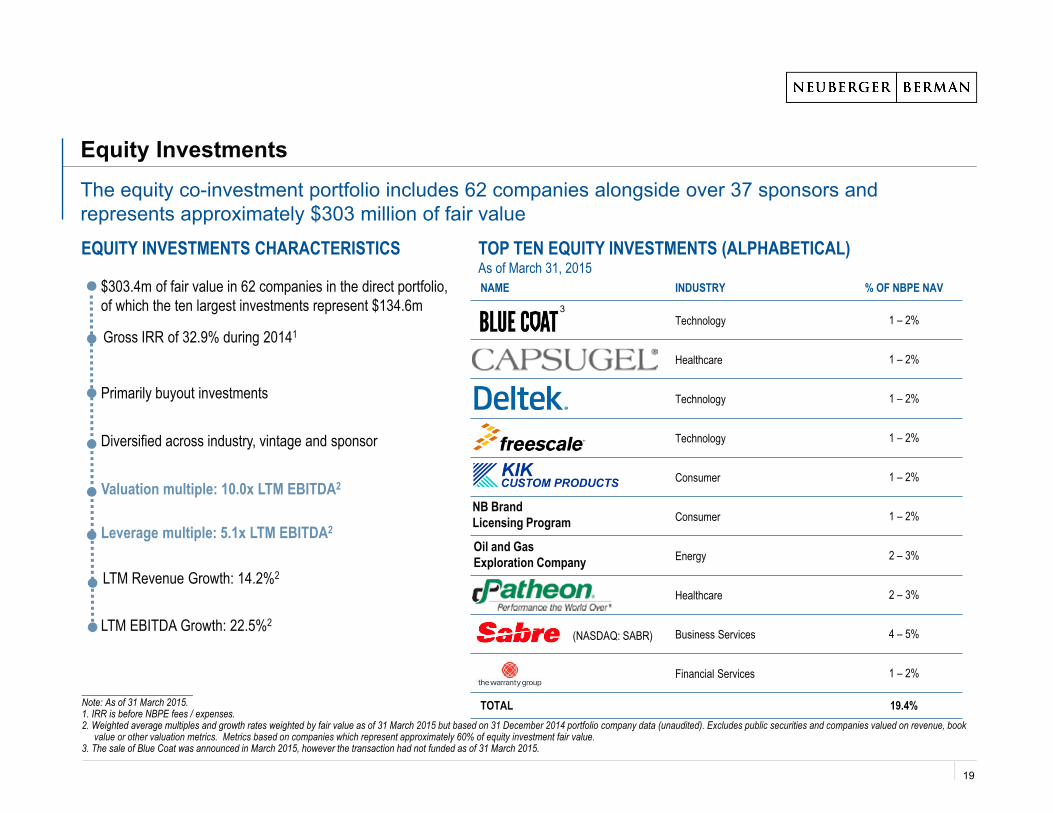
Equity InvestmentsThe equity co-investment portfolio includes 62 companies alongside over 37 sponsors and represents approximately $303 million of fair value
EQUITY INVESTMENTS CHARACTERISTICS TOP TEN EQUITY INVESTMENTS (ALPHABETICAL)As of March 31, 2015
Primarily buyout investments
$303.4m of fair value in 62 companies in the direct portfolio, of which the ten largest investments represent $134.6m
Diversified across industry, vintage and sponsor
Leverage multiple: 5.1x LTM EBITDA2
LTM EBITDA Growth: 22.5%2
_______________________Note: As of 31 March 2015. 1. IRR is before NBPE fees / expenses. 2. Weighted average multiples and growth rates weighted by fair value as of 31 March 2015 but based on 31 December 2014 portfolio company data (unaudited). Excludes public securities and companies valued on revenue, book
value or other valuation metrics. Metrics based on companies which represent approximately 60% of equity investment fair value. 3. The sale of Blue Coat was announced in March 2015, however the transaction had not funded as of 31 March 2015.
LTM Revenue Growth: 14.2%2
Valuation multiple: 10.0x LTM EBITDA2
Gross IRR of 32.9% during 20141
NAME INDUSTRY % OF NBPE NAV
Technology 1 – 2%
Healthcare 1 – 2%
Technology 1 – 2%
Technology 1 – 2%
Consumer 1 – 2%
Consumer 1 – 2%
Energy 2 – 3%
Healthcare 2 – 3%
Business Services 4 – 5%
Financial Services 1 – 2%
TOTAL 19.4%
Oil and Gas Exploration Company
(NASDAQ: SABR)
NB BrandLicensing Program
3
19
Realisation Events – Income Investments1
During 2014, NBPE received interest payments of $23.4mm
___________________________Note: As of 31 March 2015. Numbers may not sum due to rounding. 1. The transactions above are illustrative realisation events during the year and do not represent all the realisation activity of NBPE.2. Data as of 31 December 2014. Uplift includes year to date realisations and represents proceeds received relative to the carrying value the quarter prior to the announcement of the transaction.
Company Description: Develops specialty injectable and ophthalmic drugs
Full RealisationOctober 2014
Thesis: Large pipeline of products in development and high barriers to entry
Result: NBPE received $2.7mm in proceeds from the exit of term loan
NBPE received $81.0mm of distributions, including $23.4mm of interest and $55.6mm of principal and $2.0mm of proceeds attributable to equity securities during 2014. During the first three months of 2015, NBPE received $11.9mm of distributions
Debt realisations with an average uplift of 10%2
REALISATION ACTIVITY: INCOME INVESTMENTS
Specialty Drug Pharmaceuticals
Company
20
New Income Investments1
Representative new investments during 2014 and the first three months of 2015
___________________________Note: As of 31 March 2015. Numbers may not sum due to rounding.1. The transactions above are illustrative new investments events during the year and do not represent all the new investment activity of NBPE.
Company Description: Provider of software solutions and performance monitoring tools to IT organizations
December 2014 Thesis: Leading market share in a growing industry, high visibility revenue and strong cash flow characteristics
Company Description: Portfolio of small business loans
Thesis: Attractive credit profile of borrowers; geographic diversification; strong growth profileJanuary 2015
NEW INCOME INVESTMENTS
$186.0mm funded during 2014 to 24 new income investments. During January – March 2015, NBPE funded $12.2mm to five new income investments
19 new corporate private debt investments and ten new healthcare credit investments
Security: Small balance term business loans
Security: Second Lien (L+8.0% cash, 1% L Floor, 8% OID)
21
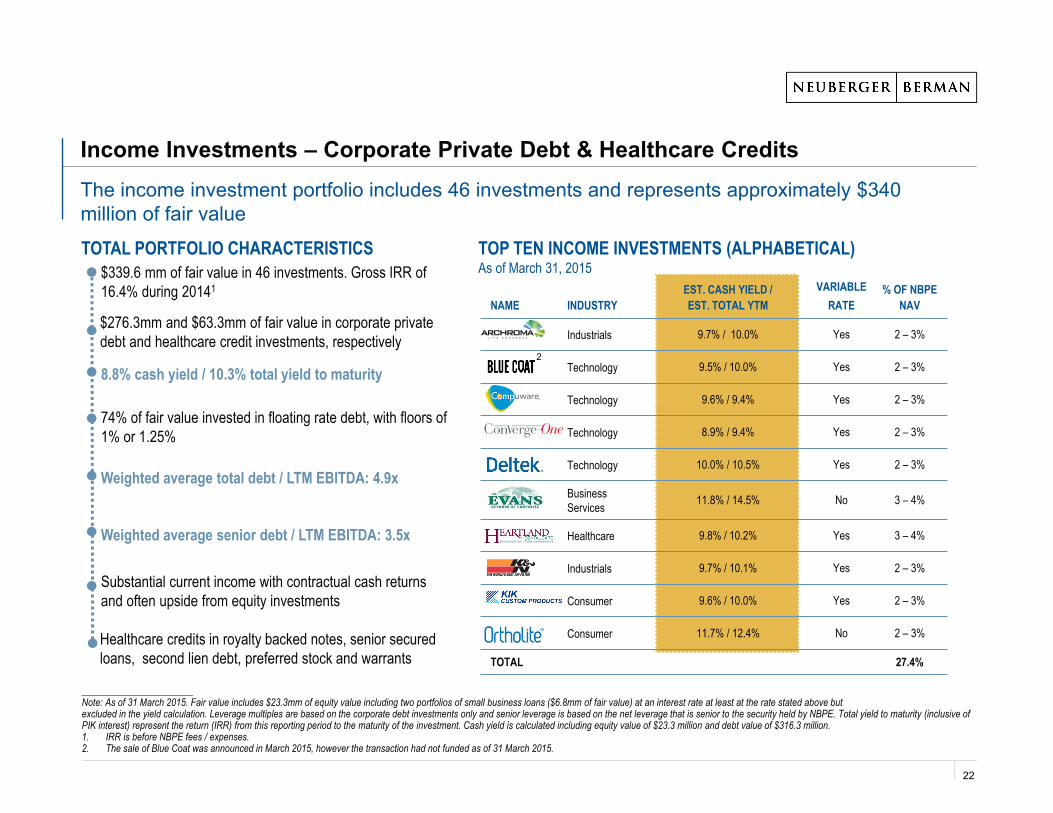
NAME INDUSTRYEST. CASH YIELD / EST. TOTAL YTM
VARIABLERATE
% OF NBPE NAV
Industrials 9.7% / 10.0% Yes 2 – 3%
Technology 9.5% / 10.0% Yes 2 – 3%
Technology 9.6% / 9.4% Yes 2 – 3%
Technology 8.9% / 9.4% Yes 2 – 3%
Technology 10.0% / 10.5% Yes 2 – 3%
Business Services 11.8% / 14.5% No 3 – 4%
Healthcare 9.8% / 10.2% Yes 3 – 4%
Industrials 9.7% / 10.1% Yes 2 – 3%
Consumer 9.6% / 10.0% Yes 2 – 3%
Consumer 11.7% / 12.4% No 2 – 3%
TOTAL 27.4%
Income Investments – Corporate Private Debt & Healthcare CreditsThe income investment portfolio includes 46 investments and represents approximately $340 million of fair value
TOTAL PORTFOLIO CHARACTERISTICS TOP TEN INCOME INVESTMENTS (ALPHABETICAL)As of March 31, 2015
8.8% cash yield / 10.3% total yield to maturity
$339.6 mm of fair value in 46 investments. Gross IRR of 16.4% during 20141
74% of fair value invested in floating rate debt, with floors of 1% or 1.25%
Weighted average senior debt / LTM EBITDA: 3.5x
Weighted average total debt / LTM EBITDA: 4.9x
Substantial current income with contractual cash returns and often upside from equity investments
_______________________Note: As of 31 March 2015. Fair value includes $23.3mm of equity value including two portfolios of small business loans ($6.8mm of fair value) at an interest rate at least at the rate stated above but excluded in the yield calculation. Leverage multiples are based on the corporate debt investments only and senior leverage is based on the net leverage that is senior to the security held by NBPE. Total yield to maturity (inclusive ofPIK interest) represent the return (IRR) from this reporting period to the maturity of the investment. Cash yield is calculated including equity value of $23.3 million and debt value of $316.3 million. 1. IRR is before NBPE fees / expenses. 2. The sale of Blue Coat was announced in March 2015, however the transaction had not funded as of 31 March 2015.
Healthcare credits in royalty backed notes, senior secured loans, second lien debt, preferred stock and warrants
$276.3mm and $63.3mm of fair value in corporate private debt and healthcare credit investments, respectively
2
22
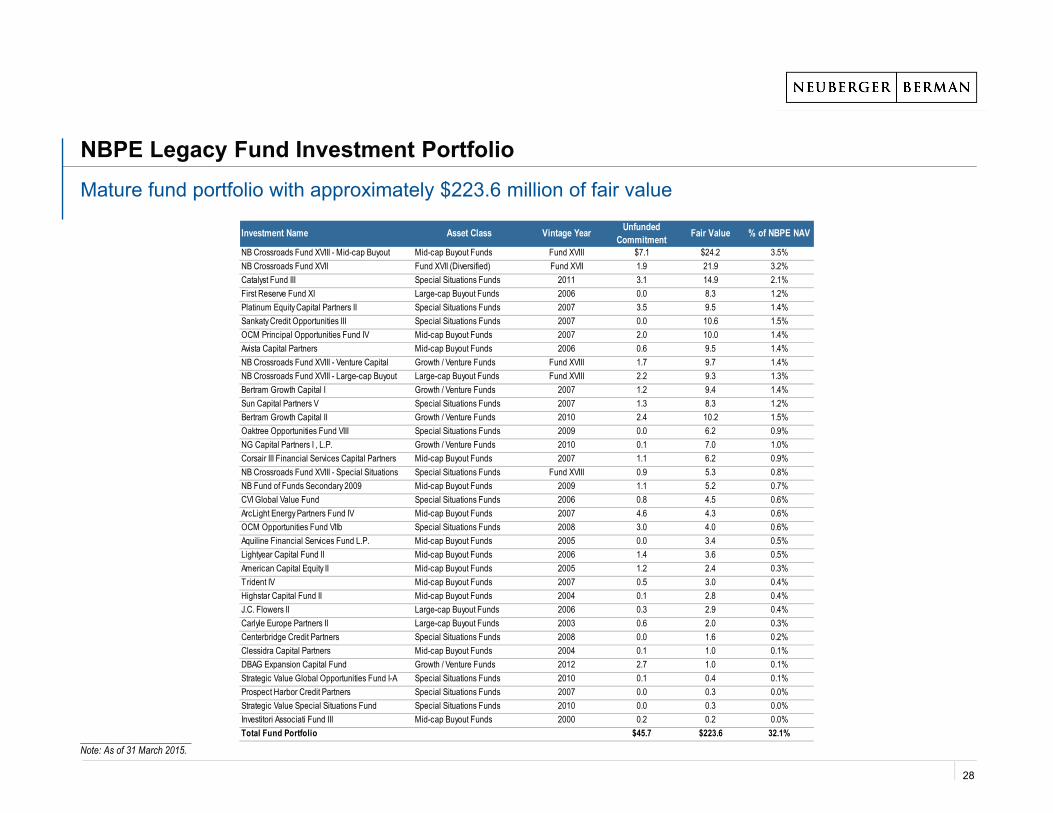
Legacy Fund InvestmentsNBPE’s legacy fund portfolio is comprised largely of mid-cap buyout and special situations funds. The portfolio is in realisation mode and represents approximately $224 million of fair value
___________________________Note: As of 31 March 2015. Numbers may not sum due to rounding.1. IRR is before fees / expenses, but net of underlying fees.
Gross IRR of 7.6% during 20141
Mature fund portfolio in realisation mode, largely invested in mid-cap buyout and special situations funds
$223.6mm of fair value, invested in 35 fund investments
$90.3mm of distributions in 2014; $10.1mm of distributions during the first three months of 2015
23
$0
$2
$4
$6
$8
$10
$12
$14
$16
Mar-14 Jun-14 Sep-14 Dec-14 Mar-15
Price
Share Price (Euronext) NAV per Share Including Dividends NAV per Share
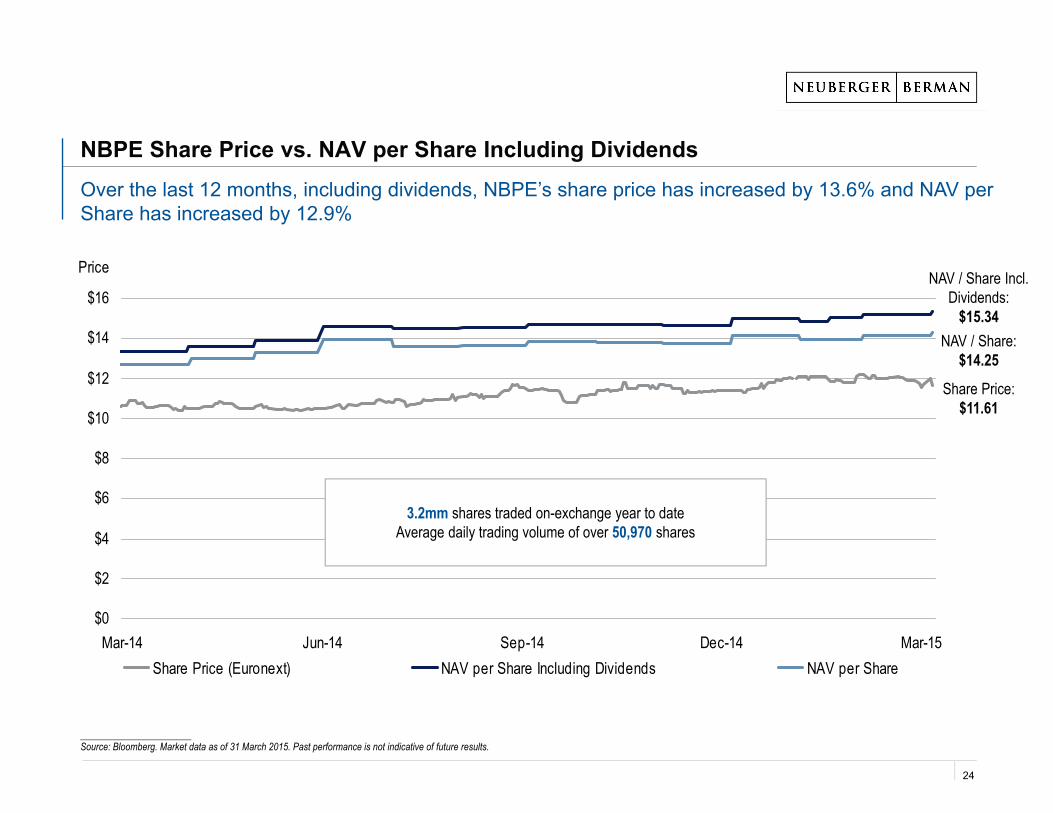
NBPE Share Price vs. NAV per Share Including Dividends
_______________________Source: Bloomberg. Market data as of 31 March 2015. Past performance is not indicative of future results.
Over the last 12 months, including dividends, NBPE’s share price has increased by 13.6% and NAV per Share has increased by 12.9%
3.2mm shares traded on-exchange year to dateAverage daily trading volume of over 50,970 shares
Share Price:$11.61
NAV / Share:$14.25
NAV / Share Incl. Dividends:
$15.34
24
Attractive Value PropositionWe believe that NBPE offers a compelling investment opportunity
Income through an attractive covered dividend, supported by the cash yield from our income portfolio
Capital appreciation and growth from equity and legacy fund investments
Opportunity for narrowing the discount
25

APPENDIX
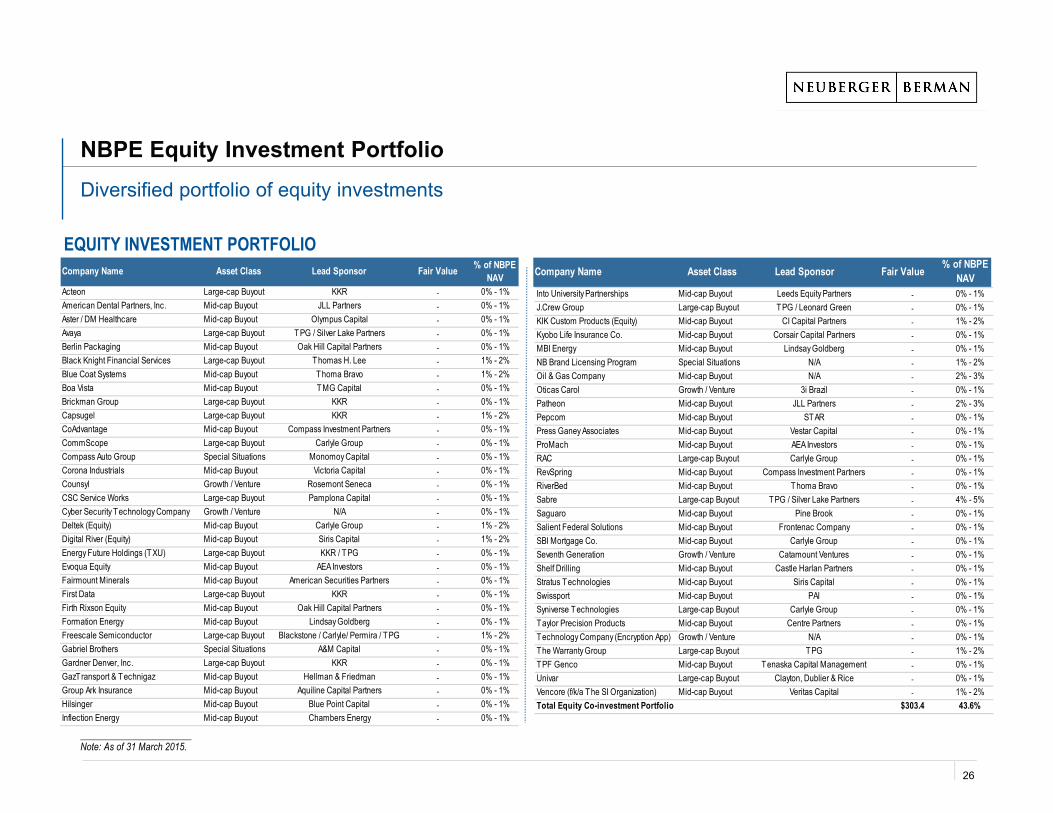
NBPE Equity Investment PortfolioDiversified portfolio of equity investments
_______________________Note: As of 31 March 2015.
Company Name Asset Class Lead Sponsor Fair Value % of NBPE NAV
EQUITY INVESTMENT PORTFOLIOCompany Name Asset Class Lead Sponsor Fair Value % of NBPE
NAVActeon Large-cap Buyout KKR - 0% - 1%American Dental Partners, Inc. Mid-cap Buyout JLL Partners - 0% - 1%Aster / DM Healthcare Mid-cap Buyout Olympus Capital - 0% - 1%Avaya Large-cap Buyout TPG / Silver Lake Partners - 0% - 1%Berlin Packaging Mid-cap Buyout Oak Hill Capital Partners - 0% - 1%Black Knight Financial Services Large-cap Buyout Thomas H. Lee - 1% - 2%Blue Coat Systems Mid-cap Buyout Thoma Bravo - 1% - 2%Boa Vista Mid-cap Buyout TMG Capital - 0% - 1%Brickman Group Large-cap Buyout KKR - 0% - 1%Capsugel Large-cap Buyout KKR - 1% - 2%CoAdvantage Mid-cap Buyout Compass Investment Partners - 0% - 1%CommScope Large-cap Buyout Carlyle Group - 0% - 1%Compass Auto Group Special Situations Monomoy Capital - 0% - 1%Corona Industrials Mid-cap Buyout Victoria Capital - 0% - 1%Counsyl Growth / Venture Rosemont Seneca - 0% - 1%CSC Service Works Large-cap Buyout Pamplona Capital - 0% - 1%Cyber Security Technology Company Growth / Venture N/A - 0% - 1%Deltek (Equity) Mid-cap Buyout Carlyle Group - 1% - 2%Digital River (Equity) Mid-cap Buyout Siris Capital - 1% - 2%Energy Future Holdings (TXU) Large-cap Buyout KKR / TPG - 0% - 1%Evoqua Equity Mid-cap Buyout AEA Investors - 0% - 1%Fairmount Minerals Mid-cap Buyout American Securities Partners - 0% - 1%First Data Large-cap Buyout KKR - 0% - 1%Firth Rixson Equity Mid-cap Buyout Oak Hill Capital Partners - 0% - 1%Formation Energy Mid-cap Buyout Lindsay Goldberg - 0% - 1%Freescale Semiconductor Large-cap Buyout Blackstone / Carlyle/ Permira / TPG - 1% - 2%Gabriel Brothers Special Situations A&M Capital - 0% - 1%Gardner Denver, Inc. Large-cap Buyout KKR - 0% - 1%GazTransport & Technigaz Mid-cap Buyout Hellman & Friedman - 0% - 1%Group Ark Insurance Mid-cap Buyout Aquiline Capital Partners - 0% - 1%Hilsinger Mid-cap Buyout Blue Point Capital - 0% - 1%Inflection Energy Mid-cap Buyout Chambers Energy - 0% - 1%
Into University Partnerships Mid-cap Buyout Leeds Equity Partners - 0% - 1%J.Crew Group Large-cap Buyout TPG / Leonard Green - 0% - 1%KIK Custom Products (Equity) Mid-cap Buyout CI Capital Partners - 1% - 2%Kyobo Life Insurance Co. Mid-cap Buyout Corsair Capital Partners - 0% - 1%MBI Energy Mid-cap Buyout Lindsay Goldberg - 0% - 1%NB Brand Licensing Program Special Situations N/A - 1% - 2%Oil & Gas Company Mid-cap Buyout N/A - 2% - 3%Oticas Carol Growth / Venture 3i Brazil - 0% - 1%Patheon Mid-cap Buyout JLL Partners - 2% - 3%Pepcom Mid-cap Buyout STAR - 0% - 1%Press Ganey Associates Mid-cap Buyout Vestar Capital - 0% - 1%ProMach Mid-cap Buyout AEA Investors - 0% - 1%RAC Large-cap Buyout Carlyle Group - 0% - 1%RevSpring Mid-cap Buyout Compass Investment Partners - 0% - 1%RiverBed Mid-cap Buyout Thoma Bravo - 0% - 1%Sabre Large-cap Buyout TPG / Silver Lake Partners - 4% - 5%Saguaro Mid-cap Buyout Pine Brook - 0% - 1%Salient Federal Solutions Mid-cap Buyout Frontenac Company - 0% - 1%SBI Mortgage Co. Mid-cap Buyout Carlyle Group - 0% - 1%Seventh Generation Growth / Venture Catamount Ventures - 0% - 1%Shelf Drilling Mid-cap Buyout Castle Harlan Partners - 0% - 1%Stratus Technologies Mid-cap Buyout Siris Capital - 0% - 1%Swissport Mid-cap Buyout PAI - 0% - 1%Syniverse Technologies Large-cap Buyout Carlyle Group - 0% - 1%Taylor Precision Products Mid-cap Buyout Centre Partners - 0% - 1%Technology Company (Encryption App) Growth / Venture N/A - 0% - 1%The Warranty Group Large-cap Buyout TPG - 1% - 2%TPF Genco Mid-cap Buyout Tenaska Capital Management - 0% - 1%Univar Large-cap Buyout Clayton, Dublier & Rice - 0% - 1%Vencore (f/k/a The SI Organization) Mid-cap Buyout Veritas Capital - 1% - 2%Total Equity Co-investment Portfolio $303.4 43.6%
26
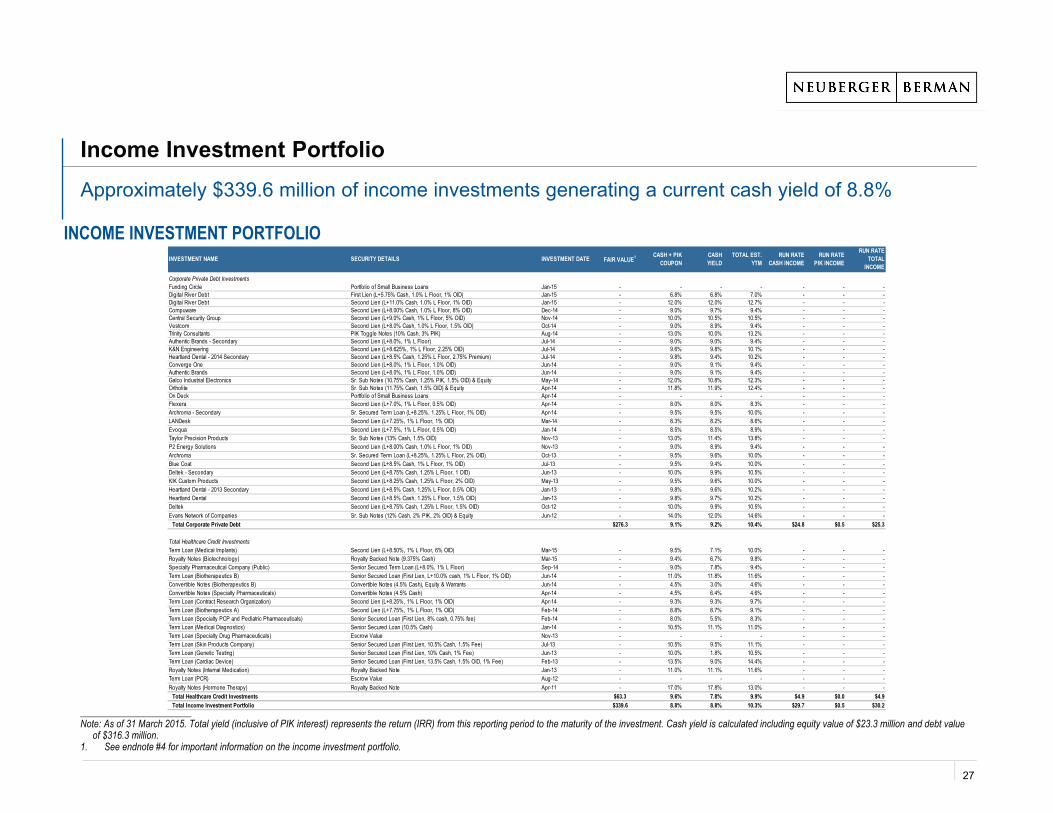
Income Investment PortfolioApproximately $339.6 million of income investments generating a current cash yield of 8.8%
_______________________Note: As of 31 March 2015. Total yield (inclusive of PIK interest) represents the return (IRR) from this reporting period to the maturity of the investment. Cash yield is calculated including equity value of $23.3 million and debt value
of $316.3 million.1. See endnote #4 for important information on the income investment portfolio.
INCOME INVESTMENT PORTFOLIOINVESTMENT NAME SECURITY DETAILS INVESTMENT DATE FAIR VALUE1 CASH + PIK
COUPONCASH YIELD
TOTAL EST. YTM
RUN RATE CASH INCOME
RUN RATE PIK INCOME
RUN RATETOTAL
INCOME
Corporate Private Debt InvestmentsFunding Circle Portfolio of Small Business Loans Jan-15 - - - - - - -Digital River Debt First Lien (L+5.75% Cash, 1.0% L Floor, 1% OID) Jan-15 - 6.8% 6.8% 7.0% - - -Digital River Debt Second Lien (L+11.0% Cash, 1.0% L Floor, 1% OID) Jan-15 - 12.0% 12.0% 12.7% - - -Compuware Second Lien (L+8.00% Cash, 1.0% L Floor, 8% OID) Dec-14 - 9.0% 9.7% 9.4% - - -Central Security Group Second Lien (L+9.0% Cash, 1% L Floor, 5% OID) Nov-14 - 10.0% 10.5% 10.5% - - -Vestcom Second Lien (L+8.0% Cash, 1.0% L Floor, 1.5% OID) Oct-14 - 9.0% 8.9% 9.4% - - -Trinity Consultants PIK Toggle Notes (10% Cash, 3% PIK) Aug-14 - 13.0% 10.0% 13.2% - - -Authentic Brands - Secondary Second Lien (L+8.0%, 1% L Floor) Jul-14 - 9.0% 9.0% 9.4% - - -K&N Engineering Second Lien (L+8.625%, 1% L Floor, 2.25% OID) Jul-14 - 9.6% 9.8% 10.1% - - -Heartland Dental - 2014 Secondary Second Lien (L+8.5% Cash, 1.25% L Floor, 2.75% Premium) Jul-14 - 9.8% 9.4% 10.2% - - -Converge One Second Lien (L+8.0%, 1% L Floor, 1.0% OID) Jun-14 - 9.0% 9.1% 9.4% - - -Authentic Brands Second Lien (L+8.0%, 1% L Floor, 1.0% OID) Jun-14 - 9.0% 9.1% 9.4% - - -Galco Industrial Electronics Sr. Sub Notes (10.75% Cash, 1.25% PIK, 1.5% OID) & Equity May-14 - 12.0% 10.8% 12.3% - - -Ortholite Sr. Sub Notes (11.75% Cash, 1.5% OID) & Equity Apr-14 - 11.8% 11.9% 12.4% - - -On Deck Portfolio of Small Business Loans Apr-14 - - - - - - -Flexera Second Lien (L+7.0%, 1% L Floor, 0.5% OID) Apr-14 - 8.0% 8.0% 8.3% - - -Archroma - Secondary Sr. Secured Term Loan (L+8.25%, 1.25% L Floor, 1% OID) Apr-14 - 9.5% 9.5% 10.0% - - -LANDesk Second Lien (L+7.25%, 1% L Floor, 1% OID) Mar-14 - 8.3% 8.2% 8.6% - - -Evoqua Second Lien (L+7.5%, 1% L Floor, 0.5% OID) Jan-14 - 8.5% 8.5% 8.9% - - -Taylor Precision Products Sr. Sub Notes (13% Cash, 1.5% OID) Nov-13 - 13.0% 11.4% 13.8% - - -P2 Energy Solutions Second Lien (L+8.00% Cash, 1.0% L Floor, 1% OID) Nov-13 - 9.0% 8.9% 9.4% - - -Archroma Sr. Secured Term Loan (L+8.25%, 1.25% L Floor, 2% OID) Oct-13 - 9.5% 9.6% 10.0% - - -Blue Coat Second Lien (L+8.5% Cash, 1% L Floor, 1% OID) Jul-13 - 9.5% 9.4% 10.0% - - -Deltek - Secondary Second Lien (L+8.75% Cash, 1.25% L Floor, 1 OID) Jun-13 - 10.0% 9.9% 10.5% - - -KIK Custom Products Second Lien (L+8.25% Cash, 1.25% L Floor, 2% OID) May-13 - 9.5% 9.6% 10.0% - - -Heartland Dental - 2013 Secondary Second Lien (L+8.5% Cash, 1.25% L Floor, 0.5% OID) Jan-13 - 9.8% 9.6% 10.2% - - -Heartland Dental Second Lien (L+8.5% Cash, 1.25% L Floor, 1.5% OID) Jan-13 - 9.8% 9.7% 10.2% - - -Deltek Second Lien (L+8.75% Cash, 1.25% L Floor, 1.5% OID) Oct-12 - 10.0% 9.9% 10.5% - - -Evans Network of Companies Sr. Sub Notes (12% Cash, 2% PIK, 2% OID) & Equity Jun-12 - 14.0% 12.0% 14.6% - - -
Total Corporate Private Debt $276.3 9.1% 9.2% 10.4% $24.8 $0.5 $25.3
Total Healthcare Credit InvestmentsTerm Loan (Medical Implants) Second Lien (L+8.50%, 1% L Floor, 6% OID) Mar-15 - 9.5% 7.1% 10.0% - - -Royalty Notes (Biotechnology) Royalty Backed Note (9.375% Cash) Mar-15 - 9.4% 6.7% 9.8% - - -Specialty Pharmaceutical Company (Public) Senior Secured Term Loan (L+8.0%, 1% L Floor) Sep-14 - 9.0% 7.8% 9.4% - - -Term Loan (Biotherapeutics B) Senior Secured Loan (First Lien, L+10.0% cash, 1% L Floor, 1% OID) Jun-14 - 11.0% 11.8% 11.6% - - -Convertible Notes (Biotherapeutics B) Convertible Notes (4.5% Cash), Equity & Warrants Jun-14 - 4.5% 3.0% 4.6% - - -Convertible Notes (Specialty Pharmaceuticals) Convertible Notes (4.5% Cash) Apr-14 - 4.5% 6.4% 4.6% - - -Term Loan (Contract Research Organization) Second Lien (L+8.25%, 1% L Floor, 1% OID) Apr-14 - 9.3% 9.3% 9.7% - - -Term Loan (Biotherapeutics A) Second Lien (L+7.75%, 1% L Floor, 1% OID) Feb-14 - 8.8% 8.7% 9.1% - - -Term Loan (Specialty PCP and Pediatric Pharmaceuticals) Senior Secured Loan (First Lien, 8% cash, 0.75% fee) Feb-14 - 8.0% 5.5% 8.3% - - -Term Loan (Medical Diagnostics) Senior Secured Loan (10.5% Cash) Jan-14 - 10.5% 11.1% 11.0% - - -Term Loan (Specialty Drug Pharmaceuticals) Escrow Value Nov-13 - - - - - - -Term Loan (Skin Products Company) Senior Secured Loan (First Lien, 10.5% Cash, 1.5% Fee) Jul-13 - 10.5% 9.5% 11.1% - - -Term Loan (Genetic Testing) Senior Secured Loan (First Lien, 10% Cash, 1% Fee) Jun-13 - 10.0% 1.8% 10.5% - - -Term Loan (Cardiac Device) Senior Secured Loan (First Lien, 13.5% Cash, 1.5% OID, 1% Fee) Feb-13 - 13.5% 9.0% 14.4% - - -Royalty Notes (Internal Medication) Royalty Backed Note Jan-13 - 11.0% 11.1% 11.6% - - -Term Loan (PCR) Escrow Value Aug-12 - - - - - - -Royalty Notes (Hormone Therapy) Royalty Backed Note Apr-11 - 17.0% 17.8% 13.0% - - -
Total Healthcare Credit Investments $63.3 9.6% 7.8% 9.9% $4.9 $0.0 $4.9Total Income Investment Portfolio $339.6 8.8% 8.8% 10.3% $29.7 $0.5 $30.2
27
NBPE Legacy Fund Investment Portfolio
_______________________Note: As of 31 March 2015.
Mature fund portfolio with approximately $223.6 million of fair value
Investment Name Asset Class Vintage Year Unfunded Commitment Fair Value % of NBPE NAV
NB Crossroads Fund XVIII - Mid-cap Buyout Mid-cap Buyout Funds Fund XVIII $7.1 $24.2 3.5%NB Crossroads Fund XVII Fund XVII (Diversified) Fund XVII 1.9 21.9 3.2%Catalyst Fund III Special Situations Funds 2011 3.1 14.9 2.1%First Reserve Fund XI Large-cap Buyout Funds 2006 0.0 8.3 1.2%Platinum Equity Capital Partners II Special Situations Funds 2007 3.5 9.5 1.4%Sankaty Credit Opportunities III Special Situations Funds 2007 0.0 10.6 1.5%OCM Principal Opportunities Fund IV Mid-cap Buyout Funds 2007 2.0 10.0 1.4%Avista Capital Partners Mid-cap Buyout Funds 2006 0.6 9.5 1.4%NB Crossroads Fund XVIII - Venture Capital Growth / Venture Funds Fund XVIII 1.7 9.7 1.4%NB Crossroads Fund XVIII - Large-cap Buyout Large-cap Buyout Funds Fund XVIII 2.2 9.3 1.3%Bertram Growth Capital I Growth / Venture Funds 2007 1.2 9.4 1.4%Sun Capital Partners V Special Situations Funds 2007 1.3 8.3 1.2%Bertram Growth Capital II Growth / Venture Funds 2010 2.4 10.2 1.5%Oaktree Opportunities Fund VIII Special Situations Funds 2009 0.0 6.2 0.9%NG Capital Partners I , L.P. Growth / Venture Funds 2010 0.1 7.0 1.0%Corsair III Financial Services Capital Partners Mid-cap Buyout Funds 2007 1.1 6.2 0.9%NB Crossroads Fund XVIII - Special Situations Special Situations Funds Fund XVIII 0.9 5.3 0.8%NB Fund of Funds Secondary 2009 Mid-cap Buyout Funds 2009 1.1 5.2 0.7%CVI Global Value Fund Special Situations Funds 2006 0.8 4.5 0.6%ArcLight Energy Partners Fund IV Mid-cap Buyout Funds 2007 4.6 4.3 0.6%OCM Opportunities Fund VIIb Special Situations Funds 2008 3.0 4.0 0.6%Aquiline Financial Services Fund L.P. Mid-cap Buyout Funds 2005 0.0 3.4 0.5%Lightyear Capital Fund II Mid-cap Buyout Funds 2006 1.4 3.6 0.5%American Capital Equity II Mid-cap Buyout Funds 2005 1.2 2.4 0.3%Trident IV Mid-cap Buyout Funds 2007 0.5 3.0 0.4%Highstar Capital Fund II Mid-cap Buyout Funds 2004 0.1 2.8 0.4%J.C. Flowers II Large-cap Buyout Funds 2006 0.3 2.9 0.4%Carlyle Europe Partners II Large-cap Buyout Funds 2003 0.6 2.0 0.3%Centerbridge Credit Partners Special Situations Funds 2008 0.0 1.6 0.2%Clessidra Capital Partners Mid-cap Buyout Funds 2004 0.1 1.0 0.1%DBAG Expansion Capital Fund Growth / Venture Funds 2012 2.7 1.0 0.1%Strategic Value Global Opportunities Fund I-A Special Situations Funds 2010 0.1 0.4 0.1%Prospect Harbor Credit Partners Special Situations Funds 2007 0.0 0.3 0.0%Strategic Value Special Situations Fund Special Situations Funds 2010 0.0 0.3 0.0%Investitori Associati Fund III Mid-cap Buyout Funds 2000 0.2 0.2 0.0%Total Fund Portfolio $45.7 $223.6 32.1%
28
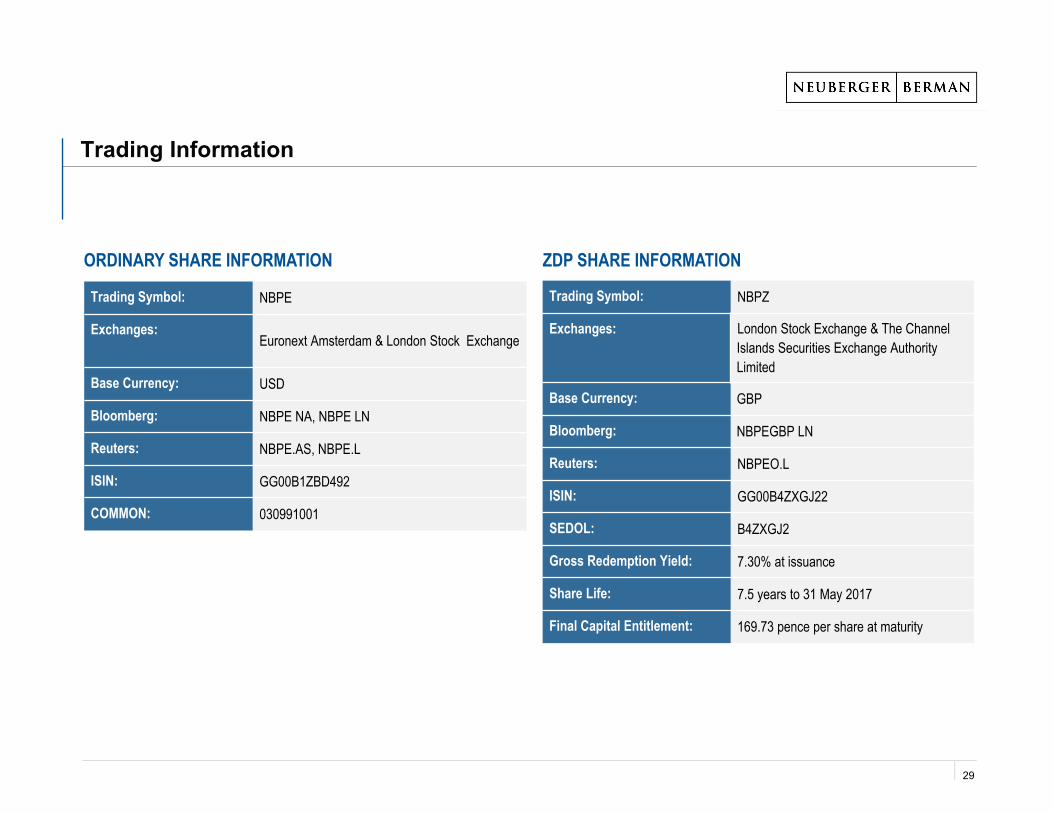
Trading Information
Trading Symbol: NBPE
Exchanges:Euronext Amsterdam & London Stock Exchange
Base Currency: USD
Bloomberg: NBPE NA, NBPE LN
Reuters: NBPE.AS, NBPE.L
ISIN: GG00B1ZBD492
COMMON: 030991001
Trading Symbol: NBPZ
Exchanges: London Stock Exchange & The Channel Islands Securities Exchange Authority Limited
Base Currency: GBP
Bloomberg: NBPEGBP LN
Reuters: NBPEO.L
ISIN: GG00B4ZXGJ22
SEDOL: B4ZXGJ2
Gross Redemption Yield: 7.30% at issuance
Share Life: 7.5 years to 31 May 2017
Final Capital Entitlement: 169.73 pence per share at maturity
ORDINARY SHARE INFORMATION ZDP SHARE INFORMATION
29
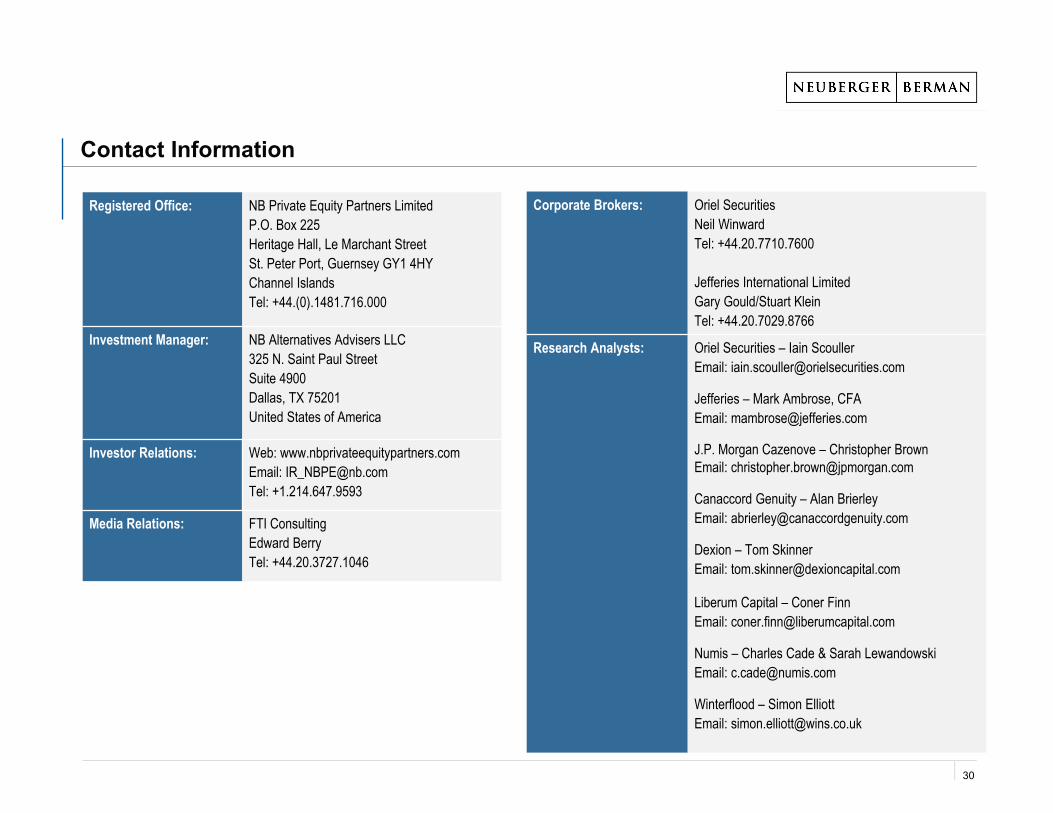
Contact Information
Registered Office: NB Private Equity Partners LimitedP.O. Box 225Heritage Hall, Le Marchant StreetSt. Peter Port, Guernsey GY1 4HYChannel IslandsTel: +44.(0).1481.716.000
Investment Manager: NB Alternatives Advisers LLC325 N. Saint Paul StreetSuite 4900Dallas, TX 75201United States of America
Investor Relations: Web: www.nbprivateequitypartners.comEmail: [email protected]: +1.214.647.9593
Media Relations: FTI ConsultingEdward BerryTel: +44.20.3727.1046
Corporate Brokers: Oriel SecuritiesNeil WinwardTel: +44.20.7710.7600
Jefferies International LimitedGary Gould/Stuart KleinTel: +44.20.7029.8766
Research Analysts: Oriel Securities – Iain ScoullerEmail: [email protected]
Jefferies – Mark Ambrose, CFAEmail: [email protected]
J.P. Morgan Cazenove – Christopher BrownEmail: [email protected]
Canaccord Genuity – Alan BrierleyEmail: [email protected]
Dexion – Tom Skinner Email: [email protected]
Liberum Capital – Coner FinnEmail: [email protected]
Numis – Charles Cade & Sarah LewandowskiEmail: [email protected]
Winterflood – Simon ElliottEmail: [email protected]
30
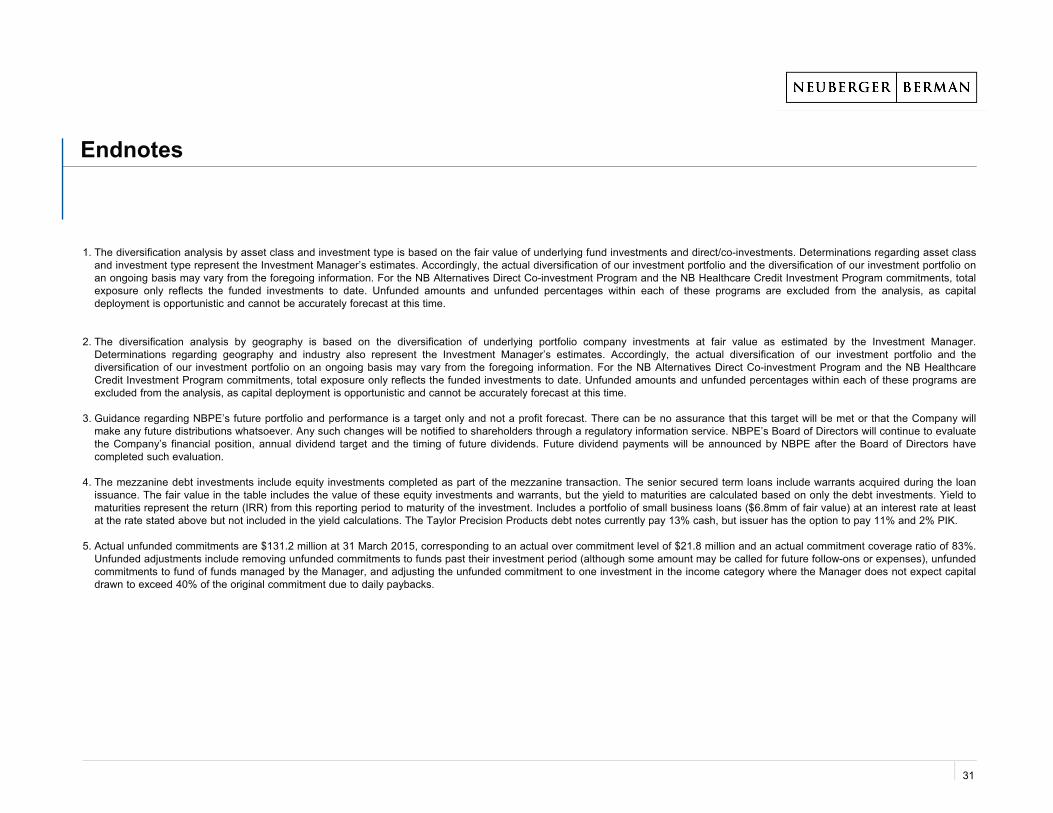
Endnotes
1. The diversification analysis by asset class and investment type is based on the fair value of underlying fund investments and direct/co-investments. Determinations regarding asset classand investment type represent the Investment Manager’s estimates. Accordingly, the actual diversification of our investment portfolio and the diversification of our investment portfolio onan ongoing basis may vary from the foregoing information. For the NB Alternatives Direct Co-investment Program and the NB Healthcare Credit Investment Program commitments, totalexposure only reflects the funded investments to date. Unfunded amounts and unfunded percentages within each of these programs are excluded from the analysis, as capitaldeployment is opportunistic and cannot be accurately forecast at this time.
2. The diversification analysis by geography is based on the diversification of underlying portfolio company investments at fair value as estimated by the Investment Manager.Determinations regarding geography and industry also represent the Investment Manager’s estimates. Accordingly, the actual diversification of our investment portfolio and thediversification of our investment portfolio on an ongoing basis may vary from the foregoing information. For the NB Alternatives Direct Co-investment Program and the NB HealthcareCredit Investment Program commitments, total exposure only reflects the funded investments to date. Unfunded amounts and unfunded percentages within each of these programs areexcluded from the analysis, as capital deployment is opportunistic and cannot be accurately forecast at this time.
3. Guidance regarding NBPE’s future portfolio and performance is a target only and not a profit forecast. There can be no assurance that this target will be met or that the Company willmake any future distributions whatsoever. Any such changes will be notified to shareholders through a regulatory information service. NBPE’s Board of Directors will continue to evaluatethe Company’s financial position, annual dividend target and the timing of future dividends. Future dividend payments will be announced by NBPE after the Board of Directors havecompleted such evaluation.
4. The mezzanine debt investments include equity investments completed as part of the mezzanine transaction. The senior secured term loans include warrants acquired during the loanissuance. The fair value in the table includes the value of these equity investments and warrants, but the yield to maturities are calculated based on only the debt investments. Yield tomaturities represent the return (IRR) from this reporting period to maturity of the investment. Includes a portfolio of small business loans ($6.8mm of fair value) at an interest rate at leastat the rate stated above but not included in the yield calculations. The Taylor Precision Products debt notes currently pay 13% cash, but issuer has the option to pay 11% and 2% PIK.
5. Actual unfunded commitments are $131.2 million at 31 March 2015, corresponding to an actual over commitment level of $21.8 million and an actual commitment coverage ratio of 83%.Unfunded adjustments include removing unfunded commitments to funds past their investment period (although some amount may be called for future follow-ons or expenses), unfundedcommitments to fund of funds managed by the Manager, and adjusting the unfunded commitment to one investment in the income category where the Manager does not expect capitaldrawn to exceed 40% of the original commitment due to daily paybacks.
31
Legal Disclaimer
THE CONTENTS OF THIS DOCUMENT AND THE PRESENTATION ARE STRICTLY CONFIDENTIAL AND MAY NOT BE COPIED, DISTRIBUTED, PUBLISHED OR REPRODUCED INWHOLE OR IN PART, OR DISCLOSED OR DISTRIBUTED BY RECIPIENTS TO ANY OTHER PERSON. ANY RECIPIENT OF THIS DOCUMENT AGREES TO KEEP PERMANENTLYCONFIDENTIAL ALL INFORMATION HEREIN NOT ALREADY IN THE PUBLIC DOMAIN.This document and the presentation are not for release, publication or distribution (directly or indirectly) in or into the United States, Canada, Australia or Japan or to any "US person" asdefined in Regulation S under the United States Securities Act of 1933, as amended (the "Securities Act") or into any other jurisdiction where applicable laws prohibit its release,distribution or publication. It does not constitute an offer of securities for sale anywhere in the world, including in or into the United States, Canada, Australia or Japan. No recipient maydistribute, or make available, this document or the presentation (directly or indirectly) to any other person. Recipients of this document and the presentation should inform themselves aboutand observe any applicable legal requirements in their jurisdictions. In particular, the distribution of this document and the presentation may in certain jurisdictions be restricted by law.Accordingly, recipients represent that they are able to receive this document and relating presentation without contravention of any applicable legal or regulatory restrictions in thejurisdiction in which they reside or conduct business.This document and the presentation have been prepared by NB Private Equity Partners Limited ("NBPE") and NB Alternatives Advisers LLC (the "Investment Manager"). No member ofthe Neuberger Berman Group nor any of their respective directors, officers, employees, advisors, representatives, or other agents makes or has been authorised to make any representationor warranties (express or implied) in relation to NBPE or as to the truth, accuracy or completeness of this document or the presentation, or any other written or oral statement provided. Inparticular, no representation or warranty is given as to the achievement or reasonableness of, and no reliance should be placed on any projections, targets, estimates or forecasts containedin this document or the presentation and nothing in this document or the presentation is or should be relied on as a promise or representation as to the future. The name "NeubergerBerman" is used interchangeably throughout these materials for a number of entities that are part of, or are associated with, the Neuberger Berman Group and when used in this noticeincludes all such entities.This document does not constitute a prospectus or offering memorandum or an offer in respect of any securities and is not intended to provide the basis for any decision inrespect of NBPE or other evaluation of any securities of NBPE or any other entity and should not be considered as a recommendation that any investor should subscribe for orpurchase any such securities. Neither the issue of this document nor the presentation nor any part of their contents constitutes an offer to sell or invitation to purchase anysecurities of NBPE or any other entity or any persons holding securities of NBPE and no information set out in this document or the presentation or referred to in other writtenor oral information is intended to form the basis of any contract of sale, investment decision or any decision to purchase any securities referred to in it.The information contained in this document is given at the date of its publication (unless otherwise marked) and is subject to updating, revision and amendment. No reliance may be placedfor any purpose whatsoever on the information of opinions contained in this document or on its completeness, accuracy or fairness. The contents of this document have not been approvedby any competent regulatory or supervisory authority.This document, any presentation made in conjunction with this document and any accompanying materials (the "Information Materials") are made available for information purposes only.The Information Materials, which are not a prospectus or listing particulars or an admission document, do not contain any representations, do not constitute or form part of any offer orinvitation to sell or transfer, or to underwrite, subscribe for or acquire, any shares or other securities, and do not constitute or form any part of any solicitation of any such offer or invitation,nor shall they are or any part of them or the fact of their distribution form the basis of or be relied upon in connection with any contract therefore, and do not constitute a recommendationregarding the securities of NBPE.Neither NBPE nor Neuberger Berman gives any undertaking to provide the recipient with access to any additional information, or to update this document, the presentation or any additionalinformation, or to correct any inaccuracies in it which may become apparent and the distribution of this document and the presentation shall not be deemed to be any form of commitment onthe part of NBPE, the Investment Manager or Neuberger Berman to proceed with any transaction.
32

Legal Disclaimer
THE PROMOTION OF NBPE AND THE DISTRIBUTION OF THIS DOCUMENT AND THE PRESENTATION IN THE UNITED KINGDOM IS RESTRICTED BY LAW. ACCORDINGLY, THIS COMMUNICATION ISDIRECTED ONLY AT (I) PERSONS OUTSIDE THE UNITED KINGDOM TO WHOM IT IS LAWFUL TO COMMUNICATE TO, OR (II) PERSONS HAVING PROFESSIONAL EXPERIENCE IN MATTERS RELATING TOINVESTMENTS WHO FALL WITHIN THE DEFINITION OF "INVESTMENT PROFESSIONALS" IN ARTICLE 19(5) OF THE FINANCIAL SERVICES AND MARKETS ACT 2000 (FINANCIAL PROMOTION) ORDER2005 (AS AMENDED), OR (III) HIGH NET WORTH COMPANIES, UNINCORPORATED ASSOCIATIONS AND PARTNERSHIPS AND TRUSTEES OF HIGH VALUE TRUSTS AS DESCRIBED IN ARTICLE 49(2) OFTHE FINANCIAL SERVICES AND MARKETS ACT 2000 (FINANCIAL PROMOTION) ORDER 2005 (AS AMENDED); PROVIDED THAT IN THE CASE OF PERSONS FALLING INTO CATEGORIES (II) OR (III), THECOMMUNICATION IS ONLY DIRECTED AT PERSONS WHO ARE ALSO "QUALIFIED INVESTORS" AS DEFINED IN SECTION 86 OF THE FINANCIAL SERVICES AND MARKETS ACT 2000 (EACH A "RELEVANTPERSON"). ANY INVESTMENT OR INVESTMENT ACTIVITY TO WHICH THIS COMMUNICATION RELATES IS AVAILABLE ONLY TO AND WILL BE ENGAGED IN ONLY WITH SUCH RELEVANT PERSONS.PERSONS WITHIN THE UNITED KINGDOM WHO RECEIVE THIS COMMUNICATION (OTHER THAN PERSONS FALLING WITHIN (II) AND (III) ABOVE) SHOULD NOT RELY ON OR ACT UPON THISCOMMUNICATION. YOU REPRESENT AND AGREE THAT YOU ARE A RELEVANT PERSON.NBPE HAS NOT BEEN, AND HAS NO INTENTION TO BE, REGISTERED UNDER THE U.S. INVESTMENT COMPANY ACT OF 1940, AS AMENDED (THE "INVESTMENT COMPANY ACT") AND INVESTORS WILLNOT BE ENTITLED TO THE BENEFITS OF THAT ACT. THE SECURITIES DESCRIBED IN THIS DOCUMENT HAVE NOT BEEN AND WILL NOT BE REGISTERED UNDER THE SECURITIES ACT.CONSEQUENTLY, SUCH SECURITIES MAY NOT BE OFFERED OR SOLD IN THE UNITED STATES OR TO U.S. PERSONS (AS SUCH TERM IS DEFINED IN REGULATION S UNDER THE SECURITIES ACT)UNLESS SUCH SECURITIES ARE REGISTERED UNDER THE SECURITIES ACT OR AN EXEMPTION FROM THE REGISTRATION REQUIREMENT OF THE SECURITIES ACT IS AVAILABLE. NO PUBLICOFFERING OF THE SECURITIES IS BEING MADE IN THE UNITED STATES.PROSPECTIVE INVESTORS SHOULD TAKE NOTE THAT ANY SECURITIES MAY NOT BE ACQUIRED BY INVESTORS USING ASSETS OF ANY RETIREMENT PLAN OR PENSION PLAN THAT IS SUBJECT TOPART 4 OF SUBTITLE B OF TITLE I OF THE UNITED STATES EMPLOYEE RETIREMENT INCOME SECURITY ACT OF 1974, AS AMENDED ("ERISA") OR SECTION 4975 OF THE UNITED STATES INTERNALREVENUE CODE OF 1986, AS AMENDED (THE "CODE"), ENTITIES WHOSE UNDERLYING ASSETS ARE CONSIDERED TO INCLUDE "PLAN ASSETS" OF ANY SUCH RETIREMENT PLAN OR PENSION PLAN,OR ANY GOVERNMENTAL PLAN, CHURCH PLAN, NON-U.S. PLAN OR OTHER INVESTOR SUBJECT TO ANY STATE, LOCAL, NON-U.S. OR OTHER LAWS OR REGULATIONS SIMILAR TO TITLE I OR ERISAOR SECTION 4975 OF THE CODE OR THAT WOULD HAVE THE EFFECT OF THE REGULATIONS ISSUED BY THE UNITED STATES DEPARTMENT OF LABOR SET FORTH AT 29 CFR SECTION 2510.3-101,AS MODIFIED BY SECTION 3(42) OF ERISA.THE MERITS OR SUITABILITY OF ANY SECURITIES MUST BE INDEPENDENTLY DETERMINED BY THE RECIPIENT ON THE BASIS OF ITS OWN INVESTIGATION AND EVALUATION OF NBPE, THEINVESTMENT MANAGER, AND NEUBERGER BERMAN. ANY SUCH DETERMINATION SHOULD INVOLVE, AMONG OTHER THINGS, AN ASSESSMENT OF THE LEGAL, TAX, ACCOUNTING, REGULATORY,FINANCIAL, CREDIT AND OTHER RELATED ASPECTS OF THE SECURITIES. RECIPIENTS OF THIS DOCUMENT AND THE PRESENTATION ARE RECOMMENDED TO SEEK THEIR OWN INDEPENDENTLEGAL, TAX, FINANCIAL AND OTHER ADVICE AND SHOULD RELY SOLELY ON THEIR OWN JUDGMENT, REVIEW AND ANALYSIS IN EVALUATING NBPE, THE INVESTMENT MANAGER, AND NEUBERGERBERMAN, AND THEIR BUSINESS AND AFFAIRS.THIS DOCUMENT AND THE PRESENTATION MAY CONTAIN CERTAIN FORWARD-LOOKING STATEMENTS. FORWARD-LOOKING STATEMENTS RELATE TO EXPECTATIONS, BELIEFS, PROJECTIONS,FUTURE PLANS AND STRATEGIES, ANTICIPATED EVENTS OR TRENDS AND SIMILAR EXPRESSIONS CONCERNING MATTERS THAT ARE NOT HISTORICAL FACTS. IN SOME CASES, FORWARD-LOOKING STATEMENTS CAN BE INDENTIFIED BY TERMS SUCH AS "ANTICIPATE", BELIEVE", "COULD", "ESTIMATE", "EXPECT", "INTEND", "MAY", "PLAN", "POTENTIAL", "SHOULD", "WILL", AND "WOULD",OR THE NEGATIVE OF THOSE TERMS OR OTHER COMPARABLE TERMINOLOGY. THE FORWARD-LOOKING STATEMENTS ARE BASED ON NBPE’S AND/OR NEUBERGER BERMAN'S BELIEFS,ASSUMPTIONS AND EXPECTATIONS OF FUTURE PERFORMANCE AND MARKET DEVELOPMENTS, TAKING INTO ACCOUNT ALL INFORMATION CURRENTLY AVAILABLE. THESE BELIEFS,ASSUMPTIONS, AND EXPECTATIONS CAN CHANGE AS A RESULT OF MANY POSSIBLE EVENTS OR FACTORS, NOT ALL OF WHICH ARE KNOWN OR ARE WITHIN NBPE’S OR NEUBERGER BERMAN’SCONTROL. IF A CHANGE OCCURS, NBPE’S BUSINESS, FINANCIAL CONDITION, LIQUIDITY AND RESULTS OF OPERATIONS MAY VARY MATERIALLY FROM THOSE EXPRESSED IN FORWARD-LOOKINGSTATEMENTS. SOME OF THE FACTORS THAT COULD CAUSE ACTUAL RESULTS TO VARY FROM THOSE EXPRESSED IN FORWARD-LOOKING STATEMENTS, INCLUDE, BUT ARE NOT LIMITED TO: THEFACTORS DESCRIBED IN THIS DOCUMENT AND THE PRESENTATION; THE RATE AT WHICH NBPE DEPLOYS ITS CAPITAL IN INVESTMENTS AND ACHIEVES EXPECTED RATES OF RETURN; NBPE’SAND THE INVESTMENT MANAGER’S ABILITY TO EXECUTE NBPE'S INVESTMENT STRATEGY, INCLUDING THROUGH THE IDENTIFICATION OF A SUFFICIENT NUMBER OF APPROPRIATE INVESTMENTS;THE CONTINUATION OF THE INVESTMENT MANAGER AS MANAGER OF NBPE'S INVESTMENTS, THE CONTINUED AFFILIATION WITH NEUBERGER BERMAN OF ITS KEY INVESTMENT PROFESSIONALS;NBPE’S FINANCIAL CONDITION AND LIQUIDITY; CHANGES IN THE VALUES OF OR RETURNS ON INVESTMENTS THAT THE NBPE MAKES; CHANGES IN FINANCIAL MARKETS, INTEREST RATES ORINDUSTRY, GENERAL ECONOMIC OR POLITICAL CONDITIONS; AND THE GENERAL VOLATILITY OF THE CAPITAL MARKETS AND THE MARKET PRICE OF NBPE’S SHARES.BY THEIR NATURE, FORWARD-LOOKING STATEMENTS INVOLVE KNOWN AND UNKNOWN RISKS AND UNCERTAINTIES BECAUSE THEY RELATE TO EVENTS, AND DEPEND ON CIRCUMSTANCES THATMAY OR MAY NOT OCCUR IN THE FUTURE. FORWARD-LOOKING STATEMENTS ARE NOT GUARANTEES OF FUTURE PERFORMANCE. ANY FORWARD-LOOKING STATEMENTS ARE ONLY MADE AS ATTHE DATE OF THIS DOCUMENT AND THE PRESENTATION, AND NEITHER NBPE NOR THE INVESTMENT MANAGER ASSUMES ANY OBLIGATION TO UPDATE FORWARD-LOOKING STATEMENTS SETFORTH IN THIS DOCUMENT WHETHER AS A RESULT OF NEW INFORMATION, FUTURE EVENTS, OR OTHERWISE, EXCEPT AS REQUIRED BY LAW OR OTHER APPLICABLE REGULATION. IN LIGHT OFTHESE RISKS, UNCERTAINTIES, AND ASSUMPTIONS, THE EVENTS DESCRIBED BY ANY SUCH FORWARD-LOOKING STATEMENTS MIGHT NOT OCCUR. NBPE QUALIFIES ANY AND ALL OF THEIRFORWARD-LOOKING STATEMENTS BY THESE CAUTIONARY FACTORS. PLEASE KEEP THIS CAUTIONARY NOTE IN MIND WHILE READING THIS DOCUMENT.
Continued
33
Legal Disclaimer
BY ACCEPTING AND READING THIS DOCUMENT AND/OR ATTENDING THE PRESENTATION TO WHICH THIS DOCUMENT RELATES YOU WILL BE DEEMED TO HAVEREPRESENTED, WARRANTED AND UNDERTAKEN FOR THE BENEFIT OF NBPE, THE INVESTMENT MANAGER, NEUBERGER BERMAN AND OTHERS THAT (A) YOU AREOUTSIDE OF THE UNITED STATES AND ARE AN "INVESTMENT PROFESSIONAL" (AS DEFINED ABOVE), (B) YOU HAVE READ AND AGREE TO COMPLY WITH THE CONTENTSOF THIS NOTICE, YOU WILL KEEP THE INFORMATION IN THIS DOCUMENT AND DELIVERED DURING ANY PRESENTATION OR CONTAINTED IN ANY ACCOMPANYINGDOCUMENT AND ALL INFORMATION ABOUT NEUBERGER BERMAN CONFIDENTIAL, AND WILL NOT REPRODUCE OR DISTRIBUTE, IN WHOLE OR IN PART, (DIRECTLY ORINDIRECTLY) ANY SUCH INFORMATION, UNTIL SUCH INFORMATION HAS BEEN MADE PUBLICLY AVAILABLE AND TAKE ALL REASONABLE STEPS TO PRESERVE SUCHCONFIDENTIALITY, AND (C) YOU ARE PERMITTED, IN ACCORDANCE WITH APPLICABLE LAWS, TO RECEIVE SUCH INFORMATION.NBPE IS ESTABLISHED AS A CLOSED-END INVESTMENT COMPANY IN GUERNSEY AND THE COMPANY IS SUBJECT TO THE NETHERLANDS FINANCIAL SUPERVISION ACT(WET OP HET FINANCIEEL TOEZICHT, "WFT"), AS A LISTED ENTITY (UITGEVENDE INSTELLING) AS DEFINED IN SECTION 1:1 OF THE WFT. ALL INVESTMENTS ARE SUBJECTTO RISK. PAST PERFORMANCE IS NO GUARANTEE OF FUTURE RETURNS. PROSPECTIVE INVESTORS ARE ADVISED TO SEEK EXPERT LEGAL, FINANCIAL, TAX AND OTHERPROFESSIONAL ADVICE BEFORE MAKING ANY INVESTMENT DECISION. THE VALUE OF INVESTMENTS MAY FLUCTUATE. RESULTS ACHIEVED IN THE PAST ARE NOGUARANTEE OF FUTURE RESULTS.THIS DOCUMENT IS ISSUED BY NBPE WHOSE REGISTERED ADDRESS IS AT HERITAGE HALL, PO BOX 225, LE MARCHANT STREET, ST. PETER PORT, GUERNSEY GY1 4HY.NB ALTERNATIVES ADVISERS LLC IS A REGISTERED INVESTMENT ADVISER IN THE UNITED STATES. NEUBERGER BERMAN IS A REGISTERED TRADEMARK. ALL RIGHTSRESERVED. ©2015 NB ALTERNATIVES ADVISERS LLC.
Continued
34