nature's place: human population and the future of biodiversity
TRANSCRIPT

RICHARD P. CINCOTTA & ROBERT ENGELMAN

About Population Action International
Population Action International (PAI) is a research-based advocacy organi-zation that works to increase global political and financial support foreffective population policies and programs grounded in individual rights.
The organization seeks to make clear the linkages between population,reproductive health, the environment and development.
At the heart of PAI’s mission is its commitment to the expansion of volun-tary family planning, other reproductive health services, and educationaland economic opportunities for girls and women. Together these strategiespromise to improve the lives of individual women and their families whilealso slowing the world’s population growth.
PAI fosters the development of U.S. and international policy on urgentpopulation issues through an integrated program of policy research, publiceducation and political advocacy. PAI reaches out to government leadersand opinion makers through the dissemination of strategic, action-orientedpublications, broader efforts to inform public opinion, and coalitions withother development, reproductive health and environmental organizations.
© Population Action International, 2000
Material from this publication may be reproduced provided Population ActionInternational and the authors are acknowledged as the source.
ISBN: 1-889735-04-3Library of Congress Number: 99-64886
Photography: Front cover, Orang-utan, Jessie Cohen, National Zoological Park,Smithsonian Institution. Back cover, ©Rebecca Janes.
Before January 31, 2000:1120 19th Street, NWSuite 550Washington, DC 20036 USA
After January 31, 2000:1300 19th Street, NWSecond FloorWashington, DC 20036 USA
Website: http://www.populationaction.org


2
Po
pu
lat
ion
A
ct
ion
I
nt
er
na
tio
na
l
Acknowledgments
This publication represents Population Action International’s first effort to workwith geographic information systems, and in this endeavor the authors weregreatly assisted by Kate Sebastian, Margret Bartels, Onyango Okello and UweDeichmann. We would also like to thank Lee Hannah and Ned Horning atConservation International (CI) for their assistance with human disturbance data,Jorgen Thomsen, Tania Tarrar, Lata Iyer and Russell Mittermeier (also of CI) fortheir assistance with aspects of the biodiversity hotspots, and Aun Ling Lim atPopulation Reference Bureau for her assistance with national demographic infor-mation. Bruce Byers provided research assistance, and valuable reviews wereoffered by David Blockstein, Alan Bornbusch, Frederick Meyerson, NormanMyers and David Pimentel. We thank Dan Sperling for his edits to style and con-tent and Anne Marie Amantia and Victoria Stubbs for their assistance in trackingliterature. Responsibility for the analysis and any views expressed in this publica-tion rest with the authors alone.
Geographic Information Systems Analysis: Jennifer WisnewskiResearch Assistance: Bonnie Dye and Akia Talbot

3
Na
tu
re
’s
Pla
ce
The Earth’s Biodiversity and Human Population ...................................................................... 4Key Terms and Definitions ...................................................................................................... 5
Summary .............................................................................................................................. 6Box: Recommendations ..................................................................................................... 9Box: Sylphion: A Natural Contraceptive and Its Loss .......................................................... 10
Introduction ......................................................................................................................... 11Box: Relative Scarcity: Apes on the Edge ............................................................................ 12
I. Biodiversity In Brief .......................................................................................................... 15Box: Relating Habitat Area to Species Numbers .................................................................. 19Box: The Red Queen’s Dowry ............................................................................................ 20Box: Banking on Genes to Feed the Future ......................................................................... 22
II. Four Waves of Human Influence ...................................................................................... 24Box: The Nature of Islands ................................................................................................ 27Box: An Epoch in the Making ............................................................................................ 30
III. Nature Replaced: Prospects for Our Species .................................................................... 33 Box: Human Fertility Change in the Highly Biodiverse Countries ......................................... 35Box: Bordering on Uncertainty: Considering the United Nations Population Projections ........ 36Box: Population Momentum .............................................................................................. 39
IV. The Role of Population Growth ........................................................................................ 40Box: Places Apart: Military Tensions and Biodiversity ......................................................... 44Box: Suburban Predators ................................................................................................... 49Box: Biodiversity, Property Rights and Population Growth .................................................. 52
V. Population Growth and the Global Biodiversity Hotspots .................................................. 56Box: Key to the Global Biodiversity Hotspots and Major Tropical Wilderness Areas .............. 58Box: Hotspot Population Profile – Madagascar .................................................................... 65Box: Hotspot Population Profile – California ....................................................................... 68
VI. Strategies ........................................................................................................................ 69Box: Learning from Biosphere 2 ......................................................................................... 73
Centerpiece Map: People and Biological Diversity: Population in the Global Biodiversity Hotspots, 1995
AppendicesAppendix 1: Data Sources and Methodology ...................................................................... 75Appendix 2: List of Figures and Their Sources .................................................................... 79
ContentsContents

Earth’s Biological Diversity and Human Population
Existing Species Probably between 7 million and 15 million species
Human PopulationWorld population, 1900: ~1.6 billion1
World population, 1950: 2.5 billion2
World population, 1999: 6.0 billion2
Threatened SpeciesAssessed Species Proportion
Listed as Threatened3 of totalVascular plants 33,798 12.5 percent
Mammals 1,096 25 percent
Birds 970 11 percent
Reptiles 253 20 percent
Amphibians 124 25 percent
Fishes 734 34 percent
The 25 Global Biodiversity HotspotsWorld land area (minus ice, bare rock): 134.9 million square kilometers4
Original extent of the 25 hotspots: 17.5 million square kilometers5
Area in hotspots remaining in natural vegetation: 2.1 million square kilometers5
World population, 1995: 5.7 billion people2
Population in the 25 hotspots, 1995: 1.1 billion people6
World population density, 1995: 42 people per square kilometer2
Population density in the 25 hotspots, 1995: 73 people per square kilometer6
World population growth rate, 1995 to 2000: 1.3 percent2
Population growth rate in the 25 hotspots, 1995 to 2000: 1.8 percent6
Units of Measurement1 kilometer = 0.621 miles
1 hectare = 2.47 acres
1 square kilometer = 100 hectares = 0.39 square miles
1 kilogram = 2.2 pounds
4
Po
pu
lat
ion
A
ct
ion
I
nt
er
na
tio
na
l
References1. J-N. Biraben, Population (Paris) 34,1
(1979):13.2. UN Population Division, 1998.3. IUCN-World Conservation Union, 1996
(animals) & 1998 (plants).4. UN Food and Agriculture
Organization, 1998.5. Conservation International, 1999.6. Population data estimated by
Population Action International.

Threatened species: species that have beenassigned to one of three IUCN Red Listcategories—either vulnerable, endan-gered or critically endangered.
Demographic Terms
Population growth rate: the percentage ofthe present population by which a popu-lation increases or decreases annually.
Annual growth increment: the number ofpeople added to a population or subtract-ed from it annually.
Population momentum: the tendency of pop-ulation growth to follow past growthtrends for several decades, despite imme-diate changes in fertility that could even-tually stabilize population or evenreverse its direction of change.
Population density: the number of peopleinhabiting an area of land (expressed aspeople per square kilometer in interna-tional publications).
Total fertility rate: the average number ofchildren that would be born alive to eachwoman if her reproductive experiencewere to turn out the same as that ofwomen of all reproductive ages who arecurrently members of the population.
Sources:“Biodiversity Notes,” Newsletter (Madison, WI:The Biodiversity Project, Winter 1999).
Convention on Biological Diversity, UNConference on Environment and Development,Rio de Janeiro, June 5, 1992.
Ecological Terms Biodiversity (or Biological diversity): thediversity of living organisms and all theinterconnections that support life on Earth.
Biological invasion: processes by whichspecies become established in ecosys-tems to which they are not native. Thesespecies are commonly called biologicalinvaders, invasive species or invadingspecies. They are often weeds, pests anddisease-causing organisms.
Breeding populations: groups of individualplants or animals that tend to reproduceamong themselves and much less fre-quently with individuals from othermembers of the same species. As impor-tant sources of migrants and their geneticvariability, these separated sub-popula-tions can prove critical to the survival ofa species as a whole.
Domesticated species: species in which theevolutionary process has been manipu-lated by humans to meet human needs.
Ecosystem: a dynamic complex of plants,animals and micro-organisms and theirnon-living environment that interact as aunit.
Endemic species: those species that occurwithin a restricted range. Outside thatrestricted range (such as an ecosystem,island, or within country boundaries) anendemic species is found nowhere elseon Earth.
Extinction: in this report, the complete,permanent loss of a species to the planetas a whole.
Habitat: the particular environment in whicha species or breeding population lives.
Local biodiversity loss: in this report, theloss of local breeding populations and/ortheir habitat, and thus the likely loss ofgenetic variation and reserve individuals.
Protected area: a geographically definedarea that is regulated and managed toachieve specific conservation objectives.
Species: a group of organisms that,because of close genetic and physicalsimilarities, can naturally mate with eachother and produce viable offspring (indi-viduals that can also reproduce natural-ly). Within species are often other levelsof similarity, including sub-species, vari-eties, and breeding populations. Organismsthat reproduce only through asexualmeans (such as micro-organisms thatreproduce by dividing or budding) aresometimes difficult to separate using thespecies concept.
Speciation: the processes by which newspecies are established.
Sustainable use: the use of components ofbiological diversity in a way and at a ratethat does not lead to its long-termdecline, thereby maintaining its potentialto meet the needs and aspirations ofpresent and future generations.
5
Na
tu
re
’s
Pla
ce
Key Terms and Definitions

Human Activity andBiodiversityScientists are becoming increasingly con-vinced that human beings have causedecosystem change and species extinctionalmost since our own species emerged.Between 50,000 and 10,000 years ago, asearly populations of humans expanded acrossthe continents, more than 200 species oflarge animals disappeared forever. Then,between 1,500 and 500 years ago, as humanpopulations reached the farthest oceanicislands, over 1,000 species of island birdswent extinct. Today’s wave of extinctions,however, is even more extensive. Moreover, itis fundamentally different from its two prede-cessors in ways that relate strongly to thepervasiveness and size of today’s humanpopulation:
• For the first time, human activities areaffecting species of all types and habits,at all points of the globe, and pushingmany toward extinction. Scientists projectthat at least half of all living species couldultimately disappear due to habitat lossalone, creating a mass extinction on a scalecomparable to those that have ended pastgeologic eras.
• Apart from habitat loss, other agents ofhuman-caused extinction are now at
T he world’s biological wealth is dwin-dling. Earth—the only location in theuniverse that we know supports life—is being transformed into a world thatis genetically poorer. The loss is irre-
trievable, and its roots lie in the spectacularsuccess of a single species: us, Homo sapiens.The disappearance of species, proceedingthousands of times faster today than in thepre-human past, is still accelerating and islikely to advance even more rapidly in the 21st
century. No one can know when the processwill end, or what the world of nature will looklike when it does.
Hopeful signs do brighten this darkprospect, however. Among the most hopeful isthat human population may well reach aplateau or peak by the middle of the 21st cen-tury. The pressure of human activities onremaining habitats could reach a maximumaround the same time—and then, perhaps,begin to subside.
Among the most pressing questions are:Does human population growth really matterto species loss? Can policies and programs sig-nificantly influence human population trends,and can they do this while upholding the basichuman right of couples and individuals tomake their own decisions about reproduction,free from interference? The evidence showsthat the answer to all these questions is yes.
6
Po
pu
lat
ion
A
ct
ion
I
nt
er
na
tio
na
l
SummarySummary

7
Na
tu
re
’s
Pla
ce
species. These organisms, whichinclude domestic and other speciesthat thrive in human-dominatedecosystems, are themselves often prin-cipal agents of ecological disruptionand biodiversity loss.
Early stabilization of human popula-tion would not by itself act as a break-water against the current wave of extinc-tions. Nonetheless, it is arguably a neces-sary condition for saving more than 10percent of the earth’s natural ecosystemsin perpetuity. And that achievement,ecologists argue, will be needed to avoidlosing more than half of the planet’sremaining plant and animal species.
Hotspots: PopulationPressures in the MostBiodiverse PlacesThe emerging technology of geographicinformation systems (GIS) opens up newpossibilities for analyzing the distributionand richness of species, including ourown species. Several key findings emergein this first-ever effort to utilize this tech-nology in a Population Action Internationalreport:
• More than 1.1 billion people now livewithin the 25 global biodiversityhotspots, described by ecologists asthe most threatened species-richregions on Earth. In 19 of thesehotspots, population is growing morerapidly than in the world as a whole. Inone hotspot (the Caucasus), populationis decreasing moderately. While thehotspots extend across some 12 percent
work. Even more species could disap-pear as a result of pollution, overhunt-ing, overfishing and inadvertent intro-duction of exotic species into weak-ened ecosystems. Hanging over thefuture of all life is the puzzle of howglobal climate will change in comingcenturies as a result of human influ-ences, and how these changes willaffect ecosystems and the species theysupport.
• Not all species are at risk, however.Evolution is resilient. A small percent-age of species—from pigeons, toweeds, to microbial parasites—haveproliferated beyond their pre-humannumbers or ranges. Rapidly evolvingpests and disease-causing organismscould swell their ranks. Humanityitself, with more than 30 times thepopulation density it ever could haveachieved without agriculture, nowappears to have become the centralorganizing reality around which non-human life will evolve.
Population and BiodiversityThe full range of connections betweenlocal population growth, the influence ofdistant consumers, changing ecosystemsand the loss of species is complex, con-troversial and in need of more research.Nonetheless, biologists agree on severalkey points:
• Population growth is among a hand-ful of underlying conditions deter-mining the type and intensity ofhuman activities that lead to biodi-versity loss. Population size itself is
an important determinant of the scaleof humanity’s use of natural resources—resources upon which other speciesdepend, as well. Population growth,along with increasing per capita con-sumption, has played a key role in thedevelopment of human-dominatedecosystems in which the survival ofwild species is often precarious. Andrecent population growth has madebiological conservation efforts moredifficult, more expensive and morelikely to conflict with human needs.
• The growth of our species’ numbersis tightly coupled to rising demandfor food and shelter. Increasing thesupply of these essentials, by whatevermeans, affects biodiversity. Agriculturalexpansion and urban sprawl play thelargest discernible roles in the loss andfragmentation of the world’s forestsand wetlands, and contribute signifi-cantly to river and coral reef siltation.Intensified agriculture and urban con-centration are leading contributors towater-borne pollution. And jointly,agriculture and domestic activitiesaccount for over three-quarters of allwater withdrawn for use from reser-voirs and aquifers. These are also theprimary beneficiaries of dam-building,which is one of the top two causes(along with biological invasions) offreshwater species extinctions.
• When considering human popula-tion growth, analysts tend to over-look the parallel growth and prolifer-ation of populations of organismsthat are closely associated with our

8
Po
pu
lat
ion
A
ct
ion
I
nt
er
na
tio
na
l
Population and HopeThe evidence of recent demographicresearch suggests that couples the worldover, and especially younger women,today desire later childbirths and fewerchildren than ever before. Both desires—if put into effect—contribute powerfullyto the slowing of population growth,now averaging 1.6 percent annually forless developed regions of the world and0.3 percent for the developed regions.The growth of our species, once theobject of environmental fears, hasinstead shown itself in the past decadeto be among the more resolvable ofenvironmental concerns.
A plateau or peak in human popula-tion by the middle of the new century ispossible. But this is likely to occur onlyif developed and developing countriesrenew their commitments to the princi-ples—and the shared investments—agreed to in 1994 at the InternationalConference on Population andDevelopment in Cairo.
An early halt to human populationgrowth will not end human-causedextinctions. Conservationists will contin-ue to contend with our species’ unprece-dented densities, its geographic range andmobility, its need for natural resourcesand ways to dispose of wastes, and itsuse of technologies. The possibility ofworld population stabilization, in combi-nation with modest decline in someregions, nonetheless offers among thegreatest hopes for the future of speciesand ecosystem conservation on a human-dominated planet.
of the planet’s land surface, by 1995they were home to about 20 percent ofthe world’s population.
• Around 75 million people, or 1.3 per-cent of the world’s population, livewithin the three major tropicalwilderness areas: the UpperAmazonia and Guyana Shield, the
Congo River Basin, and the NewGuinea-Melanesia complex of islands.All together, these areas cover around6 percent of Earth’s land surface.Population in the tropical wildernessareas is, on average, growing at anannual rate of 3.1 percent, over twicethe world’s average rate of growth—aproduct of rapid migration and highrural fertility rates in these regions.
• In most hotspots located in devel-oped countries, populations are pro-jected to grow for several decades tocome. Past and present migration intothese areas is the major factor in thiscontinued growth, specifically in theU.S. states of California, Florida andHawaii, and in western Australia andin New Zealand. Much of this migra-tion is internal, with more peoplemoving to warmer climates andcoastal areas. Significant internationalmigration has also been involved, tovarying degrees, much of it with ori-gins in developing countries.
Much of what society and conserva-tionists will need to accomplish to savespecies will have little to do directlywith population change. Populationanalysis can, however, provide a meas-ure of the risks that most species willface. For as population grows and asadditional land, water and waste-absorb-ing sinks are needed to support theseindividuals, some conservation optionsnecessarily fall by the wayside.
Human population could peak midway through the21st century, or continue growing with a wide rangeof plausible outcomes. The path that populationtakes will likely be strongly influenced by the way inwhich nations order their priorities during the com-ing decades, and the progress women achieve towardeconomic and reproductive self-determination.
Source: Data from UN Long-Range Projections, 1998.
20
18
16
14
12
10
8
6
4
2
0
PO
PU
LA
TI
ON
(bill
ions
)
Low Projection
High Projection
PROJECTEDPAST
|1950
|1975
|2000
|2025
|2050
|2075
|2100
Possibilities in the Demographic Future
FIGURE 1

1994 International Conference onPopulation and Development supportand amplify other measures to conserveEarth’s complex web of life.
• The public and private sectors shouldcooperate to diminish the environmentalimpacts of the expansion of agricultureand housing. Significant investments inresearch and improved standards in engi-neering and zoning for these sectorscould help minimize the conflictbetween conserving biodiversity, andmuch-needed efforts to alleviate povertyand to accommodate the populationgrowth that occurs during the next sev-eral decades.
• Where organizations work in remote ruralareas to promote biodiversity conserva-tion, conservationists should considercooperating with qualified providers ofreproductive health services. They can doso without jeopardizing their mission inconservation by working as part ofbroad-based efforts to promote commu-nity development, address basic humanneeds, and improve the management ofnatural resources that sustain humanand non-human life.
• In research publications and other com-munications, scientists and educatorsshould use the range of future popula-
Each of us can take action to preservethe planet’s wealth of living species.This report’s recommendations are
addressed to policymakers, to scientistsand conservationists, and to the generalpublic. Specifically, they include the fol-lowing: • The conservation of biological diversity
should be elevated to a high priority bydonor agencies, nations and communi-ties. While innovative conservation pro-grams deserve support and funds, thereis a pressing need to encourage broaderunderstanding of biodiversity and itsvalue to society. To further this objec-tive, governments and donors shouldwork to expand the ranks of biodiversityscientists and environmental educatorsin the species-rich tropical countries.
• The Convention on Biological Diversity,an international agreement aimed atmaintaining the planet’s biodiversityand equitably sharing its benefits,deserves the support of all nations andpeoples. Negotiators seeking to improveit and further its progress should con-sider the interactions between speciessurvival and human population dynam-ics. Through their impact on populationgrowth and on the capacity of women tomanage their own lives, the socialinvestment strategies called for at the
9
Na
tu
re
’s
Pla
ce
tion possibilities—the high and lowscenarios projected by the UnitedNations—rather than the medium sce-nario alone. There are immeasurablepossibilities for unexpected demo-graphic changes, even in the regionswhere up to now there has been littleimprovement in women’s status and lit-tle decline in fertility rates.
• Consumers should learn about and con-sider the role of their purchases, theirpets, and their daily activities in put-ting biodiversity at risk. They shouldinform themselves about and considerhow their lifestyles and their politicalchoices influence native species andecosystems.
• Couples and individuals should considerthe impact of their reproductive deci-sion-making on the well-being of theircommunities and of the world as awhole.
The survival of anything like the cur-rent panoply of plant and animal specieswill depend not only on investmentsmade today in biological conservationprograms, but also in human develop-ment efforts that end up, as a side bene-fit to their main purposes, slowing thegrowth of human population.
Recommendations

10
Po
pu
lat
ion
A
ct
ion
I
nt
er
na
tio
na
l
Sylphion: A Natural Contraceptive and Its Loss
Asingle wild herb, a fennel-like plant in the car-rot family, could stand as a symbol of the majorthemes of this report, except for one fact: the
plant no longer stands at all, having gone extinctaround the height of the Roman Empire.
Roman and Greek chronicles reported that syl-phion (Ferula historica) once grew in abundance inthe hills near Cyrene, a Greek city-state founded inthe 6th Century BC along the coast of what is now
Libya. Cyrenian women valuedsylphion as an herbal antifertil-ity drug. It was, in fact, theoral contraceptive of the classi-cal world, and contraceptionwas its only recorded use.1
As knowledge of sylphion’sproperties spread throughoutthe Mediterranean basin, how-ever, the herb was transformedfrom a home remedy, largelycontrolled by women them-selves, into one of the principalcommodities of Cyrene’s foreign
trade, controlled by men. Evidence of sylphion’s eco-nomic importance is its silhouette on the face ofCyrenian four-drachma coins. The 4th century BCphysician Hippocrates records Greek and Syrianattempts to cultivate the herb on home ground andcut into the Cyrenian market. The attempts failed,and sylphion remained endemic to Cyrene.2
Today, unlike in Roman times, over 3 billionadults and adolescents around the world are in orare entering their reproductive years. The need for avariety of safe and effective contraceptive methods
grows more acute each year. Whatever lessons syl-phion might have offered to developers of moderncontraception, however, are lost. No one knows whatactive ingredient in the herb allowed Mediterraneanwomen to manage their own fertility. No one knowshow safe or effective it was, or even how the herbwas prepared.
All we can be sure of is that many women in theclassical world wanted very much to postpone preg-nancy and plan their families. Sylphion’s valueclimbed until it was said to have commanded itsweight in silver. Without substitutes or the capacityto domesticate or hybridize the wild herb, commercialtraders over-harvested it. Around the 2nd or 3rd cen-tury AD, sylphion disappeared.
The case of sylphion reminds us that women’sinterest in managing their own fertility is ancient.The herb’s extinction speaks of humanity’s longstand-ing but fragile economic association with biodiversi-ty. It also demonstrates the importance of conservingcritical biological resources for ourselves and for ourposterity. As in the case of sylphion, we may notknow the full price of our loss until it is too late.
References1. J.M. Riddle, Contraception and Abortion from the Ancient
World to the Renaissance (Cambridge: Harvard UniversityPress, 1992).
2. J.M. Riddle, J. W. Estes, American Scientist 80, May/June(1992): 226-233.
ASIA
GREECE
ALBANIA
MACEDONIA
EGYPT
AFRICA
PHOENICIA
CYPRUS
BYZANTIUM
ATHENS
SPARTASYRACUSE
CYRENE
ESPHESUS
Aegean Sea
M e d i t e r r a n e a n S e a
Black Sea
NaucratisCYRENAICA
Greek Colonization6th Century BC

11
Na
tu
re
’s
Pla
ce
density and growth, aspects that will clearlyfigure in their biological future.
As is the case with most environmentalissues, there is some disagreement about thenature and scale of the threat to biodiversitytoday. Few if any scientists, however, wouldargue that there is no threat at all. As thisreport points out, humanity’s hand in theextinctions of large land mammals during thelate Pleistocene Epoch, and of oceanic islandbirds during the last two millennia is virtual-ly certain. But never has Homo sapienspushed so many species, of so many typesand located in so many parts of the world,toward the biological thresholds of existence.And this push has been rapid. Most popula-tions of these now-threatened species wereapparently hardy and viable at the beginningand even the middle of the 20th century.
Defying the world’s preoccupation withthe growth of financial wealth, conservation-ists around the world work to hold back therelentless erosion of the biological and genet-ic wealth inherited from eons of evolution.The overarching term for this natural wealthis biodiversity, described as the “diversity oflife and all the interconnections that supportall life on Earth.”1
There is little optimism in the scientificand conservation communities that the cur-
Never before, in 3.5 billion years oflife on Earth, has a single specieschipped away large portions of theentire earthly array of life. Yet thatis what human beings are doing
today, however unintentionally. If most of thetrends evident in the 20th century continue, itis hard for most biologists to project anythingother than a much less diverse—and there-fore less wondrous—web of life in the com-ing century and beyond.
There is one trend, however, that suggestshope for the future of the world’s complexmix of species and ecological systems. Thegrowth of the human population is slowingdown, faster at the close of the 20th centurythan most demographers had previouslyexpected. Whether and how fast that trendwill continue, however, depends critically ondecisions made today.
This report, the sixth in a series on popu-lation and critical natural resources, considershow population is changing, how societymight influence these trends, and whatimpact future population change might haveon the conservation of species. The reportsurveys the world’s highest-priority regionsfor biological conservation, the 25 biodiversityhotspots and three major wilderness areas. Itquantifies each region’s human population
IntroductionIntroduction

12
Po
pu
lat
ion
A
ct
ion
I
nt
er
na
tio
na
l
References1. IUCN Red List of Threatened Animals
(Gland: IUCN, 1996).2. UN Statistics Division, Demographic
Yearbook (New York: United Nations,1998).
3. M-C. King and A.C. Wilson, Science188 (1975): 107-116.
4. A.L. Rose, African Primates, Winter(1998); G. Streiker, “Poachers KillingGorillas, Chimps for Bush MeatDelicacy: Activists Blame LoggingCompanies for Problem,” CNNInteractive, Dec. 30, 1998.
5. F. de Waal and F. Lanting, Bonobo:the Forgotten Ape (Berkeley: Univ. ofCalifornia Press, 1997), p. 172.
6. J. F. Oates, “African Primates,” StatusSurvey and Conservation Action Plan(Gland: IUCN/SSC Primate SpecialistGroup, 1996).
7. S. Saunter, World ConservationSociety, personal communications,May 1998.
8. J.S. Hall and others, Oryx 32, 2(1998): 122-130.
9. C. Yeager, Conservation International,personal communications, May 1999.
10. G. Streiker, “Asian Economic CrisisCould Spell End for Orangutans,” CNNInteractive, March 5, 1999.
11. H.D. Rijksen and others, OurVanishing Relative? The Status of WildOrang-utans at the Close of theTwentieth Century (Wageningen:Tropenbos, 1998); C.P. van Schaik,Duke Univ., personal communications,May 1998.
While our own popula-tion is growing steadi-ly, those of our closest
biological relatives, the greatapes—the non-human members
of the family Hominidae—have slidprecariously toward extinction. Over thepast half-century, the population numbersof three out of our four closest relatives—chimpanzees, bonobos and gorillas—havedeclined by at least half, earning thesespecies an endangered status from theIUCN-World Conservation Union1. The orang-utan’s population has slipped between 20percent and 50 percent over a similar peri-od. Considered vulnerable to extinction inIUCN’s 1996 appraisal, the orang-utan isnow even worse off—possibly down to halfits 1996 numbers—following the past twoparticularly destructive years of forest fireson the islands of Borneo and Sumatra, andthe economic crisis and political unrest thatcontinue to plague Indonesia.10
Population sizes of the various speciesof great apes are tiny fractions of our own.Even the most abundant species, the chim-panzee, now numbers well below 200,000 inthe wild.6 In the United States alone thereare 78 cities with populations greater thanthat figure.2 The other three great apes—the bonobo (a genetically distinct speciesformerly known as the pygmy chimpanzee),the orang-utan and the gorilla—are even
less numerous. No more than a few tens ofthousands of individuals exist, about theequivalent of human population in a medi-um-sized town. In fact, the number ofhuman beings born each day—some350,000—is greater than the current popu-lations of all other great apes combined.
Much of what science has learned abouthuman physiology and behavior comes fromobservations of primates, particularly of theapes. This is hardly surprising; more than 98percent of human DNA is identical to that ofchimpanzees and bonobos.3 Yet like selfishbig brothers in a dysfunctional family,humans are these animals’ greatest threat.Some experts believe that the growing bush-meat trade—the uncontrolled harvesting ofwildlife, and the butchering and marketingof their meat—could eliminate all viablepopulations of African apes within the next50 years.4 Despite the acute problem ofhunting pressure, the clearing of forest mayyet prove the ultimate undoing of efforts tosave ape species.
Today Homo sapiens is the greatest ofthe great apes. Humans share the greatestresponsibility for these species’ demise, andcan reap the greatest benefits for conserv-ing them. But unless we fully understandthis greatness, a day may come when—beyond the walls of zoological parks and labo-ratories—we are the only living member ofour Hominid family.
Relative Scarcity: Apes on the Edge
©Dunn Photographic

13
Na
tu
re
’s
Pla
ce
FIGURE 2
Species, Scientific Namesubspecies, scientific name
Population Size(~ = approximately)
Degree of Extinction Threat
ChimpanzeePan troglodytes
100,000 - 150,000(~2,500 in captivity)
Endangered
central chimpanzeePan troglodytes troglodytes
~80,000, chiefly in Gabon and Congo.Parts of habitat still not surveyed.6
Endangered
western chimpanzeePan troglodytes verus
No more than 12,0006 Endangered
Gorilla Gorilla gorilla
40,000 - 65,000 Endangered
eastern chimpanzee Pan troglodytes schweinfurthi
More than 5,000 in the Democratic Republic of the Congo (former Zaire); ~8,000 in Uganda, Rwanda, Burundi and Tanzania6
Endangered
~17,000 (8,600 - 25,500)8 Endangered
mountain gorilla Gorilla gorilla beringei
~6507 Critically Endangered
western lowland gorillaGorilla gorilla gorilla
30,000 - 40,0007 Endangered
Orang-utanPongo pygmaeus
* ~38,500 * estimated prior to 1997-98 fires; (present popula-tion could be from 25,0009 to as low as 15,00010)
*Vulnerable
Sumatran orang-utanPongo pygmaeus abelii
* ~7,50011 (subspecies not evaluated)
Borneo orang-utanPongo pygmaeus pygmaeus
* ~31,00011 (subspecies not evaluated)
HumanHomo sapiens
~6.0 billion
Bonobo Pan paniscus
10,000 - 25,0005 Endangered
Grauer’s gorilla Gorilla gorilla grauerii
The IUCN-World Conservation Union classifies humans as members of the family of species referred to as the Hominidae—or thegreat apes, as they are more commonly known. No other ape, nor any primate, can claim near the geographic range or populationthat humans can. And all species of great apes, except our own, are listed as threatened with extinction.
The degree of extinction threat increases from vulnerable, to endangered and then to criticallyendangered—the latter category holding the mostseriously threatened species on IUCN’s Red List.
Population and Status of the Great Apes, 1999

14
Po
pu
lat
ion
A
ct
ion
I
nt
er
na
tio
na
l
References1. “Biodiversity Notes,” Newsletter
(Madison, WI.: The BiodiversityProject, Winter, 1999).
2. Louis Harris and Associates,“Biodiversity in the NextMillennium,” Survey (NewYork: American Museum ofNatural History, 1998); J.Warrick, “Mass ExtinctionUnderway, Majority ofBiologists Say,” The WashingtonPost, Tues., April 21, 1998, A-4.
rent threat to biodiversity can be easedany time soon. In a recent Harris Poll,nearly 70 percent of biologists polledsaid that they believed a mass extinctionis under way. A similar proportion pre-dicted that up to one-fifth of all livingspecies could disappear within the next30 years.2 When scientists consider cur-rent rates of land and aquatic conversionfrom non-human to human uses, theyestimate that thousands of species blinkout each year.
Most of the plants, insects, aquaticand marine creatures, and microbes thatvanish do so before scientists can recordtheir existence. But every few months,one (or more) of the high-profile species—a bird, mammal, amphibian or reptileknown to science—is officially droppedfrom the catalogue of earthly inhabitants.Only a few cases of extinction are welldocumented. The extinction of 12 ofGuam’s 14 remaining land bird species,which succumbed to the predation of theexotic brown tree snake during the past50 years, is such a case. The eliminationof over 200 freshwater fish species inEast Africa’s Lake Victoria is another.
Since Earth first spawned life, globalbiodiversity has been depleted andrenewed several times. The record leftby fossils tells us that several millionyears of evolution can generate sufficientdiversity to fill the ecological nichesabandoned by the extinct. But this ismeaningless to societies that strain evento look a matter of years or decades intothe future. Unlike most other forms of
environmental degradation, extinction ofa species is a loss no future can remedy.It is, for that life form, a one-way trip tooblivion, despite the fantasies of recentpopular cinema.
Why This Study?Just as few scientists doubt the threat tonon-human species is real, few wouldargue that the threat is unrelated to therecent growth of human population andits contribution to the scope and scale ofhuman activity. Yet little research has sofar explored the complex connectionsbetween the threat to biodiversity and thesize and growth of human population.
This report is designed to help fillthat gap, to distill the evidence and liter-ature for policymakers and other non-scientists, and to contribute originalanalysis to the issue. In the analysis, weemploy geographic information systems(GIS) technology, an approach to geogra-phy that uses digital information madepossible by surveys, remote sensing andother means. The central portion of thisreport uses GIS to make first-ever esti-mates of population size and growthrates in the world’s most biodiversity-rich hotspots. The data that result pro-vide an idea of where progress in soundpopulation and other human develop-ment policies will be needed to bringhuman population trends into balancewith the world’s most diverse and valu-able ecosystems.
Unlike most other forms
of environmental
degradation, extinction
of a species is a loss no
future can remedy.

15
Na
tu
re
’s
Pla
ce
along with plants that survive in suburbanparks, on roadsides and on lawns. Thesespecies contribute little to the global pool ofgenetic variability. In fact, they generallydetract from it. Biological invaders areblamed for pushing out native species anddisrupting the flow of energy and vital nutri-ents through both natural and agriculturalecosystems.1 A recent study calculated thatalien weeds, introduced animals (mostlyinsects) and infectious diseases of foreign ori-gin cost the United States well over $100 bil-lion a year.2
If merely counting species is an inade-quate indicator of biodiversity, then whatdefines local biodiversity? The short answeris: the status of native species. In conservingthe complement of native species, biologistsassume that each contributes, in some largeor small way, to the complex properties ofthe ecosystem in which it resides—theecosystem’s web of food relationships, itsability to capture energy and be productive,its ability to cycle nutrients and water, toexclude exotic species, and to recover fromdroughts, storms, infestations or pollution.3
Ecologists express concern about activitiesthat upset the mix of species, eliminatebreeding populations and increase the risk ofextinction. These scientists rarely can predictthe long-term implications of removing orreplacing each species from any one ecosys-
Biological diversity—or biodiversity—isthe sum total of life’s physical expres-sion and genetic potential, embodiedin the array of organisms now alive.In a practical sense, biodiversity is
the living savings bank for Earth’s successfulgenes, a bank that holds some 3.5 billionyears of life’s solutions to the problems ofsurviving and competing on our planet.
Those genetic savings alone make biodi-versity an exceedingly valuable asset—butthere is more to this natural resource. With itcome cellular processes that reshuffle andalter the expressed and hidden genetic varia-tion produced during evolution, processesthat are essential to meeting challenges yet tobe posed. Biodiversity also encompasses thephysical, chemical and behavioral relation-ships that have evolved between co-existingspecies, and the ecosystems and biotic cyclesthat embody these relationships, protectthem and promote their continued evolution.
To assess biodiversity in any one locality,biologists often run surveys to determinehow many species live there. A simple count,however, can be misleading. For example, alarge portion of the species we encounter arebiological invaders, exotic species, many ofthem adapted to environmental distur-bance—as are a majority of the commonbackyard birds, rodents and insects thatinhabit our garbage and invade our homes,
[We are] conscious of the intrinsic
value of biological diversity and of
the ecological, genetic, social, eco-
nomic, cultural, recreational and aes-
thetic values of biological diversity
and its components, conscious also of
the importance of biological diversity
for evolution and for maintaining life
sustaining systems of the biosphere.
Opening words of the preamble to the
Convention on Biological Diversity,
Rio de Janeiro, June 5, 1992
1. Biodiversity in Brief1. Biodiversity in Brief

16
Po
pu
lat
ion
A
ct
ion
I
nt
er
na
tio
na
l
ecosystems but are missing from the fos-sil record, paleontologists guess thatsomething like 5 billion species havelived on Earth.8 Only two in every thou-sand of the world’s ever-existing species,however, share the planet with today’s 6billion human beings.
From the pre-human fossil record, pale-ontologists estimate that a mass extinctionhas unfolded on average once every 26million years. Five major mass extinctionsand roughly another 20 minor pulses ofextinction have occurred since animalsemerged in the fossil record around 600million years ago. These were geologicallybrief periods during which from 15 per-cent to as much as 90 percent of animalspecies disappeared.8
Mass extinctions are presently thoughtto have been caused by radical changes insea level, abrupt climate shifts, and colli-sions with comets or other cosmic debris.All told, these pulses account for roughly60 percent of extinctions.8 The last majormass extinction, 65 million years ago, sawthe end of dinosaurs and large marine rep-tiles, and permitted the evolution of a newassemblage of species, including our own.
What Species Are Alive Today? From a geological perspective, we live ourlives in the Cenezoic Era, often called theAge of Mammals. In fact, mammals andall other vertebrates (that is, animals withbackbones) presently account for onlyaround 40,000 species, or fewer than 1percent of all species. Plant life, consistingof flowering plants, conifers, mosses and
tem. Surveys and field experiments havedemonstrated that the removal of certainkeystone species, often large predatorsthat keep other species’ populations incheck, can radically change ecosystems.In other cases, however, species havebeen eliminated with little observedshort-term ecological disruption. Just onein a hundred transplanted exotic speciesgo on to produce major biological inva-sions—and there are few clues alertingbiologists as to which one that will be.4
Unlike physics, whose laws we take
to be universal, ecological studies haveyielded only a handful of basic princi-ples that can be successfully appliedfrom one ecosystem to the next. In thepresent winnowing and rearrangementof the biological world, surprises arecommon and often very costly, as illus-trated by the over $100 million in dam-age already wrought by invading zebramussels on North American waterways.5
How Many Species Are There?The species is biodiversity’s “currency.” Itis the lowest level of classification atwhich there are good chances that organ-isms with different descriptive names willalso possess very basic genetic differ-ences. About 1.5 million species havebeen named and described in museumcollections.6 The most current scientificestimates of total living species rangebetween 7 and 15 million, though esti-mates higher than 30 million speciesemerge from justifiable assumptions andestimations. Around 10 million is a rea-sonable guess for the present, and reason-able guesses will have to do. Currently sci-entists are finding and describing about15,000 species a year. So if 10 millionspecies indeed exist, it would take over 6centuries, at current assessment rates, justto make a proper inventory.7
So far, some 250,000 extinct fossilspecies have been described. But the fos-sil record presents a notoriously smalland unbalanced sample of the earth’sbiological past. Based upon educatedguesses of what types of species wouldhave been present to fill out ancient
According to the latest scientific estimates, the number ofEarth’s species range from 7 million to 15 million. In thisgraph, a total of around 10 million species is assumed. Lessthan 1.5 million have been identified, and relatively few ofthese have been studied to any depth.Source: Adapted from N.E. Stork, 1992.
Other invertebrates
Crabs & relatives
Other arthropods
•0
•500,000
•1,000,000
•1,500,000
•2,000,000
•2,500,000
Estimate of species remaining to be described
Described species
VirusesBacteria
Amoebas & other protozoansFungi
Algae
Plants
Mammals, Birds, Amphibians,Reptiles & Fish
Roundworms Shellfish, squid and relatives
Spiders
Other insects
Flies
Ants, bees & wasps
Butterflies & moths
Beetles
N U M B E R O F S P E C I E S
Counting Earth’s Species
FIGURE 3

17
Na
tu
re
’s
Pla
ce
species are exiting much faster. Based onrecords of extinction among the best-studied types of animals, British ecologistStuart Pimm and colleagues calculatedextinction rates during the past century torange from 100 to 10,000 species per year(again, assuming 10 million speciesexist). That rate is between 100 and 1,000times faster than the background rate ofspecies extinction.11
What if all species presently listed asthreatened by IUCN-World ConservationUnion were to go extinct in the next cen-tury? Then extinction rates would multi-ply another 10 times over current rates, to1,000 to 100,000 species per year.11 Thisalarming projection matches other project-ed rates, by leading ecologists, based onrecognized mathematical relationshipsbetween habitat loss and species loss.12
Several decades of biological losses nearthe high end of this range would probablyput at risk the planet’s major biologicaland geochemical cycling systems.
How Many Species Will Remain? How many of today’s species survive thecurrent wave of extinctions depends onhow quickly nations recognize the valuesof biodiversity, and how assiduously gov-ernments, organizations and individualswork for its conservation. It also dependscritically on the future of human popula-tion and human behavior. The highestUN population projections—and eventhey assume declines in human fertilityfrom present levels—suggest a world ofhumanity that arguably could spare little
ferns, probably make up fewer than 5 per-cent of all species, or about 300,000species. Arthropods—a group thatincludes the insects, crustaceans, spiders,mites, centipedes and their relatives—areby far the most diverse and widespread ofall groups of organisms, and they are notwell studied. They make up around 40percent of living species.
Biologists still have a world of discov-ery awaiting them in invertebrate diversi-ty. There are enough undescribed mol-lusks, echinoderms, jellyfish, worms andtheir relatives and other backbonelesscreatures to fill a few hundred museumcases and bookshelves. And there arelikely significant payoffs for describingmany of the hundreds of thousands ofspecies of fungi, protozoa, algae, bacteriaand viruses that remain unknown.
Where Are They? Life has spread to virtually every cornerof our planet. Species of archaebacteriathrive at near-boiling temperatures in hotsprings in North America, while relatedspecies live in the cracks of ice-boundAntarctic lakes. Thousand year-old wel-witschia plants bloom on the dunes of theAfrican Namib, one of the hottest and dri-est of Earth’s deserts. At the same time,foot-long Jericho worms and bacteria-eat-ing brachyuran crabs feed at the mouthsof volcanic vents four kilometers beneaththe ocean surface under hull-crushingpressures, bereft of any sunlight andbathed in the searing acidity of concen-trated hydrogen sulfide.
Relatively small percentages of today’s
species, however, live in such extremeenvironments. Many more inhabit savan-nas, the tundras, or live in the open seas.Still higher concentrations of speciesspend their lives in the grasslands andconiferous forests of temperate latitudes;and even more survive in marshes andswamps, rivers and lakes, in ocean tidalzones and around nutrient-rich marineshoals. The largest concentrations of ter-restrial biological diversity live where it iswarm and humid, and where such condi-tions are seasonally quite stable: in therainforests of the tropics. Though compris-ing only 2.3 percent of the entire surfaceof the earth,9 rainforests probably holdmore than 50 percent of all species.10
Tropical coral reefs—sometimes calledthe “rainforests of the oceans” for theirrichness of species—may run a close sec-ond. Worldwide there are about 600,000square kilometers of reefs, comprisingroughly 0.1 percent of Earth’s total surface.As many as 950,000 species may inhabitcoral reefs globally, though as few as 10percent have been described.9
How Fast Is Earth Losing Species? As a rule, extinctions happen. Paleontologistsestimate the background rate of speciesextinction—the long-term extinction rateexhibited prior to humanity’s influence—at between 1 and 10 extinctions eachdecade among every million fossil species.Assuming 10 million species are alivetoday, scientists can expect 1 to 10 speciesto go extinct each year from all forms oflife, visible and microscopic. In fact,
Though comprising only
2.3 percent of the entire
surface of the earth,
rainforests probably hold
more than 50 percent of
all species.

only the number of species, but the num-ber of diverse groups of plants and ani-mals, each distinct in form from oneanother (what biologists call genera andfamilies)—required at least 5 millionyears, and in some instances up to 100million years.14 Homo sapiens has beenaround for some 250,000 years. Naturerecovers, but not on a time scale relevantto human society.
And What is Biodiversity Worth? Accounting for annual economic produc-tivity of commercial fish species or tim-ber species, or even for certain genesused in crops or in pharmaceuticals is astraightforward exercise. Much of biodi-versity’s services, however, never trade inthe marketplace. Still we know they arevaluable. Some—for example, the genera-tion of our atmosphere’s oxygen, thepurification of water, the pollination ofcrops, the formation of organic soil com-ponents, and the cycling of soil nutri-ents—are essential to human life andseemingly irreplaceable on a large scale.15
Another, even less tangible categoryincludes biodiversity’s aesthetic contribu-tions to the human experience, and itsrole as an essential ingredient in the qual-ity of life.16
Some economists have argued bluntlythat to save a reasonable portion of biodi-versity, society will have to come up withways to make the value of nature’samenities explicit, or simply risk losingthem all. This school of ecological eco-
room for nature without the widespreaduse of extraordinary technology, and theimplementation of environmentally-enlightened governance of unimaginablecapacity.
If only 10 percent of each type of natu-ral habitat eventually remains (and thatappears to be an optimistic projection formany moist tropical forests), around 50percent of all species are projected to sur-vive. If that habitat is fragmented—left insmall isolated pieces (and much of theremaining habitat already is)—then therecould be less. If species invasions contin-ue, and they appear to be increasing withglobalized trade and weakened ecosys-tems, then perhaps our descendants willencounter even fewer survivors, and evenfewer still from over-harvesting, pollutionand the myriad effects of climate change.13
Can Biodiversity BeRegained? Despite the apparent fragility of individualspecies, fossil evidence also demonstratesthat life itself is an extremely robust andresilient feature of our planet’s surface.Even as prior mass extinctions wiped outmillions of species, it opened new opportu-nities for the survivors. Exposed to lessvigorous competition and predation, sur-vivors proliferated and speciated (evolvedto form new species), filling the gaps leftby the extinct.
Can we rely on evolution to recoverfrom the present extinction? Evidence fromthe geologic record tells us that full recoveryfrom past mass extinctions—recouping not
18
Po
pu
lat
ion
A
ct
ion
I
nt
er
na
tio
na
l
If only 10 percent of
each type of natural
habitat eventually
remains . . . around 50
percent of all species
are projected to
survive.
nomic thinking, a meeting of biologicaland economic mindsets, argues that theglobal economy, swelled by populationgrowth and increasing per capita con-sumption, has grown so large, sodemanding and technologically capable,that virtually nothing can escape it.
As economist Herman Daly andethicist John Cobb have observed, “nat-ural selection is giving way…to eco-nomic selection.”17 What is not recog-nized as a valuable service in the mar-ketplace, or is not valued by regulationand enforced protection, will ultimatelybe traded for or substituted with some-thing afforded a higher value. This call-to-arms has prompted several estimatesof nature’s values. According to onerecent study by biologist David Pimenteland colleagues, biodiversity contributesannually about $2.9 trillion in goods andservices to global human welfare.18
Perhaps a more instructive way toask the thorny question—What is biodi-versity worth?—is to imagine thatnature’s business is mediated by agroup of environmental trustees. For aprice, the trustees dispense biodiversi-ty’s services, and with their returns theymaintain and invest to promote thoseservices.19 How much could they charge?And which aspects of nature would wewillingly pay to maintain and protect?For which would we settle for poor sub-stitutes, and which might we let slipaway forever, never knowing their valueto our descendants? These will be criti-cal questions for coming human genera-tions.

19
Na
tu
re
’s
Pla
ce
References1. J.B. Hughes and others, Science 278 (1997): 689-692.2. IUCN, IUCN Bulletin 23, 2 (1992): 10-11.3. World Conservation Monitoring Centre, in World Resources, 1998-99
(Washington, DC: World Resources Institute, 1998), Table 14.1. 4. S.L. Pimm and others, Science 269 (1995): 347-350; E.O. Wilson, The
Diversity of Life (Cambridge: Harvard Univ. Press, 1992).
Most projections of future extinctionsare derived from trends of habitatloss. Over decades of field research,
ecologists have shown that the relationshipbetween habitat loss and eventual declinein species numbers, for most groups oforganisms, follows a distinct pattern. [SeeAppendix 1c for the equation describing therelationship.] Presently, many ecologistsbelieve that, if present rates of deforesta-tion and wetland drainage continue, onlybetween 5 and 10 percent of all species-richhabitats is likely to be saved. From thegraphed relationship between species andhabitat area, it is possible to deduce thatlosing 90 percent of habitat would likelyresult in a loss of around 50 percent of theoriginal species.
Besides their value in predicting biodi-versity loss, species-area curves—as they arecalled—tell an important story about extinc-tion. The curve [see figure] predicts that asthe first bits of original habitat are lost,species disappear slowly. The first to dropout are the habitat specialists—species withvery specific habitat requirements and just afew breeding populations. Even more rapidspecies loss, however, occurs after habitatarea has been reduced to its last 25 percent.By then most species are vulnerable, havingdwindled to just a few breeding populations.Further shrinkage of habitat tends to result,eventually, in dramatic losses of species.
Using the species–area relationship alsohas its drawbacks. For example, it focusespolicymakers’ attentions narrowly on habitat
scarcity and species numbers, overlookingthe fact that breeding populations arebeing eliminated at all stages of habitatloss. Losing breeding populations whittlesaway at species’ genetic variability andtheir capacity for survival.1 Neither doesthe species–area relationship adequatelycapture the importance of habitat inter-connectedness and habitat quality. As arule, habitats that are fragmented—brokeninto small pieces with barriers to move-ment in between—can maintain fewerspecies, while large interconnected habi-tats in good condition can be expected toretain several more species than the curvemight predict.
In 1992, national delegates to IUCN’sFourth World Congress on National Parksand Protected Areas agreed to a non-bind-ing goal of protecting 10 percent of eachmajor habitat type by the year 2000.2
While some countries have taken this goalseriously, still less than one-third haveprotected 10 percent of their land surface.3
Currently, experts consider saving 10 per-cent of each habitat type to be an opti-mistic expectation, and yet far less habitatthan is needed.4
Most ecologists would want to save atleast 25 percent of each major habitattype. And that hope has nearly been real-ized in Costa Rica, where government lookstoward the country’s innate biological rich-ness both as a valuable economic resourceand as an important aspect of nationalidentity.
As habitat declines greater proportions of species living within those habitatstend to become extinct. Research over three decades has shown species-areacurves to be reliable predictors of declines in species numbers when habitat areais lost. The curves for most groups of species that have been studied tend to passthrough the region in the graph bounded by the two blue lines. For example,when only 10 percent of the original habitat remains (vertical line), scientistsexpect between 45 percent to 70 percent of the species to remain. And whileIUCN’s goal to help secure protection for 10 percent of each natural ecosystem islaudable, it is clear that meeting this benchmark will not be enough to avoid sig-nificant losses of native species. Source: Adapted from A.P. Dobson, 1996.
10%
20%
30%
40%
50%
60%
70%
80%
90%
100%
| 100%
| 90%
| 80%
| 70%
| 60%
| 50%
| 40%
| 30%
| 20%
| 10%
| 0%
H A B I T A T R E M A I N I N G
SP
EC
IE
S R
EM
AI
NI
NG
IUCN YEAR 2000 GOAL FOR
PROTECTED AREA
SPECIES LOSS
The two lines represent the lower and upper ranges of species lossfor various species as habitat declines.
0%
Species Numbers and Habitat Area
FIGURE 4Relating Habitat Area to Species Numbers

20
Po
pu
lat
ion
A
ct
ion
I
nt
er
na
tio
na
l
Plant life has provided modern medicine with some of its most important pharmaceutical products. More than half of today’sprescription drugs are synthesized products modeled on naturally occurring compounds. In the United States, one-quarter ofall prescriptions contains active ingredients obtained directly from plants, or chemically modified from plant compounds. By
the mid-1980s, the annual commercial trade in plant-derived drugs exceeded $40 billion worldwide.1
In terms of human welfare, the potential value of plant diversity is incalculable. For example, several decades ago researchersidentified two valuable alkaloids in the Madagascar periwinkle that suppress white blood cell production in humans. One, vinblas-tine, is used in treating Hodgkin’s disease, the other, vincristine, in treating childhood leukemia.2
Unfortunately, we are evidently losing other life-saving medicinal plants before they have been catalogued and assayed.According to the IUCN, almost 34,000 out of an estimated 270,000 known species of vascular plants are threatened with globalextinction. The proportion of threatened plant species is even higher in the United States, where almost three in ten of the coun-try’s 16,000 plant species risk extinction.3 The growth of human population, its mobility, and the nature and intensity of its activ-ities are major factors in this risk.
It is no coincidence that plants hold so many compounds of therapeutic value to our own species. Humanity has simply appro-priated chemicals from a genetically distant group of organisms, species whose immune systems are the products of successiveadaptations to disease after disease over many millions of years.
Biologists expect to find these cumulative effects. Their presence is consistent with the Red Queen hypothesis,4 an acceptedevolutionary theory named after a character in Lewis Carroll’s Through the Looking Glass. In the Red Queen’s world “it takes all therunning you can do, to keep in the same place.”5 Similarly, in order simply to maintain their competitiveness in ecological commu-nities, plant species have evolved and accumulated chemical defenses to ward off attacks by bacteria, viruses and a range of otherpathogens, parasites and predators—which themselves keep evolving, too, as if locked into a deadly biochemical arms race.
Plant chemical diversity—the Red Queen’s dowry—is precious. But the repercussions of unprecedented growth and mobility ofhuman populations have already narrowed plant genetic variability dramatically. Paradoxically, these same two human populationvariables—growth and mobility—are known to promote the transmission of emerging infectious diseases.6 We appear to be squan-dering the Red Queen’s dowry, at a time when we need it most.
References1. P.P. Principe, in Economic and Medicinal Plant Research, ed. H. Wagner and others, Vol. 3 (London: Academic Press, 1989), 1-17; C. Suplee, “1 in 8
Plants in Global Study Threatened: 20-year Project Warns of Major Diversity Loss,” The Washington Post, April 9, 1998, A8.2. J. Tuxhill, World Watch Paper, 141 (Washington, DC: Worldwatch Institute, 1998).3. IUCN Red List of Threatened Plants (Gland: IUCN, 1998). 4. L. Van Valen, Evolutionary Theory 1 (1973): 1-30. 5. L. Carroll, Lewis Carroll’s Through the Looking Glass, and What Alice Found There (Berkeley: Univ. of California, 1983; first published in 1872).6. S.J. Olshansky and others, Population Bulletin 52, 2 (1997).
Squandering the Red Queen’s Dowry

21
Na
tu
re
’s
Pla
ce
M.L. Reaka-Kudla, D.E. Wilson, and E.O.Wilson (Washington, DC: Joseph HenryPress, 1997), 41-68.
8. D.M. Raup, “Extinction: Bad Genes or BadLuck?,” New Scientist 14, Sept. (1991): 46-49.
9. M.L. Reaka-Kudla, “The Global Biodiversityof Coral Reefs: A Comparison With RainForests,” in Biodiversity II: Understandingand Protecting Our Biological Resources, 1997,83-108, p. 88.
10. T.E. Lovejoy, “Biodiversity: What Is It?,” inBiodiversity II: Understanding and ProtectingOur Biological Resources, 1997, 7-14.
11. S.L. Pimm, G.J. Russell, J.L. Gittleman, andT.M. Brooks, “The Future of Biodiversity,”Science 269 (1995): 347-350.
12. N. Myers, The Sinking Ark: A New Look atthe Problem of Disappearing Species (NewYork: Pergamon, 1979); W.V. Reid, “TropicalDeforestation and Species Extinction,” inHow Many Species Will There Be?, ed. T.C.Whitmore and J.A. Sayer (London: Chapman& Hall, 1992), 55-73; P.H. Raven, “OurDiminishing Tropical Forests,” in Biodiversity,ed. E.O. Wilson and F.M. Peters(Washington, DC: National Academy Press,1988), 119-122.
13. P.H. Raven, “The Politics of PreservingBiodiversity,” BioScience 40, 10 (1990): 769-774.
14. N. Myers, “The Biodiversity Crisis and theFuture of Evolution,” The Environmentalist16 (1996): 37-47; E.O. Wilson, The Diversityof Life (Cambridge: Harvard Univ. Press,1992), p. 330.
15. R. Costanza and others, “The Value of theWorld’s Ecosystem Services and NaturalCapital,” Nature 387, 15 May (1997): 253-259; T.E. Lovejoy and G.M. Milne, “GeneticResources, National Interests and Security,”in Environmental Change and SecurityProject, no. 3, ed. P.J. Simmons (Washington,DC: Woodrow Wilson Center, 1997), 174-179;D.I. Stern, “Limits to Substitution andIrreversibility in Production andConsumption: A Neoclassical Interpretationof Ecological Economics,” EcologicalEconomics 21 (1997): 197-215; P.R. Ehrlich
References 1. P.M. Vitousek, “Biological Invasions and
Ecosystem Properties: Can Species Make aDifference,” in Ecology of Biological Invasionsof North America and Hawaii, ed. H.A.Mooney and J.A. Drake (New York: Springer-Verlag, 1986); Office of TechnologyAssessment, “Harmful Non-IndigenousSpecies in the United States,” OTA-F-565(Washington, DC: U.S. Congress, 1993).
2. D. Pimentel, L. Lach, R. Zuniga, and D.Morrison, “Environmental and EconomicCosts Associated with Non-indigenousSpecies in the United States,” Paper at theAmerican Association for the Advancement ofScience Annual Meeting, Anaheim, CA, Jan.24, 1999.
3. S.L. Pimm, The Balance of Nature? EcologicalIssues in the Conservation of Species andCommunities (Chicago: Univ. of ChicagoPress, 1991); D. Tilman and S. Pacala, “TheMaintenance of Species Richness in PlantCommunities,” in Species Diversity inEcological Communities, ed. R.E. Ricklefs andD. Schluter (Chicago: Univ. of Chicago Press,1993), 13-25; D. Tilman, “Biodiversity:Population Versus Ecosystem Stability,”Ecology 77 (1996): 350-363.
4. M. Williamson, Biological Invasions (London:Chapman and Hall, 1996).
5. C. Bright, Life Out of Bounds: Bioinvasion ina Borderless World (Washington, DC:Worldwatch, 1998).
6. K.G. Gaston and L.A. Mound, “Taxonomy,Hypothesis Testing and the BiodiversityCrisis,” Philosophical Transactions of theRoyal Society of London, B 251 (1993): 139-142.
7. N.E. Stork, “How Many Species Are There?,”Biodiversity Conservation 2 (1993): 215-232;R.M. May, “How Many Species are There onEarth?,” Science 241 (1988): 1441-1449; P.M.Hammond, “Species Inventory,” in GlobalBiodiversity: Status of the Earth’s LivingResources, ed. B. Groombridge (London:Chapman and Hall, 1992), 17-39; N.E. Stork,“Measuring Global Biodiversity and ItsDecline,” in Biodiversity II: Understandingand Protecting Our Biological Resources, ed.
and A.H. Ehrlich, Extinction: the Causesand Consequences of the Disappearance ofSpecies (New York: Random House, 1981);G.C. Daily, ed. Nature’s Services: SocietalDependence on Natural Ecosystems(Washington, DC: Island Press, 1997).
16. R. Leakey and R. Lewin, The SixthExtinction (New York: Doubleday, 1995);E.O. Wilson, Biophilia (Cambridge:Harvard Univ. Press, 1986).
17. H.E. Daly and J.B. Cobb, For the CommonGood: Redirecting the Economy TowardCommunity, the Environment and aSustainable Future (Boston: Beacon Press,1989), p. 204.
18. D. Pimentel and others, “Economic andEnvironmental Benefits of Biodiversity,”Bioscience 47, 11 (1997): 747-757.
19. R.U. Ayres, “The Price-Value Paradox,”Ecological Economics 25, 1 (1998): 17-19.
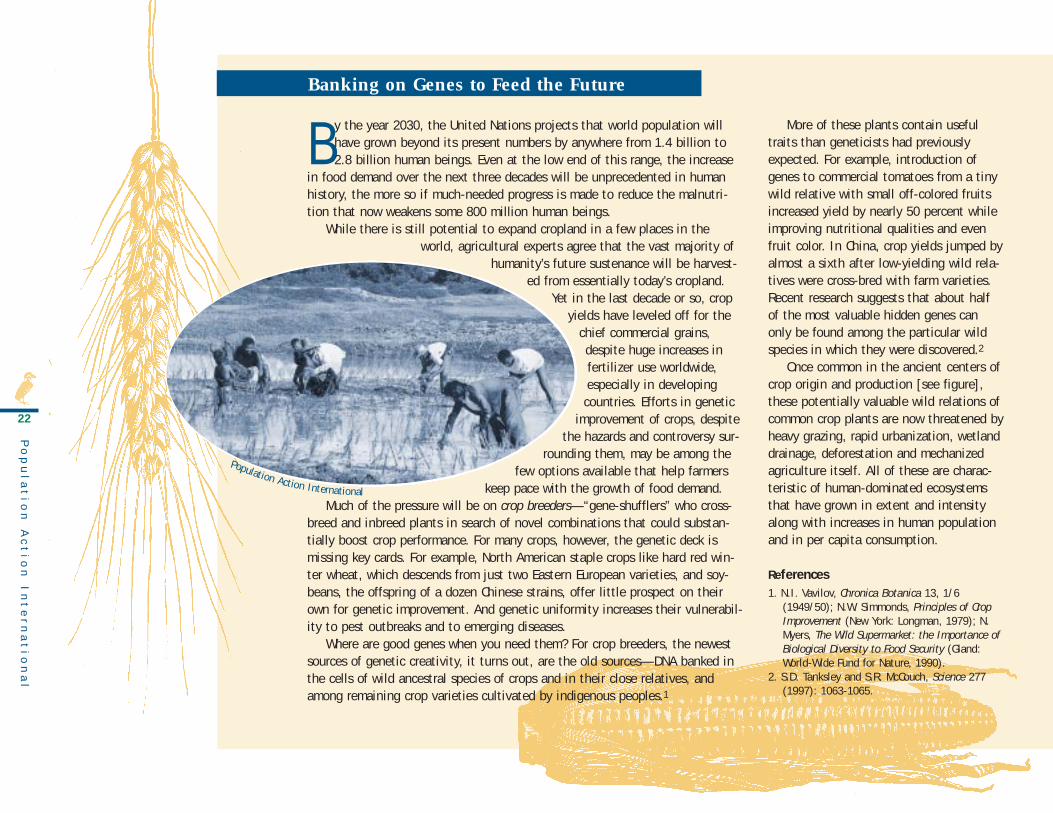
By the year 2030, the United Nations projects that world population willhave grown beyond its present numbers by anywhere from 1.4 billion to2.8 billion human beings. Even at the low end of this range, the increase
in food demand over the next three decades will be unprecedented in humanhistory, the more so if much-needed progress is made to reduce the malnutri-tion that now weakens some 800 million human beings.
While there is still potential to expand cropland in a few places in theworld, agricultural experts agree that the vast majority of
humanity’s future sustenance will be harvest-ed from essentially today’s cropland.
Yet in the last decade or so, cropyields have leveled off for the
chief commercial grains,despite huge increases infertilizer use worldwide,especially in developingcountries. Efforts in genetic
improvement of crops, despitethe hazards and controversy sur-
rounding them, may be among thefew options available that help farmers
keep pace with the growth of food demand.Much of the pressure will be on crop breeders—“gene-shufflers” who cross-
breed and inbreed plants in search of novel combinations that could substan-tially boost crop performance. For many crops, however, the genetic deck ismissing key cards. For example, North American staple crops like hard red win-ter wheat, which descends from just two Eastern European varieties, and soy-beans, the offspring of a dozen Chinese strains, offer little prospect on theirown for genetic improvement. And genetic uniformity increases their vulnerabil-ity to pest outbreaks and to emerging diseases.
Where are good genes when you need them? For crop breeders, the newestsources of genetic creativity, it turns out, are the old sources—DNA banked inthe cells of wild ancestral species of crops and in their close relatives, andamong remaining crop varieties cultivated by indigenous peoples.1
More of these plants contain usefultraits than geneticists had previouslyexpected. For example, introduction ofgenes to commercial tomatoes from a tinywild relative with small off-colored fruitsincreased yield by nearly 50 percent whileimproving nutritional qualities and evenfruit color. In China, crop yields jumped byalmost a sixth after low-yielding wild rela-tives were cross-bred with farm varieties.Recent research suggests that about halfof the most valuable hidden genes canonly be found among the particular wildspecies in which they were discovered.2
Once common in the ancient centers ofcrop origin and production [see figure],these potentially valuable wild relations ofcommon crop plants are now threatened byheavy grazing, rapid urbanization, wetlanddrainage, deforestation and mechanizedagriculture itself. All of these are charac-teristic of human-dominated ecosystemsthat have grown in extent and intensityalong with increases in human populationand in per capita consumption.
References1. N.I. Vavilov, Chronica Botanica 13, 1/6
(1949/50); N.W. Simmonds, Principles of CropImprovement (New York: Longman, 1979); N.Myers, The Wild Supermarket: the Importance ofBiological Diversity to Food Security (Gland:World-Wide Fund for Nature, 1990).
2. S.D. Tanksley and S.R. McCouch, Science 277(1997): 1063-1065.
22
Po
pu
lat
ion
A
ct
ion
I
nt
er
na
tio
na
l
Banking on Genes to Feed the Future
Population Action International

23
Na
tu
re
’s
Pla
ce
The potential hidden among wild gene pools and crop varieties used in subsistence farming first came to scientific attentionthrough the work of Russian botanist Nikolai Vavilov in the late 1930s. With his students, Vavilov first mapped the original geo-graphic centers of major domestic crops, a system which now bears his name—the Vavilov centers of crop origin. Most of thesecenters of origin overlap areas of dense or rapidly growing human population. Source: Adapted from N. Myers, 1990.
Almond GarlicApple OnionCarrot RhubarbCommon grape SpinachCucumber
EUROPEAN SIBERIAN REGIONCattle LettuceChicory LicoriceGooseberry PearKale Watercress
Asparagus Globe artichokeBroad bean MintCabbage OatCauliflower ParsnipCelery Sugar beetCommon grape
BELGIUMBrussel sprout
NORTH AFRICACattle Marjoram
Alfalfa PeaBarley PigCabbage PlumEincorn Wheat RyeFig ShallotGoat SheepHazelnut Spelt wheatLeek Sugar beetLentil Sweet cherry
Black-eye pea Finger milletBread wheat MustardCastor bean OkraCoffee Pearl milletCowpea SorghumDate palm Yam
Central AsiaBuckwheat RadishChive SoybeanFoxtail millet Sweet orangeGinseng TeaLitchi TurnipMulberry Water chestnutPeach
East Asia
CranberryJerusalem artichokeMuscadine grapeSunflower
North America
Cashew ManiocCayenne PepperCocoa PineappleGroundnut/ Potato peanut PumpkinLima bean
Andes/South America
Avocado Sweet potatoCommon bean TomatoMaize/Corn Tabasco pepperPapaya VanillaPecan
CARIBBEANGrapefruit
Mexico/Central America
Mediterranean
Near East
Horn of AfricaBlack pepper LimeBreadfruit MangoCardamon Moth beanChicken RiceChickpea SafflowerCitron SesameDwarf wheat
India/Indo-Malaya
Apricot Indian almondBanana LemonCinnamon & Mung bean Cassia Sugar caneClove TangerineCoconut palmEggplant
Southeast Asia
Centers of Crop and Livestock Origin
FIGURE 5

The results of extensive archaeological andpaleontological research over the past fourdecades leave little doubt that prehistorichuman hunting of large mammals and flight-less birds, as well as some early disturbanceof habitat and importation of exotic species,have actually shaped most of the world’smodern-day communities of species. Theassemblages of wild animals that childrenlearn so quickly to identify are in fact a pro-foundly diminished inheritance, a pale shad-ow of the far richer fauna that early humanityencountered as it first spread from Africa tothe far ends of the globe.
The First Wave: Losing the Big Ones For nearly a century, scientists believed thatclimate warming was solely to blame for thePleistocene extinctions. But by the mid-1960s,paleontologist Paul Martin and colleagues hadpieced together enough archaeological andfossil evidence to show convincingly that thedemise of populations of large animals (whichbiologists call megafauna) followed closelythe migration of human hunters who, about12,000 years ago, crossed the Bering Straitsfrom Asia into North America on a landbridge linking the two continents.
In just a thousand years, North America
Human-caused extinction has a longhistory, predating our demographicand technological dominion over theearth. There is evidence that humanhunters played a role in extinctions
as far back as 10,000 years ago, and perhapseven 50,000 years before the present.2,3 Backthen, during the late Pleistocene Epoch, theremay have been only 5 million humans,equipped with primitive technologies—a farcry from the 6 billion of our species thatinhabit today’s high-tech world.
[We] live in a zoologically
impoverished world, from which
all the hugest, and fiercest, and
strangest forms have recently
disappeared.1
Alfred Russel Wallace, 1876
Naturalist and evolutionary biologist
24
Po
pu
lat
ion
A
ct
ion
I
nt
er
na
tio
na
l
II. Four Waves of Human Influence
The Great Auk (Pinguinus impennis) in a woodcut by Danish artist Johannes Larsen (1867-1961),based on a stuffed specimen. By 1844 the Great Auk was extinct.

25
Na
tu
re
’s
Pla
ce
colorful paintings of large mammals andhuman hunters—most more than 14,000years old, at Vallon-Pont-d’Arc at least31,000 years old7—foretell the dawningof human art and civilization. But for thegreat herds that then roamed theMediterranean Basin and the Eurasianforests and steppes, the paintings fore-shadow the dusk of their existence.
The Second Wave: Island Bird ExtinctionsWhen the first human visitors to NewZealand landed on its shores about athousand years ago, they encountered a
lost at least 57 species of largemammals4—73 percent of all large ani-mals on the continent. These includedtypes of horses and camels, giant sloths,glyptodonts (looking like giant armadil-los), mammoths and mastodons. Theirremains line the flooring and garbage pitsof Pleistocene human settlements.5
Because these were the largest ani-mals, they were also slowest to reproduceand mature, and thus needed the longestrecovery periods to survive frequenthunting. And because these species hadevolved without humans, they may nothave become wary in time to survive.Predators and scavengers—such as direwolves, lions and an assorted array ofcarrion feeders—that relied on these graz-ing and browsing species for their food dis-appeared along with them, in a tumul-tuous re-shuffling of the food chain. Whenhumans crossed into South America, thescenario was replayed. About 80 percentof that continent’s large mammals suc-cumbed to extinction.2
While some researchers dispute Martin’smegafaunal-overkill hypothesis, holdingon to the climate-change hypothesis asthe probable cause for North AmericanPleistocene extinctions, most biologiststoday accept that humans played a pivotalrole in the extinctions. Without the humaninfluence, this shift to a warmer, morearid climate would probably not, by itself,have caused such ponderous losses tobiodiversity. These same assemblages oflarge animals had survived roughly 27previous ice ages with several warmingshifts before and after each one.2
Homo sapiens’ arrival on the Australian
continent some 50,000 years ago had aneven more dramatic impact than did ourarrival in the Americas. Australia lost 86percent of its marsupial mammals, includ-ing several giant kangaroos, as well asmarsupials resembling rhinoceros, tapirs,and ground sloths, plus a couple monotremes(egg-laying mammals) and a lizard largerthan any alive today. Out of at least 48highly varied large land animals, onlyfour kangaroo species survive today.6
In Eurasia, Pleistocene losses wereroughly comparable to those in NorthAmerica. On the walls of caves in north-ern Spain and in the Dordogne River val-ley of southwestern France, wondrously
Source: Adapted from J. Diamond, 1992.
AFRICA
ALASKA
Homo sapiensy.a. = years ago
SIBERIA20,000 y.a.
MADAGASCAR1,500 y.a.
HAWAII1,500 y.a.
AUSTRALIA50,000 y.a.
SOLOMONS30,000 y.a.
12,000 y.a.
11,000 y.a.
THEAMERICAS
FIJI3,600 y.a.
NEW ZEALAND1,000 y.a.
EUROPE50,000y.a.
100 •
50 •
0 • •100,000
•10,000
•1,000
•100
MADAGASCAR –NEW ZEALAND
100 •
50 •
0 •
NORTHAMERICA
100 •
50 •
0 •
AUSTRALIA
100 •
50 •
0 •
AFRICA
%
YEARS AGO
Large animal species have suffered extinctions that coincide with the presence of modern humans. The left-hand figure shows the percentsurvival of large animal species on three continents and two large islands.
Human Colonization and Associated Species Loss
FIGURE 6
Source: P.S. Martin, 1984.

26
Po
pu
lat
ion
A
ct
ion
I
nt
er
na
tio
na
l
winnowing fastest on isolated islands andin lakes, the present wave of extinction isrunning its course throughout the vastcontinents, on coral reefs and in the greatoceans as well.
There is another difference. Thosespecies extinguished during the first andsecond waves of disruption owed theirdemise largely to innate vulnerabilities,namely to slow reproductive rates, flight-lessness or their existence in small, isolat-ed breeding populations. Most of today’sthreatened species were not innately vul-nerable, but were made so by humanactivity. Only recently were these speciesreduced to small, isolated breeding popula-tions whose reproductive potential is sup-pressed by degraded habitat and pollution—and thus assume aspects of the vulnerabili-ties exhibited by the large mammals andisland birds that disappeared before them.
Already IUCN-World ConservationUnion estimates that about one-quarter ofall the world’s mammals and more than atenth of its remaining birds are at a highrisk of extinction. One-fifth of all reptilespecies, a quarter of all amphibians, and asmuch as 34 percent of all fishes, mostlyfreshwater species, are in similar jeopardy.And these proportions refer only to speciesalready described by science. In the lessstudied taxonomic groupings, IUCN esti-mates that more than 500 insect species,400 crustaceans, and 900 mollusks arethreatened as well.11 Among plants, aboutan eighth of the world’s flowering species ison the edge of survival.12
Moreover, time scales for human-caused extinction have shortened. WhereasPleistocene mammals withstood several
diverse array of moderate to large-sizedanimal species well-adapted to a varietyof local ecosystems, just as on the conti-nents. There were large grazers andbrowsers, predators and scavengers. But,quite unlike the animals of the conti-nents, these creatures were all birds. Bythe time that Captain Cook circumnavi-gated New Zealand in 1769, the 50 tribesthat are now collectively called the Maorihad grown to over 100,000 people, butscarcely a trace of the wondrous birdsremained.
By the mid-19th century, archeolo-gists in New Zealand were publishingdiscoveries of bones of several species oflarge flightless birds—called moa inMaori oral tradition—which passed intoextinction prior to European settlement.8
There were 13 species in all. One is esti-mated to have grown as large as 250 kilo-grams (550 pounds).
The evidence—over a half million moaskeletons linked with ancient Maori settle-ments—has led scientists to conclude thathuman hunters pushed the moas toextinction. The hunters were equippedwith nothing more than Stone Age hunt-ing technology and abetted by the wide-spread disturbance created by the pigs,dogs and rats that they had introduced toNew Zealand. Archaeology suggests thatthe Maori depended heavily on the moafor food, clothing and ritual items. Evenmoa eggs were blown out and used aswater vessels.9
What happened in New Zealandplayed out as well in various forms onMadagascar and Cyprus, in the Azoresand on the Caribbean islands. Wherever
flightless or weakly flying bird speciesevolved, and whenever these species wererestricted to a few breeding populations,most disappeared within a few centuriesafter humans arrived on the scene. In thePacific Ocean, this occurred on each ofnearly 800 smaller islands to the northand east of New Zealand. In fact, archae-ologists have yet to uncover fossil evi-dence of bird extinction in the SouthPacific during the long period beforehuman contact.
Polynesian settlement alone eventuallyled, estimating conservatively, to theextinction of more than 1,000 oceanic-island bird species—though estimates goas high as 2,000 lost species. Thus, extinc-tion claimed between one and two birdspecies in every ten then alive on Earth.10
The Ongoing Third Wave After reading of the already staggeringtoll of human-caused extinctions, onewell might wonder, “what group will benext, and why?” Fair questions, for mostof the plant and animal species threat-ened with extinction today coexisted withhumans for tens of thousands of years.Many were regularly hunted and harvest-ed. And until between 50 and 100 yearsago, most were surviving in good order.
The ongoing third wave of human-caused disruption to biodiversity is funda-mentally different from its predecessors.Today, breeding populations are disappear-ing from species of all evolutionary formsand sizes, from the largest trees to the tini-est soil microbes. And they are disappear-ing from all regions and habitats. Though
The ongoing third wave of
human-caused disruption
to biodiversity is
fundamentally different
from its predecessors.

27
Na
tu
re
’s
Pla
ce
Ever since the voyages of CharlesDarwin and Alfred Russel Wallaceover 150 years ago, islands have
fascinated evolutionary biologists,and for good reasons. Oceanic islands
have been hotbeds of both speciation(the formation of new species) and
recent extinction. For example, before thearrival of humans some 90 percent of the original
plant species and all of the native terrestrial birds of theHawaiian Islands were endemic—completely unique to these islands, having evolvedfrom just a few species that landed there over the past several million years.Following the original Polynesian settlement, during which pigs and rats were intro-duced, the Hawaiian Islands lost roughly half of their endemic bird species. Since1778, when Captain Cook first visited their shores, the islands have lost an additional18 bird species and the fate of another 12 Hawaiian birds hangs in the balance. Outof the 980 native plants identified in early collections, 84 are now extinct, and 133are represented by less than 100 individuals in the wild.1
As it turns out, repeated studies of island species, principally of birds, confirmthat species confined solely to small, isolated islands face high risks of extinction.This lesson from island ecology has even greater significance for 21st century conser-vation. Natural habitats, where they exist as reserves and national parks, are nowmostly small habitat islands, isolated from one another by a sea of human settlementand activity. As farms have intensified, suburbs grown, road networks expanded andvehicular traffic increased—each related in some large or small way to continued pop-ulation growth—habitat area has diminished and successful movements of organismsbetween protected habitats has become less and less likely. What were once vulnera-bilities associated primarily with fragile oceanic island species, are now characteristicsof numerous species on the continents.2
References 1. C. Mlot, Science 269 (1995): 322-323.2. R.H. MacArthur and E.O. Wilson, The Theory of Island Biogeography (Princeton: Princeton Univ.
Press, 1967), p. 3-4; M.E. Soulé and B.A. Wilcox, eds. Conservation Biology (Sunderland, MA:Sinauer, 1978); H. Remmert, ed. Minimum Animal Populations, Ecological Studies, 106 (Berlin:Springer-Verlag, 1994).
Once stopovers for grazing animals migrating throughEast Africa’s Rift Valley, Tanzania’s Serengeti National Parkand Kenya’s Maasai Mara have become, over the past 50years, isolated by agricultural settlement. Isolation couldincrease the vulnerability of wildlife populations to peri-odic drought, promote inbreeding among some species,and intensify interactions between wildlife, agricultureand surrounding people. To maintain the Serengeti’s mixof plant and animal species under conditions of increas-ing population density will likely demand greater effortsand financial resources. And much of the funding neededwill probably have to come from abroad.
Source: R.S. Reid and others, 1999.
Islands of Nature: Population Growth and the Isolation of Protected Areas
FIGURE 7The Nature of Islands
LakeVictoria
LakeVictoria
UGANDA KENYA
TANZANIA
SerengetiNational Park
Maasai MaraNational Park
1960
UGANDA
KENYA
TANZANIA
2000
0–5
5–50
More than 50
Population Density(people per squarekilometer)
Sally Ethelston

28
Po
pu
lat
ion
A
ct
ion
I
nt
er
na
tio
na
l
tural wastes. The toxic microbe Pfiesteriais just one example. Observed bloomingin higher than normal marine concentra-tions of nitrogen and phosphorous,Pfiesteria has been responsible for mas-sive fish kills in coastal waterways in theUnited States several times in the1990s.18
Some higher animals have made cleverbehavioral adjustments. Among these isthe black kite, a Southeast Asian hawkand successful urban predator that hasbecome as adept at snatching sandwichesfrom lunching students as it is at pluckingrodents from rooftops. The chimney swift,a small insect-eating bird native to NorthAmerica, today builds its nest on theinner walls of chimneys rather than insidethe dead, hollowed-out trees that wereonce a ubiquitous feature of the northernhardwood forest. And troops of Hanumanlangurs, a South Asian primate, reside intrain stations and in temples and fre-quently migrate with religious pilgrims.
Many of the organisms finding suchsuccess are not so harmless. A significantnumber are economic pests, such asweeds, house rodents and crop-eatinginsects. Some spread disease. And othersdirectly cause infectious diseases uponwhich billions of dollars are spent annual-ly for control and eradication. Whatevertheir habits and genetic origins, thesespecies are wonders of rapid adaptation,organisms that have become hugely suc-cessful by integrating themselves into rel-atively homogenous and nutrient-richhuman-dominated ecosystems.19
These make up what might be calledthe fourth wave of human-caused disrup-
thousand years of hunting, and manyisland birds survived several centuries ofharvests, species now can pass from hardy,viable populations to the threshold ofextinction in a matter of decades.
The roots of current extinctions actuallygo back 6,000 to 10,000 years, to a timewhen the habits of human hunter-gather-ers were going through change. Pressuredby the upward momentum of its ownnumbers and a related scarcity of gameanimals, Homo sapiens turned to domesti-cating plant and animal species, graduallytook to farming and livestock raising, andforged a new relationship with Earth’secosystems.13 Using fire and primitivetools, humans learned to purposefullyshape the course of natural events, andthen, slowly at first, to radically refashionentire ecosystems—to create what scien-tists now call human-dominated ecosys-tems. Today these ecosystems appear as ahighly varied set of landscapes, from swid-den farming to dense metropolitan centers,each intended to meet the needs anddesigns of members of our own species,generally at the expense of the needs ofwild species.
On top of that, our extraordinarymobility facilitated the transport of exoticplants, animals and diseases, transfiguringpreviously isolated ecosystems. It is thesechanges—and the limited capacity oftoday’s species to adapt to them—that areat the crux of recent and pending extinc-tions. And these changes, though motivat-ed by a complex mix of factors, are clearlywrit large by population growth.
How far have these trends gone? Wellover 70 percent of Earth’s habitable terres-
trial surface is fully or partially disturbedby agriculture, natural resource use orconstruction.14 Humans now claim fortheir own use around 40 percent of eachyear’s terrestrial net primary productivi-ty—the total organic material produced byphotosynthetic plants on land.15 Nearlyfour-fifths of all native forests that coveredour planet at the close of the last ice agehas been cleared, fragmented, modified ordegraded,16 and half of that cover hascompletely disappeared. At least 10 per-cent of the world’s coral reefs are severelydegraded. Another 30 percent are consid-ered in a “critical state,” and thus likely tobe lost within the next two decades.17
Clearly the additions to human popu-lation projected for at least the next half-century will require further appropriationof Earth’s ecosystems. Such growth, cou-pled with expected growth of consump-tion and further globalization of tradeand much-needed improvements in theliving standards of the world’s poor, isbound to put at further risk much of theworld’s remaining biodiversity.
The Fourth Wave: Nature Altered Many species will surely survive us.Some are becoming more numerous andeven extending their ranges. This is espe-cially true of biologically invading speciestransplanted beyond the reach of com-petitors, predators and diseases that onceconstrained them. Other species, adaptedto nutrient-rich conditions that were pre-viously rare, are also spreading, thanks toa profusion of fertile urban and agricul-
. . . the fourth wave of
human-caused disruption
of biodiversity is a wave
of proliferation rather
than extinction, involving
a small minority of
species whose success is
intimately tied to
our own.

29
Na
tu
re
’s
Pla
ce
these are small organisms that repro-duce prolifically, and mutate frequent-ly. Their recent evolutionary accom-plishments—including bacterial resist-ance to antibiotics, malarial resistanceto quinine-like drugs, and adaptationsof crop-eating insects to chemical pesti-cides—have diminished the signifi-cance of many of humanity’s earlierachievements in biochemistry andmedicine.22
Scientists see no end to this evolu-
tion of biodiversity—a wave of prolifera-tion rather than extinction, involving asmall minority of species whose successis intimately tied to our own. Amongthem are a virtual handful of domesticat-ed plants and animals that, according tosome biologists, could be considered thebiggest evolutionary winners in the raceto keep pace with human-caused globalchange.
The demographic success of domesti-cated species parallels our own [see figure8]. As our fortunes—and our popula-tions—increase, so do theirs. Along withtheir numbers, their demands for energy,nutrition, space and waste disposal growapace. In the United States alone, live-stock produce more than 900 million met-ric tons of manure every year, over 4.5tons of manure for every person. The U.S.Fish and Wildlife Service identifies live-stock waste as the principal pollutant of1,785 bodies of water in 39 U.S. states.21
How many other species are accli-mated or have become acclimated tosome type of human-dominated ecosys-tem through genetic change or learning?There appear to be no scientifically-determined estimates. For Europe andNorth America, a survey by PopulationAction International of published guide-books to flowering plants, birds andmammals suggests that between oneand two in every 20 of these larger, well-studied species is now associated withfarmland, suburban areas and otherhuman-dominated ecosystems [seeAppendix 1e], although some of thesespecies are declining because of pesti-cides and changes in farming methods.
In tropical rainforests that harbor manyspecialized and interdependent organ-isms, the number of species likely toadjust to fully human-dominated ecosys-tems probably make up a far smallerportion of the total number.
For smaller species, there is muchless information. How many fourth-waveorganisms are insects and other inverte-brates? How many are fungi, bacteria,viruses and other microbes? If evolutionhas its way, there could be many, for
The growth in livestock, shown above by their accumulated body weights, haskept pace with human population growth. Increases in disposable income glob-ally are likely to step-up growth among these few species, and thus increaselivestock waste discharge and other environmental changes these species pro-mote.
Source: Livestock numbers from FAO-STAT, 1998; other sources and assump-tions, see Appendix 1d.
0
100
200
300
400
500
600
Human
Livestock
19951990198519801975197019651960
Y E A R
BO
DY
WE
IG
HT
(mill
ions
of
met
ric
tons
)
Domesticated Demographics: the Growth of Livestock Populations
FIGURE 8

30
Po
pu
lat
ion
A
ct
ion
I
nt
er
na
tio
na
l
The global environmental change the earth went through 10,000 yearsago was quite literally epoch-making. Geologists define that time as aboundary that ended the 2-million-year-long Pleistocene epoch and
launched the Holocene in which we live today. Within a thousand years ofthe Pleistocene-Holocene boundary, ocean temperatures warmed. Shellfish
on the ocean floor shifted their distribu-tions. Atmospheric carbon dioxide leveledoff at roughly 280 parts per million, whereit remained until the Industrial Revolution.
On land, average temperatures rose by2.3 degrees Celsius. The massive glaciersthat had spread into the mid-latitudes andacross the continents over the preceding40,000 years began to melt away slowly.And as they did, the great majority of largemammals vanished from North and SouthAmerica—a process to which humans sure-ly contributed.1
Today it is increasingly obvious thatour species is responsible for fundamentalchanges to Earth’s surface that are compa-rable to those of the Pleistocene-Holocenetransition. In some locations, persistentsoil erosion and the disposal of hazardousand nuclear waste are leaving legacies ofecological change that could persist formillion of years. Over the next few millen-nia sea level rise wrought by human inten-sification of the greenhouse effect couldliterally reshape the world’s coastlines.Increases in temperature and shifts in thewater cycle could bring new patterns ofvegetation to the world’s landscapes, andreprogram the paths and volumes of ocean-ic currents. Finally, and perhaps with the
greatest long-term impact, species extinctions linked to human activityfrom the late Pleistocene through the next few centuries may well resemblemass extinctions of the pre-human past—each of which defined the bound-aries of geological epochs.1
Indeed, a case could be made that Earth has entered a new epoch. Callit the Anthrocene, a period initiated and defined by Homo sapiens’ unprece-dented population and its capacity to influence the planet’s global cycles.If scientists poke into the planet’s crust thousands or millions of yearsfrom now, they may be able to identify the opening of the Anthrocene by alayer of lead, mercury and other relatively rare metals released from buriedplastics and the settling smoke particles of fossil fuels. Probing polar iceand peat bogs, researchers will find trapped air bubbles with unusuallyhigh concentrations of carbon dioxide—now above 360 parts per millionand rising—along with trace levels of industrial gases that were new to theplanet when human beings invented them. In the surrounding media, sci-entists may find particulate ash from tropical forest burning, tilled soil andfertilizers blown from the world’s agricultural regions,2 and more heavymetals left by industrial processes hundreds of times above background lev-els.33 The plastic detritus of modern civilization could be as sure a marker ofhuman dominance of the earth as the layer of iridium left over from acoating of meteorite dust 65 million years ago is a marker of the passing ofthe dinosaurs.
What will life be like for our descendants, living later in theAnthrocene? Much will depend on the success of efforts to halt the fourmajor interacting global transitions—human population growth, speciesextinctions, tropical deforestation, and global atmospheric and climaticchange. Each of these epoch-making transitions has accelerated greatly inthe last 50 years, less than a human lifetime. There is no way to know howfar each trend will proceed, but their destinations will depend in large parton decisions human societies make in the early years of the 21st century.
References 1. E.C. Pielou, After the Ice Age: The Return of Life to Glaciated North America (Chicago:
Univ. of Chicago Press, 1991), pp. 227-228.2. P.A. Mayewski and others, Science 232 (1986): 975-977.3. W. Shotyk and others, Science 281 (1998): 1635-1640.
Most LargeMammalsDisappear
11,000years ago
1.8 millionyears ago
65millionyears ago
Beginning of theAnthrocene?
Human Influenceon Global Ecology
EarlyHominids
GrasslandsSpread
Large MammalianCarnivores Evolve
Mammals, Birdsand FloweringPlants Diversify
Dinosaurs andMarine ReptilesDisappear
Holocene
Pleistocene
Pliocene
Miocene
Oligocene
Eocene
Paleocene
Cret
aceo
us P
erio
d
MES
OZOI
C ER
A
Tert
iary
Per
iodCE
NOZ
OIC
ERA
Quat
erna
ry P
erio
d
The Present
An Epoch in the Making

31
Na
tu
re
’s
Pla
ce
use of biological controls will no doubthelp us deal with emerging crop pests.But given human population, the preva-lence and neglect of poverty, and upwardtrends in consumption and in travel andtrade, we can be sure that the battle of“wits versus genes” will continue.27
tionary tit-for-tat. By some estimates,viruses are “a million times more likely tomutate” than human cells and can, insome cases, produce a thousand copies inabout an hour.23 Though less prolificthan microbes, insects seem well suitedfor evolution in human-dominatedecosystems. For example, researchers inLondon recently identified a new speciesof mosquito in the city’s undergroundtransport system. A descendent of anaboveground species that taps into birds,this one obtains blood from the tunnel’srodents and train workers.24
In the early 1970s, advances in vac-cines suggested to many clinicians thatthe age of infectious disease was over.Since then clinicians have recorded atleast 28 newly recognized diseases—HIV/AIDS, hepatitis C, D and E, Ebolaand mad cow disease most prominentamong them—and have had to battledozens of resurgent infectious diseases.25
Logically, some of the success of parasiticorganisms could be related to amounts ofaccumulated body mass and energy nowavailable in human-dominated ecosys-tems, and the ease at which these organ-isms can travel between distant hosts.
According to PAI’s estimates[Appendix 1d], there are roughly 250 mil-lion metric tons of human mass globally,and well over twice that in livestock. It isnot unreasonable to suggest that humans,and the ecosystems they remake, arebecoming the principal organizing realityfor organic evolution. Indeed, a half-cen-tury of unprecedented human populationgrowth may have helped give evolution a
new start and some new directions.Ultimately, massive education and
public health campaigns, poverty allevia-tion, new technologies and human behav-ioral change may help control the diseasesthat have recently emerged and those thatmay be evolving.26 And methods such asintegrated pest management and careful
Source: Adapted from D. Pimentel and others, 1998; WHO, 1996.
Year of emergenceDisease or re-emergence Country
HIV/AIDS 1975 probably Gabon or the Congo
Legionnaires disease 1976 United States
Cryptosporidiosis 1976 United States
Ebola haemorrhagic fever 1976 Dem. Rep. of the Congo (then Zaire)
Hantavirus 1977 Republic of Korea
Creutzfeldt-Jakob disease (CJD) 1979 United Kingdom, Canada
Human T-cell lymphotropic virus-I 1980 Japan
Hepatitis D 1980 Italy
Escherichia coli O157:H7 1982 United States
New variant of CJD (related to mad cow disease) 1986 United Kingdom
Salmonella enteritidis PT-4 1988 United Kingdom
Hepatitis C 1989 United States
Venezuelan haemorrhagic fever 1991 Venezuela
Brazilian haemorrhagic fever 1994 Brazil
Vibrio cholerae 1992 India
Human and equine morbillivirus 1994 Australia
Newly Emerging Diseases
FIGURE 9

32
Po
pu
lat
ion
A
ct
ion
I
nt
er
na
tio
na
l
Discussion Paper, 25 (Washington, DC:International Food Policy Research Institute,1998); N. Myers, “The Biodiversity Crisis andthe Future of Evolution,” TheEnvironmentalist 16 (1996): 37-47.
23. See review by A.E. Platt, “HowEnvironmental and Social Disruptions TriggerDisease,” Worldwatch Paper, 129(Washington, DC: Worldwatch Institute,1996), p. 6; R.M. Henig, A Dancing Matrix:Voyages Along the Viral Frontier (New York:Alfred Knopf, 1993).
24. K. Byrne and R.A. Nichols, “Culex pipiens inthe London Underground Tunnels:Differentiation Between Surface andSubterranean Populations,” Heredity 80 (inpress).
25. D. Pimentel and others, “Ecology ofIncreasing Disease,” Bioscience 48, 10 (1998):817-826.
26. S..J. Olshansky, B. Carnes, R.G. Rogers, andL. Smith, “Infectious Diseases - New andAncient Threats to World Health,” PopulationBulletin 52, 2.
27. J. Lederberg, “Disease,” in Meeting theChallenges of Population, Environment, andResources: The Costs of Inaction,Environmentally Sustainable DevelopmentProceedings, 14 (Washington, DC: WorldBank, 1995), 25-26.
References1. A.R. Wallace, The Geographical Distribution
of Animals, with a Study of the Relations ofLiving and Extinct Faunas as ElucidatingPast Changes of the Earth’s Surface (NewYork: Harper, 1876), p. 150.
2. P.S. Martin, “Prehistoric Overkill: the GlobalModel,” in Quaternary Extinctions: APrehistoric Revolution, ed. P.S. Martin andR.G. Klein (Tucson: Univ. of Arizona Press,1984), 367-403;
3. G.G. Miller and others, “PleistoceneExtinction of Genyornis newtonii: HumanImpact on Australian Megafauna,” Science283 (1999): 205-206.
4. R. Leakey and R. Lewin, The Sixth Extinction(New York: Doubleday, 1995), p. 174.
5. J. Clutton-Brock, Domesticated Animals fromEarly Times (Austin: Univ. of Texas Press,1981).
6. P. Murray, “Extinctions Downunder: ABestiary of Extinct Australian Late PleistoceneMonotremes and Marsupials,” in QuaternaryExtinctions: A Prehistoric Revolution, 1984,600-628.
7. J-M. Chauvet, E. Brunel-Deschamps, and C.Hillaire, La Grotte Chauvet (Paris: Seuil,1995).
8. C. Darwin, The Origin of Species By Means ofNatural Selection or The Preservation ofFavoured Races in the Struggle for Life (NewYork: New American Library, 1958, first pub-lished 1859).
9. H.F. James and S.L. Olson, “Flightless Birds,”Natural History 92, 9 (1983): 30-40.
10. S.L. Pimm, G.J. Russell, J.L. Gittleman, andT.M. Brooks, “The Future of Biodiversity,”Science 269 (1995): 347-350; D.W. Steadman,“Human-Caused Extinction in Birds,” inBiodiversity II: Understanding and ProtectingOur Biological Resources, ed. M.L. Reaka-Kudla, D.E. Wilson, and E.O. Wilson(Washington, DC: Joseph Henry Press, 1997),139-161.
11. IUCN, IUCN Red List of Threatened Animals(Gland, Switzerland: IUCN-WorldConservation Union, 1996), p. intro 24.
12. IUCN, IUCN Red List of Threatened Plants(Gland, Switzerland: IUCN-WorldConservation Union, 1998), p. xvii.
13. E. Boserup, Conditions of AgriculturalGrowth: The Economics of Agrarian ChangeUnder Population Pressure (Chicago: Aldine,1965).
14. L. Hannah, D. Lohse, C. Hutchinson, J.L.Carr, and A. Lankerani, “A PreliminaryInventory of Human Disturbance of WorldEcosystems,” Ambio 23, 4-5 (1994): 246-250.
15. P.M. Vitousek and others, “HumanAppropriation of the Products ofPhotosynthesis,” Bioscience 36, 6 (1986): 368-373.
16. D. Bryant, D. Nielsen, and L. Tangley, TheLast Frontier Forests: Ecosystems andEconomies on the Edge (Washington, DC:World Resources Institute, 1997).
17. C. Wilkinson, “Coral Reefs of the World AreFacing Widespread Devastation: Can WePrevent This Through SustainableManagement Practices?,” in Proceedings ofthe 7th International Coral Reef Symposium,Vol. 1 (Guam: Univ. of Guam, 1993), 11-21.
18. U.S. Geological Survey, “Fish Lesions andFish-Kills,” http://chesapeake.usgs.gov/ches-bay (last accessed: October 9, 1998).
19. D. Quammen, “Planet of the Weeds: Tallyingthe Losses of Earth’s Animals and Plants,”Harper’s, October, 1998, 57-69.
20. World Conservation Monitoring Centre,Biodiversity Data Sourcebook, ed. B.Groombridge (Cambridge, U.K.: WorldConservation Press, 1994); J. Clutton-Brock,Domesticated Animals from Early Times(Austin: Univ. of Texas Press, 1981); R. Loftusand B. Scherf, eds. World Watch List forDomestic Animal Diversity (Rome: FAO,1993).
21. Scripps Howard News Service, “Is ManureLaying Waste to Our Soil?,” Sunday, May 10,1998.
22. M. Yudelman, A. Ratta, and D. Nygaard,“Pest Management and Food Production,”Food, Agriculture, and the Environment

33
Na
tu
re
’s
Pla
ce
size, the large and rapidly growing popula-tion, and the global distribution of Homosapiens. Nor has any species evolved suchintelligence and a capacity for innovationcomparable to our own. There are, in fact, nomodels to guide our course. Yet we haveplenty of demographic statistics to consider.
As the second millennium draws toa close, roughly 6 billion peopleare alive on the planet. The num-ber is unprecedented and impos-ing, but hard to place in perspec-
tive. No other species in the planet’s pastor present has combined the large body
. . . the world’s nations by
their actions or inactions
will choose from among a
range of alternative demo-
graphic futures.1
Programme of Action of the 1994
International Conference on
Population and Development
Approved by 179 nations
Cairo, 1994Since 1950, human popu-lation has more thantripled in the tropics,home to probably two-thirds of Earth’s biodiver-sity. During the sameperiod, the tropical shareof world population grewfrom 28 percent to 36percent and by 1995comprised over 2 billionpeople. Today humanpopulation is growing byaround 78 million peopleannually. PopulationAction International esti-mates that 51 percent ofthis growth now occursin the band between thetwo tropics. [SeeAppendix 1i.]
Other Regions
0 •
1 •
2 •
3 •
4 •
5 •
6 •
•1995
•1990
•1985
•1980
•1975
•1970
•1965
•1960
•1955
•1950
Tropics
PO
PU
LA
TI
ON
(bill
ions
)
Source: Estimates by Population Action International.
III. Nature Replaced: Prospects for Our Species
III. Nature Replaced: Prospects for Our Species
Population Growth in the Species-Rich Tropics
FIGURE 10
World Neighbors

34
Po
pu
lat
ion
A
ct
ion
I
nt
er
na
tio
na
l
Pre-agricultural human diets, however, fellin between carnivorous and herbivorousdiets. A liberal estimate of the averagepopulation density our species would like-ly have maintained without agriculture isaround 1.0 to 1.5 individuals per squarekilometer, similar to the average density atwhich hunter-gatherers lived until relative-ly recently. Compare this with moderndensities, such as that of Bangladesh withover 880 people per square kilometer, andthe Netherlands averaging 384 people persquare kilometer.4
If, on this principle, pre-agriculturalhumans at densities around 1.0 to 1.5persons per square kilometer were toexploit every corner of Earth’s habit-able terrestrial surface (about 130 mil-lion square kilometers),5 the worldwould conceivably support around 130million to 200 million pre-agriculturalpeople. According to several estimates,world population surpassed 130 millionin the early years of the Roman Empire(before 400 BC), and reached twice thatpopulation, or two people per squarekilometer, around AD 200.6 The UnitedStates alone surpassed 130 million justprior to World War II,7 and by mid-1999claimed over 270 million inhabitants.
Even some scientists in the biologicaldisciplines are unaware of how ecologi-cally unprecedented the scale of humannumbers is—not just present numbers,but those of the last two millennia aswell. No other mammal of comparablebody weight has ever attained anywherenear such abundance, nor has any othersimilar-sized terrestrial animal demon-strated such reproductive success.
In comparison to the recent past,today’s world population is large indeed.Our species’ numbers have multipliednearly 4 times since the beginning of thiscentury, when the world’s populationwas around 1.6 billion, and it has dou-bled since 1960. These figures are impres-sive, yet they still fail to illuminate howwe compare as a species to the rest of lifeon Earth. There is, however, a scientificmethod based on animal body size thatprovides some biological perspective tohuman numbers.
Population From AnEcological Perspective Recognizing that species with larger bodysizes have greater nutritional requirementsand therefore must range farther for food,the late Canadian ecologist Robert HenryPeters compared species’ average bodysizes to their documented abundance. Formammals, Peters found statistical relation-ships that predicted numbers of carnivores(meat-eaters) and herbivores (plant-eaters)in natural ecosystems [see Appendix 1d].2
These relationships can be used to esti-mate how many humans would have sur-vived if we had remained, in effect, justanother primate—a species that lived bygathering seeds, tubers and fruits, andhunting or scavenging meat, without thebenefits of agriculture.3
Peters’ equations predict 0.12 individu-als per square kilometer for a carnivorousmammal the size of modern Homosapiens, averaging roughly 65 kilograms(142 pounds), and 2.1 per square kilome-ter for a herbivore of the same weight.
Standard curves predict the densities at which mammalianherbivores (leaf-eaters) and mammalian carnivores (meat-eaters) of different body weights can live in undisturbedhabitats. According to the United Nations, in 1999 humansaveraged about 44 people per square kilometer, substan-tially above these curves. Such unusually high density,over 30 times what is predicted for a mammal of our sizewith a mixed diet, would not be possible without modernagriculture. Source: Relationships from R.M. Peters, 1983.
4•
8•
10•
•1000
A V E R A G E B O D Y W E I G H T(kilograms)
PO
PU
LA
TI
ON
DE
NS
IT
Y(i
ndiv
idua
ls p
er s
q. k
m.)
Carnivores
Herbivores
•100•
65
•10
2•
0•
6•
Expected PopulationDensity of Pre-agricultural People
Expected Population Densities of Mammals
FIGURE 11

35
Na
tu
re
’s
Pla
ce
The range of one to two people persquare kilometer has added significance. Itreflects how dense human populations canget, on average, before our species mustmodify the ecosystems we inhabit for ourown survival. And it suggests how dramat-ically we must now control our competi-tors, predators and parasites, in order tomaintain our numbers. It is these modifica-tions and controls, writ large by the scaleour populations and economies haveachieved, that now pose the principalthreat to biological diversity.
The Reproductive Revolution Today, despite our still growing population,we find ourselves somewhere in the middle of a revolution in reproductive behavior. Onaverage, family size has decreased by roughlyhalf, from more than six children per womanin many countries to fewer than three today.And contraceptive technologies are becomingmore accessible, more affordable and morewidely accepted. Gaps in access to familyplanning services and information, nonethe-less, continue to exist in many parts of theworld, especially in developing countries insub-Saharan Africa, South Asia, and parts ofLatin America and the Middle East.8 Recentsurveys suggest that even in the United States,nearly half of pregnancies are mistimed orunwanted. In the world as a whole, nearlytwo out of every five pregnancies areunplanned, suggesting the impact thatimproved access to safe and effective familyplanning services could have on populationgrowth, not to mention on the well-being ofwomen and their families.9
Shifts occurring in women’s roles, access
The countries listed are 18 selected by Conservation International asmegadiversity countries. These countries are home to an inordinately largeshare of biodiversity, probably between 60 percent and 70 percent of theglobal total, including terrestrial, marine and freshwater species. In severalof these countries fertility has declined dramatically over the past 30 years.Others remain considerably above replacement-level fertility, which is slight-ly above an average of 2 children per woman of reproductive age in popula-tions where there is relatively low infant and child mortality.
Source: Data from UN Population Division, 1998.
Total Fertility Rate (average number of births per woman)
1960 - 1965 1995 - 2000
Australia 3.3 1.8
Brazil 6.2 2.3
China 5.7 1.8
Colombia 6.8 2.8
Democratic Republic of the Congo (formerly Zaire) 6.0 6.4
Ecuador 6.7 3.1
India 5.8 3.1
Indonesia 5.4 2.6
Madagascar 6.6 5.4
Malaysia 6.7 3.6
Mexico 6.8 2.8
Papua New Guinea 6.3 4.6
Peru 6.9 3.0
Philippines 6.6 3.6
South Africa 6.5 3.3
United States 3.3 2.0
Venezuela 6.7 3.0
Human Fertility Change in the Highly Biodiverse Countries
FIGURE 12

36
Po
pu
lat
ion
A
ct
ion
I
nt
er
na
tio
na
l
fluctuated erratically below 3.5 childrenper woman for at least 50 years withoutever having dropped to replacement lev-els. In Costa Rica and Chile, fertilitydeclined rapidly during the 1970s, butstalled at similar levels.
For parts of these regions and much ofthe world, predictions of fertility areespecially difficult. In sub-Saharan Africawomen still bear on average more thanfive children. In Pakistan, northern India,much of the Middle East and parts ofCentral Asia, women bear around fourchildren. For these countries, demogra-phers have few clues as to when furtherchanges in reproductive behavior andwomen’s roles will occur and how smallfuture families might be. No indicatorappears in the projections for globalefforts to change human developmentpolicies that would influence populationgrowth. Yet it is clear that the size ofworld population in 2050—whether 7.3billion or 10.6 billion people, or somenumber in between—will depend inlarge part on the choices that govern-ments, foreign aid donors, businessesand non-governmental organizationsmake in the coming decades.
References1. C. Haub and N. Yinger, The UN Long-Range
Population Projections: What They Tell Us(Washington, DC: Population ReferenceBureau, 1992).
L ike other PAI reports, this publication uses the low population pro-jection as a rough semblance of the kind of demographic future wemight expect with sound and well-funded population policies around
the world. The high projection, by contrast, may represent a world in whichgovernments and leaders have neglected or misapplied the health-related
and other social strategiesthat slow population growthand improve human well-being in many other ways.
The high and low sce-narios do not represent mar-gins of error in the conven-tional statistical sense. UNdemographers do not sug-gest how probable any pro-jection is. These low andhigh scenarios simply repre-sent two distinct butextreme sets of assumptionsthat UN demographersapply, with slight variations,to every country. The lowvariant, in which fertilitylevels off at 1.6 children perwoman, mimics the path of
fertility change that has occurred in most of the European countries (includ-ing Italy, Spain, Norway and Greece) and in several East Asian countries(Japan, South Korea, Taiwan and Thailand). In these countries, when fertilitydropped from high levels it ultimately dipped below replacement fertility tolevels of 1.2 to 1.8 children per woman over the last two decades.
The high variant, in which fertility rates are assumed to level off at 2.6children per woman, mimics a number of Central and South American coun-tries where fertility rates have momentarily stabilized at higher than replace-ment.1 For example, total fertility rates of both Uruguay and Argentina have
Source: Data from UN Long-Range Projections, 1998.
30
25
20
15
10
5
0
PO
PU
LA
TI
ON
(bill
ions
)
|1850
| |1900
| |1950
| |2000
| |2050
| |2100
| |2150
Low Projection
High ProjectionPROJECTEDPAST
World Population: Past and Projected
FIGURE 13
Bordering on Uncertainty: Considering the UN Population Projections

37
Na
tu
re
’s
Pla
ce
Indonesia, Tunisia, Colombia, Thailandand Bangladesh—or that Spain andItaly would eventually experience thelowest fertility rates in the world.
Regional TrendsMany of the assumptions for futuredeclines in population growth—evenfor the UN high-growth scenario—depend on a relatively complete diffu-sion of access to family planning servic-es and better education for girls in sub-Saharan Africa, in parts of the MiddleEast, and in northernmost South Asia,where fertility rates are still high. Andthere is still considerable uncertainty asto whether declines in fertility will con-tinue in Latin America.
The UN Population Division projectsthat rising mortality from HIV/AIDScould have significant demographicimpacts in some sub-Saharan Africancountries by early in the new century.Deaths from this virulent disease, mostof which occur among adults in theprime of their productive lives, couldstall educational progress, decimate theable and trained, and set back econom-ic development for generations to come.In the long term, Africa’s HIV pandem-ic could slow the continent’s eventualtransition to low fertility. With 780 mil-lion people today, Africa is projected bythe UN to attain somewhere between1.5 billion and 2.1 billion people bymid-21st century, a projection thataccounts for some of the expected AIDSmortality.
age necessary, in the absence of netimmigration, to replace each generationwith the following one. In the industrial-ized countries fertility rates may wellremain low for some time, or they couldrise again if the tradeoffs and costs ofchildrearing decline or if larger familiesregain social approval. Realisticallyspeaking, we just don’t know.
Divergent FuturesAccording to the most recent long-rangepopulation projections, by the end of the21st century global human populationcould reach as high as 16 billion. Or itcould peak at less than 7.5 billion around2040 and return again to below 5.5 billionby the century’s end.14 Between thesetwo extreme projections lies a vast arrayof possible futures, including everythingfrom continued exponential growth toearly stabilization and even eventualdecline. The outcome of this range ofpossible population trajectories, nowuncertain, could make a critical differenceto the prospects for conserving theremainder of our biological diversity inthe coming century and beyond.
Could there be demographic surpris-es? Indeed, there already have been sev-eral. During the mid-1970s, annual netadditions in world population actuallydecreased temporarily, reflecting devas-tating effects of earlier famine and polit-ical upheaval on the age structure ofChina’s huge population.15 Few demog-raphers predicted the early declines infertility in developing countries like
to education, and economic and socialmobility in almost every society areimportant elements in the transition tolower fertility. Changes in social norms,increasing costs and higher expectationsfor children, and growing demands onparents’ time, all share in the mix thathas increased demand for family plan-ning services. How much and how ofteneach has contributed are the subjects ofcontinuing debate.10
Currently, throughout the developingworld, women are seeking to have smallerfamilies than their mothers and even theirolder sisters, and they increasingly havethe means to achieve the family size theyseek. Several good examples can begleaned from East and Southeast Asia.During the mid-1960s, South Korea,Taiwan, Singapore, Thailand and formerHong Kong Territory began effective pro-grams to lower infant and maternal mor-tality, establish easy access to family plan-ning services,11 and increase primaryschool enrollments and educational attain-ment.12 Three decades later, average fertil-ity in each of these Asian states is belowtwo children per woman (the average inthe United States). Other developingcountries, including Mexico (2.8 childrenper woman), Brazil (2.3), Indonesia (2.8),Tunisia (2.6) and Sri Lanka (2.1), also areexperiencing downward trends in fertility.Meanwhile, in more than 30 countries inAfrica, women can still expect to bear fivechildren or more during their lifetimes.13
During the late 1960s and ‘70s, nearlyall the European countries fell below theapproximately two-child-per-couple aver-
In no small way, the
survival of many of
today’s species, large and
small, is linked to the
well-being of the female
of our own species.
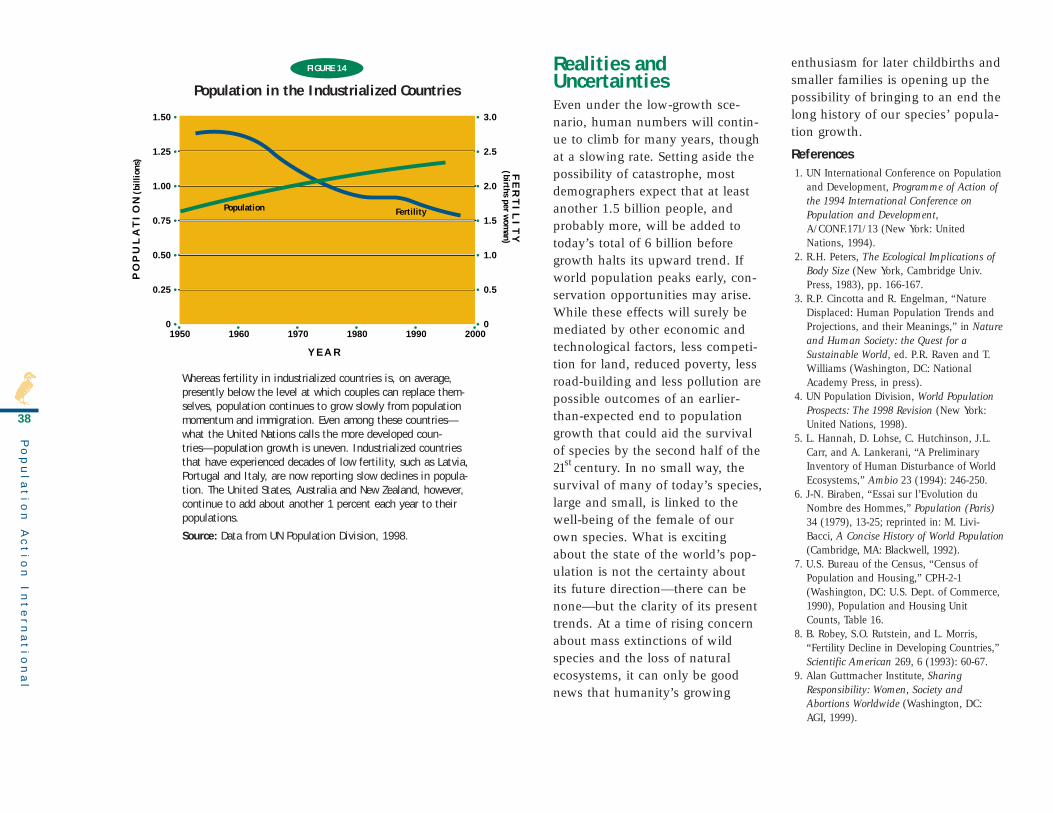
38
Po
pu
lat
ion
A
ct
ion
I
nt
er
na
tio
na
l
Whereas fertility in industrialized countries is, on average,presently below the level at which couples can replace them-selves, population continues to grow slowly from populationmomentum and immigration. Even among these countries—what the United Nations calls the more developed coun-tries—population growth is uneven. Industrialized countriesthat have experienced decades of low fertility, such as Latvia,Portugal and Italy, are now reporting slow declines in popula-tion. The United States, Australia and New Zealand, however,continue to add about another 1 percent each year to theirpopulations.
Source: Data from UN Population Division, 1998.
Population in the Industrialized Countries
FIGURE 14
•1950
1.50 •
1.25 •
1.00 •
0.75 •
0.50 •
0.25 •
0 •
• 3.0
• 2.5
• 2.0
• 1.5
• 1.0
• 0.5
• 0•1960
•1970
•1980
•1990
•2000
Y E A R
FE
RT
IL
IT
Y(births per w
oman)
PO
PU
LA
TI
ON
(bill
ions
)
Population Fertility
enthusiasm for later childbirths andsmaller families is opening up thepossibility of bringing to an end thelong history of our species’ popula-tion growth.
References1. UN International Conference on Population
and Development, Programme of Action ofthe 1994 International Conference onPopulation and Development,A/CONF.171/13 (New York: UnitedNations, 1994).
2. R.H. Peters, The Ecological Implications ofBody Size (New York, Cambridge Univ.Press, 1983), pp. 166-167.
3. R.P. Cincotta and R. Engelman, “NatureDisplaced: Human Population Trends andProjections, and their Meanings,” in Natureand Human Society: the Quest for aSustainable World, ed. P.R. Raven and T.Williams (Washington, DC: NationalAcademy Press, in press).
4. UN Population Division, World PopulationProspects: The 1998 Revision (New York:United Nations, 1998).
5. L. Hannah, D. Lohse, C. Hutchinson, J.L.Carr, and A. Lankerani, “A PreliminaryInventory of Human Disturbance of WorldEcosystems,” Ambio 23 (1994): 246-250.
6. J-N. Biraben, “Essai sur l’Evolution duNombre des Hommes,” Population (Paris)34 (1979), 13-25; reprinted in: M. Livi-Bacci, A Concise History of World Population(Cambridge, MA: Blackwell, 1992).
7. U.S. Bureau of the Census, “Census ofPopulation and Housing,” CPH-2-1(Washington, DC: U.S. Dept. of Commerce,1990), Population and Housing UnitCounts, Table 16.
8. B. Robey, S.O. Rutstein, and L. Morris,“Fertility Decline in Developing Countries,”Scientific American 269, 6 (1993): 60-67.
9. Alan Guttmacher Institute, SharingResponsibility: Women, Society andAbortions Worldwide (Washington, DC:AGI, 1999).
Realities andUncertaintiesEven under the low-growth sce-nario, human numbers will contin-ue to climb for many years, thoughat a slowing rate. Setting aside thepossibility of catastrophe, mostdemographers expect that at leastanother 1.5 billion people, andprobably more, will be added totoday’s total of 6 billion beforegrowth halts its upward trend. Ifworld population peaks early, con-servation opportunities may arise.While these effects will surely bemediated by other economic andtechnological factors, less competi-tion for land, reduced poverty, lessroad-building and less pollution arepossible outcomes of an earlier-than-expected end to populationgrowth that could aid the survivalof species by the second half of the21st century. In no small way, thesurvival of many of today’s species,large and small, is linked to thewell-being of the female of ourown species. What is excitingabout the state of the world’s pop-ulation is not the certainty aboutits future direction—there can benone—but the clarity of its presenttrends. At a time of rising concernabout mass extinctions of wildspecies and the loss of naturalecosystems, it can only be goodnews that humanity’s growing

39
Na
tu
re
’s
Pla
ce
10. J. Bongaarts and S.C. Watkins,“Social Interactions andContemporary FertilityTransitions,” Population andDevelopment Review 22, 4 (1996):639-682; J. Bongaarts,“Demographic Consequences ofDeclining Fertility,” Science 282(1998): 419-420; L. Mazur, HighStakes: The United States, GlobalPopulation and Our CommonFuture (New York: RockefellerFoundation, 1997).
11. A.O. Tsui, “Family PlanningPrograms in Asia: Approaching aHalf-Century of Effort,” Asia-Pacific Population ResearchReports, 8 (Honolulu, HI: East-West Center, 1996); AsianDevelopment Bank, EmergingAsia: Changes and Challenges(Manila: ADB, 1997).
12. N. Birdsall, B. Bruns, and R.H.Sabot, “Education in Brazil:Playing a Bad Hand Badly,” inOpportunity Foregone, eds. N.Birdsall and R.H. Sabot(Washington, DC: Inter-AmericanDevelopment Bank, 1996), 7-47;World Bank, The East AsianMiracle: Economic Growth andPublic Policy, ed. L. MacDonald(London: Oxford Univ. Press,1993).
13. UN Population Division, WorldPopulation Prospects: The 1996Revision (New York: UnitedNations, 1996).
14. UN Population Division, WorldPopulation Projections to 2150(New York: United Nations,1998).
15. Committee on Population andDemography, “Rapid PopulationChange in China, 1952-1982,”Report no. 27 (Washington, DC:National Research Council, 1984).
Population Momentum
Demographers at the United Nationscalculate that if average fertility inIndia were to have dropped abruptly
to replacement-level fertility (slightlyabove two children per woman) during1995 and had remained precisely at thatlevel, India’s population, then at 927 mil-lion people, would have continued to growrapidly, reaching 1.45 billion by 2050.1
This additional growth, occurring after fer-tility declines to replacement level, iscaused by population momentum.
Growth due to population momentumoccurs during the decades when a low-fer-tility population with a youthful age struc-ture—a characteristic left over from yearsof high fertility—gradually fills out to amore uniform age structure, one that typi-fies a population that is not growing (astationary population). For some rapidlygrowing countries, this “filling out” couldtake more than 50 years and double theexisting population.2
This effect, however, does not meanthat an extra half-century or more of pop-ulation growth is inevitable in countriesthat attain the two-child family average.Momentum is reduced when average fertili-ty falls well below replacement, and whenthe average age of women at childbirthrises.
References 1. UN, World Population Projections to 2150,
1998.2. N. Keyfitz, Demography 8, 1 (1970): 71-80.
Understanding Momentum
FIGURE 15
J A P A N ' S P O P U L A T I O N(in millions)
A G E(in years)
45–49years old in
1995
5–9years old
in 1955
Group born1946–1950
M a l e s F e m a l e s80+
70–74
60–64
50–54
40–44
30–34
20–24
10–14
0–4•6
•4
•2
•0
•0
•2
•4
•6
1955 1995
Due to population momentum alone, Japan’s pres-ent population (gold-colored bars) is about one-third larger than the population it attained almostfour decades ago, when it reached the level ofreplacement fertility (slightly over 2 children perwoman). Japan’s population is still growing mod-estly today. Demographers at the United NationsPopulation Division, however, project that trendto shift during the early 21st century to a slowlydecreasing population.
Source: Data from UN Population Division, 1998.

ders dried and was soon supplanted by non-rainforest plants. Bee populations plummet-ed, even in the 100-hectare plots, placing atrisk tens of species of orchids and other flow-ering plants that depend on them for pollina-tion. The big mammals with extensive homeranges and big appetites—jaguars, pumasand peccaries among them—simply pickedup and left the area, abandoning even largertracts. Without peccaries digging wallows,which fill with rainwater, three species offrogs failed to breed and disappeared. If fun-damental ecological theories hold true, fur-ther biodiversity chain reactions can beexpected to follow the loss of the big rainfor-est predators.
The Forest Fragments Project wasdesigned with a specific objective: to deter-mine how much rainforest is needed tomaintain 99 percent of native species for acentury. In fact, the project does much more.Considered broadly, the results can help usbetter understand population’s role in biodi-versity loss—how common patterns of mod-ern human settlement and natural resourceuse tend to reduce, fragment and isolate nat-ural habitat; and how these activities affect awide range of species in complex, long-termways, despite our best intentions to savesome portion of nature.
In the late 1970s, American ornithologistThomas Lovejoy and colleagues began inBrazil a biological experiment planned tolast a century. Taking advantage of aBrazilian law that required rainforest set-
tlers to leave at least half of their deeded landforested, Lovejoy convinced several Brazilianfarmers to leave their rainforest in squaretracts of varying sizes, from 1 to 1,000hectares (from one-hundredth to 10 squarekilometers). The changes that have so farbeen documented in the Forest FragmentsProject provide the most complete evidence todate of how human-caused forest fragmenta-tion operates on biological diversity. Andwhile ecologists expect the numbers andtypes of species in these habitat fragments tocontinue changing for decades, and perhapsfor centuries, effects were observed within thefirst several years of the experiment.2,3
The earliest changes occurred in the small-er forest tracts. In these patches, numerousmid-size plant and animal species dwindledin a matter of years, then disappeared. Closerstudy disclosed that many of the missingspecies were casualties of biodiversity chainreactions. For example, colonies of army antswere lost from woodlands of 10 hectares orsmaller. Then came the loss of ant-birds,which prey on insects taking flight to escapemarauding ants. Vegetation along forest bor-
The more fundamental causes [of
biodiversity loss] are rooted in the
contemporary human condition,
especially as they are amplified by
the explosive growth in human num-
bers in the last three centuries.1
Michael Soulé, 1991
Conservation Biologist
40
Po
pu
lat
ion
A
ct
ion
I
nt
er
na
tio
na
l
IV. The Role of Population Growth IV. The Role of Population Growth
Stephanie Koontz

People and Biological Diversity
The Global Biodiversity Hotspots and Major Tropical Wilderness Areas
Hotspots1. Tropical Andes2. Mesoamerica3. Caribbean4. Atlantic Forest Region5. Chocó-Darién-Western Ecuador6. Brazilian Cerrado7. Central Chile8. California Floristic Province9. Madagascar and Indian Ocean Islands
10. Eastern Arc Mountains and Coastal Forests of Tanzania and Kenya
11. Guinean Forests of West Africa12. Cape Floristic Province13. Succulent Karoo14. Mediterranean Basin15. Caucasus16. Sundaland17. Wallacea18. Philippines19. Indo-Burma
20. Mountains of South-Central China21. Western Ghats and Sri Lanka22. Southwest Australia23. New Caledonia24. New Zealand25. Polynesia/Micronesia
Major Tropical Wilderness AreasA. Upper Amazonia and Guyana ShieldB. Congo BasinC. New Guinea and Melanesian Islands
From Nature’s Place: Population andthe Future of Biodiversity.
Order additional copies [email protected]
On the Web at:http://www.populationaction.org/
naturesplace
Source: Conservation International, 1999.
Biodiversity Hotspots
Major Tropical Wilderness Areas
25
8
2
5
3
1
7
A6
4
11 B 10
91312
14
1520
21
22
25
24
23
1716
1819
C
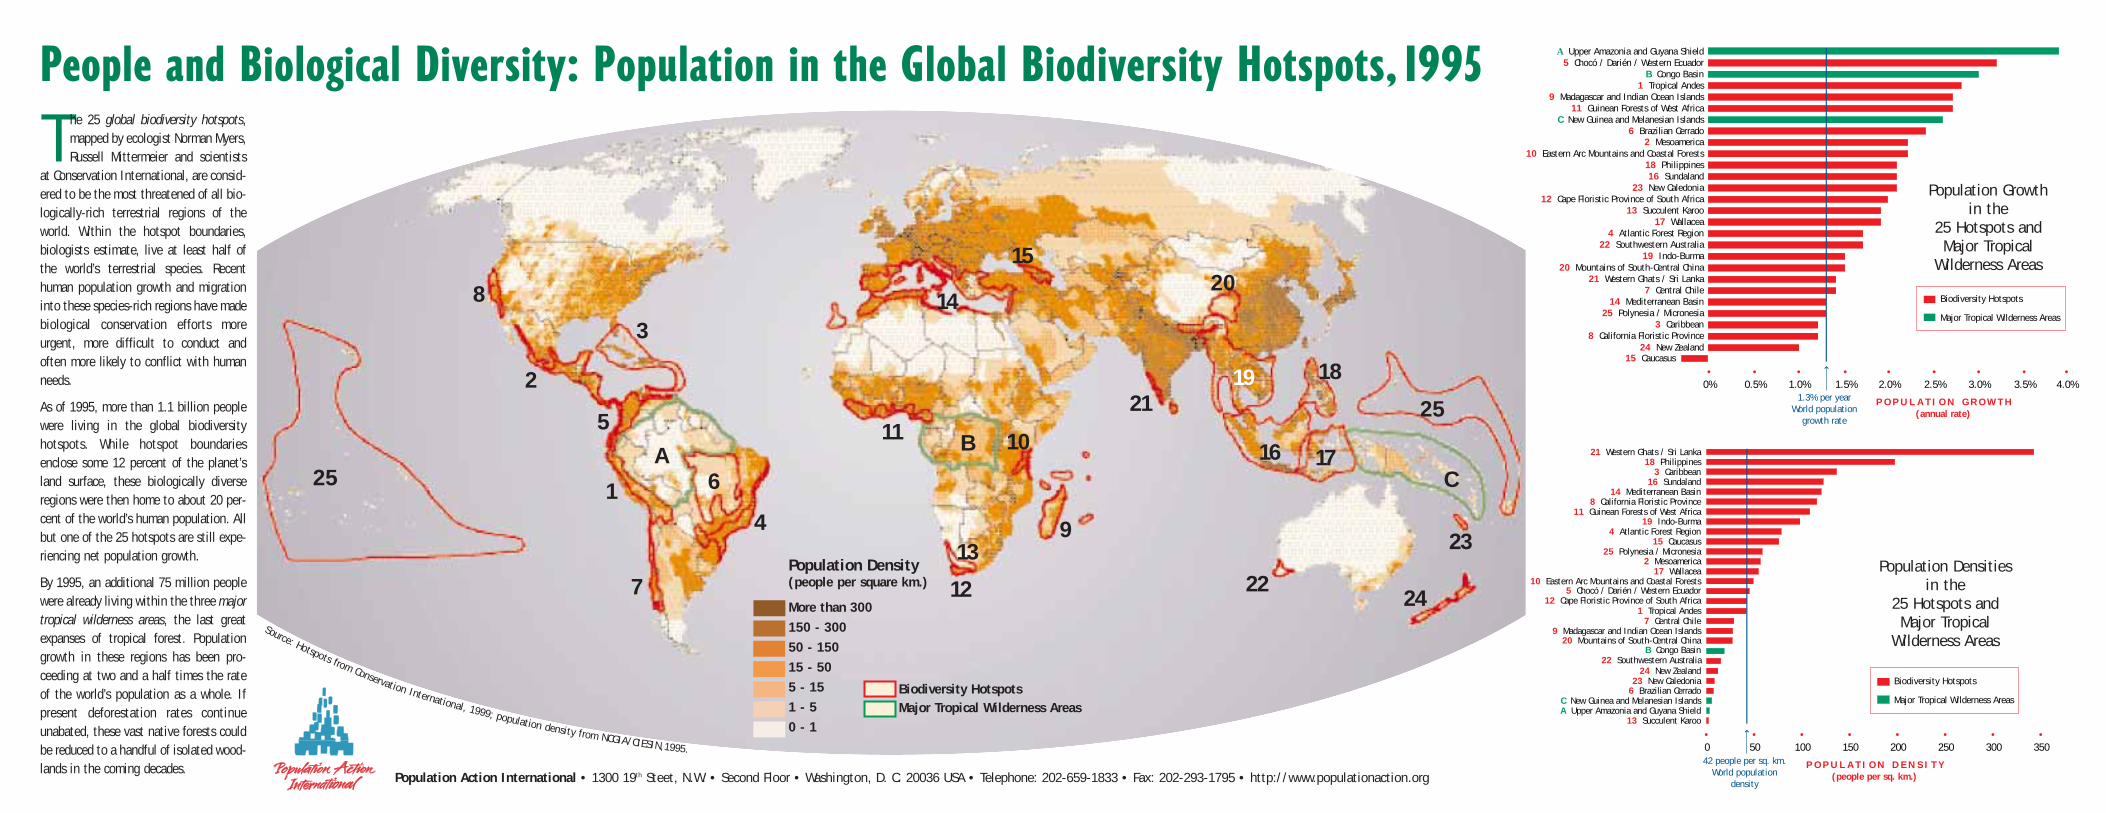
Population Growth in the
25 Hotspots andMajor Tropical
Wilderness Areas
Population Densitiesin the
25 Hotspots andMajor Tropical
Wilderness Areas
People and Biological Diversity: Population in the Global Biodiversity Hotspots, 1995
•0%
•0.5%
•1.0%
•1.5%
•2.0%
•2.5%
•3.0%
•3.5%
•4.0%
8 California Floristic Province
25 Polynesia / Micronesia
7 Central Chile
19 Indo-Burma20 Mountains of South-Central China
4 Atlantic Forest Region
13 Succulent Karoo
23 New Caledonia
18 Philippines
6 Brazilian Cerrado
11 Guinean Forests of West Africa
1 Tropical Andes
5 Chocó / Darién / Western Ecuador
24 New Zealand15 Caucasus
3 Caribbean
14 Mediterranean Basin
21 Western Ghats / Sri Lanka
22 Southwestern Australia
17 Wallacea
12 Cape Floristic Province of South Africa
16 Sundaland
10 Eastern Arc Mountains and Coastal Forests2 Mesoamerica
C New Guinea and Melanesian Islands
9 Madagascar and Indian Ocean Islands
B Congo Basin
A Upper Amazonia and Guyana Shield
P O P U L A T I O N G R O W T H(annual rate)
Biodiversity Hotspots
Major Tropical Wilderness Areas
1.3% per yearWorld population
growth rate
A Upper Amazonia and Guyana Shield
23 New Caledonia24 New Zealand
20 Mountains of South-Central ChinaB Congo Basin
7 Central Chile
5 Chocó / Darién / Western Ecuador10 Eastern Arc Mountains and Coastal Forests
25 Polynesia / Micronesia15 Caucasus
11 Guinean Forests of West Africa8 California Floristic Province
16 Sundaland
18 Philippines
13 Succulent Karoo
C New Guinea and Melanesian Islands6 Brazilian Cerrado
22 Southwestern Australia
9 Madagascar and Indian Ocean Islands
12 Cape Floristic Province of South Africa1 Tropical Andes
17 Wallacea2 Mesoamerica
4 Atlantic Forest Region19 Indo-Burma
14 Mediterranean Basin
3 Caribbean
21 Western Ghats / Sri Lanka
•0
•50
•100
•150
•200
•250
•300
•350
P O P U L A T I O N D E N S I T Y(people per sq. km.)
Biodiversity Hotspots
Major Tropical Wilderness Areas
42 people per sq. km.World population
density
Source: Hotspots from Conservation International, 1999; population density from NCGIA/CIESIN,1995.
Population Action International • 1300 19th Steet, N.W. • Second Floor • Washington, D. C. 20036 USA • Telephone: 202-659-1833 • Fax: 202-293-1795 • http://www.populationaction.org
Population Density (people per square km.)
More than 300150 - 30050 - 15015 - 505 - 151 - 50 - 1
Biodiversity Hotspots Major Tropical Wilderness Areas
25
8
2
5
3
1
7
A6
4
11 B 10
913
12
14
1520
21
22
25
24
23
1716
1819
C
The 25 global biodiversity hotspots,mapped by ecologist Norman Myers,Russell Mittermeier and scientists
at Conservation International, are consid-ered to be the most threatened of all bio-logically-rich terrestrial regions of theworld. Within the hotspot boundaries,biologists estimate, live at least half ofthe world’s terrestrial species. Recenthuman population growth and migrationinto these species-rich regions have madebiological conservation efforts moreurgent, more difficult to conduct andoften more likely to conflict with humanneeds.
As of 1995, more than 1.1 billion peoplewere living in the global biodiversityhotspots. While hotspot boundariesenclose some 12 percent of the planet’sland surface, these biologically diverseregions were then home to about 20 per-cent of the world’s human population. Allbut one of the 25 hotspots are still expe-riencing net population growth.
By 1995, an additional 75 million peoplewere already living within the three majortropical wilderness areas, the last greatexpanses of tropical forest. Populationgrowth in these regions has been pro-ceeding at two and a half times the rateof the world’s population as a whole. Ifpresent deforestation rates continueunabated, these vast native forests couldbe reduced to a handful of isolated wood-lands in the coming decades.

1 Tropical Andes 1,415 57,920 40 2.8 20,000 677 68 218 604 1,258 25% 6.3%
2 Mesoamerica 1,099 61,060 56 2.2 5,000 251 210 391 307 1,155 20% 12.0%
3 Caribbean 264 38,780 136 1.2 7,000 148 49 418 164 264 11% 15.6%
4 Atlantic Forest Region 824 65,050 79 1.7 6,000 73 160 60 253 1,228 8% 2.7%
5 Chocó-Darién-Western Ecuador 134 5,930 44 3.2 2,250 85 60 63 210 261 24% 6.3%
6 Brazilian Cerrado 2,160 14,370 7 2.4 4,400 29 19 24 45 1,783 20% 1.2%
7 Central Chile 320 9,710 29 1.4 1,605 4 9 34 14 300 30% 3.1%
8 California Floristic Province 236 25,360 108 1.2 2,125 8 30 16 17 324 25% 9.7%
9 Madagascar and Indian Ocean Islands 587 15,450 26 2.7 9704 199 84 301 187 594 10% 1.9%
10 Eastern Arc Mts. & Coastal Forests 142 7,070 50 2.2 1,400 22 16 50 33 30 7% 16.9%
11 Guinean Forests of West Africa 660 68,290 104 2.7 2,250 90 45 46 89 1,265 10% 1.6%
12 Cape Floristic Province 82 3,480 42 2.0 5,682 6 9 19 19 74 24% 19.0%
13 Succulent Karoo 193 460 3 1.9 1,940 1 4 36 4 112 27% 2.1%
14 Mediterranean Basin 1,556 174,460 111 1.3 13,000 47 46 110 32 2,362 5% 1.8%
15 Caucasus 184 13,940 76 -0.3 1,600 3 32 21 3 500 10% 2.8%
16 Sundaland 1,500 180,490 121 2.1 15,000 139 115 268 179 1,600 8% 5.6%
17 Wallacea 341 18,260 54 1.9 1,500 249 123 122 35 347 15% 5.9%
18 Philippines 293 61,790 198 2.1 5,832 183 111 159 65 301 8% 1.3%
19 Indo-Burma 2,313 224,920 98 1.5 7,000 140 73 201 114 2,060 5% 7.8%
20 Mountains of South-Central China 469 12,830 25 1.5 3,500 36 75 16 51 800 8% 2.1%
21 Western Ghats and Sri Lanka 136 46,810 341 1.4 2,180 40 38 161 116 183 7% 10.4%
22 Southwest Australia 107 1,440 13 1.7 4,331 19 7 50 24 310 11% 10.8%
23 New Caledonia 16 140 8 2.1 2,551 22 6 56 0 19 28% 2.8%
24 New Zealand 260 2,740 11 1.0 1,865 68 3 61 4 271 22% 19.2%
25 Polynesia / Micronesia 46 2,900 58 1.3 3,334 174 9 37 3 46 22% 10.7%
Po
pu
lat
ion
A
ct
ion
I
nt
er
na
tio
na
l
Hotspot Hot
spot
Are
a(t
hous
ands
of
sq.
km.)
Hum
an
Popu
lati
on,
1995
(tho
usan
ds)
Popu
lati
on
Dens
ity,
199
5(p
er s
q. k
m.)
Popu
lati
on G
row
th
Rate
, 19
95-2
000
(per
cent
per
yea
r)
Bird
s
Mam
mal
s
Rept
iles
Amph
ibia
ns
Exte
nt o
f Or
igin
alVe
geta
tion
(tho
usan
ds o
f sq
. km
.)
Orig
inal
Ext
ent
Rem
aini
ng I
ntac
t
Orig
inal
Ext
ent
Prot
ecte
d
Plan
ts
E N D E M I C S P E C I E S
The 25 Global Hotspots
FIGURE
Sources: Conservation International, Population Action International.

41
Na
tu
re
’s
Pla
ce
levels of pollution, trends in human-inducedclimate change, and the inroads alreadymade by invading species.11
Links to Direct CausesThis section focuses on evidence connect-ing human population growth (both glob-al and local) to the direct causes of biodi-versity loss. Connections that are non-demographic, though very important inthe overall loss of biodiversity, are notgiven the coverage they would deserve ina more extensive review. After this sec-tion, another entitled Considerationsreviews further complexities in the rela-
Linkages in the LiteratureThe most systematic reviews identify atleast a half-dozen major underlying causesfor current declines in species, wild breed-ing populations and natural ecosystems. Ineach review, population growth—whichcan include global and local natural increaseand migration—is listed as one of theseprimary root causes.4
It is important to note, however, thatnone of these reviews suggest that theimpacts of human activity on biodiversityare driven solely by population growth orby population density alone. It is generallyaccepted that several underlying causes areat work, some applying pressures that canalter ecosystems and deplete species, theothers undermining natural and social meansthat could limit or reverse those changes.Even in local case studies where researchersfound the growth of nearby human popula-tions to be the most apparent locus of bio-diversity loss, these same authors consis-tently indicated that, on close analysis, acomplex mix of interacting conditions andfailed remedies were involved.5
How important is population growth andpopulation density—the product of pastgrowth—to current global biodiversity loss?There is no credible numerical answer tothat question. A recent analysis that relied onseveral measures of root causes (includingpopulation density) to mathematically predictproportions of threatened species in over 107countries was only partially successful.6
Nor does the literature on individualspecies provide many clues to the linkage.Understandably, these studies have focusedon the direct causes of decline in breedingpopulations—the effects of habitat distur-
bance, fragmentation and loss; biologicalinvasion; pollution; over-hunting and, in afew recent cases, climate change—ratherthan measures of human population. Butthere are a few exceptions. In a recentstudy, over half of the deaths of African wilddogs were associated with direct humancontact and infectious diseases obtainedfrom domestic dogs.7 Similar relationshipscould explain wild carnivore declinesworldwide.8 And recent research indicatesthat above a human population threshold,usually between 15 to 20 people per squarekilometer, elephants move out of certainparts of Zimbabwe. The authors suggestthat this threshold may represent the pat-terns of farming and natural resource usethat result from this population density,rather than elephants’ aversion to humannumbers per se.9
Lack of hard evidence for the linkagehas not deterred scientists from drawingconclusions based upon fundamental eco-logical theories. Several senior ecologistsassert that continued rapid populationgrowth in the tropics is undermining theintegrity of biodiversity-rich ecosystems,and that present demographic trends bearstrongly upon what biodiversity will looklike in the future.10 Yet none of these scien-tists suggest that population stabilizationalone would be sufficient to return extinc-tion rates to background levels. And evenafter population stabilization is achieved,conservationists will likely face challengesrelated to the residual state of our human-dominated planet, such as: human distribu-tion and population density, the long-termviability of remaining species populations,global trends in per capita demand, existing
Though by no means a simple cause and effect relationship, recent analyses concludethat population growth is among a handful of underlying causes of biodiversity loss.In the bar graph, bird and mammal extinctions were summed for 50 year periods. Theyear appearing on the bottom axis is the mid-point of that period.
Source: Data from WCMC, 1992; adapted from graphs by Goudie, 1986.
Trends in Extinction
FIGURE 16
0 •
5 •
10 •
15 •
20 •
25 •
30 •
35 •
40 •
•1950
•2000
•1900
•1850
•1800
•1750
•1700
•1650
Mammal Extinctions
Bird Extinctions
Human Population
•0.0
•1.0
•2.0
•3.0
•4.0
•5.0
•6.0
•7.0
Y E A R
RE
CO
RD
ED
EX
TI
NC
TI
ON
S
HU
MA
N P
OP
UL
AT
IO
N(b
illio
ns)
?

42
Po
pu
lat
ion
A
ct
ion
I
nt
er
na
tio
na
l
tionship between population growth and biodiversi-ty loss.
Habitat Loss and Fragmentation There is consensus among ecologists, with some sup-porting evidence from research, that habitat distur-bance, fragmentation (division and isolation of habi-tat) and outright habitat loss, taken together, currentlyconstitute the leading direct cause of extinction.12
Habitat loss, the easiest to measure of this compositecategory, roughly parallels recent growth of humanpopulation. Since 1950, population has tripled andcropland has doubled in the tropics.13 Today roughly97 percent of population growth and over 99 percentof agricultural expansion occur in developing regions.
Several global studies show close associationsbetween population growth and the decline of species-rich tropical forests in developing countries.14
However, these and other studies caution against over-ly simplistic explanations of changes in forest cover,such as those based upon population growth alone.Accordingly, most analysts of localized deforestation inthe tropics describe a complex mix of factors leadingto habitat loss. These include various combinations ofland inequity and patterns of past settlement, localpopulation growth and migration from growing urbanareas and crowded agricultural zones, commercial log-ging and mining, road-building, settlement schemes,unemployment and poverty, and even political insta-bility and violence.15
Linkages also exist between population growth andaquatic habitat loss. Jointly, agricultural and housingsectors account for nearly three-quarters of annualwater withdrawals worldwide, and historically thesehave been major driving forces behind dam buildingand water diversion.16 The effects of damming—creat-ing barriers to aquatic migration and altering waterdynamics—are, in turn, considered to be among thetwo leading causes (along with biological invasion, seebelow) of aquatic extinction.17 According to the UN
Underlying Causes Direct Causes
Population Change Habitat Loss and Fragmentation * Growth * Density * Migration * Deforestation * Large dams * Coral reef destruction
* Roadways * Wetland drainage
Poverty and Inequity Biological Invasion (Invasive Species and Diseases)* Pressing needs for food and shelter * Competition from invasive species* Lack of education * Lack of options * Emerging diseases
Policy Failures Pollution* Environmentally-destructive subsidies * Synthetic pollutants * Nutrient overloads * Poor controls on species trade and movements* Lack of environmental awareness Over-Harvesting* Poor protections for property *Overhunting *Overfishing
*Over-collecting/pet tradeMarket Failures *Unsustainable logging* Lack of information on species dynamics * Lack of information about Human-Induced Climate Change
biodiversity’s present and potential value * Shift in geographic range* Susceptibility to diseases
Causes of Human-Induced Extinction
FIGURE 17A
Threats to Species in the United States
FIGURE 17B
0% •
20% •
40% •
60% •
80% •
100% •
•Disease
•Over-
Exploitation
•Pollution
•Alien
Species
•Habitat Loss and
Fragmentation
D I R E C T C A U S E O F T H R E A T
SP
EC
IE
S A
FF
EC
TE
D 85%
49%
24%17%
3%
Studies tend to separate the causes of biodiversity loss into direct causes, the factors most immediately linked toextinction, and underlying causes which are often called root causes. Generally working in combination, these under-lying causes control the type, frequency and intensity of the more direct causes of biodiversity loss.
Despite the increasing threat of speciesinvasions and pollution to biodiversityin the United States, habitat loss andfragmentation remain the major sourceof threat to imperiled species. Becausemany species are subject to multiplethreats, percentages add up to morethan 100 percent.
Source: D.S. Wilcove and others, 1998.

43
Na
tu
re
’s
Pla
ce
Commission on Sustainable Development, experience indi-cates that “special attention” is required to keep aquaticecosystems intact in countries withdrawing more than 20 per-cent of their fresh water supplies for annual use.18 Thoughdata quality is relatively poor for this measure, it is estimatedthat at least 47 countries presently fit this category.19
Biological Invasion A recent review of global species decline ranks biological inva-sion (processes by which species become established in ecosys-tems to which they are not native) as the number two cause ofglobal biodiversity loss.17 A study of threatened species in theUnited States came to a similar conclusion. Despite internation-al agreements and elaborate border controls set up to preventbiological invasion, the frequency at which invading speciesare establishing themselves appears to be on the rise. Populationgrowth has probably not been the most critical cause underly-ing biological invasions. Historically, most invasive specieshave been unleashed deliberately or carelessly by individualsignorant of the potential for economic harm. Yet populationgrowth’s effects are nonetheless discernable.
Biological surveys of human settlements illustrate this com-plex relationship. Several studies report greater counts of birdand plant species in parks, along roadsides, and around ruralhousing than in comparable forests. Yet high tallies in theseareas can often be explained by the added presence of orna-mental and invasive species.20 Port cities tend to act as launch-points for biological invasion. In San Francisco Bay, for exam-ple, one exotic marine species establishes itself on average, every12 weeks.21 Denser human settlement means significant shiftsin soil chemistry22 and more frequent soil disturbance. Suchbasic changes can encourage the proliferation of invasive species.
Population growth expands the scale of trade and transportupon which many countries now depend. By 1990, more than1.2 million tourists were arriving in foreign destinations eachday.23 Over 86,000 merchant vessels ply the seas, emptyingcargo and ballast thousands of miles from their point of origin.24
The daily movements of people, resources and species acrossgeographic barriers that once isolated them could increasewith globalization of trade, population growth, and the inte-
Demand for food and for basic shelter tends to closely parallel human population growth. For acountry to meet these basic needs using its own natural resources, it must experience develop-ment sprawl or intensification, and most often some combination of the two. Each response canhave dramatic consequences for biological diversity. Imports and exports of food also affect thescale of demand. And transportation networks, economic productivity, affluence and public poli-cies tend to shape the geographic patterns of housing and urban growth.
Habitat Loss and Fragmentation, Spread of
Invasive Species
Concentrated Pollutants, Changes in Water Cycle and
Aquatic Ecosystems
IntensifiedFarming
(increased fertilizer,water use, pesticides,and livestock waste)
UrbanConcentration
CroplandExpansion
HousingSprawl
Population GrowthIncreased
Demandfor Food
IncreasedDemandfor Shelter
Limited Alternatives: Population Growth and Responsesin Agriculture and Housing
FIGURE 18

44
Po
pu
lat
ion
A
ct
ion
I
nt
er
na
tio
na
l
Among the most convincing evidence of population growth’s rela-tionship to biodiversity comes from an unexpected source: a collec-tion of unintended experiments that are byproducts of late-20th
century hostilities and tensions. In the unpopulated Demilitarized Zonethat straddles the 250-kilometer border between North and South
Korea—no one’s idea of a wildlife refuge—researchers recently discoveredseveral species of animals and plants thought to have disappeared from the
Korean peninsula. After 50 years of military standoff, the zone’s biodiversityis now so much richer than the surrounding countryside that Korean and inter-
national environmental organizations are working to turn the area into a cross-border national park.1
Similarly, Soviet-Chinese tensions beginningin 1960 discouraged settlement and development in
parts of the Amur-Sakhalin region of Siberia, now the lastoutpost of some of Russia’s most threatened species, including theAmur tiger, Amur leopard, Blakiston’s fish-owl, and red-crowned andwhite-naped cranes. Several Russian ecologists have raised privatefunds and donated their expertise in an effort to protect more than200 square kilometers of Siberian forest and wetland in this region.2
In the United States, huge military reserves and security zones,established around the country’s atomic research laboratories at thebeginning of the Cold War, have become habitat refuges for threat-ened species that are otherwise rare or absent from the surroundinghuman-dominated landscape. For example, some ecologicalresearchers consider Oak Ridge National Laboratory’s 14,000-hectarereservation to be more pristine than most U.S. national parks. TheNature Conservancy tracks roughly 400 animal species and 11,000 plant species in this area alone.3
Many more of these depopulated areas exist around the world. Turning them permanently into conserva-tion reserves—what conservationists are calling “peace parks”—could provide new hopes for conservingmany threatened species and ecosystems.4
References1. K.C. Kim, Science 278 (1997): 242-243.2. S.M. Smirenski and J. Harris, “The Amur Program Activity,” Activity Report (Muraviovka, Russia: Muraviovka Park, 1997). 3. K.S. Brown, Science 282 (1998): 616-617.4. C. Wheal, People and the Planet 7, 4 (1998): 28-30.
Places Apart: Military Tensions and Biodiversity
SOUTH KOREA
NORTH KOREA
CHINA
JAPAN
Y e l l o w S e a
S e a o f J a p a n
Incheon
Pyongyang
Seoul
White-naped crane, Sergei Smirenski

45
Na
tu
re
’s
Pla
ce
trucked to nearby urban markets. Somebushmeat hunting is associated with forestsettlers. The more exotic species end up asfar away as Europe and Asia. Indigenousforest peoples, many of whom depend onwildlife for protein, are either being impov-erished by the trade or drawn into commer-cial hunting themselves.34
Growing demand for many marketablespecies is, in part, linked to populationgrowth. For example, Indonesian wildlifemanagers blame the exotic appetites oflarge populations in northern Asian coun-tries, particularly those with growing pur-chasing power, as the principal motivationfor Indonesia’s bushmeat trade. But on thesupply side, population appears less impor-tant: a few well-organized and well-armed
gration of more of the developing world’speople into the global economy.
Pollution Today, the earth’s biosphere is exposed totens of thousands of chemicals, includingsome 600 pesticides, that were absent dur-ing all pre-human evolution.25 For only afew hundred of these chemicals do scien-tists understand even some of their short-term biological implications. Chemical-intensive agriculture, probably essential atcurrent levels of human population,26 is amajor source of both natural chemical over-loads (particularly nitrogen and phospho-rus) and synthetic-chemical toxicities inaquatic and terrestrial ecosystems. In theUnited States alone, estimates suggest thatmore than 60 million birds are killed annu-ally by pesticides applied to farmland.27
There is also evidence that nitrogen in rain-fall, now between 10 and 100 times thenormal rates in North America and Europe,is upsetting relationships in terrestrial plantcommunities.28
Where people concentrate in urban andsuburban areas, so do nitrogen and phos-phorus-containing compounds—in sewageand organic garbage, in industrial and auto-mobile emissions, and in lawn fertilizers.Exposed soils on road and housing con-struction sites are also significant sources ofpollutant runoff, as dying soil micro-organ-isms release their cell-bound nitrogen intomore soluble forms.29 In a review of 39 ofthe world’s watersheds, researchers con-cluded that population density is the mostpowerful determinant of river-borne nitrates,regardless of the size of the watershed oramount of water flow.30 Nutrient-rich
urban and farmland runoff are thought tobe responsible for the development of about50 coastal “dead zones,” marine environ-ments depleted in oxygen by the massdecay of algae and nearly devoid of othersea life. One dead zone near the outlet ofthe Mississippi River covers 18,000 squarekilometers, an area larger than Kuwait.31
Even larger dead zones are reported in theBaltic and Black Sea.
Today roughly two-thirds of the world’speople live within 150 kilometers of coast-lines. This proportion is projected to rise tothree-quarters by year 2025, adding between1.4 and 2.3 billion coastal dwellers world-wide in just 25 years.32 The ecologicalchanges that will accompany such rapidand concentrated growth will very likelypose a major threat to remaining biodiversi-ty-rich estuaries and coral reefs.33
Over-HarvestingOverhunting, overfishing, overtrapping,and wild plant collecting continue to repre-sent extremely serious threats to manyspecies. This is particularly true when lawsthat restrict and control harvesting areabsent, weak or not enforced, and wheredemand for species is high. Perhaps themost well documented example of over-harvesting is collectively called the bush-meat trade, a market that moves weaponsto forest hunters, and wild animals fromtropical forests to the dinner table. Mammals,including primates, are the prime targets ofbushmeat hunters. But the trade alsoincludes birds, reptiles and amphibians.
Bushmeat hunting has been document-ed in each of the extensive tropical forests.Most of the kill feeds logging camps or is
An innovative study in Buenos Aires that sampled in rural and urban areas showed thatnative plant species were replaced by introduced species—both planted exotics and inva-sive weeds—as urbanization progressed. Source: Adapted from E.H. Rapaport, 1993.
More People, More Non-Native Species
FIGURE 19
•0
•5
•10
•15
•20
•25
H O U S I N G D E N S I T Y(houses per sq. km.)
IN
TR
OD
UC
ED
P
LA
NT
SP
EC
IE
S
100% •
80% •
60% •
40% •
20% •
0% •

46
Po
pu
lat
ion
A
ct
ion
I
nt
er
na
tio
na
l
ing northward as southern populationsdisappear, is perhaps the best document-ed of many cases where global warmingappears to be influencing species distri-butions.61 The threat to biodiversity isnot so much climate change itself, whichhas occurred numerous times in the pastof every living species, but the addedinability of animal and plant species toshift their ranges in response. The unprece-dented pervasiveness of human settle-ment, vegetation change, agriculturalactivity, road-building and vehicular traf-fic—all showing upward trends, thanksin part to population growth—precludessuch responses in the foreseeable future.
As temperature and weather patternschange, what will happen to thosethreatened species now cloistered in pro-tected areas, and surrounded on all sidesby agricultural and urban development?Could reserves be shifted, re-establishedunder the right habitat conditions andrestocked with species? According to onerecent study, a 3 degree Celsius increasein global average temperature—well with-in the range of possibilities over the nextfew centuries—could eliminate 7 to 11percent of North America’s vascular plantspecies.62 Trends in population growthand rapid climate change present a brandnew set of conservation challenges.
ConsiderationsThe following section highlights thecomplex nature of relationships betweenpopulation growth and biological diversi-ty. These complexities are principally
poachers can do the job. And economichardship may make illegal hunting a moreappealing livelihood.35
Animal and wild plant-parts also findtheir way into African and South Americantourist curios, or into South and EastAsian herbal medicines, while much ofthe exotic pet and plant trades are des-tined for North America. Each illegalmarket poses a formidable threat to par-ticular species—especially primates, col-orful mollusks and corals, seahorses, andtropical birds and plants—despite restric-tive national and international laws.
In addition, humans are still hunterson the world’s waters. The IUCN-WorldConservation Union now carries numer-ous once-commercial fish species on itsRed List of threatened species. The south-ern bluefin tuna, the Atlantic halibut, yel-low tail flounder and several species ofshark are among them. In already over-exploited coastal waters throughout thetropics, desperate fishermen have turnedto using small-mesh nets, cyanide anddynamite, thus killing corals and damag-ing supporting reefs, and pushing hun-dreds of tropical marine fish and inverte-brate species towards extinction.36
Humans are also wholesale gatherersof the world’s tree species. The IUCNconcludes that tree felling is the mostimportant impact on tree diversity, andnow lists more than 8,700 tree species asthreatened.37
Human-Induced Climate ChangeA recent census of a butterfly known asEdith’s checkerspot, whose range is shift-
Researchers have found a close relationship between the density of humanpopulation that lives in a watershed, and the amount of nitrates in the water-shed’s primary river. Source: Data from J.S. Cole and others, 1993.
Mississippi
Hudson
Yellow
Yangtze
TiberGanges
Thames
RhineMeuse
•0
•100
•200
•300
•400
•500
P O P U L A T I O N D E N S I T Y(people per sq. km.)
NI
TR
AT
E C
ON
CE
NT
RA
TI
ON
(mic
ro-m
oles
of
nitr
ate
per
liter
)
600 •
500 •
400 •
300 •
200 •
100 •
Rivers in developed countriesRivers in developing countries
Nitrogen Pollution and Population Density
FIGURE 20
Bottom dissolved oxygen less than 2.0 mg/L.
50 km
LouisianaMississippi River
In marine dead zones, such as the one (above) that has developed in theGulf of Mexico, dissolved oxygen in the bottom layer of seawater is present atlevels below 2.0 milligrams per liter. Development of dead zones—where sealife is nearly absent—is associated with the accumulation of large volumes ofnitrogen and phosphorous—containing chemicals that are washed from urbancenters, farms and livestock into coastal marine environments in which thereis limited water mixing. Source: Science, 1998.

47
Na
tu
re
’s
Pla
ce
tant to conservationists. Migration intoand around biologically diverse regions isa critical concern for conservation pro-grams worldwide.44 And for indigenousgroups trying to maintain their culturaltraditions and customary rights to naturalresources, the influx of settlers can meanan end to a way of life and a threat totheir very existence.45
Migration can be an exceptionally pow-erful agent of change, especially whenadded on top of already high rates of natu-ral increase. In the forested Petén region ofthe Yucatan Peninsula, for example, migra-tion has pushed rates of annual popula-tion growth to between 8 and 10 percent,more than three times the growth rate ofGuatemala as a whole.46 Similarly, immi-gration from mainland Ecuador to theGalapagos Archipelago could double theislands’ resident population in 7 to 12years.47
The question is, why now? Why arethe most remote and biologically-richecosystems experiencing such pressuresfrom migration? One answer is, arguably,that these ecosystems are all that remain.For example, few migrants would now bemoving into these inhospitable and onlymarginally arable lands if land of greaterpotential were not already claimed, or ifjobs were available. And though clearlyimportant, population growth is not theonly factor activating human movement.Today’s cumulative distribution of popu-lation—occupying virtually all land ofprime agricultural potential and packinghabitable coastlines—has been greatlyinfluenced by historic and political pat-
due to variations among human social andeconomic systems, and in their capacitiesto transform nature and to respond to threatsof biodiversity loss. Each topic discussedbelow should be an important considera-tion in policymaking, and worthy of furtherresearch.
Indigenous People Recent research casts doubts on notionsthat technologically primitive peoples everlived harmoniously with the full comple-ment of biodiversity that they first encoun-tered. More likely, Homo sapiens arrived innew lands and hunted the largest and mosteasily harvested animal species for food, oftendriving the majority of them to extinction.40
That said, there is ample evidence thatmany human tribal groups settled intovarious patterns of co-existence with theremaining, perhaps less vulnerable, plantand animal species. Some indigenousgroups continue such patterns today, oftenholding knowledge that is key to conserv-ing and utilizing the species around them.Substantial evidence suggests that somecultures have actively promoted the abun-dance of particular species either by peri-odically burning vegetation to increasegame species, by developing sophisticatedrestraints on hunting, or by adapting forestgardening techniques fostering local nativeplant and animal species.41 Patterns ofimpact of these indigenous people oftenresemble those of occasional naturaloccurrences such as fires and storms, towhich species have adapted over eons oftime. And many landscapes that we label“wilderness” have, in fact, been influ-
enced by human occupancy in the distantand not-so-distant past.
In general, where such co-existenceoccurs today, indigenous people live atlow levels of technology and in relativeisolation from the global economy.Moreover, population densities tend to beextremely low in these situations, gener-ally less than five people per square kilo-meter over their full hunting and gather-ing ranges. In almost all cases, the sur-vival of these peoples, their languages,knowledge and practices are just as muchin jeopardy as the biodiversity withwhich they are associated.42
Since the late 19th century andthroughout the 20th century, there havebeen numerous cases where indigenouspeoples were removed or restricted fromtribal lands in order to establish nationalparks and other protected areas. The wis-dom of these displacements has been crit-icized. Many might not have occurred hadequitable rights and just compensationbeen extended to these peoples. Currenttrends in conservation ethics encouragebiological conservationists to negotiatearrangements that respect both culturaland biological diversity, and share thebenefits of conserving species among gov-ernments, local people and private com-panies.43
Migration, Land Inequity andPopulation Growth In the short term, migration and naturalincrease in population are easily distin-guishable, and the distinctions are impor-
As temperature and
weather patterns change,
what will happen to those
threatened species now
cloistered in protected
areas, and surrounded on
all sides by agricultural
and urban development?

48
Po
pu
lat
ion
A
ct
ion
I
nt
er
na
tio
na
l
by retirement incomes and factors thatallow greater separation between homesand conventional urban workplaces.54
The trend raises concerns among wildlifemanagers, not only because of habitatloss, but because of the inevitable growthof predatory pet populations and thespread of invasive plant species.
While industrialized countries current-ly account for a disproportionately largeshare of housing, requirements for shelterin developing countries are projected tomore than double by the middle of the21st century.55 This upsurge in housingneeds is projected as a result of popula-tion growth combined with a gradualshift to fewer people per household. Thus,there is a type of housing momentum—atendency for per capita housing needs toincrease even while population growthslows. Today between one-fourth andone-fifth of all households in the industri-alized countries are single-person house-holds. A similar trend is expected tooccur in developing countries as familysize becomes smaller and economiesindustrialize.56
The Population Pressure Transition:Development and Its Effects on Protected Areas Governments worldwide have acceptedthe notion of protected areas—the IUCNterm for parks and reserves, many ofwhich have the conservation of biologicaldiversity as part of their mandate. Overthe past decade, the total amount of ter-restrial protected area in the world hasincreased by nearly 40 percent, most of it
terns of conquest, colonization, roadbuilding, government-subsidized migra-tion, and, very often, the grosslyinequitable distribution of land.48
Agricultural Intensification and ReforestationStudies suggest that in some farmingareas, particularly those with adequaterainfall or irrigation, the declines in percapita arable land and increases in landvalue that routinely accompany populationgrowth can act as inducements to intensifyfarming—to apply more labor and tech-nology, to abandon grazing for farming,and to produce more food per hectare.49 Arecent review of some 70 case studies, allof them from farming communities inmountain areas in developing countries,found that these communities are oftensites of environmental restoration, such astree planting and water management.50
The review also points out, however, thatplanting trees and building terraces, thoughcritical environmental improvements, arenot the same as maintaining native forestsand their species. Native species and vari-eties are lost throughout the conversion tofarmland and settlement—the most sensi-tive disappear at the early stages. Agroforestryand erosion control (which often employnon-native species) were never designedto maintain the full complement of nativespecies and natural ecosystems.51
In terms of food production, agricul-tural intensification has been enormouslysuccessful. Despite rapid populationgrowth, malnutrition is down slightlyfrom a peak around 1970 when over 900
million people were chronically malnour-ished. And by one estimate crop intensifi-cation has spared—at least temporarily—an additional 27 percent of Earth’s habit-able land surface from conversion to agri-cultural use.52 Still, intensive agricultureis not an ecologically benign response topopulation growth or to shifts in per capi-ta consumption. High concentrations ofchemical nutrients and animal wastes,the signature of intensive food-productionsystems, have proved difficult to containsafely, even in industrial countries.53
So far humans have met many of theenvironmental challenges of unprecedent-ed population growth. In a sense, we areadapting to ourselves in large numbers,and in some cases we are doing that well.But will most other species survive oursuccess in this endeavor? That is a verydifferent environmental challenge.
Housing Momentum: Trends inUrbanization and Sprawl Like food production, housing construc-tion and home services (water, energyand waste disposal) tend to accommo-date population growth. Patterns of con-centration and suburban sprawl vary con-siderably between countries. Suburbansprawl tends to consume agricultural landand its water supplies, including any ofthe habitat that farmland protected.
Urban concentrations tend to concen-trate pollutants, dramatically affectingaquatic and coastal marine ecosystems.The United States is experiencing majorhousing construction near environmental-ly pristine areas, a trend probably driven
In a sense, we are
adapting to ourselves in
large numbers, and in
some cases we are
doing that well. But
will most other species
survive our success?

49
Na
tu
re
’s
Pla
ce
Suburban Predators
Where there are people, there are pets. And while house pets bring a great dealof satisfaction to their owners, they are, after all, introduced species. As such,their numbers and activities can affect biological diversity, particularly when
significant numbers roam outdoors. Some ecologists suggest that many of our environmental problems with pets stem
from pets’ abilities to thwart some of nature’s most fundamental rules. When preypopulations decline in numbers in the wild, so do wild predators—but not popula-tions of cats and dogs, which are protected by feeding and household shelter. Also,predator-pet populations are not as limited by territoriality, as is the case for manywild predators.
While several pet species are known to affect native species, the case againstpoorly managed house cats is perhaps the best documented of all. In the UnitedStates, domestic cats (of which there are at least 60 million in U.S. homes and per-haps 30 to 40 million more feral) are estimated to kill over a billion native smallmammals and, conservatively, 200 million birds annually.1 To date, domestic catshave been implicated, to varying degrees, in the endangerment of at least six speciesof North American birds and small mammals, and in the extinction of more than 20animal species in Australia.2
Diseases common among both dogs and house cats afflict related native preda-tors. African wild dog populations, now numbering fewer than 5,000, are threatened,in part, by rabies and canine distemper, and viral infections transmitted to them pri-marily by domestic dogs.3 Likewise, the viruses causing feline leukemia and felinedistemper have spread from domestic cats into populations of North American moun-tain lions.1
Pet population densities respond to both rising human affluence and populationgrowth. How pets have been managed has clearly affected biological diversity, andwill likely influence its future in our human-dominated world.
References1. J.S. Coleman and others, “Cats and Wildlife: A Conservation Dilemma,” Extension Bulletin
(Madison: Cooperative Extension Service, Univ. of Wisconsin, 1997).2. D. Pimentel and others, “Environmental and Economic Costs Associated with Non-indigenous
Species in the United States,” (submitted). 3. R. Woodroffe and J.R. Ginsburg, Oryx 33 (1999): 132-142.

50
Po
pu
lat
ion
A
ct
ion
I
nt
er
na
tio
na
l
living in industrialized countries accountfor some 86 percent of all private con-sumption, and over 80 percent of worldtrade. In 1998, donor countries providedonly 0.23 percent of their combined grossnational product to international develop-ment assistance, far short of the UnitedNations’ target of 0.7 percent.61 Increasingforeign assistance could have major impli-cations for the developing world, for socialas well as environmental programs, includ-ing biodiversity conservation. While ulti-mate responsibility for conserving speciesrests with the countries wherein thosespecies originally reside, there is currentlymuch more interest in industrialized coun-tries in saving certain tropical species andecosystems (and more financial resources,as well) than currently exists in the trop-ics themselves.
Institutions: the Rules of the GameFor conservation scientists, ongoingupward trends in demand for naturalresources forebode a bleak future forbiological diversity. There is good news,however. Demand is not all that counts.To restrict the flow of natural resourcesand to control access to them, nationsrely on what social scientists call mod-ern institutions—rules of law, marketsand property rights, and governmentprograms and policies. And the successor failure of these institutions make itdifficult to predict precisely how popula-tion growth or changes in per capitaconsumption will ultimately affect natu-ral resources.62
There is bad news, too. Scholars of
from increases in the developing world.57
Despite these gains, the process is contro-versial. Disputes arise over each new orexpanded protected area, and tensionsover use and access often persist for gen-erations after boundaries are drawn.
In developing countries, pressuresfrom growing populations have mostoften been exerted from expanding settle-ment within and around the edges of parksand reserves. The weakest of thesereserves, or “paper parks” as conservation-ists call them, lack the funding and politicalcommitments to deter illegal resource useand species loss.
Population-related pressures on protect-ed areas do not necessarily fade awaywith development and enforcement ofreserve boundaries. They merely shift. Inindustrialized countries, impacts are exert-ed at long distances. For example, bound-aries of the Everglades National Park andAudubon’s Rowe Sanctuary on the PlatteRiver in the United States are amply pro-tected, yet both reserves have suffered sig-nificant habitat degradation because ofirrigation projects and growing urban useupstream. Yearly freshwater flows throughthese ecosystems register as a mere frac-tion of what passed through 150 yearsago—and it was to these past levels thatnative plants and animals originally adapt-ed. By comparison, many less policedreserves in developing countries are lessthreatened.58
Thus, despite a century of conserva-tion legislation and litigation in the indus-trialized countries, thousands of speciesoutside the tropics are threatened with
extinction. Because public reserves inNorth America and Europe were mostoften set up to preserve picturesque land-scape and historic sites or to controlrecreational and timber resources, ratherthan to conserve biodiversity, the indus-trialized countries face large gaps inspecies protection. For example, recentstudies in the U.S. state of Utah ledresearchers to conclude that between 25and 40 percent of the state’s vegetationtypes are at risk due to a lack of formalprotection.59 Suburban development,growing demand for natural resourcesand rising land prices could make futureland acquisitions and conservationagreements increasingly difficult.
Global Inequality and Consumption The world’s wealth is unequally distrib-uted and current trends lean towardeven greater inequalities. Presently, thepoorest one-fifth of the world’s popula-tion average less than a dollar of incomea day and account for less than 2 per-cent of all private consumption.60 Howindustrial countries deal with globaldevelopment, and how the wealthy andeducated of each nation deal with thepoorest segment of their society, willlikely have important implications forthe future of biological diversity. Simplyput, species loss can create economicrisks that are chiefly long-term, whilemany of the world’s poor face uncertain-ties about tomorrow’s meals. Povertyforces people to take sustenance fromthe most unprotected of resources.
The 20 percent of world population
Scholars of economic
history conclude that
institutions tend to work
best for those who make
their rules—and wild
species are, of course, not
making the rules.

51
Na
tu
re
’s
Pla
ce
for temporarily maintaining somespecies in off-site facilities like zoos andgermplasm banks, than anywhere withintheir native range.67
Population growth is, and has clearlybeen, an important underlying cause ofrecent losses to biological diversity. Justas clearly, it is not the sole culprit, nordo pressures from population growth,density or migration work alone. Putsimply, human-induced biodiversity losscan neither be fully understood nor canit be resolved, in practice, from this per-spective alone. Yet, in the presence ofpopulation growth, the notion of sus-tainability is, as ecologist EdwardWilson puts it, “but a fragile theoreticalconstruct.”68
economic history conclude that institu-tions tend to work best for those whomake their rules63—and wild species are,of course, not making the rules.Government subsidies are a case in point:for example, bringing in the 1994 worldfish catch was estimated to cost $124 bil-lion but was worth only $70 billion atdockside. Timber harvests, grazing allot-ments and settlement schemes in manycountries, including industrialized coun-tries, receive subsidies that weaken theabilities of markets to limit over-harvest-ing.64
Ours is a world in which species,many teetering on the brink of extinction,have no legal rights to continue existing.Biodiversity’s survival in an environmentof contentious politics, population growth,economic inequity, and fast-paced globalenterprise will, to a large extent, dependon how well laws, policies and the mar-ketplace promote biological conservation.For this reason, the degree to which scien-tists and environmentalists are able toinfluence these institutions will be criticalfor biodiversity’s future. Here, developingcountries lag.
Presently, the developing world—home to around 80 percent of the world’spopulation and the vast majority of itsbiodiversity—can claim just 30 percent ofthe world’s scientists and technicians.65
Of these, a relatively small proportionnow work in fields directly relevant tobiodiversity conservation, and a dispro-portionate number of these are concen-trated in Brazil, Mexico, India and EastAsia.66
Patterns of LossThe bulk of evidence suggests that thereare patterns of biodiversity loss associat-ed with population growth—patternsthat are repeated and clear, yet neithersimple nor entirely inalterable. Today,ecosystems populated at low densitiesvary widely in their conditions. Someremain nearly pristine, while others havereceived extensive damage from naturalresource extraction, pollution and bio-logical invasion. In more heavily settledareas, a close association betweenincreasing population density and biodi-versity loss appears clearer. Logically,the risks will be greater, and probablymore difficult—and thus more expensive—to avoid through regulation andinvestment.
Ecologist Michael Soulé concludesthat failed institutions and rapid popula-tion growth have placed powerful con-straints around what biological programscan conserve of fading biodiversity. Andbecause of these constraints, there arefew places in the world where creatingnew reserves and passing protective leg-islation are enough, by themselves, tosave native species and ecosystems.Sometimes these simple prescriptionsare not appropriate at all. Programs likeagro-forestry, shade-grown coffee, pri-vately-owned ventures in ecotourism,and multi-use community propertyschemes can be key components innational biodiversity strategies. Andwhen political systems are unstable inareas where population pressure contin-ues to build, there may be more hope
. . . there are few
places in the world
where creating new
reserves and passing
protective legislation
are enough, by
themselves, to save
native species and
ecosystems.

52
Po
pu
lat
ion
A
ct
ion
I
nt
er
na
tio
na
l
Over the past two decades, environmentalists have come torealize that marketing biodiversity’s many products, andreturning the profits to local owners and caretakers, can pro-
vide powerful incentives for conserving biodiversity. Still, on bal-ance, biodiversity has fared poorly in the global marketplace. Moreoften than not, property rights (rules of use or ownership, andpenalties for breaking those rules) are absent for wild species. Atbest, those rules are vague or hard to enforce. And typically, thereis little accurate knowledge about the response of species to har-vest and use. Without adequate property rights and knowledge,and without affordable substitutes for evolution’s unique products,competition among suppliers has repeatedly overwhelmed conser-vation efforts and outcries of public concern.
The passenger pigeon, for example, the most ubiquitous NorthAmerican bird in the early 19th century and once a delicacy, owesits extinction in part to markets. Today 69 percent of known fishstocks are in decline.1 Thirty-seven species of seahorses andpipefishes are on IUCN’s Red List of Threatened Animals, most ofthem harvested to low levels to meet the demands of the Asianmedicinal trade. And many other species—from the bluefin tuna,now fetching thousands of dollars per individual, to the Africanwhite rhinoceros, whose horn is more valuable than gold in partsof Asia—can thank market pressures for their positions on theedges of survival.
So what does population growth have to do with it? Propertyrights protect productive work and investment, and try to minimizeconflicts among resource users. It was likely that an increase inpopulation density first motivated early societies to establish localsystems of tenure—rights to use land, rivers and their resources.2
In today’s world, with 6 billion people and powerful commercialinterests, strict property arrangements are more appropriate thanever. Economists have concluded that without property rights thatare clear and enforceable, population growth can lead to greaterdemand and use of resources, and ultimately to over-harvest anddepletion.3
Property values tend to increase as local population grows, making it difficult to purchase adequate land to protect species. Source: Data from U.S. Census Bureau, 1998.
People and Property Values—California, 1990
FIGURE 21
Biodiversity, Property Rights and Population Growth
•1
•200
•400
•600
•800
•1400
•1200
•1000
P O P U L AT I O N D E N S I T Y(people per sq. km.)
AV
ER
AG
E A
SS
ES
SE
D V
AL
UE
OF
1 S
QU
AR
E K
ILO
ME
TE
R(m
illio
ns o
f U
S $)
100 •
90 •
80 •
70 •
60 •
50 •
40 •
30 •
20 •
10 •
0 •

53
Na
tu
re
’s
Pla
ce
References1. M.E. Soulé, “Conservation: Tactics for a Constant Crisis,” Science
253 (1991): 744-750, p. 745. 2. The synopsis of the Forest Fragments Project borrows from a longer
review in: E.O. Wilson, The Diversity of Life (Cambridge: HarvardUniv. Press, 1992).
3. Fundação Tropical de Pesquisas e Tecnologia “André Tosello,”http://www.bdt.org.br/bdt/bdff/, 1993 (last accessed, February 10,1999).
4. M.E. Soulé, Science 253 (1991): 744; J.A. McNeeley and others,“Human Influences on Biodiversity,” in Global BiodiversityAssessment, ed. V.H. Heywood (Cambridge: Cambridge Univ. Press& UNEP, 1995); P. Stedman-Edwards, The Root Causes ofBiodiversity Loss: An Analytical Approach, Macroeconomics forSustainable Development Office (Washington, DC: World WideFund for Nature, 1997); WRI, IUCN, and UNEP, Global BiodiversityStrategy: Guidelines for Action to Save, Study and Use Earth’s BioticWealth Sustainably and Equitably (Washington, DC: WorldResources Institute, 1992).
5. V. Dompka, ed. Human Population, Biodiversity and Protected Areas:Science and Policy Issues (Washington, DC: American Associationfor the Advancement of Science, 1996); P. Goriup, ed. Populationsand Parks, Parks 8, 1 (1998); S. Brechin, S.C. Surapaty, L. Heydir,and E. Roflin, “Protected Area Deforestation in South Sumatra,Indonesia,” George Wright FORUM 11, 3 (1994): 59-78.
6. D.J. Forester and F.E. Machlis, “Modeling Human Factors that Affectthe Loss of Biodiversity,” Conservation Biology 10, 4 (1996): 1253-1263; also see: R.F. Noss and A.Y. Cooperrider, Saving Nature’sLegacy: Protecting and Restoring Biodiversity (Washington, DC:Island Press, 1994).
7. R. Woodroffe and J.R. Ginsburg, “Conserving the African Wild Dog,Lycaon pictus. I. Diagnosing and Treating Causes of Decline,” Oryx33, 2 (1999): 132-142.
8. R. Woodroffe, personal communications, 1999.9. R. Hoare and J. Du Toit, “Coexistence Between People and
Elephants in African Savannas,” Conservation Biology 15, 3 (1999):633-639; J.S.C. Parker and A.D. Graham, “Elephant Decline:Downward Trends in African Elephant Distribution and Numbers (I& II),” International Journal of Environmental Studies 34 (1989): 13-26, 287-305.
10. N. Myers, “Population and Biodiversity,” in Population – TheComplex Reality, ed. F. Graham-Smith (London: The Royal Society,1994), 117-135; E.O. Wilson, The Diversity of Life, 1992; P.R. Ehrlichand A.H. Ehrlich, Extinction: the Causes and Consequences of theDisappearance of Species (New York: Random House, 1981); P.H.Raven, “The Politics of Preserving Biodiversity,” BioScience 40, 10(1990): 769-774.
11. N. Myers, “Population and Biodiversity,” 1994; A. Goudie, Human
Local conservation efforts are also affected. Population growth is amongfactors elevating land prices, making it expensive to purchase or retain landthat is needed to establish and broaden species protection. Even when parksand reserves are established, it is often difficult to keep large animals fromharming property or people, or being harmed themselves near or beyond theboundaries of protected areas.4 And efforts to maintain the boundaries ofprotected areas in populous localities are often deemed impractical, expen-sive or politically costly, particularly in the poorest countries.5
In the future, conservationists may also need to consider how populationgrowth relates to community-based resource management programs.6 Theseprograms have focused on arranging property rights in ways that distributebenefits of commercial use of biodiversity to local people and thus encour-age conservation. Perhaps the most widely recognized example is Zimbabwe’sCommunal Areas Management Programme for Indigenous Resources (CAMP-FIRE), which sets guidelines for community-based wildlife management out-side protected areas. This program distributed $1.6 million in profits to localcommunities during 1995, over 90 percent of it from hunting fees.7
Intriguingly, CAMPFIRE participants themselves have recognized the role ofpopulation growth in reducing the individual shares of wildlife-related rev-enues that now maintain local interest in protecting habitat and wildlife.8
References1. FAO, Fisheries Circular, 920 FIRM/C920 (Rome: FAO, 1997).2. E. Boserup, in New Palgrave: A Dictionary of Economics, eds. J. Eatwell and others (New
York: Stockton Press, 1987).3. E. Ostrom and others, Science 284 (1999): 278-282; NRC, Population Growth and Economic
Development: Policy Questions (Washington, DC: National Academy Press, 1986). 4. R. Woodroffe and J.R. Ginsberg, Science 280 (1998): 2126-2128. 5. S. Lusli, in Human Population, Biodiversity and Protected Areas: Science and Policy Issues,
ed. V. Dompka (Washington, DC: American Association for the Advancement of Science,1996), 189-198.
6. N. Salasfsky, in Natural Connections: Perspectives in Community-Based Conservation, ed. D.Western and R. M. Wright (Washington, DC: Island Press, 1994), 448-471; M. E. Soulé,Science 253 (1991): 744-750.
7. C. Pye-Smith, People and the Planet 7 (1998): 18-19.8. S. Metcalfe, in Natural Connections: Perspectives in Community-Based Conservation, 161-
192.

54
Po
pu
lat
ion
A
ct
ion
I
nt
er
na
tio
na
l
Pollution of Surface Waters with Phosphorus andNitrogen,” Issues in Ecology 3 (1999).
30. J.J. Cole, B.L. Peierls, N.F. Caraco, and M.L. Pace,“Nitrogen Loading of Rivers as a Human-DrivenProcess,” in Humans as Components of Ecosystems,1993, 141-162; R.W. Howarth and others, “RegionalNitrogen Budgets and Riverine N & P Fluxes for theDrainages to the North Atlantic Ocean: Natural andHuman Influences,” Biogeochemistry 35 (1996): 75-139.
31. N.N. Rabalais and others, “Nutrient Changes in theMississippi River and System Responses on theAdjacent Continental Shelf,” Estuaries 19 (1996):386-407.
32. D. Hinrichsen, “Coasts Under Pressure,” Peopleand the Planet 3, 1 (1994): 6-9.
33. D. Bryant, L. Burke, J. McManus, and M. Spalding,Reefs at Risk: A Map-Based Indicator of Threats tothe World’s Coral Reefs (Washington, DC: WorldResources Institute, 1998).
34. J.G. Robinson, K.H. Redford, and E.L. Bennett,“Wildlife Harvest in Logged Tropical Forests,”Science 284 (1999): 595-596; S. Lahm, “Gabon’sVillage Hunting: Assessing Its Impact,” AfricanPrimates 2, 1 (1996): 23-24; A.L. Rose, “TheAfrican Forest Bushmeat Crisis: Report to ASP,”African Primates, IUCN/SSC 2, 1 (1996): 32-34.
35. P. Waldman, “Taste of Death: DesperateIndonesians Devour Country’s Trove of EndangeredSpecies,” Wall Street Journal, Oct. 26, 1998, A1,A8.
36. L. Bolido and A. White, “Reclaiming the IslandReefs,” People & the Planet 6, 2 (1997): 22-23.
37. S. Oldfield, C. Lusty and A. MacKinven, The WorldList of Threatened Trees (Cambridge, U.K.: WorldConservation Press, 1998).
38. C. Parmesan, “Climate and Species’ Range,”Nature 882, 29 (1996): 765-766.
39. L.E. Morse and others, The Preliminary Effects ofClimate Change on the Native Vascular Flora ofNorth America: A Preliminary Climate EnvelopesAnalysis, EPRI TR-103330 (Palo Alto: Electric PowerResearch Inst., 1993).
40. P.S. Martin and R.G. Klein, eds. QuaternaryExtinctions: A Prehistoric Revolution (Tucson: Univ.of Arizona Press, 1984).
41. J. Alcorn, “Indigenous People and Conservation,”Conservation Biology 7 (1993): 424-426; W. Balee,“Ka’apor Ritual Hunting,” Human Ecology 13, 4
Impact on the Natural Environment (Cambridge, MA:MIT Press, 1986); F. Cheever, “Human Population andthe Loss of Biological Diversity: Two Aspects of theSame Problem,” International Journal of Environmentand Pollution 7, 1 (1997): 62-71.
12. J.A. McNeeley and others, “Human Influences onBiodiversity,” 1995, p. 736 (graph attributed to Tuckerand Heath, 1994, no citation); D.S. Wilcove and others,“Quantifying Threats to Imperiled Species in the UnitedStates,” Bioscience 48, 8 (1998): 607-615.
13. R.A. Houghton, “The Worldwide Extent of Land-useChange,” Bioscience 44, 5 (1994): 305-313.
14. M.T. Rock, “The Stork, the Plow, Rural Social Structureand Tropical Deforestation in Poor Countries?,”Ecological Economics 18 (1996): 113-131; A. Mather,“Global Trends in Forest Resources,” Geography 72, 314(1987): 1-15; R. Drigo and A. Marcoux, PopulationDynamics and the Assessment of Land Use Changes andDeforestation (Parts 1 & 2), (Rome: FAO, 1999).
15. M.C. Cruz, C.A. Meyer, R. Repetto, and R. Woodward,Population Growth, Poverty, and Environmental Stress:Frontier Migration in the Philippines and Costa Rica(Washington, DC: World Resources Institute, 1992);K.M. Cleaver and G.A. Schreiber, The Population,Agriculture and Environment Nexus in Sub-SaharanAfrica (Washington, DC: World Bank, 1992); P. Howardand T. Homer-Dixon, Environmental Scarcity andViolent Conflict: the Case of Chiapas, Mexico(Washington, DC: American Association for theAdvancement of Science, 1995); M. Cropper, C.Griffiths, and M. Mani, “Roads, Population Pressuresand Deforestation in Thailand, 1976-89,” PolicyResearch Working Paper, 1726 (Washington, DC: WorldBank, Environmentally Sustainable Development Dept.,1997); For a review of case studies see: N. Myers, “TheWorld’s Forests: Problems and Potentials,”Environmental Conservation 23, 2 (1996); T. Gardner-Outlaw and R. Engelman, Forest Futures: Population,Consumption and Wood Resources (Washington, DC:Population Action International, 1999).
16. World Resources Institute, World Resources, 1998-99:Environmental Change and Human Health (New York:Oxford Univ. Press, 1998), p. 304.
17. J. Tuxhill and C. Bright, “Losing Strands in the Web ofLife,” in State of the World, 1998, ed. L. Starke(Washington, DC: Worldwatch Institute, 1998), 41-58.
18. UN Commission on Sustainable Development,“Comprehensive Assessment of the FreshwaterResources of the World,” E/CN.17/1997/9 (New York:United Nations, 1997).
19. World Resources Institute, World Resources, 1998-99: Environmental Change and Human Health,Table 12.1.
20. J.A. McNeely and others, “Human Influences onBiodiversity,” 1995, pp. 757, 775-776; E.H.Rapoport, “The Process of Plant Colonization inSmall Settlements and Large Cities,” in Humans asComponents of Ecosystems, ed. M. J. McDonnelland S.T.A. Pickett (New York: Springer-Verlag,1993), 190-207.
21. A.N. Cohen and J.T. Carlton, NonindigenousSpecies in a United States Estuary: A Case Study ofthe Biological Invasions of the San Francisco Bayand Delta (Springfield, VA: National TechnicalInformation Service, 1995); C. Bright, Life Out ofBounds: Bioinvasion in a Borderless World(Washington, DC: Worldwatch, 1998).
22. R.V. Pouyat, M.J. McDonnell, and S.T.A. Pickett,“Litter Decomposition and Nitrogen Mineralizationin Oak Stands Along an Urban-Rural Land UseGradient,” Urban Ecosystems 1 (1997): 117-131.
23. World Tourism Organization, Global TourismForecasts to the Year 2000 and Beyond, RegionalForecasting Studies: South Asia (Madrid: WTO,1994).
24. Institute of Shipping Economics and Logistics,Shipping Statistics 1997 (Bremen, Germany: ISEL,1997).
25. L. Nash, “Water Quality and Health” in Water inCrisis: A Guide to the World’s Fresh WaterResources, ed. P. Gleick (Oxford, U.K.: Oxford Univ.Press, 1993), 25-39.
26. V. Smil, “Population Growth and Nitrogen: anExploration of a Critical Existential Link,”Population and Development Review 17, 4 (1991):569-601.
27. J. Bourne, “Bugging Out,” Audubon, March-April,1999, 71-73.
28. F. Berendse, R. Aerts, and R. Bobbink,“Atmospheric Nitrogen Deposition and Its Impacton Terrestrial Ecosystems,” in Landscape Ecology ofa Stressed Environment, ed. C.C. Vos and P. Opdam(London: Chapman & Hall, 1994), 104-121; D.Tilman, “Biodiversity: Population Versus EcosystemStability,” Ecology 77 (1996): 350-363.
29. P.M. Vitousek and others, “Human Alteration ofthe Global Nitrogen Cycle: Sources andConsequences,” Ecological Applications 7, 3 (1997):737-750; S. Carpenter and others, “Nonpoint

55
Na
tu
re
’s
Pla
ce
(London: Oxford Univ. Press, 1996).57. J.A. McNeely and G. Ness, “People, Parks, and
Biodiversity: Issues in Population-EnvironmentDynamics,” 1996.
58. P. Waak, ed. Sharing the Earth: Cross-CulturalExperiences in Population, Wildlife and theEnvironment (Washington, DC: National AudubonSociety, 1992).
59. J.M. Scott and M.D. Jennings, “Large-Area Mapping OfBiodiversity,” Annals of the Missouri Botanical Garden85, 1 (1998): 34-47.
60. UN Development Programme, Human DevelopmentReport 1998 (New York: Oxford Univ. Press, 1998).
61. Organisation for Economic Co-operation andDevelopment, “Financial Flows to DevelopingCountries in 1998: Rise in Aid; Sharp Fall in PrivateFlows,” Press Release (Paris: OECD, 1999).
62. R. P. Cincotta and R. Engelman, Economics and RapidChange: the Role of Population Growth, PAI OccasionalPaper, 3 (Washington, DC: Population ActionInternational, 1997).
63. D.C. North, Institutions, Institutional Change andEconomic Performance, (Cambridge: Cambridge Univ.Press. 1995), p. 16; I. Adelman, C.T. Morris, H. Fetini,and E. Golan-Hardy, “Institutional Change, EconomicDevelopment, and the Environment,” Ambio 21, 1(1992): 106-110.
64. N. Myers, “The World’s Forests: Problems andPotentials,” Environmental Conservation 23, 2 (1996):156-168; N. Myers, “Marine Fisheries: Two MacroConstraints,” Environment and Development Economics2 (1997): 91-96; D.M. Roodman, Paying the Piper:Subsidies, Politics and the Environment, WorldwatchPaper, 133 (Washington, DC: Worldwatch Institute,1996); N. Myers and J. Kent, Perverse Subsidies: Tax $sUndercutting Our Economies and Environments Alike(Winnipeg: International Institute for SustainableDevelopment, 1998).
65. UN Development Programme, Human DevelopmentReport 1998 (New York: Oxford Univ. Press, 1998).
66. J. Cracraft, “Charting the Biosphere: Why We MustBuild Global Capacity for Biodiversity Science,” Paperpresented at the National Academy of Sciences,Washington, DC, October 29, 1997; J. Cracraft, “TheUrgency of Building Global Capacity for BiodiversityScience,” Biodiversity and Conservation 4 (1995): 463-475.
67. M.E. Soulé, Science 253 (1991): 744.68. E.O. Wilson, The Diversity of Life, 1992, p. 328.
(1985): 485-510; W. Cronon, Changes in the Land:Indians, Colonists and the Ecology of New England(New York: Hill and Wang, 1984); M. Williams,“An Exceptionally Powerful Biotic Factor,” inHumans as Components of Ecosystems, 1993, 24-39.
42. L. Sponsel, “The Yanomami Holocaust Continues,”in Who Pays the Price: the Sociocultural Context ofEnvironmental Crisis, ed. B.R. Johnson(Washington, DC: Island Press, 1994), 37-46; A.T.Durning, Guardians of the Land: IndigenousPeoples and the Health of the Earth. WorldwatchPaper, 112 (Washington, DC: Worldwatch Institute,1992); R.A. Mittermeier, P. Robles Gil, and C.Goettsch Mittermeier, Megadiversity: Earth’sBiologically Wealthiest Nations (Mexico, C.F.:Cemex, 1997).
43. L. Hannah, African People, African Parks(Washington, DC: Conservation International,1992); A. T. Durning, Guardians of the Land:Indigenous Peoples and the Health of the Earth,1992.
44. A. deSherbinin and M. Freudenberger, “Migrationto Protected Areas and Buffer Zones: Can We Stemthe Tide?,” Parks 8, 1 (1998): 38-53.
45. O.J. Lynch and K. Talbott, Balancing Acts:Community-Based Forest Management andNational Law in Asia and the Pacific (Washington,DC: World Resources Institute, 1995); L. Sponsel, inWho Pays the Price: the Sociocultural Context ofEnvironmental Crisis, 1994.
46. M. Fort and L. Grandia, “Population andEnvironment in the Petén, Guatemala,” in ThirteenWays of Looking at a Tropical Forest, ed. J.D.Nations (Washington, DC: ConservationInternational, 1999), 85-91; for rates directly sur-rounding the Calakmul Preserve, see J. Ericson,M.S. Feudenberger, and E. Boege, “PopulationDynamics, Migration, and the Future of theCalakmul Biosphere Reserve,” Program onPopulation and Sustainable Development,Occasional Paper, 1 (Washington, DC: AmericanAssociation for the Advancement of Science, 1999);F. Meyerson, “Guatemala Burning,” AmicusJournal, Fall, 1999, 28-31.
47. C. MacFarland and M. Cifuentes, “Case Study:Ecuador,” in Human Population, Biodiversity andProtected Areas: Science and Policy Issues, ed. V.Dompka (Washington, DC: American Association
for the Advancement of Science, 1996), 135-188. 48. A. deSherbinin and M. Freudenberger, Parks 8, 1
(1998): 38-53.; A.S.P. Pfaff, What DrivesDeforestation in the Brazilian Amazon? Evidencefrom Satellite and Socioeconomic Data, PolicyResearch Working Paper, 1772 (Washington, DC:World Bank, Environmentally SustainableDevelopment Dept., 1997).
49. E. Boserup, The Conditions of Agricultural Growth:The Economics of Agrarian Change UnderPopulation Pressure (Chicago: Aldine, 1965); M.Tiffen, M. Mortimore, and F. Gichuki, More People,Less Erosion: Environmental Recovery in Kenya(New York: John Wiley & Sons, 1994).
50. S.R. Templeton and S.J. Scherr, “Effects ofDemographic and Related Microeconomic Changeon Land Quality in Hills and Mountains ofDeveloping Countries,” World Development 27, 6(1999): 903-918.
51. F. Smith, G. Daily, and P. Ehrlich, “HumanPopulation Dynamics and Biodiversity Loss,” in TheEconomics and Ecology of Biodiversity Decline: TheForces Driving Global Change, ed. T. Swanson(Cambridge, U.K.: Cambridge Univ. Press, 1995),125-141.
52. I.M. Goklany, “Saving Habitat and ConservingBiodiversity on a Crowded Planet,” Bioscience 48,11 (1998): 941-953; also see P. Waggoner, J.Ausubel, and I. Wernick, “Lightening the Tread ofPopulation on the Land: American Examples,”Population and Development Review 22, 3 (1996):531-545.
53. V. Smil, “Population Growth and Nitrogen: anExploration of a Critical Existential Link,”Population and Development Review 17, 4 (1991):569-601; P.M. Vitousek and others, EcologicalApplications 7 (1997): 737.
54. D.M. Mageean and J.G. Bartlett, “Using PopulationData to Address the Problem of Human Dimensionsof Environmental Change,” in GIS Solutions inNatural Resource Management: Balancing theTechnical-Political Equation, ed. S.A. Morain (SantaFe, NM: OnWood Press, 1998), 193-205.
55. L.R. Brown, G. Gardner, and B. Halweil, BeyondMalthus: Sixteen Dimensions of the PopulationProblem, Worldwatch Paper, 143 (Washington, DC:Worldwatch Institute, 1998).
56. UN Centre for Human Settlements, An UrbanizingWorld: Global Report on Human Settlements, 1996

56
Po
pu
lat
ion
A
ct
ion
I
nt
er
na
tio
na
l
wilderness areas have been identified: the UpperAmazonia and Guyana Shield, the Congo RiverBasin, and forests of New Guinea and Melanesia.These are the most pristine and least fragmentedof all species-rich regions of the world, and amongthe last places in the tropics where indigenousforest-dwelling peoples have any hope of main-taining their traditional lifestyles. An estimated 75percent or more of the naturally vegetated habitatremains in each of the three major tropical wilder-ness areas.3
What Makes the Hotspots So “Hot”? Analysis of hotspots is based on the number ofendemic species (species found nowhere else inthe world) of vascular plants. These are plantswith internal vessels to conduct water and nutri-ents, like grasses, flowering plants, trees andferns. Although the intact, naturally vegetatedecosystems within the hotspots cover less than 2percent of the Earth’s land surface, over 131,000species are found within these hotspots as endemics.These account for roughly 44 percent of theworld’s plant diversity. In addition, the hotspotsinclude habitat for thousands more plant speciesthat are also found outside the hotspots.3
D espite the efforts of dedicated conserva-tionists of many different nationalities,significant numbers of today’s livingspecies will become extinct in the com-ing decades. To minimize the loss to
future human generations, international environ-mental policymakers, strapped by limited funds,will have to act quickly, wisely and in the rightlocations. How will they manage to do this?
In fact, a tool exists. Conceived by British ecol-ogist Norman Myers in the late 1980s,2 and expand-ed upon by Myers, Russell Mittermeier and scien-tists at Conservation International, the global bio-diversity hotspots call attention to 25 terrestrialregions of the world where biological diversity ismost concentrated and the threat of loss mostsevere. In all of the hotspots, fully intact naturalecosystems have already been reduced to 30 per-cent or less of their original land surface area.And in nine hotspots—including the Philippines,Madagascar and Brazil’s Atlantic Forest Region—intact natural habitats are down to less than 10percent of their original extent.4 As presentlydrawn, the boundaries of the 25 biodiversityhotspots enclose around 12 percent of the Earth’shabitable land surface (omitting Antarctica andother areas of bare rock and ice).
Along with the hotspots, three major tropical
By concentrating on such areas
where needs are greatest and where
the pay-off from safeguard measures
would also be greatest, conserva-
tionists can engage in a more sys-
tematized response to the challenge
of large-scale extinctions.1
Norman Myers, 1988
Ecologist
V. Human Population Growth and theBiodiversity Hotspots
V. Human Population Growth and theBiodiversity Hotspots
©Rebecca Janes

57
Na
tu
re
’s
Pla
ce
to prevent biodiversity loss, even withsignificant regulation and investment.
Results of the Analysis As of 1995, more than 1.1 billion peoplewere living within the 25 biodiversityhotspots. Population density in thehotspots was, on average, almost twicethat of the world as a whole. Despitedeclines in human fertility in severalregions of the world, this study suggeststhat population growth, which ranges from1.0 to 3.2 percent annual growth in 24 ofthe 25 hotspots, remains an important fac-tor in global biodiversity conservation. Onaverage, population in the hotspots isgrowing by 1.8 percent annually, 38 per-cent faster than the world populationgrowth rate of 1.3 percent per year, andeven significantly above the developingworld’s rate of 1.6 percent per year.
Around 75 million people, or 1.3 per-cent of the world’s population, presentlylive within the three major tropical wilder-ness areas. These tropical forests coveraround 6 percent of the Earth’s land sur-face, an area larger than China. AmongEarth’s most biologically diverse regions,these forests are experiencing the mostrapid growth in human population: 3.1percent annually, on average, a level overtwice the global rate of population growth.
Growth rates for developed countrypopulations situated in hotspots are, inmost cases, substantially higher than theworldwide average for developed regions,which is 0.3 percent. Migration, both inpresent and past decades, is the principal
Because high plant diversity is, by andlarge, a good indicator for a richness of ter-restrial animal species, the hotspots help setgeographical priorities for world animalconservation as well. The hotspots are esti-mated to contain somewhere around 35percent of all terrestrial vertebrates (whichexcludes fish) as endemics. There are alsoindications that at least 75 percent of all ter-restrial animal species listed as threatenedby the IUCN-World Conservation Union arefound within this relatively small area.3
Hotspot analysis is an ongoing process.Revisions to the current list are likely in thefuture. And the global biodiversity hotspotsare not the only world-wide conservationpriority system. Others include World WildlifeFund’s (WWF) global 200 ecoregions,BirdLife International’s endemic bird areas,and WWF/IUCN’s centers of plant diversity.4
Future Risk and UncertaintyThe fate of a significantly large proportionof terrestrial biodiversity is linked to thefuture of these 28 biologically diverseregions. But what is that future, and whatare its risks? Realistically, we cannot knowprecisely. Economic and cultural factors,both global and local, will matter. So willpolicy responses to biodiversity loss. Andmost of these are not measurable, or arepresently unavailable for evaluation.
Population density and populationgrowth have been measured. Both implyrisks to biodiversity, for both will assuredlyplay important roles in determining theextent and nature of human dominion overecosystems, and in the success or failure of
conservation efforts. Rates of growth ofhuman population provide some insightinto the future hotspot population, andallude to densities it might achieve insome localities.
In the following analysis byPopulation Action International, popula-tion density and growth rates have beenestimated for each of the hotspots andmajor tropical wilderness areas. Theanalysis uses geographical data fromConservation International; a map of1995 population density produced bythe National Center for GlobalInformation Analysis, at the Universityof California at Santa Barbara, California,in the United States; and national andsub-national population growth datafrom various sources.5 [See Appendices1f, g and j.]
This method cannot assess the fullrange of risks on specific groups oforganisms or species. And there arenumerous sources of uncertainty, par-ticularly at low levels of human popula-tion density. Here, human-caused dis-turbance can vary dramatically—nativehabitat could be nearly pristine, inhabit-ed by relatively small groups of indige-nous people who subsist with littleimpact on the environment. Or, signifi-cant biodiversity loss may have resultedprevious to widespread settlement, fromland uses like logging, grazing, miningand hunting that have extracted naturalresources, abetted biological invasion ordumped pollutants. That variationdiminishes with higher population den-sities, in which case it becomes harder
As of 1995, more than
1.1 billion people were
living within the 25
biodiversity hotspots.

58
Po
pu
lat
ion
A
ct
ion
I
nt
er
na
tio
na
l
5. Chocó-Darién-Western EcuadorOriginal extent remaining intact: 24%Original extent protected: 6.3%Location: coastal plains of Colombia, Ecuador,
eastern PanamaVegetation types: tropical moist broadleaf
forestsEndemic plant species: 2,250Hotspot area: 134,000 sq. km. Population: 5,930,000Population density: 44 persons per sq. km.Population growth rate: 3.2% per year
World’s richest assemblages of lowland plantsand animals. High rates of deforestation duringpast half-century. Ecuador’s lowland wet forestnow below 10 percent of original cover. Speciesinclude cycad palms, jaguar, cotton-top tamarin,harpy eagle.
6. Brazilian CerradoOriginal extent remaining intact: 20%Original extent protected: 1.2%Location: central BrazilVegetation types: tropical woodlands and savannasEndemic plant species: 4,400Hotspot area: 2,160,000 sq. km. Population: 14,370,000Population density: 7 persons per sq. km.Population growth rate: 2.4% per year
One of largest savanna-woodland complexes. Siteof commercial agricultural expansion.Agriculture, charcoal production and water proj-ects are main threats. Species include manedwolf, giant anteater, Spix’s macaw.
3. Caribbean Original extent remaining intact: 11%Original extent protected: 15.6%Location: the Florida Everglades and the
Caribbean IslandsVegetation types: tropical moist broadleaf forest,
pine forests, wetlands, mangrovesEndemic plant species: 7,000Hotspot area: 264,000 sq. km. Population: 38,780,000Population density: 136 persons per sq. km.Population growth rate: 1.2% per year
Ancient flora and fauna, distinct from mainland.Everglades contain some 11,000 species of seed-bearing plants, 25 orchid varieties, 323 birdspecies. Islands are regional centers for marineendemism. Species include the solenodon (smallinsectivores), Caribbean manatee, many endemicfrogs, marine turtles.
4. Atlantic Forest RegionOriginal extent remaining intact: 8%Original extent protected: 2.7%Location: eastern coast of Brazil, eastern
Paraguay, small area in northern ArgentinaVegetation types: tropical moist broadleaf forestEndemic plant species: 6,000Hotspot area: 824,000 sq. km. Population: 65,050,000Population density: 79 persons per sq. km.Population growth rate: 1.7% per year
Known in Brazil as Mata Atlantica, in Argentinaas Selva Misionera o Paranaense. 54 percent ofregion’s trees, 80 percent of primates are endem-ic. Less than 5 percent of once vast forest stillintact. Coastal development and urban sprawlthreaten remainder. Primates such as golden liontamarin and black-faced lion tamarin endemic toregion, as are maned sloth, red-billed currasow.
K e y t o t h e G l o b a l B i o d i v e r s i t y H o t s p o t s a n d M a j o r T r o p i c a l W i l d e r n e s s A r e a s
Global Biodiversity Hotspots1. Tropical AndesOriginal extent remaining intact: 25%Original extent protected: 6.3%Location: highlands of Colombia, Ecuador,
Bolivia, Peru, VenezuelaVegetation types: tropical moist broadleaf for-
est, dry forests, montane grasslands Endemic plant species: 20,000Hotspot area: 1,415,000 sq. km. Population: 57,920,000Population density: 40 persons per sq. km.Population growth rate: 2.8% per year
Endemics include 320 bird, 558 reptile andamphibian species. Origin of several importantcrops and genetic relatives. Two-thirds of origi-nal natural vegetation cover already lost.Habitat for Peruvian yellow-tailed woolly mon-key, mountain tapir, spectacled bear, marblespatula-tailed hummingbird.
2. Mesoamerica Original extent remaining intact: 20%Original extent protected: 12.0%Location: Central America, from Panama north to
central west coast of MexicoVegetation types: tropical moist broadleaf for-
est, tropical dry forest, mangrovesEndemic plant species: 5,000Hotspot area: 1,099,000 sq. km. Population: 61,060,000Population density: 56 persons per sq. km.Population growth rate: 2.2% per year
Distinctive continental species. Winter range formany North American song birds. Ranching,coastal development and agriculture pose seri-ous threats. Species include the resplendentquetzal, ocelot, mountain squirrel.
©RebeccaJanes

7. Central ChileOriginal extent remaining intact: 30%Original extent protected: 3.1%Location: Chile Vegetation types: mediterranean shrublands, temper-
ate rainforest.Endemic plant species: 1,605Hotspot area: 320,000 sq. km. Population: 9,710,000Population density: 29 persons per sq. km.Population growth rate: 1.4% per year
Chilean mattoral shrublands highlydiverse. Region includes only tem-perate rainforest in South America,which is home to over 3,000plant species. Natural vegeta-tion reduced to less than one-third of original. Most denselypopulated part of Chile.
8. California FloristicProvince
Original extent remaining intact: 25%
Original extent protected: 9.7%Location: the northern portion of the
Mexican state of Baja California, tojust north of the border of the U.S. stateof California
Vegetation types: mediterranean shrublands, coniferous forest
Endemic plant species: 2,125Hotspot area: 236,000 sq. km. Population: 25,360,000Population density: 108 persons per sq. km.Population growth rate: 1.2% per year
Chaparral shrublands along coast are heavily threat-ened. Mountain ranges home to ancient forest rem-nants including redwoods and giant sequoias.Region contains one-fourth of all plant species inthe continental United States and Canada, half ofwhich are endemic.
59
Na
tu
re
’s
Pla
ce
FIGURE 22
By 1995, population density (people per square kilometer) in the global biodiversity hotspots was, on average,almost twice that of the world as a whole. Out of the 25 hotspots (numbered 1 to 25 on the map), 15 hadattained densities higher than the world population density of 42 people per square kilometer. For the timebeing, the three major tropical wilderness areas (A, B, C) remain populated at relatively low densities. Source: Population Action International; data from NCGIA/CIESIN, 1998.
Population Density in the 25 Global Biodiversity Hotspots and Major Tropical Wilderness Areas, 1995
25
8
32
5
1
7
46
A
14
15
11
12
13
10
9
B
21
20
19
16
18
25
17
22
23
24
C
Population Density(people per sq. km.)
Greater than 50
10 - 50
Less than 10

60
Po
pu
lat
ion
A
ct
ion
I
nt
er
na
tio
na
l
9. Madagascar and Indian Ocean Islands
Original extent remaining intact: 10%Original extent protected: 1.9%Location: Madagascar and surrounding
islands, including the Comoros, Mauritius,Mayotte, Reunion, Mascarene, Seychelles
Vegetation types: moist tropical forest, dryforest, savannas, desert, mangroves
Endemic plant species: 9,704Hotspot area: 587,000 sq. km. Population: 15,450,000 Population density: 26 persons per sq. km.Population growth rate: 2.7% per year
About three-quarters of Madagascar’s plantsand animals are endemic. Lemurs, a threat-ened group of primitive primates, are bestknown mammals. Forests now at 20 percentof pre-human extent. Smaller ocean islandsharbor distinctive fauna.
10. Eastern Arc Mountains andCoastal Forests of Tanzania and Kenya
Original extent remaining intact: 7%Original extent protected: 16.9%Location: eastern Tanzania Vegetation types: tropical moist forestsEndemic plant species: 1,400Hotspot area: 142,000 sq. km. Population: 7,070,000Population density: 50 persons per sq. km.Population growth rate: 2.2% per year
Once a site of profuse local evolution. Nowjust half of original cover remains.Usambara Mountains alone contain 50endemic tree species. Threatened by fire-wood collection, agriculture. Home to 18 of20 known species of African violets, 16species of wild coffee, numerous birdsincluding Hartlaub’s turaco.
15. CaucasusOriginal extent remaining intact: 10%Original extent protected: 2.8%Location: Armenia, Azerbaijan, Georgia and
small section of IranVegetation types: temperate montane forests Endemic plant species: 1,600 Hotspot area: 184,000 sq. km. Population: 13,940,000Population density: 76 persons per sq. km. Population growth rate: - 0.3% per year
One of the most biodiverse temperate forestsof Asia. High levels of plant and animalendemism. Remnants of European and Asianfauna, including Caucasian tur, chamoix, ibex,red deer, wolf, bear, lynx.
16. SundalandOriginal extent remaining intact: 8%Original extent protected: 5.6%Location: Indonesian islands of Sumatra, Java
and Borneo, Brunei, peninsular and easternMalaysia.
Vegetation types: tropical moist forests, dryand monsoon forests, alpine meadows, man-groves
Endemic plant species: 15,000Hotspot area: 1,500,000 sq. km. Population: 180,490,000Population density: 121 persons per sq. km.Population growth rate: 2.1% per year
Rainforest and mangroves highly biodiverse,but threatened by agriculture, logging, burn-ing. Among richest flora in Asia. Includes rela-tives of crop and orchard species. Region’smangroves important marine nursing grounds.Species include Sumatran tigers, rhinos, gib-bons, Sunda otter-civet, Bornean tarsier andorang-utans.
11. Guinean Forests of West Africa
Original extent remaining intact: 10%Original extent protected: 1.6%Location: from Nigeria along the southern
portion of West Africa to Sierra Leone andGuinea
Vegetation types: tropical moist broadleafforest, mangroves
Endemic plant species: 2,250Hotspot area: 660,000 sq. km. Population: 68,290,000Population density: 104 persons per sq. km.Population growth rate: 2.7% per year
Some of most species-rich habitats inAfrica. Many plants and animals distinctfrom Congo Basin. Mammals threatened bypoaching, including lowland gorillas andchimpanzees. Species include West Africanmahogany, zebra duiker (a tiny antelope),crowned eagle-hawk.
12. Cape Floristic Province Original extent remaining intact: 24%Original extent protected: 19.0%Location: South AfricaVegetation types: mediterranean shrublands Endemic plant species: 5,682Hotspot area: 82,000 sq. km. Population: 3,480,000Population density: 42 persons per sq. km.Population growth rate: 2.0% per year
Coastal shrubland, known as fynbos, mayhave highest plant species density of anycomparably-sized land ecosystem. 70 per-cent of plant species are endemic. One-thirdof original natural vegetation lost to agri-culture and urban sprawl. Remainderdegraded and highly fragmented.
13. Succulent KarooOriginal extent remaining intact: 27%Original extent protected: 2.1%Location: southwestern Namibia, South AfricaVegetation types: desert succulents Endemic plant species: 1,940Hotspot area: 193,000 sq. km. Population: 460,000Population density: 3 persons per sq. km.Population growth rate: 1.9% per year
Supports roughly 3,500 plant species, morethan half endemic. Distinctive semi-desertcommunities, many over-grazed. Problemsinclude over-pumping groundwater and ille-gal harvest of succulent plants. Speciesinclude centuries-old welwitschia, mountainzebra, black rhino.
14. Mediterranean Basin Original extent remaining intact: 5%Original extent protected: 1.8%Location: coastal and near-coastal parts of
southern Europe, the Middle East andNorth Africa
Vegetation types: mediterranean shrub-lands, montane coniferous forests
Endemic plant species: 13,000Hotspot area: 1,556,000 sq. km. Population: 174,460,000Population density: 111 persons per sq. km.Population growth rate: 1.3% per year
Home to more than 10 percent of all plantspecies, much of it in coastal shrublandsknown as macchia. Southern Europeanmountains home to remnants of oncediverse European fauna. Turkish TaurusMountains particularly rich in plant species.Fauna include chamoix, brown bear, mar-bled polecat, Egyptian vulture. Until lateRoman Era, North Africa supported faunasimilar to present sub-Saharan plains,including elephants, rhino and lion.

17. WallaceaOriginal extent remaining intact: 15%Original extent protected: 5.9%Location: central islands of Indonesia, including
Sulawesi and Moluccas Vegetation types: tropical moist forests, mangrovesEndemic plant species: 1,500Hotspot area: 341,000 sq. km. Population: 18,260,000Population density: 54 persons per sq. km.Population growth rate: 1.9% per year
Extremely high levels of bird, mammaland plant endemism. Moluccan archi-pelago includes hundreds of heavilyforested islands. Mix of Asian line-ages, such as macaques and tar-siers, with Australian lineagessuch as eucalyptus trees andmarsupials.
18. PhilippinesOriginal extent remaining
intact: 8%Original extent protected: 1.3%Location: 7,100 islands of the
Philippines Vegetation types: tropical moist forestsEndemic plant species: 5,832Hotspot area: 293,000 sq. km. Population: 61,790,000Population density: 198 persons per sq. km.Population growth rate: 2.1% per year
Densely populated, population growing rapidly.Numerous vertebrates discovered in recent years.About 8 percent of original forest remains. Over460 endemic vertebrates. Species includePhilippine tarsier, colugo (flying lemur), monkey-eating eagle.
61
Na
tu
re
’s
Pla
ce
Population Growth in the 25 Global Biodiversity Hotspots andMajor Tropical Wilderness Areas, 1995-2000
FIGURE 23
Despite significant declines in human fertility in several regions of the world, human populationgrowth, which ranges from 1.0 to 3.2 percent annual growth in 24 of the 25 global biodiversityhotspots (numbered 1 to 25), remains an important factor in global biodiversity conservation. Thethree major tropical wilderness areas (A, B, C) are, on average, experiencing more rapid growth inpopulation than the hotspots. Population growth in these heavily forested regions, as a whole, is3.1 percent each year, a level over twice the global rate of population growth.Source: Population Action International, see Appendix 1h.
25
Population Growth Rate Above 3.0%2.0 - 3.0%1.0 - 2.0%Less than 1% [see 15]
8
32
5
1
7
6
14
15
11
12
9
B
21
20
16
18
25
17
22
23
24
C
4
A
13
10
C
19

62
Po
pu
lat
ion
A
ct
ion
I
nt
er
na
tio
na
l
23. New CaledoniaOriginal extent remaining intact: 28%Original extent protected: 2.8%Location: island of New Caledonia Vegetation types: tropical moist broadleaf
and dry forestsEndemic plant species: 2,551Hotspot area: 16,000 sq. km. Population: 140,000Population density: 8 persons per sq. km.Population growth rate: 2.1% per year
Endemism due to long geographic isolation.80 percent of plants endemic. Wildly color-ful flowers. Extraordinary endemic reptilesand high degree of endemism among birdsand invertebrates. Original forests down toless than 10 percent of island. Speciesinclude the kagu (a flightless bird), terres-trial crocodiles, giant gecko.
24. New ZealandOriginal extent remaining intact: 22%Original extent protected: 19.2%Location: New Zealand’s North and South
IslandsVegetation types: tropical moist broadleaf
forests and temperate rainforest Endemic plant species: 1,865Hotspot area:
260,000 sq. km. Population: 2,740,000Population density:
11 persons per sq. km.Population growth rate:
1.0% per year
Endemic species evolved separately from ancestors on mainland. Other than bats, no native mammals. Almost all flightless birds now extinct. Grazing and introduced species are greatest threats.Species include the kauri tree, giant ferns,kiwi, crested penguin.
19. Indo-BurmaOriginal extent remaining intact: 5%Original extent protected: 7.8%Location: Eastern Nepal to Eastern India
and Bangladesh, east to Vietnam andHainan Island (China).
Vegetation types: tropical moist broadleafforest, dry and monsoon forests, man-groves
Endemic plant species: 7,000 Hotspot area: 2,313,000 sq. km. Population: 224,920,000Population density: 97.8 persons
per sq. km. Population growth rate: 1.5% per year
Richest endemic bird area in Asia. InIndochina highlands biologists recently cat-alogued 2 mammals: Vu Quang ox and giantmuntjac. Home to tiger, golden langur, less-er panda, clouded leopard, gaur andkouprey (wild cattle), Javan rhinos, severalgibbons (apes), endemic pheasants, Asianelephants and many rare plants.
20. Mountains of South-Central China
Original extent remaining intact: 8%Original extent protected: 2.1%Location: parts of the Chinese provinces of
Sichuan, Gansu, Qinghai, and TibetanAutonomous Region
Vegetation types: temperate forests, grass-lands, alpine meadows
Endemic plant species: 3,500Hotspot area: 469,000 sq. km. Population: 12,830,000Population density: 25 persons per sq. km.Population growth rate: 1.5% per year
One of richest assemblages of forest treesin the world. Many rare animals and plantsendemic to this region, including numerousrhododendrons, the giant panda, goldenpheasant, and copper pheasant.
21. Western Ghats and Sri LankaOriginal extent remaining intact: 7%Original extent protected: 10.4%Location: southwestern Indian states of
Karnataka and Kerala, southwestern SriLanka
Vegetation types: tropical moist broadleafforests
Endemic plant species: 2,180Hotspot area: 136,000 sq. km. Population: 46,810,000Population density: 341 persons per sq. km.Population growth rate: 1.4% per year
Among South Asia’s last remaining tropicalrainforests. Densely populated. WesternGhats home to 84 endemic amphibianspecies. Very high tree diversity including13 species of commercially valuable dipte-rocarp. Uniquely high rainfall forest in SriLanka. Species include Asian leopard,Ceylon giant squirrel, Asian elephant, lion-tailed macaque, Malabar parakeet.
22. Southwest AustraliaOriginal extent remaining intact: 11%Original extent protected: 10.8%Location: southwestern corner of coastal
AustraliaVegetation types: mediterranean shrublandsEndemic plant species: 4,331Hotspot area: 107,000 sq. km. Population: 1,440,000Population density: 13 persons per sq. km.Population growth rate: 1.7% per year
Two-thirds of 5,500 resident plant speciesin coastal kwongan shrublands are endemic.Region well suited to agriculture, grazingand urbanization. Introduced plants posemajor threat. Species include Albany pitcherplant, honey possum, and dragon orchid.
25. Polynesia / Micronesia Original extent remaining intact: 22%Original extent protected: 10.7%Location: Pacific Ocean islands, from the
Samoan Islands and the Federated Statesof Micronesia, to Fiji, and east to Hawaii(U.S.).
Vegetation types: tropical moist broadleafforests and dry forests
Endemic plant species: 3,334Hotspot area: 46,000 sq. km. Population: 2,900,000Population density: 58.4 persons per sq. km.Population growth rate: 1.3% per year
For some islands, over 95 percent ofspecies are endemic. Majority of originalland bird species extinct. Remaining nativebirds, plant species and invertebrates suc-cumbing to biological invasion. Speciesinclude Hawaii’s native hibiscus trees andflightless goose (nene), Fiji iguana, orangedove.
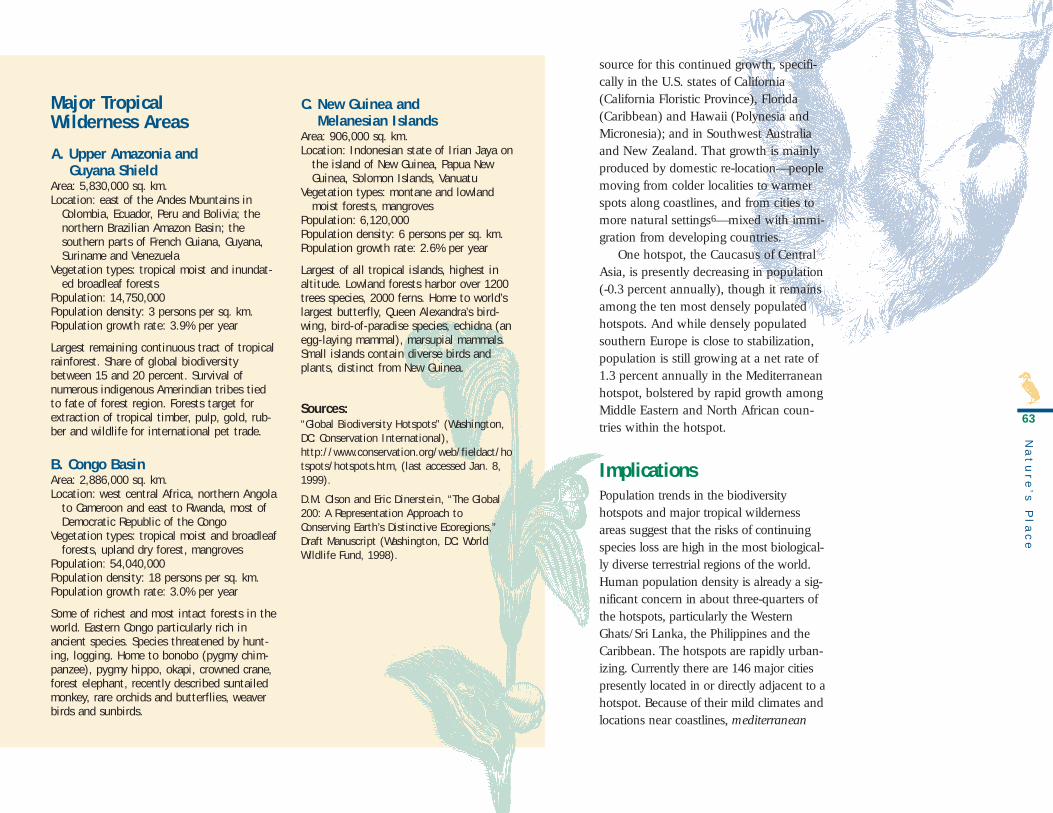
63
Na
tu
re
’s
Pla
ce
Major Tropical Wilderness Areas
A. Upper Amazonia and Guyana Shield
Area: 5,830,000 sq. km.Location: east of the Andes Mountains in
Colombia, Ecuador, Peru and Bolivia; thenorthern Brazilian Amazon Basin; thesouthern parts of French Guiana, Guyana,Suriname and Venezuela
Vegetation types: tropical moist and inundat-ed broadleaf forests
Population: 14,750,000Population density: 3 persons per sq. km.Population growth rate: 3.9% per year
Largest remaining continuous tract of tropicalrainforest. Share of global biodiversitybetween 15 and 20 percent. Survival ofnumerous indigenous Amerindian tribes tiedto fate of forest region. Forests target forextraction of tropical timber, pulp, gold, rub-ber and wildlife for international pet trade.
B. Congo BasinArea: 2,886,000 sq. km.Location: west central Africa, northern Angola
to Cameroon and east to Rwanda, most ofDemocratic Republic of the Congo
Vegetation types: tropical moist and broadleafforests, upland dry forest, mangroves
Population: 54,040,000Population density: 18 persons per sq. km.Population growth rate: 3.0% per year
Some of richest and most intact forests in theworld. Eastern Congo particularly rich inancient species. Species threatened by hunt-ing, logging. Home to bonobo (pygmy chim-panzee), pygmy hippo, okapi, crowned crane,forest elephant, recently described suntailedmonkey, rare orchids and butterflies, weaverbirds and sunbirds.
source for this continued growth, specifi-cally in the U.S. states of California(California Floristic Province), Florida(Caribbean) and Hawaii (Polynesia andMicronesia); and in Southwest Australiaand New Zealand. That growth is mainlyproduced by domestic re-location—peoplemoving from colder localities to warmerspots along coastlines, and from cities tomore natural settings6—mixed with immi-gration from developing countries.
One hotspot, the Caucasus of CentralAsia, is presently decreasing in population(-0.3 percent annually), though it remainsamong the ten most densely populatedhotspots. And while densely populatedsouthern Europe is close to stabilization,population is still growing at a net rate of1.3 percent annually in the Mediterraneanhotspot, bolstered by rapid growth amongMiddle Eastern and North African coun-tries within the hotspot.
ImplicationsPopulation trends in the biodiversityhotspots and major tropical wildernessareas suggest that the risks of continuingspecies loss are high in the most biological-ly diverse terrestrial regions of the world.Human population density is already a sig-nificant concern in about three-quarters ofthe hotspots, particularly the WesternGhats/Sri Lanka, the Philippines and theCaribbean. The hotspots are rapidly urban-izing. Currently there are 146 major citiespresently located in or directly adjacent to ahotspot. Because of their mild climates andlocations near coastlines, mediterranean
C. New Guinea and Melanesian Islands
Area: 906,000 sq. km.Location: Indonesian state of Irian Jaya on
the island of New Guinea, Papua NewGuinea, Solomon Islands, Vanuatu
Vegetation types: montane and lowlandmoist forests, mangroves
Population: 6,120,000 Population density: 6 persons per sq. km.Population growth rate: 2.6% per year
Largest of all tropical islands, highest inaltitude. Lowland forests harbor over 1200trees species, 2000 ferns. Home to world’slargest butterfly, Queen Alexandra’s bird-wing, bird-of-paradise species, echidna (anegg-laying mammal), marsupial mammals.Small islands contain diverse birds andplants, distinct from New Guinea.
Sources: “Global Biodiversity Hotspots” (Washington,DC: Conservation International),http://www.conservation.org/web/fieldact/hotspots/hotspots.htm, (last accessed Jan. 8,1999).
D.M. Olson and Eric Dinerstein, “The Global200: A Representation Approach toConserving Earth’s Distinctive Ecoregions,”Draft Manuscript (Washington, DC: WorldWildlife Fund, 1998).

64
Po
pu
lat
ion
A
ct
ion
I
nt
er
na
tio
na
l
ing agencies, many of which haveincreased funding to biodiversity programsover the past decade. Each agency mustdecide how to invest: whether to concen-trate efforts in the hotspots where thethreats are most immediate, and theremainder of unprotected biodiversity-richhabitat is relatively small; or to dedicatethe lion’s share of its funds to establishreserves enclosing much larger tracts ofrainforest in the tropical wildernessareas.11
Whatever strategies ultimately emerge,geographical patterns of human popula-tion density, growth and migration willcontinue to influence decisions in globalbiodiversity conservation.12 Future demo-graphic patterns, however, are themselvesuncertain. To some extent local populationdensity and migration, particularly as theyoperate by the middle of the 21st century,will be influenced by how quickly theongoing global revolution in reproductiveself-determination is extended to couplesin the biodiversity-rich tropics.
References 1. N. Myers, “Threatened Biotas: Hotspots in
Tropical Forests,” The Environmentalist 8, 3(1988): 178-208, p. 187.
2. N. Myers, The Environmentalist 8, 3 (1988):178; N. Myers, “The Biodiversity Challenge:Expanded Hot-spot Analysis,” TheEnvironmentalist 10, 4 (1990): 243-256.
3. R.A. Mittermeier, N. Myers, J.B. Thomsen,G.A.B. da Fonseca, and S. Olivieri, “BiodiversityHotspots and Major Tropical Wilderness Areas:Approaches to Setting Conservation Priorities,”Conservation Biology 12, 3 (1998): 516-520
4. D.M. Olson and E. Dinerstein, “The Global 200:a Representation Approach to ConservingEarth’s Distinctive Ecoregions,” Draft
Whatever strategies
ultimately emerge,
geographical patterns of
human population
density, growth and
migration will continue to
influence decisions in
global biodiversity
conservation.
shrublands (regions with climates and vege-tation similar to the Mediterranean Basin) areattractive to human settlement. Within the 25hotspots lie 62 cities having over 1 millioninhabitants each. Of these, 22 are within the 5hotspots dominated by mediterranean shrub-lands.
Together, unsustainable natural resourceextraction and the persistent spread of agricul-ture pose a dual threat to tropical forest habi-tat. Within the Southeast Asian hotspotsalone—the Philippines, Wallacea, Sundalandand Indo-Burma—cropland grew by some 11million hectares (roughly the size ofBulgaria) in the decade prior to forest surveystaken in 1992-94.7 Nearly all of this new crop-land was cleared from forest. More recently,rates of deforestation appear to have accelerat-ed, assisted by burning in 1997 and 1998, andby commercial logging that was stepped upduring the recent Asian economic crisis.
Although fertility rates in Brazil andIndonesia have fallen dramatically over thepast decade, pro-migration policies undermineany likelihood that high rates of populationincrease in the three tropical wilderness areaswill slow in the immediate future. A half-cen-tury ago these areas were almost exclusivelythe domains of indigenous hunter-gatherers.Today, only the Amazonian and Guyananforests have densities of less than five peopleper square kilometer. And even here, lowpopulation density is likely to be short-lived. The area’s population growth rate, at3.9 percent per year, is the highest of thethree tropical wilderness areas. If growthcontinues at this rate, the area’s mostlyimmigrant population would double in under19 years. Already, life expectancy at birth for
dwindling indigenous Amazonian popula-tions is roughly 20 years below the Brazilianaverage of 66—and it is falling.8
Tropical wilderness areas are at a cross-roads. Policies applied to these forests have,in the past, resembled those in westernNorth America in the late 19th century thatgranted land to migrants, and concessionsfor logging, mining and grazing. In general,the results have been the same: rapid defor-estation, loss of natural ecosystems, anddepopulation of native peoples. Yet, thereis still time in the tropics to change theoutcome. Recently the government ofSuriname, with assistance from theGlobal Environmental Facility andConservation International, created theCentral Suriname Nature Reserve by put-ting aside some 16,000 square kilometersof rainforest (roughly equivalent to thearea deforested annually in the BrazilianAmazon).10 More large tracts could bereserved for future needs, some as man-aged natural resource areas and indige-nous reserves, others as national parks,recreation sites and research stations.
Population and GlobalBiodiversity Strategies One of the most important tasks for con-servationists in the 21st century will be todetermine where to salvage the scantremains of evolution’s legacy. To that end,the hotspots and other global biodiversityprioritization systems are essential tools.Yet, knowledge of the global biodiversityhotspots does not eliminate a fundamentaldilemma for international donor and lend-

65
Na
tu
re
’s
Pla
ce
Manuscript (Washington, DC: World Wildlife Fund, 1998);A.J. Stattersfield, M.J. Crosby, A.J. Long, and D.C. Wege,Endemic Bird Areas of the World: Priorities for BiodiversityConservation (Cambridge, U.K.: BirdLife International,1998); WWF and IUCN, Centres of Plant Diversity: A Guideand Strategy for Their Conservation, Vols. 1-3 (Cambridge,U.K.: IUCN, 1994 - 97).
5. W. Tobler, U. Deichmann, J. Gottsegen, and K. Maloy, “TheGlobal Demography Project,” Technical Report, 95-6 (SantaBarbara: National Center for Geographic InformationAnalysis, Univ. of California, Santa Barbara, 1995).
6. D.M. Mageean and J.G. Bartlett, “Using Population Data toAddress the Problem of Human Dimensions ofEnvironmental Change,” in GIS Solutions in NaturalResource Management: Balancing the Technical-PoliticalEquation, ed. S.A. Morain (Santa Fe, NM: OnWood Press,1998), 193-205.
7. Calculated from cropland expansion data for countrieswithin the 4 Southeast Asian hotspot boundaries men-tioned in the text. Data are from FAO, and published in:World Resources Institute, World Resources, 1998-99:Environmental Change and Human Health (New York:Oxford Univ. Press, 1998).
8. UN Economic and Social Council, “Review ofDevelopments Pertaining to the Promotion andProtection of Human Rights and Fundamental Freedomsof Indigenous Peoples: Health and Indigenous Peoples,”E/CN.4/Sub.2/AC.4/1996/3/Add.2 (New York: U.N.,1996).
9. Brazil National Institute for Space Research, Monitoringthe Brazilian Amazon by Satellite, 1997 – 1998 (Sao Paolo:Instituto Nacional de Pesquisas Espaciais, 1999); J. Craig,“Ravaging of the Amazon Continues Survey Shows,”Reuters, Jan. 26, 1998.
10. L. Asato, “New Partnership Backs Suriname’s ForestProtection Efforts,” Press Release (Washington, DC:Conservation International), http://www.conservation.org/web/news/pressrel/99-0513.htm, May 13, 1999 (lastaccessed, June 3, 1999).
11. R.A. Mittermeier and others, The Global BiodiversityHotspots (Mexico, D.F.: Cemex, 1999).
12. M.E. Soulé, “Conservation: Tactics for a Constant Crisis,”Science 253 (1991): 744-750; E.D. Wikramanayake and oth-ers, A Conservation Assessment of the Ecoregions of theIndo-Pacific region (Washington, DC: World WildlifeFund/US, in press).
It is on tropical oceanic islands that evolution seems mostwondrously productive. Left in isolation from mainlandpredators and competitors, given tens of millions of years
and just a modest few forms to start with, its processes haveproduced entirely new and unusual repertoires of species.Madagascar, the islands of the Caribbean Sea, Polynesia andthe Philippines are among the best examples. Nowhere does
organic evolution seem more wildly creative—almost exper-imental—as on these islands. And nowhere today are evo-
lution’s creations more threatened. Two major events shaped Madagascar’s biodiversity.
The first was its separation from Africa around 180million years ago, setting off a burst of isolated evo-lution among plant and animal life. The second wasthe arrival of Homo sapiens less than 2,000 yearsago from somewhere in the Indonesian islands. Notlong afterwards, much of what evolution had fash-ioned forever disappeared.
Among the animals that thrived until our ownspecies set foot on Madagascar was the flightless ele-phant bird, one of the largest birds that ever lived. A
pygmy hippopotamus also went extinct, along with agiant tortoise and an aardvark. Two giant lemurs—
Archaeonindris, which was larger than a male gorilla, andMegaladapis, as big as a female gorilla—disappeared after
human arrival, as did a large tree sloth-like lemur calledBabakotia.1 Today humans and their livestock are the only ani-mals on Madagascar weighing over 12 kilograms.2
Despite the losses, Madagascar remains biologically unique.Roughly 80 percent of Madagascar’s plants are endemic. Andthough the island, which is considered part of Africa, repre-sents less than 2 percent of that continent’s land, it is hometo fully a quarter of all African plant species. More species oforchids are native to Madagascar than to the rest of Africa.Thirty species of reptiles and 178 species of frogs—staggering
Hotspot Population Profile: Madagascar
Alan Bornbusch

66
Po
pu
lat
ion
A
ct
ion
I
nt
er
na
tio
na
l
from the UN Population Fund (UNFPA) esti-mates that Madagascar falls short of meetingthe present demand for contraception amonglow-income couples by $650,000 a year.6
Community-Based Population and EnvironmentThe need for family planning and maternalhealth services appears greatest inMadagascar’s countryside, where infant andchild mortality is nearly one-third higher thanin urban areas. However, Madagascar’s HealthMinistry is understandably hesitant about try-ing to move reproductive health services intothe countryside when demand for family plan-ning goes unfulfilled in the island’s rapidlygrowing cities. Most of the few efforts to pro-vide such services are run by non-governmen-tal organizations—including several managedby environmental organizations focused onsaving Madagascar’s remaining biodiversity.Since 1995, APPROPOP, a program sponsored bythe U.S. Agency for InternationalDevelopment, has linked local healthproviders to environmental field projects,each at the edge of a protected area, wherecommunity-based natural resource projectsare already active. One is located near theZahamena Integral Reserve, one nearRanomafana and another near AndohahelaNational Parks.7
These projects have tried to minimizehabitat loss in and around the parks whiledeveloping and encouraging sustainableincome-generating practices in the same gen-
15.4 million by 1998.Four out of five of the country’s workers
are farmers. And three out of four earn lessthan $1 a day.4 Less than one-fifth of ahectare of cropland is available per capita,one of the lowest such figures in the world.To feed their families, new generations ofMalagasy farmers have moved further upslope,burning the island’s remaining tropical forestsfrom the hillsides of its eastern region, andplanting its thin soils with upland rice.Madagascar’s remaining woodlands cover lessthan 20 percent of that which Malay marinersencountered some 15 centuries ago. Then,perhaps, the island held opportunities for thenew migrants. Today, Madagascar’s farmingfamilies are typically poor, conservatively tra-ditional, and situated far from the meagerrural services that their government provides.
Recent surveys show that Malagasy womenexpress the desire for somewhat smaller fami-lies—on average, one child less than thepresent six children per woman recorded.About 19 percent of women who lack accessto family planning services would like to usecontraception to limit childbirth. Another 16percent want to lengthen the period betweenbirths. Studies suggest that delayed child-bearing could substantially reduce infant mor-tality.5 It could also slow the growth of popu-lation by spreading out the time betweengenerations.
Despite the gravity of reproductive healthneeds, Madagascar’s budget for family plan-ning services is only one-fifth the amountspent on conservation efforts. A spokesperson
numbers for one island—have been recordedthere to date, and more are discovered eachyear.
All the world’s 32 species of lemurs liveon Madagascar and nearby islands, andnowhere else. Twenty lemur species arethreatened with extinction, four with onlyslim chances for survival. Less recognized is asecond completely endemic family of small,primitive insect-eating mammals, the
Malagasy tenrecs, compris-ing 30 species. IUCN-WorldConservation Union classi-fies 10 of these as threat-ened.3
Our Own Species During the latter half of the20th century, dramaticdemographic changesoccurred in Madagascar.Responding to modestimprovements in publichealth conditions, mortalityrates declined in the mid-1950s, while fertility ratesremained high. As a result,the rate of annual popula-tion growth climbed to 3.4percent by 1985. The valleysof Madagascar’s centralplateau filled with farms
and began to urbanize. In less than 50 years,the island’s population more than tripled,growing from 4.2 million in 1950 to about
Madagascar 2000 Years Ago
Original Forest Cover
MangroveTropical Moist ForestTropical Dry ForestMostly Non-Forest
Source: Data from WCMC.

67
Na
tu
re
’s
Pla
ce
eral areas. In Ranomafana local villagersmanage tourist campsites, returning pro-ceeds to committees of village elders. Halfof park admittance fees return to villagecommunities for use in conservationprojects.8
These community-based initiatives pro-vide materials and train community membersin a variety of environmentally sound liveli-hoods, from community gardening andsmall-scale aquaculture to beekeeping andecotourism. For their part, health providerson the projects operate mobile health unitsoffering basic health care as well as familyplanning information.
Concern about demographic pressures onwildlife is no doubt among the concernsthat motivate these partnerships, whichcombine local and foreign developmentworkers. But an equally important motiva-tion is simply to respond to pressing healthneeds—needs often articulated clearly bywomen and other community membersthemselves.
Projects that link natural resource con-servation with family planning and repro-ductive health services tend to view eco-nomic development, education and people’scontrol over their own fertility as interrelat-ed and vital to both community well-beingand environmental sustainability. The demo-graphic bonus, if one develops, is merelyone among several important benefits thatresult from this approach.
Some conservationists warn thatimproved services and training programs
could attract more settlers to project sites.In Madagascar, however, population is pro-jected to triple or quadruple by 2050. Therecan be no illusion that failing to provideservices for populations in wildlife-rich areaswill dissuade people from living there. OnMadagascar, biodiversity’s last hope lies in apartnership with its people. And that part-nership requires not only effective naturalresource management but quality health care—including family planning services forthose who seek them.
References1. R.E. Dewar, in Quaternary Extinctions: A Prehistoric
Revolution, eds. P.S. Martin and R.G. Klein(Tucson: Univ. of Arizona Press, 1984).
2. P. Harrison, The Third Revolution (London: I.B.Tauris, 1992).
3. IUCN Red List of Threatened Animals (Gland: IUCN,1996).
4. World Development Indicators 1997 (Washington,DC: World Bank, 1997).
5. G. Refeno and others, “Madagascar: EnqueteNationale Demographiqe et Sanitaire, 1992,”Synthesis Report, Demographic and Health Survey(Antananrivo, Madagascar: Centre National deRecherches sur l’Environnement, 1994).
6. R. Harrabin, “Madagascar: Growing PopulationFuels Environmental Crisis,” The Guardian(London), Wed., June 30, 1999.
7. E. Rabelhasa and D. Whyner, “Evaluation Finaledes AAPS Environmentaux,” Report(Antananarivo, Madagascar: Appui au Programmede Population/Planification Familiale, 1998).
8. Institute for the Conservation of TropicalEnvironments, “Conservation Efforts,” (StonyBrook, NY: State Univ. of New York, StonyBrook), http://notes.cc.sunysb.edu/CAS/icte.nsf/webform/conservation, February 5, 1998(last accessed, December 5, 1998).
Madagascar 1995
Current Forest Cover
Population Density
The valleys of
Madagascar’s
central plateau
filled with farms
and began to
urbanize. Source: Data from WCMC, NCGIA/CIESIN.
Remaining Forest cover
More than 300150 - 30050 - 15015 - 505 - 150 - 5
Alan Bornbusch
The valleys of
Madagascar’s
central plateau
filled with farms
and began to
urbanize.

68
Po
pu
lat
ion
A
ct
ion
I
nt
er
na
tio
na
l
Hotspot Population Profile: Urbanization in the California Floristic Province
Not all of the global biodiversity hotspots are situated in the trop-ics. Endemic plant species—the biological criteria for hotspots—are found in great diversity in mid-latitude coastal shrublands that
are graced with mild and stable mediterranean-like climates. Five suchhotspots have been identified: the California
Floristic Province in the UnitedStates, Southwest Australia, the
Cape Floristic Province ofSouth Africa, Central Chile
and the MediterraneanBasin itself.
These five hotspotsare also preferred human
habitat. Within theirboundaries lie nearly 40
percent of all the urban areasthat have reached 1 million inhabi-
tants within the 25 hotspots. Among the most notable clashes between biodiver-
sity and human population growth is one at the western edge of thecontinental United States, extending southward onto the Baja CaliforniaPeninsula of Mexico. This hotspot, the California Floristic Province, iswitnessing some of the most rapid population growth in the industrial-ized world, with few signs of the slowdown that characterizes popula-tion growth in much of the rest of the world.
Nearly half the plant species that are unique to the United Statesare found in this modest-sized hotspot, along with an estimated 30,000species of insects, 341 birds, 145 mammals, 61 reptiles and 37 amphib-ians. Outside of Australia and New Zealand, no other similar-sized areaof a developed country can compare.1
Yet consider what California has lost as its population has grownfrom fewer than 1 million people in 1850 to more than 34 million atthe end of the 20th century.2 Only 1 percent of the state’s original grass-land remains, as does just 5 percent of its once-pervasive redwoodforests and 6 percent of its interior wetlands.3
As with all such correlations between human populationgrowth and biodiversity, no method for quantifying the causalrelationship is readily apparent. But a quick glance at the LosAngeles metropolitan area, home to nearly 14.5 millionCalifornians (1997 estimate), makes clear how inhospitabledense human settlement can be for wild species. After decadesof population growth and suburban development, the LosAngeles-Anaheim-Riverside urban conglomerate covers about88,000 square kilometers, an area a little larger than the stateof Maine.2 The area’s crowded highways carry more than 7 carsfor each 10 of the area’s human beings.4 And its sanitation sys-tems release around 800 million gallons (3 million metric tons)of minimally treated sewage directly into the Pacific Oceanevery day, placing nearby marine life at risk.5
California’s growing economy has offered mobility to millionswho have migrated from other parts of the United States, fromLatin America and from Asia. The scale of growth and many ofits impacts, on humans as well as on biological diversity, arenonetheless clear. California can claim more threatened speciesthan any other U.S. state except Hawaii. In 1997, 200 of itsspecies were listed by the U.S. Fish and Wildlife Service asendangered, including the famed northern spotted owl. Even theofficial “state mammal,” the grizzly bear, survives only on thestate flag. It disappeared from California’s forests in 1922.5
References 1. R.F. Noss and R.L. Peters, Endangered Ecosystems: A Status Report on
America’s Vanishing Habitat and Wildlife (Washington, DC: Defenders ofWildlife, 1995).
2. U.S. Bureau of the Census, Doc. ST-97-1 (Washington, DC: U.S. Dept. ofCommerce, 1997).
3. R.A. Mittermeier and others, Megadiversity: Earth’s BiologicallyWealthiest Nations (Mexico, C.F.: Cemex, 1997).
4. U.S. Federal Highway Administration, Selected Highway Statistics andCharts (U.S. Dept. of Commerce, 1995).
5. S. Shroeder, California Population Project: Protecting the Environment byReducing the Birth Rate (Sacramento, CA: Planning and ConservationLeague Foundation, 1996).
Sally Ethelston

69
Na
tu
re
’s
Pla
ce
A Plan of ActionEach of us can take action to preserve theplanet’s wealth of living species. This report’srecommendations are addressed to policymak-ers, to scientists and conservationists, and tothe general public:
• The conservation of biological diversityshould be elevated to a high priority indonor agencies, nations and communi-ties. While innovative conservation pro-grams deserve support and funds, thereis a pressing need to encourage broaderunderstanding of biodiversity and itsvalue to society. To further this objective,governments and donors should work toexpand the ranks of biodiversity scien-tists and environmental educators in thespecies-rich tropical countries.
Work should continue on innovative approach-es to biodiversity conservation, especiallyfinancial mechanisms that spread the cost ofsuch strategies among all who can affordthem. The biodiversity that finds its home inpoor countries matters to the survival andquality of life of all humanity. Mechanismsneed to be developed that encourage all nationsto shoulder the costs of species preservation,wherever it occurs, according to their capacityto pay and the benefits they and their descen-dants will derive.
The current rapid rate of species extinc-tion, out of all proportion with back-ground rates and thus clearly relatedto human activities, should warn usthat society is approaching a classic
double bind. Continued population growthand steady increases in per capita consump-tion mean that we are accumulating moreneeds and more wants, much of which canonly be satisfied by the biological worldaround us. Yet, in failing to conserve biodi-versity, humanity is simultaneously eliminat-ing those naturally endowed options thatmay be key to improving our own lives, andthe lives of our descendents.
It will take decades, even centuries, tosecure the long-term survival of the richestpossible diversity of non-human life. This is
one reason the future growth of humanpopulation is so critical an issue—
and so important to address inthis context. Policies that leadto a stabilized human popu-lation, though often missingin recommendations for con-
serving biodiversity, may beamong the most important in the
long run. And they must work intandem with strategies that act more directly
to limit further losses of species and maintainfunctioning ecosystems.
The protection of … major parks and
reserves is conceivable, if there is a
willingness to share resources on a
global level – to provide major support
from industrialized countries not
merely for the protection of parks and
reserves but for the creation of condi-
tions in which all people can live with
a measure of human dignity. The deci-
sive factors will be social, political,
and economic; they will not be limited
simply to [society’s] willingness to
conserve.1
Peter H. Raven,
1986
Evolutionary
Botanist
Director, Missouri
Botanical Garden
VI. StrategiesVI. Strategies
Rio de Janeiro, Vicky Hancock

70
Po
pu
lat
ion
A
ct
ion
I
nt
er
na
tio
na
l
Convention on Biological Diversity. Thisinternational treaty is designed to estab-lish rights to original genetic materialsand promote commercial incentives thatencourage nations to identify, conserveand thoughtfully manage those speciesand ecosystems within their nationalboundaries. So far, 175 countries haveratified the Convention on BiologicalDiversity.2 Despite the importance of thistreaty to global conservation, the UnitedStates is not one of them. Clearly, itshould be.
Human population and its dynamicsgo unmentioned in the Convention onBiological Diversity, despite language call-ing for minimizing adverse impacts onbiodiversity. Clearly, biodiversity will fareworse if population size and density fol-low high-growth scenarios rather thanlow-growth ones. Just as clearly, a rangeof social policies and programs will ulti-mately influence the future of biodiversi-ty. Among them are population programsconsistent with the Programme of Actionagreed to by 179 countries (including theUnited States) at the 1994 InternationalConference on Population and Development(ICPD) in Cairo.
The ICPD Programme of Action affirmedthe principle that population policy mustbe based in social investments aimed athuman development and in the rights ofwomen and men to determine for them-selves the timing of childbirth and thesize of their families. Among the mostimportant of these social investments isthe provision of family planning servicesfor all who seek to use them, and that
Subsidies that lead to biodiversity lossshould be ended, and biodiversity man-agement plans should become key ele-ments in national and community plan-ning. Efforts are needed to more accurate-ly assess and publicize the long-term valueof functioning ecosystems and the speciesthey shelter. And legislation that specifical-ly protects species—such as theEndangered Species Act in the UnitedStates—deserves support in all countries,as do measures designed to keep intactnatural terrestrial, aquatic and marineecosystems. National and communityplanning should require that economicdevelopment not put at risk critical biolog-ical resources that can never be replaced.
Education on the value of biodiversityis vitally needed now. Most policymakersand much of the general public cannotdefine the term biodiversity and have littleidea why scientists and conservationistsfind its accelerating loss alarming. Thatloss is unlikely to be reversed until thosewho care about it find effective ways tocommunicate biodiversity’s importanceand beauty to the news media and thegeneral public.
International donors can do more toincrease the number of professionals spe-cializing in biodiversity. Developing coun-tries, where the vast majority of biologicaldiversity resides, face extreme shortages ofbiodiversity scientists and technicians withbiodiversity-relevant skills. Developingcountries also need more and better equippedenvironmental watchdogs and advocates,and programs that promote an environ-mentally-aware and educated public.
To succeed in the long term, conserva-tionists will need to influence the underly-ing conditions that drive biodiversity loss.Many scientists no doubt consider a broad-er role in development to be outside theirexpertise. Yet, most of the larger conservationorganizations—IUCN-World ConservationUnion, the World Wildlife Fund andConservation International among them—have integrated social scientists into theirprofessional (and mostly biologically-trained)staff. These organizations see the need toinfluence social and economic conditions,including those that affect population growth,so that their biological programs can succeed.
• The Convention on BiologicalDiversity, an international agreementaimed at maintaining the planet’s bio-diversity and equitably sharing itsbenefits, deserves the support of allnations and peoples. Negotiatorsseeking to improve it and further itsprogress should consider the interac-tions between species survival andhuman population dynamics. Byslowing the growth of populationwhile improving the capacity of allpeople, especially women, to managetheir own lives, the social investmentstrategies called for at the 1994International Conference onPopulation and Development supportand amplify other measures to con-serve Earth’s complex web of life.
At the 1992 Earth Summit (the UNConference on Environment andDevelopment) in Rio de Janeiro, theworld’s nations agreed to the text of the
. . . legislation that
specifically protects
species—such as the
Endangered Species Act in
the United States—
deserves support in all
countries, as do measures
designed to keep intact
natural terrestrial, aquatic
and marine ecosystems.

71
Na
tu
re
’s
Pla
ce
demographic change on ecosystems andwildlife populations, more research mayhelp scientists learn how to retain criticalaspects of biodiversity in certain human-dominated ecosystems.
• Where organizations work in remoterural areas to promote biodiversityconservation, conservationists shouldconsider cooperating with qualifiedproviders of reproductive health serv-ices. They can do so without jeopard-izing their mission in conservation byworking as part of broad-based effortsto promote community development,address basic human needs, andimprove the management of naturalresources that sustain human andnon-human life.
As women have increasingly steppedforward to ask for access to family plan-ning services, some conservation andcommunity-development organizationsworking in the field have begun respond-ing by entering into partnerships withreproductive health service organizations.These partnerships respond to explicitrequests for services emanating fromcommunities themselves. The most directbenefit is that such communities are bet-ter able as a result to manage their natu-ral resources and thus their stewardshipof biological assets that surround them.
An added benefit of including familyplanning services in such integrated orlinked-service efforts is that populationgrowth is likely to slow as a result oflater childbirths and smaller families. Atleast 48 community-based projects or
includes the vast majority of the world’sapproximately 1.5 billion women ofreproductive age. A recent study con-cluded that nearly 40 percent of all preg-nancies worldwide are either mistimedor not intended at all, suggesting thatthe world’s nations still fall far short ofoffering sufficient services, informationand personal freedoms for couples tosuccessfully manage their own reproduc-tive lives.3 Governments should supportthe policies agreed to at the ICPD in1994. These policies would facilitate anearly peak in the size of human popula-tion while immediately improving thewell-being of women and their families.
Efforts to address human populationgrowth and biodiversity loss go hand inhand. And the survival of anything likethe present panoply of plant and animalspecies will depend on investments madetoday, both directly in biodiversity con-servation and in human developmentefforts that end up, as a side benefit totheir main purposes, slowing the growthof human population.
• The public and private sectors shouldcooperate to diminish the environ-mental impacts of the expansion ofagriculture and housing. Significantinvestments in research and improvedstandards in engineering and zoningfor these sectors could help minimizethe conflict between efforts to con-serve biodiversity and efforts to allevi-ate poverty and accommodate thepopulation growth that occurs duringthe next several decades.
On the following point few expertswould disagree: for worldwide biologicalconservation efforts to be successful, agri-culture and human settlement (housingand basic services, such as power, waterand waste disposal) will have to becomeseveral times more land- and water-effi-cient and far less polluting than they aretoday. In poor agricultural economies,development that includes massive jobcreation in urban areas, land equity inrural areas, and serious protection andmanagement of forests will likely be need-ed to halt tropical deforestation.
Put simply, society should invest inconserving biodiversity just as it invests inharvesting it. If humanity would apply toconservation a mere fraction of the finan-cial resources and technological geniusthat it has applied to increasing grain andfish yields and modifying the landscape,biodiversity’s future might look consider-ably less bleak than it does today.Eliminating subsidies that induce unsus-tainable natural resource use would servethe same purpose.
Scientists can do more to help policy-makers understand the implications ofpopulation growth on biodiversity. Muchmore research is needed, particularlyrelated to how changes in population den-sity, lifestyles and land-use practices influ-ence long-term processes associated withbiodiversity decline. When long-term datais unavailable, studies that sample along apath of increasing human density, fromnear-pristine ecosystems to urban ecosys-tems, can be a revealing analytic tool.Besides documenting the influence of
The survival of many
plant and animal species
will depend on
investments made today,
both directly in
biodiversity conservation
and in human
development efforts that
end up, as a side benefit
to their main purposes,
slowing the growth of
human population.

72
Po
pu
lat
ion
A
ct
ion
I
nt
er
na
tio
na
l
sustainable forestry, or tuna caught usingmethods that spare porpoises, obliges theprivate sector to recognize biologicaldiversity’s value on its own terms.Supporting conservation organizations,contributing to their purchase of criticalhabitat, their activism on endangeredspecies and on reducing greenhouse gasemissions, helps policymakers and busi-ness leaders take measure of the public’sconcern about biodiversity loss. And theway we vote, our presence at publicmeetings and interchange with themedia, can eventually transform land useand water policies into those that main-tain natural ecosystems and nativespecies over the long term. Consumerstoday remain largely unaware of theirown potential to help sustain biodiversity.
• Couples and individuals should con-sider the impact of their reproductivedecision-making on the well-being oftheir communities and of the worldas a whole.
Only couples and individuals candecide when and how often to have chil-dren. And in general, the social and eco-nomic realities of personal and familylife tend to play the strongest roles inmost couples’ reproductive decision-mak-ing. But collectively such decisions willaffect the future of biodiversity and thequality of life of all future human beings.Governments, for their part, shouldencourage environmental and populationeducation, and promote the diffusion ofinformation that leads to responsiblereproductive decision-making.
groups of projects worldwide now linkconservation and natural-resource man-agement efforts with the provision ofreproductive health services to those whorequest them. In some cases such proj-ects are able to supply remote popula-tions with contraceptive options thatwere otherwise unavailable. The singlemost important component in successfulcommunity-based projects appears to bethe active engagement of women. But italso requires that conservationists andothers helping to sponsor such linked-service projects be adaptable and willingto learn about human needs outside theirarea of expertise.4
• In research publications and othercommunications, scientists and edu-cators should use the range of futurepopulation possibilities—the high andlow scenarios projected by the UnitedNations—rather than the medium sce-nario alone. There are immeasurablepossibilities for unexpected demo-graphic changes, even in the regionswhere up to now there has been littleimprovement in women’s status andlittle decline in fertility rates.
Conservationists can learn more abouthuman population and fertility dynamicsand promote that understanding in theirpublications. When using the UnitedNations population projections, scientistsand educators should employ the range offuture population possibilities—the UNhigh and low scenarios—rather than themedium scenario. This approach commu-nicates the uncertainties and possibilities
that are associated with the demographicfuture.
Rates of population growth tend tochange slowly in the short term, butaspects of society that bear upon fertilitycan change rapidly. Among the mostimportant of these aspects is improvedaccess to a range of choices in moderncontraception and other reproductivehealth services. Similarly, delays in theage of marriage for women, increases inthe time interval between births, improve-ments in girls’ enrollment and education-al achievement, and increased femaleemployment and better job mobility allcould result in slower population growthand lower peaks in future population size.
• Consumers should learn about andconsider the role of their purchases,their pets, and their daily activities inputting biodiversity at risk. Theyshould inform themselves about andconsider how their lifestyles and theirpolitical choices influence nativespecies and ecosystems.
Personal lifestyles and everyday choicesaffect biological diversity in an increas-ingly populous world. Both are importantforms of expression in democratic soci-eties and in market economies.
These choices are most effective whenthey transmit strong signals—messagesabout preferences, acceptable standardsand willingness to pay—to those control-ling the distribution of goods and servic-es. For example, paying a little more forproducts like habitat-friendly shade-grown coffee, paper produced through
At least 48 community-
based projects or groups
of projects worldwide now
link conservation and
natural-resource
management efforts with
the provision of
reproductive health
services to those who
request them.

73
Na
tu
re
’s
Pla
ce
When human population growthinduces scarcity, according to oneline of economic reasoning, the
price of the scarce resource rises. That, itcan be argued, spurs innovation andinvention, which stimulates productionand provides reasonably-priced substi-tutes. Thus, scarcity-induced problemsare eliminated, making resources onceagain affordable. This reasoning may wellapply to certain non-renewable resourceslike metals or energy sources. It is fool-hardy thinking, however, when assumedto predict the response of non-humanlife and complex ecosystem relationships.If proof is needed, there is Biosphere 2.
A fully enclosed, live-in ecosystemlocated in Arizona, Biosphere 2 occupies1.3 hectares and has its own atmosphere,ponds, plants and animal life. The proj-ect was engineered to provide data thatcould someday make it possible to oper-ate the life support systems needed forlong-term space travel. A further pointwas to help scientists learn more aboutlife-sustaining processes on what wasdubbed “Biosphere 1”—the livingEarth—and to provide insight into eco-logically sound agriculture and technolo-gy.1 The enclosure cost an estimated$200 million to design and construct.
From 1991 to 1993, eight “biospheri-ans” lived and worked within the artifi-
cial ecosystem, demonstrating its poten-tial, dealing with its challenges and doc-umenting changes in its environment.From its early stages the project drewfrequent coverage from the science newsmedia. As time wore on it became appar-ent that even with considerable financialresources at their disposal, scientists andengineers are still a long way from repli-cating systems that successfully deliverthe services that Earth’s ecosystems offerfree of charge.
Trying to maintain Biosphere 2’s bio-diversity may have been the project’sbiggest challenge. Although the enclo-sure was over-stocked with species tosee which could survive the competition,more extinctions occurred than scientistshad anticipated. Of the system’s 25species of vertebrates, 19 went extinct,as did most of its insect species. Withmost competitors and predators gone,ants seemed to thrive, along with cock-roaches and katydids. All of the enclo-sure’s pollinators became extinct, leavingmany of the plant species without ameans to successfully reproduce.Biosphere 2’s aquatic and marine commu-nities underwent comparable changes.2
The most immediately hazardousproblem involved the ecosystem’s carboncycle, which came close to threateningthe human lives that breathed its air.
Carbon dioxide (CO2) levels shot up dra-matically as microbes in Biosphere 2’srich garden soils quickly consumed thesystem’s oxygen and released above-nor-mal quantities of CO2. Less than 18months after the biospherians sealedthemselves into the enclosure, the sys-tem’s atmospheric oxygen concentrationdropped by nearly one-half.
Air temperatures, however, climbed.Vines introduced to absorb CO2 grewexplosively, blocking light and threaten-ing Biosphere 2’s crops and other plants.Trees stressed by high CO2 concentrationsdropped branches too brittle to holdtheir own weight. With natural processesspiraling out of control, the researchersabandoned the illusion that Biosphere 2was truly isolated from Biosphere 1—andpumped in outside oxygen to sustain thehuman occupants within.
In summing up the lessons learnedfrom the project, ecologists Joel Cohenand David Tilman concluded that “thereis still no demonstrated alternative tomaintaining the viability of Earth.”2
References1. M. Nelson, “Letters: Biospherian Viewpoints,”
Science 275 (1996).2. J.E. Cohen and D. Tilman, Science 274
(1996): 1150-1151.
No Biosphere Like Home
“. . . there is still
no demonstrated
alternative to
maintaining the
viability of Earth.”

74
Po
pu
lat
ion
A
ct
ion
I
nt
er
na
tio
na
l
References 1. P.H. Raven, “Our Diminishing Tropical
Forests,” in Biodiversity, ed. E.O. Wilsonand F.M. Peter (Washington, DC:National Academy Press, 1986), 119-122,pp. 120-121.
2. Consortium for Earth SciencesInformation Network, “EnvironmentalTreaties and Resource Indicators,” DataBase (New York: Columbia University,1999), http://sedac.ciesin.org/prod/char-lotte (last accessed, Aug. 30, 1999).
3. Alan Guttmacher Institute, SharingResponsibility: Women, Society andAbortion Worldwide (New York: AGI,1999).
4. R. Engelman, Plan and Conserve: ASource Book on Linking Population andEnvironmental Services in Communities(Washington, DC: Population ActionInternational, 1998).
5. J. Bongaarts, W.P. Mauldin, and J.F.Phillips, “The Demographic Impact ofFamily Planning Programs,” Studies inFamily Planning 21, 6 (1990): 299-310.
6. A.O. Tsui, “Family planning programs inAsia: Approaching a Half-Century ofEffort,” Asia-Pacific Population ResearchReports, 8 (Honolulu: East-West Center,1996); J. Bongaarts, “DemographicConsequences of Declining Fertility,”Science 282 (1998): 419-420.
Demographic Hope for BiodiversityAt the dawn of the 21st century, we find—and who would have predicted it?—that human population growth is amongthe most resolvable of all of the majorglobal trends that now threaten biodiver-sity. A recent study estimated that,today, the population of the developingworld is around 700 million smaller thanit would have been without organizedfamily planning programs. That figure,representing unintended pregnanciesthat otherwise would have contributedto population growth were it not for theavailability of effective contraception, isprojected to reach 3.1 billion by 2050—assuming continued investments inthese programs.5
The past 30 years have seen enor-mous progress toward providing univer-sal access to family planning services, ascalled for in the Cairo Programme ofAction. There is still a long distance togo. More than 100 million marriedwomen would like to space and limitchildbirth but lack access to the meansto accomplish these goals.3
Fertility rates are not descending “ontheir own,” in apparently spontaneousresponse to economic change. Theinvestment and hard work of govern-ments—those of developing countries aswell as industrialized donor nations—and non-governmental organizationshave made a difference. Studies ofSoutheast Asian nations suggest thattoday’s population growth rates resulted
in large part from policies and programssupported decades earlier. Voluntaryfamily planning programs were key. Butso were other policies that increased thedemand for these programs—especiallypolicies that put more girls into class-rooms, and opened employment oppor-tunities for women.6
The future could see a continuationof today’s impressive decline in fertili-ty—if citizens and the governments thatrepresent them support and fund thepolicies and programs that make suchchange possible. Decisions made todaywill have an enormous influence on thefuture size of world population. Noprognosticator can predict how much ofa difference a stabilized or even tem-porarily declining world population willmake to the survival of the uncountabletrillions of beings that accompany us onthis living planet. But the differencecould hardly be small. And we humansourselves—simultaneously the threat to,and the caretakers of, earthly life—willbe among the greatest beneficiaries.
The future could see a
continuation of today’s
impressive decline in
fertility—if citizens and
the governments that
represent them support
and fund the policies and
programs that make such
change possible.

tion, endangered, and critically endangered. Inthe early 1990s, IUCN’s Species Survival Commissionstandardized a series of methods that scientistsnow use to determine the category into which aspecies under study is appropriately fit.3
Readers in the United States should be care-ful not to confuse IUCN’s conservation statuscategories with those established in theEndangered Species Act and used by the U.S.Fish and Wildlife Service. In the United States,unlike in the IUCN system, threatened andendangered remain separate categories.
IUCN (which retains the acronym from itsformer name, the International Union for theConservation of Nature) is an international bodyheadquartered in Gland, Switzerland, that bringstogether over 900 governmental and non-govern-mental organizations. These embrace more than12,000 scientists from 139 countries concernedwith environmental conservation, management,regulation and protection. This report uses IUCNas its principal source for conservation status,scientific names, and for the spelling of commonnames of species.
c The species-area relationshipOver time, the number of original species tendsto decrease with the loss of habitat area. This
a Demographic estimates and projections
For past estimates and future population projec-tions, this publication uses data from the UnitedNations 1998 medium-range projections, whichestimate past populations at 5-year intervals from1950 to 1995, and project from 2000 to 2050.1
The UN long-range projections, which projectpopulation for India, China, and the world’sregions are used for senarios out to 2150.2 Sub-national estimates of population density, used inthe global biodiversity hotspot analysis, wereobtained using geographic information systemsdata. Methods employed in this analysis are out-lined in section h of this appendix.
b Threatened species (conservation status)
Population Action International and most envi-ronmental organizations recognize the IUCN RedList as the principal authority on the conservationstatus of known species. Featured on the Red Listare species that biologists, working in conjunctionwith the IUCN–World Conservation Union, havedetermined to be threatened with extinction.These are species believed to be nearing extinc-tion or declining rapidly. There are three degreesof threatened status in IUCN’s system (listed fromleast to most threatened): vulnerable to extinc-
75
Na
tu
re
’s
Pla
ce
trend is described by a curve generated by themodified exponential function
S = cA-z
where S is the number of original speciesremaining, c is a constant and z controls theshape of the curve. The z-value ranges between0.15 and 0.35 over most of the research that hasbeen conducted on this topic. There is a growingconsensus that 0.25 is a good approximation forthe value of the exponent z in most cases.4
d Estimating body weights of human and livestock populations
To estimate the total mass of humans, we beganwith age-specific expected body weightsdescribed by the National Research Council,5
averaged for males and females, and fit a poly-nomial curve to this curve (r2 = 0.99). Wereduced the age-related weights by 20 percent toaccount for lower average weights in developingcountries. Then, average body weight in kilo-grams (BW) for each age group is:
BW = 0.8(0.0006[AGE]3 - 0.0949[AGE]2
+ 4.6361[AGE] + 1.9325), where AGE is the median age for each 5-year agecategory. For age category 80+, AGE was set to80. To estimate global human body weight weestimated the average for each 5-year category,
Appendix 1: Data Sources and Methodology
AppendicesAppendices

Hotspot land area was calculatedusing Spatial Analyst and CI’s hotspotlayer. Spatial Analyst provided the per-centage of each country occupied by thehotspot. Data from the UN Food andAgricultural Organization (in WorldResources, World Resources Institute,1997) were used as the source for mostcountry areas. Total land areas forAnguilla, Federated States of Micronesia,Marshall Islands, Mayotte, Monaco,Montenegro, Northern Mariana Islands,Palau, Pitcairn Islands, and the West Bankwere taken from data provided by TheCIA World Factbook, 1997.
Average hotspot population densitywas calculated using Spatial Analystapplied to NCGIA’s Gridded Populationof the World, 1995. As a preliminarystep to calculating average hotspotgrowth rates, population density wascalculated for the total hotspot, the por-tion of each country within the hotspot.In cases where sub-national populationgrowth rate data were available, popu-lation density was determined for sub-national units (provinces, states).
Hotspot population growth rateswere estimated by partitioning hotspotsinto their respective countries andprovinces within countries, and calcu-lating a population-weighted average ofgrowth rates for all of the portions.Where hotspots covered only portionsof countries, sub-national data (provin-cial or state data) were used whenavailable to weight the portions withinthose sub-national units. In this publi-cation sub-national population growthrates were applied to parts of Argentina,Australia, Brazil, Bolivia, Colombia,
76
Po
pu
lat
ion
A
ct
ion
I
nt
er
na
tio
na
l
g Geographic information systems (GIS) data layers
Spatial population density data areobtained from the Gridded Populationof the World, 1995, published by theNational Center for Global GeographicAnalysis (NCGIA), University of California,Santa Barbara, USA. These data can bedownloaded from Columbia University’sCenter for International Earth ScienceInformation Network (CIESIN) Website,at the following address: http://www.ciesin.org/datasets/gpw/globldem.doc.html.9 The year 1995 is the basis for allpopulation density mapping in thispublication.
Hotspots and major tropical wilder-ness boundaries were created and digi-tized by Conservation International (CI).CI continues to identify hotspots fromamong the most biodiverse regions ofthe world, and to modify boundaries ofthe hotspots that it presently recognizes.
Current forest cover and original for-est cover, used in the Madagascar casestudy, were mapped from various coun-try sources by the World ConservationMonitoring Centre.10
h Biodiversity hotspots and human population analysis
Geographical information systems map-ping and analysis was conducted usingArcView software, a product of EarthSystem Resources, Inc. (ESRI). Populationdensities of hotspots and major tropicalwilderness areas were determined usingSpatial Analyst, an application devel-oped for ArcView workstations by ESRI.
multiplied by the number in that agecategory, and then summed for all agecategories in the world population.
For domestic animal species, weused adult weights from varioussources, and used the median weightfrom the range listed.6 We assumed thatin species living more than two years,one-year-olds attain one-third of adultweight, two-year-olds two-thirds ofadult weight, and from three yearsonward they attained adult bodyweight. For species living two years,we assumed two-thirds weight for one-year-olds, and full weight thereafter.
e Estimating population densities of mammals
Robert Henry Peters used numerousstudies of mammals to derive statisticalmodels that relate adult body weight tothe observed abundance of these ani-mals in the wild. Peters’ work predictsthat the density of mammalian species’within their home ranges, if living inan undisturbed condition, should varyaccording to the following relationships:7
Population Density of Carnivores= 15 x [Average Body Weight] - 1.16
Population Density of Herbivores= 103 x [Average Body Weight] - 0.93
f Species in human-dominatedecosystems
To produce rough estimates of thenumber of species that presently showsigns of co-existing with humans inhuman-dominated ecosystems, we sur-veyed several guides to well-studied
plants and animals. A species wascounted as being likely not to incur ele-vated risks of extinction due to the con-tinued proliferation of human-dominat-ed ecosystems if the species was identi-fied with a human-made structure, aland-use type, or a domestic species.Key words included: city, suburb, road-side, mine, waste place, garbage dump,building, farm, livestock, crop or gar-den. Because large predators are effec-tively eradicated to reduce losses tolivestock, the method likely overesti-mates the number of large predatorsthat will survive in human-dominatedecosystems. For example, in three guides to NorthAmerican birds, descriptions of about25 to 35 species (roughly 5 percent ofthe 650 birds) mention cities, lawns,and buildings or farm fields, crops andlivestock. Using the same method,about 15 percent of listed Europeanbirds fall in this category. For floweringplants, around 10 percent mentionhuman-dominated ecosystems. Some70 percent of these are weedy exoticspecies. In guides of North Americanplants (around 380 species) some 15percent show similar references. Formammals, however, more than half ofthese references are for bats, most ofwhich roost in buildings and are beingexterminated because of this habit.Also in that number are predators thatoccasionally kill livestock, some ofwhich have been actively hunted withsome success. Omitting these groupsprovides a more realistic estimate ofaround 5 percent.8

77
Na
tu
re
’s
Pla
ce
China, Ecuador, France, India, Indonesia,Mexico, Panama, Peru, South Africa,Spain, Turkey, the United States, andVenezuela in order to determine aver-age population growth rates for biodi-versity hotspots or major tropicalwilderness areas.
i Human population betweenthe tropics
There were several methodologicalsteps used in estimating populationwithin the tropics, the land situatedbetween the Tropics of Cancer andCapricorn. First, an estimate was madeof the 1995 tropical population. Wherecountries were wholly within the trop-ics, national populations were obtainedfrom the UN Population Division, andsummed. To estimate contributions tothis sum from countries straddling thetropics, sub-national tropical popula-tions were estimated using the 1995World Population Density GIS layer.
A somewhat different method wasused to estimate for past years (1950 to1990, at 5 year intervals). For countrieswholly within the tropics, again the UNPopulation Division’s estimates wereused and summed. Because GIS sub-national population density data doesnot exist prior to 1995, it was assumedthat the percentage of the population inthose sub-national areas within eachcountry that straddles a tropic (such asAustralia, China, India, Mexico andothers) was identical to the 1995 per-centage. This source of inaccuracymakes this a rough estimate, but onethat should be accurate to within ahundred million people.
j Sources for sub-national census dataArgentina: Instituto Nacional de Estadística y Censos (INDEC),
Anuario Estadistico 1998, (Buenos Aires: INDEC, 1998),http://www.indec.mecon.gov.ar/default.htm, (lastaccessed: Nov. 29, 1999); 1997 Britannica Book of theYear (London: Encyclopaedia Britannica, 1997).
Australia: Australian Bureau of Statistics (ABS),”ABS Statsite,”Australian Demographic Statistics, Catalogue No. 3101.0,March Quarter 1998 (Canberra: ABS, 1998),http://www.statistics.gov.au, (last accessed: Dec. 4,1998); 1997 Britannica Book of the Year (London:Encyclopaedia Britannica, 1997).
Brazil: Instituto Brasileiro de Geografia e Estatistica (IBGE),“Diretoria de Pesquisas, Population Census 1991,”(Brasilia: IBGE, 1991), http://www.ibge.gov.br (lastaccessed: Nov. 29, 1999).
China: China National Statistics Bureau, “China Cities,” (Beijing:China Today, 1999), http://www.chinatoday.com/city/a.htm, (last accessed: Jan. 20, 1999); People’sRepublic of China, Atlas of the People’s Republic of China,ed. Sun Xiudong (Beijing: China Cartographic PublishingHouse, 1989).
Colombia: Departamento Administrivo Nacional de Estadística(DANE), “Censo de Población y Vivienda de 1993,”(Bogotá: DANE, 1993), http://www.dane.gov.co/, (lastaccessed: Jan. 20, 1999); DANE, XV Censo Nacional dePoblacion y IV de Vivienda: Colombia, vol. I (Bogotá:DANE, 1986).
Ecuador: Instituto Nacional Estadística y Censos (INEC),“Proyecciones de la Población Total por Años CalendarioSegún Provincias: Périodo 1990-2000,” (Quito: INEC, nodate), http://www4.inec.gov.ec/master.htm, (lastaccessed: Nov. 29, 1999); 1997 Britannica Book of theYear (London: Encyclopaedia Britannica, 1997).
India: National Statistical Institute of India (NSII), “PopulationStatistics, India 1991: Population Data,” (New Delhi:NSII, no date),http://www.censusindia.net/cendat/sub.html, (lastaccessed: Dec. 8, 1998).
References1. UN Population Division, World Population
Prospects: The 1998 Revision (New York:United Nations, 1998).
2. UN Population Division, World PopulationProjections to 2150, (New York: UnitedNations, 1998).
3. IUCN Red List of Threatened Animals (Gland:IUCN-World Conservation Union, 1996);IUCN Red List of Threatened Plants (Gland:IUCN-World Conservation Union, 1998).
4. N. Myers, “Global Biodiversity II: Losses,” inPrinciples of Conservation Biology, ed. G. K.Meffe and C.R. Caroll (Sunderland, MA.:Sinauer, 1997), 110-139.
5. NRC, “Recommended Dietary Allowances,”10th Ed. (Washington, DC: National ResearchCouncil, 1989).
6. B. Grzimek (ed.), Grzimek’s Animal LifeEncyclopedia., Vol. 10 - 14 (New York: VanNostrand Reinhold, 1972-75); NationalZoological Park, “Animal Facts,” Data Base,http://www.fonz.org/animals/animalfacts.htm (last accessed, August 30, 1999); varioussources.
7. R.H. Peters, The Ecological Implications ofBody Size (New York: Cambridge Univ. Press,1983).
8. C.S. Robbins, B. Bruun, and H. S. Zim, AGuide to Field Identification: Birds of NorthAmerica (New York: Golden, 1983); R.T.Peterson, G. Mountfort, and P.A.D. Hollom, AField Guide to the Birds of Britain and Europe,The Peterson field guide series, 8 (Boston:Houghton Mifflin, 1966); R.T. Peterson andM. McKenny, A Field Guide to Wildflowers:Northeastern and Northcentral North America(Boston: Houghton Mifflin, 1968); W.H. Burtand R.P. Grossenheider, A Field Guide to theMammals: North America North of Mexico,3rd ed. (New York: Houghton Mifflin, 1980).
9. W. Tobler, U. Deichmann, J. Gottsegen, andK. Maloy, “The Global Demography Project,”Tech. Report, 95-6 (Santa Barbara: NationalCenter for Geographic Information Analysis,Univ. of California, Santa Barbara, 1995).
10.World Conservation Monitoring Centre, “AGlobal Overview of Forest Conservation,” CD-ROM (Cambridge, U.K.: WCMC, 1997).

78
Po
pu
lat
ion
A
ct
ion
I
nt
er
na
tio
na
l
Indonesia: UN Statistics Division, “Popmap,” CD ROM,INT/96/P74/WWW (New York: UN, 1998).
Mexico: Instituto Nacional de Estadística, Geografía eInformática (INEGI), ”Estadísticas Demográficas ySocioeconómicas de México,” (Mexico: INEGI,1997).
Peru: Instituto Nacional de Estadística e Informática(INEI), “IX Censo Nacional de Población y IV deVivienda, 1993” (Lima: INEI, 1995),http://www.inei.gob.pe/, (last accessed: Feb. 9,1999).
South Africa: Statistics South Africa (SSA), “The People of SouthAfrica: Census 1996,” (Pretoria: SSA, 1998),http://www.statssa.gov.za/census96/HTML/DEFAULT.HTM, (last accessed: Nov. 13, 1998).
Spain: Instituto Nacional de Estadística (INE), “España encifres,” (Madrid: INE, 1997),http://www.ine.ex/htdocs/espcif/espcifin.htm, (lastaccessed: Feb. 11, 1999).
Turkey: State Institute of Statistics, (Ankara: Prime Ministryof Turkey, 1998), http://www.die.gov.tr, (lastaccessed, Nov. 29, 1999); 1997 Britannica Book ofthe Year (London: Encyclopaedia Britannica, 1997).
United States: U.S. Bureau of the Census, “State PopulationEstimates and Demographic Components ofPopulation Change: July 1, 1997 to July 1, 1998,”Doc. ST-97-1 (Washington, DC: U.S. Dept. ofCommerce, 1997), http://www.census.gov/popula-tion/www/estimates/statepop.html, (last accessed:June 22, 1999).
Venezuela: Oficina Central de Estadística y Informática (OCEI),“XII Censo de población y vivienda, 1990,”(Caracas: OCEI, no date), http://www.ocei.gov.ve,(last accessed: March 9, 1999); 1997 BritannicaBook of the Year (London: Encyclopaedia Britannica,1997).

79
Na
tu
re
’s
Pla
ce
Figure 18: Limited Alternatives:Population Growth and Responses inAgriculture and Housing Source: Population Action International
Figure 19: More People, More Non-NativeSpecies Source: adapted from E.H. Rapoport, “TheProcess of Plant Colonization in SmallSettlements and Large Cities,” in Humansas Components of Ecosystems, ed. M.J.McDonnell and S.T. A. Pickett (New York:Springer-Verlag, 1993), 190-207.
Figure 20: Nitrogen Pollution andPopulation Density Source: J.J. Cole and others, “NitrogenLoading of Rivers as a Human-DrivenProcess,” in Humans as Components ofEcosystems, ed. M.J. McDonnell andS.T.A. Pickett (New York: Springer-Verlag,1993), 141-162.
Figure 21: People and Property ValuesSource: data from U.S. Census Bureau,“Taxable Property Values: AssessedValuations for Local General PropertyTaxation,” GC92, Vol. 2 (Washington, DC:U.S. Dept. of Commerce, 1996).
Figure 22: Population Density in theBiodiversity HotspotsSource: Population Action International,data from GIS analysis of WorldPopulation Density, 1995, GIS Data Layer(NCGIA, University of California, SantaBarbara, 1994).
Figure 23: Population Growth in theBiodiversity HotspotsSource: Population Action International,synthesized from various sources, seeAppendix 1h.
Figure 6: Human Colonization andAssociated Species LossSource: adapted from J. Diamond, TheThird Chimpanzee: The Evolution andFuture of the Human Animal (New York:Harper Collins, 1992).
Figure 7: Islands of Nature: PopulationGrowth and the Isolation of ProtectedAreasSource: R.S. Reid, L. Kruska, U.Deichmann, P.K. Thornton, and S.G.A.Leak, “Human Population Growth andthe Extinction of the Tsetse Fly,” (unpub-lished manuscript, 1999).
Figure 8: Domesticated Demographics:the Growth of Domesticated AnimalsSource: data from FAO STAT, CD-ROM(Rome: Food and AgricultureOrganization, 1998).
Figure 9: Newly Emerging Diseases Source: D. Pimentel and others, “Ecologyof Increasing Disease,” Bioscience 48, 10(1998): 817-826.
Figure 10: Population in the Tropics Source: estimates by Population ActionInternational; data from GIS analysis ofWorld Population Density, 1995, GIS DataLayer (CIESIN/UNEP, New York/SiouxFalls, SD, 1997).
Figure 11: Expected Population Densitiesof Mammals Source: adapted from equations pub-lished in R.M. Peters, The EcologicalImplications of Body Size (New York:Cambridge Univ. Press, 1983).
Figure 12: Human Fertility Change inHighly Biodiverse Countries Source: UN Population Division, WorldPopulation Prospects: The 1998 Revision(New York: United Nations, 1998); list ofbiodiversity countries from R.A.Mittermeier, P. Robles Gil, and C.Goettsch Mittermeier, Megadiversity:Earth’s Biologically Wealthiest Nations(Mexico, C.F.: Cemex, 1997).
Figure 13: World Population: Past and ProjectedSource: UN Population Division, WorldPopulation Projections to 2150, (NewYork: United Nations, 1998).
Figure 14: Population in the Industrialized Countries Source: UN Population Division, WorldPopulation Prospects: The 1998 Revision(New York: United Nations, 1998).
Figure 15: Understanding MomentumSource: UN Population Division, WorldPopulation Prospects: The 1998 Revision(New York: United Nations, 1998).
Figure 16: Trends in ExtinctionSource: data from World ConservationMonitoring Centre, Global Biodiversity:Status of the Earth’s Living Resources(London: Chapman & Hall, 1992).
Figure 17: Threats to SpeciesSource: (A.) Population ActionInternational; (B.) D.S. Wilcove and oth-ers, “Quantifying Threats to ImperiledSpecies in the United States,” Bioscience48, 8 (1998): 607-615.
Figure 1: Possibilities in the Demographic FutureSource: data from UN Population Division,World Population Projections to 2150, (NewYork: United Nations, 1998).
Figure 2: Population and Status of theGreat ApesSources: see reference following text
Figure 3: Counting Earth’s Species Source: adapted from N.E. Stork,“Measuring Global Biodiversity and ItsDecline,” in Biodiversity II: Understandingand Protecting Our Biological Resources,ed. M.L. Reaka-Kudla, D.E. Wilson, andE.O. Wilson (Washington, DC: JosephHenry Press, 1997), 41-68.
Figure 4: Species Numbers and Habitat AreaSource: adapted from A. Dobson,Conservation and Biodiversity (New York:Scientific American Library, 1996), p. 66.
Figure 5: Centers of Crop and Livestock OriginSource: N.I. Vavilov, “The Origin,Variation, Immunity and Breeding ofCultivated Plants,” transl. K.S. Chester,Chronica Botanica, 13, 1-6 (1949-50);N.W. Simmonds, Principles of CropImprovement (New York: Longman,1979); N. Myers, The Wild Supermarket:the Importance of Biological Diversity toFood Security (Gland: World-Wide Fundfor Nature, 1990).
Appendix 2: Figures and Their Sources

80
Po
pu
lat
ion
A
ct
ion
I
nt
er
na
tio
na
l
Population & Environment Studies
Forest Futures: Population, Consumption and WoodResources (NEW)Examines impact of shrinking forest cover worldwideon resources and human quality of life. Containsinsert chart ranking 157 countries by per capita forestavailability in 1980, 1995, and 2025. (1999. 68pp.English. $9.00)
Profiles in Carbon: An Update on Population,Consumption and Carbon Dioxide EmissionsHighlights neglected linkages between population andclimate by chronicling CO2 emissions from 1950 to1995. Includes charts on 145 countries by 1995 percapita emissions, and 180 individual country charts.(1998. 40 pp. English. $5.00)
Sustaining Water, Easing Scarcity: A Second UpdatePAI revision of estimates and projections of theamount of fresh water available to each person inmost countries from the present to 2050. Based on1996 UN population projections, which reflect a slow-ing of population growth. (1997. 20 pp. English.$5.00)
Plan and Conserve: A Source Book on LinkingPopulation and Environmental Services inCommunitiesUnique guide summarizing the history of integrationof population and environment programs. Profiles 42community projects. (1998. 112 pp. English. $9.00)
Forging the Link: Emerging Accounts of Populationand Environment Work in Communities (NEW)Examines feasibility of integrating reproductive healthand environmental sustainability into the same devel-opment project. Summarizes efforts of last 25 yearsand explores benefits and challenges of approach.(1999. 56 pp. English. $9.00)
Population PolicyResearch
Africa’s PopulationChallenge: AcceleratingProgress in ReproductiveHealth Highlights the progressAfrica has made in expand-ing access to reproductivehealth care and the chal-lenges countries face to pro-vide quality services for alltheir people. (1998. 88 pp.English, French. $9.00)
Educating Girls: GenderGaps and GainsWall chart ranks 132 coun-tries by difference betweenschool enrollment rates forgirls and boys, showingwhere girls lag furthestbehind boys. Illustrates thelink between education andteen birthrates and offersstrategies for increasinggirls’ access to education.Eighth in PAI’s Report Cardseries. (1998. Wall chart.English, French, Spanish.$6.00)
Selected Recent Publications From Population Action International
Ship to:
Name
Organization
Street Address
City, State/Province, Zip/Postal Code, Country
Telephone Email
Please make checks or money orders in U.S. dollars, drawn on a U.S. bank, payable to: Population Action International
1300 19th Street, NW2nd FloorWashington, DC 20036 USA
For bulk orders, contact Carolyn Ross:Phone: 202-659-1833Fax: 202-293-1795Email: [email protected]
Order publications on-line at http://www.populationaction.orgAll domestic orders are postpaid.All orders to be shipped outside the USA will be charged postage.Publications are available in limited quantities, at no charge, to residents ofdeveloping countries.
O r d e r F o r mDescription Quantity Language Item Price Total Price
TOTALPAYMENT BY: ❒ VISA ❒ MASTER CHARGE ❒ CHECK
Card Number:❒❒❒❒❒❒❒❒❒❒❒❒❒❒❒❒Exp. Date ❒❒ ❒❒ Signature
Please copy form and send with payment

Board of DirectorsWilliam H. Draper, Jr., Honorary Chair 1965-1974
OfficersChairConstance Spahn
Vice ChairsWilliam H. Draper, IIIVictoria P. Sant
Chair EmeritusRobin Chandler Duke
TreasurerScott M. Spangler
Secretary Phyllis Tilson Piotrow
PresidentAmy Coen
DirectorsVincent AnkuVicki-Ann E. AsseveroAnthony C. BeilensonPouru P. BhiwandiMarion M. Dawson CarrWilliam Clark, Jr.Bill GreenKaval GulhatiYolanda RichardsonAllan RosenfieldFred T. SaiIsabel V. SawhillTimothy L. TowellJoseph C. WheelerWilliam D. Zabel
The CouncilJoseph D. Tydings, ChairC. Payne Lucas, Vice ChairRobert Fearey, SecretaryNorman E. BorlaugSharon L. CampA.W. ClausenBarber B. ConableHenry H. FowlerJulia J. HendersonLawrence R. KeganEdwin M. MartinRobert S. McNamaraWendy B. MorganThomas H. Roberts, Jr.Elmer Boyd Staats
Population Action International
Printed on recycled paper with soy inks.
Publications team: Sally Ethelston, Odell Gilliam,Jennifer Wisnewski
Designed by: Feld Design, Alexandria, VirginiaPrinted by: Colorcraft of Virginia

Before January 31, 2000:1120 19th Street, N.W. • Suite 550
Washington, D.C. 20036 USA
http://www.populationaction.org
After January 31, 2000:1300 19th Street, N.W. • Second FloorWashington, D.C. 20036 USA