naturalistic driving observations of manual and visual...
TRANSCRIPT

31
Transportation Research Record: Journal of the Transportation Research Board, No. 2365, Transportation Research Board of the National Academies, Washington, D.C., 2013, pp. 31–38.DOI: 10.3141/2365-05
M. Christoph and N. van Nes, SWOV Institute for Road Safety Research, P.O. Box 1090, 2260 BB Leidschendam, Netherlands. A. Knapper, Delft University of Technology, P.O. Box 5015, 2600 GA Delft, Netherlands. Corresponding author: M. Christoph, [email protected].
research, based mostly on driving simulator studies, shows that manual and visual–manual interaction with devices impairs driving performance (2). Texting, dialing a number, or entering a destina-tion in a navigation system while driving results in greater deviation in drivers’ lateral position, reduced speed, and increased time with the driver’s eyes off the road (3–7 ).
The naturalistic driving method, in which drivers are observed unobtrusively during their everyday driving, helps in further under-standing the prevalence of manual and visual–manual interactions with electronic devices while driving and the effects on driving behavior. Klauer et al. found in one of the early naturalistic driving studies that drivers who were distracted by performing visual–manual tasks while driving, thus having their eyes off the forward road, had a three times higher near-crash or crash risk than attentive drivers (8). More recent research also indicated a relationship between subtasks of interacting with electronic devices, such as reaching for a device and operating a device, and the likelihood of involvement in a safety-critical event (9, 10). The naturalistic driving method also gives insight into the prevalence of manual and visual–manual interactions with electronic devices. The key questions are: How often do drivers engage in these secondary tasks during their everyday driving? And how much time is spent on these secondary tasks in real traffic?
This study investigated frequencies and durations of drivers’ man-ual interactions with mobile phones and navigation systems while they were driving in real traffic. The study focuses on these two sys-tems as previous research indicated many drivers use them regularly (11). Manual interactions are distinguished in different subtasks: pure manual tasks and visual–manual tasks; the visual–manual task is considered to be more distracting and more dangerous. As pre-vious research indicates there is a strong relation between vehicle speed and risk; speed in relation to interacting with the devices is also studied. The relationship between speed at which drivers engaged in interacting with the mobile phone or navigation system is studied. Finally, an exploratory analysis of speed changes before and during interaction with the mobile phone or navigation system is presented.
Method
Naturalistic driving observations were conducted to collect natural behavior on the manual interaction with a mobile phone and naviga-tion system in real traffic. Five vehicles were instrumented, and par-ticipants were asked to use these vehicles instead of their own cars. The field study took place in the Netherlands. In the Netherlands
Naturalistic Driving Observations of Manual and Visual–Manual Interactions with Navigation Systems and Mobile Phones While Driving
Michiel Christoph, Nicole van Nes, and Allert Knapper
This paper discusses a naturalistic driving study on the use of mobile phones and navigation systems while driving. Manual interactions with these devices while driving can cause distraction from the driving task and reduce traffic safety. In this study 21 subjects were observed for 5 weeks. Their behavior was logged by four cameras, a Global Position-ing System sensor, and a number of additional sensors. Results are pre-sented on the durations and frequencies of manual interactions with the mobile phone and navigation system. Different manual subtasks with different levels of visual interaction are discussed, as well as how these interactions relate to driving speed. Results show that participants spent on average 1% of their driving time interacting with the navigation sys-tem and 4% of their driving time interacting with the mobile phone, excluding mobile phone conversations. For the mobile phone, 48% of the interactions took longer than 15 s; for the navigation system it was 40%. The average duration of a visual–manual subtask for the naviga-tion system and the mobile phone was not significantly different when the task was performed while driving or while the vehicle was standing still. Exploratory analysis of vehicle speed suggests that drivers do not seem to adjust their speed while performing a visual–manual task. The results are discussed in relation to traffic safety and recommendations for future research.
Drivers are increasingly involved in operating electronic devices while driving (1). This includes driver support systems (e.g., navi-gation system) and safety systems (e.g., speed limiter) as well as communication and multimedia devices such as tablet PCs and (smart) phones. Apparently drivers decide to use these systems behind the wheel to assist them in the driving task, increase comfort and safety, and provide information or entertainment. But operating such systems may interact with driving behavior because a certain amount of attention from drivers is required, potentially distracting them from their driving task. Manual interaction with a system often takes a driver’s hand off the wheel. Visual interaction with a system takes a driver’s eyes off the road. Auditory instructions or signals require attention, and cognitive tasks increase workload. Previous
32 Transportation Research Record 2365
it is forbidden by law to hold a phone in one’s hand while driving (regardless of whether a phone call is being made or not). There is no specific law about navigation system use while driving.
Participants
In this study 21 drivers participated; 14 of them were male, 7 were female. The participants were on average 37.3 years old [standard deviation (SD) = 9.9], ranging from 27 to 59. They had held their driver’s licences on average for 15 years (SD = 9.7). Recruited drivers were asked to fill in a questionnaire about their general driving behav-ior and how often they used devices (navigation system, mobile phone, cruise control) in the vehicle. Drivers who were selected reported driving regularly (>10,000 km/year) and using a navigation system and mobile phone at least once a week while driving.
Procedure
Participants drove the instrumented vehicle for 5 to 6 weeks. Before their participation they were informed about the study in a briefing session. When they agreed with the terms and conditions set up for the study, they signed the participant agreement form and the instru-mented vehicle was handed over to them, along with a nomadic navi-gation system and a plug-and-play hands-free device that they could use for the duration of the study. Participants were free to choose to use these devices or not. They were asked to use the vehicle and the devices as they would normally do. No details about the focus of the study were revealed.
Materials
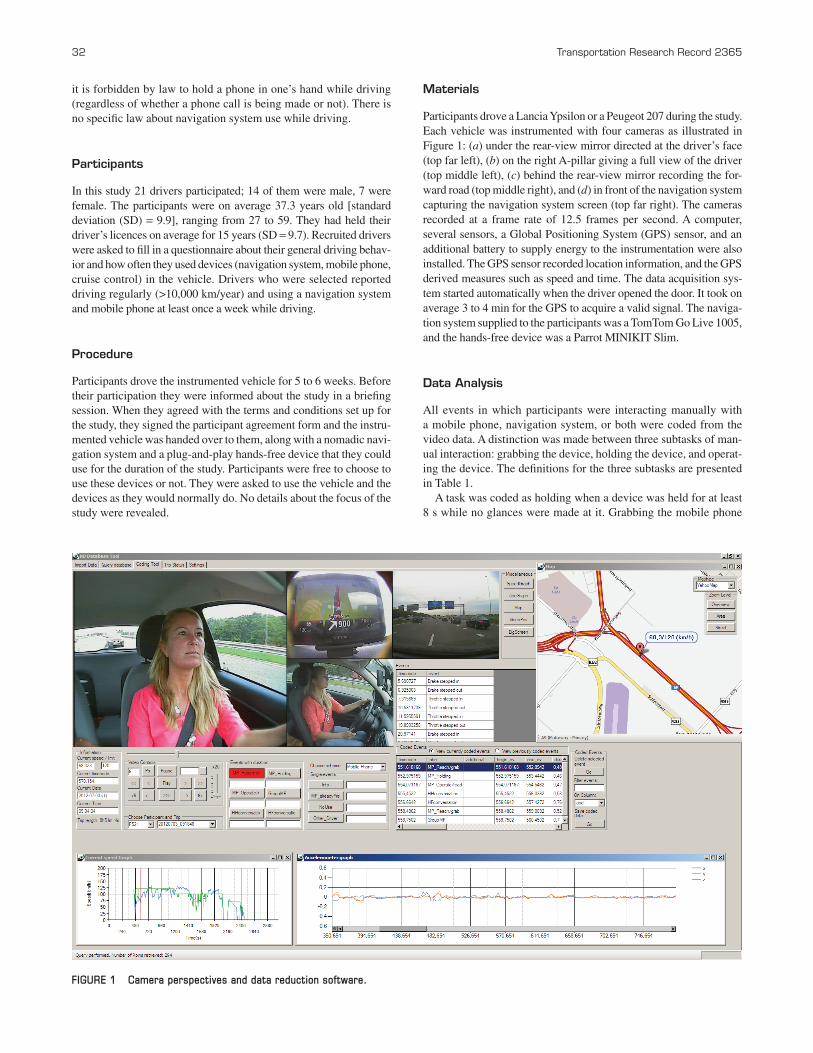
Participants drove a Lancia Ypsilon or a Peugeot 207 during the study. Each vehicle was instrumented with four cameras as illustrated in Figure 1: (a) under the rear-view mirror directed at the driver’s face (top far left), (b) on the right A-pillar giving a full view of the driver (top middle left), (c) behind the rear-view mirror recording the for-ward road (top middle right), and (d ) in front of the navigation system capturing the navigation system screen (top far right). The cameras recorded at a frame rate of 12.5 frames per second. A computer, several sensors, a Global Positioning System (GPS) sensor, and an additional battery to supply energy to the instrumentation were also installed. The GPS sensor recorded location information, and the GPS derived measures such as speed and time. The data acquisition sys-tem started automatically when the driver opened the door. It took on average 3 to 4 min for the GPS to acquire a valid signal. The naviga-tion system supplied to the participants was a TomTom Go Live 1005, and the hands-free device was a Parrot MINIKIT Slim.
Data Analysis
All events in which participants were interacting manually with a mobile phone, navigation system, or both were coded from the video data. A distinction was made between three subtasks of man-ual interaction: grabbing the device, holding the device, and operat-ing the device. The definitions for the three subtasks are presented in Table 1.
A task was coded as holding when a device was held for at least 8 s while no glances were made at it. Grabbing the mobile phone
FIGURE 1 Camera perspectives and data reduction software.

Christoph, van Nes, and Knapper 33
was acknowledged as a separate task only if it took more than 2 s. If it took less than 2 s to grab the device (e.g., if the device was on someone’s lap) this was too short to be considered as a separate task. In these cases the grabbing was not coded as a separate event but included in the subsequent operating or holding event. Grabbing the device could involve eye glances at the device and is therefore considered to be a visual–manual task. The subtask of operating the mobile phone includes all kinds of tasks, for example, texting, e-mailing, dialing a phone number, or reading traffic information. Phone conversations were not included in the definition of an operating task; thus results on the frequency and duration of phone conversations are not reported in this paper. For operating the navigation system, a distinction was made between making a destination entry (as the most often performed task) and performing any other task. When it was ambiguous what task the driver was performing, the interaction was coded as “other task.”
The first week was considered to be an adjustment period to the instrumented vehicle and to the navigation system, and therefore the data collected during this time were not included in the analyses. The coding of a trip started when the driver entered the car. Pos-sible interactions with the device while parked before, during, or at the end of the trip were excluded from the analysis. Interactions when the vehicle was stopped (e.g., waiting for a traffic light) were included. Interactions with the navigation system that included voice control were excluded from the analysis.
data Coding
Coding was done manually by four data reductionists. Weekly train-ing and coding sessions were held to ensure quality and consistency of the data reduction. To assess the intercoder reliability, 50 ran-domly selected trips were coded independently by all reductionists. Krippendorf’s alpha was used to statistically test the level of agree-ment (12). Over all 50 quadruple coded trips, Krippendorf’s alpha was α = 0.89 for having observed the same behavior (nominal), and α = 0.83 for having coded the same event duration (ratio), indicating a good agreement between the data reductionists.
Results
In total the participants made 1,319 trips and drove for 573 h. Par-ticipants made a mean number of 62 trips (SD = 21.6) and drove for 27.3 h (SD = 10.9). On average, a participant had the naviga-tion system activated during 23% of the trips (SD = 16), either a complete trip or partially. Participants interacted with their mobile phones during 40% of the trips (SD = 20) on average. During the 4 to 5 weeks of driving observation, a total of 2,577 manual inter-actions were observed for the mobile phone and 1,026 interactions for the navigation system. When possible, results were subjected to either a dependent-samples T-test or a repeated measures ANOVA to test the significance of differences found.
Frequency and duration of Manual Interactions
The average number of manual interactions with the navigation system and mobile phone per hour and the average duration of the manual interactions for each participant are presented in Figure 2. The figure shows that participants who manually interacted with their devices more often did not necessarily have longer average durations for these interactions.
TABLE 1 Definitions of Subtasks in Manual Interactions
Subtask Definition
Grabbing (visual– manual task)
Retrieving the device from the storage location into one’s hand and returning to the driving position.
Operating (visual– manual task)
Touching the device to perform a task and looking at the device to support performing this task.
Holding (manual task)
Having the device in the hand without operating it or making eye glances toward the device.
FIGURE 2 Manual interactions: (a) average number of manual interactions per hour and (b) average duration of manual interactions in seconds (ns 5 navigation system; mp 5 mobile phone).
0
5
10
15
1 2 3 4 5 6 7 8 9 10 11 12 13 14 15 16 17 18 19 20 21Ave
rag
e n
um
ber
of
inte
ract
ion
s p
er h
ou
r
Participant
NS interactions MP interactions
0
20
40
60
80
1 2 3 4 5 6 7 8 9 10 11 12 13 14 15 16 17 18 19 20 21Ave
rag
e d
ura
tio
n o
fin
tera
ctio
ns
(s)
Participant
NS interactions MP interactions
(a)
(b)
34 Transportation Research Record 2365
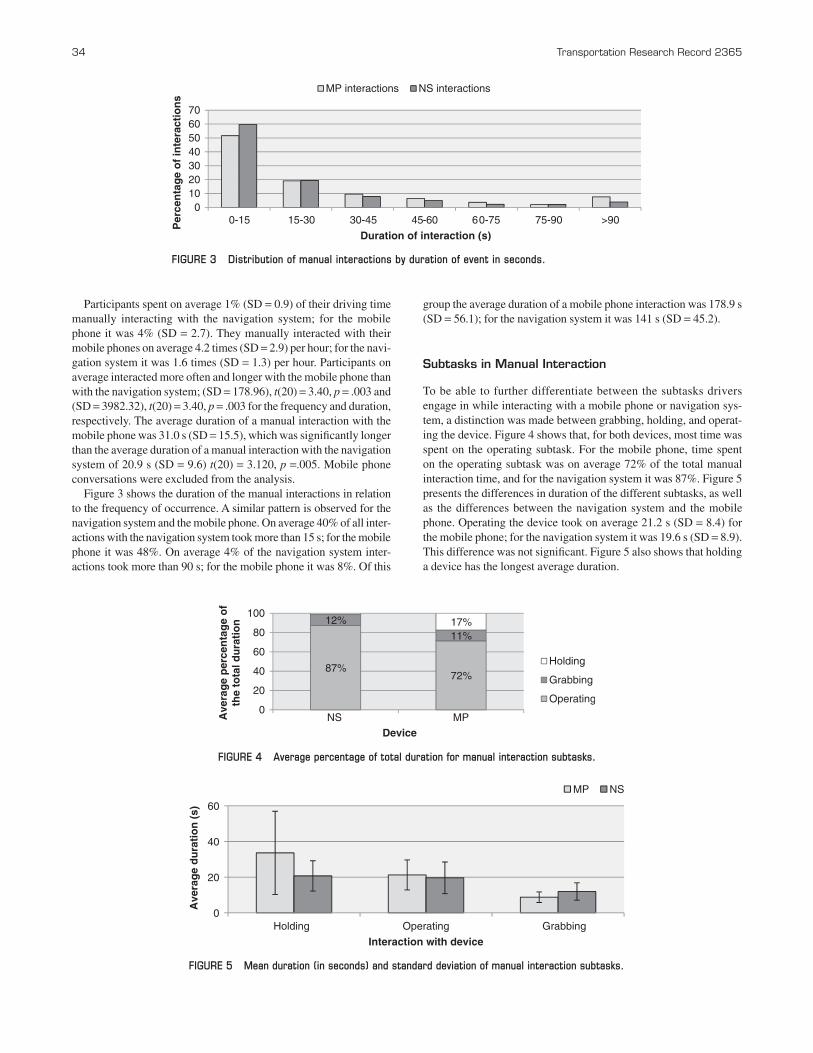
Participants spent on average 1% (SD = 0.9) of their driving time manually interacting with the navigation system; for the mobile phone it was 4% (SD = 2.7). They manually interacted with their mobile phones on average 4.2 times (SD = 2.9) per hour; for the navi-gation system it was 1.6 times (SD = 1.3) per hour. Participants on average interacted more often and longer with the mobile phone than with the navigation system; (SD = 178.96), t(20) = 3.40, p = .003 and (SD = 3982.32), t(20) = 3.40, p = .003 for the frequency and duration, respectively. The average duration of a manual interaction with the mobile phone was 31.0 s (SD = 15.5), which was significantly longer than the average duration of a manual interaction with the navigation system of 20.9 s (SD = 9.6) t(20) = 3.120, p =.005. Mobile phone conversations were excluded from the analysis.
Figure 3 shows the duration of the manual interactions in relation to the frequency of occurrence. A similar pattern is observed for the navigation system and the mobile phone. On average 40% of all inter-actions with the navigation system took more than 15 s; for the mobile phone it was 48%. On average 4% of the navigation system inter-actions took more than 90 s; for the mobile phone it was 8%. Of this
group the average duration of a mobile phone interaction was 178.9 s (SD = 56.1); for the navigation system it was 141 s (SD = 45.2).
subtasks in Manual Interaction
To be able to further differentiate between the subtasks drivers engage in while interacting with a mobile phone or navigation sys-tem, a distinction was made between grabbing, holding, and operat-ing the device. Figure 4 shows that, for both devices, most time was spent on the operating subtask. For the mobile phone, time spent on the operating subtask was on average 72% of the total manual interaction time, and for the navigation system it was 87%. Figure 5 presents the differences in duration of the different subtasks, as well as the differences between the navigation system and the mobile phone. Operating the device took on average 21.2 s (SD = 8.4) for the mobile phone; for the navigation system it was 19.6 s (SD = 8.9). This difference was not significant. Figure 5 also shows that holding a device has the longest average duration.
87%72%
12%
11%17%
0
20
40
60
80
100
NS MPAve
rag
e p
erce
nta
ge
of
the
tota
l du
rati
on
Device
Holding
Grabbing
Operating
FIGURE 4 Average percentage of total duration for manual interaction subtasks.
010203040506070
0-15 15-30 30-45 45-60 60-75 75-90 >90Per
cen
tag
e o
f in
tera
ctio
ns
Duration of interaction (s)
MP interactions NS interactions
FIGURE 3 Distribution of manual interactions by duration of event in seconds.
FIGURE 5 Mean duration (in seconds) and standard deviation of manual interaction subtasks.
0
20
40
60
Holding Operating Grabbing
Ave
rag
e d
ura
tio
n (
s)
Interaction with device
MP NS

Christoph, van Nes, and Knapper 35
For the navigation system operating events, a distinction was made between destination entry and an “other task.” Participants made on average 18.1 (SD = 15.0) destination entries and 31.9 (SD = 28.7) other tasks. Participants spent significantly longer on destination entries, 26.6 s (SD = 13.2), compared with other tasks, 15.3 s (SD = 10.0), t(20) = 4.295, p < .001.
Frequency and duration of Visual–Manual tasks
Because the operating stage is the main and most (visually) distract-ing part of a manual interaction, the operating subtask was studied in more depth. Figure 6 shows the relationship between the duration of operating events and their frequency of occurrence. For the navi-gation system and the mobile phone, 36% of all operating events took more than 15 s. Just 2% of the navigation system operating events took more than 90 s; for the mobile phone it was 3%.
Vehicle speed at Which drivers Initiated Visual–Manual task in Relation to task duration
The focus of the discussion here is the speed behavior for the visual–manual tasks. Speed data in the current study are based mainly on speed figures derived from the GPS sensor. As mentioned, on aver-age it took the GPS sensor 3 to 4 min to acquire a valid signal. This means that in most cases speed measurements at the very beginning of the trip were unavailable. In instances in the analyses in which speed is reported as a dichotomous variable (stopped or driving), the video of the events in which no GPS signal was available was
used to determine the speed status. Figure 7 presents the percent-age of operating tasks for the navigation system and mobile phone while the participant was driving or while the vehicle was stopped. A paired samples t-test revealed that drivers operated the mobile phone and the navigation system significantly more often while they were driving than while they were stopped; (SD = 77.58), t(17) = 4.45, p < .001 and (SD = 28.84), t(17) = 3.85, p = .001 for the mobile phone and the navigation system, respectively.
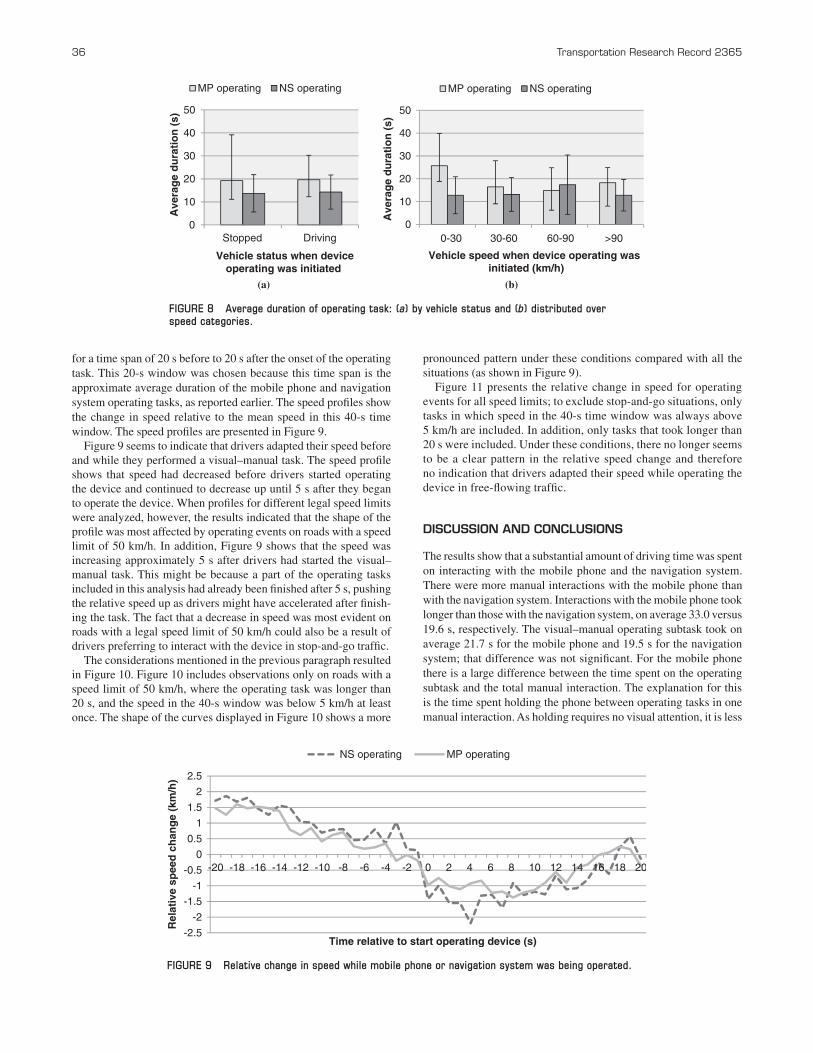
Figure 8a shows the duration of operating events in relation to vehicle status at the time the visual–manual task was initiated. For the navigation system and the mobile phone there was no signifi-cant difference in the duration of the operating task for the situ-ations in which the task was initiated while the participant was driving or when stopped. Figure 8b presents the average duration of the operating task in four speed categories at which this task was started. For the mobile phone, a repeated measures ANOVA with Greenhouse–Geisser correction determined a significant main effect of the vehicle speed at which the task was started on the dura-tion of the operating task, F(1.85, 31.51) = 5.81, p = .008. Pairwise comparisons corrected with Bonferroni revealed no significant dif-ferences between the speed categories. No significant effects of the speed at which the task was started on the duration of the operating tasks were found for the navigation system.
exploratory Analysis of speed Behavior Before and during Visual–Manual tasks
To analyze the speed behavior before and while the visual–manual operating task was being performed, speed profiles were generated
FIGURE 6 Distribution of operating events by duration of event in seconds.
0
20
40
60
80
0-15 15-30 45-60 60-75 75-90 >90Ave
rag
e p
erce
nta
ge
of
op
erat
ing
eve
nts
Duration of operating (s)
MP operating NS operating
30-45
21% 20%
79% 80%
20
40
60
80
0
100
MP operating NS operating
Per
cen
tag
e o
f o
per
atin
gev
ents
Device
Stopped Driving
FIGURE 7 Percentage of operating events while driver stopped or was driving for mobile phone and navigation system.
36 Transportation Research Record 2365
for a time span of 20 s before to 20 s after the onset of the operating task. This 20-s window was chosen because this time span is the approximate average duration of the mobile phone and navigation system operating tasks, as reported earlier. The speed profiles show the change in speed relative to the mean speed in this 40-s time window. The speed profiles are presented in Figure 9.
Figure 9 seems to indicate that drivers adapted their speed before and while they performed a visual–manual task. The speed profile shows that speed had decreased before drivers started operating the device and continued to decrease up until 5 s after they began to operate the device. When profiles for different legal speed limits were analyzed, however, the results indicated that the shape of the profile was most affected by operating events on roads with a speed limit of 50 km/h. In addition, Figure 9 shows that the speed was increasing approximately 5 s after drivers had started the visual–manual task. This might be because a part of the operating tasks included in this analysis had already been finished after 5 s, pushing the relative speed up as drivers might have accelerated after finish-ing the task. The fact that a decrease in speed was most evident on roads with a legal speed limit of 50 km/h could also be a result of drivers preferring to interact with the device in stop-and-go traffic.
The considerations mentioned in the previous paragraph resulted in Figure 10. Figure 10 includes observations only on roads with a speed limit of 50 km/h, where the operating task was longer than 20 s, and the speed in the 40-s window was below 5 km/h at least once. The shape of the curves displayed in Figure 10 shows a more
pronounced pattern under these conditions compared with all the situations (as shown in Figure 9).
Figure 11 presents the relative change in speed for operating events for all speed limits; to exclude stop-and-go situations, only tasks in which speed in the 40-s time window was always above 5 km/h are included. In addition, only tasks that took longer than 20 s were included. Under these conditions, there no longer seems to be a clear pattern in the relative speed change and therefore no indication that drivers adapted their speed while operating the device in free-flowing traffic.
dIsCussIon And ConClusIons
The results show that a substantial amount of driving time was spent on interacting with the mobile phone and the navigation system. There were more manual interactions with the mobile phone than with the navigation system. Interactions with the mobile phone took longer than those with the navigation system, on average 33.0 versus 19.6 s, respectively. The visual–manual operating subtask took on average 21.7 s for the mobile phone and 19.5 s for the navigation system; that difference was not significant. For the mobile phone there is a large difference between the time spent on the operating subtask and the total manual interaction. The explanation for this is the time spent holding the phone between operating tasks in one manual interaction. As holding requires no visual attention, it is less
0
10
20
30
40
50
Stopped Driving
Ave
rag
e d
ura
tio
n (
s)
Vehicle status when deviceoperating was initiated
MP operating NS operating
0
10
20
30
40
50
0-30 30-60 60-90 >90
Ave
rag
e d
ura
tio
n (
s)
Vehicle speed when device operating wasinitiated (km/h)
MP operating NS operating
(a) (b)
FIGURE 8 Average duration of operating task: (a) by vehicle status and (b) distributed over speed categories.
-2.5
-2
-1.5
-1
-0.5
0
0.5
1
1.5
2
2.5
-20 -18 -16 -14 -12 -8 -6 -4 -2 0 2 4 6 8 10 12 14 16 18 20
Rel
ativ
e sp
eed
ch
ang
e (k
m/h
)
Time relative to start operating device (s)
NS operating MP operating
-10
FIGURE 9 Relative change in speed while mobile phone or navigation system was being operated.

Christoph, van Nes, and Knapper 37
-6
-5
-4
-3
-2
-1
0
1
2
3
4
5
-20 -18 -16 -14 -12 -10 -8 -6 -4 -2 0 2 4 6 8 10 12 14 16 18 20
Rel
ativ
e sp
eed
ch
ang
e (k
m/h
)
Time relative to start operating device (s)
NS operating MP operating
FIGURE 11 Relative speed change while driver was operating mobile phone or navigation system for all speed limits (includes only operating tasks longer than 20 s when speed in 40-s window was not below 5 km/h).
-10
-5
0
5
10
15
-20 -18 -16 -14 -12 -10 -8 -6 -4 -2 0 2 4 6 8 10 12 14 16 18 20
Rel
ativ
e sp
eed
ch
ang
e (k
m/h
)
Time relative to start operating device (s)
NS operating MP operating
FIGURE 10 Relative speed change while driver was operating mobile phone or navigation system (includes only observations on roads with speed limit of 50 km/h when operating task was longer than 20 s and speed in the 40-s window was below 5 km/h at least once).
distracting from the driving task than actively operating the device. However, as holding a device ties up one hand it may compromise emergency evasive steering performance.
Results suggest that the tasks, in particular for the mobile phone, often take drivers too long to perform without interruption when they are behind the wheel and prevent them from paying full atten-tion to the driving task. Drivers in fact cut the task into several pieces and squeeze these pieces into the driving task. The average duration of an operating event was about 20 s, which may indicate that this is about the duration that drivers feel confident with and will allow themselves to spend on a visual–manual task. Although for both devices the major part of the operating events took less than 15 s, results show that there were still a substantial number of interactions that did take longer. Overall, results suggest that a substantial number of manual and visual–manual interactions with the mobile phone and the navigation system (1% and 4% of the total driving time) took place while participants were driving.
The analysis related to driving speed showed that drivers operated the mobile phone and navigation system significantly more often while they were driving than while the vehicle was stopped. Future analy-ses, however, should correct these results for exposure to driving and stopped situations. No significant differences in the average duration of the operating task were found for the navigation system and mobile
phone while participants were driving or while they were stopped. The exploratory analysis on speed before and while drivers are oper-ating the device suggests that drivers do not adjust their speed while operating the device in free-flowing traffic. The speed decrease found during the visual–manual task is likely to be the result of drivers inter-acting with the device in stop-and-go traffic. Future analysis should further study whether drivers favor inter acting with devices in stop-and-go traffic compared with free-flowing traffic as this might indicate strategic behavior.
lIMItAtIons And FutuRe ReseARCh
Participants in this study were drivers who drove frequently and used a navigation system and mobile phone regularly while driving (at least once a week); therefore these participants may not be rep-resentative of the general driving population. As a result, the fre-quency of manual interactions in the sample could be different from that of the general population. There is no indication however that the average duration of manual interactions would be different in another sample, as Figure 2 shows that there does not seem to be a strong relationship between duration and frequency of use. Future research could validate the average duration of manual interactions

38 Transportation Research Record 2365
found in this study and verify whether the average duration of manual interactions is indeed unrelated to the frequency.
Another limitation of this study is the fact that participants did not use their own vehicles. In the analyses, possible effects of driving another vehicle are compensated for by excluding the first week of data gathered for each participant in which participants familiarized themselves with driving another vehicle.
A substantial amount of driving time was spent on secondary tasks, which could affect safe driving. Previous research indicates that two tasks that require the same sensory modality (e.g., visual modality) and that are performed in parallel, interfere with one another (13–15) and could affect performance on both tasks (16). As driving is mainly a visual task, further research should be done on eye glance behavior during the visual–manual tasks to determine the level of visual distrac-tion caused by interactions with a device (17, 18). Previous research has already shown that eyes off the road time is an important measure for determining the amount of distraction for a driver and the related crash risk (19, 20). It would also be interesting to investigate under what circumstances a driver uses a device in the car, to see whether a driver favors low-complexity situations, for instance. In addition, future research could also study whether the amount of visual attention required by the tasks performed with the devices could be reduced by voice-controlled technology.
ACknoWledgMents
The research leading to these results received funding from the European Community’s Seventh Framework Programme FP7 (2007–2013) under the project INTERACTION. The authors acknowledge the contributions of Simone Wesseling to the data reduction and analysis of this study.
ReFeRenCes
1. Mobile Phone Use: A Growing Problem of Driver Distraction. World Health Organization, Geneva, 2011.
2. Stelling, A., and M. P. Hagenzieker. Afleiding in het verkeer. SWOV Institute for Road Safety Research, Leidschendam, Netherlands, 2012.
3. Hosking, S. G., K. L. Young, and M. A. Regan. The Effects of Text Messaging on Young Drivers. Human Factors, Vol. 51, No. 4, 2009, pp. 582–592.
4. Drews, F. A., H. Yazdani, C. N. Godfrey, J. M. Cooper, and D. L. Strayer. Text Messaging During Simulated Driving. Human Factors, Vol. 51, No. 5, 2009, pp. 762–770.
5. Törnros, J. E. B., and A. K. Bolling. Mobile Phone Use—Effects of Handheld and Handsfree Phones on Driving Performance. Accident Analysis and Prevention, Vol. 37, No. 5, 2005, pp. 902–909.
6. Chiang, D. P., A. M. Brooks, and D. H. Weir. An Experimental Study of Destination Entry with an Example Automobile Navigation System. Society of Automotive Engineers Special Publication. SAE Paper 2001-01-0810. Society of Automotive Engineers, 2001.
7. Liang, Y., and J. D. Lee. Combining Cognitive and Visual Distraction: Less Than the Sum of Its Parts. Accident Analysis and Prevention, Vol. 42, No. 3, 2010, pp. 881–890.
8. Klauer, S. G., T. A. Dingus, V. L. Neale, J. D. Sudweeks, and D. J. Ramsey. The Impact of Driver Inattention on Near-Crash/Crash Risk: An Analysis Using the 100-Car Naturalistic Driving Study Data. DOT HS-810 594. NHTSA, U.S. Department of Transportation, 2006.
9. Hickman, J. S., R. J. Hanowski, and J. Bocanegra. Distraction in Com-mercial Trucks and Buses: Assessing Prevalence and Risk in Conjunc-tion with Crashes and Near-Crashes. FMCSA-RRR-10-049. Federal Motor Carrier Safety Administration, Washington, D.C., 2010.
10. Olson, R. L., R. J. Hanowski, J. S. Hickman, and J. L. Bocanegra. Driver Distraction in Commercial Vehicle Operations. FMCSA-RRR-09-042. U.S. Department of Transportation, 2009.
11. Britschgi, V., P. Rämä, and M. Penttinen. Survey on Individual and Cross-Cultural Differences in the Use of In-Vehicle Technologies (IVT). Report FP7 project INTERACTION, 2010.
12. Hayes, A. F., and K. Krippendorff. Answering the Call for a Standard Reliability Measure for Coding Data. Communication Methods and Measures, Vol. 1, No. 1, 2007, pp. 77–89.
13. Duncan, J., P. Williams, I. Nimmo-Smith, and I. D. Brown. The Control of Skilled Behavior: Learning, Intelligence and Distraction. MIT Press, Cambridge, Mass., 1992.
14. Groeger, J. A. Understanding Driving: Applying Cognitive Psychol-ogy to a Complex Everyday Task. Psychology Press, Taylor & Francis Group, East Sussex, United Kingdom, 2000.
15. Shinar, D., M. Meir, and I. Ben-Shoham. How Automatic Is Manual Gear Shifting? Human Factors, Vol. 40, No. 4, 1998, pp. 647–654.
16. Wickens, C. D. Multiple Resources and Performance Prediction. Theo-retical Issues in Ergonomics Science, Vol. 3, No. 2, 2002, pp. 159–177.
17. Hills, B. Vision, Visibility and Perception in Driving. Perception, Vol. 9, No. 2, 1980, pp. 183–216.
18. Sivak, M. The Information That Drivers Use: Is It Indeed 90% Visual? Perception, Vol. 25, No. 9, 1996, pp. 1081–1089.
19. Burns, P., J. Harbluk, J. P. Foley, and L. Angell. The Importance of Task Duration and Related Measures in Assessing the Distraction Potential of In-Vehicle Tasks. Proc., 2nd International Conference on Auto-motive User Interfaces and Interactive Vehicular Applications. Carnegie Mellon University, Pittsburgh, Pa., 2010.
20. Klauer, S. G., F. Guo, J. Sudweeks, and T. A. Dingus. An Analysis of Driver Inattention Using a Case-Crossover Approach on 100-Vehicle Data: Final Report. DOT HS 811 334. NHTSA, U.S. Department of Transportation, 2010.
The Vehicle User Characteristics Committee peer-reviewed this paper.