natixis quarterly results · c3 - restricted natixis covid-19 main observable impacts(1) from the...
TRANSCRIPT

Natixis 1Q20 resultsMay 6, 2020
C3 - Restricted Natixis
DISCLAIMER
This media release may contain objectives and comments relating to the objectives
and strategy of Natixis. Any such objectives inherently depend on assumptions, project
considerations, objectives and expectations linked to future and uncertain events,
transactions, products and services as well as suppositions regarding future performances
and synergies.
No assurance can be given that such objectives will be realized. They are subject
to inherent risks and uncertainties and are based on assumptions relating to Natixis,
its subsidiaries and associates, and the business development thereof; trends in the sector;
future acquisitions and investments; macroeconomic conditions and conditions in Natixis'
principal local markets; competition and regulations. Occurrence of such events is not
certain, and outcomes may prove different from current expectations, significantly affecting
expected results. Actual results may differ significantly from those implied by such
objectives.
Information in this media release relating to parties other than Natixis or taken from
external sources has not been subject to independent verification, and Natixis makes no
warranty as to the accuracy, fairness or completeness of the information or opinions
herein. Neither Natixis nor its representatives shall be liable for any errors or omissions
or for any harm resulting from the use of this media release, its contents or any document
or information referred to herein.
Figures in this presentation are unaudited.
MAY 6, 2020 1Q20 RESULTS2

C3 - Restricted Natixis
3
Figures excluding exceptional items(1)
(1) See page 8 (2) See note on methodology
NETREVENUES
+0%
OPERATING EXPENSES
Flat
CET1 FL(2)
11.4%~310bps above current CET1 requirements
EARNINGS CAPACITY(2)
+€60m
NETREVENUES
+0%
NETREVENUES
Businesses excl. CVA/DVA
-3%
1Q20 resultsSolid balance sheet together with positive earnings capacity to face the current environment
MAY 6, 2020 1Q20 RESULTS
Solid balance sheet features…
Capital11.4% CET1 FL(2) ratio
~310bps above current regulatory requirements and
~120bps above new 2020-2021 target of 10.2%
Liquidity>100% LCR ratio
Joint funding platform together with BPCE
Leverage4.5% Leverage(2) ratio
Asset duration>70% of assets with a duration < 1 year
Low sensitivity to IFRS 9 lifetime expected loss transitioning
…for more agility in the current environment
C3 - Restricted Natixis
4
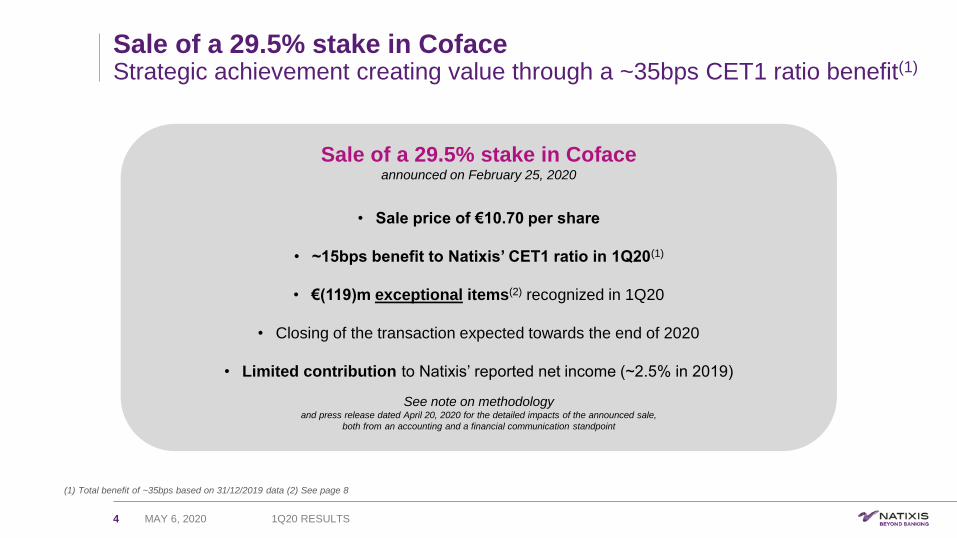
Sale of a 29.5% stake in CofaceStrategic achievement creating value through a ~35bps CET1 ratio benefit(1)
MAY 6, 2020 1Q20 RESULTS
Sale of a 29.5% stake in Cofaceannounced on February 25, 2020
• Sale price of €10.70 per share
• ~15bps benefit to Natixis’ CET1 ratio in 1Q20(1)
• €(119)m exceptional items(2) recognized in 1Q20
• Closing of the transaction expected towards the end of 2020
• Limited contribution to Natixis’ reported net income (~2.5% in 2019)
See note on methodologyand press release dated April 20, 2020 for the detailed impacts of the announced sale,
both from an accounting and a financial communication standpoint
(1) Total benefit of ~35bps based on 31/12/2019 data (2) See page 8
C3 - Restricted Natixis
5 MAY 6, 2020 1Q20 RESULTS
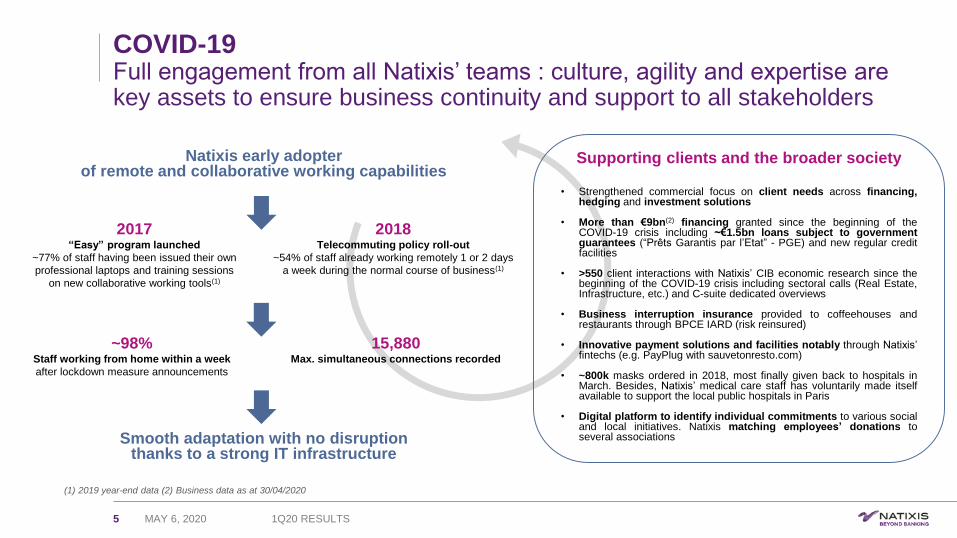
COVID-19Full engagement from all Natixis’ teams : culture, agility and expertise are key assets to ensure business continuity and support to all stakeholders
(1) 2019 year-end data (2) Business data as at 30/04/2020
Supporting clients and the broader society
• Strengthened commercial focus on client needs across financing,hedging and investment solutions
• More than €9bn(2) financing granted since the beginning of theCOVID-19 crisis including ~€1.5bn loans subject to governmentguarantees (“Prêts Garantis par l’Etat” - PGE) and new regular creditfacilities
• >550 client interactions with Natixis’ CIB economic research since thebeginning of the COVID-19 crisis including sectoral calls (Real Estate,Infrastructure, etc.) and C-suite dedicated overviews
• Business interruption insurance provided to coffeehouses andrestaurants through BPCE IARD (risk reinsured)
• Innovative payment solutions and facilities notably through Natixis’fintechs (e.g. PayPlug with sauvetonresto.com)
• ~800k masks ordered in 2018, most finally given back to hospitals inMarch. Besides, Natixis’ medical care staff has voluntarily made itselfavailable to support the local public hospitals in Paris
• Digital platform to identify individual commitments to various socialand local initiatives. Natixis matching employees’ donations toseveral associations
Natixis early adopterof remote and collaborative working capabilities
~98%Staff working from home within a week
after lockdown measure announcements
15,880Max. simultaneous connections recorded
2017“Easy” program launched
~77% of staff having been issued their own
professional laptops and training sessions
on new collaborative working tools(1)
2018Telecommuting policy roll-out
~54% of staff already working remotely 1 or 2 days
a week during the normal course of business(1)
Smooth adaptation with no disruptionthanks to a strong IT infrastructure

C3 - Restricted Natixis
COVID-19Main observable impacts(1) from the COVID-19 context in 1Q20
6 MAY 6, 2020 1Q20 RESULTS
(1) Not exhaustive (2) See page 8 (3) Management data, gross
Excluding exceptional items(2)
The main direct impact from the COVID-19 context on
Natixis’ 1Q20 cost of risk comes from IFRS 9
provisioning based on scenario reweighting
(pessimistic now at 100%) to reflect the evolution of
the macroeconomic context
Besides, oil price pressures have also added to the
demand shock ensued from the COVID-19 economic
slowdown, notably in Asia, indirectly leading to
individual cost of risk increases and notably some
frauds
~€(115)mImpact
CET1 Capital
~€(510)mImpact from lower OCI and higher PVA deduction
RWA
~€3.2bnImpact from higher Market RWA (~€1.0bn),
CVA RWA (~€0.5bn) and
Credit RWA due to RCF drawdowns(3) (~€1.7bn)
~(90)bps~70bps mechanically linked to 1Q market evolution
that should recover over time
AWM• €(34)m impact from seed money portfolio mark-downs
CIB• €(55)m CVA/DVA impact
• €(130)m impact from dividend mark-downs on equity
products after corporates’ 2019 dividend cancellation
(Global markets - Equity)
CORPORATE CENTER• €(71)m FVA impact
~€(290)m~€160m mechanically linked to 1Q market evolution
that should recover over time
Net revenues CapitalCost of risk

Natixis consolidated1Q20 results
C3 - Restricted Natixis
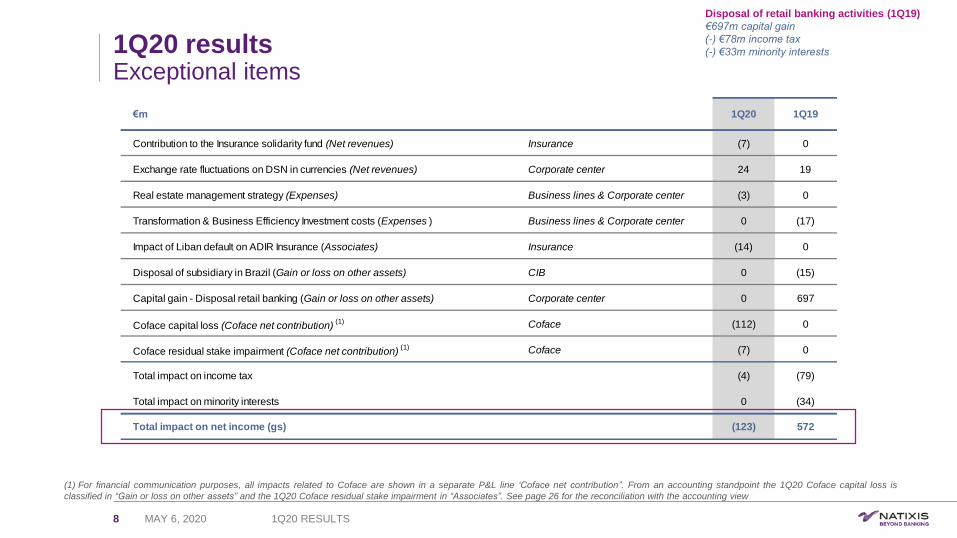
€m 1Q20 1Q19
Contribution to the Insurance solidarity fund (Net revenues) Insurance (7) 0
Exchange rate fluctuations on DSN in currencies (Net revenues) Corporate center 24 19
Real estate management strategy (Expenses) Business lines & Corporate center (3) 0
Transformation & Business Efficiency Investment costs (Expenses ) Business lines & Corporate center 0 (17)
Impact of Liban default on ADIR Insurance (Associates) Insurance (14) 0
Disposal of subsidiary in Brazil (Gain or loss on other assets) CIB 0 (15)
Capital gain - Disposal retail banking (Gain or loss on other assets) Corporate center 0 697
Coface capital loss (Coface net contribution)(1) Coface (112) 0
Coface residual stake impairment (Coface net contribution)(1) Coface (7) 0
Total impact on income tax (4) (79)
Total impact on minority interests 0 (34)
Total impact on net income (gs) (123) 572
1Q20 resultsExceptional items
8
Disposal of retail banking activities (1Q19)
€697m capital gain
(-) €78m income tax
(-) €33m minority interests
MAY 6, 2020 1Q20 RESULTS
(1) For financial communication purposes, all impacts related to Coface are shown in a separate P&L line ‘Coface net contribution”. From an accounting standpoint the 1Q20 Coface capital loss is
classified in “Gain or loss on other assets” and the 1Q20 Coface residual stake impairment in “Associates”. See page 26 for the reconciliation with the accounting view
C3 - Restricted Natixis
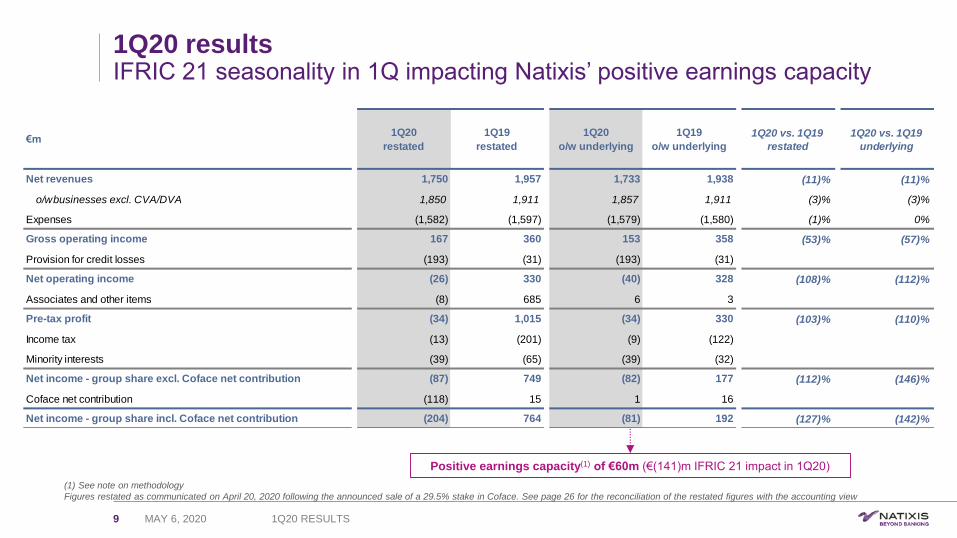
1Q20 resultsIFRIC 21 seasonality in 1Q impacting Natixis’ positive earnings capacity
9
(1) See note on methodology
Figures restated as communicated on April 20, 2020 following the announced sale of a 29.5% stake in Coface. See page 26 for the reconciliation of the restated figures with the accounting view
MAY 6, 2020 1Q20 RESULTS
Positive earnings capacity(1) of €60m (€(141)m IFRIC 21 impact in 1Q20)
€m1Q20
restated
1Q19
restated
1Q20
o/w underlying
1Q19
o/w underlying
1Q20 vs. 1Q19
restated
1Q20 vs. 1Q19
underlying
Net revenues 1,750 1,957 1,733 1,938 (11)% (11)%
o/w businesses excl. CVA/DVA 1,850 1,911 1,857 1,911 (3)% (3)%
Expenses (1,582) (1,597) (1,579) (1,580) (1)% 0%
Gross operating income 167 360 153 358 (53)% (57)%
Provision for credit losses (193) (31) (193) (31)
Net operating income (26) 330 (40) 328 (108)% (112)%
Associates and other items (8) 685 6 3
Pre-tax profit (34) 1,015 (34) 330 (103)% (110)%
Income tax (13) (201) (9) (122)
Minority interests (39) (65) (39) (32)
Net income - group share excl. Coface net contribution (87) 749 (82) 177 (112)% (146)%
Coface net contribution (118) 15 1 16
Net income - group share incl. Coface net contribution (204) 764 (81) 192 (127)% (142)%

C3 - Restricted Natixis
1Q20 resultsPositive earnings capacity through resilient top-line and costs under control
10
Figures excluding exceptional items(1) Net revenues impacted by the following lumpy items, all directly or indirectly linked to
the COVID-19 context for a total amount of ~€(290)m:
• AWM: €(34)m mark-down impact on the seed money portfolio (post overlay) due
to the sharp drop in market levels in March
• CIB: €(55)m CVA/DVA (Credit/Debit Value Adjustment) impact due to spreads
widening on the back of perceived counterparty credit risk deterioration as at
March 31, 2020 vs. December 31, 2019. €(130)m impact from dividend mark-
downs across Equity following corporates’ 2019 dividend cancellation and the
related sharp moves of dividend future curves
• Corporate Center: €(71)m FVA (Funding Value Adjustment) impact due to the
increase in funding costs on the market
Expenses are flat YoY and even down -1% at constant FX reflecting ongoing cost
discipline
Cost of risk reflecting higher provisioning, mainly across energy exposures as well
as some IFRS 9 provisioning (see page 12)
Coface net contribution based on a ~13% residual stake (vs. ~42% in 1Q19)
Earnings capacity(3) positive at €60m despite these lumpy items, adjusting for the
front-loading of mandatory expenses recognized every 1Q due to IFRIC 21
(1) See page 8 (2) See note on methodology and excluding IFRIC 21 (3) See note on methodology
73.2%81.9%
1Q19 1Q20Cost/income ratio(2)
+8.7 pp10.2%
0.8%
1Q19 1Q20RoTE after tax(2)
-9.4 pp
MAY 6, 2020 1Q20 RESULTS
€m 1Q20 1Q191Q20
vs. 1Q19
1Q20
vs. 1Q19
constant FX
Net revenues 1,733 1,938 (11)% (12)%
o/w businesses excl. CVA/DVA 1,857 1,911 (3)% (4)%
Expenses (1,579) (1,580) 0% (1)%
Gross operating income 153 358 (57)% (58)%
Provision for credit losses (193) (31)
Associates and other items 6 3
Pre-tax profit (34) 330 (110)%
Income tax (9) (122)
Minority interests (39) (32)
Net income (gs) - underlying excl. Coface net contribution (82) 177 (146)%
Coface net contribution 1 16
Net income (gs) - underlying incl. Coface net contribution (81) 192 (142)%
Restatement of IFRIC 21 141 142
Net income (gs) excl. IFRIC 21 - underlying incl. Coface 60 334 (82)%

C3 - Restricted Natixis
11
(1) Energy & Natural Resources + Real Asset perimeters
Exposures at DefaultFocus on selected sectors across Natixis’ well diversified portfolio
MAY 6, 2020
Oil & Gas(1): >75% of exposures with no/limited sensitivity to oil prices
€10.1bn Net EaD: ~60% Investment Grade
1Q20 RESULTS
Not exposed
to oil price
risk
Independent producers &
service companies
Offshore Infrastructure
Independent producers risk mitigants include:
• senior secured lending position among creditors (RBL security package);
• borrower’s hedging policy is part of credit decision making;
• IP are prompt in adjusting Capex and Opex to market environment;
• semi-annual borrowing base redeterminations include revised price assumptions
Companies involved in drilling rigs, in assistance to production, pipe laying, heavy
lifting, etc. ➔ Exposure in and out of the US market has been almost exited over the
past 10 years
Mainly operational offshore platforms with Majors/NOCs & investment grade
companies in secured lending basis only
€1.1bn
US
€1.4bn
EMEA/
Other
Trade finance
Midstream
Trade financing is inherently very short term (< 90 days). Traders are generally hedged
against price variation risk. Natixis is not exposed to the oil price variation risk
Transportation (pipeline), storage and wholesale marketing of crude oil, petroleum
products and gas. Most resilient segment as revenues are generally based on carried
volume and not linked to oil price
€4.7bn
€0.2bn
€0.4bn
Refining / Petrochemicals
Liquefied Natural Gas
Majors &
National Oil Companies
Mainly secured transactions (Asset Back Facilities) to US refiners which enjoy a
favorable refining margin environment
Mainly long term contracts with Majors in a take or pay or tolling basis
Majors / integrated oil companies with strong balance sheet and national oil companies
of strategic importance for oil producing countries
€1.2bn
€0.2bn
€1.0bn
Absorption
capacity of
lower oil price
Not directly
exposed to oil
price risk or
with a low
sensitivity to
oil price risk
More limited
absorption
capacity of
lower oil price
Positioning of the US portfolio to be reviewed in line with Natixis’ CIB green strategy
Aviation(1): ~80% of secured exposures
€4.5bn Net EaD: well-diversified portfolio across ~30
countries (no country accounting for >20% of Net EaD),
~80% of exposures secured and majority Investment Grade.
Majority of aircrafts aged < 10 years and narrow-body type i.e.
less sensitive to asset price variation in a stressed scenario.
Various government’s measures for the industry also likely to
limit potential jumps to default (~€0.3bn of “sensitive”
exposures)
• €2.3bn Net EaD to airlines
• €2.2bn Net EaD to lessors
Leisure, Hotels & Restaurants
€1.7bn Net EaD: 94% EMEA, geared towards industry
leaders and with limited non-performing assets (~2%)
No more exposure to Shipping
Limited exposure to SMEs

C3 - Restricted Natixis
12
(1) Cost of risk excluding credit institutions. Cost of risk in bps of total amount of loans outstanding, beginning of period
Cost of riskLimited pro-cyclicality due to balance-sheet features and positioning
MAY 6, 2020 1Q20 RESULTS
Limited pro-cyclicality from IFRS 9
due to balance sheet features
Natixis’ internal models are based on inputs close to the
latest SSM macroeconomic baseline scenario purposely
released for the current situation. Pessimistic scenario now
weighted at 100% in IFRS 9 models.
Short duration balance-sheet means potentially limited “cliff
effect” from Stage 1 exposures (12-m EL) transitioning to
Stage 2 (lifetime EL).
As such, future cost of risk impacts could be mostly derived
from individual jumps to default that could nonetheless be
limited by governments’ supporting measures which overall
impact will be assessed over time.
2020 cost of risk sensitivity to a severe macroeconomic scenario
Natixis’ focused positioning means exposures outside France limited to a few sectors of expertise i.e. not reflective of the broader economy as measured by GDP
Based on the projection of a ~9% drop in the 2020 French GDP (cumulative ~4% drop for 2020-2021) and severe assumptions across sectors of expertise
incl. only modest oil price recovery towards early April levels and significant haircuts to asset prices on real assets (e.g. ~30-40% for aircrafts and ~15% for real estate),
cost of risk for the rest of the year could be along the lines of 1Q20 or moderately above
Main COVID-19 related impacts
Direct
IFRS 9 scenario reweighting (100% pessimistic)
Indirect
Frauds - mainly in Energy & Natural Resources
~45bps cost of risk(1) excluding such impacts
Breakdown of 1Q20 cost of risk
~60%
~40%
COVID-19 direct impacts & frauds
Cost of risk excl. COVID-19
117bps(1)
C3 - Restricted Natixis
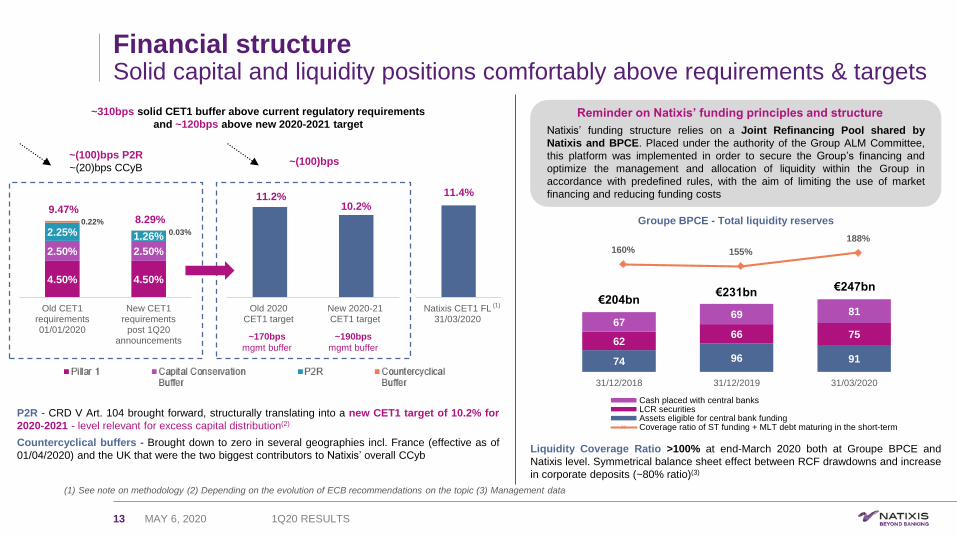
Financial structureSolid capital and liquidity positions comfortably above requirements & targets
13
(1) See note on methodology (2) Depending on the evolution of ECB recommendations on the topic (3) Management data
~310bps solid CET1 buffer above current regulatory requirements
and ~120bps above new 2020-2021 target
P2R - CRD V Art. 104 brought forward, structurally translating into a new CET1 target of 10.2% for
2020-2021 - level relevant for excess capital distribution(2)
Countercyclical buffers - Brought down to zero in several geographies incl. France (effective as of
01/04/2020) and the UK that were the two biggest contributors to Natixis’ overall CCyb
MAY 6, 2020 1Q20 RESULTS
(1)
Reminder on Natixis’ funding principles and structure
Natixis’ funding structure relies on a Joint Refinancing Pool shared by
Natixis and BPCE. Placed under the authority of the Group ALM Committee,
this platform was implemented in order to secure the Group’s financing and
optimize the management and allocation of liquidity within the Group in
accordance with predefined rules, with the aim of limiting the use of market
financing and reducing funding costs
Liquidity Coverage Ratio >100% at end-March 2020 both at Groupe BPCE and
Natixis level. Symmetrical balance sheet effect between RCF drawdowns and increase
in corporate deposits (~80% ratio)(3)
74 96 91
6266 75
6769 81
31/12/2018 31/12/2019 31/03/2020
Cash placed with central banksLCR securitiesAssets eligible for central bank fundingCoverage ratio of ST funding + MLT debt maturing in the short-term
Groupe BPCE - Total liquidity reserves
€204bn€231bn
160% 155%
188%
€247bn4.50% 4.50%
2.50% 2.50%
2.25% 1.26%
0.22%
0.03%
Old CET1requirements01/01/2020
New CET1requirements
post 1Q20announcements
9.47%8.29%
Natixis CET1 FL31/03/2020
~(100)bps P2R
~(20)bps CCyB
11.2%10.2%
Old 2020CET1 target
New 2020-21CET1 target
~(100)bps
11.4%
~170bps
mgmt buffer
~190bps
mgmt buffer
C3 - Restricted Natixis
Financial structureStrong CET1 FL(1) ratio at 11.4% with ~70bps to be recovered over time
14
(1) See note on methodology (2) Management data, gross
MAY 6, 2020 1Q20 RESULTS
CET1 FL(1) capital
€11.2bn12.0 11.9 11.9 11.6 11.4 11.3 11.3 €11.3bn
€977m
€(141)m €(123)m
€60m
€(389)m €(118)m €(111)m
€24m
CET1 FL31/12/2019
FY19dividend release
1Q20IFRIC 21 impact
1Q20exceptional items
1Q20earnings capacity
1Q20OCI evolution
1Q20PVA evolution
1Q20DTA
1Q20FX & Other
CET1 FL31/03/2020
€99.0bn 99.0 100.0 100.0 101.0 101.299.3 €99.3bn
€1.9bn
€(0.9)bn
€1.0bn €0.5bn
€(0.3)bn€(1.9)bn
RWA31/12/2019
1Q20Credit riskvolumes
1Q20Credit risk
other parameters
1Q20Market riskVaR & SVaR
1Q20CVA risk
1Q20Operational risk
& Other
1Q20Coface
reclassification
RWA31/03/2020
Basel 3 RWA
o/w ~€1.7bn related
to RCF drawdowns(2)
~€(510)m of volatile items linked to the 1Q20 market evolution that should reverse over time
RWA well under control+2% QoQ excl. CofaceStandardized approach for
100% of operational RWA and 45% of market RWA
~€1.4bnFurther RWA release
upon closing of the 29.5% Coface stake sale
~€1.5bn of RWA inflation linked to the 1Q20 market evolution that should reverse over time

Business lines1Q20 results
C3 - Restricted Natixis
891
789
43(8) (3) (6)
(100)
11
40
AuM at31/12/2019
Net flowsLT products
Net flowsLife ins.
Net flowsMoney mkts
Marketeffect
FX impact &perimeter
effect
AuM at31/03/2020
Assets under Management(2)
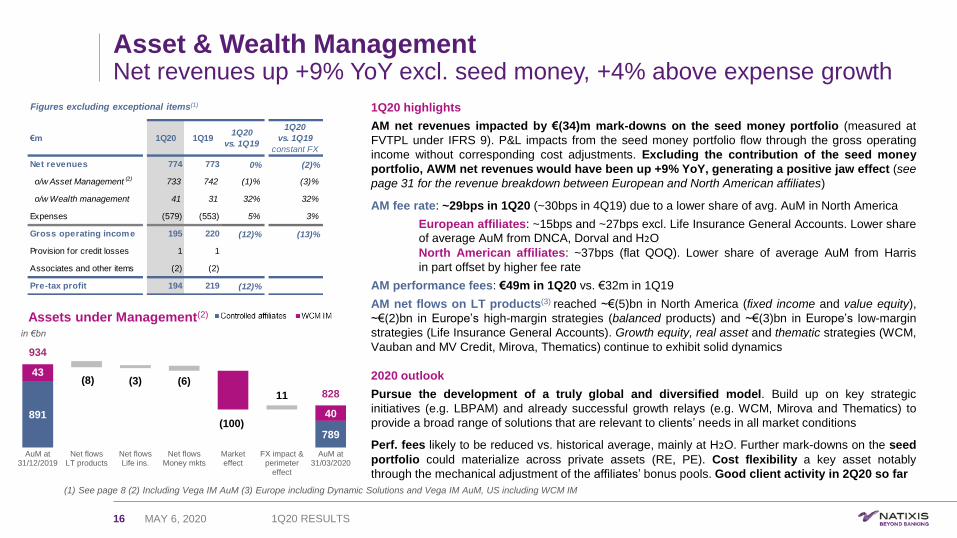
Asset & Wealth ManagementNet revenues up +9% YoY excl. seed money, +4% above expense growth
16
(1) See page 8 (2) Including Vega IM AuM (3) Europe including Dynamic Solutions and Vega IM AuM, US including WCM IM
Figures excluding exceptional items(1)
828
934
MAY 6, 2020 1Q20 RESULTS
in €bn
1Q20 highlights
AM net revenues impacted by €(34)m mark-downs on the seed money portfolio (measured at
FVTPL under IFRS 9). P&L impacts from the seed money portfolio flow through the gross operating
income without corresponding cost adjustments. Excluding the contribution of the seed money
portfolio, AWM net revenues would have been up +9% YoY, generating a positive jaw effect (see
page 31 for the revenue breakdown between European and North American affiliates)
AM fee rate: ~29bps in 1Q20 (~30bps in 4Q19) due to a lower share of avg. AuM in North America
European affiliates: ~15bps and ~27bps excl. Life Insurance General Accounts. Lower share
of average AuM from DNCA, Dorval and H2O
North American affiliates: ~37bps (flat QOQ). Lower share of average AuM from Harris
in part offset by higher fee rate
AM performance fees: €49m in 1Q20 vs. €32m in 1Q19
AM net flows on LT products(3) reached ~€(5)bn in North America (fixed income and value equity),
~€(2)bn in Europe’s high-margin strategies (balanced products) and ~€(3)bn in Europe’s low-margin
strategies (Life Insurance General Accounts). Growth equity, real asset and thematic strategies (WCM,
Vauban and MV Credit, Mirova, Thematics) continue to exhibit solid dynamics
2020 outlook
Pursue the development of a truly global and diversified model. Build up on key strategic
initiatives (e.g. LBPAM) and already successful growth relays (e.g. WCM, Mirova and Thematics) to
provide a broad range of solutions that are relevant to clients’ needs in all market conditions
Perf. fees likely to be reduced vs. historical average, mainly at H2O. Further mark-downs on the seed
portfolio could materialize across private assets (RE, PE). Cost flexibility a key asset notably
through the mechanical adjustment of the affiliates’ bonus pools. Good client activity in 2Q20 so far
€m 1Q20 1Q191Q20
vs. 1Q19
1Q20
vs. 1Q19
constant FX
Net revenues 774 773 0% (2)%
o/w Asset Management (2) 733 742 (1)% (3)%
o/w Wealth management 41 31 32% 32%
Expenses (579) (553) 5% 3%
Gross operating income 195 220 (12)% (13)%
Provision for credit losses 1 1
Associates and other items (2) (2)
Pre-tax profit 194 219 (12)%

C3 - Restricted Natixis
Net revenues
Corporate & Investment BankingStrong revenue diversification together with a tight control on expenses
17
Figures excluding exceptional items(1)
(1) See page 8
-9 -3 -8 -6 -55
251 304 258 306 367
125117
9481
-32
337333
369369
302
8790
73145
104
CVA/DVA desk FICT Equity Global finance Investment banking/M&A
X CIB (excl. CVA/DVA desk and other)
MAY 6, 2020 1Q20 RESULTS
in €m901
800844
794
3Q19 4Q192Q191Q19 1Q20
1Q20 highlights
Global markets: FICT revenues up a strong +46% YoY due to Rates & FX and with overall YoY
revenue growth for the 4th quarter in a row. Equity revenues at €(32)m despite resilient client activity
due to increased hedging cost and a €(130)m impact from dividend mark-downs following corporates’
2019 dividend cancellation and related sharp moves of dividend future curves. Such an impact could
partly reverse
Global finance: Net revenues down YoY due to lower syndication fees (essentially in March and in the
US) and with new production levels impacted by the March economic backdrop (-8% YoY in 1Q20 for
structured financings)
Investment banking/M&A: Net revenues up a solid +19% YoY mainly driven by robust activity
across M&A boutiques, mainly Natixis Partners, PJ Solomon and Fenchurch
CIB net revenues excl. CVA/DVA and dividend mark-down impact would have been up +7% YoY
(o/w +24% for Global markets) and with expenses down -4% YoY featuring some flexibility without
compromising priority investments
2020 outlook
Global markets: 2020 net revenues likely to be impacted by the current environnement although
Natixis’ positioning should demonstrate its relevance for clients, supporting market share across
main areas of expertise
Global finance: 2020 net revenues likely to experience lower syndication fees, although partly offset
by higher net interest income over time
IB/M&A: 2020 activity levels will largely depend on the shape of the recovery although opportunities for
client advisory may also arise in the current environnement. Natixis’ Green & Sustainable Hub as
well as the flexibility offered by the M&A multiboutique model are key assets to leverage on
Ongoing efforts from a cost saving standpoint including portfolio reviews
741
€m 1Q20 1Q191Q20
vs. 1Q19
1Q20
vs. 1Q19
constant FX
Net revenues 688 807 (15)% (16)%
Net revenues excl. CVA/DVA/Other 741 800 (7)% (9)%
Expenses (557) (579) (4)% (5)%
Gross operating income 130 228 (43)% (44)%
Provision for credit losses (194) (30)
Associates and other items 2 2
Pre-tax profit (61) 201 (131)%

C3 - Restricted Natixis
Life insurance AuM(3)
InsuranceSolid fundamentals with limited P&L impacts from the COVID-19 context
18
(1) See page 8 (2) See note on methodology and excluding IFRIC 21 (3) Excluding reinsurance agreement with CNP
Figures excluding exceptional items(1) 1Q20 highlights
Exceptional items identified on page 8: €(7)m impact from the contribution to the insurance
solidarity fund to support the economy, mainly micro-enterprises and self-employed (Net revenues);
€(14)m impact from the Lebanon default on the value of 34%-owned ADIR Insurance (Associates)
Limited net revenue impact from market volatility thanks to efficient hedging strategy against the
drop in equity markets
Cost/income ratio(2) at 52.2% and RoE(2) at 33.0%
Commercial indicators (more details on page 35): €2.6bn gross inflows(3) (o/w 37% UL products)
and €1.3bn net inflows(3) (o/w 58% UL) for Life insurance
2020 outlook
Fundamentals remain solid despite a slowdown in commercial activity as of mid-March as a result of
lockdown measures being taken in France. Expected 2Q20 contribution to the insurance solidarity fund
to be similar to the one recorded in 1Q20 (exceptional item)
Life and Personal protection (~65% of Insurance net revenues):
Gross operating income largely secured given the limited sensitivity to a potential further drop in
equity markets (~€(15)m for a ~10% drop in the relevant equity indices vs. end-March levels). Gross
inflow dynamics and the trade-off between €/UL contracts should not have any significant P&L
impact for the rest of the year although the trend is to be monitored over the medium-term
P&C (~35% of Insurance net revenues):
Gross operating income sensitivity to a ~20% drop in sales 2020 vs. 2019 ~€(5)m-€(10)m. Such a
scenario would be consistent with a U-shaped recovery and normalization towards early 4Q20
68.4 67.8 67.8
0.6 0.8
(2.0)
AuM at31/12/2019
Net inflows €
Net inflowsUL
Reevaluation &others
AuM at31/03/2020
in €bn
-1%
MAY 6, 2020 1Q20 RESULTS
€m 1Q20 1Q191Q20
vs. 1Q19
Net revenues 228 218 5%
Expenses (134) (125) 7%
Gross operating income 94 93 1%
Provision for credit losses 0 0
Associates and other items 3 0
Pre-tax profit 97 93 5%

C3 - Restricted Natixis
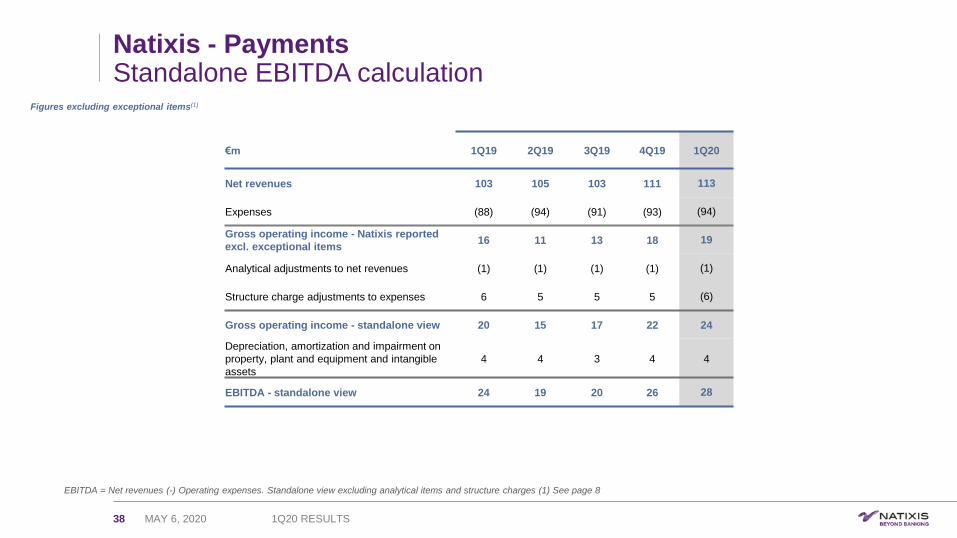
EBITDA(3)
Payments2020 net revenues expected to grow despite the COVID-19 context
19
(1) See page 8 (2) See note on methodology and excluding IFRIC 21 (3) Standalone view. See page 38
Figures excluding exceptional items(1)
24
19 20
2628
1Q19 2Q19 3Q19 4Q19 1Q20
+17% YoY in 1Q20
1Q20 highlights
Strong acceleration across all business lines with net revenues up +13% YoY over the first two
months
Slowdown in activity following the announcement of lockdown measures in France, resulting in
the second half of March featuring only minor net revenue growth vs. March 2019 due to:
Payment Processing & Services: Number of card transactions processed significantly
reduced since the 1st day of lockdown (by ~50%). Revenue impact limited by the business
model thanks to some flat fee component in the billing
Merchant Solutions: Slowdown in business volumes generated by the fintechs particularly
marked across a few sectors (e.g travel, entertainment). Payplug continued to experience
solid growth rates through a more favourable positioning and ramp-up across the banking
networks
Prepaid & Issuing Solutions: Impact from technical unemployment and the closure of
some acceptation venues such as restaurants for meal vouchers
Cost/income ratio(2) improving to 82.9% (84.1% in 1Q19) with positive jaws and RoE(2) at 14.9%
(12.5% in 1Q19)
2020 outlook
2020 net revenues are expected to continue to exhibit positive momentum vs. 2019
2Q20 net revenues to be impacted by the lockdown in France with progressive easing as of mid-
May/June and expected normalization in activity levels as of 3Q20. April already featuring some
nice rebound vs. the second half of March
MAY 6, 2020 1Q20 RESULTS
in €m
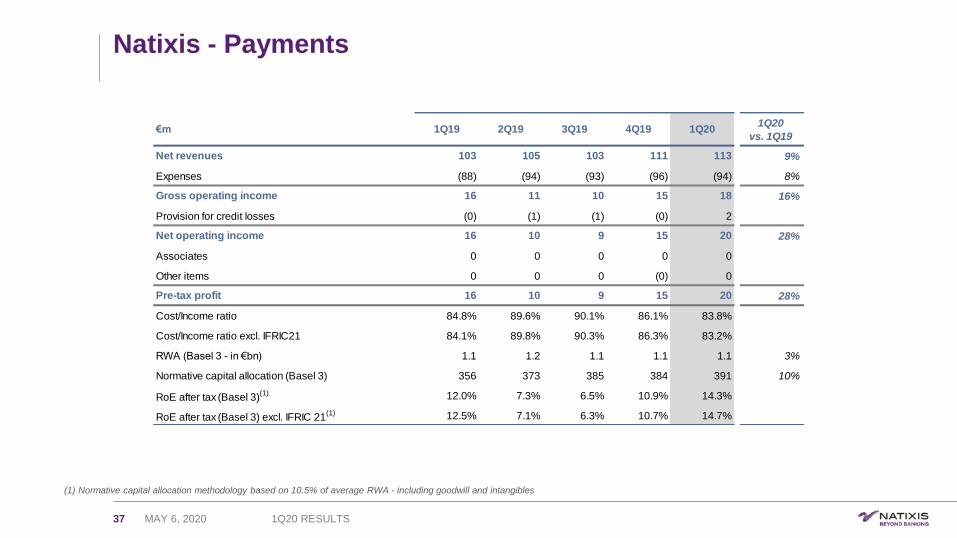
€m 1Q20 1Q191Q20
vs. 1Q19
Net revenues 113 103 9%
Expenses (94) (88) 7%
Gross operating income 19 16 18%
Provision for credit losses 2 (0)
Associates and other items 0 0
Pre-tax profit 20 16 30%
C3 - Restricted Natixis
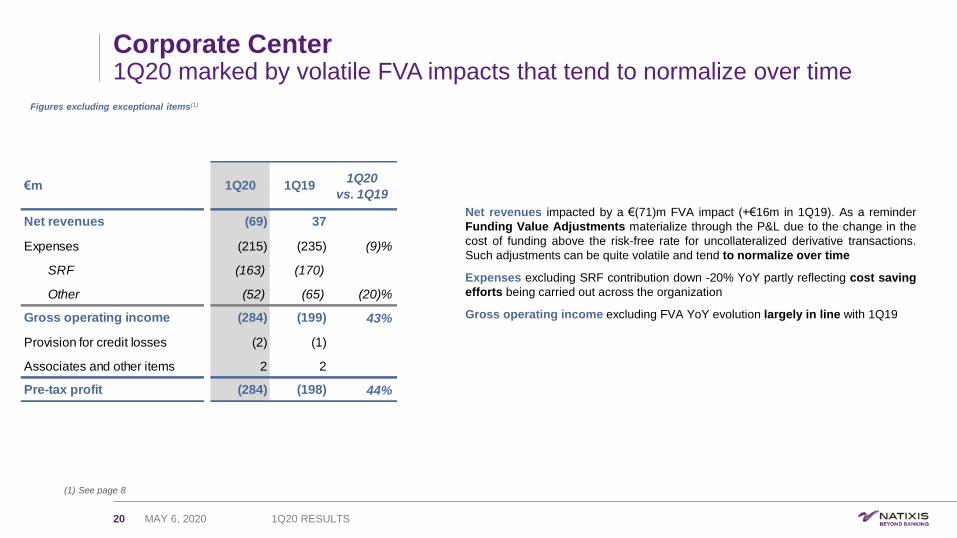
Corporate Center1Q20 marked by volatile FVA impacts that tend to normalize over time
20
(1) See page 8
Net revenues impacted by a €(71)m FVA impact (+€16m in 1Q19). As a reminder
Funding Value Adjustments materialize through the P&L due to the change in the
cost of funding above the risk-free rate for uncollateralized derivative transactions.
Such adjustments can be quite volatile and tend to normalize over time
Expenses excluding SRF contribution down -20% YoY partly reflecting cost saving
efforts being carried out across the organization
Gross operating income excluding FVA YoY evolution largely in line with 1Q19
MAY 6, 2020 1Q20 RESULTS
Figures excluding exceptional items(1)
€m 1Q20 1Q191Q20
vs. 1Q19
Net revenues (69) 37
Expenses (215) (235) (9)%
SRF (163) (170)
Other (52) (65) (20)%
Gross operating income (284) (199) 43%
Provision for credit losses (2) (1)
Associates and other items 2 2
Pre-tax profit (284) (198) 44%

Conclusion1Q20 results
C3 - Restricted Natixis
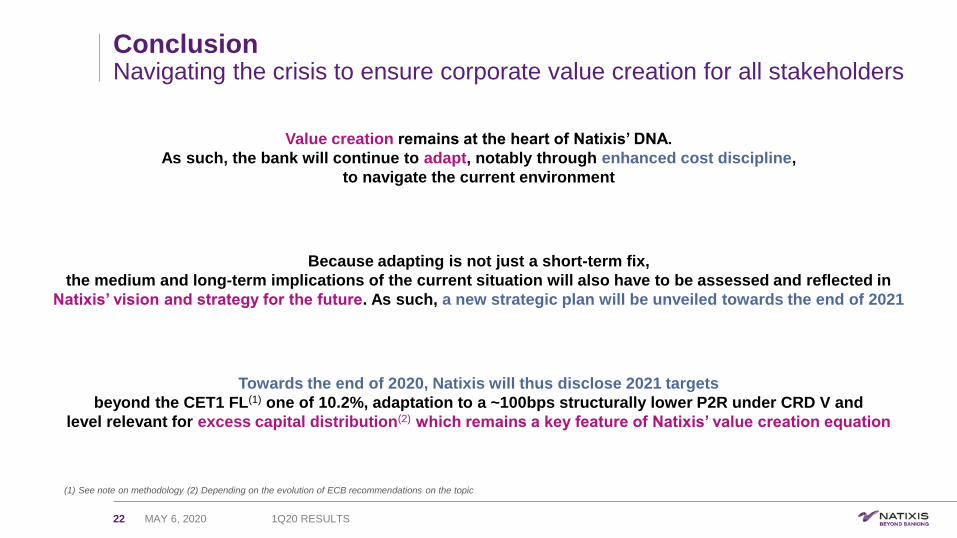
ConclusionNavigating the crisis to ensure corporate value creation for all stakeholders
22 MAY 6, 2020 1Q20 RESULTS
(1) See note on methodology (2) Depending on the evolution of ECB recommendations on the topic
NETREVENUES
+0%
NETREVENUES
+0%
Value creation remains at the heart of Natixis’ DNA.
As such, the bank will continue to adapt, notably through enhanced cost discipline,
to navigate the current environment
Because adapting is not just a short-term fix,
the medium and long-term implications of the current situation will also have to be assessed and reflected in
Natixis’ vision and strategy for the future. As such, a new strategic plan will be unveiled towards the end of 2021
Towards the end of 2020, Natixis will thus disclose 2021 targets
beyond the CET1 FL(1) one of 10.2%, adaptation to a ~100bps structurally lower P2R under CRD V and
level relevant for excess capital distribution(2) which remains a key feature of Natixis’ value creation equation

Appendix IFinancial Statements &Business indicators1Q20 results
C3 - Restricted Natixis
24
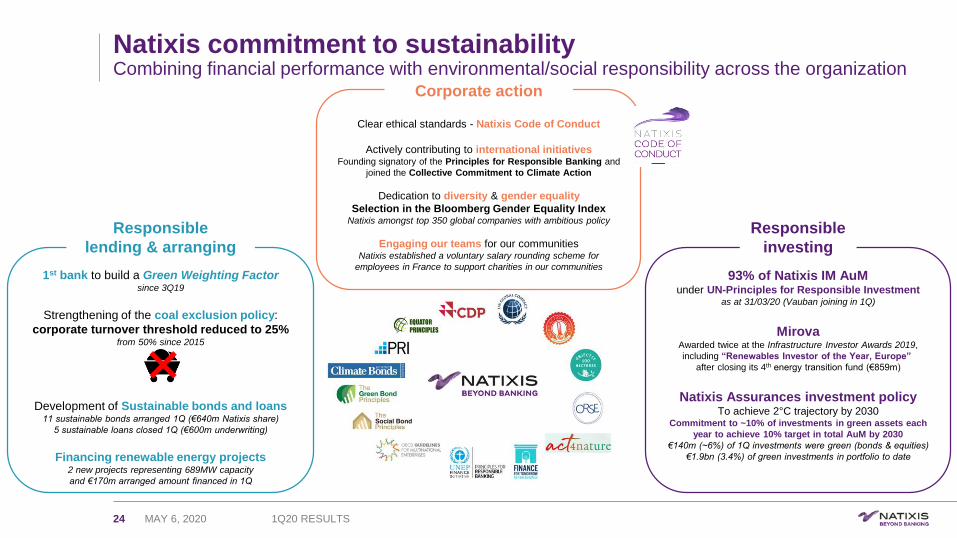
1st bank to build a Green Weighting Factorsince 3Q19
Strengthening of the coal exclusion policy:
corporate turnover threshold reduced to 25% from 50% since 2015
Development of Sustainable bonds and loans11 sustainable bonds arranged 1Q (€640m Natixis share)
5 sustainable loans closed 1Q (€600m underwriting)
Financing renewable energy projects2 new projects representing 689MW capacity
and €170m arranged amount financed in 1Q
93% of Natixis IM AuMunder UN-Principles for Responsible Investment
as at 31/03/20 (Vauban joining in 1Q)
MirovaAwarded twice at the Infrastructure Investor Awards 2019,
including “Renewables Investor of the Year, Europe”
after closing its 4th energy transition fund (€859m)
Natixis Assurances investment policyTo achieve 2°C trajectory by 2030
Commitment to ~10% of investments in green assets each
year to achieve 10% target in total AuM by 2030
€140m (~6%) of 1Q investments were green (bonds & equities)
€1.9bn (3.4%) of green investments in portfolio to date
Clear ethical standards - Natixis Code of Conduct
Actively contributing to international initiativesFounding signatory of the Principles for Responsible Banking and
joined the Collective Commitment to Climate Action
Dedication to diversity & gender equality
Selection in the Bloomberg Gender Equality IndexNatixis amongst top 350 global companies with ambitious policy
Engaging our teams for our communitiesNatixis established a voluntary salary rounding scheme for
employees in France to support charities in our communities
Responsible
lending & arranging
Responsible
investing
Corporate action
Natixis commitment to sustainabilityCombining financial performance with environmental/social responsibility across the organization
MAY 6, 2020 1Q20 RESULTS

C3 - Restricted Natixis
Natixis - Consolidated P&L (restated)
25 MAY 6, 2020 1Q20 RESULTS
Figures restated as communicated on April 20, 2020 following the announced sale of a 29.5% stake in Coface. See page 26 for the reconciliation of the restated figures with the accounting view
€m 1Q19 2Q19 3Q19 4Q19 1Q201Q20
vs. 1Q19
Net revenues 1,957 2,100 2,102 2,326 1,750 (11)%
Expenses (1,597) (1,448) (1,465) (1,606) (1,582) (1)%
Gross operating income 360 653 637 719 167 (53)%
Provision for credit losses (31) (109) (70) (119) (193)
Associates 3 8 3 6 (8)
Gain or loss on other assets 682 (7) 9 1 (0)
Change in value of goodwill 0 0 0 0 0
Pre-tax profit 1,015 545 579 607 (34) (103)%
Tax (201) (149) (114) (153) (13)
Minority interests (65) (68) (66) (96) (39)
Net income - group share excl. Coface net contribution 749 328 399 358 (87) (112)%
Coface net contribution 15 18 16 12 (118)
Net income - group share incl. Coface net contribution 764 346 415 371 (204) (127)%
C3 - Restricted Natixis
1Q20
€m 1Q19
underlying
Exceptional
items
1Q19
restated
Coface
restatement
Residual contribution from
perimeter sold
(ex SFS)
1Q19
reported
1Q20
underlying
Exceptional
items
1Q20
restated
Coface
restatement
1Q20
reported
Net revenues 1,938 19 1,957 175 22 2,154 1,733 17 1,750 0 1,750
Expenses (1,580) (17) (1,597) (123) (22) (1,742) (1,579) (3) (1,582) 0 (1,582)
Gross operating income 358 2 360 52 (0) 412 153 14 167 0 167
Provision for credit losses (31) 0 (31) (1) 0 (31) (193) 0 (193) 0 (193)
Associates 3 0 3 0 0 3 6 (14) (8) (6) (14)
Gain or loss on other assets (0) 682 682 0 0 682 (0) 0 (0) (112) (112)
Pre-tax profit 330 684 1,015 51 (0) 1,066 (34) (0) (34) (118) (152)
Tax (122) (79) (201) (15) 0 (215) (9) (4) (13) 0 (13)
Minority interests (32) (34) (65) (21) 0 (86) (39) 0 (39) 0 (39)
Net income - group share excl. Coface net contribution 177 572 749 (82) (4) (87)
Coface net contribution 16 (0) 15 1 (119) (118)
Net income - group share incl. Coface net contribution 192 572 764 764 (81) (123) (204) (204)
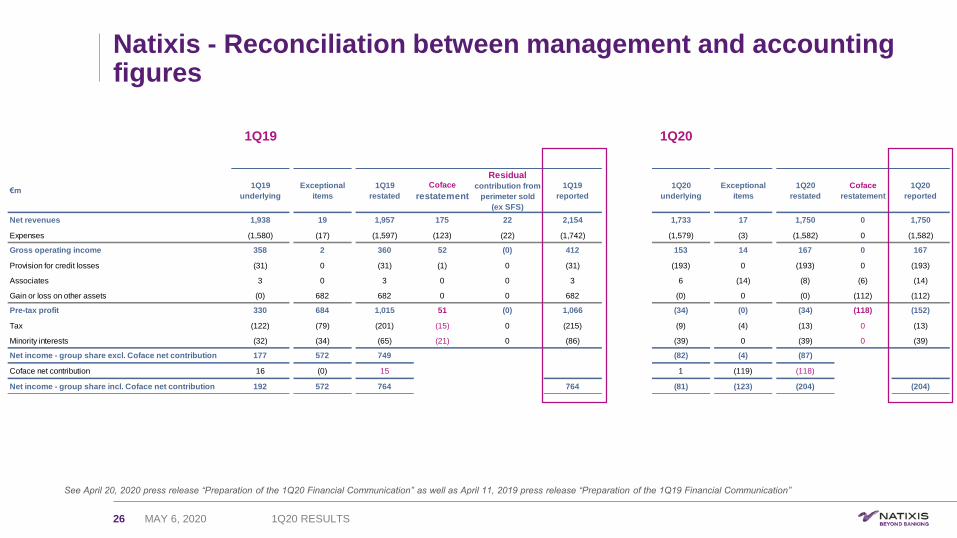
Natixis - Reconciliation between management and accounting figures
26
1Q19
See April 20, 2020 press release “Preparation of the 1Q20 Financial Communication” as well as April 11, 2019 press release “Preparation of the 1Q19 Financial Communication”
MAY 6, 2020 1Q20 RESULTS

C3 - Restricted Natixis
Natixis - IFRS 9 Balance sheet
27
(1) Including deposit and margin call
MAY 6, 2020 1Q20 RESULTS
Assets (€bn) 31/03/2020 31/12/2019 Liabilities and equity (€bn) 31/03/2020 31/12/2019
Cash and balances with central banks 15.3 21.0 Due to central banks 0.0 0.0
Financial assets at fair value through profit and loss(1) 223.4 228.8 Financial liabilities at fair value through profit and loss
(1) 216.9 218.3
Financial assets at fair value through Equity 12.3 12.1 Customer deposits and deposits from financial institutions(1) 104.9 102.4
Loans and receivables(1) 126.1 119.2 Debt securities 45.3 47.4
Debt instruments at amortized cost 1.5 1.6 Liabilities associated with non-current assets held for sale 0.0 0.0
Insurance assets 103.2 108.1 Accruals and other liabilities 17.3 18.1
Non-current assets held for sale 0.5 0.0 Insurance liabilities 95.3 100.5
Accruals and other assets 15.8 15.7 Contingency reserves 1.4 1.6
Investments in associates 0.9 0.7 Subordinated debt 3.6 4.0
Tangible and intangible assets 2.0 2.1 Equity attributable to equity holders of the parent 19.7 19.4
Goodwill 3.6 3.9 Minority interests 0.3 1.4
Total 504.7 513.2 Total 504.7 513.2

C3 - Restricted Natixis
Natixis - P&L by Business line
28 MAY 6, 2020 1Q20 RESULTS
€m AWM CIB Insurance PaymentsCorporate
Center
1Q20
reported
Net revenues 774 688 221 113 (46) 1,750
Expenses (579) (557) (134) (94) (217) (1,582)
Gross operating income 195 130 87 18 (263) 167
Provision for credit losses 1 (194) 0 2 (2) (193)
Net operating income 195 (64) 87 20 (265) (26)
Associates and other items (2) 2 (11) 0 2 (8)
Pre-tax profit 194 (61) 76 20 (263) (34)
Tax (13)
Minority interests (39)
(87)
(118)
(204)
Coface net contribution
Net income (gs) excl. Coface net contribution
Net income (gs) incl. Coface net contribution
C3 - Restricted Natixis
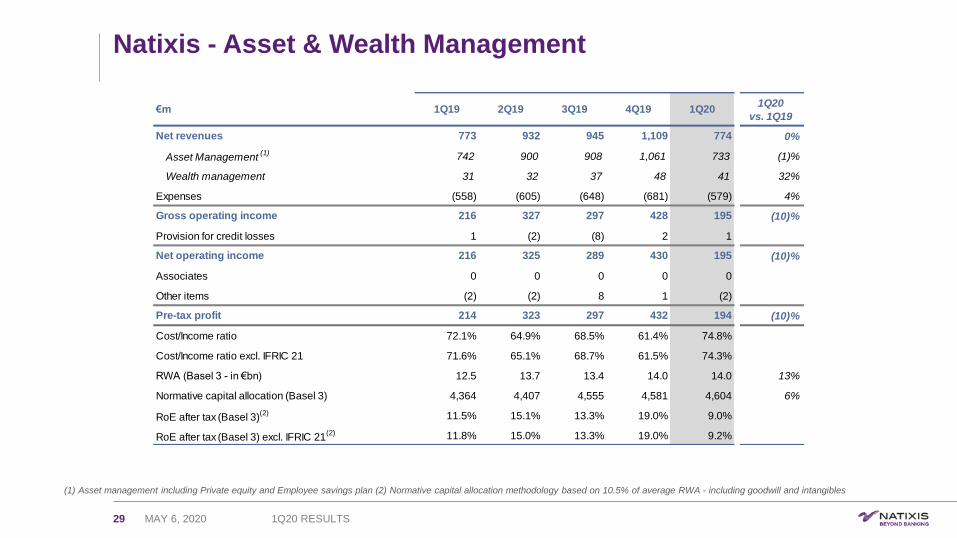
Natixis - Asset & Wealth Management
29
(1) Asset management including Private equity and Employee savings plan (2) Normative capital allocation methodology based on 10.5% of average RWA - including goodwill and intangibles
MAY 6, 2020 1Q20 RESULTS
€m 1Q19 2Q19 3Q19 4Q19 1Q201Q20
vs. 1Q19
Net revenues 773 932 945 1,109 774 0%
Asset Management(1) 742 900 908 1,061 733 (1)%
Wealth management 31 32 37 48 41 32%
Expenses (558) (605) (648) (681) (579) 4%
Gross operating income 216 327 297 428 195 (10)%
Provision for credit losses 1 (2) (8) 2 1
Net operating income 216 325 289 430 195 (10)%
Associates 0 0 0 0 0
Other items (2) (2) 8 1 (2)
Pre-tax profit 214 323 297 432 194 (10)%
Cost/Income ratio 72.1% 64.9% 68.5% 61.4% 74.8%
Cost/Income ratio excl. IFRIC 21 71.6% 65.1% 68.7% 61.5% 74.3%
RWA (Basel 3 - in €bn) 12.5 13.7 13.4 14.0 14.0 13%
Normative capital allocation (Basel 3) 4,364 4,407 4,555 4,581 4,604 6%
RoE after tax (Basel 3)
(2) 11.5% 15.1% 13.3% 19.0% 9.0%
RoE after tax (Basel 3) excl. IFRIC 21
(2) 11.8% 15.0% 13.3% 19.0% 9.2%
C3 - Restricted Natixis
50%
28%
11%
8%4%
Fixed Income
Equities
Alternative (incl. RE)
Multi-asset
Money Market
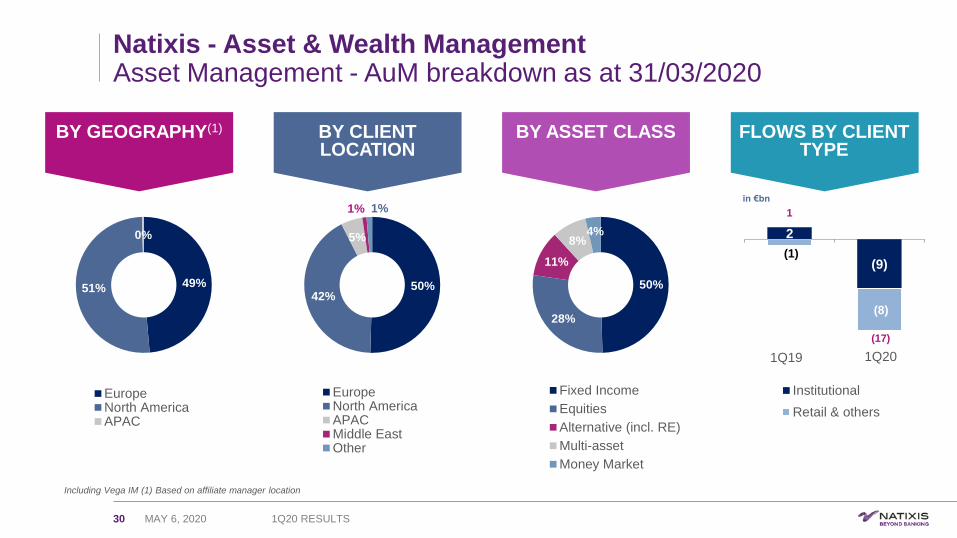
Natixis - Asset & Wealth ManagementAsset Management - AuM breakdown as at 31/03/2020
30
Including Vega IM (1) Based on affiliate manager location
BY GEOGRAPHY(1) BY CLIENT LOCATION
BY ASSET CLASS FLOWS BY CLIENT TYPE
2
(9)(1)
(8)
Institutional
Retail & others
1Q19
in €bn
1Q20
1
50%42%
5%
1% 1%
EuropeNorth AmericaAPACMiddle EastOther
49%51%
0%
EuropeNorth AmericaAPAC
(17)
MAY 6, 2020 1Q20 RESULTS
C3 - Restricted Natixis
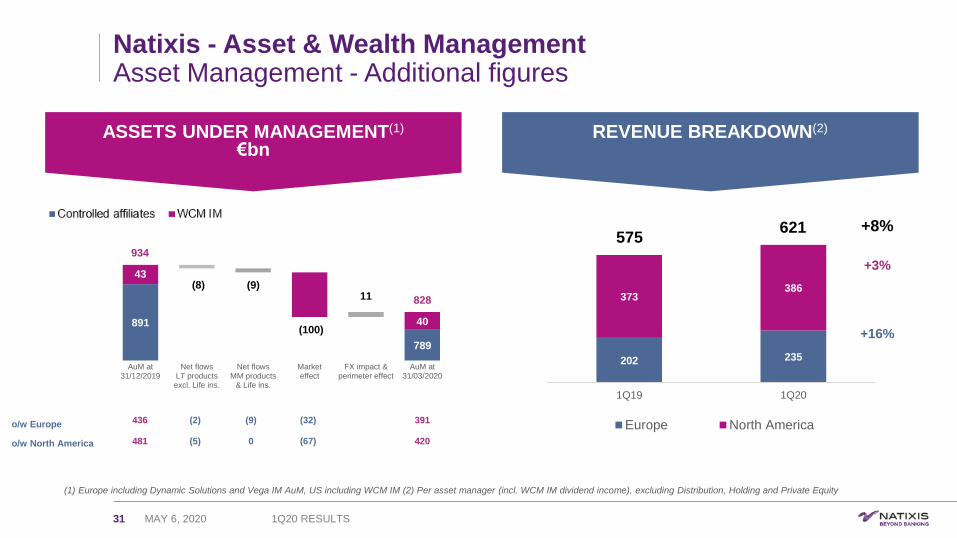
Natixis - Asset & Wealth ManagementAsset Management - Additional figures
31
(1) Europe including Dynamic Solutions and Vega IM AuM, US including WCM IM (2) Per asset manager (incl. WCM IM dividend income), excluding Distribution, Holding and Private Equity
ASSETS UNDER MANAGEMENT(1)
€bnREVENUE BREAKDOWN(2)
MAY 6, 2020 1Q20 RESULTS
891
917 818 789
43(8) (9)
(100)
11
40
AuM at31/12/2019
Net flowsLT productsexcl. Life ins.
Net flowsMM products
& Life ins.
Marketeffect
FX impact &perimeter effect
AuM at31/03/2020
828
934
o/w Europe
o/w North America
436
481
202 235
373386
1Q19 1Q20
Europe North America391
420
(32)
(67)
(9)
0
(2)
(5)
+3%
+16%
575621 +8%
C3 - Restricted Natixis
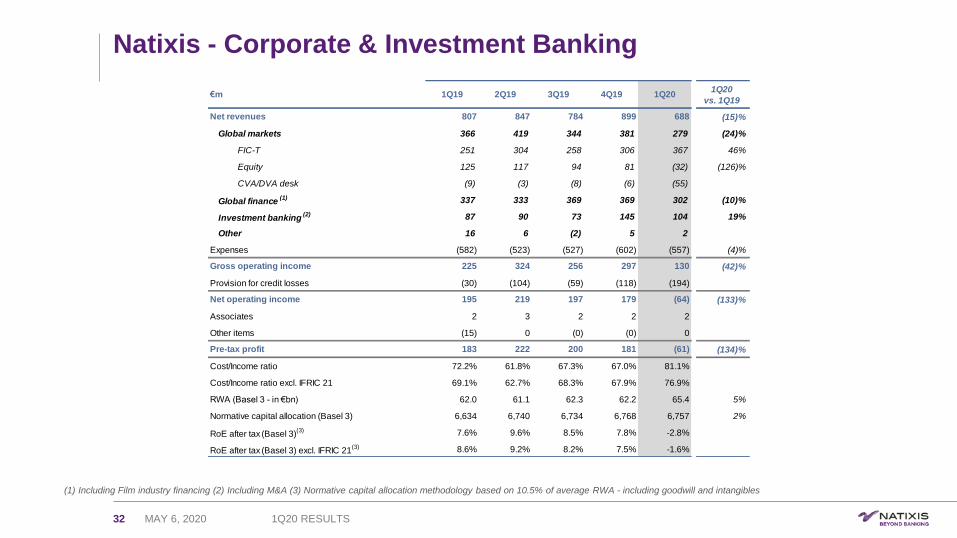
Natixis - Corporate & Investment Banking
32
(1) Including Film industry financing (2) Including M&A (3) Normative capital allocation methodology based on 10.5% of average RWA - including goodwill and intangibles
MAY 6, 2020 1Q20 RESULTS
€m 1Q19 2Q19 3Q19 4Q19 1Q201Q20
vs. 1Q19
Net revenues 807 847 784 899 688 (15)%
Global markets 366 419 344 381 279 (24)%
FIC-T 251 304 258 306 367 46%
Equity 125 117 94 81 (32) (126)%
CVA/DVA desk (9) (3) (8) (6) (55)
Global finance(1) 337 333 369 369 302 (10)%
Investment banking(2) 87 90 73 145 104 19%
Other 16 6 (2) 5 2
Expenses (582) (523) (527) (602) (557) (4)%
Gross operating income 225 324 256 297 130 (42)%
Provision for credit losses (30) (104) (59) (118) (194)
Net operating income 195 219 197 179 (64) (133)%
Associates 2 3 2 2 2
Other items (15) 0 (0) (0) 0
Pre-tax profit 183 222 200 181 (61) (134)%
Cost/Income ratio 72.2% 61.8% 67.3% 67.0% 81.1%
Cost/Income ratio excl. IFRIC 21 69.1% 62.7% 68.3% 67.9% 76.9%
RWA (Basel 3 - in €bn) 62.0 61.1 62.3 62.2 65.4 5%
Normative capital allocation (Basel 3) 6,634 6,740 6,734 6,768 6,757 2%
RoE after tax (Basel 3)
(3) 7.6% 9.6% 8.5% 7.8% -2.8%
RoE after tax (Basel 3) excl. IFRIC 21
(3) 8.6% 9.2% 8.2% 7.5% -1.6%
C3 - Restricted Natixis
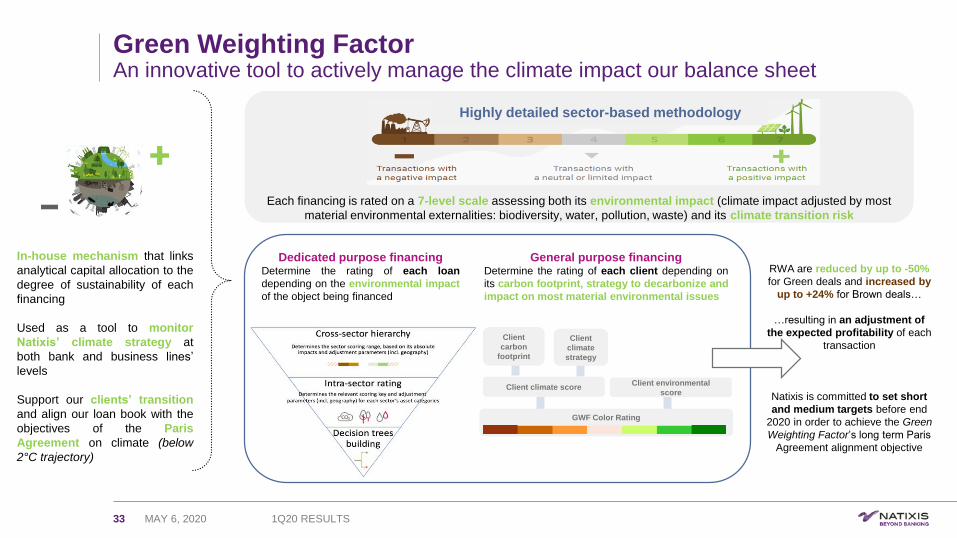
Each financing is rated on a 7-level scale assessing both its environmental impact (climate impact adjusted by most
material environmental externalities: biodiversity, water, pollution, waste) and its climate transition risk
Green Weighting FactorAn innovative tool to actively manage the climate impact our balance sheet
33
In-house mechanism that links
analytical capital allocation to the
degree of sustainability of each
financing
Used as a tool to monitor
Natixis’ climate strategy at
both bank and business lines’
levels
Support our clients’ transition
and align our loan book with the
objectives of the Paris
Agreement on climate (below
2°C trajectory)
Highly detailed sector-based methodology
Client climate scoreClient environmental
score
GWF Color Rating
Client
carbon
footprint
Client
climate
strategy
Dedicated purpose financingDetermine the rating of each loan
depending on the environmental impact
of the object being financed
RWA are reduced by up to -50%
for Green deals and increased by
up to +24% for Brown deals…
…resulting in an adjustment of
the expected profitability of each
transaction
Natixis is committed to set short
and medium targets before end
2020 in order to achieve the Green
Weighting Factor’s long term Paris
Agreement alignment objective
General purpose financingDetermine the rating of each client depending on
its carbon footprint, strategy to decarbonize and
impact on most material environmental issues
MAY 6, 2020 1Q20 RESULTS

C3 - Restricted Natixis
Natixis - Insurance
34
(1) Normative capital allocation methodology based on 10.5% of average RWA - including goodwill and intangibles
MAY 6, 2020 1Q20 RESULTS
€m 1Q19 2Q19 3Q19 4Q19 1Q201Q20
vs. 1Q19
Net revenues 218 207 205 216 221 1%
Expenses (125) (116) (112) (125) (134) 7%
Gross operating income 93 92 93 90 87 (6)%
Provision for credit losses 0 0 0 0 0
Net operating income 93 92 93 90 87 (6)%
Associates 0 5 1 4 (11)
Other items 0 (0) 0 0 0
Pre-tax profit 93 96 94 94 76 (18)%
Cost/Income ratio 57.5% 55.8% 54.6% 58.1% 60.6%
Cost/Income ratio excl. IFRIC 21 51.7% 57.8% 56.6% 60.1% 53.9%
RWA (Basel 3 - in €bn) 8.0 7.9 8.4 8.3 7.6 (5)%
Normative capital allocation (Basel 3) 858 942 926 978 965 12%
RoE after tax (Basel 3)
(1) 29.4% 28.4% 27.7% 26.4% 20.7%
RoE after tax (Basel 3) excl. IFRIC 21
(1) 33.3% 27.2% 26.4% 25.2% 25.0%
C3 - Restricted Natixis
35
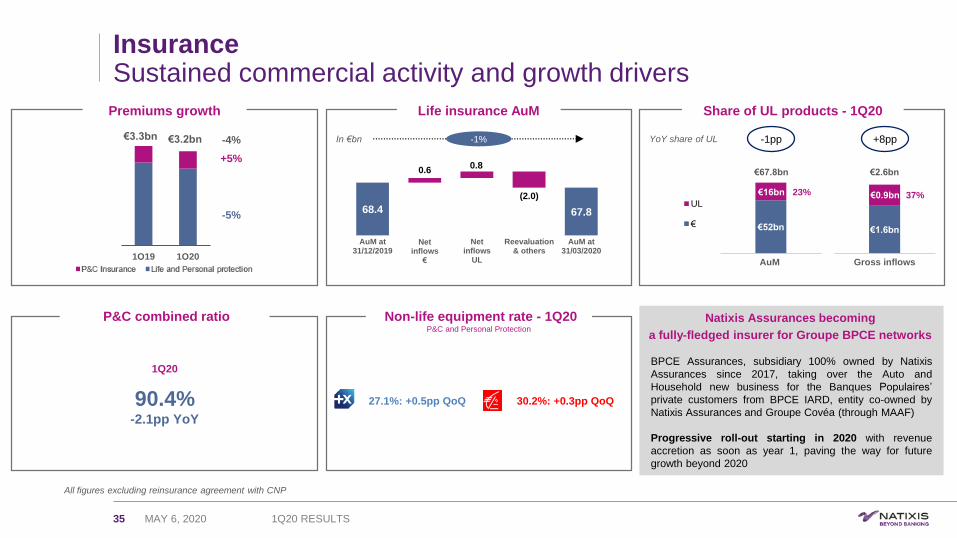
InsuranceSustained commercial activity and growth drivers
All figures excluding reinsurance agreement with CNP
€1.6bn
Gross inflows
YoY share of UL
€52bn
AuM
UL
€
€67.8bn
€16bn 23%
68.4 67.8 67.8
0.60.8
(2.0)
AuM at31/12/2019
Net inflows
€
Netinflows
UL
Reevaluation& others
AuM at31/03/2020
In €bn
€2.6bn
37%€0.9bn
Life insurance AuMPremiums growth
-1pp
Share of UL products - 1Q20
-1% +8pp
1Q19 1Q20
+5%
-5%
€3.3bn €3.2bn -4%
27.1%: +0.5pp QoQ 30.2%: +0.3pp QoQ
Non-life equipment rate - 1Q20P&C and Personal Protection
P&C combined ratio Natixis Assurances becoming
a fully-fledged insurer for Groupe BPCE networks
BPCE Assurances, subsidiary 100% owned by Natixis
Assurances since 2017, taking over the Auto and
Household new business for the Banques Populaires’
private customers from BPCE IARD, entity co-owned by
Natixis Assurances and Groupe Covéa (through MAAF)
Progressive roll-out starting in 2020 with revenue
accretion as soon as year 1, paving the way for future
growth beyond 2020
1Q20
90.4%-2.1pp YoY
MAY 6, 2020 1Q20 RESULTS
C3 - Restricted Natixis
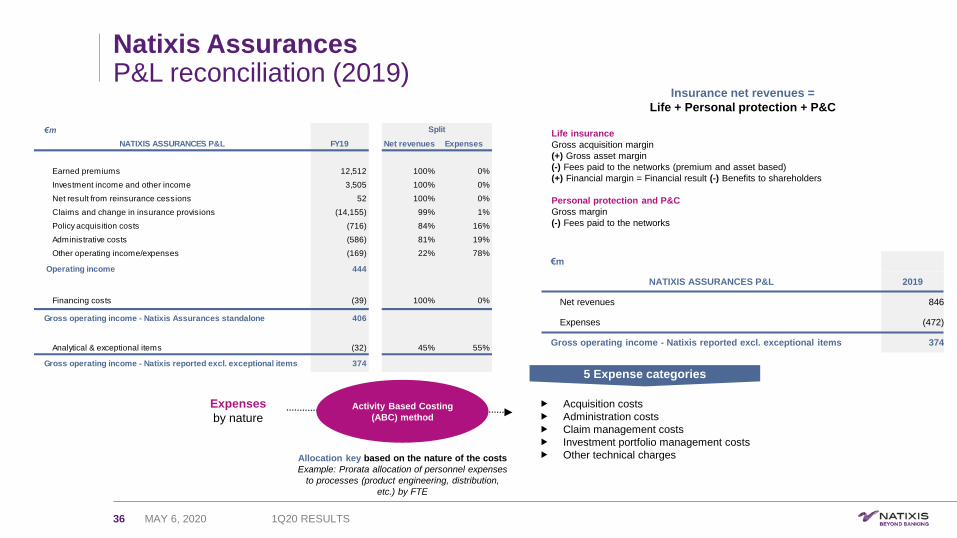
Natixis AssurancesP&L reconciliation (2019)
36
Life insurance
Gross acquisition margin
(+) Gross asset margin
(-) Fees paid to the networks (premium and asset based)
(+) Financial margin = Financial result (-) Benefits to shareholders
Personal protection and P&C
Gross margin
(-) Fees paid to the networks
Insurance net revenues =
Life + Personal protection + P&C
Acquisition costs
Administration costs
Claim management costs
Investment portfolio management costs
Other technical charges
Expenses
by nature
5 Expense categories
Activity Based Costing
(ABC) method
Allocation key based on the nature of the costs
Example: Prorata allocation of personnel expenses
to processes (product engineering, distribution,
etc.) by FTE
€m
NATIXIS ASSURANCES P&L 2019
Net revenues 846
Expenses (472)
Gross operating income - Natixis reported excl. exceptional items 374
€m
NATIXIS ASSURANCES P&L FY19 Net revenues Expenses
Earned premiums 12,512 100% 0%
Investment income and other income 3,505 100% 0%
Net result from reinsurance cessions 52 100% 0%
Claims and change in insurance provisions (14,155) 99% 1%
Policy acquisition costs (716) 84% 16%
Administrative costs (586) 81% 19%
Other operating income/expenses (169) 22% 78%
Operating income 444
Financing costs (39) 100% 0%
Gross operating income - Natixis Assurances standalone 406
Analytical & exceptional items (32) 45% 55%
Gross operating income - Natixis reported excl. exceptional items 374
Split
MAY 6, 2020 1Q20 RESULTS
C3 - Restricted Natixis
Natixis - Payments
37
(1) Normative capital allocation methodology based on 10.5% of average RWA - including goodwill and intangibles
MAY 6, 2020 1Q20 RESULTS
€m 1Q19 2Q19 3Q19 4Q19 1Q201Q20
vs. 1Q19
Net revenues 103 105 103 111 113 9%
Expenses (88) (94) (93) (96) (94) 8%
Gross operating income 16 11 10 15 18 16%
Provision for credit losses (0) (1) (1) (0) 2
Net operating income 16 10 9 15 20 28%
Associates 0 0 0 0 0
Other items 0 0 0 (0) 0
Pre-tax profit 16 10 9 15 20 28%
Cost/Income ratio 84.8% 89.6% 90.1% 86.1% 83.8%
Cost/Income ratio excl. IFRIC21 84.1% 89.8% 90.3% 86.3% 83.2%
RWA (Basel 3 - in €bn) 1.1 1.2 1.1 1.1 1.1 3%
Normative capital allocation (Basel 3) 356 373 385 384 391 10%
RoE after tax (Basel 3)
(1) 12.0% 7.3% 6.5% 10.9% 14.3%
RoE after tax (Basel 3) excl. IFRIC 21
(1) 12.5% 7.1% 6.3% 10.7% 14.7%
C3 - Restricted Natixis
Natixis - PaymentsStandalone EBITDA calculation
38
EBITDA = Net revenues (-) Operating expenses. Standalone view excluding analytical items and structure charges (1) See page 8
€m 1Q19 2Q19 3Q19 4Q19 1Q20
Net revenues 103 105 103 111 113
Expenses (88) (94) (91) (93) (94)
Gross operating income - Natixis reported
excl. exceptional items16 11 13 18 19
Analytical adjustments to net revenues (1) (1) (1) (1) (1)
Structure charge adjustments to expenses 6 5 5 5 (6)
Gross operating income - standalone view 20 15 17 22 24
Depreciation, amortization and impairment on
property, plant and equipment and intangible
assets
4 4 3 4 4
EBITDA - standalone view 24 19 20 26 28
Figures excluding exceptional items(1)
MAY 6, 2020 1Q20 RESULTS

C3 - Restricted Natixis
Natixis - Corporate Center & Coface RWA
39
€697m capital gain coming from the disposal of the retail banking activities in 1Q19
MAY 6, 2020 1Q20 RESULTS
€m 1Q19 2Q19 3Q19 4Q19 1Q201Q20
vs. 1Q19
Net revenues 55 10 64 (10) (46)
Expenses (244) (110) (84) (102) (217) (11)%
SRF (170) 0 0 (0) (163)
Other (74) (110) (84) (102) (54) (26)%
Gross operating income (188) (100) (20) (112) (263) 40%
Provision for credit losses (1) (3) (2) (2) (2)
Net operating income (190) (103) (22) (114) (265) 39%
Associates (0) 0 (0) (0) 0
Other items 699 (5) 1 (0) 2
Pre-tax profit 509 (108) (21) (114) (263) (152)%
RWA (Basel 3 - in €bn) 8.8 9.2 9.8 9.4 9.1 3%
€bn 1Q19 2Q19 3Q19 4Q19 1Q20
Coface RWA (Basel 3) 3.9 3.8 3.8 4.0 1.9

Appendix IIAdditional information
1Q20 results
C3 - Restricted Natixis
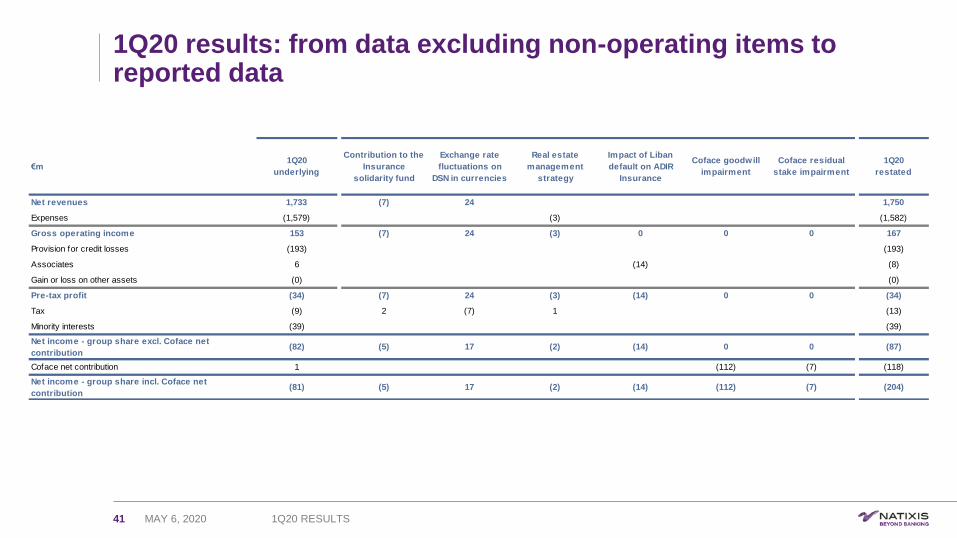
1Q20 results: from data excluding non-operating items to reported data
41 MAY 6, 2020 1Q20 RESULTS
€m 1Q20
underlying
Contribution to the
Insurance
solidarity fund
Exchange rate
fluctuations on
DSN in currencies
Real estate
management
strategy
Impact of Liban
default on ADIR
Insurance
Coface goodwill
impairment
Coface residual
stake impairment
1Q20
restated
Net revenues 1,733 (7) 24 1,750
Expenses (1,579) (3) (1,582)
Gross operating income 153 (7) 24 (3) 0 0 0 167
Provision for credit losses (193) (193)
Associates 6 (14) (8)
Gain or loss on other assets (0) (0)
Pre-tax profit (34) (7) 24 (3) (14) 0 0 (34)
Tax (9) 2 (7) 1 (13)
Minority interests (39) (39)
Net income - group share excl. Coface net
contribution(82) (5) 17 (2) (14) 0 0 (87)
Coface net contribution 1 (112) (7) (118)
Net income - group share incl. Coface net
contribution(81) (5) 17 (2) (14) (112) (7) (204)

C3 - Restricted Natixis
Natixis - 1Q20 capital & Basel 3 financial structure(1)
42
Irrevocable Payment Commitment (IPC) deduction disclosed as part of the ratio since 2Q19 (1) See note on methodology (2) Including capital gain following reclassification of hybrids as equity instruments
Fully-loaded Phased-in incl. current financial year’s earnings and dividends
MAY 6, 2020 1Q20 RESULTS
€bn 31/03/2020
Shareholder’s Equity 19.7
Hybrid securities(2) (2.2)
Goodwill & intangibles (3.8)
Deferred tax assets (0.8)
Dividend provision 0.0
Other deductions (1.6)
CET1 capital 11.3
CET1 ratio 11.4%
Additional Tier 1 capital 1.8
Tier 1 capital 13.1
Tier 1 ratio 13.2%
Tier 2 capital 2.2
Total capital 15.3
Total capital ratio 15.5%
Risk-weighted assets 99.3
€bn 31/03/2020
CET1 capital 11.3
CET1 ratio 11.4%
Additional Tier 1 capital 2.2
Tier 1 capital 13.5
Tier 1 ratio 13.6%
Tier 2 capital 2.3
Total capital 15.8
Total capital ratio 15.9%
Risk-weighted assets 99.3

C3 - Restricted Natixis
Natixis - IFRIC 21 effects by business line
43
Effect in Expenses
Historical figures restated for the disposal of the retail banking activities
MAY 6, 2020 1Q20 RESULTS
€m 1Q19 2Q19 3Q19 4Q19 1Q20
AWM (4) 1 1 1 (4)
CIB (24) 8 8 8 (28)
Insurance (13) 4 4 4 (15)
Payments (1) 0 0 0 (1)
Corporate center (119) 40 40 40 (113)
Total Natixis (161) 54 54 54 (161)
C3 - Restricted Natixis
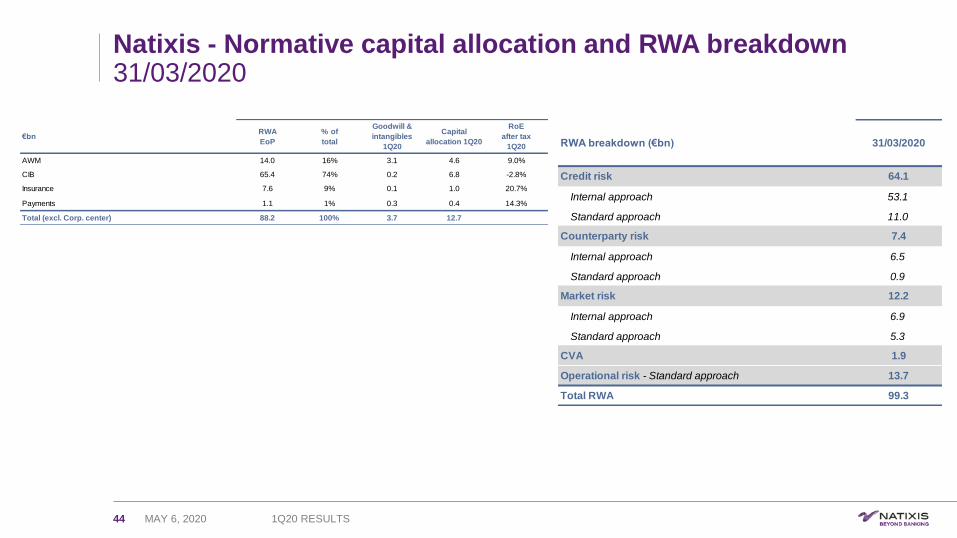
Natixis - Normative capital allocation and RWA breakdown31/03/2020
44 MAY 6, 2020 1Q20 RESULTS
€bnRWA
EoP
% of
total
Goodwill &
intangibles
1Q20
Capital
allocation 1Q20
RoE
after tax
1Q20
AWM 14.0 16% 3.1 4.6 9.0%
CIB 65.4 74% 0.2 6.8 -2.8%
Insurance 7.6 9% 0.1 1.0 20.7%
Payments 1.1 1% 0.3 0.4 14.3%
Total (excl. Corp. center) 88.2 100% 3.7 12.7
RWA breakdown (€bn) 31/03/2020
Credit risk 64.1
Internal approach 53.1
Standard approach 11.0
Counterparty risk 7.4
Internal approach 6.5
Standard approach 0.9
Market risk 12.2
Internal approach 6.9
Standard approach 5.3
CVA 1.9
Operational risk - Standard approach 13.7
Total RWA 99.3
C3 - Restricted Natixis
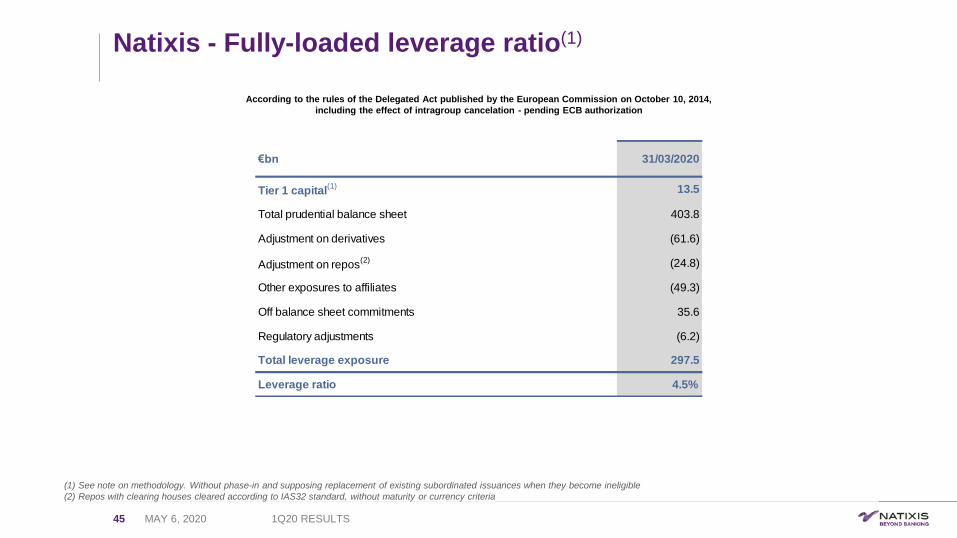
Natixis - Fully-loaded leverage ratio(1)
45
According to the rules of the Delegated Act published by the European Commission on October 10, 2014,
including the effect of intragroup cancelation - pending ECB authorization
(1) See note on methodology. Without phase-in and supposing replacement of existing subordinated issuances when they become ineligible
(2) Repos with clearing houses cleared according to IAS32 standard, without maturity or currency criteria
MAY 6, 2020 1Q20 RESULTS
€bn 31/03/2020
Tier 1 capital(1) 13.5
Total prudential balance sheet 403.8
Adjustment on derivatives (61.6)
Adjustment on repos(2) (24.8)
Other exposures to affiliates (49.3)
Off balance sheet commitments 35.6
Regulatory adjustments (6.2)
Total leverage exposure 297.5
Leverage ratio 4.5%
C3 - Restricted Natixis
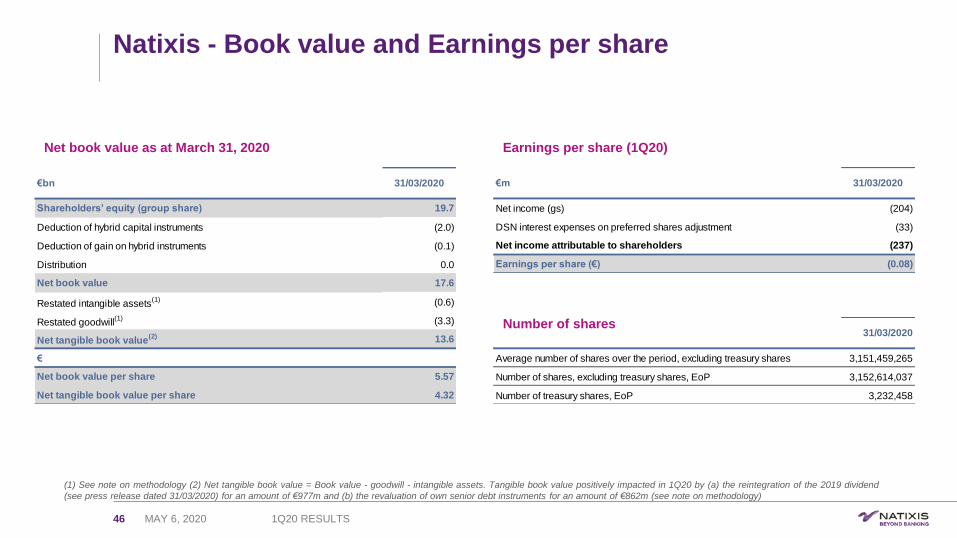
Natixis - Book value and Earnings per share
46
Net book value as at March 31, 2020 Earnings per share (1Q20)
(1) See note on methodology (2) Net tangible book value = Book value - goodwill - intangible assets. Tangible book value positively impacted in 1Q20 by (a) the reintegration of the 2019 dividend
(see press release dated 31/03/2020) for an amount of €977m and (b) the revaluation of own senior debt instruments for an amount of €862m (see note on methodology)
Number of shares
MAY 6, 2020 1Q20 RESULTS
€bn 31/03/2020
Shareholders’ equity (group share) 19.7
Deduction of hybrid capital instruments (2.0)
Deduction of gain on hybrid instruments (0.1)
Distribution 0.0
Net book value 17.6
Restated intangible assets(1) (0.6)
Restated goodwill(1) (3.3)
Net tangible book value(2) 13.6
€
Net book value per share 5.57
Net tangible book value per share 4.32
€m 31/03/2020
Net income (gs) (204)
DSN interest expenses on preferred shares adjustment (33)
Net income attributable to shareholders (237)
Earnings per share (€) (0.08)
31/03/2020
Average number of shares over the period, excluding treasury shares 3,151,459,265
Number of shares, excluding treasury shares, EoP 3,152,614,037
Number of treasury shares, EoP 3,232,458
C3 - Restricted Natixis
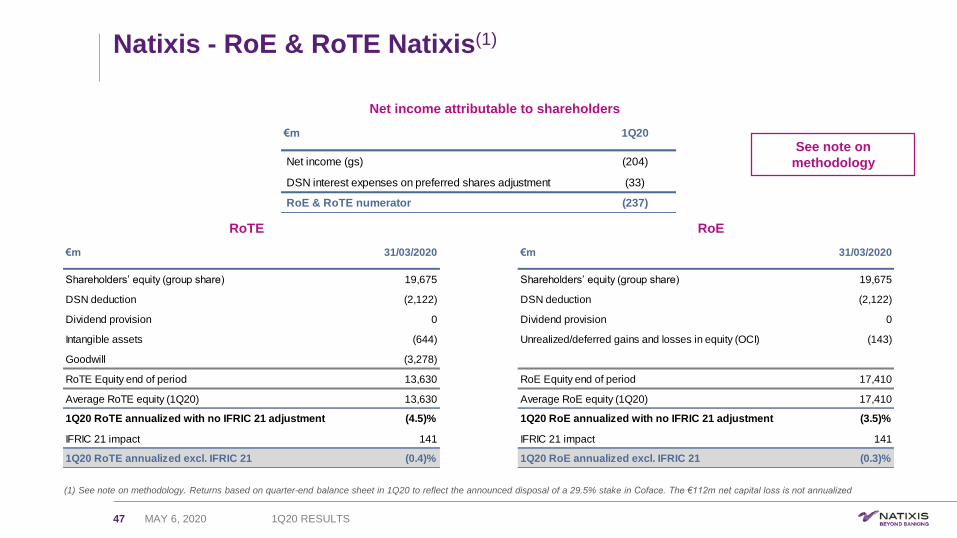
€m 31/03/2020 €m 31/03/2020
Shareholders’ equity (group share) 19,675 Shareholders’ equity (group share) 19,675
DSN deduction (2,122) DSN deduction (2,122)
Dividend provision 0 Dividend provision 0
Intangible assets (644) Unrealized/deferred gains and losses in equity (OCI) (143)
Goodwill (3,278)
RoTE Equity end of period 13,630 RoE Equity end of period 17,410
Average RoTE equity (1Q20) 13,630 Average RoE equity (1Q20) 17,410
1Q20 RoTE annualized with no IFRIC 21 adjustment (4.5)% 1Q20 RoE annualized with no IFRIC 21 adjustment (3.5)%
IFRIC 21 impact 141 IFRIC 21 impact 141
1Q20 RoTE annualized excl. IFRIC 21 (0.4)% 1Q20 RoE annualized excl. IFRIC 21 (0.3)%
Natixis - RoE & RoTE Natixis(1)
47
(1) See note on methodology. Returns based on quarter-end balance sheet in 1Q20 to reflect the announced disposal of a 29.5% stake in Coface. The €112m net capital loss is not annualized
See note on
methodology
MAY 6, 2020 1Q20 RESULTS
€m 1Q20
Net income (gs) (204)
DSN interest expenses on preferred shares adjustment (33)
RoE & RoTE numerator (237)
RoTE RoE
Net income attributable to shareholders

C3 - Restricted Natixis
Natixis - EAD (Exposure at Default) and doubtful loansAs at March 31, 2020
48
(1) Outstandings: €268bn (2) On-balance sheet, excluding repos, net of collateral (3) Net commitments (4) Specific and portfolio-based provisions
EAD - Regional breakdown(1) EAD - Sector breakdown(1)
France46%
European Union18%
North America
17%
Asia & Oceania
9%
Africa & ME5% Latin
America3%
Europeexcl. UE
3%
€bn 31/12/2019Proforma
Coface
31/03/2020
Provisionable commitments(3) 2.0 2.1
Provisionable commitments / Gross debt 1.7% 1.7%
Stock of provisions(4) 1.4 1.5
Stock of provisions / Provisionable commitments 70% 73%
Doubtful loans(2)
MAY 6, 2020 1Q20 RESULTS
0%
0%
1%
1%
1%
1%
1%
1%
1%
1%
1%
1%
1%
1%
1%
2%
2%
3%
3%
3%
5%
5%
5%
12%
19%
28%
Technology
Tourism
Mechanical constr.
Medias
Pharma/Healthcare
Automotive industry
Aeronautics
Services
Food & agric.
Holdings
Distribution
Public works
Telecom
Consumer goods
Community services
Base industries
Others
Electricity
Transport
International Trade
Securitization
Real Estate
Oil / Gas
Administrations
Finance - BPCE
Finance excl. BPCE
C3 - Restricted Natixis
0
2
4
6
8
10
12
14
16
18
20
Mar-19 Apr-19 May-19 Jun-19 Jul-19 Aug-19 Sep-19 Oct-19 Nov-19 Dec-19 Jan-20 Feb-20 Mar-20
€m
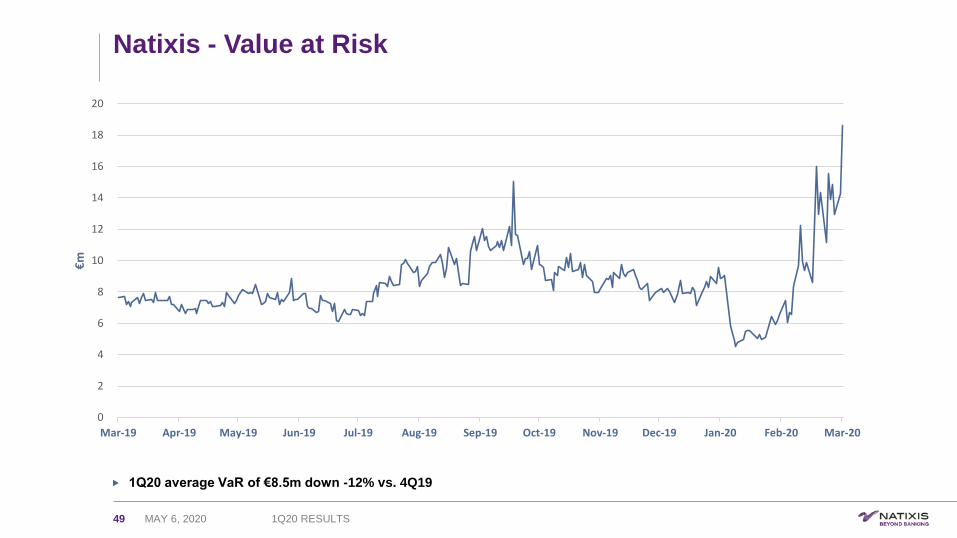
Natixis - Value at Risk
49
1Q20 average VaR of €8.5m down -12% vs. 4Q19
MAY 6, 2020 1Q20 RESULTS
C3 - Restricted Natixis
50
The results at 31/03/2020 were examined by the board of directors at their meeting on 06/05/2020.
Figures at 31/03/2020 are presented in accordance with IAS/IFRS accounting standards and IFRS Interpretation Committee (IFRIC) rulings as adopted in the European
Union and applicable at this date
Press release dated 20/04/2020 “Preparation of the 1Q20 Financial Communication”
The 2019 quarterly series have been updated following the February 25, 2020 announcement regarding the sale by Natixis of a 29.5% stake in Coface to Arch Capital
Group. This announcement notably translates into the following:
- Natixis losing exclusive control over Coface in the first quarter of 2020 and the recognition of a capital loss at the date of such a loss of control. It is estimated at
€112m based on the 2020 sale price;
- Application of the IAS 28 standard “Investments in associates and joint ventures” to the residual stake held by Natixis in Coface. For financial communication
purposes, the contribution of Coface to Natixis' income statement is isolated on a line "Coface net contribution" (based on a ~42% ownership over 2019 and of ~13%
as of the first quarter of 2020) and the Financial investments division no longer exists;
- In addition, the value of the retained stake (accounted for under the equity method) will be impacted by a €7m impairment due to the drop in the value of Coface
related to the context prevailing at March 31, 2020. For financial communication purposes, these two items – capital loss and residual stake impairment – will be
classified as exceptional items in the first quarter of 2020 and both presented within the line "Coface net contribution” (see page 26 for the reconciliation of the
restated figures with the accounting view);
- The prudential treatment applied to Natixis' stake in Coface resulted in a ~€2bn risk-weighted asset release in the first quarter 2020. Upon closing of the transaction,
~€1.4bn of additional risk-weighted assets should be released i.e. ~€3.5bn in total;
- The remaining Financial investments, namely Natixis Algeria as well as the private equity activities managed in run-off, are no longer isolated and are reallocated to
the Corporate center, which, as a reminder, gathers the holding and the centralized balance sheet management functions of Natixis.
The equity method value of Coface will be re-assessed every quarter depending, among other, on the evolution of the economic context and any change in
such a value will be reflected in the P&L line “Coface net contribution”
Press release of April 20, 2020
Note on methodology (1/3)
MAY 6, 2020 1Q20 RESULTS
C3 - Restricted Natixis
Note on methodology (2/3)
51
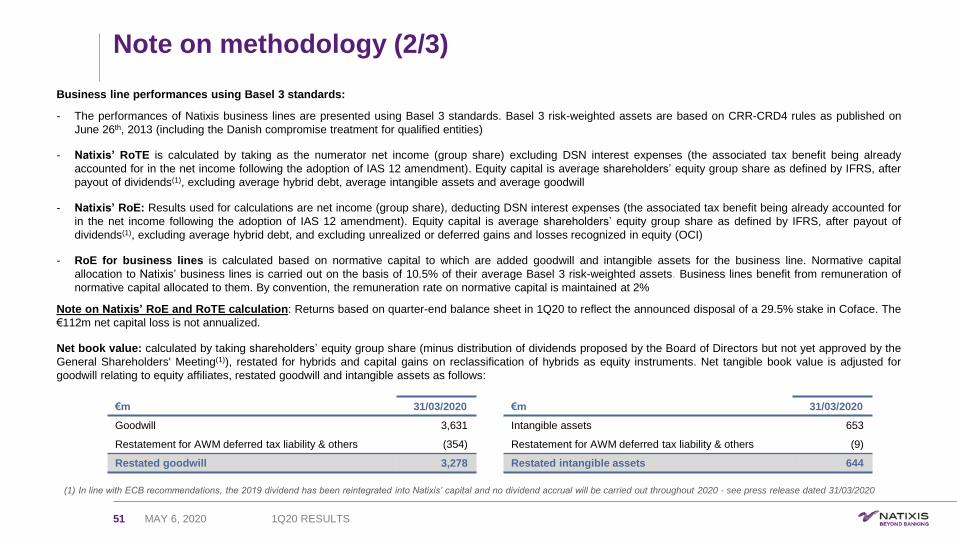
Business line performances using Basel 3 standards:
- The performances of Natixis business lines are presented using Basel 3 standards. Basel 3 risk-weighted assets are based on CRR-CRD4 rules as published on
June 26th, 2013 (including the Danish compromise treatment for qualified entities)
- Natixis’ RoTE is calculated by taking as the numerator net income (group share) excluding DSN interest expenses (the associated tax benefit being already
accounted for in the net income following the adoption of IAS 12 amendment). Equity capital is average shareholders’ equity group share as defined by IFRS, after
payout of dividends(1), excluding average hybrid debt, average intangible assets and average goodwill
- Natixis’ RoE: Results used for calculations are net income (group share), deducting DSN interest expenses (the associated tax benefit being already accounted for
in the net income following the adoption of IAS 12 amendment). Equity capital is average shareholders’ equity group share as defined by IFRS, after payout of
dividends(1), excluding average hybrid debt, and excluding unrealized or deferred gains and losses recognized in equity (OCI)
- RoE for business lines is calculated based on normative capital to which are added goodwill and intangible assets for the business line. Normative capital
allocation to Natixis’ business lines is carried out on the basis of 10.5% of their average Basel 3 risk-weighted assets. Business lines benefit from remuneration of
normative capital allocated to them. By convention, the remuneration rate on normative capital is maintained at 2%
Note on Natixis’ RoE and RoTE calculation: Returns based on quarter-end balance sheet in 1Q20 to reflect the announced disposal of a 29.5% stake in Coface. The
€112m net capital loss is not annualized.
Net book value: calculated by taking shareholders’ equity group share (minus distribution of dividends proposed by the Board of Directors but not yet approved by the
General Shareholders' Meeting(1)), restated for hybrids and capital gains on reclassification of hybrids as equity instruments. Net tangible book value is adjusted for
goodwill relating to equity affiliates, restated goodwill and intangible assets as follows:
€m 31/03/2020
Intangible assets 653
Restatement for AWM deferred tax liability & others (9)
Restated intangible assets 644
€m 31/03/2020
Goodwill 3,631
Restatement for AWM deferred tax liability & others (354)
Restated goodwill 3,278
MAY 6, 2020 1Q20 RESULTS
(1) In line with ECB recommendations, the 2019 dividend has been reintegrated into Natixis’ capital and no dividend accrual will be carried out throughout 2020 - see press release dated 31/03/2020
C3 - Restricted Natixis
Note on methodology (3/3)
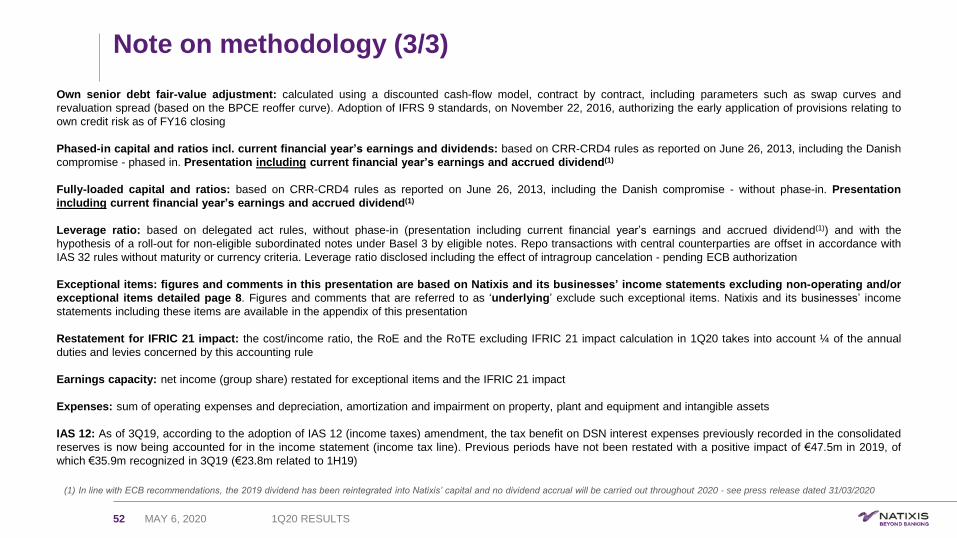
52
Own senior debt fair-value adjustment: calculated using a discounted cash-flow model, contract by contract, including parameters such as swap curves and
revaluation spread (based on the BPCE reoffer curve). Adoption of IFRS 9 standards, on November 22, 2016, authorizing the early application of provisions relating to
own credit risk as of FY16 closing
Phased-in capital and ratios incl. current financial year’s earnings and dividends: based on CRR-CRD4 rules as reported on June 26, 2013, including the Danish
compromise - phased in. Presentation including current financial year’s earnings and accrued dividend(1)
Fully-loaded capital and ratios: based on CRR-CRD4 rules as reported on June 26, 2013, including the Danish compromise - without phase-in. Presentation
including current financial year’s earnings and accrued dividend(1)
Leverage ratio: based on delegated act rules, without phase-in (presentation including current financial year’s earnings and accrued dividend(1)) and with the
hypothesis of a roll-out for non-eligible subordinated notes under Basel 3 by eligible notes. Repo transactions with central counterparties are offset in accordance with
IAS 32 rules without maturity or currency criteria. Leverage ratio disclosed including the effect of intragroup cancelation - pending ECB authorization
Exceptional items: figures and comments in this presentation are based on Natixis and its businesses’ income statements excluding non-operating and/or
exceptional items detailed page 8. Figures and comments that are referred to as ‘underlying’ exclude such exceptional items. Natixis and its businesses’ income
statements including these items are available in the appendix of this presentation
Restatement for IFRIC 21 impact: the cost/income ratio, the RoE and the RoTE excluding IFRIC 21 impact calculation in 1Q20 takes into account ¼ of the annual
duties and levies concerned by this accounting rule
Earnings capacity: net income (group share) restated for exceptional items and the IFRIC 21 impact
Expenses: sum of operating expenses and depreciation, amortization and impairment on property, plant and equipment and intangible assets
IAS 12: As of 3Q19, according to the adoption of IAS 12 (income taxes) amendment, the tax benefit on DSN interest expenses previously recorded in the consolidated
reserves is now being accounted for in the income statement (income tax line). Previous periods have not been restated with a positive impact of €47.5m in 2019, of
which €35.9m recognized in 3Q19 (€23.8m related to 1H19)
MAY 6, 2020 1Q20 RESULTS
(1) In line with ECB recommendations, the 2019 dividend has been reintegrated into Natixis’ capital and no dividend accrual will be carried out throughout 2020 - see press release dated 31/03/2020