national welfare & economic contributions of public libraries · national welfare &...
TRANSCRIPT
20120433_Revised Final Report
National Welfare & Economic Contributions of Public Libraries Final Report Australian Library and Information Association March 2013
20120433_Revised Final Report
This report has been prepared on behalf of Australian Library and Information Association. SGS Economics and Planning and its associated consultants are not liable to any person or entity for any damage or loss that has occurred, or may occur, in relation to that person or entity taking or not taking action in respect of any representation, statement, opinion or advice referred to herein. SGS Economics and Planning Pty Ltd ACN 007 437 729 www.sgsep.com.au Offices in Brisbane, Canberra, Hobart, Melbourne, Sydney
National Welfare & Economic Contributions of Public Libraries
TABLE OF CONTENTS
EXECUTIVE SUMMARY I Introduction i Cost benefit assessment i Economic impact assessment ii
1 INTRODUCTION 1 1.1 Project background 1 1.2 Broad framework 1
Cost benefit assessment 1 Economic impact assessment 2
2 METHODOLOGY 3 2.1 Market research 3 2.2 Public library service categorisation 4 2.3 Cost benefit assessment 4 2.4 Economic impact assessment 4
3 RESULTS 5 3.1 Recurrent costs of operation 5 3.2 Recurrent benefits of operation 5 3.3 Community welfare returns 6 3.4 Conservative estimates 6 3.5 Qualitative snapshots 7 3.6 Recurrent economic stimulus 8 3.7 Recurrent economic impact 8

National Welfare & Economic Contributions of Public Libraries i
EXECUTIVE SUMMARY
Introduction
On behalf of a consortium of state and territory libraries, the Australia Library and Information Association (ALIA) commissioned SGS Economics and Planning Pty Ltd (SGS) to generate estimates of the contributions that public libraries make to Australian community welfare and Australian economic activity. To do this, SGS applied the same methodological principles that were adopted in recent Victorian and Queensland studies, which were based on two separate measurement frameworks: The net contribution public libraries make to community welfare. This contribution is measured by subtracting
the costs of library service provision from the community benefits provided; with the community benefits assessed using three separate measurement techniques (i.e. financial savings, travel costs and contingent valuation methods).
The economic activity induced in the economy by public library operations. This is a process of isolating the
economic stimuli that public libraries introduce into the economy, and tracing how these stimuli culminate in economic activity in buyer and supplier industries through successive rounds of economic transactions.
It is important to note that the results generated by these assessment frameworks are not cumulative, i.e. they cannot be added together. They answer two different questions, with the first telling us if libraries are good value investments, and the second telling us how much economic activity libraries generate through operations.
Cost benefit assessment
The costs of operating existing public libraries are clearly identifiable through their recurrent operating costs. This information is collected annually by local governments across Australia and has been provided directly to SGS, by each State & Territory, in the following cost categories:
Library materials expenditure Staffing expenditures
Capital (asset) maintenance expenditures, and
Other expenditures. The benefits of public libraries are wide ranging and encompass the value delivered to library users directly and indirectly including: The services and programs made available to users by public libraries
The social interaction facilitated in public libraries
The sense of place and enhanced local amenity afforded by libraries
Environmental savings generated through continued re-use of library collections Public library contributions to language and computer literacy, and
Public library facilitation of improved education, career development and health outcomes. Non-users of public libraries also gain benefits from public library services. These include the value non-users place on having the option to use public libraries in future, as well as the value of knowing that public libraries exist for others to use, both now and in future. Based on the information provided across all jurisdictions, the total annual cost of public libraries across Australia is $1.03 billion. Public library staffing is consistently the largest individual cost category across all jurisdictions. Using benchmarks of user and non-user benefits, drawing from the significant market research undertaken in Victoria and Queensland, it has been estimated that the total annual benefit provided by public libraries to Australians is approximately $3 billion.
National Welfare & Economic Contributions of Public Libraries ii
Consequently, it is estimated that a net annual benefit of some $1.97 billion is provided to Australians by public library services. This is reflected in a benefit cost ratio of 2.9, meaning that the annual benefits generated outweigh the annual costs by a factor of 2.9. This is considered to be a sound return on investment. Importantly, the level of investment in public library services does not display a pattern of diminishing returns. Estimates of per capita costs and benefits, using the research carried out in Victoria and Queensland in 14 case study communities, highlight that the larger the investment made into public libraries, the larger the benefits derived by the respective communities. Collectively these findings provide a strong basis for arguing for increased levels of funding for public library services. It should also be noted that the results presented above can be considered conservative, as they inherently undercount the benefits provided by the online services of by public libraries, and they are based on some techniques which measure user willingness to pay for library services. Given the user profile of public libraries, user willingness to pay is likely to be constrained by user capacity to pay.
Economic impact assessment
The economic impact framework is relatively simple. It isolates the stimulus that public libraries bring to the Australian economy and traces how this stimulus flows through to other entities via multiple rounds of buyer and supplier transactions. Public libraries stimulate the national economy through their recurrent operating expenditures, as well as by triggering library user spending, predominantly on retail goods and services. To trace how this stimulus flows through the economy, SGS has utilised the Treasury Model (TRYM) which has been developed and which is maintained by the Commonwealth Treasury. Approximately $3.18 billion of economic stimulus is provided to the Australian economy by public libraries each year, through triggered library user expenditures and the recurrent operating expenditures of public libraries. After accounting for flow on linkages and transactions, it is estimated that approximately 30,950 jobs are supported by public library services, as is some $3.83 billion in value added annually. These economic impacts have been made using range based estimates, with low and high estimates stipulated. Under the range estimates generated, the lower bound of impacts are some 15% less than that reported above, while the high estimates are ~30% larger.
National Welfare & Economic Contributions of Public Libraries 1
1 INTRODUCTION
1.1 Project background
In recent years the Victorian and Queensland State Libraries have investigated the contributions that their respective public library networks made to community welfare and economic activity levels. These separate projects applied a common methodology, which was developed and implemented by SGS Economics and Planning Pty Ltd (SGS). Given the rigour and depth of research generated by these projects, state and territory libraries subsequently commissioned SGS to generate estimates of the contributions that public libraries make to Australian community welfare and Australian economic activity. In effect this required appropriately applying and scaling the combined Queensland and Victorian results across the remainder of Australia’s states and territories.
1.2 Broad framework
To complete this task, SGS applied the same methodological principles as the earlier studies, which are based on two separate measurement frameworks:
The net contribution public libraries make to community welfare. This contribution is measured via a cost benefit assessment (CBA) framework, which contrasts the economic, social and environmental costs and benefits associated with operating public library services; enabling an estimate of net benefit to be derived.
The economic activity induced in the economy by public library operations. This activity is measured by an economic impact assessment (EIA) framework, which identifies the stimuli that public libraries introduce into the economy through their expenditure profiles, and traces how these stimuli culminate in economic activity in buyer and supplier industries through successive rounds of economic transactions.
It is important to note that the results generated by these assessment frameworks are not cumulative, i.e. they cannot be added together. They answer two different questions, with the CBA telling us if libraries are good value investments, and the EIA telling us how much economic activity libraries generate through operations.
Cost benefit assessment
The costs of operating existing public libraries are clearly identifiable through their recurrent operating costs. This information is collected annually by local governments across Australia and has been provided directly to SGS, by each State & Territory, in the following cost categories:
Library materials expenditure Staffing expenditures
Capital (asset) maintenance expenditures, and
Other expenditures.
The benefits of public libraries are wide ranging and encompass the value delivered to library users directly and indirectly including:
The services and programs made available to users by public libraries
The social interaction facilitated in public libraries The sense of place and enhanced local amenity afforded by libraries
Environmental savings generated through continued re-use of library collections
Public library contributions to language and computer literacy, and
Public library facilitation of improved education, career development and health outcomes.
National Welfare & Economic Contributions of Public Libraries 2
Non-users of public libraries also gain benefits from public library services. These include the value non-users place on having the option to use public libraries in future, as well as the value of knowing that public libraries exist for others to use, both now and in future. Measuring the benefits of public libraries is not as straightforward as measuring costs, because the benefits are enjoyed by both users and non-users, and are not traded in the market place as they are largely provided free of charge. Consequently, market prices do not exist. To overcome this, SGS has used a combination of three non-market valuation techniques, which overlap in some cases, but which provide alternative estimates of benefit for the sake of comparison:
Financial savings – this method values the services offered by public libraries by asking users to estimate the
costs they would incur if similar services were provided by substitute, private sector providers. Travel costs – this method estimates the value of time, cost and effort that library users incur in getting to and in
using public library services. In essence this method assumes that the value derived by users must outweigh the costs incurred, otherwise users wouldn’t invest the effort required.
Contingency valuation – this method asks library users and non-users how much they would be willing to pay to keep public library services operating in their respective communities.
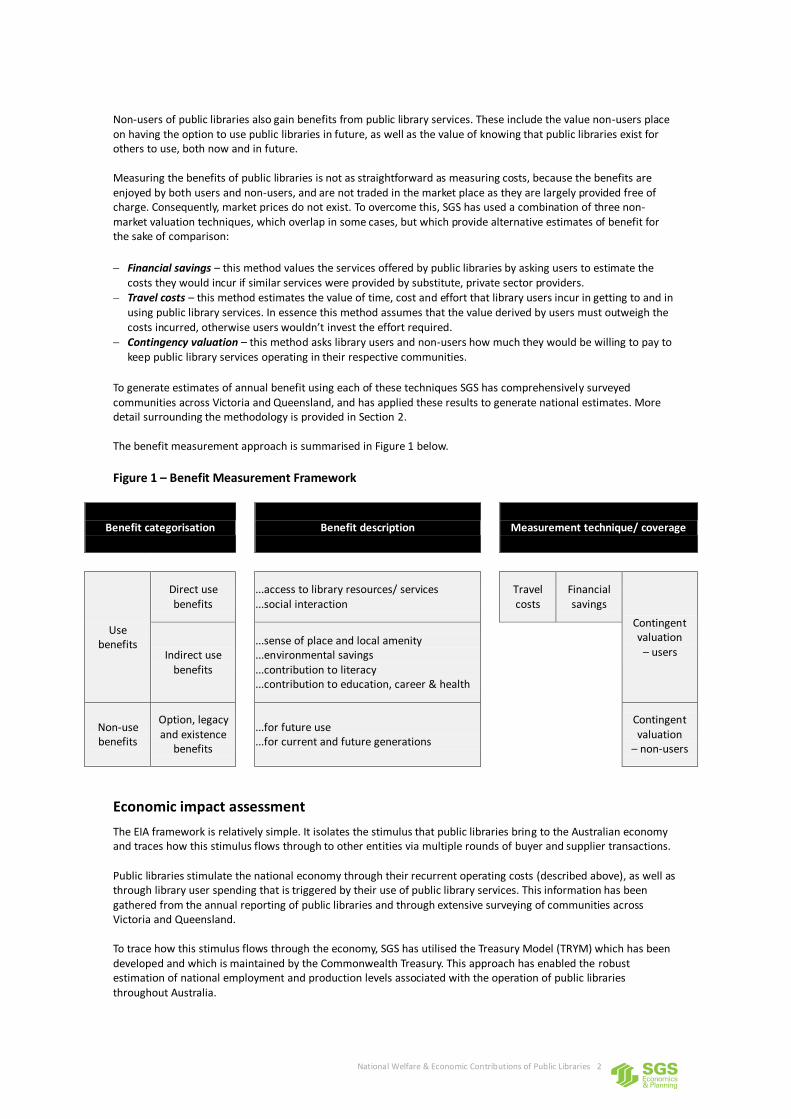
To generate estimates of annual benefit using each of these techniques SGS has comprehensively surveyed communities across Victoria and Queensland, and has applied these results to generate national estimates. More detail surrounding the methodology is provided in Section 2. The benefit measurement approach is summarised in Figure 1 below.
Figure 1 – Benefit Measurement Framework
Benefit categorisation
Benefit description
Measurement technique/ coverage
Use benefits
Direct use benefits
...access to library resources/ services
...social interaction
Travel costs
Financial savings
Contingent valuation
– users Indirect use benefits
...sense of place and local amenity
...environmental savings
...contribution to literacy
...contribution to education, career & health
Non-use benefits
Option, legacy and existence
benefits
...for future use
...for current and future generations
Contingent valuation
– non-users
Economic impact assessment
The EIA framework is relatively simple. It isolates the stimulus that public libraries bring to the Australian economy and traces how this stimulus flows through to other entities via multiple rounds of buyer and supplier transactions. Public libraries stimulate the national economy through their recurrent operating costs (described above), as well as through library user spending that is triggered by their use of public library services. This information has been gathered from the annual reporting of public libraries and through extensive surveying of communities across Victoria and Queensland. To trace how this stimulus flows through the economy, SGS has utilised the Treasury Model (TRYM) which has been developed and which is maintained by the Commonwealth Treasury. This approach has enabled the robust estimation of national employment and production levels associated with the operation of public libraries throughout Australia.
National Welfare & Economic Contributions of Public Libraries 3
2 METHODOLOGY
2.1 Market research
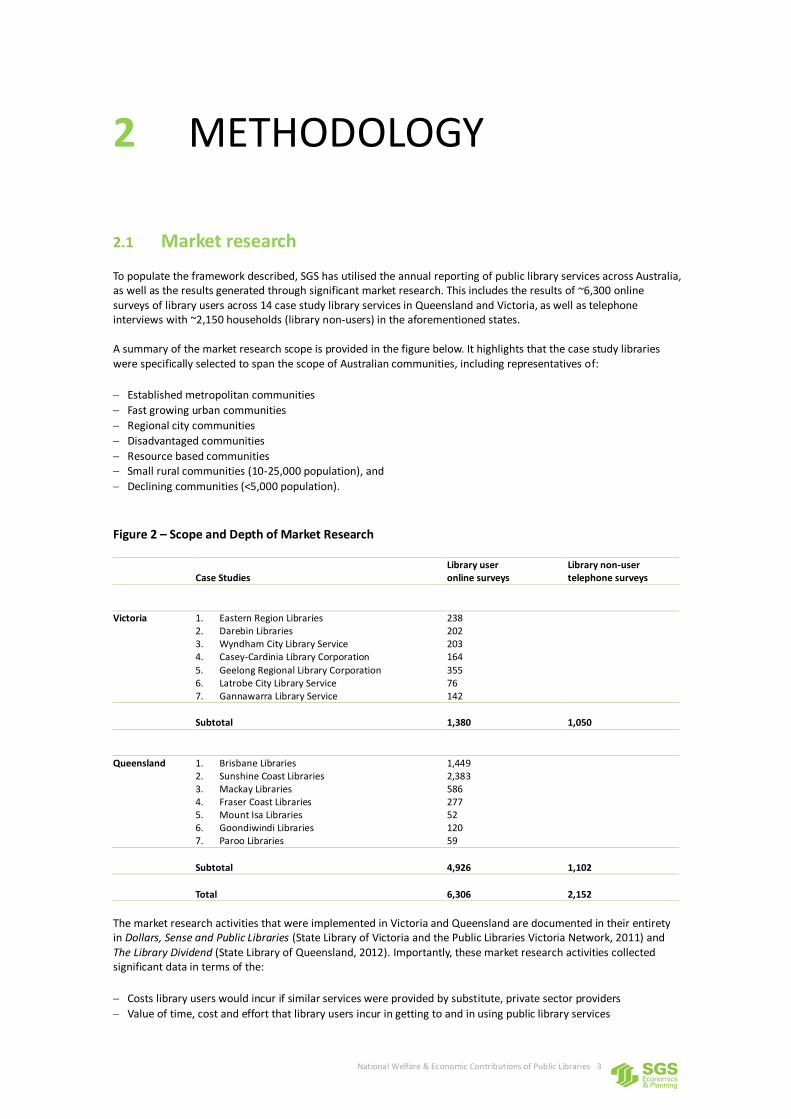
To populate the framework described, SGS has utilised the annual reporting of public library services across Australia, as well as the results generated through significant market research. This includes the results of ~6,300 online surveys of library users across 14 case study library services in Queensland and Victoria, as well as telephone interviews with ~2,150 households (library non-users) in the aforementioned states. A summary of the market research scope is provided in the figure below. It highlights that the case study libraries were specifically selected to span the scope of Australian communities, including representatives of:
Established metropolitan communities
Fast growing urban communities
Regional city communities
Disadvantaged communities
Resource based communities Small rural communities (10-25,000 population), and
Declining communities (<5,000 population).
Figure 2 – Scope and Depth of Market Research
Case Studies
Library user online surveys
Library non-user telephone surveys
Victoria 1. Eastern Region Libraries 2. Darebin Libraries 3. Wyndham City Library Service 4. Casey-Cardinia Library Corporation
5. Geelong Regional Library Corporation 6. Latrobe City Library Service 7. Gannawarra Library Service
238 202 203 164
355 76 142
Subtotal
1,380
1,050
Queensland 1. Brisbane Libraries 2. Sunshine Coast Libraries 3. Mackay Libraries 4. Fraser Coast Libraries 5. Mount Isa Libraries 6. Goondiwindi Libraries 7. Paroo Libraries
1,449 2,383 586 277 52 120 59
Subtotal
4,926
1,102
Total
6,306
2,152
The market research activities that were implemented in Victoria and Queensland are documented in their entirety in Dollars, Sense and Public Libraries (State Library of Victoria and the Public Libraries Victoria Network, 2011) and The Library Dividend (State Library of Queensland, 2012). Importantly, these market research activities collected significant data in terms of the:
Costs library users would incur if similar services were provided by substitute, private sector providers
Value of time, cost and effort that library users incur in getting to and in using public library services
National Welfare & Economic Contributions of Public Libraries 4
How much library users and non-users would be willing to pay to keep public library services operating in their respective communities, and
Level of expenditure that is triggered by library users as a direct result of their library usage.
From this dataset, benchmarks for library user benefits and expenditures that are applicable to each of the various categories of communities across Australia were generated.
2.2 Public library service categorisation
SGS subsequently categorised each public library service in Australia so that the benchmark estimates generated could be appropriately applied. This application process reflected the categorisation of public library services using assessments of the following data for each library service:
Population
Population growth
Industry structure (particularly the significance of mining activities)
Geographic remoteness, and Socio-economic status.
In effect each public library service was categorised as being either an 1) established metropolitan, 2) fast growing urban, 3) regional city based, 4) disadvantaged, 5) resource based, 6) small rural or 7) declining community.
2.3 Cost benefit assessment
SGS then applied the benchmarks for each of these community types to estimate the benefits conferred to both the library user and non-user groups in that location. For the library user group assessed benefits, the average estimate generated by the financial savings, travel costs and contingency valuation method was applied. For the non-user group in that particular library service, the contingency valuation estimate was adopted. As stated earlier, the actual recurrent costs of public library service operation were sourced for each public library service, as were membership rates and estimates of the population potentially served (covered in the geographic catchment).
2.4 Economic impact assessment
Using the categorisations made earlier, SGS applied the average value of library user expenditure that was triggered by library usage each year. This triggered expenditure was added to the recurrent cost of operations to the relevant library service to estimate the annual stimulus made to the surrounding economy. The collective stimulus made annually by all public library services across Australia was then used to ‘shock’ a model of the Australia economy, using the Treasury Model (TRYM).1 The cumulative impact of this shock was then assessed from the modelled results to estimate the level of employment and activity supported by the public library sector across Australia.
1 A detailed specification of TRYM and how it works is available at http://archive.treasury.gov.au/contentitem.asp?ContentID=238
National Welfare & Economic Contributions of Public Libraries 5
3 RESULTS
3.1 Recurrent costs of operation
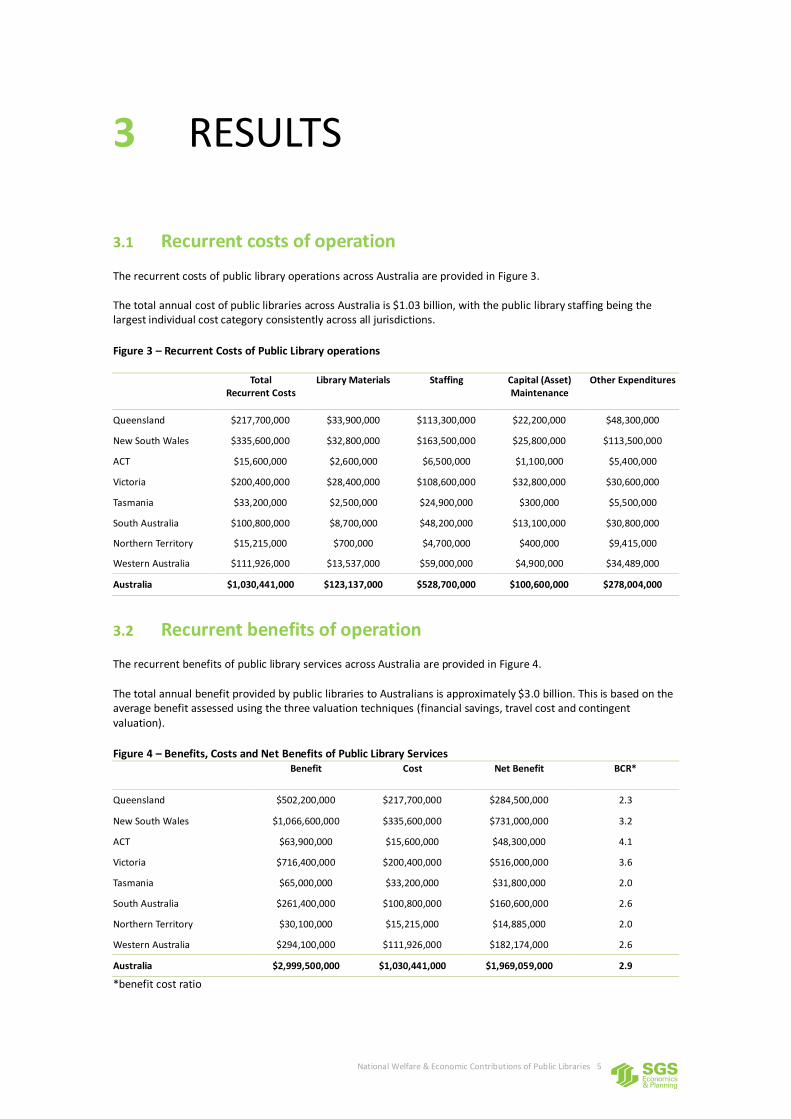
The recurrent costs of public library operations across Australia are provided in Figure 3. The total annual cost of public libraries across Australia is $1.03 billion, with the public library staffing being the largest individual cost category consistently across all jurisdictions.
Figure 3 – Recurrent Costs of Public Library operations Total
Recurrent Costs Library Materials Staffing Capital (Asset)
Maintenance Other Expenditures
Queensland $217,700,000 $33,900,000 $113,300,000 $22,200,000 $48,300,000
New South Wales $335,600,000 $32,800,000 $163,500,000 $25,800,000 $113,500,000
ACT $15,600,000 $2,600,000 $6,500,000 $1,100,000 $5,400,000
Victoria $200,400,000 $28,400,000 $108,600,000 $32,800,000 $30,600,000
Tasmania $33,200,000 $2,500,000 $24,900,000 $300,000 $5,500,000
South Australia $100,800,000 $8,700,000 $48,200,000 $13,100,000 $30,800,000
Northern Territory $15,215,000 $700,000 $4,700,000 $400,000 $9,415,000
Western Australia $111,926,000 $13,537,000 $59,000,000 $4,900,000 $34,489,000
Australia $1,030,441,000 $123,137,000 $528,700,000 $100,600,000 $278,004,000
3.2 Recurrent benefits of operation
The recurrent benefits of public library services across Australia are provided in Figure 4. The total annual benefit provided by public libraries to Australians is approximately $3.0 billion. This is based on the average benefit assessed using the three valuation techniques (financial savings, travel cost and contingent valuation).
Figure 4 – Benefits, Costs and Net Benefits of Public Library Services Benefit Cost Net Benefit BCR*
Queensland $502,200,000 $217,700,000 $284,500,000 2.3
New South Wales $1,066,600,000 $335,600,000 $731,000,000 3.2
ACT $63,900,000 $15,600,000 $48,300,000 4.1
Victoria $716,400,000 $200,400,000 $516,000,000 3.6
Tasmania $65,000,000 $33,200,000 $31,800,000 2.0
South Australia $261,400,000 $100,800,000 $160,600,000 2.6
Northern Territory $30,100,000 $15,215,000 $14,885,000 2.0
Western Australia $294,100,000 $111,926,000 $182,174,000 2.6
Australia $2,999,500,000 $1,030,441,000 $1,969,059,000 2.9
*benefit cost ratio

National Welfare & Economic Contributions of Public Libraries 6
3.3 Community welfare returns
The annual net benefit of public library services across Australia is also provided in Figure 4. According to the methodology applied, it is estimated that a net annual benefit of some $1.97 billion is provided to Australians by public library services. This is reflected in a benefit cost ratio of 2.9, meaning that the annual benefits generated outweigh the annual costs by a factor of 2.9. This is considered to be a sound return on investment. Importantly, the level of investment in public library services does not display a pattern of diminishing returns (Figure 5). Estimates of per capita costs and benefits, using the research carried out in Victoria and Queensland in 14 case study communities, highlight that the larger the investment made into public libraries, the larger the benefits derived by the respective communities. Collectively these findings provide a strong basis for arguing for increased levels of funding for public library services. Figure 5 – Public Library Services - Benefits & Costs per capita (14 case study communities)
3.4 Conservative estimates
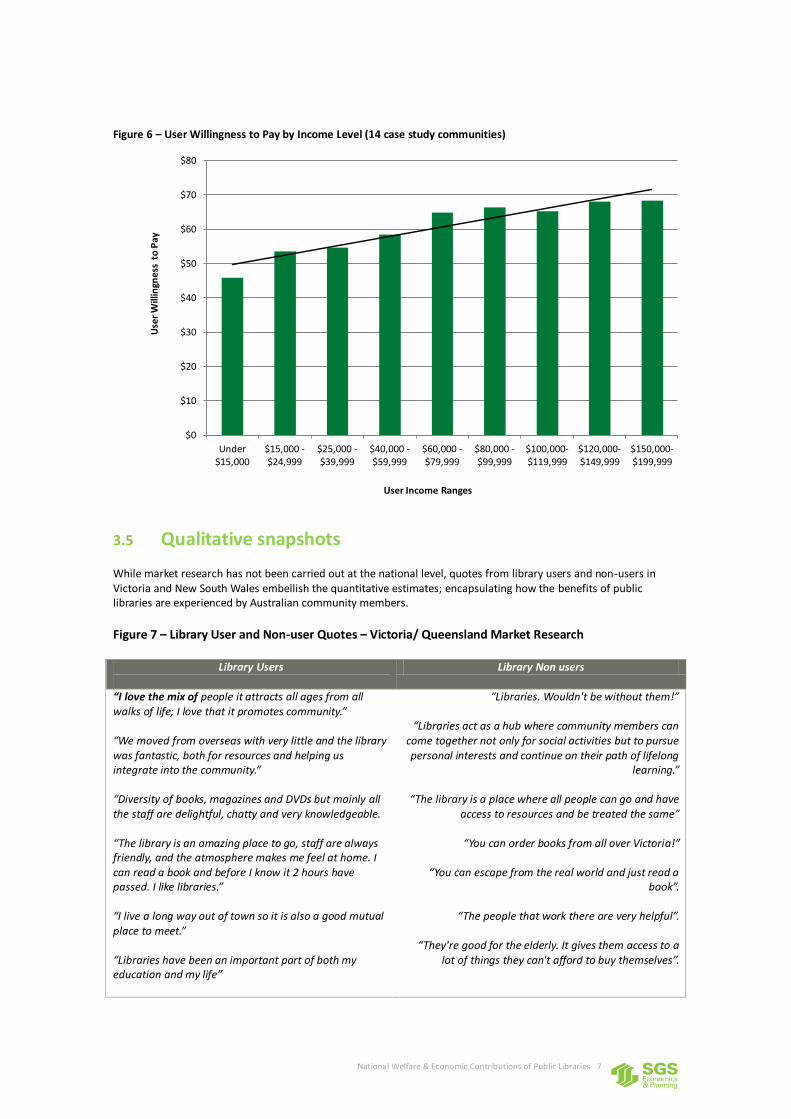
It should also be noted that the research presented above does not fully capture benefits that might be attributable to the online presence of public library services. Given the increasing online presence and electronic service delivery of public libraries in recent years, the estimates of benefit may well be viewed as conservative. Finally, the estimates of user benefit generated by some of the valuation techniques utilised (i.e. contingent valuation, travel cost) are likely to be constrained by user income levels. That is, user willingness to pay for public library services may well be constrained by user capacity to pay. The effect of this compromised capacity to pay is likely to be compounded by the over-representation of low income and other disadvantaged persons in the user profile of public libraries (Libraries Building Communities – Report 3, Bridging the Gaps, State Library of Victoria, 2005). The case study results are instructive in this regard. In Figure 6, user willingness to pay (~ benefit) estimates are categorised by income level, highlighting that the higher the user’s income, the greater their expressed willingness to pay for public library services. This merely confirms the earlier assertion that the benefit estimates provided in Figure 4 are likely to be conservative.
$0
$20
$40
$60
$80
$100
$120
$140
$160
$180
$200
$0 $20 $40 $60 $80 $100 $120
Co
mm
un
ity
Be
ne
fit
pe
r C
ap
ita
Operating Cost per Capita
National Welfare & Economic Contributions of Public Libraries 7
Figure 6 – User Willingness to Pay by Income Level (14 case study communities)
3.5 Qualitative snapshots
While market research has not been carried out at the national level, quotes from library users and non-users in Victoria and New South Wales embellish the quantitative estimates; encapsulating how the benefits of public libraries are experienced by Australian community members.
Figure 7 – Library User and Non-user Quotes – Victoria/ Queensland Market Research
Library Users
Library Non users
“I love the mix of people it attracts all ages from all walks of life; I love that it promotes community.” “We moved from overseas with very little and the library was fantastic, both for resources and helping us integrate into the community.” “Diversity of books, magazines and DVDs but mainly all the staff are delightful, chatty and very knowledgeable. “The library is an amazing place to go, staff are always friendly, and the atmosphere makes me feel at home. I can read a book and before I know it 2 hours have passed. I like libraries.” “I live a long way out of town so it is also a good mutual place to meet.” “Libraries have been an important part of both my education and my life”
“Libraries. Wouldn't be without them!”
“Libraries act as a hub where community members can come together not only for social activities but to pursue personal interests and continue on their path of lifelong
learning.”
“The library is a place where all people can go and have access to resources and be treated the same”
“You can order books from all over Victoria!”
“You can escape from the real world and just read a
book”.
“The people that work there are very helpful”.
“They're good for the elderly. It gives them access to a lot of things they can't afford to buy themselves”.
$0
$10
$20
$30
$40
$50
$60
$70
$80
Under $15,000
$15,000 - $24,999
$25,000 - $39,999
$40,000 - $59,999
$60,000 - $79,999
$80,000 - $99,999
$100,000- $119,999
$120,000- $149,999
$150,000- $199,999
Use
r W
illin
gne
ss t
o P
ay
User Income Ranges
National Welfare & Economic Contributions of Public Libraries 8
3.6 Recurrent economic stimulus
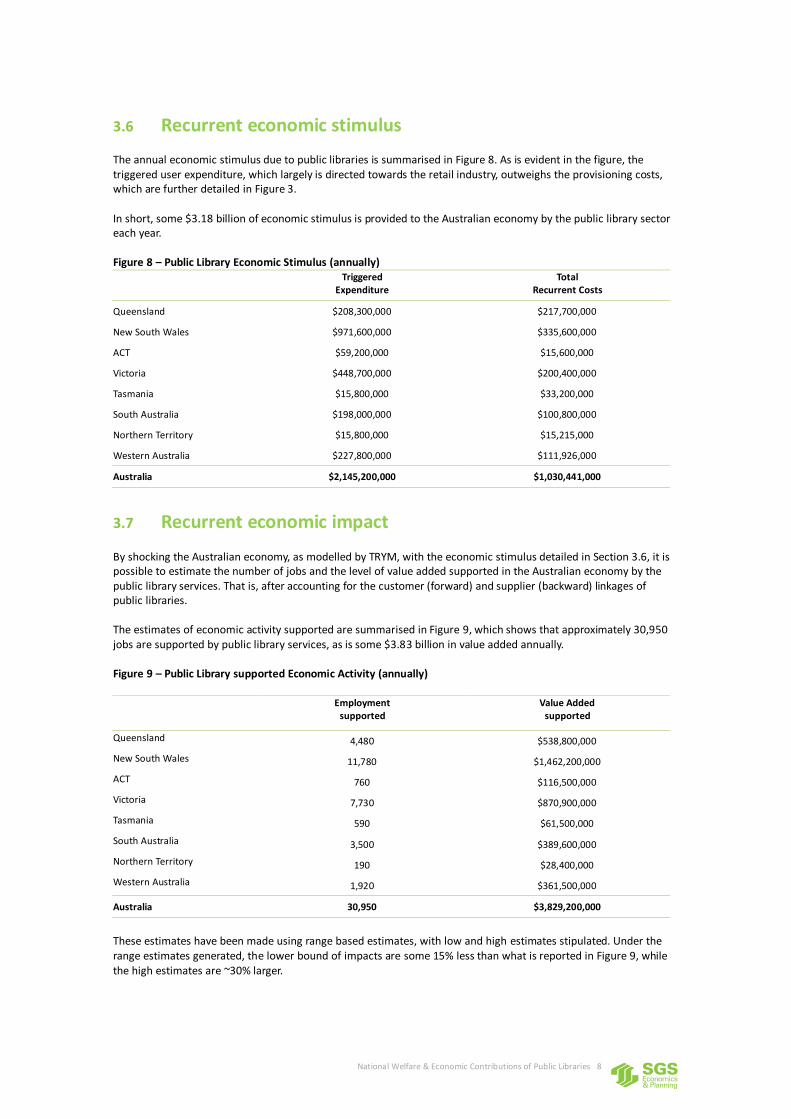
The annual economic stimulus due to public libraries is summarised in Figure 8. As is evident in the figure, the triggered user expenditure, which largely is directed towards the retail industry, outweighs the provisioning costs, which are further detailed in Figure 3. In short, some $3.18 billion of economic stimulus is provided to the Australian economy by the public library sector each year. Figure 8 – Public Library Economic Stimulus (annually) Triggered
Expenditure Total
Recurrent Costs
Queensland $208,300,000 $217,700,000
New South Wales $971,600,000 $335,600,000
ACT $59,200,000 $15,600,000
Victoria $448,700,000 $200,400,000
Tasmania $15,800,000 $33,200,000
South Australia $198,000,000 $100,800,000
Northern Territory $15,800,000 $15,215,000
Western Australia $227,800,000 $111,926,000
Australia $2,145,200,000 $1,030,441,000
3.7 Recurrent economic impact
By shocking the Australian economy, as modelled by TRYM, with the economic stimulus detailed in Section 3.6, it is possible to estimate the number of jobs and the level of value added supported in the Australian economy by the public library services. That is, after accounting for the customer (forward) and supplier (backward) linkages of public libraries. The estimates of economic activity supported are summarised in Figure 9, which shows that approximately 30,950 jobs are supported by public library services, as is some $3.83 billion in value added annually. Figure 9 – Public Library supported Economic Activity (annually) Employment
supported Value Added
supported
Queensland 4,480 $538,800,000
New South Wales 11,780 $1,462,200,000
ACT 760 $116,500,000
Victoria 7,730 $870,900,000
Tasmania 590 $61,500,000
South Australia 3,500 $389,600,000
Northern Territory 190 $28,400,000
Western Australia 1,920 $361,500,000
Australia 30,950 $3,829,200,000
These estimates have been made using range based estimates, with low and high estimates stipulated. Under the range estimates generated, the lower bound of impacts are some 15% less than what is reported in Figure 9, while the high estimates are ~30% larger.
www.sgsep.com.au
Contact us BRISBANE
PO Box 1177 Level 1, 76 McLachlan Street Fortitude Valley QLD 4006
+61 7 3124 9026 [email protected]
CANBERRA
Level 1, 55 Woolley Street Dickson ACT 2602
+61 2 6262 7603 [email protected]
HOBART
Unit 2, 5 King Street Bellerive TAS 7018
+61 (0)439 941 934 [email protected]
MELBOURNE
Level 5, 171 La Trobe Street Melbourne VIC 3000
+61 3 8616 0331 [email protected]
SYDNEY
Suite 12, 50 Reservoir Street Surry Hills NSW 2010
+61 2 8307 0121 [email protected]