national risk assessment partnership
TRANSCRIPT

Stakeholder Group
Wade, LLC
National Risk Assessment PartnershipNRAP leverages DOE’s capabilities to help quantify uncertainties and risks
necessary to remove barriers to full-scale CO2 storage deployment.
Building toolsets and improving the science base to address…• Potential impacts related to release of CO2 or brine from the storage reservoir
• Potential ground‐motion impacts due to injection of CO2
Technical Team

National Risk Assessment PartnershipNRAP leverages DOE’s capabilities to help quantify uncertainties and risks
necessary to remove barriers to full-scale CO2 storage deployment.
Seals Reservoir
Wells Groundwater
Fault
Building toolsets and improving the science base to address…By simulating risk across the entire carbon storage system;
And generation thousands of realizations to quantify uncertainties.

Broad knowledge base provides foundation for confidence in long‐term geologic storage security.
Schematic evolution of trapping mechanisms over time (IPCC, 2005)
Multiple trapping mechanisms reduceCO2 mobility over time
• structural/stratigraphic; residual; solubility; mineralization; sorption
Risk profiles should decline over time
Broad experience base for effective site‐characterization & operational strategies
• Decades of successful operational experience (e.g., EOR, gas storage, …)
• RCSPs & DOE Best‐Practices• Early successes with large‐scale field demos (e.g., Sleipner, Weyburn)
Schematic profile of environmental risk (Benson, 2007)
IPCC (2005)
“Observations from engineered and natural analogues as well as models suggest that the fraction retained in appropriately selected and managed geological reservoirs is very likely to exceed 99% over 100 years and is likely to exceed 99% over 1,000 years.”
What do we know?
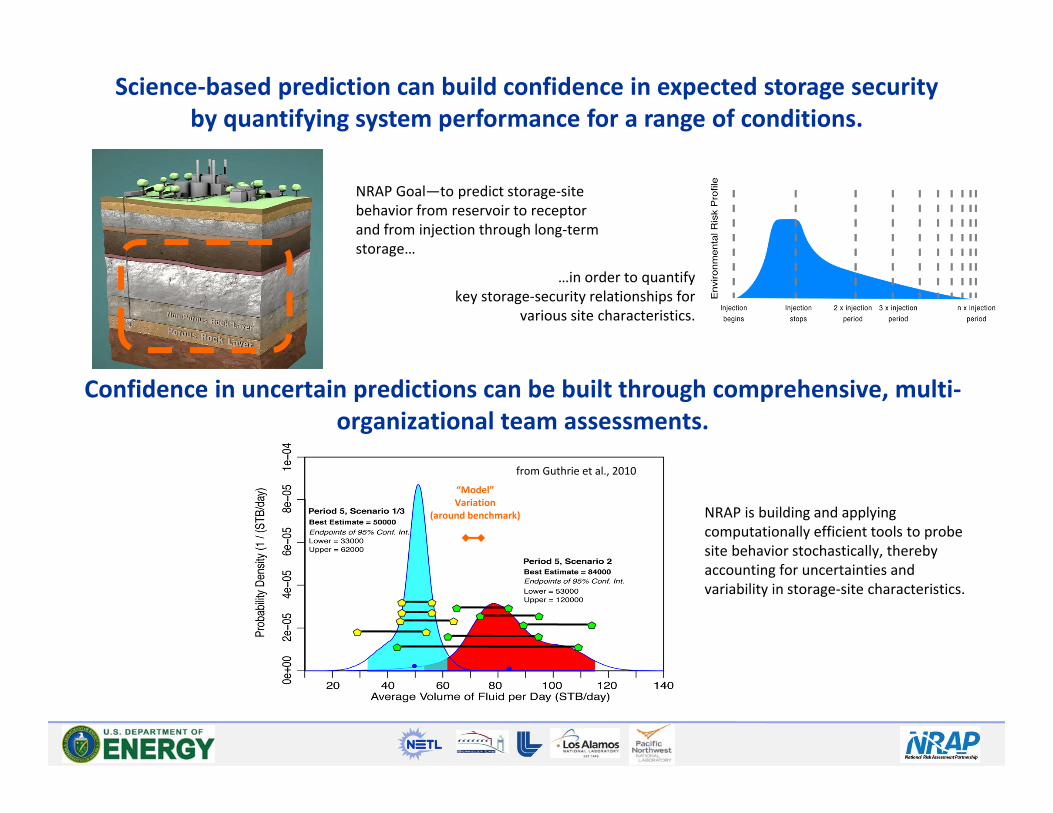
Science‐based prediction can build confidence in expected storage security by quantifying system performance for a range of conditions.
NRAP Goal—to predict storage‐site behavior from reservoir to receptor and from injection through long‐term storage…
Confidence in uncertain predictions can be built through comprehensive, multi‐organizational team assessments.
“Model”Variation
(around benchmark)
from Guthrie et al., 2010
NRAP is building and applyingcomputationally efficient tools to probe site behavior stochastically, thereby accounting for uncertainties and variability in storage‐site characteristics.
…in order to quantifykey storage‐security relationships for
various site characteristics.

What information is needed to provide the confidence necessary to consider an alternative approach to PISC monitoring needs?
0
5
10
US$
/ tC
O2
IPCC (2005) EPA (2010)Prelim. Formation‐Specific EstimatesNETL (Morgan et al., in progress)
Class VI
• IPCC (2005) estimated post‐injection monitoring costs to be <10% of project costs.
• Post Class VI estimates range from 35–50% of total costs.
• Primary drivers for costs include:
• long time frame (50 yrs)
• large area‐of‐review
• large battery of techniques
pre‐Class VI
Operations Costs
Monitoring/PISCCosts
A reduction of 1‐2 $/ton CO2 would mean a savings of $50‐250 million per project.

NR
AP
Inte
grat
ed A
sses
smen
t (S
yste
m) M
odel
s
NRAP’s approach to quantifying performance relies on reduced‐order models to probe uncertainty in the system.
Storage Reservoir
Release and Transport
Potential Receptors or Impacted Media
Data from RCSPs etc.
New Data from NRAP
calibrate
calibrate
Energy DataExchange (EDX)
IAM
E. Develop strategic monitoring protocols that allow verification of predicted system performance
A. Divide system intodiscrete components
B. Develop detailed component models that are validated against lab/field data
C. Develop reduced‐order models (ROMs) that rapidly reproduce component model predictions
D. Link ROMs via integrated assessment models (IAMs) to predict system performance & risk; calibrate using lab/field data from NRAP and other sources
Energy Data eXchange(edx.netl.doe.gov)

Key NRAP Accomplishments: Building the Toolsets
• First‐of‐a‐kind toolsets for science‐based, quantitative evaluation of risks and uncertainties• Leakage risks (reservoirs to receptors)• Induced seismic events
• Site‐specific and adaptable ROMs• Reservoirs (3 classes; 3 injection scenarios)• Wellbores (open and cemented)• Fractures (discrete and networks)• Aquifers (two major types)
• Evaluated numerous approaches to reduced‐order models (lookup table to artificial intelligence)• Achieve balance between fidelity and speed

Several NRAP products will be released for use in August 2015.
• Integrated Assessment Model – CO2‐PENS• Reservoir Analysis Tool• Wellbore ROM Tool• NSealR Model• Coupled High Plains Aquifer Tool• Coupled Edwards Aquifer Tool• Simulation Tools for Optimization and Risk Management
(STORM)• Empirical Seismic Hazard Analysis Tool• Probabilistic Seismic Risk Assessment Tool (RISKCAT)• Ground Motion Predictive Tool
www.edx.netl.doe.gov/nrap
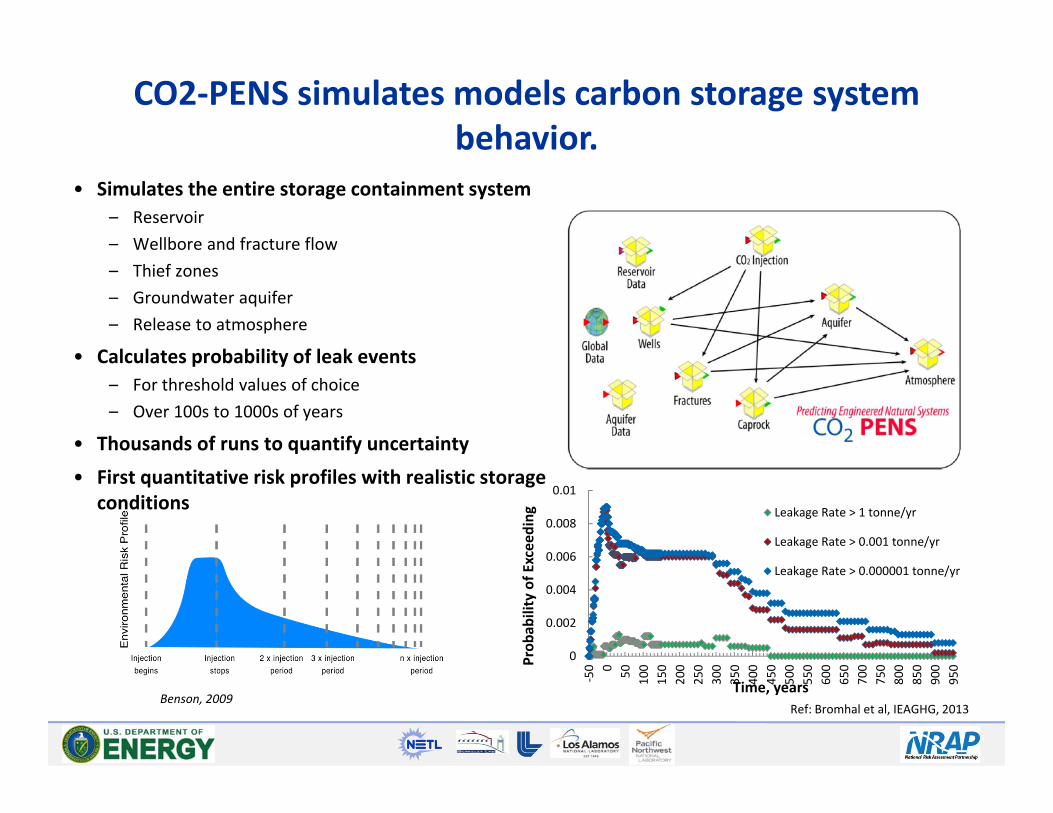
CO2‐PENS simulates models carbon storage system behavior.
0
0.002
0.004
0.006
0.008
0.01
‐50 0 50 100
150
200
250
300
350
400
450
500
550
600
650
700
750
800
850
900
950Pr
obab
ility of E
xceeding
Time, years
Leakage Rate > 1 tonne/yr
Leakage Rate > 0.001 tonne/yr
Leakage Rate > 0.000001 tonne/yr
• Simulates the entire storage containment system – Reservoir– Wellbore and fracture flow– Thief zones– Groundwater aquifer– Release to atmosphere
• Calculates probability of leak events– For threshold values of choice– Over 100s to 1000s of years
• Thousands of runs to quantify uncertainty
• First quantitative risk profiles with realistic storage conditions
Benson, 2009Ref: Bromhal et al, IEAGHG, 2013
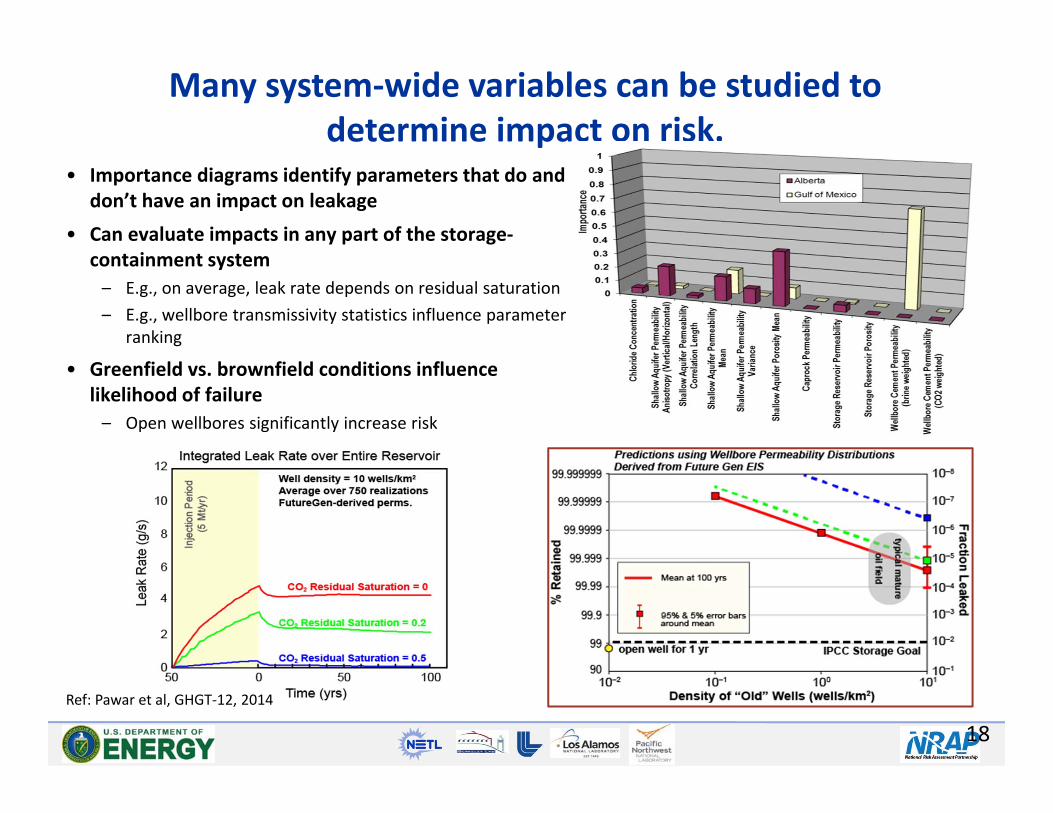
Many system‐wide variables can be studied to determine impact on risk.
18
• Importance diagrams identify parameters that do and don’t have an impact on leakage
• Can evaluate impacts in any part of the storage‐containment system– E.g., on average, leak rate depends on residual saturation– E.g., wellbore transmissivity statistics influence parameter
ranking
• Greenfield vs. brownfield conditions influence likelihood of failure– Open wellbores significantly increase risk
Ref: Pawar et al, GHGT‐12, 2014
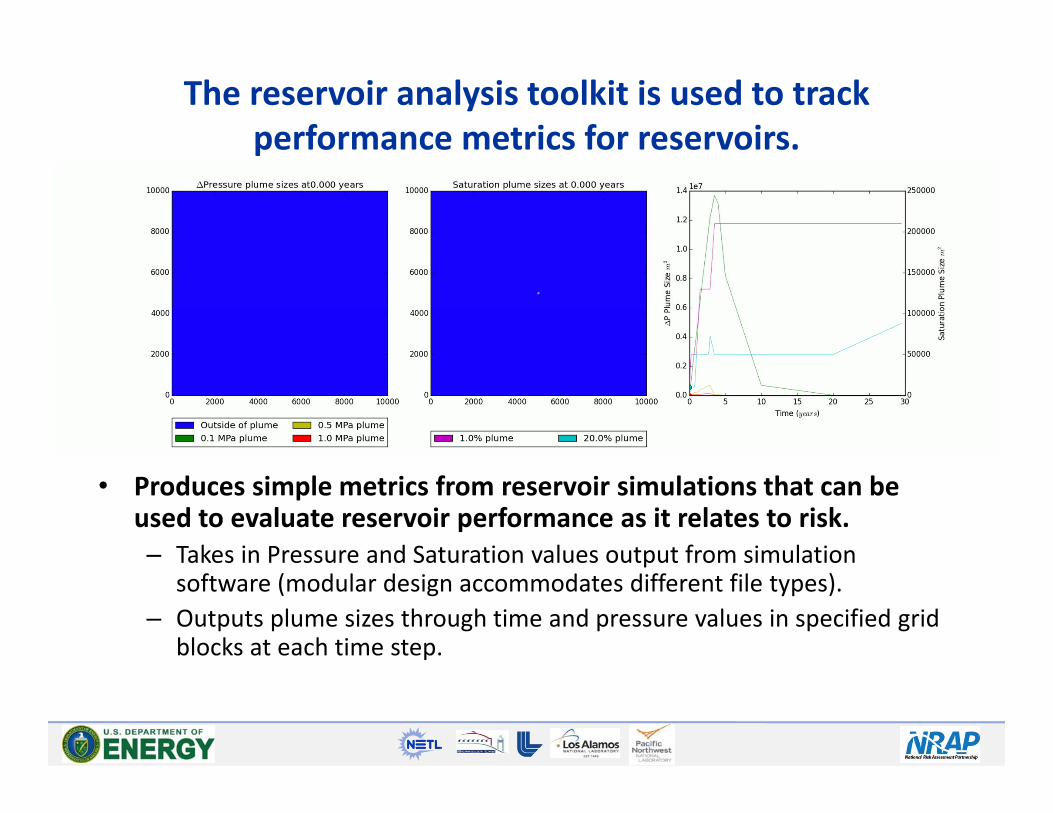
The reservoir analysis toolkit is used to track performance metrics for reservoirs.
• Produces simple metrics from reservoir simulations that can be used to evaluate reservoir performance as it relates to risk.– Takes in Pressure and Saturation values output from simulation
software (modular design accommodates different file types).– Outputs plume sizes through time and pressure values in specified grid
blocks at each time step.

Addresses multiple simulations probabilistically.
• Colors based on likelihood of exceeding user‐defined thresholds in each grid block
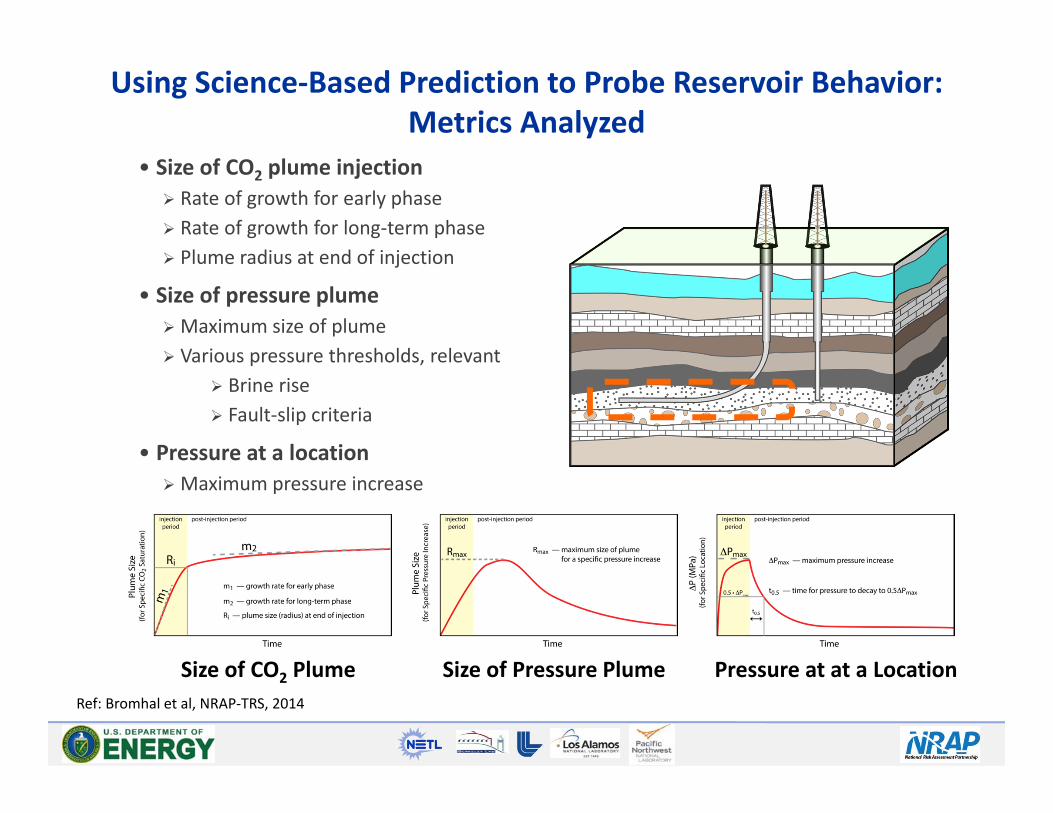
Using Science‐Based Prediction to Probe Reservoir Behavior:Metrics Analyzed
• Size of CO2 plume injection Rate of growth for early phase Rate of growth for long‐term phase Plume radius at end of injection
• Size of pressure plumeMaximum size of plume Various pressure thresholds, relevant
Brine rise Fault‐slip criteria
• Pressure at a locationMaximum pressure increase
Size of CO2 Plume Size of Pressure Plume Pressure at at a LocationRef: Bromhal et al, NRAP‐TRS, 2014

Domal Sandstone‐Limestone(10‐yr injection; 1‐50 Mt)
Multi‐layer, Domal Sandstone(3‐yr injection; 0.1‐10 Mt)
Growth of CO2 plume has a characteristic behavior,albeit details vary between sites.
Unbound Sandstone, Regional Dip(0° dip; kh=100 mD; =0.2)
injection: rapid growth
post‐injection: slow growth to stable
Unbound Sandstone, Regional Dip(0° dip; kh=1000 mD; =0.2)

Amount of CO2 injected is primary factor in the growth rate and size of CO2 plume.
Increase in mass of CO2 increases the growth ratefor the CO2 plume (both early and long‐term rates)
Increase in porosity decreases growth rate
Permeability has minimal impact on growth ratebut impacts size of CO2 plume
Unbound Sandstone, Regional Dip (0° dip)
Unbound Sandstone, Regional Dip (0° dip)Unbound Sandstone,
Regional Dip(1° dip; 1Mt/yr)
operationa
lgeological
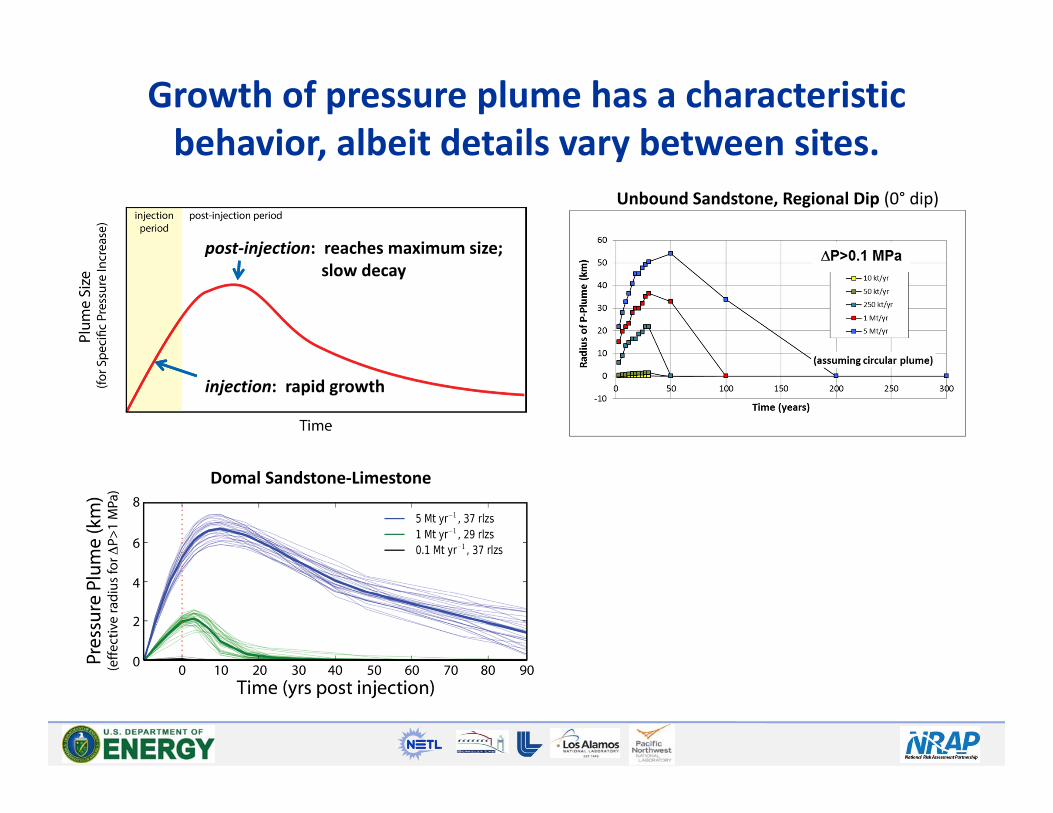
Growth of pressure plume has a characteristic behavior, albeit details vary between sites.
Domal Sandstone‐Limestone
Unbound Sandstone, Regional Dip (0° dip)
injection: rapid growth
post‐injection: reaches maximum size;slow decay

Amount of CO2 injected and geologic detailseach impact the area/distance for pressure effects.
Increase in mass of CO2 increases the distanceof pressure effects for a given threshold
Decreasing permeability can significantlyincrease distance (or size) of pressure effects
Increasing the permeability can dramaticallydecrease distance (or size) of pressure effects
Unbound Sandstone,Regional Dip (0° dip)
(kh=10 mD)
DomalSandstone‐Limestone
(kh=100 mD)
(kh=1000 mD)
operationa
lgeological

General Observations
Two questionsHow does reservoir performance change as a function of injection volumes & rates?How does a reservoir respond as a function of time when injection stops?
Impact of operational variables…• Reservoir response varies with amount of injected CO2
1. Size of CO2 Plume—rapid growth during injection; slower growth post injection2. Size of Pressure Plume—rapid growth during injection; reaches maximum and decays post3. Change in Pressure over Time—rapid growth during injection; rapid decline post injection
• Potential to exceed some pressure thresholds depends on size of injection
Impact of geologic variables…• Reservoir response varies with geologic type
• Rate of CO2 plume growth depends on reservoir porosity
• Potential to exceed some pressure thresholds depends on reservoir permeability
Impact of geologic variables is on the same order as operational variables.

Induced Seismicity
Tool & Method Development
• Developed a probabilistic seismic hazard assessment (PSHA) tool for induced seismicity– adapted widely accepted conventional PSHA approach
• Extending development to assess damage and nuisance (felt event) risks– demonstration application to realistic CO2 injection scenarios based
on In Salah (Algeria)
General Trends & Relationships
• Rates of occurrence and sizes of earthquakes are determined by tectonic stress and reservoir pressure– sensitive to fault permeability and a few key parameters in the law
governing the evolution of fault frictional strength
• Risk of CO2 leakage may be coupled to slip on faults during earthquakes
Hazard calculationSIMRISK
Eq. simulationRSQSim
Ground motionSYNHAZ
Flow model:P(x,t)
crustal modelstress & fault params
EqCatalog
Ground motion
Hazard Curve
Eq. source params
1.5
2.0
2.5
3.0
3.5
4.0
4.5
480 500 520 540 560years
1.5
2.0
2.5
3.0
3.5
4.0
4.5
520 520 521 521 522years
470‐570 years 520‐522 years
Pore pressure
Seismicity

High costs and large uncertainties suggest a phased approach to seismicity management
Phase Characterization & Monitoring
Modelling Risk Assessment
• Site‐screening • Regional stress estimates
• Fault density estimates
• Back‐of‐the‐envelope
• Red‐flags• Atlas
• Pre‐injection • 3D seismic• XLOTs• FMI• Limited
microseismic
• Simple models • Qualitative Assessments
• PSHA
• Injection & PISC • 4D seismic• Full microseismic
• Sophisticated models
• Traffic‐light• PSRA
‐‐ Cost/benefit of additional methods assessed based on evolving project conditions.‐‐ Baselines are important.‐‐ Timely processing and interpretation of data are important.

Measured
ETAS ForecastEvents / Da
y
Days 80000
Empirical short‐term forecasting tool helps determine risk of induced seismicity.
Ref: Bachmann et al, 2014
• Based on Gutenburg‐Richter and Omori laws
• Originally an aftershock models• Reads a seismic event catalog
• Typically used for a window of a few days.
• Would complement a stoplight protocol
• Forecasts seismic frequency

NRAP future focus is on the incorporation of monitoring and mitigation.
• Optimizes subsurface monitoring design for a specified CCS site
• Finds monitoring design that yields minimum expected time to first detection of CO2 leakage (E[TFD])
– Subsurface monitoring design includes well locations and type/depth of sensors deployed in each well
– Subject to constraints like budget, number of wells, physical limitations
• Uses a collection of subsurface realizations
• User defined alarm and inference criteria
– What causes sensor to alarm– How many sensors imply a leak
• Uses simulated annealing to check for optimum design
Leakage Signature
InputsModel Output
Defines criteria to infer leakage has occurred
Provide data needed to calculate time to first detection
SimulatedAnnealing
Searches for optimal monitoring designs
SubsurfaceSimulations
Optimal monitoring designs

Acknowledgements
This presentation was prepared with contributions from several outstanding researchers on the NRAP team, including:
Corinne Bachmann, LBNLJens Birkholzer, LBNLChris Brown, PNNLSusan Carroll, LLNLAbdullah Cihan, LBNLDiana Bacon, PNNLTom Daley, LBNLRobert Dilmore, NETLJason Gastelum, PNNLNik Huerta, NETLElizabeth Keating, LANLSeth King, NETLErnest Lindner, NETLRajesh Pawar, LANLPhil Stauffer, LANLVeronika Vasylkivska, NETLJosh White, LLNL

Thank you.
• Integrated Assessment Model – CO2‐PENS• Reservoir Analysis Tool• Wellbore ROM Tool• NSealR Model• Coupled High Plains Aquifer Tool• Coupled Edwards Aquifer Tool• Simulation Tools for Optimization and Risk Management (STORM)• Empirical Seismic Hazard Analysis Tool• Probabilistic Seismic Risk Assessment Tool (RISKCAT)• Ground Motion Predictive Tool
www.edx.netl.doe.gov/nrap
NRAP Products for planned August release.
More information at:

NSealR Computer Code• Computes two‐phase (brine and supercritical CO2) flow and
Includes fluid thermal/pressure dependence• Module to compute leakage through a Barrier (Seal) Layer• Uses inputs of pressure and saturation at the reservoir/seal
interface• Various levels of complexity to model barrier response• Accounts for effective stress dependence of aperture
In Situ Stress
Aperture
Orientation / Trend
Areal Density
Center
Vertical Fracture
Equivalent Permeability= Fracture Flow in Cell Area

Wellbore ROMs address vertical migration for a variety of conditions.
• Models migration of brine and/or CO2outside of storage reservoir
• Inputs of reservoir pressures and saturations
• Predicts flowrate into thief zone and groundwater aquifer
• Incorporates chemistry to identify flowrate changes as a function of time

Groundwater ROMs predict volume of aquifer impacted.
• Inputs migration rate and concentrations from wellbore or similar models• Includes two different end member aquifer types• Incorporate flow and chemistry• Metrics include: pH, TDS, metals concentrations, organics concentrations
7.0 7.5 8.0 8.5 9.0 9.5 10.0
0.2
0.4
0.6
0.8
1.0
plume volume (log10)
cum
ulat
ive
prob
abilit
y
<66 kTon66−142kTon>142 kTon
pH plume volume (log 10 m3)
Cumulative prob
ability
• Shallow aquifer pH plume volume, considering uncertain aquifer parameters and leakage scenarios
• Note higher uncertainty for small leaks
CO2 Leak

Other preliminary induced seismicity codes incorporate seismic hazard and ground motion.
Risk Curves
Recorded seismicity
Seismicity catalog Seismicity catalog Simulated seismicity
Stochastichybrid modeling
Fragility FunctionsFragility
Functions
RISKCat
Earth model
Empirical GMPEs
Empirical Green’s fns
Numerical modeling
Ground motion functions Ground motion functions Analytical Green’s fns
Hazard Curves
Hazard Calculation- calculate ground motions- ground motion statistics- sample gm in time windows
Hazard Calculation- calculate ground motions- ground motion statistics- sample gm in time windows
• Uses probabilistic seismic hazards assessment (PSHA)• Incorporated multiple sources and ground motion realizations• Coupled hydro‐mechanical modeling• Injection‐induced incremental hazard is calculated
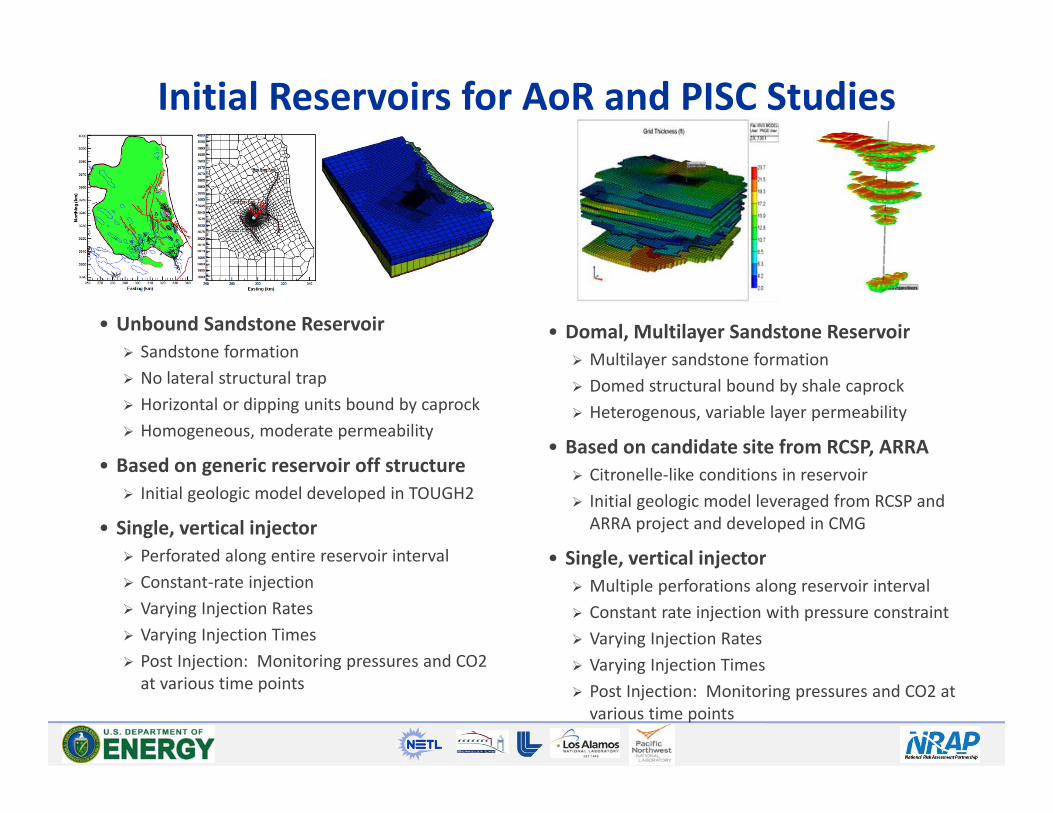
Initial Reservoirs for AoR and PISC Studies
• Unbound Sandstone Reservoir Sandstone formation No lateral structural trap Horizontal or dipping units bound by caprock Homogeneous, moderate permeability
• Based on generic reservoir off structure Initial geologic model developed in TOUGH2
• Single, vertical injector Perforated along entire reservoir interval Constant‐rate injection Varying Injection Rates Varying Injection Times Post Injection: Monitoring pressures and CO2 at various time points
• Domal, Multilayer Sandstone Reservoir Multilayer sandstone formation Domed structural bound by shale caprock Heterogenous, variable layer permeability
• Based on candidate site from RCSP, ARRA Citronelle‐like conditions in reservoir Initial geologic model leveraged from RCSP and ARRA project and developed in CMG
• Single, vertical injector Multiple perforations along reservoir interval Constant rate injection with pressure constraint Varying Injection Rates Varying Injection Times Post Injection: Monitoring pressures and CO2 at various time points

NRAP Value Proposition 1:Science‐based prediction can build confidence in expected storage security by
quantifying system performance for a range of conditions.
NRAP Goal—to predict storage‐site behavior from reservoir to receptor and from injection through long‐term storage…
…in order to quantifykey storage‐security relationships for
various site characteristics.
• Storage‐security relationships are a function of the behavior of the coupled storage‐site system
• reservoir behavior (e.g., evolution of CO2 & pressure plumes)
• nature of seal and potential fastpaths (e.g., fractures, wells)• response of receptors (e.g., aquifer)
• Storage‐site characteristics vary & are incompletely known
• uncertainty in characteristics leads to uncertainty in behavior
Simulated distributions of CO2 over time(adapted from BPM on Risk Analysis; DOE/NETL‐2011/1459)
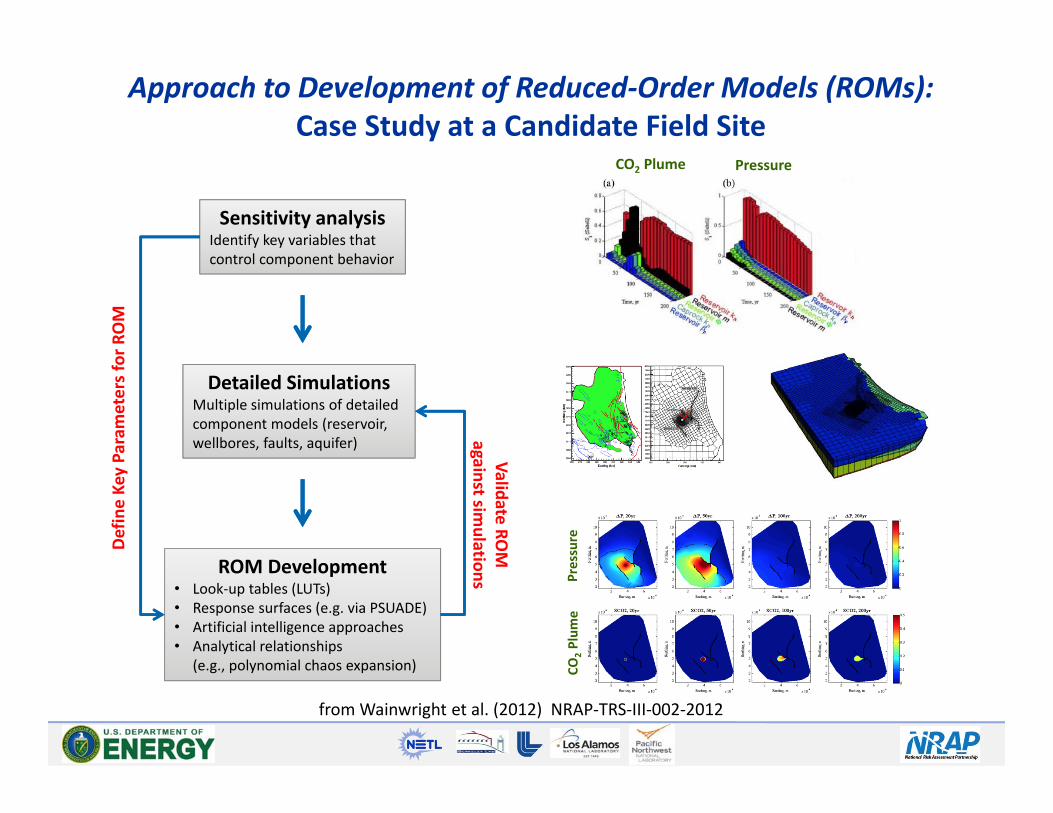
Approach to Development of Reduced‐Order Models (ROMs):Case Study at a Candidate Field Site
Detailed SimulationsMultiple simulations of detailed component models (reservoir, wellbores, faults, aquifer)
Sensitivity analysisIdentify key variables that control component behavior
ROM Development• Look‐up tables (LUTs)• Response surfaces (e.g. via PSUADE)• Artificial intelligence approaches • Analytical relationships
(e.g., polynomial chaos expansion)
Validate ROM
against simulations Pr
essure
CO2Plum
e
PressureCO2 Plume
Define Ke
y Parameters for R
OM
from Wainwright et al. (2012) NRAP‐TRS‐III‐002‐2012