national perfomance report 2014–15: urban water utilities · southwest western australia, ... the...
TRANSCRIPT

NATIONAL PERFORMANCE REPORT 2014–15 // URBAN WATER UTILITIES 17
1 Introduction
1.1 Context and overviewThe National performance report 2014–15: urban water utilities (2015 Urban NPR) is the tenth in the series of national performance reports. It is the second to be produced by the Bureau of Meteorology, in conjunction with State and Territory governments and the Water Services Association of Australia.
The Urban NPR supports the commitments made by States and Territories under the National Water Initiative (NWI) to report publicly and independently on the performance of water utilities (NWI clauses 75–76).
The 2015 Urban NPR compares the performance of 87 water utilities providing urban water services to over 20 million people across all of Australia. The number of utilities reporting on urban water services in 2014–15 increased from that of 2013–14. This is because of changes to Queensland State regulations that now require all utilities with over 10,000 connections to report through the NPR process. In order to compare reports between years, analysis has been undertaken in a manner that mitigates the impacts of these changes. In all cases, the assumptions or methods used are clearly noted.
This Part A of the report provides commentary and analysis for key indicators that apply to retail/distribution utilities (the capital cities analysis in Chapter 2 includes performance data for bulk water suppliers). Part B of the report contains data for the full set of over 180 indicators that are reported on by urban water utilities and bulk water suppliers for all reporting years.
The analysis and commentary provides a context for each indicator, discusses changes in reporting methodologies, and highlights trends within and/or between different utility groups. The utilities are grouped according to their number of connections (see ‘Common abbreviations and explanatory notes’). The 2015 Urban NPR provides summary tables covering all utility groups. Commentary is limited to a discussion of the 100,000+ utility size grouping only.
The commentary and analysis contained in this report is not intended to be a comprehensive explanation of every reported indicator. It has been prepared to explain some of the more apparent trends or differences between years and utilities. Much of the information is sourced from publicly available documents, such as annual reports, regulatory decisions, and the utilities’ websites.
1.2 ReportingThe 87 urban water service providers that have contributed data for the 2015 Urban NPR are listed in Appendix C. A summary of utility type by jurisdiction is shown in Table 1.1.
The 2015 Urban NPR includes nine utilities that reported in Queensland for the first time in the 2014–15 year as a result of changes to regulations at State level. These are:
• Bundaberg Regional Council
• Western Downs Regional Council
• Gladstone Regional Council
• Redland City Council
• Southern Downs Regional Council
• Whitsunday Regional Council
• Cassowary Coast Regional Council
• Central Highlands Regional Council
• Livingston Shire Council.

18 NATIONAL PERFORMANCE REPORT 2014–15 // URBAN WATER UTILITIES
INTR
OD
UC
TIO
N The 87 urban water service providers included in this report are comprised of 80 water utilities and councils (collectively referred to as utilities) and 7 bulk water suppliers. Of the 80 utilities, 71 provide both reticulated water supply and sewerage services. The remaining utilities providing only water supply or sewerage services. In summary the breakdown is:
• water supply and sewerage: 71 utilities
• water supply only: 5 utilities
• sewerage only: 4 utilities
• bulk water: 7 suppliers.
Table 1.1 Utilities reporting in the 2015 Urban NPR by size group and jurisdiction
Jurisdiction Bulk utility 100,000+ 50,000–100,000
20,000–50,000
10,000–20,000
Total
Australian Capital Territory 0 1 0 0 0 1
New South Wales 4 2 2 10 14 32
Northern Territory 0 0 1 0 1 2
Queensland 2 4 3 6 7 22
South Australia 0 1 0 0 0 1
Tasmania 0 1 0 0 0 1
Victoria 1 4 5 5 2 17
Western Australia 0 1 0 1 9 11
Total 7 14 11 22 33 87
1.3 Locations of utilitiesThe administrative boundaries of all utilities reporting data through the 2015 Urban NPR are shown in Figure 1.1. Further details about the utilities are available from their respective websites.
Figure 1.1 Organisational boundaries of utilities reporting to the 2015 Urban NPR

19NATIONAL PERFORMANCE REPORT 2014–15 // URBAN WATER UTILITIES
1.4 Key driversThis section discusses some of the key drivers of the water utility performance indicators presented in the 2015 Urban NPR. Rainfall, temperature, utility size, and sources of water are discussed. Many other factors that also affect the results, including network density, soil types, the age and condition of infrastructure, and Government policy and regulation, are not discussed.
1.4.1 Rainfall
Figure 1.2 shows how rainfall has varied from the long-term average across Australia over the past eight years: white shows ‘average’; blue shows ‘above average’; and red shows ‘below average’ rainfall. Weather conditions have been extremely variable over this period in terms of both the average rainfall over time and the distribution of rainfall within each year.
Rainfall deficiencies continued across southern and eastern Australia. This was consistent with longer-term drying trends and the El Niño conditions in the tropical Pacific, experienced across 2014 and 2015 (Bureau 2016).
Annual rainfall trends across the States and Territories in 2014–15 were: average for the Northern Territory, close to average for New South Wales and Western Australia, and drier-than-average for the other States and Territory (Bureau 2016).
Below-average rainfall was recorded across most of Queensland and parts of the Northern Territory’s Top End; Victoria and southeast South Australia; Tasmania; the western half of South Australia and the far southwest of the Northern Territory; and the southwest of Western Australia (Bureau 2016), with some pockets experiencing their lowest rainfall on record, including major urban centres of Melbourne, Townsville, Adelaide, and Perth. These urban centres experienced drier conditions than in 2013–14 when rainfall deciles varied from average to very-much-above average.
Rainfall was above average for the Gascoyne and Pilbara in Western Australia; areas of the Northern Territory stretching from the western Top End, across the central region, through the southeast of the Northern Territory and across northeastern South Australia, into northwestern New South Wales; and also for small parts of the east coast between southeastern Queensland and East Gippsland in Victoria (Bureau 2016).
Annual rainfall was below to very-much-below-average for west-facing parts of southern Australia, including southwest Western Australia, Tasmania, South Australia, and Victoria (Bureau 2016). These areas experienced a decline in rainfall from 2013–14 when rainfall deciles varied from average to very-much-above average.
Rainfall can affect the performance results of utilities in many ways. These include:
• Significant droughts with prolonged periods of low rainfall can stress urban water supply systems. Depending on the severity of the drought, the security of the system, and the availability of climate–independent water sources (such as desalination or recycled water), the utility may need to impose water restrictions in order to conserve water and assure continuity of the water supply.
• Wet or dry conditions can affect demand for outdoor watering, resulting in a change in urban water and recycled water supplied to residents, councils, and golf courses (indicators W12 and W26 relate to residential water supplied and recycled water). Changes in water consumption affect the revenue collected by water utilities, their profitability, and the strength of their water-usage pricing signal.
• Wet or dry conditions can also affect decisions about which water sources to use (W1–W7). For example, persistent dry conditions can trigger thresholds for production from desalination plants or for the use of particular groundwater or recycled water sources, affecting the operating costs of utilities (F11, F12, F13).
• Increased rainfall can result in infiltration of water into sewer systems. This can increase the volume of sewage to be pumped and treated, increasing the operating costs of utilities (F12, F13) and also greenhouse gas emissions from sewage (E12). Additional rainfall and sewer infiltration can also result in additional sewer overflows. This is especially the case during heavy rainfall.

20 NATIONAL PERFORMANCE REPORT 2014–15 // URBAN WATER UTILITIES
INTR
OD
UC
TIO
N
Figure 1.2 Australian 12-month rainfall deciles, 2007–08 to 2014–15. Decile 1 means the lowest 10 per cent of records,
decile 2 the next lowest 10 per cent, and so on, up to decile 10, the highest 10 per cent of records.

21NATIONAL PERFORMANCE REPORT 2014–15 // URBAN WATER UTILITIES
• Extreme wet or dry conditions can cause expansion and shrinking of reactive clay soils in some parts of Australia, resulting in ground movements that can cause an increase in water or sewer main breaks (A8, A14). This is especially the case when conditions fluctuate rapidly from wet to dry or vice versa. In periods of more even rainfall, the soils maintain more even moisture levels, resulting in less ground movement.
1.4.2 Temperature
Figure 1.3 shows the annual maximum temperature deciles for 2014–15, indicating largely above-average to very-much-above-average temperatures across the majority of the country, with a general trend of cooler temperatures from the largely very-much-above-average to highest-on-record maximum temperature deciles recorded in 2013–14.
2015 was Australia’s fifth warmest year on record. This is consistent with general trends of warming over recent years, with eight of Australia’s warmest years on record having occurred in the 14 years since 2002. Only one cooler-than-average year has occurred in the past decade (2011) and the 10-year mean temperature for 2006–2015 was the second highest on record at 0.53 °C above-average, with the highest on record being 2005–2014 (Bureau 2016).
A number of heatwaves and warm spells, important because of their impacts on water use, were experienced across Australia in 2014–15. Most notable were an exceptional autumn heatwave in northern and central Australia in March, an early season spring heatwave in southern Australia in October, and extreme heat for the start of the summer season in much of southeast Australia in December (Bureau 2016).
Figure 1.3 Australian 12-month maximum temperature deciles for 2014–15. Map issued 30 December 2015.

22 NATIONAL PERFORMANCE REPORT 2014–15 // URBAN WATER UTILITIES
INTR
OD
UC
TIO
N There are many relationships between temperature and the performance of utilities. These include:
• The relationship between demand and temperature in particular residential and non-residential outdoor demand. Increased temperature, in particular prolonged periods above long-term averages, can result in increased potable and recycled water supplied to residents, councils, and golf courses (indicators W12, W26, and W27 relate to residential water supplied and recycled water). Changes in water consumption affect the revenue collected by water utilities, their profitability (F3, F24), and the strength of their water-usage pricing signal (F4).
• The relationship between hot weather and an increased risk of bushfires. This risk can result in the deployment of resources to protect water supply catchments and mitigate the impacts of a bushfire should one occur. Such deployments can affect the operating expenditure of a utility (F11, F12, F13), in particular if responding to an actual bushfire event. In addition, temporary water restrictions that ensure the availability of supply to meet firefighting requirements can be implemented during extreme fire weather. Such restrictions can impact on the volume of water supplied by a utility and in turn affect its operating cost and revenue. Should a catchment be burnt, this can impact on water supply due to water quality issues that may require the storage to be taken off-line for some time.
• That extended periods of heat or cold can impact on the quality of water sources and supplies and therefore affect decisions about which water sources are to be used (W1–W7) and the level of the treatment required. For example, a heatwave contributes to the decline in dissolved oxygen levels within a waterbody and can trigger the need to supply water from an alternative source or increase the cost of treatment, in turn affecting the operating costs of utilities (F11, F12, F13).
• The relationship between temperature and the quality of treated water. In particular, biological processes are sensitive to extremes of heat or cold as well as rapid fluctuations in temperature. Such events can have important consequences for the quality of water supplied (H indicators) and the operational costs of a utility (F11, F12, F13).
• Extended hot conditions give rise to dry soil conditions. Consequently, many plant species will seek out moisture, and their roots can enter the sewer system causing blockages and/or breaks (A14, A15) as well as increasing water main breaks (A8).
1.5 Utility sizeWhile many factors influence performance, there is a relationship between the size of the utility’s customer base (in terms of the number of connections) and its performance on a number of indicators. This relationship may be causal, coincidental, or due to a related matter (for example, larger utilities are subject to price regulation while many smaller utilities are not). Utility size also has a role in establishing economies of scale; however, such economies are also affected by the size of the area serviced by a utility and the density of the population within it.
1.6 Sources of waterThe sources of water used by a utility and the geographical relationship between the source and the urban centre it supplies are two important drivers of performance. The combination and interaction of these drivers serve to create widely varying engineering, operational, and social challenges for each utility across the country. The sources of water available to a utility are an important driver of a number of key performance indicators. For example, the cost of treating water to an acceptable standard and supplying it to users affect the revenue collected by water utilities, their profitability (F3, F24), and the strength of their water-usage pricing signal (F4).
Traditionally, Australians have relied on surface and, to a lesser extent, groundwater sources to meet their urban consumptive needs. Increased demand driven by factors such as population growth and changes to the reliability of existing sources (predominantly driven by water quality and climatic variability) have resulted in a need to further develop water supply sources to ensure supply is maintained. Financial, environmental, and social considerations mean a reduced number of opportunities exist to develop more of these traditional supply sources. As a result, utilities and bulk water suppliers across the country are developing non-traditional (alternative) supply sources such as desalination and recycling, while continuing to explore options for stormwater and rainwater harvesting.

23NATIONAL PERFORMANCE REPORT 2014–15 // URBAN WATER UTILITIES
This diversification has important consequences for the performance of urban water utilities. It impacts upon how much it costs to treat water to an acceptable standard and supply multiple water types to end-users while meeting regulatory requirements.
For example, water from a storage in a protected (or ‘closed’) catchment is typically of a higher quality than that of an ‘open’ catchment and therefore requires less treatment, hence reducing the cost of supply. Groundwater sources can also vary significantly. The type and depth of an aquifer as well as the quality of the water it contains each have a significant impact on the extraction and treatment of the water. Urban water users supplied from recycled sources typically require a dual-pipe supply system to separate the recycled water from potable water, and thereby incur a greater infrastructure cost.
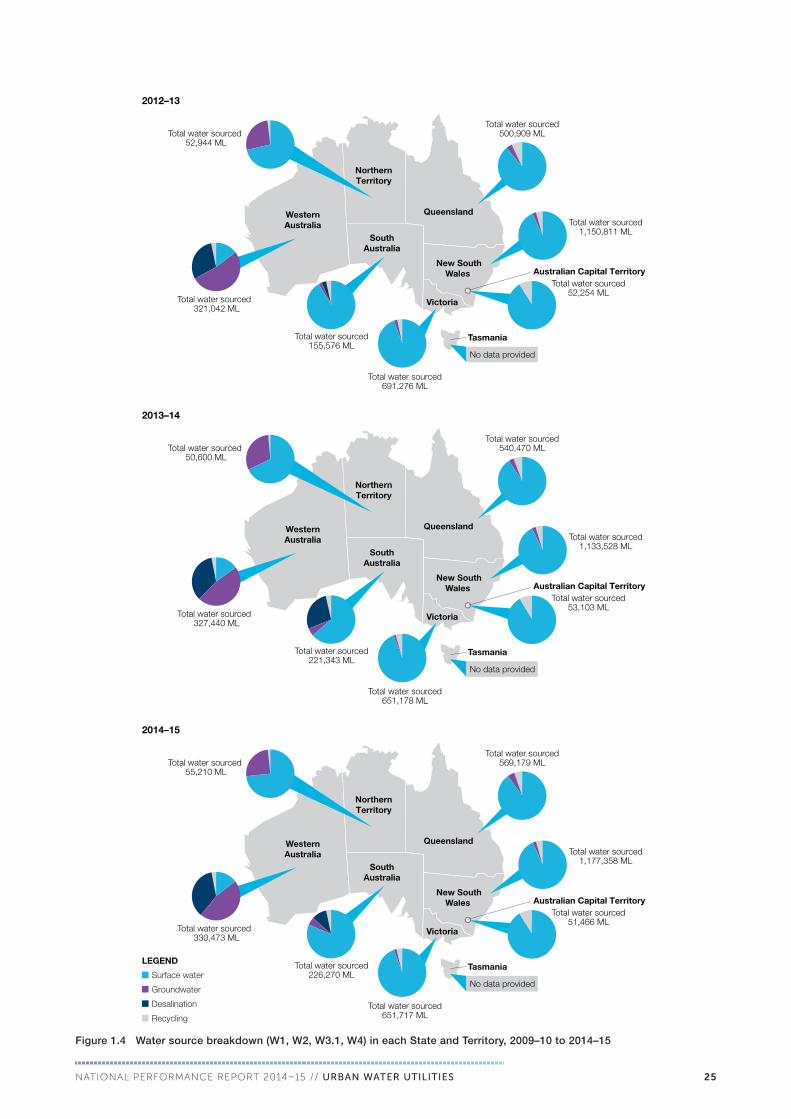
Figure 1.4 shows the breakdown of sourced water for each State and Territory for utilities reporting in a given year. These charts show all results for all reporting utilities for each year. Therefore, care should be taken when comparing the total source water volumes between years. Additionally, differing interpretations of the definition of Indicator W4 have most likely led to the under reporting of recycled water sourced volumes. By definition, W4 only includes the volume of recycled water supplied that has been directly substituted for potable supply. That is, had the recycled water not been available potable water would have been used to meet the demand. Because of the observed issues in interpreting this definition the total volume of recycled water supplied (W26) is preferred and will replace W4 in future Urban NPR reporting. By way of comparison, in this reporting year, the national total volume of recycled water sourced (W4) was 126,359 ML while the total volume of recycled water supplied (W26) was 261,525 ML, the bulk of which was for agricultural irrigation.
The charts show the following:
• Water sourced from surface water (W1), from rivers, streams, and dams, is the dominant water source in all States and Territories except Western Australia, where most of the water supplied is sourced from groundwater (W2).
• The importance of desalination (W3.1) as a reliable source of water continues to grow, in particular for Western Australia and South Australia, where constraints on traditional water sources have driven diversification. In 2013–14, desalination within these two States supplied 36 per cent and 10 per cent respectively of the reported total water sourced. This represents a 1 per cent increase in the percentage of total water sourced from desalination in Western Australia but a drop of 18 per cent in South Australia, where the availability of surface water within the year reduced the states reliance on desalination.
• Desalination in other States remains minimal with plants in New South Wales Victoria and Queensland operating in maintenance or ‘stand-by’ modes.

24 NATIONAL PERFORMANCE REPORT 2014–15 // URBAN WATER UTILITIES
INTR
OD
UC
TIO
N
WesternAustralia
NorthernTerritory
Queensland
SouthAustralia
New SouthWales
Tasmania
Total water sourced 52,515 ML
2009–10
Victoria
Total water sourced404,517 ML
Total water sourced 862,594 ML
Total water sourced 49,564 ML
Total water sourced 587,588 ML
Total water sourced167,607 ML
Total water sourced 288,871 ML
Australian Capital Territory
No data provided
WesternAustralia
NorthernTerritory
Queensland
SouthAustralia
New SouthWales
Tasmania
No data provided
Total water sourced 46,727 ML
2010–11
Victoria
Total water sourced420,255 ML
Total water sourced 1,057,339 ML
Total water sourced 45,250 ML
Total water sourced 577,718 ML
Total water sourced152,403 ML
Total water sourced 286,230 ML
Australian Capital Territory
WesternAustralia
NorthernTerritory
Queensland
SouthAustralia
New SouthWales
Tasmania
No data provided
Total water sourced 51,496 ML
2011–12
Victoria
Total water sourced481,587 ML
Total water sourced 1,179,316 ML
Total water sourced 46,397 ML
Total water sourced 599,459 ML
Total water sourced142,975 ML
Total water sourced 289,045 ML
Australian Capital Territory
Surface water
Groundwater
Desalination
Recycling
LEGEND
25NATIONAL PERFORMANCE REPORT 2014–15 // URBAN WATER UTILITIES
Figure 1.4 Water source breakdown (W1, W2, W3.1, W4) in each State and Territory, 2009–10 to 2014–15
Tasmania
WesternAustralia
NorthernTerritory
Queensland
SouthAustralia
New SouthWales
No data provided
Total water sourced 52,944 ML
2012–13
Victoria
Total water sourced500,909 ML
Total water sourced 1,150,811 ML
Total water sourced 52,254 ML
Total water sourced 691,276 ML
Total water sourced155,576 ML
Total water sourced 321,042 ML
Australian Capital Territory
WesternAustralia
NorthernTerritory
Queensland
SouthAustralia
New SouthWales
Tasmania
No data provided
Total water sourced 50,600 ML
2013–14
Victoria
Total water sourced540,470 ML
Total water sourced 1,133,528 ML
Total water sourced 53,103 ML
Total water sourced 651,178 ML
Total water sourced221,343 ML
Total water sourced 327,440 ML
Australian Capital Territory
Victoria
WesternAustralia
NorthernTerritory
Queensland
SouthAustralia
New SouthWales
Tasmania
No data provided
Total water sourced 55,210 ML
2014–15
Total water sourced569,179 ML
Total water sourced 1,177,358 ML
Total water sourced 51,466 ML
Total water sourced 651,717 ML
Total water sourced226,270 ML
Total water sourced 330,473 ML
Australian Capital Territory
Surface water
Groundwater
Desalination
Recycling
LEGEND