national - mclaughlin &...
TRANSCRIPT

National Likely General Election Voter Survey
August 28th, 2017 On the web
www.mclaughlinonline.com

More Likely/Less Likely Re-Elect your Member of Congress: “Has increased the debt ceiling to spend more money the government
doesn’t have, without any new constraints on future spending.”
23
12 11
62
18
45
96
0
10
20
30
40
50
60
70
M OR E
LIKELY
M uch Smwt LESS
LIKELY
Smwt M uch N O
D IF F .
D K/ R ef.
ML LL ND
East 22 64 7
Midwest 22 62 10
South 26 59 8
West 19 65 11
Cont. Obama Pols. 32 52 10
Change Direction 17 71 7
Approve – Trump 26 64 7
Disapprove – Trump 20 61 12
Favorable – Trump 26 64 6
Unfavorable– Trump 21 62 11
Vote Pres. 2016 – Clinton 27 54 12
Vote Pres. 2016 – Trump 20 69 6
Vote Cong. 2018 – GOP 23 68 6
Vote Cong. 2018 – DEM 26 56 13
Vote Cong. 2018 - UND 11 65 10
Republican 24 66 5
Democrat 28 56 11
Independent 15 65 12
Liberal 36 49 10
Moderate 21 60 12
Conservative 16 74 6
No College Degree 19 64 11
College Graduate 28 59 8
White 19 67 9
African- American 30 48 12
Hispanic 35 54 5
Under 55 29 55 11
Over 55 13 75 6
Married 25 63 9
Single 28 55 11
Men 29 58 10
Women 18 66 9
National – August 2017
Center for Security Policy/Eagle Forum

More Likely/Less Likely Re-Elect your Member of Congress: “Is bailing out the health insurance companies without repealing
Obamacare.”
29
14 15
53
15
38
118
0
10
20
30
40
50
60
M OR E
LIKELY
M uch Smwt LESS
LIKELY
Smwt M uch N O
D IF F .
D K/ R ef.
ML LL ND
East 33 53 9
Midwest 24 58 10
South 29 53 10
West 30 46 13
Cont. Obama Pols. 45 36 11
Change Direction 16 70 8
Approve – Trump 26 62 8
Disapprove – Trump 32 45 14
Favorable – Trump 27 62 7
Unfavorable– Trump 32 45 13
Vote Pres. 2016 – Clinton 39 36 14
Vote Pres. 2016 – Trump 21 67 7
Vote Cong. 2018 – GOP 24 66 6
Vote Cong. 2018 – DEM 39 39 15
Vote Cong. 2018 - UND 11 56 14
Republican 26 64 5
Democrat 41 39 13
Independent 19 57 14
Liberal 48 34 11
Moderate 28 49 14
Conservative 16 72 7
No College Degree 27 54 11
College Graduate 32 52 11
White 25 59 10
African- American 44 30 11
Hispanic 40 45 9
Under 55 34 48 12
Over 55 20 62 9
Married 28 56 10
Single 35 43 12
Men 36 50 9
Women 23 55 12
National – August 2017
Center for Security Policy/Eagle Forum

More Likely/Less Likely Re-Elect your Member of Congress: “Failed to stop the Obama policy of not only recruiting transgender persons to the U.S. Military, but paying for hormone treatments and full sex change surgeries, plus salary and benefits while they are in “transition” and unable
to serve.”
28
16
12
52
16
36
13
7
0
10
20
30
40
50
60
M OR E
LIKELY
M uch Smwt LESS
LIKELY
Smwt M uch N O
D IF F .
D K/ R ef.
ML LL ND
East 31 51 11
Midwest 26 51 15
South 29 53 11
West 28 52 14
Cont. Obama Pols. 44 33 15
Change Direction 17 71 8
Approve – Trump 24 65 8
Disapprove – Trump 33 40 18
Favorable – Trump 25 65 7
Unfavorable– Trump 33 40 17
Vote Pres. 2016 – Clinton 39 36 15
Vote Pres. 2016 – Trump 19 69 8
Vote Cong. 2018 – GOP 21 70 6
Vote Cong. 2018 – DEM 39 36 17
Vote Cong. 2018 - UND 15 44 20
Republican 22 69 5
Democrat 39 37 17
Independent 23 51 16
Liberal 52 30 30
Moderate 27 46 46
Conservative 13 74 74
No College Degree 25 54 54
College Graduate 32 49 49
White 24 57 57
African- American 38 34 34
Hispanic 44 44 44
Under 55 34 46 46
Over 55 19 62 62
Married 26 57 57
Single 37 43 43
Men 33 51 51
Women 25 53 53
National – August 2017
Center for Security Policy/Eagle Forum

More Likely/Less Likely Re-Elect your Member of Congress: “Refuses to repeal Obamacare mandates and taxes to reduce the cost of
health care.”
36
20
16
50
13
36
8 7
0
10
20
30
40
50
60
M OR E
LIKELY
M uch Smwt LESS
LIKELY
Smwt M uch N O
D IF F .
D K/ R ef.
ML LL ND
East 38 48 8
Midwest 32 50 8
South 36 51 6
West 38 47 10
Cont. Obama Pols. 58 28 7
Change Direction 18 71 5
Approve – Trump 28 64 4
Disapprove – Trump 45 37 11
Favorable – Trump 29 63 3
Unfavorable– Trump 44 38 10
Vote Pres. 2016 – Clinton 51 30 9
Vote Pres. 2016 – Trump 23 68 4
Vote Cong. 2018 – GOP 24 69 3
Vote Cong. 2018 – DEM 53 30 10
Vote Cong. 2018 - UND 19 51 16
Republican 26 66 2
Democrat 51 34 9
Independent 30 51 12
Liberal 63 25 25
Moderate 34 43 43
Conservative 18 75 75
No College Degree 31 53 53
College Graduate 42 45 45
White 31 55 55
African- American 46 33 33
Hispanic 46 41 41
Under 55 41 44 44
Over 55 28 60 60
Married 37 54 54
Single 40 41 41
Men 40 49 49
Women 32 50 50
National – August 2017
Center for Security Policy/Eagle Forum

More Likely/Less Likely Re-Elect your Member of Congress: “Voted to continue government spending including funding Planned
Parenthood abortions, without building the border wall on the Mexican border, defunding National Public Radio or trying again to repeal
Obamacare.”
39
22
17
47
14
34
9
5
0
5
10
15
20
25
30
35
40
45
50
M OR E
LIKELY
M uch Smwt LESS
LIKELY
Smwt M uch N O
D IF F .
D K/ R ef.
ML LL ND
East 41 48 8
Midwest 38 46 10
South 37 50 7
West 41 44 11
Cont. Obama Pols. 62 27 6
Change Direction 20 68 8
Approve – Trump 26 64 7
Disapprove – Trump 52 32 10
Favorable – Trump 27 64 7
Unfavorable– Trump 52 34 9
Vote Pres. 2016 – Clinton 58 27 8
Vote Pres. 2016 – Trump 23 66 7
Vote Cong. 2018 – GOP 23 69 6
Vote Cong. 2018 – DEM 58 28 8
Vote Cong. 2018 - UND 25 41 22
Republican 25 67 5
Democrat 54 32 10
Independent 36 45 12
Liberal 67 24 6
Moderate 39 42 12
Conservative 18 71 8
No College Degree 34 50 10
College Graduate 44 44 8
White 35 52 9
African- American 45 35 11
Hispanic 55 36 4
Under 55 44 41 10
Over 55 30 58 6
Married 39 52 6
Single 41 41 11
Men 43 47 7
Women 35 48 10
National – August 2017
Center for Security Policy/Eagle Forum

More Likely/Less Likely Re-Elect your Member of Congress: “Failed to investigate President Obama and Secretary Clinton’s well
documented collusion with the Russians.”
27
17
10
47
16
31
18
8
0
5
10
15
20
25
30
35
40
45
50
M OR E
LIKELY
M uch Smwt LESS
LIKELY
Smwt M uch N O
D IF F .
D K/ R ef.
ML LL ND
East 29 45 20
Midwest 27 46 18
South 28 49 15
West 23 46 23
Cont. Obama Pols. 40 30 21
Change Direction 18 65 13
Approve – Trump 26 60 10
Disapprove – Trump 29 34 26
Favorable – Trump 26 61 9
Unfavorable– Trump 29 35 26
Vote Pres. 2016 – Clinton 34 31 23
Vote Pres. 2016 – Trump 22 64 10
Vote Cong. 2018 – GOP 24 62 10
Vote Cong. 2018 – DEM 34 33 23
Vote Cong. 2018 - UND 10 41 32
Republican 27 60 9
Democrat 34 37 21
Independent 18 45 25
Liberal 47 27 20
Moderate 23 43 23
Conservative 16 67 11
No College Degree 25 48 18
College Graduate 30 45 18
White 24 51 18
African- American 28 32 22
Hispanic 41 40 15
Under 55 32 43 18
Over 55 17 54 19
Married 25 52 18
Single 33 40 18
Men 34 46 15
Women 21 47 21
National – August 2017
Center for Security Policy/Eagle Forum

More Likely/Less Likely Re-Elect your Member of Congress: “Failed to support President Trump’s “more careful vetting” of immigrants in
order to protect the American people, especially against immigrants from
areas with a strong terrorist presence.”
38
2018
46
13
33
107
0
5
10
15
20
25
30
35
40
45
50
M OR E
LIKELY
M uch Smwt LESS
LIKELY
Smwt M uch N O
D IF F .
D K/ R ef.
ML LL ND
East 41 49 9
Midwest 37 45 9
South 36 48 8
West 38 42 15
Cont. Obama Pols. 58 26 11
Change Direction 21 68 6
Approve – Trump 29 62 5
Disapprove – Trump 47 32 14
Favorable – Trump 29 63 5
Unfavorable– Trump 47 32 13
Vote Pres. 2016 – Clinton 53 27 12
Vote Pres. 2016 – Trump 24 67 5
Vote Cong. 2018 – GOP 26 66 4
Vote Cong. 2018 – DEM 53 28 14
Vote Cong. 2018 - UND 25 41 18
Republican 29 63 3
Democrat 51 31 13
Independent 32 46 14
Liberal 64 23 9
Moderate 36 40 15
Conservative 20 70 5
No College Degree 33 50 10
College Graduate 44 42 10
White 34 51 9
African- American 42 27 16
Hispanic 53 37 4
Under 55 43 40 10
Over 55 27 58 9
Married 38 51 8
Single 40 38 12
Men 41 45 9
Women 35 47 10
National – August 2017
Center for Security Policy/Eagle Forum

Less Likely/Much Less Tot Rep Dem Ind Vote
DJT Mod Cons
App.
DJT
Disapp.
DJT
Under
55
Over
55 Men Women
Has increased the debt ceiling to spend more money the government doesn’t have, without any new constraints on future spending.
62/45 66/53 56/34 65/48 69/55 60/40 74/60 64/49 61/41 55/37 75/56 58/39 66/49
Is bailing out the health insurance companies without repealing Obamacare.
53/38 64/53 39/21 57/43 67/55 49/33 72/58 62/49 45/28 48/32 62/49 50/37 55/39
Failed to stop the Obama policy of not only recruiting transgender persons to the U.S. Military, but paying for hormone treatments and full sex change surgeries, plus salary and benefits while they are in “transition” and unable to serve.
52/36 69/55 37/18 51/36 69/55 46/28 74/60 65/50 40/23 46/29 62/48 51/33 53/38
Refuses to repeal Obamacare mandates and taxes to reduce the cost of health care.
50/36 66/57 34/17 51/37 68/58 43/28 75/62 64/53 37/21 44/30 60/48 49/35 50/38
Voted to continue government spending including funding Planned Parenthood abortions, without building the border wall on the Mexican border, defunding National Public Radio or trying again to repeal Obamacare.
47/34 67/55 32/15 45/32 66/54 42/24 71/60 64/51 32/18 41/28 58/44 47/32 48/35
Failed to investigate President Obama and Secretary Clinton’s well documented collusion with the Russians.
47/31 60/45 37/17 45/31 64/50 43/24 67/51 60/46 34/17 43/24 54/42 46/31 47/31
Failed to support President Trump’s “more careful vetting” of immigrants in order to protect the American people, especially against immigrants from areas with a strong terrorist presence.
46/33 63/51 31/14 46/35 67/55 40/26 70/57 62/51 32/17 40/27 58/44 45/30 47/36
If you knew each of the following statements about your Member of Congress were true, would each make you more likely or less likely to vote to re-elect them in the November 2018 election for U.S .Congress? If it would make no difference, just say so.
9
National – August 2017
Center for Security Policy/Eagle Forum

Tot Rep Dem Ind Vote
DJT Mod Cons
App.
DJT
Disapp.
DJT
Under
55
Over
55 Men
Wo-
men
Increased Debt Ceiling 25 16 31 27 16 28 18 15 35 25 25 23 26
Refuses to Repeal Obamacare 20 31 13 18 31 16 26 32 10 22 18 24 18
Gov’t Spending/No Wall 11 15 8 11 15 10 14 16 7 12 10 13 110
Bailout Health Ins. Cos. 9 10 9 7 9 8 9 8 9 9 8 9 8
Not Supp. Trump/Vetting 8 9 8 8 11 9 11 9 7 7 10 7 9
Transgender/Military 5 6 6 4 6 5 5 6 5 5 6 5 5
Obama/Clinton/Russia Fail 5 6 5 4 6 5 5 7 3 4 6 6 4
Unsure 16 6 22 21 6 20 12 7 23 16 17 13 19
Which of the following would make you LEAST likely vote to re-elect your Member of Congress in the November 2018 election for U.S. Congress? 1. Refuses to repeal Obamacare mandates and taxes to reduce the cost of health care.
2. Has increased the debt ceiling to spend more money the government doesn’t have, without any new constraints on future spending. 3. Voted to continue government spending including funding Planned Parenthood abortions, without building the border wall on the Mexican border, defunding National
Public Radio or cutting taxes to create jobs. 4. Is bailing out the health insurance companies without repealing Obamacare.
5. Failed to investigate President Obama and Secretary Clinton’s well documented collusion with the Russians. 6. Failed to support President Trump’s “more careful vetting” of immigrants in order to protect the American people, especially against immigrants from areas with a strong
terrorist presence. 7. Failed to stop the Obama policy of not only recruiting transgender person to the U.S. Military, but paying for hormone treatments and full sex change surgeries, plus salary
and benefits while they are in “transition” and unable to serve.
10
National – August 2017
Center for Security Policy/Eagle Forum
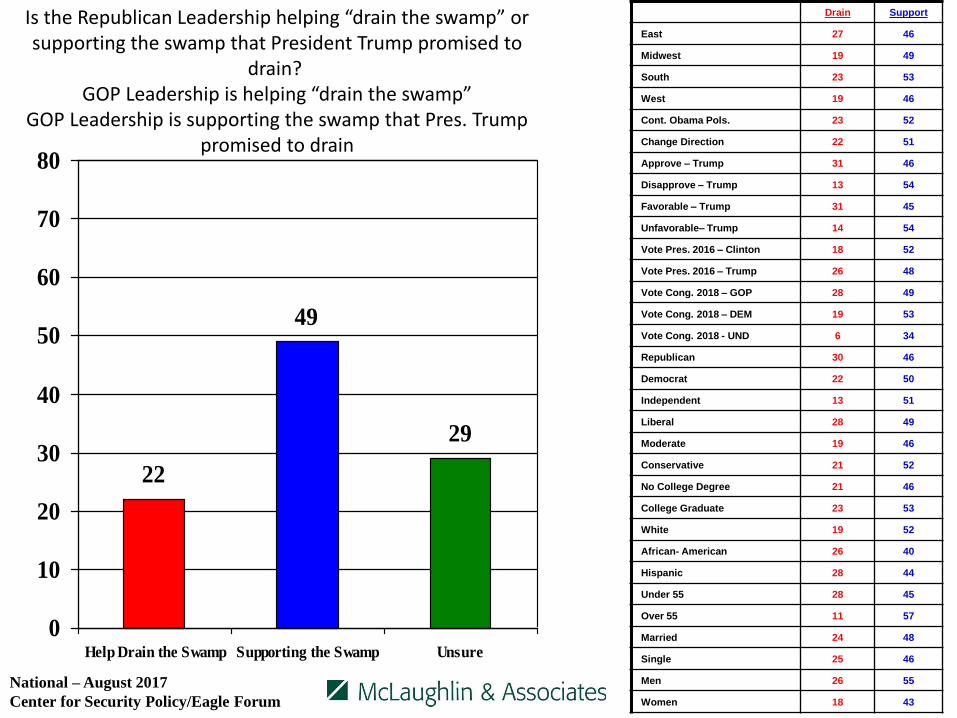
Is the Republican Leadership helping “drain the swamp” or supporting the swamp that President Trump promised to
drain? GOP Leadership is helping “drain the swamp”
GOP Leadership is supporting the swamp that Pres. Trump promised to drain
22
49
29
0
10
20
30
40
50
60
70
80
Help Drain the Swamp Supporting the Swamp Unsure
Drain Support
East 27 46
Midwest 19 49
South 23 53
West 19 46
Cont. Obama Pols. 23 52
Change Direction 22 51
Approve – Trump 31 46
Disapprove – Trump 13 54
Favorable – Trump 31 45
Unfavorable– Trump 14 54
Vote Pres. 2016 – Clinton 18 52
Vote Pres. 2016 – Trump 26 48
Vote Cong. 2018 – GOP 28 49
Vote Cong. 2018 – DEM 19 53
Vote Cong. 2018 - UND 6 34
Republican 30 46
Democrat 22 50
Independent 13 51
Liberal 28 49
Moderate 19 46
Conservative 21 52
No College Degree 21 46
College Graduate 23 53
White 19 52
African- American 26 40
Hispanic 28 44
Under 55 28 45
Over 55 11 57
Married 24 48
Single 25 46
Men 26 55
Women 18 43
National – August 2017
Center for Security Policy/Eagle Forum

Is it time for new Republican Leadership in Congress which would mean replacing Senate
Leader Mitch McConnell and Speaker Paul Ryan?
63
15
22
0
10
20
30
40
50
60
70
80
Yes No Unsure
Yes No
East 65 16
Midwest 60 15
South 63 14
West 64 18
Cont. Obama Pols. 63 18
Change Direction 66 13
Approve – Trump 67 13
Disapprove – Trump 60 18
Favorable – Trump 67 13
Unfavorable– Trump 61 17
Vote Pres. 2016 – Clinton 62 20
Vote Pres. 2016 – Trump 67 12
Vote Cong. 2018 – GOP 67 13
Vote Cong. 2018 – DEM 63 19
Vote Cong. 2018 - UND 42 9
Republican 68 14
Democrat 63 21
Independent 57 11
Liberal 70 16
Moderate 55 18
Conservative 65 12
No College Degree 60 16
College Graduate 66 15
White 63 15
African- American 55 19
Hispanic 68 14
Under 55 62 16
Over 55 63 15
Married 68 12
Single 59 21
Men 69 16
Women 57 15
National – August 2017
Center for Security Policy/Eagle Forum

Party Total Age Total Race Total
Republican 33% 18-29 19% White 71%
Democrat 36% 30-40 19% African American 12%
Independent 31% 41-55 27% Hispanic 11%
Ideology % 56-65 20% Asian 4%
Liberal 26% Over 65 16% Gender %
Moderate 39% Male 47%
Conservative 35% Female 53%
Voter Profile