national indian education study
TRANSCRIPT
National Indian Education StudyPart I:The Performance of American Indian and Alaska Native Fourth- and Eighth-Grade Studentson NAEP 2005 Reading andMathematics Assessments
Statistical Analysis Report
U.S. Department of EducationNCES 2006-463

The National Assessment of Educational Progress (NAEP) is a nationally representative and continuing assessment of what America’s students know and can do in various subject areas. Since 1969, assessments have been conducted periodically in reading, mathematics, science, writing, history, geography, and other subjects.
NAEP is a congressionally mandated project of the National Center for Education Statistics within the Institute of Education Sciences of the U.S. Department of Education. The Commissioner of Education Statistics is responsible, by law, for carrying out the NAEP project through competitive awards to qualified organizations.
By making objective information on student perfor-mance available to policymakers at the national, state, and local levels, NAEP is an integral part of our nation’s evaluation of the condition and progress of education. Only information related to academic achievement and relevant variables is collected under this program. The privacy of individual students and their families is pro-tected to the fullest extent allowable under law, and the identities of participating schools are not released.
In 1988, Congress established the National Assessment Governing Board (NAGB) to oversee and set policy for NAEP. The Board is responsible for select-ing the subject areas to be assessed; setting appropriate student achievement levels; developing assessment objectives and test specifications; developing a process for the review of the assessment; designing the assess-ment methodology; developing guidelines for reporting and disseminating NAEP results; developing standards and procedures for interstate, regional, and national comparisons; determining the appropriateness of all assessment items and ensuring the assessment items are free from bias and are secular, neutral, and nonideologi-cal; taking actions to improve the form, content, use, and reporting of results of the National Assessment; and planning and executing the initial public release of NAEP reports.

May 2006
B. D. RampeyAnthony D. LutkusArlene W. WeinerEducational Testing Service
Taslima RahmanProject Offi cerNational Center for Education Statistics
NIES was sponsored bythe Offi ce of Indian Education,U.S. Department of Education
National Indian Education StudyPart I:The Performance of American Indian and Alaska Native Fourth- and Eighth-Grade Students on NAEP 2005 Reading and Mathematics AssessmentsStatistical Analysis Report
U.S. Department of EducationNCES 2006-463

U.S. Department of EducationMargaret SpellingsSecretary
Institute of Education SciencesGrover J. WhitehurstDirector
National Center for Education StatisticsMark SchneiderCommissioner
The National Center for Education Statistics (NCES) is the primary federal entity for collecting, analyzing, and report-ing data related to education in the United States and other nations. It fulfills a congressional mandate to collect, collate, analyze, and report full and complete statistics on the condition of education in the United States; conduct and publish reports and specialized analyses of the meaning and significance of such statistics; assist state and local educa-tion agencies in improving their statistical systems; and review and report on education activities in foreign countries.
NCES activities are designed to address high-priority education data needs; provide consistent, reliable, complete, and accurate indicators of education status and trends; and report timely, useful, and high quality data to the U.S. Department of Education, the Congress, the states, other education policymakers, practitioners, data users, and the general public. Unless specifically noted, all information contained herein is in the public domain.
We strive to make our products available in a variety of formats and in language that is appropriate to a variety of audiences. You, as our customer, are the best judge of our success in communicating information effectively. If you have any comments or suggestions about this or any other NCES product or report, we would like to hear from you. Please direct your comments to
National Center for Education Statistics Institute of Education Sciences U.S. Department of Education 1990 K Street NW Washington, DC 20006-5651
May 2006
The NCES World Wide Web Home Page address is http://nces.ed.gov.
The NCES World Wide Web Electronic Catalog is http://nces.ed.gov/pubsearch.
Suggested Citation Rampey, B.D., Lutkus, A.D., and Weiner, A.W., (2006). National Indian Education Study, Part I: The Performance of American Indian and Alaska Native Fourth- and Eighth-Grade Students on NAEP 2005 Reading and Mathematics Assessments (NCES 2006-463). U.S. Department of Education, Institute of Education Sciences, National Center for Education Statistics. Washington, DC: Government Printing Office.
For ordering information on this report, write to U.S. Department of Education ED Pubs P.O. Box 1398 Jessup, MD 20794-1398
or call toll free 1-877-4ED-Pubs or order online at http://www.edpubs.org.
Content ContactTaslima [email protected]
The work upon which this publication is based was performed for the National Center for Education Statistics by Educational Testing Service, the Education Statistics Services Institute,
Pearson Educational Measurement, Westat, and Windwalker.
N A T I O N A L I N D I A N E D U C A T I O N S T U D Y : 2 0 0 5iii
Summary
Executive
The National Indian Education Study is a two-part study designed to describe the condition of education for American Indian/Alaska Native students in the United States. The study was con-ducted by the National Center for Education Statistics for the U.S. Department of Education, with the support of the Office of Indian Education. This report, Part I of the study, presents the performance of American Indian/Alaska Native students at grades 4 and 8 on the 2005 National Assessment of Educational Progress in reading and mathematics. Part II, a separate report, will present the results of a special survey of American Indian/Alaska Native students and schools, focusing on demographic and cultural factors.
A primary objective of the National Assessment of Educational Progress (NAEP) is to provide educators and policymakers reliable data on academic performance of students at the national, state, and local levels. NAEP serves as an integral part of our nation’s evaluation of the condition and progress of education. The National Indian Education Study was conducted for the first time in 2005 as a part of NAEP, and in accordance with Title VII Part A of the Elementary and Secondary Education Act, 2001. This report is a summary of a compilation of comprehensive data on the academic achievement and progress of American Indian/Alaska Native students.
E X E C U T I V E S U M M A R Yiv
This report, Part I of the National Indian Education Study, presents the performance results of American Indian/Alaska Native students at grades 4 and 8 on the 2005 NAEP in reading and math-ematics. In 2005, approximately 325,000 students (combined grades 4 and 8) participated in the reading assessment nationwide, and 334,000 par-ticipated in the mathematics assessment. Of these, approximately 7,200 American Indian/Alaska Native students participated in the reading assessment, and 7,300 participated in mathematics. The national sample includes students from both public and non-public schools (i.e., Bureau of Indian Affairs [BIA], Department of Defense Education Activity [DoDEA], and private schools).
In addition to the national sample, states with relatively large populations of American Indian/Alaska Native students were selected for this study. The states whose results are included in this report (Alaska, Arizona, Montana, New Mexico, North Dakota, Oklahoma, and South Dakota) are the seven states with the largest proportions of American Indians and Alaska Natives as a percentage of the state’s total population. The state samples included only public and BIA schools.
Chapters 2 and 3 provide performance results for reading and mathematics and are divided into four sections: National Results, Results by Region of the Country, Selected State Results, and Student Group Results. In all of the sections, except for Selected State Results, the comparisons are generally between the performance results of American Indian/Alaska Native students and the performance results of stu-dents who are neither American Indian nor Alaska Native. In the section discussing state results, the comparisons are between the performance results of American Indian/Alaska Native students within each selected state and those of American Indian/Alaska Native students in each of the other selected states, and to the performance results of the national sample of American Indian/Alaska Native students. At the state level, the sample design did not per-mit comparisons to students who are not American
Indian or Alaska Native. Only differences that have been determined to be statistically significant at the .05 level after controlling for multiple comparisons are discussed in this report.
The Technical Notes section provides information about sampling, accommodations, interpreting sta-tistical significance, and other technical features. The Data Appendix provides tables that support the find-ings provided in this report.
The data in this report provide a snapshot of American Indian/Alaska Native students’ current performance. When considering these data, it should be noted that the results represent students from a variety of educational settings and that future NAEP assessments may reveal different patterns of perfor-mance. Further, NAEP does not collect information about students’ prior educational experience, which contributes to present performance.
Reading Results
National• At both grades 4 and 8, American Indian/Alaska
Native students had a lower average score in read-ing than the average score for all other students in the nation (students who are neither American Indian nor Alaska Native).
• The percentages of students performing at or above Basic and at or above Proficient were lower for American Indian/Alaska Native students than those for all other students at both grades.
Regional• At grade 4, the average reading score for American
Indian/Alaska Native students in each of the five regions was lower than the average score for all other students in the same region.
• At grade 8, American Indian/Alaska Native stu-dents in the North Central, Mountain, and Pacific regions had lower average scores than the average score for all other students in the same regions.
N A T I O N A L I N D I A N E D U C A T I O N S T U D Y : 2 0 0 5v
Selected States• At grade 4, American Indian/Alaska Native stu-
dents in Oklahoma had a higher average score and a higher percentage performing at or above Basic than American Indian/Alaska Native stu-dents in the nation and in the other selected states. Compared to American Indian/Alaska Native stu-dents in the nation, American Indian/Alaska Native students in Alaska, Arizona, New Mexico, and South Dakota had lower average scores.
• At grade 8, compared to American Indian/Alaska Native students in the nation, American Indian/Alaska Native students in Oklahoma had a higher average score. American Indian/Alaska Native students in Alaska, Arizona, New Mexico, and South Dakota had lower average scores than American Indian/Alaska Native students in the nation. American Indian/Alaska Native students in Oklahoma had a higher average score than their peers in Alaska, Arizona, New Mexico, and South Dakota.
Student Groups• At both grades 4 and 8, compared to Black stu-
dents in the nation, American Indian/Alaska Native students had a higher average score and a higher percentage performing at or above Basic. American Indian/Alaska Native students had a lower aver-age score and a lower percentage performing at or above Basic than White and Asian/Pacific Islander students. No significant difference was found between the performance of Hispanic students and American Indian/Alaska Native students on either measure.
• At grade 4, the average scores and the percentages of American Indian/Alaska Native students per-forming at or above the Basic and Proficient levels were higher in urban fringe/large town and central city locations than in rural/small town locations. For all other students at both grades, reading per-formance was higher, on average, in urban fringe and rural locations than in central city locations.
Mathematics Results
National• At both grades 4 and 8, American Indian/Alaska
Native students had lower average scores in mathe-matics than the average score for all other students in the nation (students who are neither American Indian nor Alaska Native).
• The percentages of students performing at or above Basic and at or above Proficient were lower for American Indian/Alaska Native students than for all other students at both grades.
Regional• At grade 4, American Indian/Alaska Native stu-
dents in each of the five regions had a lower average score than the average score for all other students in the same region.
• At grade 8, the average mathematics score for American Indian/Alaska Native students in each of the five regions was lower than the average score for all other students in the same region.
Selected States• At grade 4, compared to American Indian/Alaska
Native students in the nation, the average scores for American Indian/Alaska Native students in Montana and Oklahoma were not significantly dif-ferent; American Indian/Alaska Native students in all the other selected states had lower average scores. American Indian/Alaska Native students in Oklahoma had a higher percentage performing at or above Basic than American Indian/Alaska Native students in the nation. American Indian/Alaska Native students in Alaska, Arizona, New Mexico, and South Dakota had lower percentages perform-ing at or above Basic than American Indian/Alaska Native students in the nation.
• At grade 8, American Indian/Alaska Native stu-dents in New Mexico and South Dakota had lower average scores and lower percentages performing at or above Basic than American Indian/Alaska Native students in the nation.

E X E C U T I V E S U M M A R Yvi
Student Groups• At grade 4, compared to Black students in the
nation, American Indian/Alaska Native students had a higher average score and a higher percentage performing at or above Basic. American Indian/Alaska Native students performed lower on both measures than White students and Asian/Pacific Islander students.
• At grade 8, compared to Black students in the nation, American Indian/Alaska Native students had a higher average score and a higher percent-age performing at or above Basic. Compared to Hispanic students, American Indian/Alaska Native students had a higher average score. American Indian/Alaska Native students had a lower aver-age score and lower percentage performing at or above Basic than White students and Asian/Pacific Islander students.
• At both grades, the average scores of American Indian/Alaska Native students were higher in urban fringe and central city locations than in rural locations.
The second part of the National Indian Education Study is entitled The Educational Experiences of Fourth- and Eighth-Grade American Indian and Alaska Native Students. This report provides results from an in-depth survey of American Indian/Alaska Native students and their teachers, focusing on demographic factors, school culture and climate, the use of traditional culture and language in the home, student perceptions about school, and teacher qualifications and cultural preparation. Results from the questionnaires used in the survey report (Part II) will not be linked to data from this performance report (Part I). Future studies will aim to link student performance results with the survey data.
N A T I O N A L I N D I A N E D U C A T I O N S T U D Y : 2 0 0 5vii
Acknowledgments
The National Center for Education Statistics (NCES) conducted the National Indian Education Study (NIES) for the U.S. Department of Education, Office of Indian Education (OIE). The study was designed in consulta-tion with a technical review panel composed of American Indian and Alaska Native educators and researchers from across the country.
The National Assessment of Educational Progress (NAEP) is directed by NCES and overseen by the National Assessment Governing Board. NAEP activities are carried out by Educational Testing Service (ETS), Pearson Educational Measurement, American Institutes for Research, Education Statistics Services Institute, and Westat.
The NAEP project at ETS is directed by Jay Campbell and John Mazzeo, with assistance from John Barone. Test development took place at ETS under the direction of Jeff Haberstroh, Patricia Donahue, and Gloria Dion. Sampling and data collection activities were conducted by Westat under the direction of Renee Slobasky, Nancy Caldwell, and William Buckles. Printing, distribution, scoring, and processing activities were conducted by Pearson Educational Measurement under the direction of Brad Thayer, Connie Smith, and Dianne Walsh.
The complex statistical and psychometric activities necessary to report results for the NAEP assessment were directed by Catherine McClellan and Lydia Gladkova at ETS, with assistance from Amy Dresher. The extensive data processing and computer programming underlying the statistical and psychometric activities conducted at ETS were under the direction of David Freund, Edward Kulick, Bruce Kaplan, and Steven Isham. The data analyses presented in the report were produced by Mei-jang Lin. The complex database work for this assess-ment was managed by Katharine Pashley.
Nancy Mead directed the reporting process with assistance from Wendy Grigg. The design and production of this report were overseen by Loretta Casalaina with assistance from Rick Hasney and Susan Mills. Ming Kuang coordinated the documentation and data-checking procedures with assistance from Kit Chan, Janice Goodis, and Karen Damiano. Janice Lukas coordinated the editorial procedures with assistance from Mary Daane and Linda Myers. The consistency review process was coordinated by Joanne O’Brien. The web version of the report was coordinated by Rick Hasney.
Members of the NCES staff—Peggy Carr, Taslima Rahman, Steve Gorman, Andrew Kolstad, and Arnold Goldstein—worked closely and collegially with the authors to produce this report. Many thanks are due to the numerous people who reviewed this report at various stages.The NCES review process was supervised by Marilyn Seastrom, with assistance from Kerry Gruber, Edith McArthur, and Jennifer Park. Young Chun, Linda Shafer, and Alan Vanneman conducted reviews for ESSI. Jeff Johnson and Donna Sabis-Burns were reviewers for the Office of Indian Education. In addition, the comments and suggestions of the following reviewers are reflected in the final version: Raymond J. Barnhardt of the University of Alaska; Henry Braun of ETS; Gloria Collins of the Forest Institute, Missouri; Ray Gachupin of Jemez Pueblo, New Mexico; Gerald Gipp of the American Indian Higher Education Consortium, Alexandria, Virginia; Juana C. Jose of the Arizona Department of Education; Lori King of Malcolm High School, Sault Ste. Marie, Michigan; Larry Ludlow of Boston College, Boston, Massachusetts; Edward Monaghan of the Gallup McKinley County Schools, Gallup, New Mexico; Yolanda Rossi of the Ute Mountain Tribal Education Department, Towaoc, Colorado; and Jim Williamson of New West Technologies, LLC, Englewood, Colorado.
Special thanks to the student artists whose works are featured on the cover. Clockwise from the top: Loksi (Choctaw/Chickasaw for Turtle) - Katie Johnson; A Modern Ritual - Heather Duggins; My People - Danica Engstrom; and I Dance for My People - Gabriell Lira.

THIS PAGE INTENTIONALLY LEFT BLANK.

N A T I O N A L I N D I A N E D U C A T I O N S T U D Y : 2 0 0 5ix
cONTENTSPage
Executive Summary . . . . . . . . . . . . . . . . . . . . . . . . . . . . . . . . . . . . . . . . . . . . . . . . . . . . . . .iii
Acknowledgments. . . . . . . . . . . . . . . . . . . . . . . . . . . . . . . . . . . . . . . . . . . . . . . . . . . . . . . vii
List of Tables . . . . . . . . . . . . . . . . . . . . . . . . . . . . . . . . . . . . . . . . . . . . . . . . . . . . . . . . . . . . xi
List of Figures. . . . . . . . . . . . . . . . . . . . . . . . . . . . . . . . . . . . . . . . . . . . . . . . . . . . . . . . . . . . xiii
Chapter 1Introduction . . . . . . . . . . . . . . . . . . . . . . . . . . . . . . . . . . . . . . . . . . . . . . . . . . . . . . . . . . . . . . . . . . . . . . 1 Context . . . . . . . . . . . . . . . . . . . . . . . . . . . . . . . . . . . . . . . . . . . . . . . . . . . . . . . . . . . . . . . . . . . . . . . 1 Purpose . . . . . . . . . . . . . . . . . . . . . . . . . . . . . . . . . . . . . . . . . . . . . . . . . . . . . . . . . . . . . . . . . . . . . . . 2 What Was Assessed? . . . . . . . . . . . . . . . . . . . . . . . . . . . . . . . . . . . . . . . . . . . . . . . . . . . . . . . . . . . . . 2 Sample Design . . . . . . . . . . . . . . . . . . . . . . . . . . . . . . . . . . . . . . . . . . . . . . . . . . . . . . . . . . . . . . . . . . 3 Understanding NAEP Results . . . . . . . . . . . . . . . . . . . . . . . . . . . . . . . . . . . . . . . . . . . . . . . . . . . . . . . . 5 Interpreting Results . . . . . . . . . . . . . . . . . . . . . . . . . . . . . . . . . . . . . . . . . . . . . . . . . . . . . . . . . . . . . . . 6 Cautions in Interpretation . . . . . . . . . . . . . . . . . . . . . . . . . . . . . . . . . . . . . . . . . . . . . . . . . . . . . . . . . . . 6 About This Report . . . . . . . . . . . . . . . . . . . . . . . . . . . . . . . . . . . . . . . . . . . . . . . . . . . . . . . . . . . . . . . . 6
Chapter 2Reading Results, Grades 4 and 8 . . . . . . . . . . . . . . . . . . . . . . . . . . . . . . . . . . . . . . . . . . . . . . . . . . . . . . 7 National Results . . . . . . . . . . . . . . . . . . . . . . . . . . . . . . . . . . . . . . . . . . . . . . . . . . . . . . . . . . . . . . . . . 7 Results by Region of the Country . . . . . . . . . . . . . . . . . . . . . . . . . . . . . . . . . . . . . . . . . . . . . . . . . . . . 11 Selected State Results . . . . . . . . . . . . . . . . . . . . . . . . . . . . . . . . . . . . . . . . . . . . . . . . . . . . . . . . . . . . 12 Student Group Results . . . . . . . . . . . . . . . . . . . . . . . . . . . . . . . . . . . . . . . . . . . . . . . . . . . . . . . . . . . . 18
Chapter 3Mathematics Results, Grades 4 and 8 . . . . . . . . . . . . . . . . . . . . . . . . . . . . . . . . . . . . . . . . . . . . . . . . . . 29 National Results . . . . . . . . . . . . . . . . . . . . . . . . . . . . . . . . . . . . . . . . . . . . . . . . . . . . . . . . . . . . . . . . 29 Results by Region of the Country . . . . . . . . . . . . . . . . . . . . . . . . . . . . . . . . . . . . . . . . . . . . . . . . . . . . 33 Selected State Results . . . . . . . . . . . . . . . . . . . . . . . . . . . . . . . . . . . . . . . . . . . . . . . . . . . . . . . . . . . . 35 Student Group Results . . . . . . . . . . . . . . . . . . . . . . . . . . . . . . . . . . . . . . . . . . . . . . . . . . . . . . . . . . . . 40

C O N T E N T Sx
Page
Chapter 4Frameworks, Item Maps, and Sample Questions . . . . . . . . . . . . . . . . . . . . . . . . . . . . . . . . . . . . . . . . . . 51 Grade 4 Reading Assessment Framework. . . . . . . . . . . . . . . . . . . . . . . . . . . . . . . . . . . . . . . . . . . . . . 51 Grade 4 Reading Achievement-Level Descriptions . . . . . . . . . . . . . . . . . . . . . . . . . . . . . . . . . . . . . . . . 53 Grade 4 Reading Item Map . . . . . . . . . . . . . . . . . . . . . . . . . . . . . . . . . . . . . . . . . . . . . . . . . . . . . . . . 54 Grade 4 Reading Sample Questions. . . . . . . . . . . . . . . . . . . . . . . . . . . . . . . . . . . . . . . . . . . . . . . . . . 55 Grade 8 Reading Assessment Framework. . . . . . . . . . . . . . . . . . . . . . . . . . . . . . . . . . . . . . . . . . . . . . 56 Grade 8 Reading Achievement-Level Descriptions . . . . . . . . . . . . . . . . . . . . . . . . . . . . . . . . . . . . . . . . 57 Grade 8 Reading Item Map . . . . . . . . . . . . . . . . . . . . . . . . . . . . . . . . . . . . . . . . . . . . . . . . . . . . . . . . 58 Grade 8 Reading Sample Questions. . . . . . . . . . . . . . . . . . . . . . . . . . . . . . . . . . . . . . . . . . . . . . . . . . 59 Grade 4 Mathematics Assessment Framework . . . . . . . . . . . . . . . . . . . . . . . . . . . . . . . . . . . . . . . . . . 60 Grade 4 Mathematics Achievement-Level Descriptions . . . . . . . . . . . . . . . . . . . . . . . . . . . . . . . . . . . . . 61 Grade 4 Mathematics Item Map . . . . . . . . . . . . . . . . . . . . . . . . . . . . . . . . . . . . . . . . . . . . . . . . . . . . . 62 Grade 4 Mathematics Sample Questions . . . . . . . . . . . . . . . . . . . . . . . . . . . . . . . . . . . . . . . . . . . . . . 63 Grade 8 Mathematics Assessment Framework . . . . . . . . . . . . . . . . . . . . . . . . . . . . . . . . . . . . . . . . . . 64 Grade 8 Mathematics Achievement-Level Descriptions . . . . . . . . . . . . . . . . . . . . . . . . . . . . . . . . . . . . . 65 Grade 8 Mathematics Item Map . . . . . . . . . . . . . . . . . . . . . . . . . . . . . . . . . . . . . . . . . . . . . . . . . . . . . 66 Grade 8 Mathematics Sample Questions . . . . . . . . . . . . . . . . . . . . . . . . . . . . . . . . . . . . . . . . . . . . . . 67
Technical NotesIntroduction to the Technical Notes . . . . . . . . . . . . . . . . . . . . . . . . . . . . . . . . . . . . . . . . . . . . . . . . . . . . 69 NAEP Sampling Procedures for American Indian/Alaska Native Students . . . . . . . . . . . . . . . . . . . . . . . . . 69 Understanding NAEP Reporting Groups. . . . . . . . . . . . . . . . . . . . . . . . . . . . . . . . . . . . . . . . . . . . . . . . 70 Accommodations . . . . . . . . . . . . . . . . . . . . . . . . . . . . . . . . . . . . . . . . . . . . . . . . . . . . . . . . . . . . . . . 72 Exclusion Rates . . . . . . . . . . . . . . . . . . . . . . . . . . . . . . . . . . . . . . . . . . . . . . . . . . . . . . . . . . . . . . . 73 Drawing Inferences From the Results . . . . . . . . . . . . . . . . . . . . . . . . . . . . . . . . . . . . . . . . . . . . . . . . . 73 Weighting and Variance Estimation . . . . . . . . . . . . . . . . . . . . . . . . . . . . . . . . . . . . . . . . . . . . . . . . . . 74 Analyzing Group Differences in Averages and Percentages . . . . . . . . . . . . . . . . . . . . . . . . . . . . . . . . . . 75 Conducting Multiple Tests . . . . . . . . . . . . . . . . . . . . . . . . . . . . . . . . . . . . . . . . . . . . . . . . . . . . . . . . . 76 Cautions in Interpretation . . . . . . . . . . . . . . . . . . . . . . . . . . . . . . . . . . . . . . . . . . . . . . . . . . . . . . . . . 77
References . . . . . . . . . . . . . . . . . . . . . . . . . . . . . . . . . . . . . . . . . . . . . . . . . . . . . . . . . . . . . . . . . . 78
Data Appendix . . . . . . . . . . . . . . . . . . . . . . . . . . . . . . . . . . . . . . . . . . . . . . . . . . . . . . . . . . . . . . 79
Contents (continued)

N A T I O N A L I N D I A N E D U C A T I O N S T U D Y : 2 0 0 5xi
List of Tables
Table Page
2-1. Achievement-level results in reading, by student group, grades 4 and 8: 2005 . . . . . . . . . . . . . . . . 102-2. Reading scale scores at selected percentiles, by student group, grades 4 and 8: 2005 . . . . . . . . . . 103-1. Achievement-level results in mathematics, by student group, grades 4 and 8: 2005 . . . . . . . . . . . . 323-2. Mathematics scale scores at selected percentiles, by student group, grades 4 and 8: 2005 . . . . . . . 32
Appendix
A-1. National school participation rates and national American Indian/Alaska Native student participation rates for reading and mathematics, grades 4 and 8: 2005. . . . . . . . . . . . . . . . . . . . . 79
A-2. Number of participating schools with American Indian/Alaska Native students and number of participating American Indian/Alaska Native students, by region, grades 4 and 8: 2005. . . . . . . . 80
A-3. Number of participating schools with American Indian/Alaska Native students and number of participating American Indian/Alaska Native students, by selected states, grades 4 and 8: 2005 . . . . . . . . . . . . . . . . . . . . . . . . . . . . . . . . . . . . . . . . . . . . . . . . . . . . . . . 80
A-4. Students identifi ed, excluded, and assessed with accommodations, by students with disabilities and/or English language learners, as percentages of all sampled students, grades 4 and 8 public and nonpublic schools: 2005. . . . . . . . . . . . . . . . . . . . . . . . . . . . . . . . . . 81
A-5. Percentage of students identifi ed as students with disabilities and/or English language learners, excluded, and assessed in reading with accommodations, by student group and jurisdiction, grade 4: 2005 . . . . . . . . . . . . . . . . . . . . . . . . . . . . . . . . . . . . . . . . . . . . . . . . . 82
A-6. Percentage of students identifi ed as students with disabilities and/or English language learners, excluded, and assessed in reading with accommodations, by student group and jurisdiction, grade 8: 2005 . . . . . . . . . . . . . . . . . . . . . . . . . . . . . . . . . . . . . . . . . . . . . . . . . 83
A-7. Percentage of students identifi ed as students with disabilities and/or English language learners, excluded, and assessed in mathematics with accommodations, by student group and jurisdiction, grade 4: 2005 . . . . . . . . . . . . . . . . . . . . . . . . . . . . . . . . . . . . . . . . . . . . 84
A-8. Percentage of students identifi ed as students with disabilities and/or English language learners, excluded, and assessed in mathematics with accommodations, by student group and jurisdiction, grade 8: 2005 . . . . . . . . . . . . . . . . . . . . . . . . . . . . . . . . . . . . . . . . . . . . 85
A-9. Average scale scores and achievement-level results in reading, by student group, grades 4 and 8: 2005 . . . . . . . . . . . . . . . . . . . . . . . . . . . . . . . . . . . . . . . . . . . . . . . . . . . . . . . 86
A-10. Reading scale scores at selected percentiles, by student group, grades 4 and 8: 2005 . . . . . . . . . . 86A-11. Average scale scores and achievement-level results in reading, by student group and
region, grades 4 and 8: 2005 . . . . . . . . . . . . . . . . . . . . . . . . . . . . . . . . . . . . . . . . . . . . . . . . . . 87A-12. Average scale scores and achievement-level results in reading for American Indian/
Alaska Native students only, by nation and selected states, grades 4 and 8: 2005 . . . . . . . . . . . . . 88A-13. Average scale scores and achievement-level results in reading, by race/ethnicity,
grades 4 and 8: 2005 . . . . . . . . . . . . . . . . . . . . . . . . . . . . . . . . . . . . . . . . . . . . . . . . . . . . . . . 89A-14. Average scale scores and achievement-level results in reading, by student group
and eligibility for free or reduced-price school lunch, grades 4 and 8: 2005 . . . . . . . . . . . . . . . . . . 90A-15. Average scale scores and achievement-level results in reading, by student group
and gender, grades 4 and 8: 2005 . . . . . . . . . . . . . . . . . . . . . . . . . . . . . . . . . . . . . . . . . . . . . . 91A-16. Average scale scores and achievement-level results in reading, by student group and
type of school location, grades 4 and 8: 2005 . . . . . . . . . . . . . . . . . . . . . . . . . . . . . . . . . . . . . . 92A-17. Average scale scores and achievement-level results in reading, by student group and
student-reported highest level of education of either parent, grade 8: 2005 . . . . . . . . . . . . . . . . . . . 93A-18. Average scale scores and achievement-level results in mathematics, by student group,
grades 4 and 8: 2005 . . . . . . . . . . . . . . . . . . . . . . . . . . . . . . . . . . . . . . . . . . . . . . . . . . . . . . . 94

A-19. Mathematics scale scores at selected percentiles, by student group, grades 4 and 8: 2005 . . . . . . . 94A-20. Average scale scores and achievement-level results in mathematics, by student group
and region, grades 4 and 8: 2005. . . . . . . . . . . . . . . . . . . . . . . . . . . . . . . . . . . . . . . . . . . . . . . 95A-21. Average scale scores and achievement-level results in mathematics for American Indian/
Alaska Native students only, by nation and selected states, grades 4 and 8: 2005 . . . . . . . . . . . . . 96A-22. Average scale scores and achievement-level results in mathematics, by race/ethnicity,
grades 4 and 8: 2005 . . . . . . . . . . . . . . . . . . . . . . . . . . . . . . . . . . . . . . . . . . . . . . . . . . . . . . . 97A-23. Average scale scores and achievement-level results in mathematics, by student group
and eligibility for free or reduced-price school lunch, grades 4 and 8: 2005 . . . . . . . . . . . . . . . . . . 98A-24. Average scale scores and achievement-level results in mathematics, by student group
and gender, grades 4 and 8: 2005 . . . . . . . . . . . . . . . . . . . . . . . . . . . . . . . . . . . . . . . . . . . . . . 99A-25. Average scale scores and achievement-level results in mathematics, by student group
and type of school location, grades 4 and 8: 2005 . . . . . . . . . . . . . . . . . . . . . . . . . . . . . . . . . . 100A-26. Average scale scores and achievement-level results in mathematics, by student group
and student-reported highest level of education of either parent, grade 8: 2005. . . . . . . . . . . . . . . 101
L I S T O F T A B L E Sxii
List of Tables (continued)
Table Page

N A T I O N A L I N D I A N E D U C A T I O N S T U D Y : 2 0 0 5xiii
1-1. Regions and selected states for the National Indian Education Study: 2005 . . . . . . . . . . . . . . . . . . . 42-1. Average reading scale scores, by student group, grade 4: 2005 . . . . . . . . . . . . . . . . . . . . . . . . . . . 82-2. Reading achievement-level results, by student group, grade 4: 2005. . . . . . . . . . . . . . . . . . . . . . . . 82-3. Average reading scale scores, by student group, grade 8: 2005 . . . . . . . . . . . . . . . . . . . . . . . . . . . 92-4. Reading achievement-level results, by student group, grade 8: 2005. . . . . . . . . . . . . . . . . . . . . . . . 92-5. Average reading scale scores, by student group and region, grade 4: 2005 . . . . . . . . . . . . . . . . . . 112-6. Reading achievement-level results, by student group and region, grade 4: 2005. . . . . . . . . . . . . . . 112-7. Average reading scale scores, by student group and region, grade 8: 2005 . . . . . . . . . . . . . . . . . . 122-8. Reading achievement-level results, by student group and region, grade 8: 2005. . . . . . . . . . . . . . . 122-9. Average reading scale scores for American Indian/Alaska Native students only,
by nation and selected states, grade 4: 2005 . . . . . . . . . . . . . . . . . . . . . . . . . . . . . . . . . . . . . . . 142-10. Reading achievement-level results for American Indian/Alaska Native students only,
by nation and selected states, grade 4: 2005 . . . . . . . . . . . . . . . . . . . . . . . . . . . . . . . . . . . . . . . 142-11. Cross-state comparison of average reading scale scores for American Indian/
Alaska Native students, grade 4: 2005. . . . . . . . . . . . . . . . . . . . . . . . . . . . . . . . . . . . . . . . . . . . 152-12. Cross-state comparison of the percentages of American Indian/Alaska Native
students performing at or above Basic in reading, grade 4: 2005 . . . . . . . . . . . . . . . . . . . . . . . . . 152-13. Average reading scale scores for American Indian/Alaska Native students only,
by nation and selected states, grade 8: 2005 . . . . . . . . . . . . . . . . . . . . . . . . . . . . . . . . . . . . . . . 162-14. Reading achievement-level results for American Indian/Alaska Native students only,
by nation and selected states, grade 8: 2005 . . . . . . . . . . . . . . . . . . . . . . . . . . . . . . . . . . . . . . . 162-15. Cross-state comparison of average reading scale scores for American Indian/
Alaska Native students, grade 8: 2005. . . . . . . . . . . . . . . . . . . . . . . . . . . . . . . . . . . . . . . . . . . . 172-16. Cross-state comparison of the percentages of American Indian/Alaska Native
students performing at or above Basic in reading, grade 8: 2005 . . . . . . . . . . . . . . . . . . . . . . . . . 172-17. Average reading scale scores, by race/ethnicity, grade 4: 2005. . . . . . . . . . . . . . . . . . . . . . . . . . . 192-18. Reading achievement-level results, by race/ethnicity, grade 4: 2005 . . . . . . . . . . . . . . . . . . . . . . . 192-19. Average reading scale scores, by race/ethnicity, grade 8: 2005. . . . . . . . . . . . . . . . . . . . . . . . . . . 202-20. Reading achievement-level results, by race/ethnicity, grade 8: 2005 . . . . . . . . . . . . . . . . . . . . . . . 202-21. Average reading scale scores, by student group and eligibility for free/reduced-price
school lunch, grade 4: 2005. . . . . . . . . . . . . . . . . . . . . . . . . . . . . . . . . . . . . . . . . . . . . . . . . . . 212-22. Reading achievement-level results, by student group and eligibility for free/reduced-price
school lunch, grade 4: 2005. . . . . . . . . . . . . . . . . . . . . . . . . . . . . . . . . . . . . . . . . . . . . . . . . . . 212-23. Average reading scale scores, by student group and eligibility for free/reduced-price
school lunch, grade 8: 2005. . . . . . . . . . . . . . . . . . . . . . . . . . . . . . . . . . . . . . . . . . . . . . . . . . . 222-24. Reading achievement-level results, by student group and eligibility for free/reduced-price
school lunch, grade 8: 2005. . . . . . . . . . . . . . . . . . . . . . . . . . . . . . . . . . . . . . . . . . . . . . . . . . . 222-25. Average reading scale scores, by student group and gender, grade 4: 2005. . . . . . . . . . . . . . . . . . 232-26. Reading achievement-level results, by student group and gender, grade 4: 2005 . . . . . . . . . . . . . . 232-27. Average reading scale scores, by student group and gender, grade 8: 2005. . . . . . . . . . . . . . . . . . 242-28. Reading achievement-level results, by student group and gender, grade 8: 2005 . . . . . . . . . . . . . . 242-29. Average reading scale scores, by student group and type of school location,
grade 4: 2005. . . . . . . . . . . . . . . . . . . . . . . . . . . . . . . . . . . . . . . . . . . . . . . . . . . . . . . . . . . . . 252-30. Reading achievement-level results, by student group and type of school location,
grade 4: 2005. . . . . . . . . . . . . . . . . . . . . . . . . . . . . . . . . . . . . . . . . . . . . . . . . . . . . . . . . . . . . 252-31. Average reading scale scores, by student group and type of school location,
grade 8: 2005. . . . . . . . . . . . . . . . . . . . . . . . . . . . . . . . . . . . . . . . . . . . . . . . . . . . . . . . . . . . . 26
List of Figures
Figure Page
2-32. Reading achievement-level results, by student group and type of school location, grade 8: 2005. . . . . . . . . . . . . . . . . . . . . . . . . . . . . . . . . . . . . . . . . . . . . . . . . . . . . . . . . . . . . 26
2-33. Average reading scale scores, by student group and student-reported highest level of education of either parent, grade 8: 2005 . . . . . . . . . . . . . . . . . . . . . . . . . . . . . . . . . . . . . . . . 27
2-34. Reading achievement-level results, by student group and student-reported highestlevel of education of either parent, grade 8: 2005 . . . . . . . . . . . . . . . . . . . . . . . . . . . . . . . . . . . . 28
3-1. Average mathematics scale scores, by student group, grade 4: 2005 . . . . . . . . . . . . . . . . . . . . . . 303-2. Mathematics achievement-level results, by student group, grade 4: 2005 . . . . . . . . . . . . . . . . . . . 303-3. Average mathematics scale scores, by student group, grade 8: 2005 . . . . . . . . . . . . . . . . . . . . . . 313-4. Mathematics achievement-level results, by student group, grade 8: 2005 . . . . . . . . . . . . . . . . . . . 313-5. Average mathematics scale scores, by student group and region, grade 4: 2005 . . . . . . . . . . . . . . 333-6. Mathematics achievement-level results, by student group and region, grade 4: 2005 . . . . . . . . . . . 333-7. Average mathematics scale scores, by student group and region, grade 8: 2005 . . . . . . . . . . . . . . 343-8. Mathematics achievement-level results, by student group and region, grade 8: 2005 . . . . . . . . . . . 343-9. Average mathematics scale scores for American Indian/Alaska Native students only,
by nation and selected states, grade 4: 2005 . . . . . . . . . . . . . . . . . . . . . . . . . . . . . . . . . . . . . . . 363-10. Mathematics achievement-level results for American Indian/Alaska Native students only,
by nation and selected states, grade 4: 2005 . . . . . . . . . . . . . . . . . . . . . . . . . . . . . . . . . . . . . . . 363-11. Cross-state comparison of average mathematics scale scores for American Indian/Alaska
Native students, grade 4: 2005 . . . . . . . . . . . . . . . . . . . . . . . . . . . . . . . . . . . . . . . . . . . . . . . . . 373-12. Cross-state comparison of the percentages of American Indian/Alaska Native students
performing at or above Basic in mathematics, grade 4: 2005 . . . . . . . . . . . . . . . . . . . . . . . . . . . . 373-13. Average mathematics scale scores for American Indian/Alaska Native students only,
by nation and selected states, grade 8: 2005 . . . . . . . . . . . . . . . . . . . . . . . . . . . . . . . . . . . . . . . 383-14. Mathematics achievement-level results for American Indian/Alaska Native students only,
by nation and selected states, grade 8: 2005 . . . . . . . . . . . . . . . . . . . . . . . . . . . . . . . . . . . . . . . 383-15. Cross-state comparison of average mathematics scale scores for American Indian/Alaska
Native students, grade 8: 2005 . . . . . . . . . . . . . . . . . . . . . . . . . . . . . . . . . . . . . . . . . . . . . . . . . 393-16. Cross-state comparison of the percentages of American Indian/Alaska Native students
performing at or above Basic in mathematics, grade 8: 2005 . . . . . . . . . . . . . . . . . . . . . . . . . . . . 393-17. Average mathematics scale scores, by race/ethnicity, grade 4: 2005 . . . . . . . . . . . . . . . . . . . . . . . 413-18. Mathematics achievement-level results, by race/ethnicity, grade 4: 2005 . . . . . . . . . . . . . . . . . . . . 413-19. Average mathematics scale scores, by race/ethnicity, grade 8: 2005 . . . . . . . . . . . . . . . . . . . . . . . 423-20. Mathematics achievement-level results, by race/ethnicity, grade 8: 2005 . . . . . . . . . . . . . . . . . . . . 423-21. Average mathematics scale scores, by student group and eligibility for
free/reduced-price school lunch, grade 4: 2005 . . . . . . . . . . . . . . . . . . . . . . . . . . . . . . . . . . . . . 433-22. Mathematics achievement-level results, by student group and eligibility for
free/reduced-price school lunch, grade 4: 2005 . . . . . . . . . . . . . . . . . . . . . . . . . . . . . . . . . . . . . 433-23. Average mathematics scale scores, by student group and eligibility for
free/reduced-price school lunch, grade 8: 2005 . . . . . . . . . . . . . . . . . . . . . . . . . . . . . . . . . . . . . 443-24. Mathematics achievement-level results, by student group and eligibility for
free/reduced-price school lunch, grade 8: 2005 . . . . . . . . . . . . . . . . . . . . . . . . . . . . . . . . . . . . . 443-25. Average mathematics scale scores, by student group and gender, grade 4: 2005 . . . . . . . . . . . . . . 453-26. Mathematics achievement-level results, by student group and gender, grade 4: 2005 . . . . . . . . . . . 453-27. Average mathematics scale scores, by student group and gender, grade 8: 2005 . . . . . . . . . . . . . . 463-28. Mathematics achievement-level results, by student group and gender, grade 8: 2005 . . . . . . . . . . . 46
L I S T O F F I G U R E Sxiv
List of Figures (continued)
Figure Page

N A T I O N A L I N D I A N E D U C A T I O N S T U D Y : 2 0 0 5xv
3-29. Average mathematics scale scores, by student group and type of school location, grade 4: 2005. . . . . . . . . . . . . . . . . . . . . . . . . . . . . . . . . . . . . . . . . . . . . . . . . . . . . . . . . . . . . 47
3-30. Mathematics achievement-level results, by student group and type of school location, grade 4: 2005. . . . . . . . . . . . . . . . . . . . . . . . . . . . . . . . . . . . . . . . . . . . . . . . . . . . . . . . . . . . . 47
3-31. Average mathematics scale scores, by student group and type of school location, grade 8: 2005. . . . . . . . . . . . . . . . . . . . . . . . . . . . . . . . . . . . . . . . . . . . . . . . . . . . . . . . . . . . . 48
3-32. Mathematics achievement-level results, by student group and type of school location, grade 8: 2005. . . . . . . . . . . . . . . . . . . . . . . . . . . . . . . . . . . . . . . . . . . . . . . . . . . . . . . . . . . . . 48
3-33. Average mathematics scale scores, by student group and student-reported highest level of education of either parent, grade 8: 2005 . . . . . . . . . . . . . . . . . . . . . . . . . . . . . . . . . . . . 49
3-34. Mathematics achievement-level results, by student group and student-reported highest level of education of either parent, grade 8: 2005. . . . . . . . . . . . . . . . . . . . . . . . . . . . . . . 50
List of Figures (continued)
Figure Page

THIS PAGE INTENTIONALLY LEFT BLANK.
N A T I O N A L I N D I A N E D U C A T I O N S T U D Y : 2 0 0 51
Chapter 1Introduction
The National Indian Education Study (NIES) is a two-part study designed to describe the condi-tion of education for American Indian/Alaska Native students in the United States. The study was conducted by the National Center for Education Statistics (NCES) for the U.S. Department of Education, Office of Indian Education (OIE). This report, Part I of the study, presents the performance results of American Indian/Alaska Native students at grades 4 and 8 on the 2005 National Assessment of Educational Progress (NAEP) in reading and mathematics. Part II, a separate report, will present the results of a special survey of American Indian/Alaska Native stu-dents and schools, focusing on demographic and cultural factors.
ContextThe federal government has long been involved with American Indian/Alaska Native educa-tion. The 1972 Indian Education Act established a comprehensive approach to meeting the unique needs of American Indian and Alaska Native students. Continuity has been maintained through subsequent reauthorizing statutes. The latest amendments were made by the No Child Left Behind Act of 2001 (NCLB), which reauthorized the program in Title VII Part A of the Elementary and Secondary Education Act. A brief history of modern federal legislation regarding Indian education can be reviewed at http://www.ed.gov/about/offices/list/oese/oie/history.html.
In 1991, the report of the Indian Nations At Risk Task Force of the U.S. Department of Education documented an “at risk” status of Indian education, called for research-based strate-gies for addressing educational needs, and presented a comprehensive set of recommendations that were responsive to the complexities of improving American Indian schools and schooling toward the end of the 20th century (Indian Nations At Risk Task Force 1991).

C h a p t e r 12
As a follow-up to NCLB, President Bush signed Executive Order 13336 on April 30, 2004 (see http://www.whitehouse.gov/news/releases/2004/04/20040430-3.html). The purpose of this order was to assist American Indian/Alaska Native students in meeting the challenging student aca-demic standards of NCLB. The order established an Interagency Working Group on American Indian and Alaska Native Education. The order also called for a study and report on the current status of American Indian/Alaska Native students, including a com-pilation of comprehensive data on the academic achievement and progress of American Indian/Alaska Native students. The present report is part of the compilation of information about education achieve-ment called for by the executive order.
In the summer of 2005, NCES released two impor-tant studies which provide additional context for American Indian and Alaska Native education. Status and Trends in the Education of American Indians and Alaska Natives (Freeman and Fox 2005) provided a current and thorough description of demographic information (e.g., population growth, geographic distribution, tribes, socioeconomic data), educa-tional information (e.g., enrollment in vari ous school types, absenteeism and dropout rates, coursework), and social/educational environments (e.g., access to computers, leisure activities). It also included NAEP achievement data from 2003. This report can be accessed at http://nces.ed.gov/pubs2005/2005108.pdf. American Indian and Alaska Native Children: Findings From the Base Year of the Early Childhood Longitudinal Study, Birth Cohort (Flanagan and Park 2005) profiled American Indian and Alaska Native children born in the year 2001. When the children were about 9 months of age, the study interviewed parents (typically the mother), assessed children, and gathered information directly from the children’s father. This report focused on the information gathered from American Indian and Alaska Native children and their families, providing basic demo-graphic information on the children, information on some of their specific mental and physical skills, a brief profile of their experiences in child care, and some descriptive information on the percentage of children with fathers in their lives. This report can be accessed at http://nces.ed.gov/pubs2005/2005116.pdf.
PurposeAmerican Indian/Alaska Native students represent about 1 percent of the total student population in the United States (Freeman and Fox 2005, p. 30). While sufficient for reliable reporting of national-level results, a typical NAEP American Indian/Alaska Native sample is not large enough to provide reliable results by state or by region, or for variables such as gender, eligibility for free/reduced-price school lunch, or type of geographic location of the schools. Because the purpose of the current study was to probe more deeply into the reading and mathemat-ics achievement of American Indian/Alaska Native students, the NAEP samples for this population of students were increased to permit reporting of per-formance in greater detail.
The current report, focused on the NAEP perfor-mance of American Indian/Alaska Native fourth- and eighth-graders, is more limited in scope than the comprehensive social and educational status report of the Indian Nations At Risk Task Force of 1991 and the recent Status and Trends report. However, the present report does set a baseline for 21st century reading and mathematics performance of American Indian/Alaska Native students in grades 4 and 8. Future reports will build on this information to form a more complete picture of the status of education for American Indian/Alaska Native students in the United States.
What Was Assessed?
Reading The NAEP reading framework specifies the assess-ment of reading in English in three contexts: reading for literary experience, reading to gain informa-tion, and reading to perform a task. Each context for reading is associated with a range of different types of texts that are included in the NAEP read-ing assessment. All three contexts for reading are assessed at grade 8, but reading to perform a task is not assessed at grade 4. The reading framework specifies four “aspects of reading” that represent the types of comprehension questions asked of students. Each comprehension question in the NAEP assess-ment measures one of the fol lowing four aspects of reading: 1) forming a general understanding, 2)

N A T I O N A L I N D I A N E D U C A T I O N S T U D Y : 2 0 0 53
developing interpretation, 3) making reader/text connections, and 4) examining content and struc-ture. All four aspects of reading are assessed at both grades 4 and 8 for each context for reading relevant to that grade. The reading framework specifies the percentage distribution of questions by grade level for each of the contexts for and aspects of reading.
The assessment contains reading materials that were drawn from sources commonly available to students both in and out of the school environment. These materials were considered to be representative of students’ typical reading experiences. Each student in the assessment was asked to complete two 25-min-ute sections, each consisting of a reading passage and associated comprehension questions. A combination of multiple-choice and constructed-response ques-tions was used to assess students’ understanding of the passages. Constructed-response questions require students to provide their own written response to an open-ended question. Short constructed-response questions may require a response of only a sentence or two for the answer to be considered complete. Extended constructed-response questions, however, may require a response of a paragraph or more for the answer to receive full credit. Each constructed-response question has its own unique scoring guide that is used by trained scorers to rate students’ responses. (See chapter 4 for more information about the Reading Framework.)
MathematicsThe NAEP mathematics framework calls for ques-tions based on five mathematics content areas: number properties and operations, measurement, geometry, data analysis and probability, and algebra. The mathematics framework classifies test items in two dimensions: content area and mathematical complexity. A combination of multiple-choice and constructed-response questions was used to assess students’ mathematics performance. Short con-structed-response questions ask students to provide the answer for a numerical problem or to briefly describe the solution to a problem. Longer construct-ed-response questions require students to produce both a solution and a justification, explanation, or interpretation for the solution. The framework incor-porates the use of calculators (four-function at grade 4 and scientific at grade 8), rulers, protractors (grade 8), and manipulatives such as spinners and geomet-
ric shapes. The use of these ancillary materials and the use of calculators were incorporated into some parts of the assessment, but not all. Calculator use was permitted on approximately one-third of the test questions. (See chapter 4 for more information about the Mathematics Framework.)
Sample DesignThe NIES sample was designed as an augmentation of the 2005 NAEP reading and mathematics assess-ment samples of American Indian and Alaska Native students in the fourth and eighth grades. While American Indian and Alaska Native students have been sampled for inclusion in the nationally repre-sentative NAEP assessments administered in the past, the expanded sample provides more reliable esti-mates of American Indian and Alaska Native student performance on the NAEP reading and mathematics assessments.
The sample design for the 2005 NAEP reading and mathematics assessments consists of individual state samples and an aggregated national sample. The combined national sample comprises a nation-ally representative sample of students from public schools, private schools, Department of Defense Schools, and Bureau of Indian Affairs (BIA) schools. The expanded NIES sample permits the reporting of results for American Indian and Alaska Native stu-dents in the nation, in regions, and in selected states that were identified as having the largest proportion of American Indian and Alaska Native students as a percentage of the state’s total population. In each of these selected states, more than 5 percent of the stu-dent population is American Indian or Alaska Native; almost 50 percent of the nation’s American Indian and Alaska Native students reside in these states.
NAEP typically reports state-level results for fourth- and eighth-grade public school students only. In contrast, the state-level results reported in the NIES are for public school plus BIA school students. As noted above, the NIES focused on states with relatively high proportions of American Indian and Alaska Native students. The seven states that are dis-cussed in this report are Alaska, Arizona, Montana, New Mexico, North Dakota, Oklahoma, and South Dakota. In addition to the national and state-level results, results for American Indian/Alaska Native students are also presented for 5 regions of the country.

C h a p t e r 14
See figure 1-1 for a map of the regions and the selected states (shown by bold borders and fully spelled-out names).
In reading, nationally representative samples of about 166,000 fourth-grade and 159,000 eighth-grade students participated in the assessment nationwide. Of these, approximately 3,800 American Indian/Alaska Native students participated at grade 4,and approximately 3,400 American Indian/Alaska Native students participated at grade 8 (table A-1). At the regional level, the number of participating American Indian/Alaska Native students ranged from 200 to 1,200 students (table A-2). In the seven selected states, the number of American Indian/
Alaska Native students ranged from 200 to 600 students (table A-3). Student-weighted school par-ticipation rates ranged from 96 to 97 percent (table A-1).
In mathematics, about 172,000 fourth-grade and 162,000 eighth-grade students participated in the assessment nationally. Of these, approximately 3,900 American Indian/Alaska Native students partici-pated at grade 4, and approximately 3,500 American Indian/Alaska Native students participated at grade 8 (table A-1). At the regional level, the number of participating American Indian/Alaska Native students ranged from 200 to 1,200 students (table A-2). In the seven selected states, the number of American
Figure 1-1. Regions and selected states for the National Indian Education Study: 2005
map2.eps
NOTE: Selected states are shown with bold borders and fully spelled-out names. These states were identifi ed by NAEP as having the largest proportion of American Indian/Alaska Native students as a percentage of the state's total population. Regions referenced in the fi gure were defi ned by NAEP exclusively for the 2005 National Indian Education Study.SOURCE: U.S. Department of Education, Institute of Education Sciences, National Center for Education Statistics, National Assessment of Educational Progress (NAEP), 2005 National Indian Education Study.
CO
FL
ID
ILMD
MI
MO
PA
SC
UT
AL
AR
CA
DC
GA
HI
KY
LA
MS
NV
RI
TN
WVDE
CT
IN
KS
ME
MA
MN
NE
NH
NJ
NY
NC
OR
TX
VT
VA
WA
WI
WY
IA
OH
Atlantic
North Central
South Central
Mountain
Pacific
Montana
Arizona
Alaska
North Dakota
South Dakota
New MexicoOklahoma
REGION
N A T I O N A L I N D I A N E D U C A T I O N S T U D Y : 2 0 0 55
Indian/Alaska Native students ranged from 200 to 600 students (table A-3). Student-weighted school participation rates ranged from 96 to 97 percent (table A-1).
This report contains comparisons of American Indian/Alaska Native student performance to the performance of all other students in the nation or region (i.e., comparisons of American Indian and Alaska Native students to students who are neither American Indian nor Alaska Native).
In addition, the sections discussing state results present comparisons between the performance results of American Indian/Alaska Native students within each state and those of American Indian/Alaska Native students in each of the other selected states, and to the performance results of the national sample of American Indian/Alaska Native students. It should be noted that the national and regional results include American Indian and Alaska Native students in all schools (public, private, Department of Defense, and BIA), while the state results are based on samples of American Indian and Alaska Native students in public and BIA schools only; however, the percentage of American Indian and Alaska Native students who are enrolled in schools other than public and BIA schools nationally is very small (between 1 and 2 percent, unweighted).
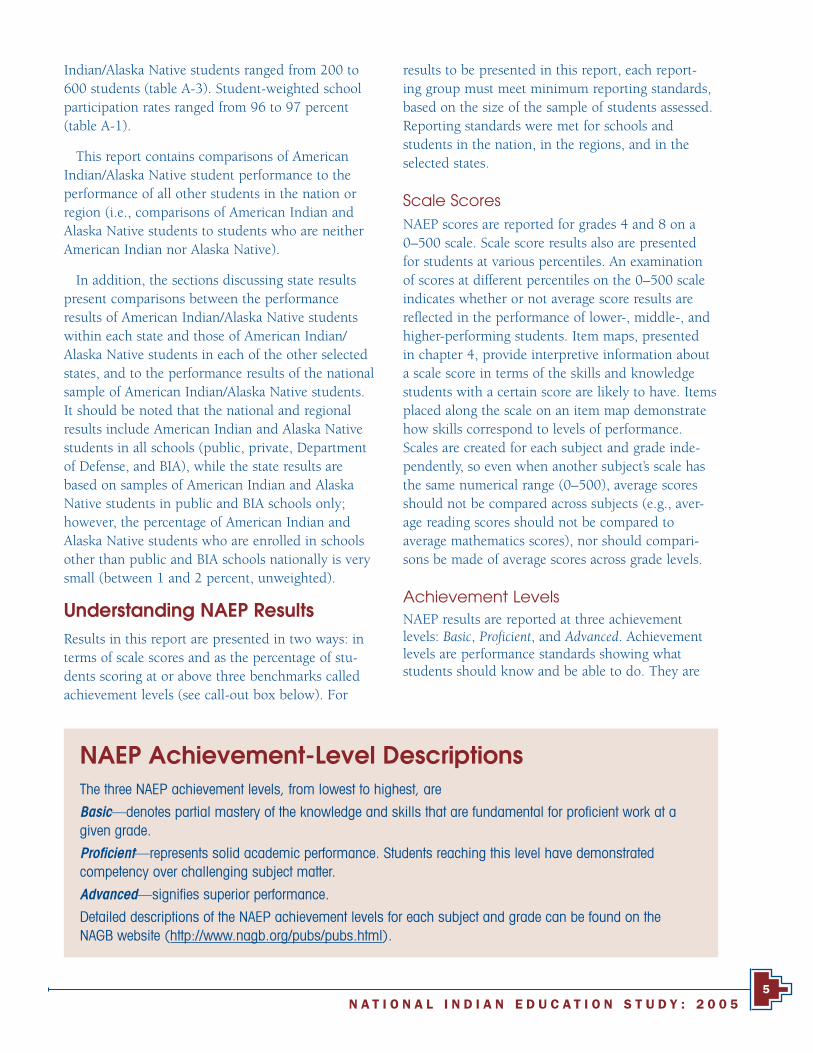
Understanding NAEP ResultsResults in this report are presented in two ways: in terms of scale scores and as the percentage of stu-dents scoring at or above three benchmarks called achievement levels (see call-out box below). For
results to be presented in this report, each report-ing group must meet minimum reporting standards, based on the size of the sample of students assessed. Reporting standards were met for schools and students in the nation, in the regions, and in the selected states.
Scale ScoresNAEP scores are reported for grades 4 and 8 on a 0–500 scale. Scale score results also are presented for students at various percentiles. An examination of scores at different percentiles on the 0–500 scale indicates whether or not average score results are reflected in the performance of lower-, middle-, and higher-performing students. Item maps, presented in chapter 4, provide interpretive information about a scale score in terms of the skills and knowledge students with a certain score are likely to have. Items placed along the scale on an item map demonstrate how skills correspond to levels of performance. Scales are created for each subject and grade inde-pendently, so even when another subject’s scale has the same numerical range (0–500), average scores should not be compared across subjects (e.g., aver-age reading scores should not be compared to average mathematics scores), nor should compari-sons be made of average scores across grade levels.
Achievement LevelsNAEP results are reported at three achievement levels: Basic, Proficient, and Advanced. Achievement levels are performance standards showing what students should know and be able to do. They are
NAEP Achievement-Level DescriptionsThe three NAEP achievement levels, from lowest to highest, are
Basic—denotes partial mastery of the knowledge and skills that are fundamental for profi cient work at a given grade.
Profi cient—represents solid academic performance. Students reaching this level have demonstrated competency over challenging subject matter.
Advanced—signifi es superior performance.
Detailed descriptions of the NAEP achievement levels for each subject and grade can be found on the NAGB website (http://www.nagb.org/pubs/pubs.html).

C h a p t e r 16
set by the National Assessment Governing Board (NAGB), based on recommendations from panels of educators and members of the public, to provide a context for interpreting student performance on NAEP. In this report, the achievement-level results are reported as percentages of students perform-ing at or above Basic and at or above Proficient. As provided by law, the National Center for Education Statistics (NCES), upon review of congressionally mandated evaluations of NAEP, has determined that achievement levels are to be used on a trial basis and should be interpreted with caution. However, NCES and NAGB have affirmed the usefulness of these performance standards for understanding trends in achievement.
Interpreting ResultsA number of statistical standards are followed in NAEP reports for the public. For example, states and jurisdictions must achieve an 85 percent par-ticipation rate of sampled schools for the data to be reported publicly. Also, in order to assure statisti-cally reliable results, categories with sample sizes of fewer than 62 students or 5 primary sampling units (schools) are not reported.
Because NAEP is a sample survey, and because no test can measure achievement perfectly, each score or percentage is associated with a margin of error. Appropriate statistical tests are performed to determine whether differences between percent-ages of students, scale scores, and achievement-level percentages are statistically significant, that is, larger than the margin of error. Estimates based on smaller student groups are likely to have relatively large stan-dard errors, because the smaller the sample, the less representative it is of the population in question. As a consequence, some differences that seem large may not be statistically significant. That is, it cannot be determined whether these differences are due to the particular makeup of the samples of students who were randomly selected, or to true differences in the population of interest.
Therefore, the reader is cautioned that only those differences that are discussed in the text, or that are indicated with asterisks in the figures and tables, have been determined to be statistically signifi-cant using the criteria established for this report. Differences between scale scores or percentages are calculated using unrounded numbers. In some
instances, the result of the subtraction differs from what would be obtained by subtracting the rounded values shown in the accompanying figure or table. A full discussion of the method by which statisti-cal significance was determined for the comparisons discussed in this report is presented in the Technical Notes.
Cautions in InterpretationIt is important to note that a relationship between a variable and measures of educational achievement, like the ones presented in this report, does not imply that a difference in the variable causes differences in educational achievement. There are many reasons why the performance of one group of students differs from another, including ones that are not measured in NAEP.
This report is purely descriptive in nature. Readers are cautioned not to draw causal inferences based solely on the results presented here. It is important to note that many of the grouping variables exam-ined in this report (e.g., race/ethnicity, eligibility for free/reduced-price school lunch, type of school location) are correlated with one another, and com-plex interactions and relationships have not been explored here.
About This ReportThis report describes the reading and mathemat-ics performance of American Indian/Alaska Native students at grades 4 and 8, based on data from the 2005 NAEP assessment. Chapter 2 examines reading results for the nation, for regions, for selected states, and for groups of students defined by race/ethnic-ity, eligibility for free/reduced-price school lunch, gender, type of school location, and student-reported level of parental education (grade 8 only). Chapter 3 provides mathematics results in the same categories. Chapter 4 presents information about the assess-ment design, including the frameworks, item maps, and sample questions for each of the respective assessments. The Technical Notes section discusses technical procedures and terms, and contains a table which shows the standard deviations of the scores of American Indian/Alaska Native students and of all other students for each subject and grade. The Data Appendix provides tables with additional details, including standard errors, for the data presented in figures in the text.

N A T I O N A L I N D I A N E D U C A T I O N S T U D Y : 2 0 0 57
Chapter 2Reading Results, Grades 4 and 8
This chapter provides results from the 2005 NAEP reading assessment at grades 4 and 8 for the nation, for regions, for selected states, and for student groups.
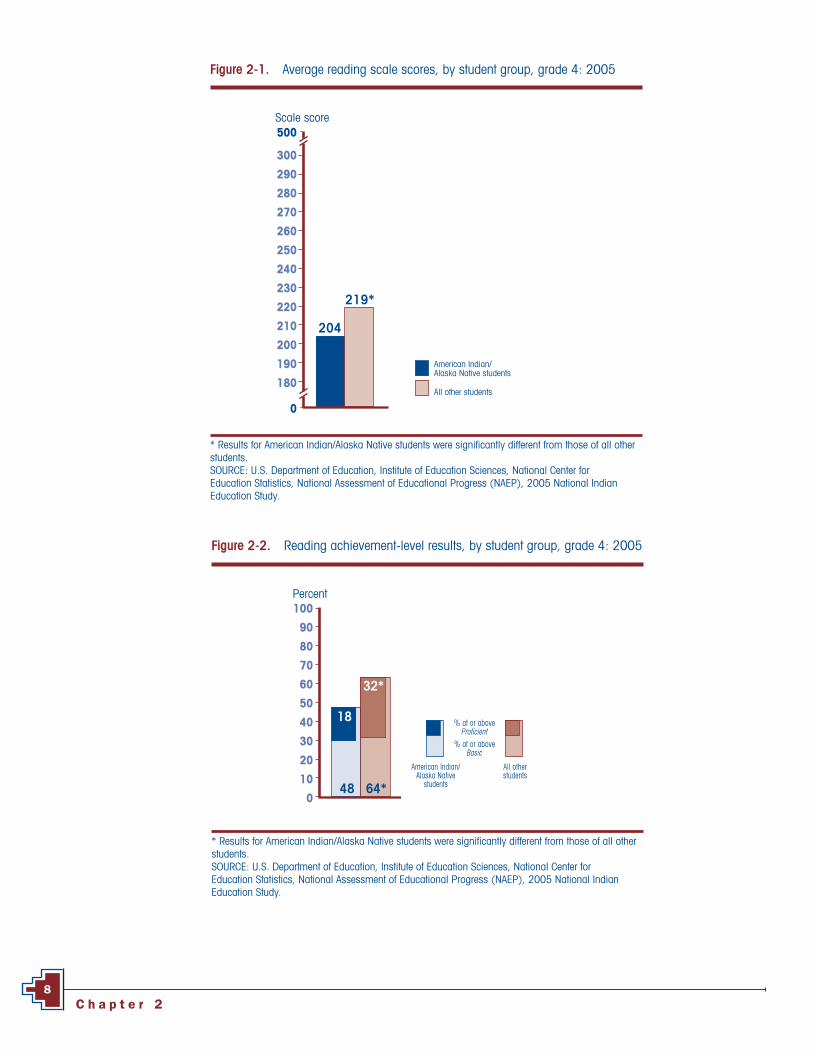
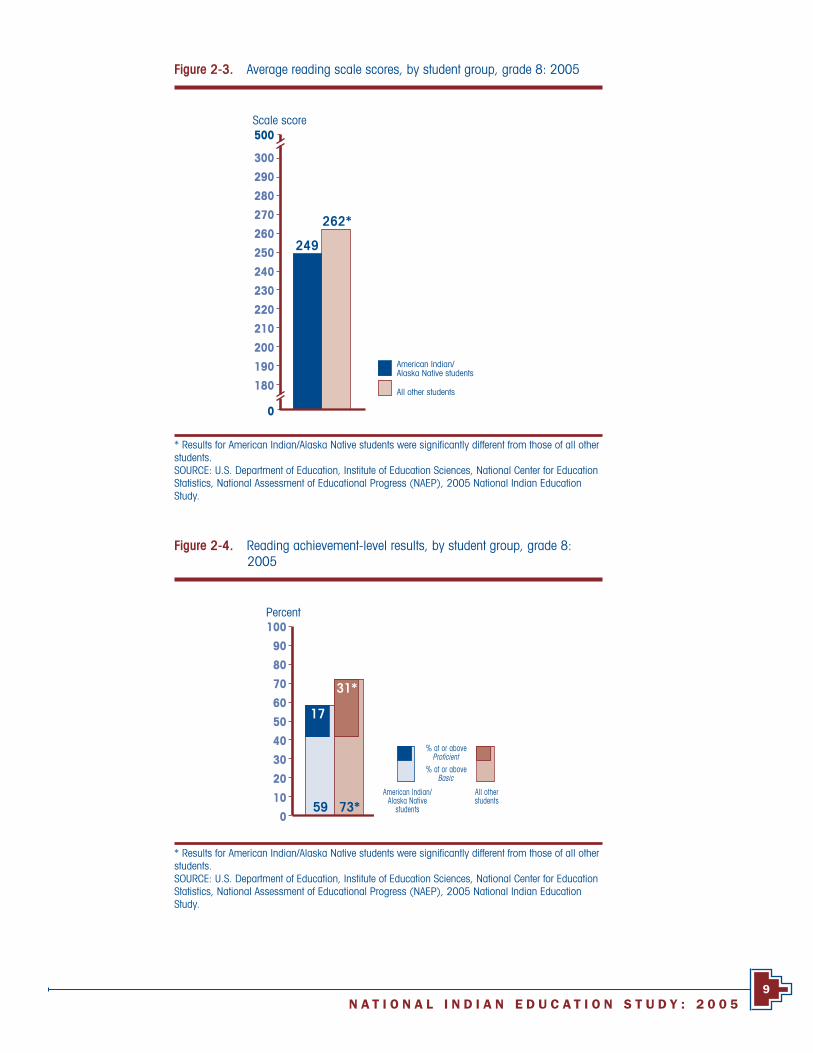
National ResultsFigures 2-1 and 2-3 show the average reading scores in 2005 for American Indian/Alaska Native students and all other students at grades 4 and 8, respectively. Figures 2-2 and 2-4 show the reading achievement-level results for each grade. In this report, the figures presenting achieve-ment-level results show the percentage of students performing at or above Proficient in a bar nested within the bar representing the percentage at or above Basic, indicating that the percent-age of students at or above Basic includes those performing at or above Proficient.
At both grades 4 and 8, American Indian/Alaska Native students scored lower, on average, in reading than the average of all other students in the nation (students who are neither American Indian nor Alaska Native). The percentages of students performing at or above Basic and at or above Proficient in reading were also lower for American Indian/Alaska Native students than for all other students at both grades.
C h a p t e r 28
Figure 2-1. Average reading scale scores, by student group, grade 4: 2005
4r-ss01-nat
* Results for American Indian/Alaska Native students were signifi cantly different from those of all other students.SOURCE: U.S. Department of Education, Institute of Education Sciences, National Center for Education Statistics, National Assessment of Educational Progress (NAEP), 2005 National Indian Education Study.
All other students
American Indian/Alaska Native students
204
219*
0
500Scale score
300
290
280
270
260
250
240
230
220
210
200
190
180
Figure 2-2. Reading achievement-level results, by student group, grade 4: 2005
4r-al01-nat
* Results for American Indian/Alaska Native students were signifi cantly different from those of all other students.SOURCE: U.S. Department of Education, Institute of Education Sciences, National Center for Education Statistics, National Assessment of Educational Progress (NAEP), 2005 National Indian Education Study.
% at or aboveProficient
% at or aboveBasic
American Indian/Alaska Native
students
All otherstudents
Percent100
90
80
70
60
50
40
30
20
10
0
18
32*
48 64*
N A T I O N A L I N D I A N E D U C A T I O N S T U D Y : 2 0 0 59
Figure 2-3. Average reading scale scores, by student group, grade 8: 2005
8r-ss01-nat
* Results for American Indian/Alaska Native students were signifi cantly different from those of all other students.SOURCE: U.S. Department of Education, Institute of Education Sciences, National Center for Education Statistics, National Assessment of Educational Progress (NAEP), 2005 National Indian Education Study.
All other students
American Indian/Alaska Native students
249
262*
0
500Scale score
300
290
280
270
260
250
240
230
220
210
200
190
180
Figure 2-4. Reading achievement-level results, by student group, grade 8: 2005
8r-al01-nat
* Results for American Indian/Alaska Native students were signifi cantly different from those of all other students.SOURCE: U.S. Department of Education, Institute of Education Sciences, National Center for Education Statistics, National Assessment of Educational Progress (NAEP), 2005 National Indian Education Study.
% at or aboveProficient
% at or aboveBasic
American Indian/Alaska Native
students
All otherstudents
Percent100
90
80
70
60
50
40
30
20
10
0
17
31*
59 73*

C h a p t e r 210
Table 2-1 presents the 2005 reading achievement-level results as the percentage of students performing within each achievement level at each grade. The percentages of students performing at Proficient and at Advanced were lower for American Indian/Alaska Native students than for all other students at both grades. At grade 4, the percentages of American Indian/Alaska Native students performing at Basic were also lower than for all other students.
Comparing Scores Among Lower-, Middle-, and Higher-Performing StudentsExamining performance of students at selected per-centiles can indicate when the overall picture for students diverges by lower-, middle-, or higher-scoring students. A percentile indicates the per-centage of students whose scores fell at or below a particular score on the NAEP reading scale. For example, the results presented in table 2-2 for stu-dents at grade 4 show that 50 percent of American Indian/Alaska Native students scored at or below 206 and 50 percent of all other students scored at or below 222. At each of the five percentiles analyzed, the score for American Indian/Alaska Native students was lower than the score for all other students at both grades 4 and 8.
Table 2-2. Reading scale scores at selected percentiles, by student group, grades 4 and 8: 2005
Student group
Percentile
10th 25th 50th 75th 90th
Grade 4
American Indian/Alaska Native students 154 179 206 230 251
All other students 171* 196* 222* 244* 263*
Grade 8
American Indian/Alaska Native students 204 227 251 273 292
All other students 216* 240* 265* 287* 305*
* Results for American Indian/Alaska Native students were signifi cantly different from those of all other students.SOURCE: U.S. Department of Education, Institute of Education Sciences, National Center for Education Statistics, National Assessment of Educational Progress (NAEP), 2005 National Indian Education Study.
Percent
Student group Below Basic At Basic At Profi cient At Advanced
Grade 4
American Indian/Alaska Native students 52 30 15 3
All other students 36* 33* 24* 8*
Grade 8
American Indian/Alaska Native students 41 41 16 1
All other students 27* 42 28* 3*
Table 2-1. Achievement-level results in reading, by student group, grades 4 and 8: 2005
* Results for American Indian/Alaska Native students were signifi cantly different from those of all other students.NOTE: Detail may not sum to totals because of rounding.SOURCE: U.S. Department of Education, Institute of Education Sciences, National Center for Education Statistics, National Assessment of Educational Progress (NAEP), 2005 National Indian Education Study.

N A T I O N A L I N D I A N E D U C A T I O N S T U D Y : 2 0 0 511
Results by Region of the CountryIn addition to the national results, reading performance is reported for five regions: Atlantic, North Central, South Central, Mountain, and Pacific. These NIES regions, which differ from the typical regions used in other NAEP reports, are based on U.S. Census divisions, and are configured to align with the distribution of the American Indian/Alaska Native student population. The regional samples are composed of the samples for the states that make up each defined region (figure 1-1).
Grade 4As shown in figure 2-5, American Indian/Alaska Native students scored lower on average than all other students in all the regions.
The achievement-level results, presented in figure 2-6, show lower percentages of American Indian/Alaska Native students than all other students perform-ing at or above Basic and at or above Proficient in the Atlantic, North Central, and Mountain regions.
The difference in average scores, or “score gap,” between all other students and American Indian/Alaska Native students is 15 points at the national level (figure 2-1). The score gap in the Mountain region (27 points) is greater than the gap in the nation, and the gaps in the South Central region (5 points) and in the Pacific region (6 points) are smaller than the gap in the nation. Comparing the perfor-mance differences within each
Figure 2-5. Average reading scale scores, by student group and region, grade 4: 2005
4r-ss02-reg
* Results for American Indian/Alaska Native students were signifi cantly different from those of all other students in the same region.SOURCE: U.S. Department of Education, Institute of Education Sciences, National Center for Education Statistics, National Assessment of Educational Progress (NAEP), 2005 National Indian Education Study.
Figure 2-6. Reading achievement-level results, by student group and region, grade 4: 2005
4r-al02-reg
* Results for American Indian/Alaska Native students were signifi cantly different from those of all other students in the same region.SOURCE: U.S. Department of Education, Institute of Education Sciences, National Center for Education Statistics, National Assessment of Educational Progress (NAEP), 2005 National Indian Education Study.
All other students
American Indian/Alaska Native students
223*
207210
222*212
217*
190
217*
206212*
Atlantic NorthCentral
SouthCentral
Mountain Pacific0
500Scale score
300
290
280
270
260
250
240
230
220
210
200
190
180
Atlantic NorthCentral
SouthCentral
Mountain Pacific
Percent100
90
80
70
60
50
40
30
20
10
0
24 28
10
30*
2126
35*
18
34*
58 62 32 63* 50 5668* 51
20
55 68*
% at or aboveProficient
% at or aboveBasic
American Indian/Alaska Native
students
All otherstudents

C h a p t e r 212
of the regions, the gap in the Mountain region is significantly larger than the gaps in the other four regions (figure 2-5).
Grade 8As shown in figure 2-7, American Indian/Alaska Native students in the North Central, Mountain, and Pacific regions had lower average reading scores than all other students in the same region. As shown in figure 2-8, lower percentages of American Indian/Alaska Native students than of all other students in the North Central, Mountain, and Pacific regions performed at or above Basic and at or above Proficient.
At the national level, the differ-ence in average scores, or “score gap,” between all other students and American Indian/Alaska Native students is 13 points (figure 2-3). The score gap in the Mountain region (21 points) is greater than the gap in the nation, and the gaps in the South Central region (3 points) and in the Atlantic region (4 points) are smaller. Comparing the perfor-mance differences within each of the regions, the gap in the Mountain region is significantly larger than the gaps in the other four regions (figure 2-7).
Selected State ResultsSpecific states with relatively large populations of American Indian/Alaska Native students were selected for this study. Readers are cautioned, however, to consider that each of the selected states represents a different educational context and that comparisons
Figure 2-7. Average reading scale scores, by student group and region, grade 8: 2005
8r-ss02-reg
* Results for American Indian/Alaska Native students were signifi cantly different from those of all other students in the same region.SOURCE: U.S. Department of Education, Institute of Education Sciences, National Center for Education Statistics, National Assessment of Educational Progress (NAEP), 2005 National Indian Education Study.
All other students
American Indian/Alaska Native students
260265
256
267*
256 259
239
261*
246256*
Atlantic NorthCentral
SouthCentral
Mountain Pacific0
500Scale score
300
290
280
270
260
250
240
230
220
210
200
190
180
Figure 2-8. Reading achievement-level results, by student group and region, grade 8: 2005
8r-al02-reg
* Results for American Indian/Alaska Native students were signifi cantly different from those of all other students in the same region.SOURCE: U.S. Department of Education, Institute of Education Sciences, National Center for Education Statistics, National Assessment of Educational Progress (NAEP), 2005 National Indian Education Study.
Atlantic NorthCentral
SouthCentral
Mountain Pacific
Percent100
90
80
70
60
50
40
30
20
10
0
23 27
10
29*
1725*
26 3420
35*
68 70 46 71* 55 65*72 75 68 78*
% at or aboveProficient
% at or aboveBasic
American Indian/Alaska Native
students
All otherstudents
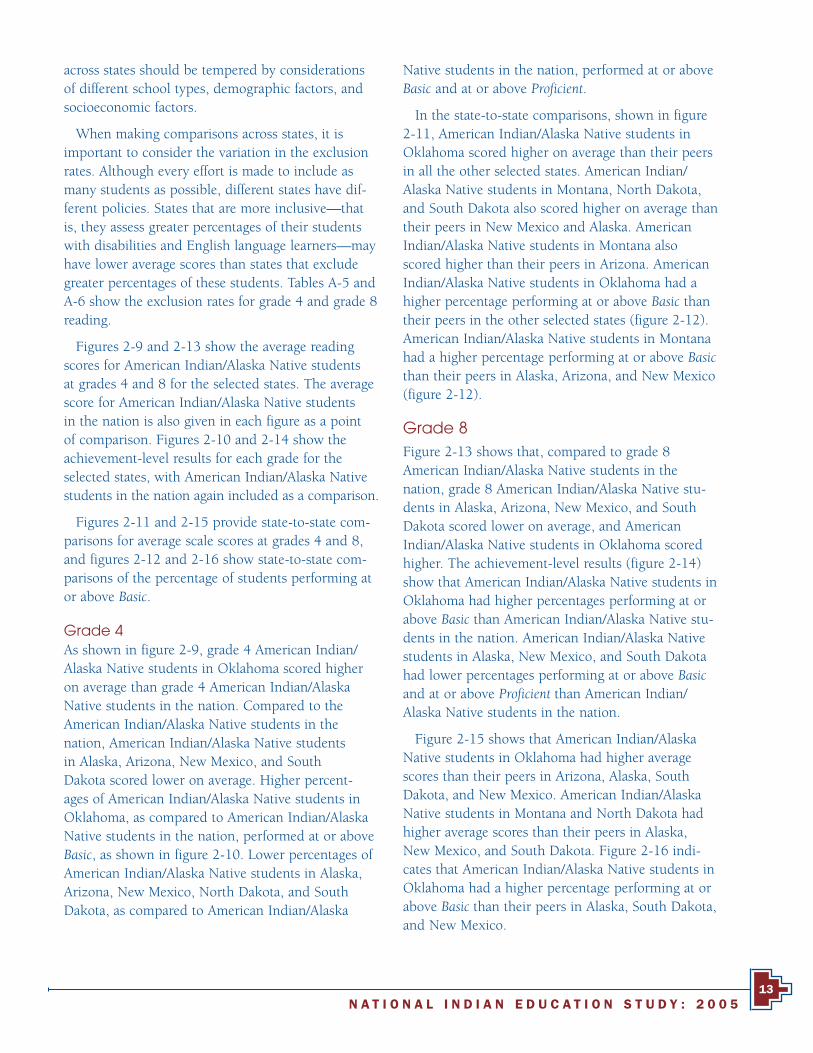
N A T I O N A L I N D I A N E D U C A T I O N S T U D Y : 2 0 0 513
across states should be tempered by considerations of different school types, demographic factors, and socioeconomic factors.
When making comparisons across states, it is important to consider the variation in the exclusion rates. Although every effort is made to include as many students as possible, different states have dif-ferent policies. States that are more inclusive—that is, they assess greater percentages of their students with disabilities and English language learners—may have lower average scores than states that exclude greater percentages of these students. Tables A-5 and A-6 show the exclusion rates for grade 4 and grade 8 reading.
Figures 2-9 and 2-13 show the average reading scores for American Indian/Alaska Native students at grades 4 and 8 for the selected states. The average score for American Indian/Alaska Native students in the nation is also given in each figure as a point of comparison. Figures 2-10 and 2-14 show the achievement-level results for each grade for the selected states, with American Indian/Alaska Native students in the nation again included as a comparison.
Figures 2-11 and 2-15 provide state-to-state com-parisons for average scale scores at grades 4 and 8, and figures 2-12 and 2-16 show state-to-state com-parisons of the percentage of students performing at or above Basic.
Grade 4As shown in figure 2-9, grade 4 American Indian/Alaska Native students in Oklahoma scored higher on average than grade 4 American Indian/Alaska Native students in the nation. Compared to the American Indian/Alaska Native students in the nation, American Indian/Alaska Native students in Alaska, Arizona, New Mexico, and South Dakota scored lower on average. Higher percent-ages of American Indian/Alaska Native students in Oklahoma, as compared to American Indian/Alaska Native students in the nation, performed at or above Basic, as shown in figure 2-10. Lower percentages of American Indian/Alaska Native students in Alaska, Arizona, New Mexico, North Dakota, and South Dakota, as compared to American Indian/Alaska
Native students in the nation, performed at or above Basic and at or above Proficient.
In the state-to-state comparisons, shown in figure 2-11, American Indian/Alaska Native students in Oklahoma scored higher on average than their peers in all the other selected states. American Indian/Alaska Native students in Montana, North Dakota, and South Dakota also scored higher on average than their peers in New Mexico and Alaska. American Indian/Alaska Native students in Montana also scored higher than their peers in Arizona. American Indian/Alaska Native students in Oklahoma had a higher percentage performing at or above Basic than their peers in the other selected states (figure 2-12). American Indian/Alaska Native students in Montana had a higher percentage performing at or above Basic than their peers in Alaska, Arizona, and New Mexico (figure 2-12).
Grade 8Figure 2-13 shows that, compared to grade 8 American Indian/Alaska Native students in the nation, grade 8 American Indian/Alaska Native stu-dents in Alaska, Arizona, New Mexico, and South Dakota scored lower on average, and American Indian/Alaska Native students in Oklahoma scored higher. The achievement-level results (figure 2-14) show that American Indian/Alaska Native students in Oklahoma had higher percentages performing at or above Basic than American Indian/Alaska Native stu-dents in the nation. American Indian/Alaska Native students in Alaska, New Mexico, and South Dakota had lower percentages performing at or above Basic and at or above Proficient than American Indian/Alaska Native students in the nation.
Figure 2-15 shows that American Indian/Alaska Native students in Oklahoma had higher average scores than their peers in Arizona, Alaska, South Dakota, and New Mexico. American Indian/Alaska Native students in Montana and North Dakota had higher average scores than their peers in Alaska, New Mexico, and South Dakota. Figure 2-16 indi-cates that American Indian/Alaska Native students in Oklahoma had a higher percentage performing at or above Basic than their peers in Alaska, South Dakota, and New Mexico.
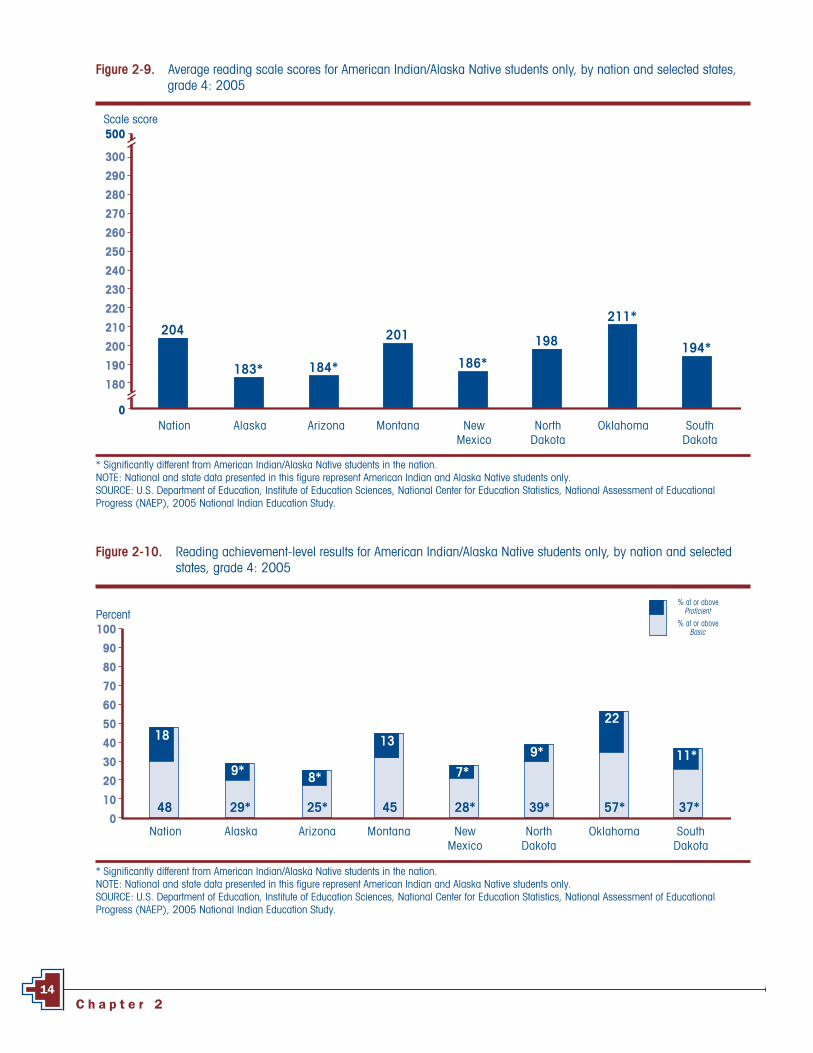
C h a p t e r 214
Figure 2-9. Average reading scale scores for American Indian/Alaska Native students only, by nation and selected states, grade 4: 2005
4r-ss03-st
* Signifi cantly different from American Indian/Alaska Native students in the nation.NOTE: National and state data presented in this fi gure represent American Indian and Alaska Native students only.SOURCE: U.S. Department of Education, Institute of Education Sciences, National Center for Education Statistics, National Assessment of Educational Progress (NAEP), 2005 National Indian Education Study.
183* 184*
201
186*
198
211*
194*
Alaska Arizona Montana NewMexico
NorthDakota
Oklahoma SouthDakota
204
Nation0
500Scale score
300
290
280
270
260
250
240
230
220
210
200
190
180
Figure 2-10. Reading achievement-level results for American Indian/Alaska Native students only, by nation and selected states, grade 4: 2005
4r-al03-st
* Signifi cantly different from American Indian/Alaska Native students in the nation.NOTE: National and state data presented in this fi gure represent American Indian and Alaska Native students only.SOURCE: U.S. Department of Education, Institute of Education Sciences, National Center for Education Statistics, National Assessment of Educational Progress (NAEP), 2005 National Indian Education Study.
25*
8*
Alaska Arizona Montana NewMexico
NorthDakota
Oklahoma SouthDakota
Percent100
90
80
70
60
50
40
30
20
10
045
13
28*
7*
39*
9*
57*
22
37*
11*
29*
9*
Nation
48
18
% at or aboveProficient
% at or aboveBasic

N A T I O N A L I N D I A N E D U C A T I O N S T U D Y : 2 0 0 515
Figure 2-12. Cross-state comparison of the percentages of American Indian/Alaska Native students performing at or above Basic in reading, grade 4: 2005
4r-ml02-ab
NOTE: Read across the row corresponding to a state listed to the left of the chart. Match the shading intensity (and arrow direction) to the chart’s key to determine whether the percentage of students in this state performing at or above Basic was found to be higher than (up arrow), not signifi cantly different from (blank cell), or lower than (down arrow) the percentage of students performing at or above Basic in the state in the column heading. SOURCE: U.S. Department of Education, Institute of Education Sciences, National Center for Education Statistics, National Assessment of Educational Progress (NAEP), 2005 National Indian Education Study.
� � � � �
� �
�
�
�
�
�
� �
�
�
� �
Oklahoma
Montana
North Dakota
South Dakota
New Mexico
Arizona
Alaska
Okl
ahom
a
Mon
tana
Nor
th D
akot
a
Sout
h D
akot
a
New
Mex
ico
Ariz
ona
Alas
ka
Figure 2-11. Cross-state comparison of average reading scale scores for American Indian/Alaska Native students, grade 4: 2005
4r-ml01-as
NOTE: Read across the row corresponding to a state listed to the left of the chart. Match the shading intensity (and arrow direction) to the chart’s key to determine whether the average score for students in this state was found to be higher than (up arrow), not signifi cantly different from (blank cell), or lower than (down arrow) the average score for students in the state in the column heading. SOURCE: U.S. Department of Education, Institute of Education Sciences, National Center for Education Statistics, National Assessment of Educational Progress (NAEP), 2005 National Indian Education Study.
� � � � �
� �
�
�
�
�
�
� �
�
�
�
� �
� �
�
� � � �
Oklahoma
Montana
North Dakota
South Dakota
New Mexico
Arizona
Alaska
Okl
ahom
a
Mon
tana
Nor
th D
akot
a
Sout
h D
akot
a
New
Mex
ico
Ariz
ona
Alas
ka
Figures 2-11 and 2-12 compare average scores and percentages of grade 4 American Indian/Alaska
Native students performing at or above Basic in each state to those in each other state.
Students in this state had a higher average scale score than students in the state listed at the top of the column.
No statistically significant difference was detected between the average scale score for students in this state and the state listed at the top of the column.
Students in this state had a lower average scale score than students in the state listed at the top of the column.
�
�
Students in this state had a higher percentage than students in the state listed at the top of the column.
No statistically significant difference was detected between the percentage for students in this state and the state listed at the top of the column.
Students in this state had a lower percentage than students in the state listed at the top of the column.
�
�

C h a p t e r 216
Figure 2-13. Average reading scale scores for American Indian/Alaska Native students only, by nation and selected states, grade 8: 2005
8r-ss03-st
* Signifi cantly different from American Indian/Alaska Native students in the nation.NOTE: National and state data presented in this fi gure represent American Indian and Alaska Native students only.SOURCE: U.S. Department of Education, Institute of Education Sciences, National Center for Education Statistics, National Assessment of Educational Progress (NAEP), 2005 National Indian Education Study.
240* 238*247
236*
248254*
238*
Alaska Arizona Montana NewMexico
NorthDakota
Oklahoma SouthDakota
249
Nation0
500Scale score
300
290
280
270
260
250
240
230
220
210
200
190
180
Figure 2-14. Reading achievement-level results for American Indian/Alaska Native students only, by nation and selected states, grade 8: 2005
8r-al03-st
* Signifi cantly different from American Indian/Alaska Native students in the nation.NOTE: National and state data presented in this fi gure represent American Indian and Alaska Native students only.SOURCE: U.S. Department of Education, Institute of Education Sciences, National Center for Education Statistics, National Assessment of Educational Progress (NAEP), 2005 National Indian Education Study.
Alaska Arizona Montana NewMexico
NorthDakota
Oklahoma SouthDakota
Percent100
90
80
70
60
50
40
30
20
10
056
16
44*
6*
59
14
66*
19
46*
10*
49*
10*
Nation
59
17
43
11
% at or aboveProficient
% at or aboveBasic

N A T I O N A L I N D I A N E D U C A T I O N S T U D Y : 2 0 0 517
Figure 2-15. Cross-state comparison of average reading scale scores for American Indian/Alaska Native students, grade 8: 2005
8r-ml01-as
NOTE: Read across the row corresponding to a state listed to the left of the chart. Match the shading intensity (and arrow direction) to the chart’s key to determine whether the average score for students in this state was found to be higher than (up arrow), not signifi cantly different from (blank cell), or lower than (down arrow) the average score for students in the state in the column heading. SOURCE: U.S. Department of Education, Institute of Education Sciences, National Center for Education Statistics, National Assessment of Educational Progress (NAEP), 2005 National Indian Education Study.
� � �
� �
� �
�
� � �
� � �
�
�
�
� � �
Oklahoma
North Dakota
Montana
Arizona
Alaska
South Dakota
New Mexico
Okl
ahom
a
Nor
th D
akot
a
Mon
tana
Ariz
ona
Alas
ka
Sout
h D
akot
a
New
Mex
ico
Students in this state had a higher average scale score than students in the state listed at the top of the column.
No statistically significant difference was detected between the average scale score for students in this state and the state listed at the top of the column.
Students in this state had a lower average scale score than students in the state listed at the top of the column.
�
�
Figure 2-16. Cross-state comparison of the percentages of American Indian/Alaska Native students performing at or above Basic in reading, grade 8: 2005
8r-ml01-ab
NOTE: Read across the row corresponding to a state listed to the left of the chart. Match the shading intensity (and arrow direction) to the chart’s key to determine whether the percentage of students in this state performing at or above Basic was found to be higher than (up arrow), not signifi cantly different from (blank cell), or lower than (down arrow) the percentage of students performing at or above Basic in the state in the column heading. SOURCE: U.S. Department of Education, Institute of Education Sciences, National Center for Education Statistics, National Assessment of Educational Progress (NAEP), 2005 National Indian Education Study.
� �
�
�
�
�
Oklahoma
North Dakota
Montana
Arizona
Alaska
South Dakota
New Mexico
Okl
ahom
a
Nor
th D
akot
a
Mon
tana
Ariz
ona
Alas
ka
Sout
h D
akot
a
New
Mex
ico
Students in this state had a higher percentage than students in the state listed at the top of the column.
No statistically significant difference was detected between the percentage for students in this state and the state listed at the top of the column.
Students in this state had a lower percentage than students in the state listed at the top of the column.
�
�
Figures 2-15 and 2-16 compare average scores and percentages of grade 8 American Indian/Alaska
Native students performing at or above Basic in each state to those in each other state.

C h a p t e r 218
Student Group ResultsIn addition to reporting on the performance of American Indian/Alaska Native and other students overall and by region or state, NAEP also provides results for a variety of student groups for each grade level assessed.
This section includes average reading scale score and achievement-level results for groups of American Indian/Alaska Native and other students in the nation at grades 4 and 8. Results are reported by
• race/ethnicity,
• students’ eligibility for free/reduced-price school lunch,
• gender,
• type of school location, and
• parents’ highest level of education (grade 8 only).
This report is purely descriptive in nature, and the reader is cautioned not to draw causal infer-ences based solely on the results presented here. The reader should bear in mind that the estimated average scale score for a group of students does not reflect the entire range of performance (i.e., the vari-ability) within that group. A significant difference between average scores for two groups does not indi-cate that all students in one group have higher scores than all students in the second group; indeed, there may be substantial overlap in individual students’ scores across the two groups. In addition, differences in group performance cannot be ascribed solely to the students’ group identification. Average student performance is affected by the interaction of a com-plex set of educational, cultural, and social factors
not discussed in this report nor addressed by NAEP assessments. It is important to note that many of the grouping variables examined in this report (e.g., race/ethnicity, eligibility for free/reduced-price school lunch, type of school location) are correlated with one another, and complex interactions and relation-ships have not been explored here.
Race/EthnicityNAEP reports data on student race/ethnicity based on information obtained from school records. Figures 2-17 through 2-20 show results for five mutually exclusive categories: American Indian/Alaska Native, White, Black, Hispanic, and Asian/Pacific Islander. Black includes African American, Hispanic includes Latino, and Pacific Islander includes Native Hawaiian. Race categories exclude Hispanic origin. For information about the per-formance of students not classified in one of these categories, visit http://nces.ed.gov/nationsreportcard/nde.
At both grades 4 and 8, compared to Black stu-dents in the nation, American Indian/Alaska Native students had higher average scores (figures 2-17 and 2-19) and higher percentages performing at or above Basic and at or above Proficient (figures 2-18 and 2-20). American Indian/Alaska Native students had lower average scores (figures 2-17 and 2-19) and lower percentages performing at or above Basic and at or above Proficient (figures 2-18 and 2-20) than White and Asian/Pacific Islander students, while no significant difference was found between the performance of Hispanic students and American Indian/Alaska Native students on any measure (grade 4: figures 2-17 and 2-18; grade 8: figures 2-19 and 2-20).
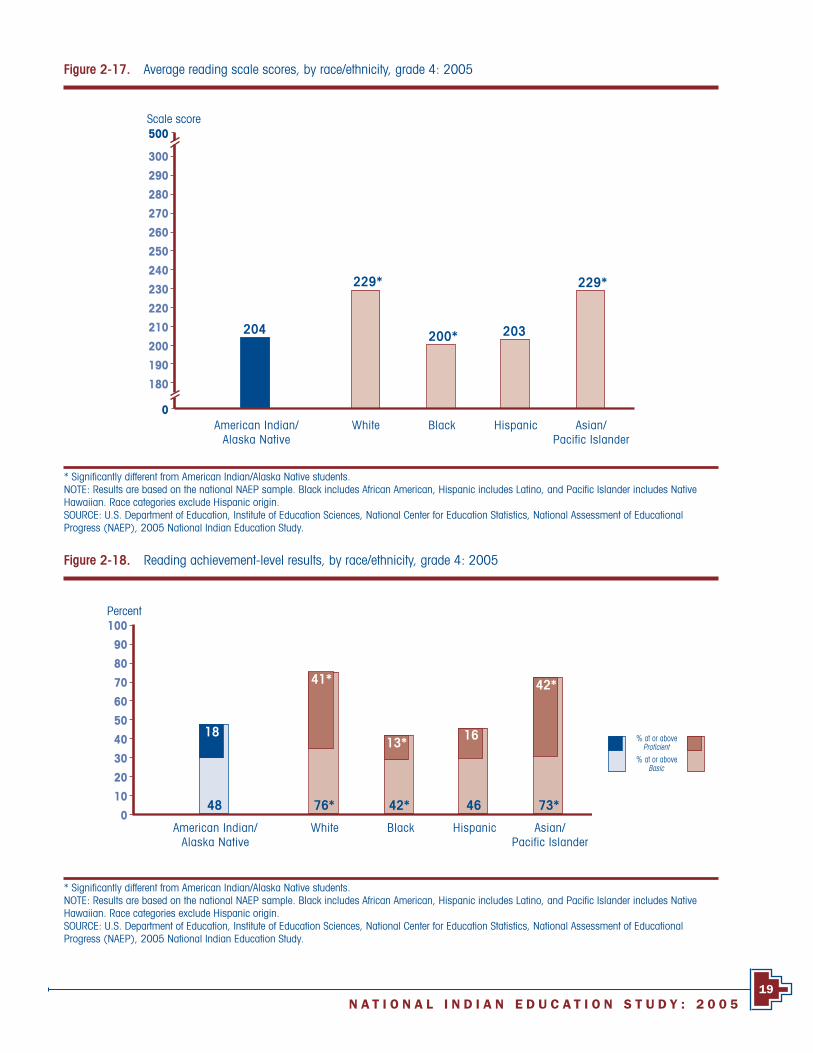
N A T I O N A L I N D I A N E D U C A T I O N S T U D Y : 2 0 0 519
Figure 2-17. Average reading scale scores, by race/ethnicity, grade 4: 2005
4r-ss05-race
* Signifi cantly different from American Indian/Alaska Native students.NOTE: Results are based on the national NAEP sample. Black includes African American, Hispanic includes Latino, and Pacifi c Islander includes Native Hawaiian. Race categories exclude Hispanic origin.SOURCE: U.S. Department of Education, Institute of Education Sciences, National Center for Education Statistics, National Assessment of Educational Progress (NAEP), 2005 National Indian Education Study.
Figure 2-18. Reading achievement-level results, by race/ethnicity, grade 4: 2005
4r-al05-race
* Signifi cantly different from American Indian/Alaska Native students.NOTE: Results are based on the national NAEP sample. Black includes African American, Hispanic includes Latino, and Pacifi c Islander includes Native Hawaiian. Race categories exclude Hispanic origin. SOURCE: U.S. Department of Education, Institute of Education Sciences, National Center for Education Statistics, National Assessment of Educational Progress (NAEP), 2005 National Indian Education Study.
% at or aboveProficient
% at or aboveBasic
204
229*
200* 203
229*
American Indian/Alaska Native
White Black Hispanic Asian/Pacific Islander
0
500Scale score
300
290
280
270
260
250
240
230
220
210
200
190
180
American Indian/Alaska Native
White Black Hispanic Asian/Pacific Islander
Percent100
90
80
70
60
50
40
30
20
10
076*
41*
42*
13*
46
16
73*
42*
48
18

C h a p t e r 220
Figure 2-19. Average reading scale scores, by race/ethnicity, grade 8: 2005
8r-ss05-race
* Signifi cantly different from American Indian/Alaska Native students.NOTE: Results are based on the national NAEP sample. Black includes African American, Hispanic includes Latino, and Pacifi c Islander includes Native Hawaiian. Race categories exclude Hispanic origin. SOURCE: U.S. Department of Education, Institute of Education Sciences, National Center for Education Statistics, National Assessment of Educational Progress (NAEP), 2005 National Indian Education Study.
% at or aboveProficient
% at or aboveBasic
249
271*
243* 246
271*
American Indian/Alaska Native
White Black Hispanic Asian/Pacific Islander
0
500Scale score
300
290
280
270
260
250
240
230
220
210
200
190
180
Figure 2-20. Reading achievement-level results, by race/ethnicity, grade 8: 2005
8r-al05-race
* Signifi cantly different from American Indian/Alaska Native students.NOTE: Results are based on the national NAEP sample. Black includes African American, Hispanic includes Latino, and Pacifi c Islander includes Native Hawaiian. Race categories exclude Hispanic origin. SOURCE: U.S. Department of Education, Institute of Education Sciences, National Center for Education Statistics, National Assessment of Educational Progress (NAEP), 2005 National Indian Education Study.
American Indian/Alaska Native
White Black Hispanic Asian/Pacific Islander
Percent100
90
80
70
60
50
40
30
20
10
082*
39*
52*
12*
56
15
80*
40*
59
17

N A T I O N A L I N D I A N E D U C A T I O N S T U D Y : 2 0 0 521
Eligibility for Free/Reduced-Price School LunchAn indicator of a student’s socio-economic status is whether or not that student is eligible for free or reduced-price lunch under the National School Lunch Program. Children from fami-lies with incomes at or below 130 percent of the poverty level are eligible for free meals. Those with incomes between 130 percent and 185 percent of the poverty level are eligible for reduced-price meals. (For the period July 1, 2004, through June 30, 2005, for a family of four, 130 percent of the poverty level was $24,505, and 185 percent was $34,873. See http://www.fns.usda.gov/cnd/lunch for more information.)
Among grade 4 reading stu-dents, 65 percent of American Indian/Alaska Native students were eligible for free or reduced-price lunch, and 41 percent of all other students were eligible. Among grade 8 reading students, 60 percent of American Indian/Alaska Native students were eli-gible for free or reduced-price lunch, and 36 percent of all other students were eligible (table A-14).If school records were not avail-able or if the school did not participate in the program, the student was classified as “Information not available.”
Grade 4As shown in figure 2-21, the average score for American Indian/Alaska Native students who were eligible for free or reduced-price lunch was lower than the average score for other
Figure 2-21. Average reading scale scores, by student group and eligibility for free/reduced-price school lunch, grade 4: 2005
4r-ss06-lunch
* Results for American Indian/Alaska Native students were signifi cantly different from those of all other students in the same eligibility category.NOTE: Results are based on the national NAEP sample. SOURCE: U.S. Department of Education, Institute of Education Sciences, National Center for Education Statistics, National Assessment of Educational Progress (NAEP), 2005 National Indian Education Study.
Figure 2-22. Reading achievement-level results, by student group and eligibility for free/reduced-price school lunch, grade 4: 2005
4r-al06-lunch
* Results for American Indian/Alaska Native students were signifi cantly different from those of all other students in the same eligibility category.NOTE: Results are based on the national NAEP sample. SOURCE: U.S. Department of Education, Institute of Education Sciences, National Center for Education Statistics, National Assessment of Educational Progress (NAEP), 2005 National Indian Education Study.
% at or aboveProficient
% at or aboveBasic
American Indian/Alaska Native
students
All otherstudents
All other students
American Indian/Alaska Native students
196203*
217 218
230* 232
Eligible Not eligible Informationnot available
0
500Scale score
300
290
280
270
260
250
240
230
220
210
200
190
180
27
60
Eligible Not eligible Informationnot available
Percent100
90
80
70
60
50
40
30
20
10
0
45*
1316*
28
42*
7740 46* 63 77*

C h a p t e r 222
eligible students. Similarly, achievement-level results (per-centages at or above Basic and at or above Proficient) were lower for eligible American Indian/Alaska Native students than for all other students (figure 2-22).
Figure 2-21 shows that the per-formance gap between students who were not eligible for free/reduced-price lunch and students who were eligible was 21 points among American Indian/Alaska Native students, while it was wider among all other students (27 points).
Grade 8Figure 2-23 shows that American Indian/Alaska Native students eli-gible for free/reduced-price lunch scored lower on average than all other students in the nation who were eligible. The percentages of eligible American Indian/Alaska Native students performing at or above Basic and at or above Proficient were not significantly different from the percentages of all other students performing at those respective achievement lev-els (figure 2-24).
Figure 2-23 shows that the per-formance gap between not eligible and eligible students was nar-rower for American Indian/Alaska Native students (16 points) than for all other students (23 points).
Figure 2-23. Average reading scale scores, by student group and eligibility for free/reduced-price school lunch, grade 8: 2005
8r-ss06-lunch
* Results for American Indian/Alaska Native students were signifi cantly different from those of all other students in the same eligibility category.NOTE: Results are based on the national NAEP sample. SOURCE: U.S. Department of Education, Institute of Education Sciences, National Center for Education Statistics, National Assessment of Educational Progress (NAEP), 2005 National Indian Education Study.
All other students
American Indian/Alaska Native students
243 247*
259
270*
251
275*
Eligible Not eligible Informationnot available
0
500Scale score
300
290
280
270
260
250
240
230
220
210
200
190
180
% at or aboveProficient
% at or aboveBasic
American Indian/Alaska Native
students
All otherstudents
Figure 2-24. Reading achievement-level results, by student group and eligibility for free/reduced-price school lunch, grade 8: 2005
8r-al06-lunch
* Results for American Indian/Alaska Native students were signifi cantly different from those of all other students in the same eligibility category.NOTE: Results are based on the national NAEP sample. SOURCE: U.S. Department of Education, Institute of Education Sciences, National Center for Education Statistics, National Assessment of Educational Progress (NAEP), 2005 National Indian Education Study.
Eligible Not eligible Informationnot available
Percent100
90
80
70
60
50
40
30
20
10
0
21
45*
1315
25
39*
63 8452 57 70 81*
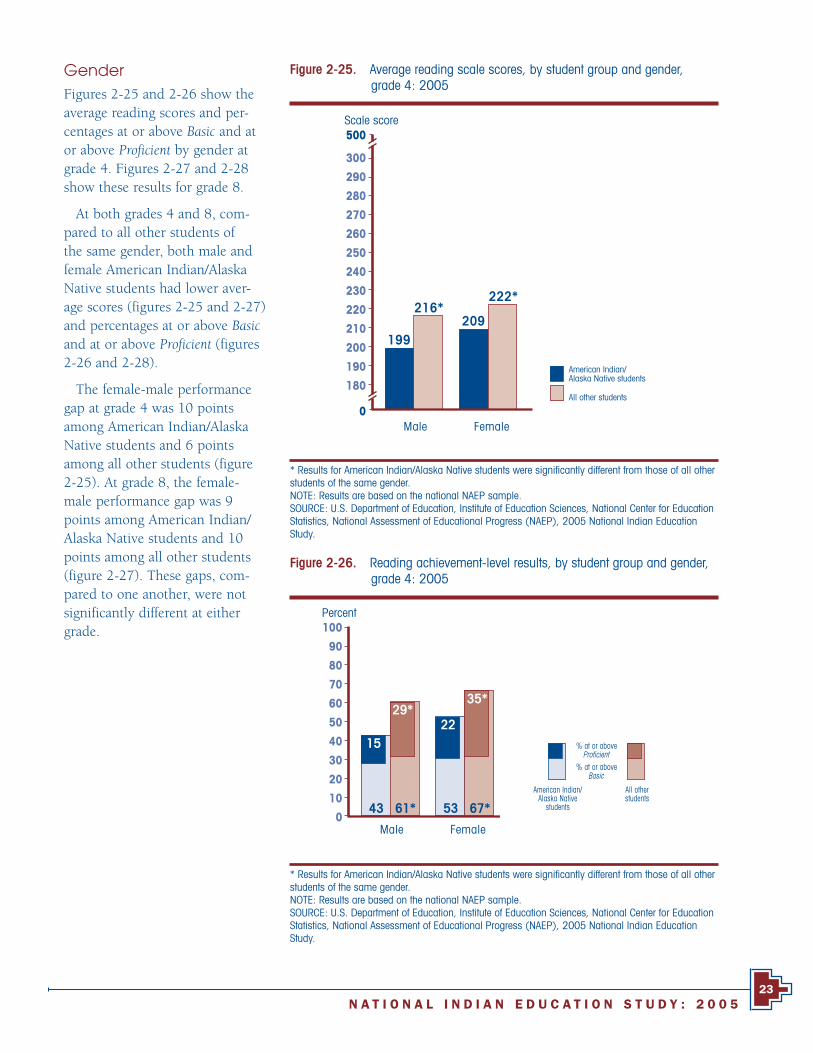
N A T I O N A L I N D I A N E D U C A T I O N S T U D Y : 2 0 0 523
GenderFigures 2-25 and 2-26 show the average reading scores and per-centages at or above Basic and at or above Proficient by gender at grade 4. Figures 2-27 and 2-28 show these results for grade 8.
At both grades 4 and 8, com-pared to all other students of the same gender, both male and female American Indian/Alaska Native students had lower aver-age scores (figures 2-25 and 2-27) and percentages at or above Basic and at or above Proficient (figures 2-26 and 2-28).
The female-male performance gap at grade 4 was 10 points among American Indian/Alaska Native students and 6 points among all other students (figure 2-25). At grade 8, the female-male performance gap was 9 points among American Indian/Alaska Native students and 10 points among all other students (figure 2-27). These gaps, com-pared to one another, were not significantly different at either grade.
Figure 2-25. Average reading scale scores, by student group and gender, grade 4: 2005
4r-ss04-gen
* Results for American Indian/Alaska Native students were signifi cantly different from those of all other students of the same gender.NOTE: Results are based on the national NAEP sample. SOURCE: U.S. Department of Education, Institute of Education Sciences, National Center for Education Statistics, National Assessment of Educational Progress (NAEP), 2005 National Indian Education Study.
All other students
American Indian/Alaska Native students
199
216*209
222*
Male Female0
500Scale score
300
290
280
270
260
250
240
230
220
210
200
190
180
Figure 2-26. Reading achievement-level results, by student group and gender, grade 4: 2005
4r-al04-gen
* Results for American Indian/Alaska Native students were signifi cantly different from those of all other students of the same gender.NOTE: Results are based on the national NAEP sample. SOURCE: U.S. Department of Education, Institute of Education Sciences, National Center for Education Statistics, National Assessment of Educational Progress (NAEP), 2005 National Indian Education Study.
% at or aboveProficient
% at or aboveBasic
American Indian/Alaska Native
students
All otherstudents
Male Female
Percent100
90
80
70
60
50
40
30
20
10
0
15
29*22
35*
43 61* 53 67*

C h a p t e r 224
Figure 2-27. Average reading scale scores, by student group and gender, grade 8: 2005
8r-ss04-gen
* Results for American Indian/Alaska Native students were signifi cantly different from those of all other students of the same gender.NOTE: Results are based on the national NAEP sample. SOURCE: U.S. Department of Education, Institute of Education Sciences, National Center for Education Statistics, National Assessment of Educational Progress (NAEP), 2005 National Indian Education Study.
All other students
American Indian/Alaska Native students
244
257* 254
268*
Male Female0
500Scale score
300
290
280
270
260
250
240
230
220
210
200
190
180
Figure 2-28. Reading achievement-level results, by student group and gender, grade 8: 2005
8r-al04-gen
* Results for American Indian/Alaska Native students were signifi cantly different from those of all other students of the same gender.NOTE: Results are based on the national NAEP sample. SOURCE: U.S. Department of Education, Institute of Education Sciences, National Center for Education Statistics, National Assessment of Educational Progress (NAEP), 2005 National Indian Education Study.
% at or aboveProficient
% at or aboveBasic
American Indian/Alaska Native
students
All otherstudents
Male Female
Percent100
90
80
70
60
50
40
30
20
10
054
15
68*
26*
64
20
78*
36*
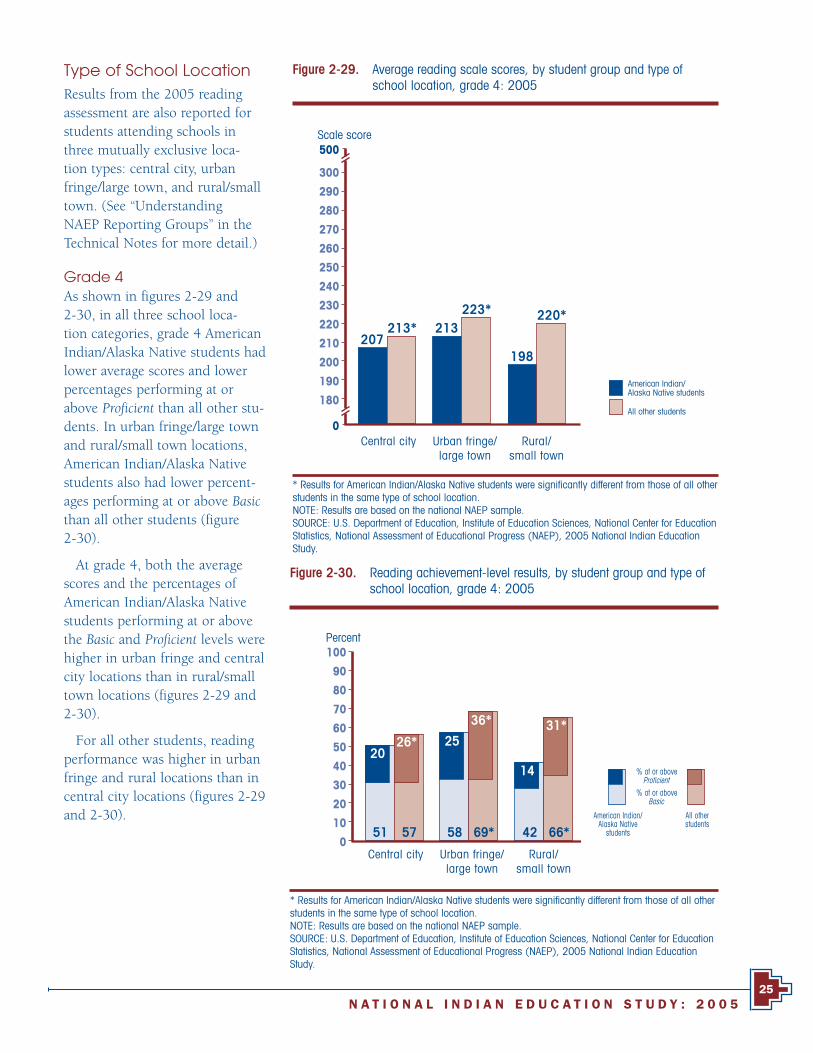
N A T I O N A L I N D I A N E D U C A T I O N S T U D Y : 2 0 0 525
Type of School LocationResults from the 2005 reading assessment are also reported for students attending schools in three mutually exclusive loca-tion types: central city, urban fringe/large town, and rural/small town. (See “Understanding NAEP Reporting Groups” in the Technical Notes for more detail.)
Grade 4As shown in figures 2-29 and 2-30, in all three school loca-tion categories, grade 4 American Indian/Alaska Native students had lower average scores and lower percentages performing at or above Proficient than all other stu-dents. In urban fringe/large town and rural/small town locations, American Indian/Alaska Native students also had lower percent-ages performing at or above Basic than all other students (figure 2-30).
At grade 4, both the average scores and the percentages of American Indian/Alaska Native students performing at or above the Basic and Proficient levels were higher in urban fringe and central city locations than in rural/small town locations (figures 2-29 and 2-30).
For all other students, reading performance was higher in urban fringe and rural locations than in central city locations (figures 2-29 and 2-30).
Figure 2-29. Average reading scale scores, by student group and type of school location, grade 4: 2005
4r-ss07-locat
* Results for American Indian/Alaska Native students were signifi cantly different from those of all other students in the same type of school location.NOTE: Results are based on the national NAEP sample. SOURCE: U.S. Department of Education, Institute of Education Sciences, National Center for Education Statistics, National Assessment of Educational Progress (NAEP), 2005 National Indian Education Study.
All other students
American Indian/Alaska Native students
207213* 213
223*
198
220*
Central city Urban fringe/large town
Rural/small town
0
500Scale score
300
290
280
270
260
250
240
230
220
210
200
190
180
Figure 2-30. Reading achievement-level results, by student group and type of school location, grade 4: 2005
4r-al07-locat
* Results for American Indian/Alaska Native students were signifi cantly different from those of all other students in the same type of school location.NOTE: Results are based on the national NAEP sample. SOURCE: U.S. Department of Education, Institute of Education Sciences, National Center for Education Statistics, National Assessment of Educational Progress (NAEP), 2005 National Indian Education Study.
% at or aboveProficient
% at or aboveBasic
American Indian/Alaska Native
students
All otherstudents
Central city Urban fringe/large town
Rural/small town
Percent100
90
80
70
60
50
40
30
20
10
0
14
31*
2026* 25
36*
51 57 58 69* 42 66*

C h a p t e r 226
Grade 8As shown in figures 2-31 and 2-32, grade 8 American Indian/Alaska Native students had lower average scores and lower percent-ages performing at or above Basic and at or above Proficient than all other students in each of the school location categories.
There were no significant dif-ferences in reading performance (average scores and percentages at or above Basic and at or above Proficient) for American Indian/Alaska Native students across the three types of school locations. For all other students, reading performance was higher on all three measures in urban fringe and rural locations than in central city locations.
Figure 2-31. Average reading scale scores, by student group and type of school location, grade 8: 2005
8r-ss07-locat
* Results for American Indian/Alaska Native students were signifi cantly different from those of all other students in the same type of school location.NOTE: Results are based on the national NAEP sample. SOURCE: U.S. Department of Education, Institute of Education Sciences, National Center for Education Statistics, National Assessment of Educational Progress (NAEP), 2005 National Indian Education Study.
All other students
American Indian/Alaska Native students
Figure 2-32. Reading achievement-level results, by student group and type of school location, grade 8: 2005
8r-al07-locat
* Results for American Indian/Alaska Native students were signifi cantly different from those of all other students in the same type of school location.NOTE: Results are based on the national NAEP sample. SOURCE: U.S. Department of Education, Institute of Education Sciences, National Center for Education Statistics, National Assessment of Educational Progress (NAEP), 2005 National Indian Education Study.
% at or aboveProficient
% at or aboveBasic
American Indian/Alaska Native
students
All otherstudents
250257* 254
266*
246
263*
Central city Urban fringe/large town
Rural/small town
0
500Scale score
300
290
280
270
260
250
240
230
220
210
200
190
180
Central city Urban fringe/large town
Rural/small town
Percent100
90
80
70
60
50
40
30
20
10
0
15
31*
1826* 22
35*
56 75*59 67* 66 76*

N A T I O N A L I N D I A N E D U C A T I O N S T U D Y : 2 0 0 527
Parental Education (grade 8 only)Earlier NAEP reports have shown that across all ages and subject areas, students who reported higher parental education levels tended to have higher assessment scores, on average (Braswell et al. 2005; Donahue, Daane, and Jin 2005).
In the assessment background questionnaires, eighth-grade students were asked to identify the high-est level of education attained by each of their parents. The student indicated how far each parent progressed in school, choosing from the following categories:
• did not finish high school,
• graduated from high school,
• some education after high school,
• graduated from college, and
• I don’t know.
The highest education level of either parent is used in this report.
As figures 2-33 and 2-34 show, the average scores` and achievement-level percentages of American Indian/Alaska Native students who reported that their parents’ highest level of education was “gradu-ated from high school” or “graduated from college” were lower than the performance of all other stu-dents reporting the corresponding levels of parental education. The performance measures for American Indian/Alaska Native students who reported a par-ent with “some education after high school” and “graduated from college” did not differ statistically from one another. In contrast, among students who are not American Indian or Alaska Native, those who reported a parent had “graduated from college” had higher average scores and higher achievement-level results than those who reported a parent with “some education after high school.”
For more information, see the Technical Notes sec-tion and table A-17 in the Data Appendix.
Figure 2-33. Average reading scale scores, by student group and student-reported highest level of education of either parent, grade 8: 2005
8r-ss08-pared
* Results for American Indian/Alaska Native students were signifi cantly different from those of all other students in the same parental education category.NOTE: Results are based on the national NAEP sample. SOURCE: U.S. Department of Education, Institute of Education Sciences, National Center for Education Statistics, National Assessment of Educational Progress (NAEP), 2005 National Indian Education Study.
All other students
American Indian/Alaska Native students
240 244 245253* 257
266257
272*
236243*
Less thanhigh school
Graduatedfrom
high school
Someeducation after
high school
Graduatedfrom
college
Unknown0
500Scale score
300
290
280
270
260
250
240
230
220
210
200
190
180

C h a p t e r 228
Figure 2-34. Reading achievement-level results, by student group and student-reported highest level of education of either parent, grade 8: 2005
8r-al08-pared
* Results for American Indian/Alaska Native students were signifi cantly different from those of all other students in the same parental education category.NOTE: Results are based on the national NAEP sample. SOURCE: U.S. Department of Education, Institute of Education Sciences, National Center for Education Statistics, National Assessment of Educational Progress (NAEP), 2005 National Indian Education Study.
% at or aboveProficient
% at or aboveBasic
American Indian/Alaska Native
students
All otherstudents
Less thanhigh school
Graduatedfrom
high school
Someeducation after
high school
Graduatedfrom
college
Unknown
Percent100
90
80
70
60
50
40
30
20
10
0
2432
24
42*
812*8
12 14
19*
68 78 68 82* 45 5249 54 53 64*
For additional information regarding results presented in this chapter, see the following tables in the Data Appendix:
Table A-9 Data for fi gures 2-1 through 2-4, and table 2-1 (national results: average scores and percentages at achievement levels)
Table A-10 Data for table 2-2 (national results: percentiles)
Table A-11 Data for fi gures 2-5 through 2-8 (regional results)
Table A-12 Data for fi gures 2-9 through 2-16 (selected state results)
Table A-13 Data for fi gures 2-17 through 2-20 (race/ethnicity results)
Table A-14 Data for fi gures 2-21 through 2-24 (eligibility for free/reduced-price lunch results)
Table A-15 Data for fi gures 2-25 through 2-28 (gender results)
Table A-16 Data for fi gures 2-29 through 2-32 (school location results)
Table A-17 Data for fi gures 2-33 through 2-34 (student-reported parental education)

N A T I O N A L I N D I A N E D U C A T I O N S T U D Y : 2 0 0 529
Chapter 3Mathematics Results, Grades 4 and 8
This chapter provides results from the 2005 NAEP mathematics assessment at grades 4 and 8 for the nation, for regions, for selected states, and for student groups.
National ResultsFigures 3-1 and 3-3 show the average mathematics scores for American Indian/Alaska Native students and all other students at grades 4 and 8, respectively. Figures 3-2 and 3-4 show the mathematics achievement-level results for each grade. The figures presenting achievement-level results show the percentage of students performing at or above Proficient in a bar nested within the bar representing the percentage at or above Basic, indicating that the percentage of students at or above Basic includes those performing at or above Proficient.
At both grades 4 and 8, American Indian/Alaska Native students scored lower, on average, in mathematics than the average of all other students in the nation (students who are neither American Indian nor Alaska Native). The percentages of students performing at or above Basic and at or above Proficient in mathematics were also lower for American Indian/Alaska Native students than for all other students at both grades.

C h a p t e r 330
Figure 3-2. Mathematics achievement-level results, by student group, grade 4: 2005
4m-al01-nat
* Results for American Indian/Alaska Native students were signifi cantly different from those of all other students.SOURCE: U.S. Department of Education, Institute of Education Sciences, National Center for Education Statistics, National Assessment of Educational Progress (NAEP), 2005 National Indian Education Study.
Percent100
90
80
70
60
50
40
30
20
10
0
21
37*
68 80*
% at or aboveProficient
% at or aboveBasic
American Indian/Alaska Native
students
All otherstudents
Figure 3-1. Average mathematics scale scores, by student group, grade 4: 2005
4m-ss01-nat
* Results for American Indian/Alaska Native students were signifi cantly different from those of all other students.SOURCE: U.S. Department of Education, Institute of Education Sciences, National Center for Education Statistics, National Assessment of Educational Progress (NAEP), 2005 National Indian Education Study.
226
238*
0
500Scale score
300
290
280
270
260
250
240
230
220
210
200
190
180All other students
American Indian/Alaska Native students

N A T I O N A L I N D I A N E D U C A T I O N S T U D Y : 2 0 0 531
Figure 3-4. Mathematics achievement-level results, by student group, grade 8: 2005
8m-al01-nat
* Results for American Indian/Alaska Native students were signifi cantly different from those of all other students.SOURCE: U.S. Department of Education, Institute of Education Sciences, National Center for Education Statistics, National Assessment of Educational Progress (NAEP), 2005 National Indian Education Study.
Percent100
90
80
70
60
50
40
30
20
10
0
14
30*
53 69*
% at or aboveProficient
% at or aboveBasic
American Indian/Alaska Native
students
All otherstudents
Figure 3-3. Average mathematics scale scores, by student group, grade 8: 2005
8m-ss01-nat
* Results for American Indian/Alaska Native students were signifi cantly different from those of all other students.SOURCE: U.S. Department of Education, Institute of Education Sciences, National Center for Education Statistics, National Assessment of Educational Progress (NAEP), 2005 National Indian Education Study.
264
279*
0
500Scale score
300
290
280
270
260
250
240
230
220
210
200
190
180All other students
American Indian/Alaska Native students

C h a p t e r 332
Table 3-1 presents the mathematics achievement-level results as the percentage of students performing within each achievement level at each grade. While the percentages of students performing at Proficient and at Advanced were lower for American Indian/Alaska Native students than for all other students at both grades, there were no significant differences in the percentages of students performing at Basic at grade 4 or at grade 8.
Comparing Scores Among Lower-, Middle-, and Higher-Performing StudentsExamining performance of students at selected per-centiles can indicate when the overall picture for students diverges by lower-, middle-, or higher-scoring students. A percentile indicates the per-centage of students whose scores fell at or below a particular score on the NAEP mathematics scale. For example, the results presented in table 3-2 for stu-dents at grade 4 show that 50 percent of American Indian/Alaska Native students scored at or below 227 and 50 percent of all other students scored at or below 240. At each of the five percentiles analyzed, the score for American Indian/Alaska Native students was lower than the score for all other students at both grades 4 and 8.
Table 3-2. Mathematics scale scores at selected percentiles, by student group, grades 4 and 8: 2005
Student group
Percentile
10th 25th 50th 75th 90th
Grade 4
American Indian/Alaska Native students 190 208 227 246 261
All other students 201* 220* 240* 258* 273*
Grade 8
American Indian/Alaska Native students 221 243 265 286 304
All other students 232* 256* 280* 304* 324*
* Results for American Indian/Alaska Native students were signifi cantly different from those of all other students.SOURCE: U.S. Department of Education, Institute of Education Sciences, National Center for Education Statistics, National Assessment of Educational Progress (NAEP), 2005 National Indian Education Study.
Student group
Percent
Below Basic At Basic At Profi cient At Advanced
Grade 4
American Indian/Alaska Native students 32 47 19 2
All other students 20* 44 31* 5*
Grade 8
American Indian/Alaska Native students 47 40 12 2
All other students 31* 39 24* 6*
Table 3-1. Achievement-level results in mathematics, by student group, grades 4 and 8: 2005
* Results for American Indian/Alaska Native students were signifi cantly different from those of all other students.NOTE: Detail may not sum to totals because of rounding.SOURCE: U.S. Department of Education, Institute of Education Sciences, National Center for Education Statistics, National Assessment of Educational Progress (NAEP), 2005 National Indian Education Study.

N A T I O N A L I N D I A N E D U C A T I O N S T U D Y : 2 0 0 533
Results by Region of the CountryIn addition to the national results, mathematics performance is reported for five regions: Atlantic, North Central, South Central, Mountain, and Pacific. These NIES regions, which differ from the typical regions used in other NAEP reports, are based on U.S. Census divisions, and are config-ured to align with the distribution of the American Indian/Alaska Native student population. The regional samples are composed of the samples for the states that make up each defined region (figure 1-1).
Grade 4As shown in figure 3-5, American Indian/Alaska Native students scored lower on average than all other students (students who are neither American Indian nor Alaska Native) in all the regions.
The achievement-level results, presented in figure 3-6, show lower percentages of American Indian/Alaska Native students than all other students perform-ing at or above Basic in the North Central and Mountain regions, and lower percentages of American Indian/Alaska Native students performing at or above Proficient in all five of the regions.
The difference in average scores, or “score gap,” between all other students and American Indian/Alaska Native students is 12 points at the national level (figure 3-1). The score gap in the Mountain region (17 points) is greater than the gap in the
Figure 3-5. Average mathematics scale scores, by student group and region, grade 4: 2005
4m-ss02-reg
* Results for American Indian/Alaska Native students were signifi cantly different from those of all other students in the same region.SOURCE: U.S. Department of Education, Institute of Education Sciences, National Center for Education Statistics, National Assessment of Educational Progress (NAEP), 2005 National Indian Education Study.
240*
229230240*
231237*
218
235*227
234*
Atlantic NorthCentral
SouthCentral
Mountain Pacific0
500Scale score
300
290
280
270
260
250
240
230
220
210
200
190
180
Figure 3-6. Mathematics achievement-level results, by student group and region, grade 4: 2005
4m-al02-reg
* Results for American Indian/Alaska Native students were signifi cantly different from those of all other students in the same region.SOURCE: U.S. Department of Education, Institute of Education Sciences, National Center for Education Statistics, National Assessment of Educational Progress (NAEP), 2005 National Indian Education Study.
28
70
Atlantic NorthCentral
SouthCentral
Mountain Pacific
Percent100
90
80
70
60
50
40
30
20
10
0
23 33*
13
33*
2332*
39*
23
39*
78 80 57 78* 67 7583 82*71
All other students
American Indian/Alaska Native students
% at or aboveProficient
% at or aboveBasic
American Indian/Alaska Native
students
All otherstudents

C h a p t e r 334
nation, and the gap in the South Central region (5 points) is smaller. Comparing the perfor-mance differences within each of the regions, the gaps in the South Central and Pacific regions are smaller than the gap in the Mountain region (figure 3-5).
Grade 8As shown in figure 3-7, the average mathematics score for American Indian/Alaska Native students in each of the five regions was lower than the aver-age score for all other students in the same region. As shown in figure 3-8, lower percent-ages of American Indian/Alaska Native students than all other students performed at or above Basic and at or above Proficient in the Atlantic, North Central, and Mountain regions. Lower percent-ages of American Indian/Alaska Native students in the South Central and Pacific regions per-formed at or above Proficient than all other students in the same region.
At the national level, the differ-ence in average scores, or “score gap,” between all other students and American Indian/Alaska Native students is 15 points (figure 3-3). The score gap in the Mountain region (22 points) is greater than the gap in the nation, and the gaps in the South Central region (6 points) and in the Pacific region (6 points) are smaller. Comparing the performance differences within each of the regions, the gaps in the Mountain and in the North Central regions are larger than the gaps in the South Central or Pacific regions (figure 3-7).
Figure 3-7. Average mathematics scale scores, by student group and region, grade 8: 2005
8m-ss02-reg
* Results for American Indian/Alaska Native students were signifi cantly different from those of all other students in the same region.SOURCE: U.S. Department of Education, Institute of Education Sciences, National Center for Education Statistics, National Assessment of Educational Progress (NAEP), 2005 National Indian Education Study.
Figure 3-8. Mathematics achievement-level results, by student group and region, grade 8: 2005
8m-al02-reg
* Results for American Indian/Alaska Native students were signifi cantly different from those of all other students in the same region.SOURCE: U.S. Department of Education, Institute of Education Sciences, National Center for Education Statistics, National Assessment of Educational Progress (NAEP), 2005 National Indian Education Study.
269
281*
264
283*
269276*
256
278*
267274*
Atlantic NorthCentral
SouthCentral
Mountain Pacific0
500Scale score
300
290
280
270
260
250
240
230
220
210
200
190
180
All other students
American Indian/Alaska Native students
% at or aboveProficient
% at or aboveBasic
American Indian/Alaska Native
students
All otherstudents
Atlantic NorthCentral
SouthCentral
Mountain Pacific
Percent100
90
80
70
60
50
40
30
20
10
0
16 26*
10
29*
1826*
15
32*
14
34*
63 66 43 69* 56 6358 71* 53 74*
N A T I O N A L I N D I A N E D U C A T I O N S T U D Y : 2 0 0 535
Selected State ResultsSpecific states with relatively large populations of American Indian/Alaska Native students were select-ed for this study. Readers are cautioned, however, to consider that each of the selected states represents a different educational context and that comparisons across states should be tempered by considerations of different school types, demographic factors, and socioeconomic factors.
When making comparisons across states, it is important to consider the variation in the exclusion rates. Although every effort is made to include as many students as possible, different states have dif-ferent policies. States that are more inclusive—that is, they assess greater percentages of their students with disabilities and English language learners—may have lower average scores than states that exclude greater percentages of these students. Tables A-7 and A-8 show the exclusion rates for grade 4 and grade 8 mathematics.
Figures 3-9 and 3-13 show the average math-ematics scores for American Indian/Alaska Native students at grades 4 and 8, respectively, for the selected states. The average score for American Indian/Alaska Native students in the nation is also given in each figure as a point of comparison. Figures 3-10 and 3-14 show the achievement-level results for each grade for the selected states, with American Indian/Alaska Native students in the nation again included as a comparison.
Figures 3-11 and 3-15 provide state-to-state com-parisons for average scale scores at grades 4 and 8, respectively, and figures 3-12 and 3-16 show state-to-state comparisons of the percentage of students performing at or above Basic.
Grade 4As shown in figure 3-9, American Indian/Alaska Native students in all the selected states, except for Montana and Oklahoma, had lower average scores than American Indian/Alaska Native students in the nation. The achievement-level results presented
in figure 3-10 show that American Indian/Alaska Native students in Oklahoma had higher percentages performing at or above Basic than American Indian/Alaska Native students in the nation. American Indian/Alaska Native students in Alaska, Arizona, New Mexico, and South Dakota had lower percent-ages performing at or above Basic and at or above Proficient than American Indian/Alaska Native stu-dents in the nation. American Indian/Alaska Native students in North Dakota had a lower percentage performing at or above Proficient than American Indian/Alaska Native students in the nation.
In the state-to-state comparisons shown in figures 3-11 and 3-12, American Indian/Alaska Native stu-dents in Oklahoma had higher average scores than American Indian/Alaska Native students in all the other selected states, except for Montana. American Indian/Alaska Native students in Alaska, Montana, and North Dakota also had higher average scores than American Indian/Alaska Native students in New Mexico. American Indian/Alaska Native students in Oklahoma had a higher percentage performing at or above Basic than their peers in the other selected states.
Grade 8Figure 3-13 shows that American Indian/Alaska Native students in New Mexico and South Dakota had lower average scores than American Indian/Alaska Native students in the nation. As shown in figure 3-14, American Indian/Alaska Native stu-dents in New Mexico and South Dakota had lower percentages performing at or above Basic and at or above Proficient than American Indian/Alaska Native students in the nation.
Figures 3-15 and 3-16 show that American Indian/Alaska Native students in Oklahoma had higher average scores and higher percentages performing at or above Basic than their peers in Montana, New Mexico, North Dakota, and South Dakota. American Indian/Alaska Native students in Alaska performed higher than their peers in New Mexico and South Dakota on both measures.

C h a p t e r 336
Figure 3-9. Average mathematics scale scores for American Indian/Alaska Native students only, by nation and selected states, grade 4: 2005
4m-ss03-st
* Signifi cantly different from American Indian/Alaska Native students in the nation.NOTE: National and state data presented in this fi gure represent American Indian and Alaska Native students only.SOURCE: U.S. Department of Education, Institute of Education Sciences, National Center for Education Statistics, National Assessment of Educational Progress (NAEP), 2005 National Indian Education Study.
220* 223215* 215*
221*229
217*
Alaska Arizona Montana NewMexico
NorthDakota
Oklahoma SouthDakota
0
500Scale score
300
290
280
270
260
250
240
230
220
210
200
190
180
226
Nation
Figure 3-10. Mathematics achievement-level results for American Indian/Alaska Native students only, by nation and selected states, grade 4: 2005
4m-al03-st
* Signifi cantly different from American Indian/Alaska Native students in the nation.NOTE: National and state data presented in this fi gure represent American Indian and Alaska Native students only.SOURCE: U.S. Department of Education, Institute of Education Sciences, National Center for Education Statistics, National Assessment of Educational Progress (NAEP), 2005 National Indian Education Study.
Alaska Arizona Montana NewMexico
NorthDakota
Oklahoma SouthDakota
Percent100
90
80
70
60
50
40
30
20
10
0
177*
12*
21
11*15*12*
62 54* 63 76* 56*57*
Nation
21
68 51*
% at or aboveProficient
% at or aboveBasic

N A T I O N A L I N D I A N E D U C A T I O N S T U D Y : 2 0 0 537
Figures 3-11 and 3-12 compare average scores and percentages of grade 4 American Indian/Alaska
Native students performing at or above Basic in each state to those in each other state.
Figure 3-11. Cross-state comparison of average mathematics scale scores for American Indian/Alaska Native students, grade 4: 2005
4m-ml01-as
NOTE: Read across the row corresponding to a state listed to the left of the chart. Match the shading intensity (and arrow direction) to the chart’s key to determine whether the average score for students in this state was found to be higher than (up arrow), not signifi cantly different from (blank cell), or lower than (down arrow) the average score for students in the state in the column heading.SOURCE: U.S. Department of Education, Institute of Education Sciences, National Center for Education Statistics, National Assessment of Educational Progress (NAEP), 2005 National Indian Education Study.
Figure 3-12. Cross-state comparison of the percentages of American Indian/Alaska Native students performing at or above Basic in mathematics, grade 4: 2005
4m-ml02-ab
NOTE: Read across the row corresponding to a state listed to the left of the chart. Match the shading intensity (and arrow direction) to the chart’s key to determine whether the percentage of students in this state performing at or above Basic was found to be higher than (up arrow), not signifi cantly different from (blank cell), or lower than (down arrow) the percentage of students performing at or above Basic in the state in the column heading. SOURCE: U.S. Department of Education, Institute of Education Sciences, National Center for Education Statistics, National Assessment of Educational Progress (NAEP), 2005 National Indian Education Study.
Oklahoma
Montana
North Dakota
Alaska
South Dakota
Arizona
New Mexico
Okl
ahom
a
Mon
tana
Nor
th D
akot
a
Alas
ka
Sout
h D
akot
a
Ariz
ona
New
Mex
ico
� � � � � �
�
�
�
�
�
�
Students in this state had a higher percentage than students in the state listed at the top of the column.
No statistically significant difference was detected between the percentage for students in this state and the state listed at the top of the column.
Students in this state had a lower percentage than students in the state listed at the top of the column.
�
�
� � � �
�
�
�
�
�
�
�
�
� � � �
Oklahoma
Montana
North Dakota
Alaska
South Dakota
Arizona
New Mexico
Okl
ahom
a
Mon
tana
Nor
th D
akot
a
Alas
ka
Sout
h D
akot
a
Ariz
ona
New
Mex
ico
Students in this state had a higher average scale score than students in the state listed at the top of the column.
No statistically significant difference was detected between the average scale score for students in this state and the state listed at the top of the column.
Students in this state had a lower average scale score than students in the state listed at the top of the column.
�
�

C h a p t e r 338
Figure 3-13. Average mathematics scale scores for American Indian/Alaska Native students only, by nation and selected states, grade 8: 2005
8m-ss03-st
* Signifi cantly different from American Indian/Alaska Native students in the nation.NOTE: National and state data presented in this fi gure represent American Indian and Alaska Native students only.SOURCE: U.S. Department of Education, Institute of Education Sciences, National Center for Education Statistics, National Assessment of Educational Progress (NAEP), 2005 National Indian Education Study.
264256 259
251*260
267
250*
Alaska Arizona Montana NewMexico
NorthDakota
Oklahoma SouthDakota
264
Nation0
500Scale score
300
290
280
270
260
250
240
230
220
210
200
190
180
Figure 3-14. Mathematics achievement-level results for American Indian/Alaska Native students only, by nation and selected states, grade 8: 2005
8m-al03-st
* Signifi cantly different from American Indian/Alaska Native students in the nation.NOTE: National and state data presented in this fi gure represent American Indian and Alaska Native students only.SOURCE: U.S. Department of Education, Institute of Education Sciences, National Center for Education Statistics, National Assessment of Educational Progress (NAEP), 2005 National Indian Education Study.
Alaska Arizona Montana NewMexico
NorthDakota
Oklahoma SouthDakota
Percent100
90
80
70
60
50
40
30
20
10
048 36* 47 60 37*53 42
11 4* 9
15
8*
15
Nation
53
149
% at or aboveProficient
% at or aboveBasic

N A T I O N A L I N D I A N E D U C A T I O N S T U D Y : 2 0 0 539
Figure 3-15. Cross-state comparison of average mathematics scale scores for American Indian/Alaska Native students, grade 8: 2005
8m-ml01-as
NOTE: Read across the row corresponding to a state listed to the left of the chart. Match the shading intensity (and arrow direction) to the chart’s key to determine whether the average score for students in this state was found to be higher than (up arrow), not signifi cantly different from (blank cell), or lower than (down arrow) the average score for students in the state in the column heading.SOURCE: U.S. Department of Education, Institute of Education Sciences, National Center for Education Statistics, National Assessment of Educational Progress (NAEP), 2005 National Indian Education Study.
� � �
�
�
� � � �
�
�
�
�
�
�
� � �
Oklahoma
Alaska
North Dakota
Montana
Arizona
New Mexico
South Dakota
Okl
ahom
a
Alas
ka
Nor
th D
akot
a
Mon
tana
Ariz
ona
New
Mex
ico
Sout
h D
akot
a
Figure 3-16. Cross-state comparison of the percentages of American Indian/Alaska Native students performing at or above Basic in mathematics, grade 8: 2005
8m-ml02-ab
NOTE: Read across the row corresponding to a state listed to the left of the chart. Match the shading intensity (and arrow direction) to the chart’s key to determine whether the percentage of students in this state performing at or above Basic was found to be higher than (up arrow), not signifi cantly different from (blank cell), or lower than (down arrow) the percentage of students performing at or above Basic in the state in the column heading.SOURCE: U.S. Department of Education, Institute of Education Sciences, National Center for Education Statistics, National Assessment of Educational Progress (NAEP), 2005 National Indian Education Study.
� �
Oklahoma
Alaska
North Dakota
Montana
Arizona
New Mexico
South Dakota
Okl
ahom
a
Alas
ka
Nor
th D
akot
a
Mon
tana
Ariz
ona
New
Mex
ico
Sout
h D
akot
a
� � � �
�
�
�
�
�
�
Students in this state had a higher average scale score than students in the state listed at the top of the column.
No statistically significant difference was detected between the average scale score for students in this state and the state listed at the top of the column.
Students in this state had a lower average scale score than students in the state listed at the top of the column.
�
�
Students in this state had a higher percentage than students in the state listed at the top of the column.
No statistically significant difference was detected between the percentage for students in this state and the state listed at the top of the column.
Students in this state had a lower percentage than students in the state listed at the top of the column.
�
�
Figures 3-15 and 3-16 compare average scores and percentages of grade 8 American Indian/Alaska
Native students performing at or above Basic in each state to those in each other state.
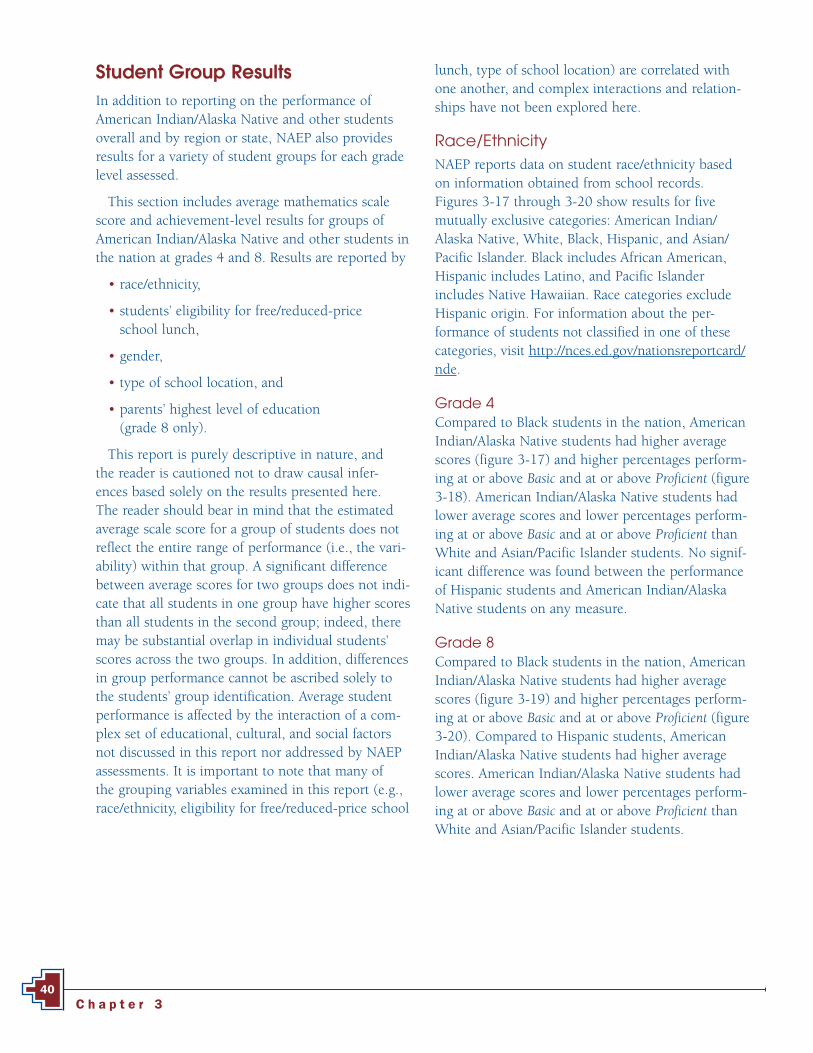
C h a p t e r 340
Student Group ResultsIn addition to reporting on the performance of American Indian/Alaska Native and other students overall and by region or state, NAEP also provides results for a variety of student groups for each grade level assessed.
This section includes average mathematics scale score and achievement-level results for groups of American Indian/Alaska Native and other students in the nation at grades 4 and 8. Results are reported by
• race/ethnicity,
• students’ eligibility for free/reduced-price school lunch,
• gender,
• type of school location, and
• parents’ highest level of education (grade 8 only).
This report is purely descriptive in nature, and the reader is cautioned not to draw causal infer-ences based solely on the results presented here. The reader should bear in mind that the estimated average scale score for a group of students does not reflect the entire range of performance (i.e., the vari-ability) within that group. A significant difference between average scores for two groups does not indi-cate that all students in one group have higher scores than all students in the second group; indeed, there may be substantial overlap in individual students’ scores across the two groups. In addition, differences in group performance cannot be ascribed solely to the students’ group identification. Average student performance is affected by the interaction of a com-plex set of educational, cultural, and social factors not discussed in this report nor addressed by NAEP assessments. It is important to note that many of the grouping variables examined in this report (e.g., race/ethnicity, eligibility for free/reduced-price school
lunch, type of school location) are correlated with one another, and complex interactions and relation-ships have not been explored here.
Race/EthnicityNAEP reports data on student race/ethnicity based on information obtained from school records. Figures 3-17 through 3-20 show results for five mutually exclusive categories: American Indian/Alaska Native, White, Black, Hispanic, and Asian/Pacific Islander. Black includes African American, Hispanic includes Latino, and Pacific Islander includes Native Hawaiian. Race categories exclude Hispanic origin. For information about the per-formance of students not classified in one of these categories, visit http://nces.ed.gov/nationsreportcard/nde.
Grade 4Compared to Black students in the nation, American Indian/Alaska Native students had higher average scores (figure 3-17) and higher percentages perform-ing at or above Basic and at or above Proficient (figure 3-18). American Indian/Alaska Native students had lower average scores and lower percentages perform-ing at or above Basic and at or above Proficient than White and Asian/Pacific Islander students. No signif-icant difference was found between the performance of Hispanic students and American Indian/Alaska Native students on any measure.
Grade 8Compared to Black students in the nation, American Indian/Alaska Native students had higher average scores (figure 3-19) and higher percentages perform-ing at or above Basic and at or above Proficient (figure 3-20). Compared to Hispanic students, American Indian/Alaska Native students had higher average scores. American Indian/Alaska Native students had lower average scores and lower percentages perform-ing at or above Basic and at or above Proficient than White and Asian/Pacific Islander students.

N A T I O N A L I N D I A N E D U C A T I O N S T U D Y : 2 0 0 541
Figure 3-17. Average mathematics scale scores, by race/ethnicity, grade 4: 2005
4m-ss05-race
* Signifi cantly different from American Indian/Alaska Native students.NOTE: Results are based on the national NAEP sample. Black includes African American, Hispanic includes Latino, and Pacifi c Islander includes Native Hawaiian. Race categories exclude Hispanic origin.SOURCE: U.S. Department of Education, Institute of Education Sciences, National Center for Education Statistics, National Assessment of Educational Progress (NAEP), 2005 National Indian Education Study.
Figure 3-18. Mathematics achievement-level results, by race/ethnicity, grade 4: 2005
4m-al05-race
* Signifi cantly different from American Indian/Alaska Native students.NOTE: Results are based on the national NAEP sample. Black includes African American, Hispanic includes Latino, and Pacifi c Islander includes Native Hawaiian. Race categories exclude Hispanic origin. SOURCE: U.S. Department of Education, Institute of Education Sciences, National Center for Education Statistics, National Assessment of Educational Progress (NAEP), 2005 National Indian Education Study.
American Indian/Alaska Native
White Black Hispanic Asian/Pacific Islander
Percent100
90
80
70
60
50
40
30
20
10
0
21
47*
13*19
55*
90* 60* 68 90*68
% at or aboveProficient
% at or aboveBasic
226
246*
220*226
251*
American Indian/Alaska Native
White Black Hispanic Asian/Pacific Islander
0
500Scale score
300
290
280
270
260
250
240
230
220
210
200
190
180

C h a p t e r 342
Figure 3-19. Average mathematics scale scores, by race/ethnicity, grade 8: 2005
8m-ss05-race
* Signifi cantly different from American Indian/Alaska Native students.NOTE: Results are based on the national NAEP sample. Black includes African American, Hispanic includes Latino, and Pacifi c Islander includes Native Hawaiian. Race categories exclude Hispanic origin.SOURCE: U.S. Department of Education, Institute of Education Sciences, National Center for Education Statistics, National Assessment of Educational Progress (NAEP), 2005 National Indian Education Study.
Figure 3-20. Mathematics achievement-level results, by race/ethnicity, grade 8: 2005
8m-al05-race
* Signifi cantly different from American Indian/Alaska Native students.NOTE: Results are based on the national NAEP sample. Black includes African American, Hispanic includes Latino, and Pacifi c Islander includes Native Hawaiian. Race categories exclude Hispanic origin.SOURCE: U.S. Department of Education, Institute of Education Sciences, National Center for Education Statistics, National Assessment of Educational Progress (NAEP), 2005 National Indian Education Study.
American Indian/Alaska Native
White Black Hispanic Asian/Pacific Islander
Percent100
90
80
70
60
50
40
30
20
10
0
14
39*
9*13
47*
80*53 42* 52 81*
% at or aboveProficient
% at or aboveBasic
264
289*
255*262*
295*
American Indian/Alaska Native
White Black Hispanic Asian/Pacific Islander
0
500Scale score
300
290
280
270
260
250
240
230
220
210
200
190
180
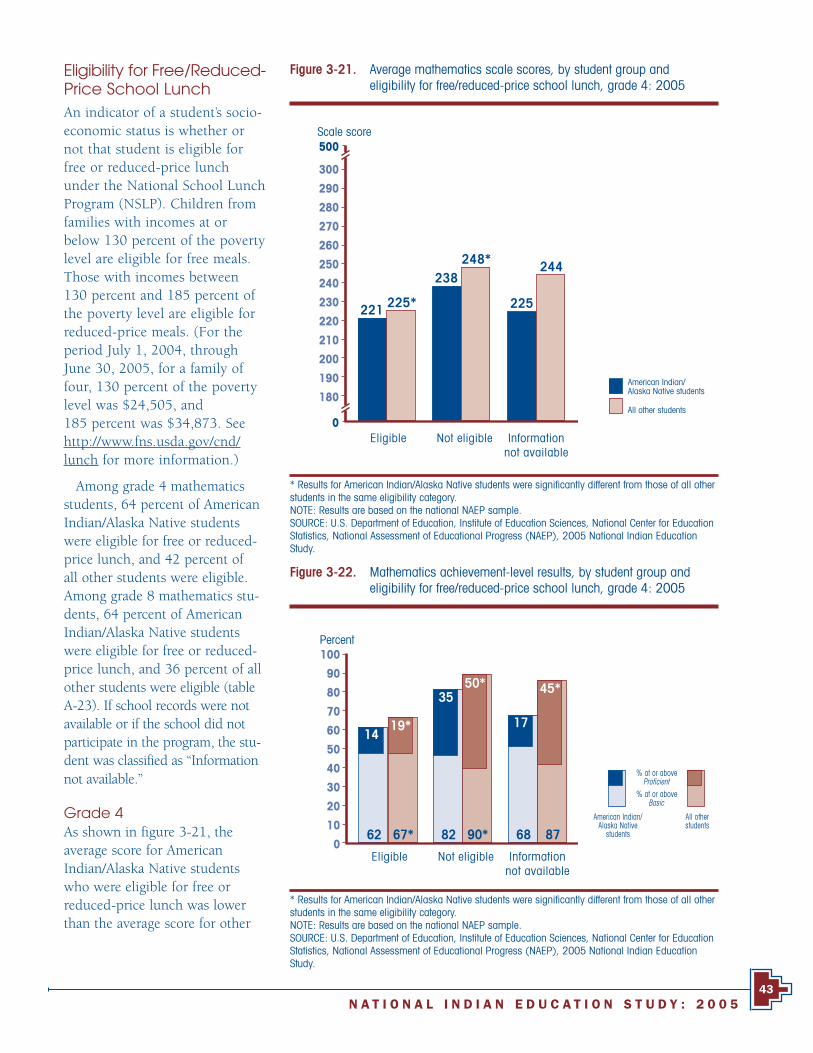
N A T I O N A L I N D I A N E D U C A T I O N S T U D Y : 2 0 0 543
Eligibility for Free/Reduced-Price School LunchAn indicator of a student’s socio-economic status is whether or not that student is eligible for free or reduced-price lunch under the National School Lunch Program (NSLP). Children from families with incomes at or below 130 percent of the poverty level are eligible for free meals. Those with incomes between 130 percent and 185 percent of the poverty level are eligible for reduced-price meals. (For the period July 1, 2004, through June 30, 2005, for a family of four, 130 percent of the poverty level was $24,505, and 185 percent was $34,873. See http://www.fns.usda.gov/cnd/lunch for more information.)
Among grade 4 mathematics students, 64 percent of American Indian/Alaska Native students were eligible for free or reduced-price lunch, and 42 percent of all other students were eligible. Among grade 8 mathematics stu-dents, 64 percent of American Indian/Alaska Native students were eligible for free or reduced-price lunch, and 36 percent of all other students were eligible (table A-23). If school records were not available or if the school did not participate in the program, the stu-dent was classified as “Information not available.”
Grade 4As shown in figure 3-21, the average score for American Indian/Alaska Native students who were eligible for free or reduced-price lunch was lower than the average score for other
Figure 3-21. Average mathematics scale scores, by student group and eligibility for free/reduced-price school lunch, grade 4: 2005
4m-ss06-lunch
* Results for American Indian/Alaska Native students were signifi cantly different from those of all other students in the same eligibility category.NOTE: Results are based on the national NAEP sample. SOURCE: U.S. Department of Education, Institute of Education Sciences, National Center for Education Statistics, National Assessment of Educational Progress (NAEP), 2005 National Indian Education Study.
225221 225*
238248* 244
0
500Scale score
300
290
280
270
260
250
240
230
220
210
200
190
180
Eligible Not eligible Informationnot available
Figure 3-22. Mathematics achievement-level results, by student group and eligibility for free/reduced-price school lunch, grade 4: 2005
4m-al06-lunch
* Results for American Indian/Alaska Native students were signifi cantly different from those of all other students in the same eligibility category.NOTE: Results are based on the national NAEP sample. SOURCE: U.S. Department of Education, Institute of Education Sciences, National Center for Education Statistics, National Assessment of Educational Progress (NAEP), 2005 National Indian Education Study.
17
68
Eligible Not eligible Informationnot available
Percent100
90
80
70
60
50
40
30
20
10
0
45*
1419*
3550*
8762 67* 82 90*
% at or aboveProficient
% at or aboveBasic
American Indian/Alaska Native
students
All otherstudents
All other students
American Indian/Alaska Native students
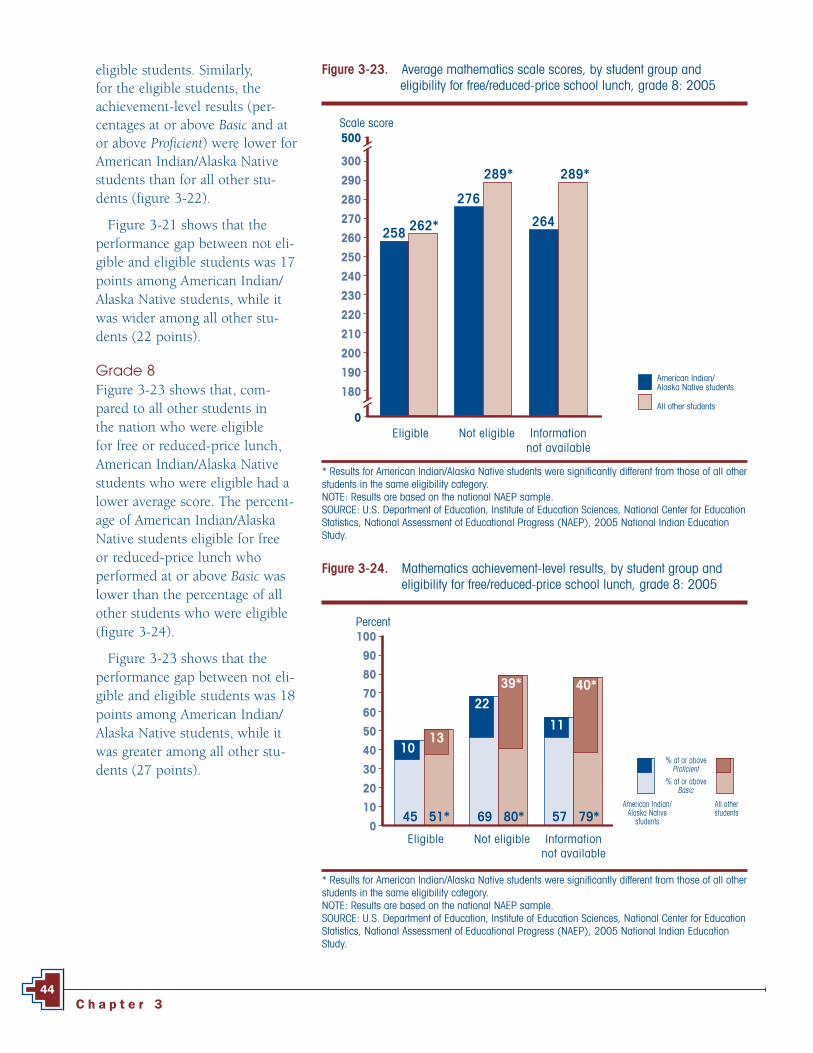
C h a p t e r 344
eligible students. Similarly, for the eligible students, the achievement-level results (per-centages at or above Basic and at or above Proficient) were lower for American Indian/Alaska Native students than for all other stu-dents (figure 3-22).
Figure 3-21 shows that the performance gap between not eli-gible and eligible students was 17 points among American Indian/Alaska Native students, while it was wider among all other stu-dents (22 points).
Grade 8Figure 3-23 shows that, com-pared to all other students in the nation who were eligible for free or reduced-price lunch, American Indian/Alaska Native students who were eligible had a lower average score. The percent-age of American Indian/Alaska Native students eligible for free or reduced-price lunch who performed at or above Basic was lower than the percentage of all other students who were eligible (figure 3-24).
Figure 3-23 shows that the performance gap between not eli-gible and eligible students was 18 points among American Indian/Alaska Native students, while it was greater among all other stu-dents (27 points).
Figure 3-23. Average mathematics scale scores, by student group and eligibility for free/reduced-price school lunch, grade 8: 2005
8m-ss06-lunch
* Results for American Indian/Alaska Native students were signifi cantly different from those of all other students in the same eligibility category.NOTE: Results are based on the national NAEP sample. SOURCE: U.S. Department of Education, Institute of Education Sciences, National Center for Education Statistics, National Assessment of Educational Progress (NAEP), 2005 National Indian Education Study.
264258 262*
276
289* 289*
0
500Scale score
300
290
280
270
260
250
240
230
220
210
200
190
180
Eligible Not eligible Informationnot available
All other students
American Indian/Alaska Native students
% at or aboveProficient
% at or aboveBasic
American Indian/Alaska Native
students
All otherstudents
Figure 3-24. Mathematics achievement-level results, by student group and eligibility for free/reduced-price school lunch, grade 8: 2005
8m-al06-lunch
* Results for American Indian/Alaska Native students were signifi cantly different from those of all other students in the same eligibility category.NOTE: Results are based on the national NAEP sample. SOURCE: U.S. Department of Education, Institute of Education Sciences, National Center for Education Statistics, National Assessment of Educational Progress (NAEP), 2005 National Indian Education Study.
11
57
Eligible Not eligible Informationnot available
Percent100
90
80
70
60
50
40
30
20
10
0
40*
1013
22
39*
79*45 51* 69 80*
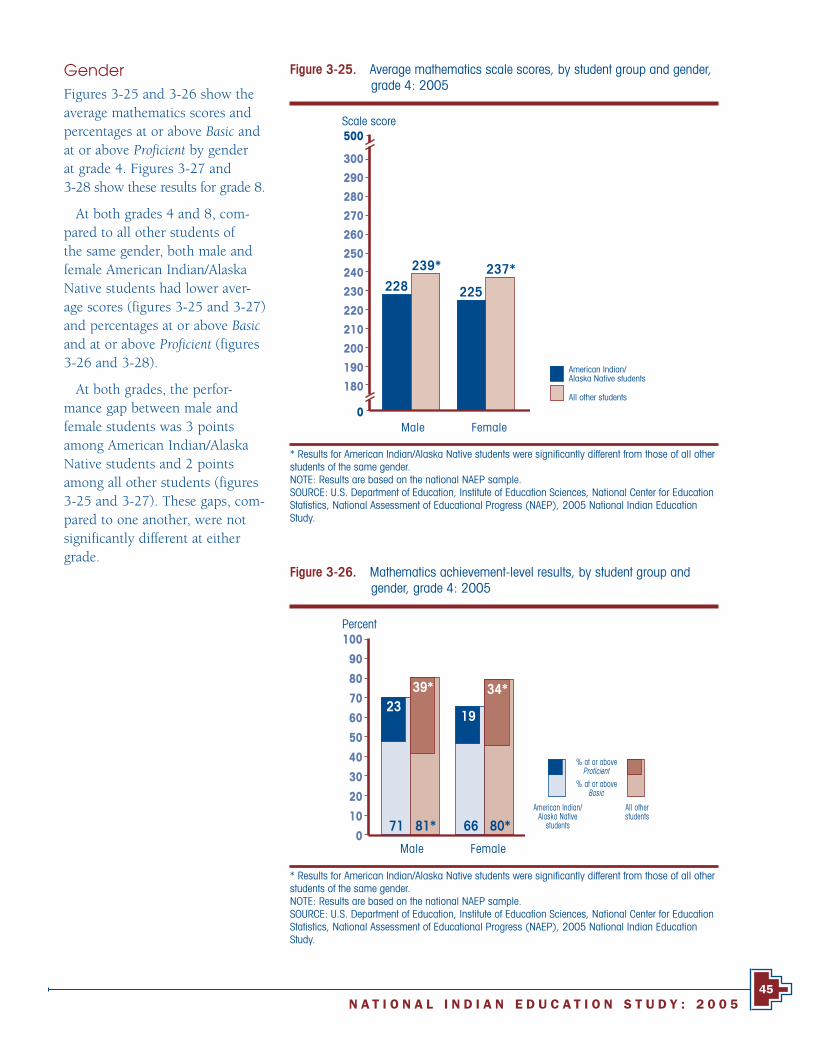
N A T I O N A L I N D I A N E D U C A T I O N S T U D Y : 2 0 0 545
GenderFigures 3-25 and 3-26 show the average mathematics scores and percentages at or above Basic and at or above Proficient by gender at grade 4. Figures 3-27 and 3-28 show these results for grade 8.
At both grades 4 and 8, com-pared to all other students of the same gender, both male and female American Indian/Alaska Native students had lower aver-age scores (figures 3-25 and 3-27) and percentages at or above Basic and at or above Proficient (figures 3-26 and 3-28).
At both grades, the perfor-mance gap between male and female students was 3 points among American Indian/Alaska Native students and 2 points among all other students (figures 3-25 and 3-27). These gaps, com-pared to one another, were not significantly different at either grade.
Figure 3-25. Average mathematics scale scores, by student group and gender, grade 4: 2005
4m-ss04-gen
* Results for American Indian/Alaska Native students were signifi cantly different from those of all other students of the same gender.NOTE: Results are based on the national NAEP sample. SOURCE: U.S. Department of Education, Institute of Education Sciences, National Center for Education Statistics, National Assessment of Educational Progress (NAEP), 2005 National Indian Education Study.
228
239*
225
237*
0
500Scale score
300
290
280
270
260
250
240
230
220
210
200
190
180
Male Female
All other students
American Indian/Alaska Native students
Figure 3-26. Mathematics achievement-level results, by student group and gender, grade 4: 2005
4m-al04-gen
* Results for American Indian/Alaska Native students were signifi cantly different from those of all other students of the same gender.NOTE: Results are based on the national NAEP sample. SOURCE: U.S. Department of Education, Institute of Education Sciences, National Center for Education Statistics, National Assessment of Educational Progress (NAEP), 2005 National Indian Education Study.
% at or aboveProficient
% at or aboveBasic
American Indian/Alaska Native
students
All otherstudents
Male Female
Percent100
90
80
70
60
50
40
30
20
10
0
2339*
19
34*
71 81* 66 80*

C h a p t e r 346
Figure 3-27. Average mathematics scale scores, by student group and gender, grade 8: 2005
8m-ss04-gen
* Results for American Indian/Alaska Native students were signifi cantly different from those of all other students of the same gender.NOTE: Results are based on the national NAEP sample. SOURCE: U.S. Department of Education, Institute of Education Sciences, National Center for Education Statistics, National Assessment of Educational Progress (NAEP), 2005 National Indian Education Study.
266
280*
262
278*
0
500Scale score
300
290
280
270
260
250
240
230
220
210
200
190
180
Male Female
All other students
American Indian/Alaska Native students
Figure 3-28. Mathematics achievement-level results, by student group and gender, grade 8: 2005
8m-al04-gen
* Results for American Indian/Alaska Native students were signifi cantly different from those of all other students of the same gender.NOTE: Results are based on the national NAEP sample. SOURCE: U.S. Department of Education, Institute of Education Sciences, National Center for Education Statistics, National Assessment of Educational Progress (NAEP), 2005 National Indian Education Study.
Male Female
Percent100
90
80
70
60
50
40
30
20
10
0
15
31*
13
29*
55 70* 52 69*
% at or aboveProficient
% at or aboveBasic
American Indian/Alaska Native
students
All otherstudents

N A T I O N A L I N D I A N E D U C A T I O N S T U D Y : 2 0 0 547
Type of School LocationResults from the 2005 mathemat-ics assessment are also reported for students attending schools in three mutually exclusive loca-tion types: central city, urban fringe/large town, and rural/small town. (See “Understanding NAEP Reporting Groups” in the Technical Notes for more detail.)
Grade 4As shown in figures 3-29 and 3-30, in urban fringe and rural locations, American Indian/Alaska Native students had lower aver-age scores (figure 3-29) and lower percentages performing at or above Basic and at or above Proficient than all other students (figure 3-30).
Figure 3-30. Mathematics achievement-level results, by student group and type of school location, grade 4: 2005
4m-al07-locat
* Results for American Indian/Alaska Native students were signifi cantly different from those of all other students in the same type of school location.NOTE: Results are based on the national NAEP sample. SOURCE: U.S. Department of Education, Institute of Education Sciences, National Center for Education Statistics, National Assessment of Educational Progress (NAEP), 2005 National Indian Education Study.
% at or aboveProficient
% at or aboveBasic
American Indian/Alaska Native
students
All otherstudents
Central city Urban fringe/large town
Rural/small town
Percent100
90
80
70
60
50
40
30
20
10
0
16
36*27 31 26
41*
65 83*73 74 72 84*
Figure 3-29. Average mathematics scale scores, by student group and type of school location, grade 4: 2005
4m-ss07-locat
* Results for American Indian/Alaska Native students were signifi cantly different from those of all other students in the same type of school location.NOTE: Results are based on the national NAEP sample. SOURCE: U.S. Department of Education, Institute of Education Sciences, National Center for Education Statistics, National Assessment of Educational Progress (NAEP), 2005 National Indian Education Study.
All other students
American Indian/Alaska Native students
231 233 230
241*
222
238*
0
500Scale score
300
290
280
270
260
250
240
230
220
210
200
190
180
Central city Urban fringe/large town
Rural/small town
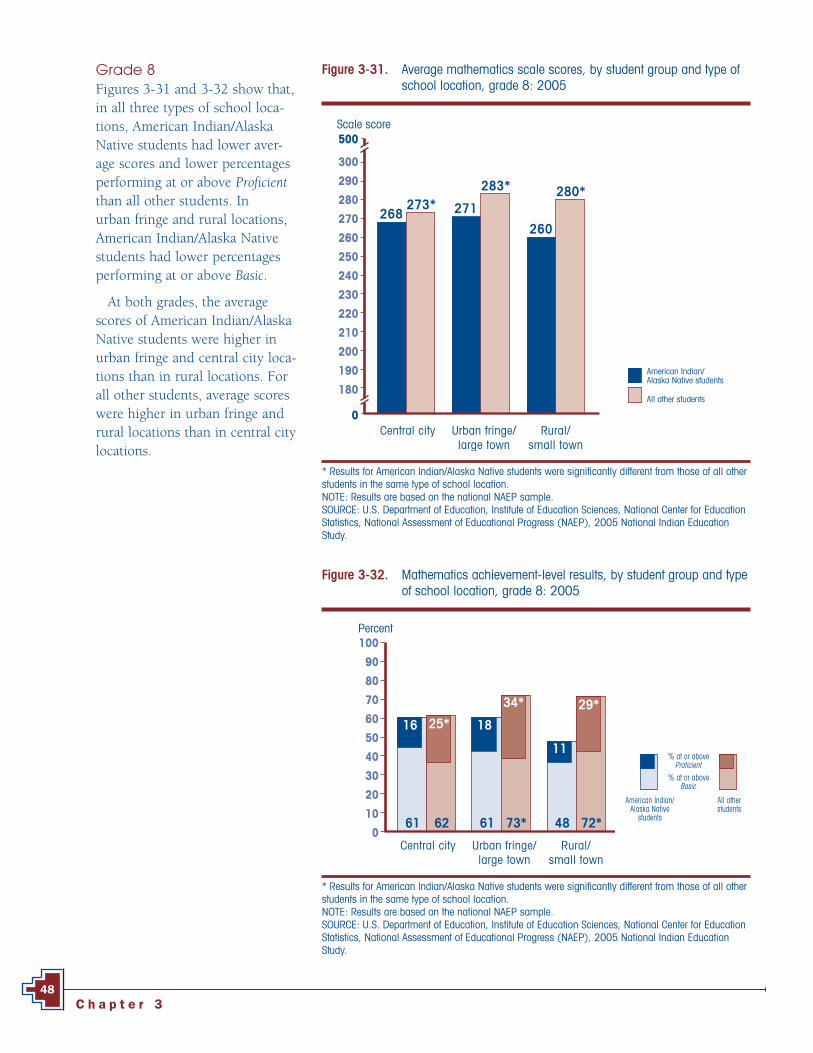
C h a p t e r 348
Grade 8Figures 3-31 and 3-32 show that, in all three types of school loca-tions, American Indian/Alaska Native students had lower aver-age scores and lower percentages performing at or above Proficient than all other students. In urban fringe and rural locations, American Indian/Alaska Native students had lower percentages performing at or above Basic.
At both grades, the average scores of American Indian/Alaska Native students were higher in urban fringe and central city loca-tions than in rural locations. For all other students, average scores were higher in urban fringe and rural locations than in central city locations.
Figure 3-31. Average mathematics scale scores, by student group and type of school location, grade 8: 2005
8m-ss07-locat
* Results for American Indian/Alaska Native students were signifi cantly different from those of all other students in the same type of school location.NOTE: Results are based on the national NAEP sample. SOURCE: U.S. Department of Education, Institute of Education Sciences, National Center for Education Statistics, National Assessment of Educational Progress (NAEP), 2005 National Indian Education Study.
268273* 271
283*
260
280*
0
500Scale score
300
290
280
270
260
250
240
230
220
210
200
190
180
Central city Urban fringe/large town
Rural/small town
Figure 3-32. Mathematics achievement-level results, by student group and type of school location, grade 8: 2005
8m-al07-locat
* Results for American Indian/Alaska Native students were signifi cantly different from those of all other students in the same type of school location.NOTE: Results are based on the national NAEP sample. SOURCE: U.S. Department of Education, Institute of Education Sciences, National Center for Education Statistics, National Assessment of Educational Progress (NAEP), 2005 National Indian Education Study.
Central city Urban fringe/large town
Rural/small town
Percent100
90
80
70
60
50
40
30
20
10
0
11
29*
16 25* 18
34*
48 72*61 62 61 73*
% at or aboveProficient
% at or aboveBasic
American Indian/Alaska Native
students
All otherstudents
All other students
American Indian/Alaska Native students
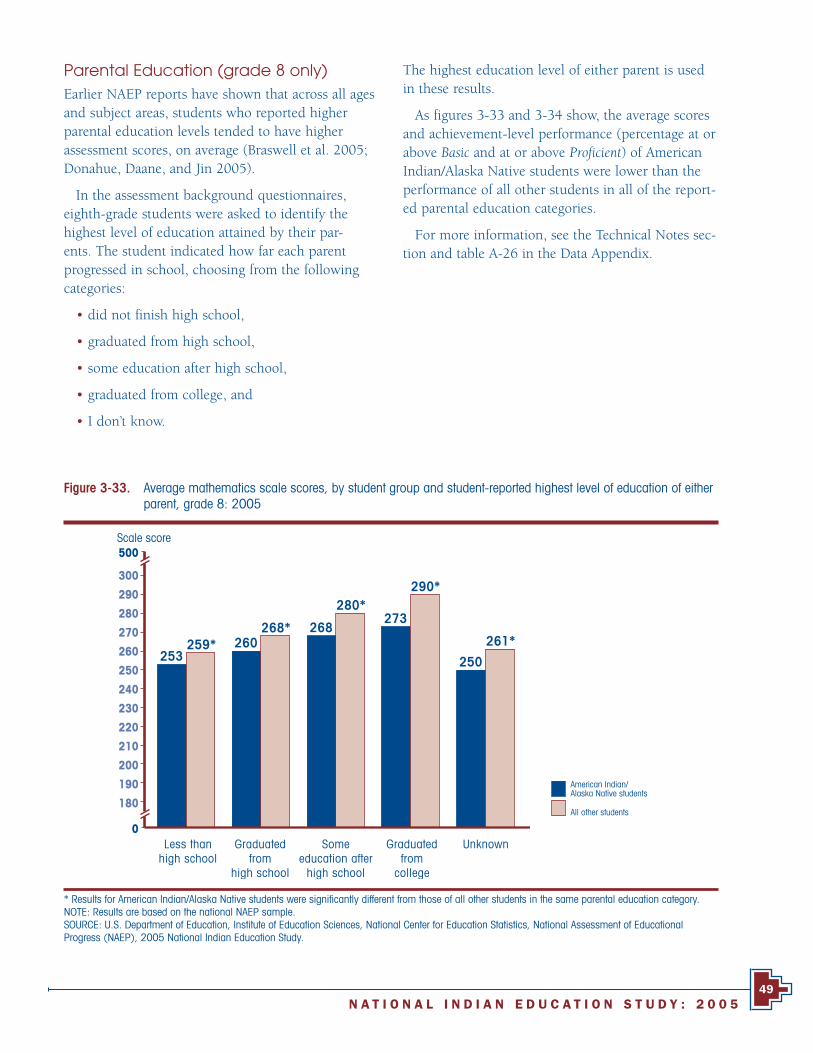
N A T I O N A L I N D I A N E D U C A T I O N S T U D Y : 2 0 0 549
Parental Education (grade 8 only)Earlier NAEP reports have shown that across all ages and subject areas, students who reported higher parental education levels tended to have higher assessment scores, on average (Braswell et al. 2005; Donahue, Daane, and Jin 2005).
In the assessment background questionnaires, eighth-grade students were asked to identify the highest level of education attained by their par-ents. The student indicated how far each parent progressed in school, choosing from the following categories:
• did not finish high school,
• graduated from high school,
• some education after high school,
• graduated from college, and
• I don’t know.
The highest education level of either parent is used in these results.
As figures 3-33 and 3-34 show, the average scores and achievement-level performance (percentage at or above Basic and at or above Proficient) of American Indian/Alaska Native students were lower than the performance of all other students in all of the report-ed parental education categories.
For more information, see the Technical Notes sec-tion and table A-26 in the Data Appendix.
Figure 3-33. Average mathematics scale scores, by student group and student-reported highest level of education of either parent, grade 8: 2005
8m-ss08-pared
* Results for American Indian/Alaska Native students were signifi cantly different from those of all other students in the same parental education category.NOTE: Results are based on the national NAEP sample. SOURCE: U.S. Department of Education, Institute of Education Sciences, National Center for Education Statistics, National Assessment of Educational Progress (NAEP), 2005 National Indian Education Study.
253259* 260
268* 268
280*273
290*
250
261*
0
500Scale score
300
290
280
270
260
250
240
230
220
210
200
190
180
Less thanhigh school
Graduatedfrom
high school
Someeducation after
high school
Graduatedfrom
college
Unknown
All other students
American Indian/Alaska Native students

C h a p t e r 350
Figure 3-34. Mathematics achievement-level results, by student group and student-reported highest level of education of either parent, grade 8: 2005
8m-al08-pared
* Results for American Indian/Alaska Native students were signifi cantly different from those of all other students in the same parental education category.NOTE: Results are based on the national NAEP sample. SOURCE: U.S. Department of Education, Institute of Education Sciences, National Center for Education Statistics, National Assessment of Educational Progress (NAEP), 2005 National Indian Education Study.
Less thanhigh school
Graduatedfrom
high school
Someeducation after
high school
Graduatedfrom
college
Unknown
Percent100
90
80
70
60
50
40
30
20
10
0
14
28*
22
42*
414*4 11* 10
17*
60 74* 64 80* 35 50*38 48* 49 58*
% at or aboveProficient
% at or aboveBasic
American Indian/Alaska Native
students
All otherstudents
For additional information regarding results presented in this chapter, see the following tables in the Data Appendix:
Table A-18 Data for fi gures 3-1 through 3-4, and table 3-1 (national results: average scores and percentages at achievement levels)
Table A-19 Data for table 3-2 (national results: percentiles)
Table A-20 Data for fi gures 3-5 through 3-8 (regional results)
Table A-21 Data for fi gures 3-9 through 3-16 (selected state results)
Table A-22 Data for fi gures 3-17 through 3-20 (race/ethnicity results)
Table A-23 Data for fi gures 3-21 through 3-24 (eligibility for free/reduced-price lunch results)
Table A-24 Data for fi gures 3-25 through 3-28 (gender results)
Table A-25 Data for fi gures 3-29 through 3-32 (school location results)
Table A-26 Data for fi gures 3-33 through 3-34 (student-reported parental education)

N A T I O N A L I N D I A N E D U C A T I O N S T U D Y : 2 0 0 551
Chapter 4Frameworks, Item Maps, and Sample Questions
Grade 4 Reading Assessment FrameworkThe content of the NAEP reading assessment is based on a framework, which describes in detail how reading in English should be assessed by NAEP. The current NAEP reading framework was first used for the 1992 assessment and has continued to be used through 2005.
This framework, developed through a comprehensive national consultative process and adopted by NAGB, provides a broad definition of reading that includes developing a general understanding of written text, thinking about texts, and using various texts for different purpos-es. In addition, it views reading as an interactive and dynamic process involving the reader, the text, and the context of the reading experience. The framework specifies that the fourth-grade reading assessment should measure reading performance in two dimensions: contexts for read-ing and aspects of reading.
Item Maps
The item maps presented on page 54 (grade 4) and page 58 (grade 8) illustrate the knowledge and skills demonstrated by students performing at different score points on the 2005 NAEP reading assessment. In order to provide additional context, the cut scores for the three NAEP achievement levels are marked on the item maps. The map location for each question represents the probability that, for a given score point, 65 percent of the students for a constructed-response question or 74 percent of the students for a multiple-choice question answered that question successfully. For constructed-response questions, responses may be completely or partially correct; therefore, different types of responses to the same question could map onto the scale at different score levels.
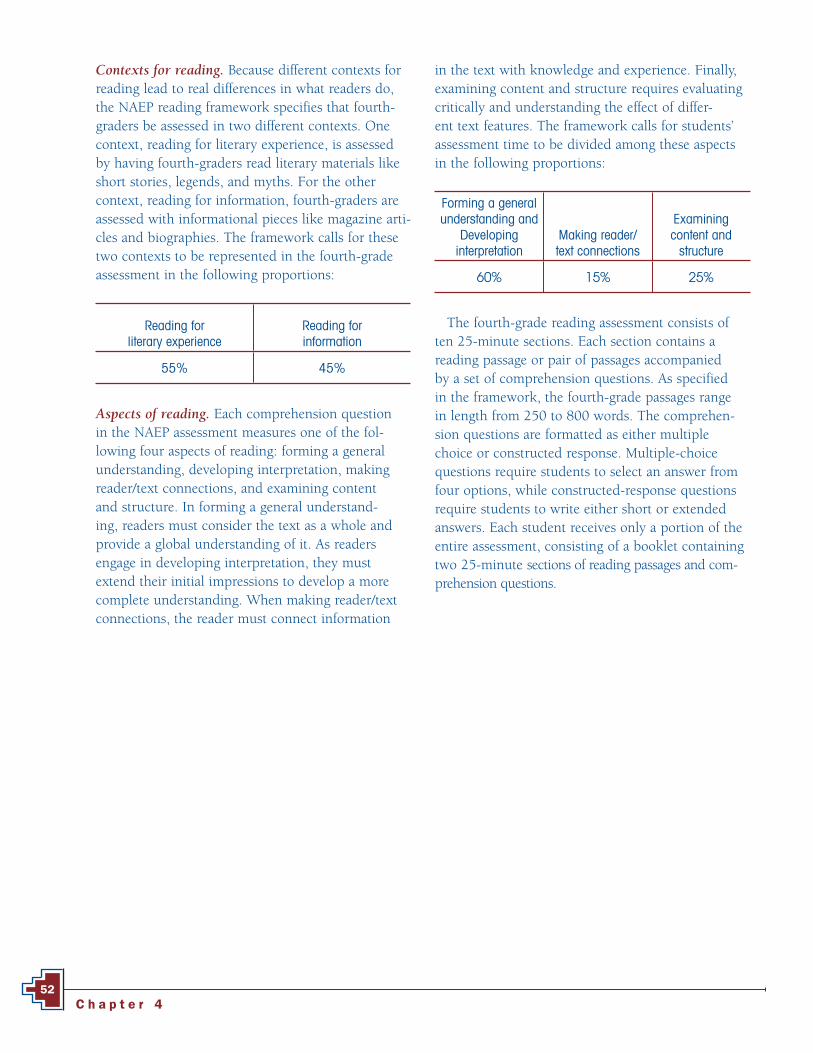
C h a p t e r 452
Contexts for reading. Because different contexts for reading lead to real differences in what readers do, the NAEP reading framework specifies that fourth-graders be assessed in two different contexts. One context, reading for literary experience, is assessed by having fourth-graders read literary materials like short stories, legends, and myths. For the other context, reading for information, fourth-graders are assessed with informational pieces like magazine arti-cles and biographies. The framework calls for these two contexts to be represented in the fourth-grade assessment in the following proportions:
Aspects of reading. Each comprehension question in the NAEP assessment measures one of the fol-lowing four aspects of reading: forming a general understanding, developing interpretation, making reader/text connections, and examining content and structure. In forming a general understand-ing, readers must consider the text as a whole and provide a global understanding of it. As readers engage in developing interpretation, they must extend their initial impressions to develop a more complete understanding. When making reader/text connections, the reader must connect information
in the text with knowledge and experience. Finally, examining content and structure requires evaluating critically and understanding the effect of differ-ent text features. The framework calls for students’ assessment time to be divided among these aspects in the following proportions:
Reading for literary experience
Reading for information
55% 45%
The fourth-grade reading assessment consists of ten 25-minute sections. Each section contains a reading passage or pair of passages accompanied by a set of comprehension questions. As specified in the framework, the fourth-grade passages range in length from 250 to 800 words. The comprehen-sion questions are formatted as either multiple choice or constructed response. Multiple-choice questions require students to select an answer from four options, while constructed-response questions require students to write either short or extended answers. Each student receives only a portion of the entire assessment, consisting of a booklet containing two 25-minute sections of reading passages and com-prehension questions.
Forming a general understanding and
Developing interpretation
Making reader/text connections
Examining content and
structure
60% 15% 25%

N A T I O N A L I N D I A N E D U C A T I O N S T U D Y : 2 0 0 553
Cut Scores
Cut scores represent the minimum score required for performance at each NAEP achievement level. NAEP cut scores were determined through a standard-setting process that convened a cross-section of educators and interested citizens from across the nation. The group was asked to determine what students should know and be able to do relative to a body of content refl ected in the reading framework. NAGB then adopted a set of cut scores on the 0–500 scale that defi ne the lower boundaries of the Basic, Profi cient, and Advanced achievement levels. The reading cut scores, which appear on the item maps, are as follows:
Grade 4 Grade 8
Basic 208 243
Profi cient 238 281
Advanced 268 323
Basic: Fourth-grade students performing at the Basic level should demonstrate an understanding of the overall meaning of what they read. When reading text appropriate for fourth-graders, they should be able to make relatively obvious connections between the text and their own experiences and extend the ideas in the text by making simple inferences.
Profi cient: Fourth-grade students performing at the Profi cient level should be able to demonstrate an overall understanding of the text, providing inferential as well as literal information. When reading text appropriate to fourth grade, they should be able to extend the ideas in the text by making inferences, drawing conclusions, and making connections to their own experiences. The connection between the text and what the student infers should be clear.
Advanced: Fourth-grade students performing at the Advanced level should be able to generalize about topics in the reading selection and demonstrate an awareness of how authors compose and use literary devices. When reading text appropriate to fourth grade, they should be able to judge text critically and, in general, to give thorough answers that indicate careful thought.
Grade 4 Reading Achievement-Level DescriptionsReading achievement-level descriptions are based on NAGB achievement-level policy descriptions with subject- and grade-specific information added. The
following descriptions are abbreviated versions of the full achievement-level descriptions for grade 4 reading. The full descriptions can be found at http://www.nagb.org /pubs/readingbook.pdf.

C h a p t e r 454
Grade 4 ReadingItem MapThis map describes the knowledge or skill associated with answering individual reading comprehension questions. The map identifies the score point at which students had a high probability of successfully answering the question.1
Advanced
268
Profi cient
238
Basic
208
1 Each grade 4 reading question in the 2005 reading assessment was mapped onto the NAEP 0–500 reading scale. The position of a question on the scale represents the average scale score attained by students who had a 65 percent probability of successfully answering a constructed-response question, or a 74 percent probability of correctly answering a four-option multiple-choice question. Only selected questions are presented. Scale score ranges for reading achieve-ment levels are referenced on the map. For constructed-response questions, the question description represents students’ performance at the scoring level being mapped.NOTE: Regular type denotes a constructed-response question. Italic type denotes a multiple-choice question.SOURCE: U.S. Department of Education, Institute of Education Sciences, National Center for Education Statistics, National Assessment of Educational Progress (NAEP), 2005 Reading Assessment.
NAEP Reading Scale
300 Describe character’s changing feelings and explain cause
291 Provide text examples that support description
276 Use story details to support opinion about fi ctional character
270 Generate a comparison based on character traits268 Explain author’s use of direct quotations268 Provide overall message of story264 Explain author’s statement with text information
256 Make inference to identify character motivation255 Discriminate between closely related text ideas to fi nd relevant detail
242 Retrieve relevant information to fi t description238 Identify main theme of story238 Identify explicitly stated but embedded text detail—Sample Question 1233 Provide explanation of character’s feeling231 Recognize fact supported by text information229 Infer or identify a lesson based on text information—Sample Question 2226 Recognize reason that explains feelings of biographical subject222 Make inference to identify intent of description220 Recognize meaning of specialized vocabulary from context
215 Recognize support for interpretation of character
211 Recognize literal information from text207 Identify trait describing main character202 Provide story detail to support opinion201 Recognize main topic of article200 Provide text-based explanation of character’s importance to story
193 Retrieve and provide a text-related fact
172 Recognize central problem faced by story character
500
300
290
280
270
260
250
240
230
220
210
200
190
180
170
O

N A T I O N A L I N D I A N E D U C A T I O N S T U D Y : 2 0 0 555
1. According to the passage, what was the purpose of the space station Mir program?
To learn how the body reacts to long-term travel in space
B To observe how people from different cultures live together
C To see what the seasons look like from outer space
D To take pictures of the Earth and of water currents
Sample Grade 4 Short Constructed-Response Question
Sample question 2 is a short constructed-response question, which asked students to make an inference about a lesson that can be learned and support that inference with information from the passage. Responses to this task were rated according to a three-level scoring guide in one of the following categories: “Evidence of full comprehension,” “Evidence of partial comprehension,” “Evidence of little or no comprehension.” This sample response was rated as “Evidence of full comprehension.”
58 percent of fourth-graders wrote responses rated as "Evidence of full comprehension."
2. What is one lesson that could be learned from reading this passage? Use information from the passage to support your answer.
Grade 4 Reading Sample QuestionsThe following sample questions assessed students’ comprehension of an article entitled, Dr. Shannon Lucid: Space Pioneer, which describes the remarkable achievements of one of the few women to explore
outer space, Shannon Lucid. The article discusses how, in 1996, Dr. Lucid spent over six months in space aboard Mir, a Russian vessel, research-ing how long-term space travel affects the human body. Shannon Lucid is presented as a courageous woman who pursued her dreams.
Sample Grade 4 Multiple-Choice Question
Sample question 1 is a multiple-choice question, which asked students to recognize a detail from the passage.
65 percent of fourth-graders answered this question correctly.
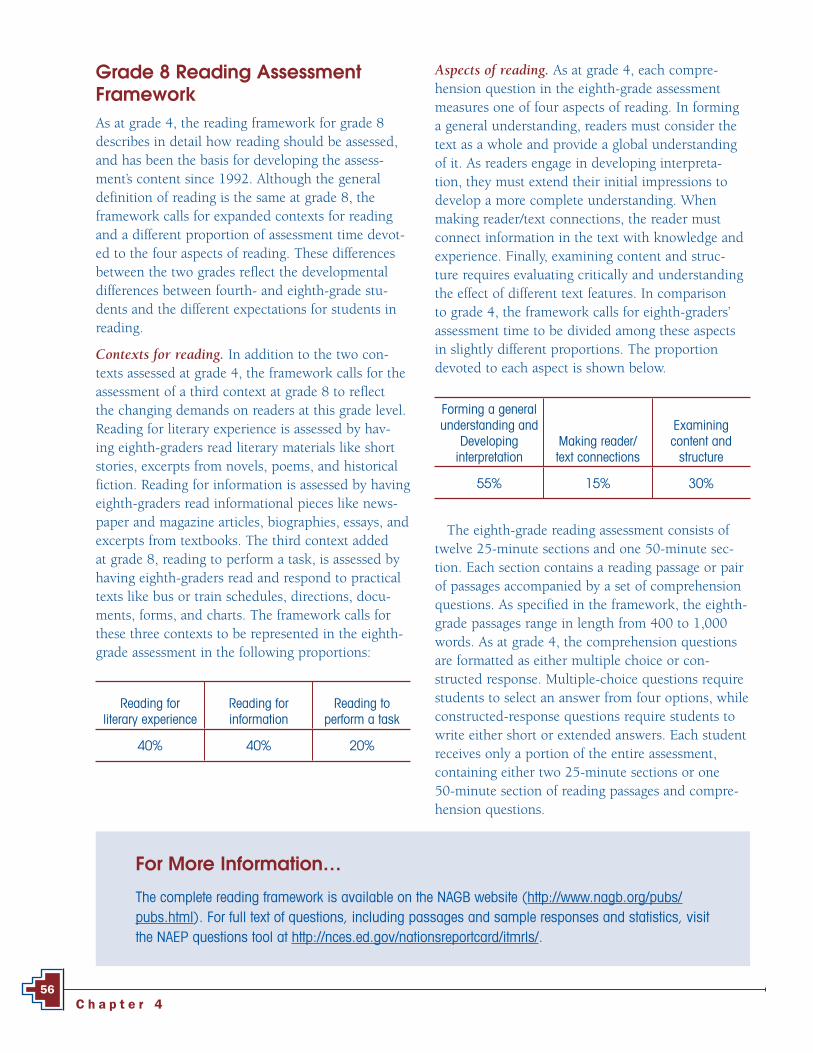
C h a p t e r 456
Grade 8 Reading Assessment FrameworkAs at grade 4, the reading framework for grade 8 describes in detail how reading should be assessed, and has been the basis for developing the assess-ment’s content since 1992. Although the general definition of reading is the same at grade 8, the framework calls for expanded contexts for reading and a different proportion of assessment time devot-ed to the four aspects of reading. These differences between the two grades reflect the developmental differences between fourth- and eighth-grade stu-dents and the different expectations for students in reading.
Contexts for reading. In addition to the two con-texts assessed at grade 4, the framework calls for the assessment of a third context at grade 8 to reflect the changing demands on readers at this grade level. Reading for literary experience is assessed by hav-ing eighth-graders read literary materials like short stories, excerpts from novels, poems, and historical fiction. Reading for information is assessed by having eighth-graders read informational pieces like news-paper and magazine articles, biographies, essays, and excerpts from textbooks. The third context added at grade 8, reading to perform a task, is assessed by having eighth-graders read and respond to practical texts like bus or train schedules, directions, docu-ments, forms, and charts. The framework calls for these three contexts to be represented in the eighth-grade assessment in the following proportions:
Forming a general understanding and
Developing interpretation
Making reader/text connections
Examining content and
structure
55% 15% 30%
Reading for literary experience
Reading for information
Reading toperform a task
40% 40% 20%
Aspects of reading. As at grade 4, each compre-hension question in the eighth-grade assessment measures one of four aspects of reading. In forming a general understanding, readers must consider the text as a whole and provide a global understanding of it. As readers engage in developing interpreta-tion, they must extend their initial impressions to develop a more complete understanding. When making reader/text connections, the reader must connect information in the text with knowledge and experience. Finally, examining content and struc-ture requires evaluating critically and understanding the effect of different text features. In comparison to grade 4, the framework calls for eighth-graders’ assessment time to be divided among these aspects in slightly different proportions. The proportion devoted to each aspect is shown below.
The eighth-grade reading assessment consists of twelve 25-minute sections and one 50-minute sec-tion. Each section contains a reading passage or pair of passages accompanied by a set of comprehension questions. As specified in the framework, the eighth-grade passages range in length from 400 to 1,000 words. As at grade 4, the comprehension questions are formatted as either multiple choice or con-structed response. Multiple-choice questions require students to select an answer from four options, while constructed-response questions require students to write either short or extended answers. Each student receives only a portion of the entire assessment, containing either two 25-minute sections or one 50-minute section of reading passages and compre-hension questions.
For More Information…
The complete reading framework is available on the NAGB website (http://www.nagb.org/pubs/pubs.html). For full text of questions, including passages and sample responses and statistics, visit the NAEP questions tool at http://nces.ed.gov/nationsreportcard/itmrls/.

N A T I O N A L I N D I A N E D U C A T I O N S T U D Y : 2 0 0 557
Basic: Eighth-grade students performing at the Basic level should demonstrate a literal understanding of what they read and be able to make some interpretations. When reading text appropriate to eighth grade, they should be able to identify specifi c aspects of the text that refl ect overall meaning, extend the ideas in the text by making simple inferences, recognize and relate interpretations and connections among ideas in the text to personal experience, and draw conclusions based on the text.
Profi cient: Eighth-grade students performing at the Profi cient level should be able to show an overall understanding of the text, including inferential as well as literal information. When reading text appropriate to eighth grade, they should be able to extend the ideas in the text by making clear inferences from it, by drawing conclusions, and by making connections to their own experiences—including other reading experiences. Profi cient eighth-graders should be able to identify some of the devices authors use in composing text.
Advanced: Eighth-grade students performing at the Advanced level should be able to describe the more abstract themes and ideas of the overall text. When reading text appropriate to eighth grade, they should be able to analyze both meaning and form and support their analyses explicitly with examples from the text; they should be able to extend text information by relating it to their experiences and to world events. At this level, student responses should be thorough, thoughtful, and extensive.
Grade 8 Reading Achievement-Level DescriptionsReading achievement-level descriptions are based on NAGB achievement-level policy descriptions with
subject- and grade-specific information added. The following descriptions are abbreviated versions of the full achievement-level descriptions for grade 8 reading. The full descriptions can be found at http://www.nagb.org/pubs/readingbook.pdf.
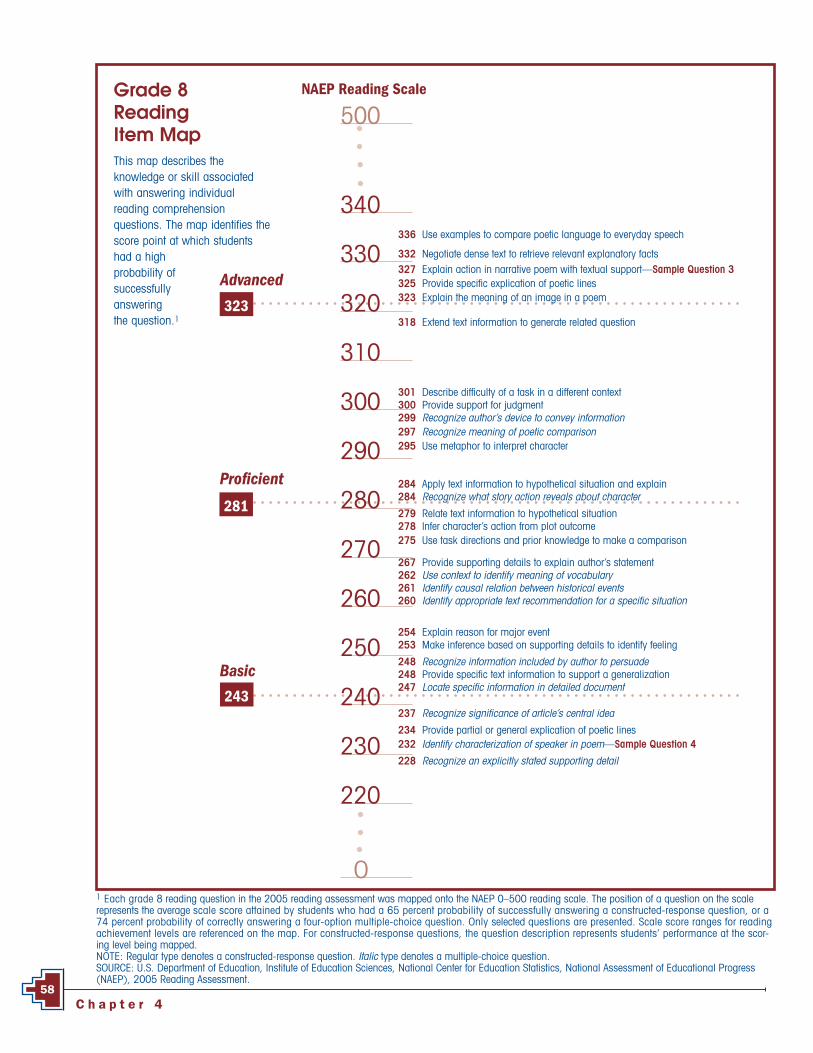
C h a p t e r 458
Grade 8 ReadingItem MapThis map describes the knowledge or skill associated with answering individual reading comprehension questions. The map identifies the score point at which students had a high probability of successfully answering the question.1
Advanced
323
Profi cient
281
Basic
243
NAEP Reading Scale 500
340
330
320
310
300
290
280
270
260
250
240
230
220
O1 Each grade 8 reading question in the 2005 reading assessment was mapped onto the NAEP 0–500 reading scale. The position of a question on the scale represents the average scale score attained by students who had a 65 percent probability of successfully answering a constructed-response question, or a 74 percent probability of correctly answering a four-option multiple-choice question. Only selected questions are presented. Scale score ranges for reading achievement levels are referenced on the map. For constructed-response questions, the question description represents students’ performance at the scor-ing level being mapped.NOTE: Regular type denotes a constructed-response question. Italic type denotes a multiple-choice question.SOURCE: U.S. Department of Education, Institute of Education Sciences, National Center for Education Statistics, National Assessment of Educational Progress (NAEP), 2005 Reading Assessment.
336 Use examples to compare poetic language to everyday speech
332 Negotiate dense text to retrieve relevant explanatory facts327 Explain action in narrative poem with textual support—Sample Question 3325 Provide specifi c explication of poetic lines323 Explain the meaning of an image in a poem
318 Extend text information to generate related question
301 Describe diffi culty of a task in a different context300 Provide support for judgment299 Recognize author’s device to convey information297 Recognize meaning of poetic comparison295 Use metaphor to interpret character
284 Apply text information to hypothetical situation and explain284 Recognize what story action reveals about character
279 Relate text information to hypothetical situation278 Infer character’s action from plot outcome275 Use task directions and prior knowledge to make a comparison
267 Provide supporting details to explain author’s statement262 Use context to identify meaning of vocabulary261 Identify causal relation between historical events260 Identify appropriate text recommendation for a specifi c situation
254 Explain reason for major event253 Make inference based on supporting details to identify feeling
248 Recognize information included by author to persuade248 Provide specifi c text information to support a generalization247 Locate specifi c information in detailed document
237 Recognize signifi cance of article’s central idea
234 Provide partial or general explication of poetic lines232 Identify characterization of speaker in poem—Sample Question 4
228 Recognize an explicitly stated supporting detail

N A T I O N A L I N D I A N E D U C A T I O N S T U D Y : 2 0 0 559
Grade 8 Reading Sample QuestionsThe following sample questions assessed students’ comprehension of a narrative poem by Elizabeth Bishop entitled, The Fish. The narrator of the poem tells about catching a tremendous and very old
fish. The poet uses powerful and visual language to describe the fish’s appearance, and to convey that the fish is wise and venerable. Impressed and moved by the fish’s appearance and seeming ability to evade capture (as evidenced by five old hooks in its mouth), the narrator is inspired to let the fish go.
3. Why does the person let the fi sh go? What in the poem makes you think so?
Sample Grade 8 Short Constructed-Response Question
Sample question 3 is a short constructed-response question, which asked students to explain the action of a character in a narrative poem and provide textual support. Responses to this task were rated according to a three-level scoring guide in one of the following categories: “Evidence of full comprehension,” “Evidence of partial comprehension,” “Evidence of little or no comprehension.” This sample response was rated as “Evidence of full comprehension.”
29 percent of eighth-graders wrote responses rated as "Evidence of full comprehension."
Sample Grade 8 Multiple-Choice Question
Sample question 4 is a multiple-choice question which asked students to use their understanding of the poem to infer characteristics about the speaker.
82 percent of eighth-graders answered this question correctly.
4. Which of the following best describes the person speaking in the poem?
A Thoughtful and observant
B Tired and victorious
C Grim and sullen
D Frightened and lonely

C h a p t e r 460
Grade 4 Mathematics Assessment Framework The content of the NAEP mathematics assessment is based on a framework, which describes in detail how mathematics should be assessed by NAEP. The cur-rent NAEP mathematics framework was first used for the 1990 assessment and has continued to be used through 2005. It was developed through a compre-hensive national consultative process and adopted by NAGB. The framework calls for the assessment of mathematics within five content areas and at differ-ent levels of complexity.
Mathematics content areas. In order to ensure that NAEP assesses an appropriate balance of content, the framework defines five broad areas of mathematical content. The content areas assessed at grade 4 are number properties and operations, measurement, geometry, data analysis and probability, and algebra. The framework calls for the test questions at grade 4 to be distributed across the five content areas in the following proportions:
Mathematical complexity. The framework also calls for an assessment that measures different levels of mathematical complexity to make sure that NAEP assesses a variety of ways of knowing and doing mathematics. The level of complexity of a test ques-tion is determined by the demands that it places on students. For example, test questions with a high level of complexity at grade 4 might ask students to solve a problem in more than one way. According to the framework, the ideal balance for the assessment is that half the score is based on items of moderate complexity, with the remainder of the score based equally on items of low and high complexity.
Revisions were made to the framework for the 1996 assessment and again for the 2005 assessment. The names of some of the content areas changed in 2005, but there remains a consistent focus on the five key areas. The framework reflects current cur-ricular emphases and objectives, while continuing a connection to previous frameworks. This connection allows the trend line at grade 4 that started with the 1990 assessment to be maintained.
The grade 4 mathematics assessment consists of ten 25-minute sections of mathematics questions. Each section contains 14 to 20 questions. The ques-tions are both multiple choice and constructed response. Multiple-choice questions require stu-dents to select an answer from four options, while constructed-response questions require students to write either short or extended answers. Each student receives only a portion of the entire assessment, consisting of a booklet containing two 25-minute sections of mathematics questions.
Number properties and
operations Measurement Geometry
40% 20% 15%
Data analysis and probability Algebra
10% 15%
Item Maps
The item maps presented on page 62 (grade 4) and page 66 (grade 8) illustrate the knowledge and skills demonstrated by students performing at different score points on the 2005 NAEP mathematics assessment. In order to provide additional context, the cut scores for the three NAEP achievement levels are marked on the item maps. The map location for each question represents the probability that, for a given score point, 65 percent of the students for a constructed-response question, 74 percent of the students for a four-option multiple-choice question, or 72 percent of the students for a fi ve-option multiple-choice question answered that question successfully. For constructed-response questions, only responses considered to be completely correct are shown on the item maps.
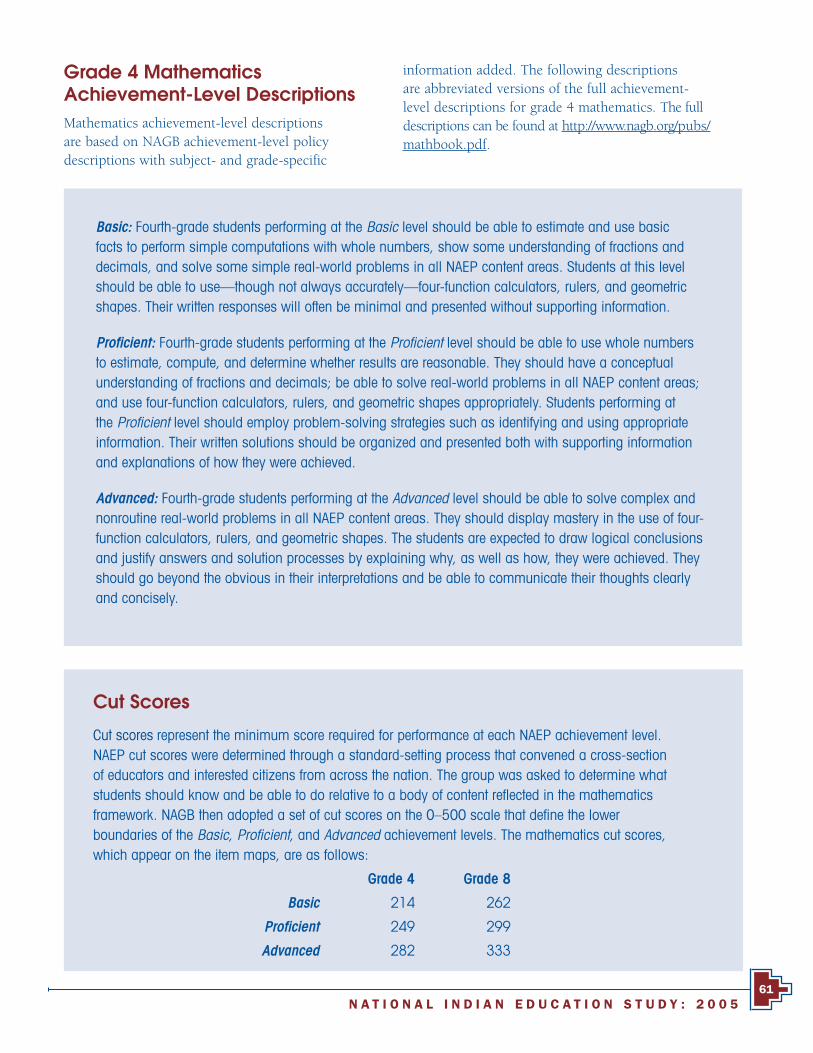
N A T I O N A L I N D I A N E D U C A T I O N S T U D Y : 2 0 0 561
Grade 4 Mathematics Achievement-Level DescriptionsMathematics achievement-level descriptions are based on NAGB achievement-level policy descriptions with subject- and grade-specific
Basic: Fourth-grade students performing at the Basic level should be able to estimate and use basic facts to perform simple computations with whole numbers, show some understanding of fractions and decimals, and solve some simple real-world problems in all NAEP content areas. Students at this level should be able to use—though not always accurately—four-function calculators, rulers, and geometric shapes. Their written responses will often be minimal and presented without supporting information.
Profi cient: Fourth-grade students performing at the Profi cient level should be able to use whole numbers to estimate, compute, and determine whether results are reasonable. They should have a conceptual understanding of fractions and decimals; be able to solve real-world problems in all NAEP content areas; and use four-function calculators, rulers, and geometric shapes appropriately. Students performing at the Profi cient level should employ problem-solving strategies such as identifying and using appropriate information. Their written solutions should be organized and presented both with supporting information and explanations of how they were achieved.
Advanced: Fourth-grade students performing at the Advanced level should be able to solve complex and nonroutine real-world problems in all NAEP content areas. They should display mastery in the use of four-function calculators, rulers, and geometric shapes. The students are expected to draw logical conclusions and justify answers and solution processes by explaining why, as well as how, they were achieved. They should go beyond the obvious in their interpretations and be able to communicate their thoughts clearly and concisely.
Cut Scores
Cut scores represent the minimum score required for performance at each NAEP achievement level. NAEP cut scores were determined through a standard-setting process that convened a cross-section of educators and interested citizens from across the nation. The group was asked to determine what students should know and be able to do relative to a body of content refl ected in the mathematics framework. NAGB then adopted a set of cut scores on the 0–500 scale that defi ne the lower boundaries of the Basic, Profi cient, and Advanced achievement levels. The mathematics cut scores, which appear on the item maps, are as follows:
Grade 4 Grade 8
Basic 214 262
Profi cient 249 299
Advanced 282 333
information added. The following descriptions are abbreviated versions of the full achievement-level descriptions for grade 4 mathematics. The full descriptions can be found at http://www.nagb.org/pubs/mathbook.pdf.

C h a p t e r 462
Grade 4 Mathematics Item MapThis map describes the knowledge or skill associated with answering individual mathematics questions. The map identifies the score point at which students had a high probability of successfully answering the question.1
1 Each grade 4 mathematics question in the 2005 mathematics assessment was mapped onto the NAEP 0–500 mathematics scale. The position of a question on the scale represents the average scale score attained by students who had a 65 percent probability of successfully answering a constructed-response question, or a 74 percent probability of correctly answering a four-option multiple-choice question. Only selected questions are presented. Scale score ranges for mathematics achievement levels are referenced on the map. For constructed-response questions, the question description represents students’ performance rated as completely correct.NOTE: Regular type denotes a constructed-response question. Italic type denotes a multiple-choice question.SOURCE: U.S. Department of Education, Institute of Education Sciences, National Center for Education Statistics, National Assessment of Educational Progress (NAEP), 2005 Mathematics Assessment.
294 Identify equation to describe pattern given in table
286 Identify given measurements on a ruler
284 Subtract fractions with common denominators
276 Approximate fraction of an hour given minutes273 Solve a story problem involving large numbers (calculator available)272 Given a solution, determine the numbers in the problem272 Solve a story problem involving multiplication (calculator available)
260 Determine the width of a rectangle after it is folded258 Represent a situation with an algebraic expression—Sample Question 5
254 Identify which fi gure on grid has greatest area 253 Complete a bar graph from a description of data
245 Determine the value of a point on a number line—Sample Question 6
232 Determine next number in given pattern
228 Classify numbers as even or odd
223 Determine which attribute could be measured with a meter stick
219 Subtract two-digit numbers to solve a story problem
211 Identify which shapes are cylinders211 Subtract two-digit number from three-digit number
203 Identify a number given in expanded notation
197 Determine the most likely outcome in a story problem
Advanced
282
Profi cient
249
Basic
214
500
300
290
280
270
260
250
240
230
220
210
200
190
O
NAEP Mathematics Scale

N A T I O N A L I N D I A N E D U C A T I O N S T U D Y : 2 0 0 563
Sample Grade 4 Multiple-Choice Question
Sample question 5 is a multiple-choice question in the algebra content area. This question asked students to represent a given situation with an algebraic expression.
61 percent of fourth-graders answered this question correctly.
5. N stands for the number of hours of sleep Ken gets each night. Which of the following represents the number of hours of sleep Ken gets in 1 week?
A N � 7
B N � 7
N � 7
D N � 7
5.6 6.2 6.4
P
6. On the number line above, what number would be located at point P?
Answer: 6.0
Sample Grade 4 Short Constructed-Response Question
Sample question 6 is a short constructed-response question in the number properties and operations content area. This question asked students to identify the point indicated on a number line. The response shown here would have been rated correct.
56 percent of fourth-graders wrote correct responses.
Grade 4 Mathematics Sample Questions

C h a p t e r 464
Grade 8 Mathematics Assessment Framework As at grade 4, the content of the mathematics assessment at grade 8 is based on a framework that describes in detail how mathematics should be assessed by NAEP. The current NAEP mathematics framework was first used for the 1990 assessment and has continued to date to be the basis for the assessment content. It was developed through a com-prehensive national consultative process and adopted by NAGB. The framework calls for the assessment of mathematics within five content areas and at differ-ent levels of complexity.
Mathematics content areas. In order to ensure that NAEP assesses an appropriate balance of content, the framework defines five broad areas of mathematical content. The content areas assessed at grade 8 are the same as those assessed at grade 4: number prop-erties and operations, measurement, geometry, data analysis and probability, and algebra. At grade 8,however, the emphasis placed on each content area is different from that at grade 4, to reflect differences in curricular emphasis at the two grades. The frame-work calls for the eighth-grade test questions to be distributed across the five content areas in the fol-lowing proportions:
Mathematical complexity. As at grade 4, the frame-work calls for an assessment at grade 8 that measures different levels of mathematical complexity, to make sure that NAEP assesses a variety of ways of know-ing and doing mathematics. The level of complexity of a test question is determined by the demands that it places on students. For example, test questions at grade 8 with a high level of complexity might ask students to provide a mathematical justifica-tion. According to the framework, the ideal balance for the assessment is that half the score is based on items of moderate complexity, with the remainder of the score based equally on items of low and high complexity.
Revisions were made to the framework for the 1996 assessment and again for the 2005 assessment. For example, the names of some of the content areas changed in 2005, but there remains a consistent focus on the five key areas. The framework reflects current curricular emphases and objectives, while continuing a connection to previous frameworks. This connection allows the trend line at grade 8 that started with the 1990 assessment to be maintained.
The grade 8 mathematics assessment consists of ten 25-minute sections of mathematics questions. Each section contains 16 to 21 questions. The questions are either multiple choice or constructed response. Multiple-choice questions require students to select an answer from four or five options, while constructed-response questions require students to write either short or extended answers. Each student receives only a portion of the entire assessment, consisting of a booklet containing two 25-minute sections of mathematics questions.
Number properties and
operations Measurement Geometry
20% 15% 20%
Data analysis and probability Algebra
15% 30%
For More Information…
The complete mathematics framework is available on the NAGB website (http://www.nagb.org/pubs/pubs.html). To view more questions, including sample responses and statistics, visit the NAEP questions tool at http://nces.ed.gov/nationsreportcard/itmrls/.

N A T I O N A L I N D I A N E D U C A T I O N S T U D Y : 2 0 0 565
Basic: Eighth-grade students performing at the Basic level should complete problems correctly with the help of structural prompts such as diagrams, charts, and graphs. They should be able to solve problems in all NAEP content areas through the appropriate selection and use of strategies and technological tools—including calculators, computers, and geometric shapes. Students at this level also should be able to use fundamental algebraic and informal geometric concepts in problem solving.
Profi cient: Eighth-grade students performing at the Profi cient level should be able to conjecture, defend their ideas, and give supporting examples. They should understand the connections between fractions, percents, decimals, and other mathematical topics such as algebra and functions. Students at this level are expected to have a thorough understanding of Basic-level arithmetic operations—an understanding suffi cient for problem solving in practical situations.
Advanced: Eighth-grade students performing at the Advanced level should be able to probe examples and counterexamples in order to shape generalizations from which they can develop models. Eighth-graders performing at the Advanced level should use number sense and geometric awareness to consider the reasonableness of an answer. They are expected to use abstract thinking to create unique problem-solving techniques and explain the reasoning processes underlying their conclusions.
Grade 8 Mathematics Achievement-Level DescriptionsMathematics achievement-level descriptions are based on NAGB achievement-level policy descrip-
tions with subject- and grade-specific information added. The following descriptions are abbreviated versions of the full achievement-level descriptions for grade 8 mathematics. The full descriptions can be found at http://www.nagb.org/pubs/mathbook.pdf.

C h a p t e r 466
Grade 8 Mathematics Item MapThis map describes the knowledge or skill associated with answering individual mathematics questions. The map identifies the score point at which students had a high probability of successfully answering the question.1
500
370
360
350
340
330
320
310
300
290
280
270
260
250
O1 Each grade 8 mathematics question in the 2005 mathematics assessment was mapped onto the NAEP 0–500 mathematics scale. The position of a question on the scale represents the average scale score attained by students who had a 65 percent probability of successfully answering a constructed-response question, a 74 percent probability of correctly answering a four-option multiple-choice question, or a 72 percent probability of correctly answering a fi ve-option multiple-choice question. Only selected questions are presented. Scale score ranges for mathematics achievement levels are referenced on the map. For constructed-response questions, the question description represents students’ performance rated as completely correct.NOTE: Regular type denotes a constructed-response question. Italic type denotes a multiple-choice question.SOURCE: U.S. Department of Education, Institute of Education Sciences, National Center for Education Statistics, National Assessment of Educational Progress (NAEP), 2005 Mathematics Assessment.
Basic
262
Advanced
333
Profi cient
299
365 Reason about pattern on a grid using concept of slope
353 Determine a probability (calculator available)
343 Determine effect of increasing the value of one variable
335 Reason about properties of a parallelogram
330 Determine median price for a gallon of gasoline
319 Estimate the x-coordinate from the graph of a curve317 Solve a story problem involving percent increase315 Determine the 6th term in a pattern—Sample Question 7311 Predict results of experiment using probability
306 Determine an equation given a table of x and y values302 Solve a story problem with multiple operations301 Extend a pattern on grid
294 Determine coordinates to complete a rectangle294 Identify piece of information not needed291 Solve problem involving square root (calculator available)
283 Shade a grid to form symmetric pattern—Sample Question 8282 Determine how many angles are less than 90 degrees282 Convert a written number to decimal form
274 List angle measures from smallest to largest (protractor available)
253 Draw the refl ection of a fi gure252 Determine area of shaded region on grid
247 Solve a multi-step story problem
NAEP Mathematics Scale

N A T I O N A L I N D I A N E D U C A T I O N S T U D Y : 2 0 0 567
Sample Grade 8 Multiple-Choice Question
Sample question 7 is a multiple-choice question in the algebra content area. This question asked students to infer a rule and find the next term in a sequence. The terms in this sequence are the squares of consecutive odd numbers.
60 percent of eighth-graders answered this question correctly.
1, 9, 25, 49, 81,…
7. The same rule is applied to each number in the pattern above. What is the 6th number in the pattern?
A 40
B 100
121
D 144
E 169
Sample Grade 8 Short Constructed-Response Question
Sample question 8 is a short constructed-response question in the geometry content area. This question asked students to shade 5 additional squares in a grid that has 3 shaded squares to create a symmetric pattern. Students were given paper squares for this question. The response shown here would have been rated correct.
58 percent of eighth-graders gave correct responses.
Fold Line
8. Shade fi ve more squares on the grid below so that if your completed fi gure were folded along the fold line both sides would match.
Grade 8 Mathematics Sample Questions

THIS PAGE INTENTIONALLY LEFT BLANK.

N A T I O N A L I N D I A N E D U C A T I O N S T U D Y : 2 0 0 569
Notes
Technical
Introduction to the Technical Notes
This section describes the procedures used for the 2005 National Indian Education Study (NIES), which involved an augmentation of the NAEP 2005 reading and mathematics assess-ment samples of American Indian and Alaska Native students in the fourth and eighth grades. The primary technical components relevant to the NIES are detailed.
NAEP Sampling Procedures for American Indian/Alaska Native StudentsThe samples of American Indian/Alaska Native students participating in the 2005 NAEP reading and mathematics assessments represent augmentations of the sample of American Indian/Alaska Native students who would usually be selected by NAEP. This allows more detailed reporting of performance for this group. In past NAEP samples, Bureau of Indian Affairs (BIA) schools1 were identified as part of the national sample, and the resulting number of participating schools was usually small, fewer than five per grade. In 2005, BIA schools were sampled as a part of each state sample, at the same rate as public schools in a given state. That means, roughly speaking, that a BIA student had the same probability of selection as a public school student in the same state. As a result, about 30 BIA schools were included per grade, thereby increasing the number of American Indian/Alaska Native students in the sample. The national participation of sampled American Indian/Alaska Native students may be found in data appendix table A-1. The total number of participating schools and American Indian/Alaska Native students by region and by selected states may be found in data appendix tables A-2 and A-3.
1 American Indian/Alaska Native students represent about 1 percent of the student population in the United States. Approximately 7 percent
of American Indian/Alaska Native students attend BIA schools which are administered by or affiliated with the U.S. Department of Interior,
Bureau of Indian Affairs (BIA). Schools funded by the BIA are either operated by the BIA or by tribes under contracts or grants. BIA-operated
schools are under the direct auspices of the BIA, and tribally operated schools are run by individual federally-recognized tribes with grants or
contracts from the BIA. The Office of Indian Education Programs (OIEP) in the Bureau of Indian Affairs oversees the BIA school programs
(Freeman and Fox 2005, p. 30 and p. 32).

T E C H N I C A L N O T E S70
Understanding NAEP Reporting GroupsNAEP results are provided for groups of students defined by shared characteristics—race/ethnicity, eligibility for free/reduced-price school lunch, gender, school’s type of location, and parental education. Based on participa-tion rate criteria, results are reported for groups only when sufficient numbers of students and adequate school representation are present. The minimum requirement is at least 62 students in a particular group from at least five primary sampling units (PSUs). However, the data for all students, regardless of whether their group was reported separately, were included in computing overall national results. Definitions of the stu-dent groups follow.
Race/EthnicityIn all NAEP assessments, data about student race/ethnicity are collected from two sources: school records and student self-reports. Prior to 2002, NAEP used students’ self-reported race as the pri-mary race/ethnicity reporting variable. Beginning in 2002, the race/ethnicity variable presented in NAEP reports has been based on the race reported by the school. When school-recorded information is miss-ing, student-reported data are used to determine race/ethnicity.
Schools sampled for NAEP are asked to provide lists of all students in the target grade(s) along with basic demographic information, including race/ethnicity. Students are categorized into one of five mutually exclusive categories plus “other.” Administration Schedules—also referred to as stu-dent rosters—are created that include the list of sampled students along with their basic demographic information. These data are checked and updated during data collection. This race/ethnicity informa-tion is available for all sampled students: those who participated and those who were absent or excluded.
All students who take a NAEP assessment com-plete a section of general student background questions, including questions about their race/eth-nicity. Separate questions are asked about students’ Hispanic ethnic background and about students’ race. This race/ethnicity information is available just for students who participated in the assessment and not for those who were absent or excluded. See http://nces.ed.gov/nationsreportcard/bgquest.asp for more information.
The mutually exclusive racial/ethnic categories are White (non-Hispanic), Black (non-Hispanic), Hispanic, Asian/Pacific Islander, American Indian (including Alaska Native), and Unclassified. Unclassified students are those whose school-report-ed race was “other,” or “unavailable,” or was missing, or who self-reported more than one race category (i.e., “multi-racial”) or none. Hispanic students may be of any race. Information based on student self-reported race/ethnicity is available on the NAEP Data Explorer (http://nces.ed.gov/nationsreportcard/nde).

N A T I O N A L I N D I A N E D U C A T I O N S T U D Y : 2 0 0 571
Eligibility for Free/Reduced-Price School LunchAs part of the Department of Agriculture’s National School Lunch Program, schools can receive cash subsidies and donated commodities in return for offering free or reduced-price lunches to eligible children. Based on available school records, students were classified as either currently eligible for free/reduced-price school lunch or not eligible. Eligibility for the program is determined by a student's family income in relation to the federally established pov-erty level. Free lunch qualification is set at 130 percent of the poverty level or below, and reduced-price lunch qualification is set at between 130 and 185 percent of the poverty level. (For the period July 1, 2004, through June 30, 2005, for a family of four, 130 percent of the poverty level was $24,505, and 185 percent was $34,873. See http://www.fns.usda.gov/cnd/lunch for more information.) The classification applies only to the school year when the assessment was administered (i.e., the 2004–2005 school year) and is not based on eligi-bility in previous years. If school records were not available, the student was classified as “Information not available.” If the school did not participate in the program, all students in that school were classified as “Information not available.”
GenderResults are reported separately for male students and female students. Gender was reported by the student.
Type of LocationResults from the 2005 assessment are reported for students attending schools in three mutually exclu-sive location types: central city, urban fringe/large town, and rural/small town. A school’s type of loca-tion is based on its physical location (as provided by addresses in the NCES Common Core of Data) and on characteristics of the population in that loca-
tion. Classifications are based on three factors: (1) a school’s location within or outside a metropolitan area (as defined by standards of the U.S. Office of Management and Budget), (2) a school’s location in a city or town designated as either urban or rural (based on U.S. Census Bureau classifications), and (3) the population size of that city or town (also based on U.S. Census data). A metropolitan area typically includes at least one principal city with a population of at least 50,000 and adjacent areas that have economic and social ties with the urban cen-ter. Metropolitan areas are coterminous with county boundaries.
Central city
The central city category includes schools located in a large city (a principal city of a metropolitan area having a population of at least 250,000) and those located in a mid-size city (a principal city of a metro-politan area having a population less than 250,000). Central city is a geographical term and is not syn-onymous with “inner city.”
Urban fringe/large town
The urban fringe category includes schools located within a metropolitan area of a large or mid-sized city, in a city or town which is classified as urban by the U.S. Census Bureau, but which does not qualify as a principal city. The large town category includes schools located outside a metropolitan area in a town with a population of at least 25,000.
Rural/small town
The rural category includes all locations within or outside a statistical area that are classified as rural by the U.S. Census Bureau. The small town category includes schools outside a metropolitan area in a town with a population of at least 2,500, but less than or equal to 25,000.

T E C H N I C A L N O T E S72
Parental EducationEighth-graders were asked the following two ques-tions, the responses to which were combined to derive the parental education variable:
How far in school did your mother go?
• She did not finish high school.
• She graduated from high school.
• She had some education after high school.
• She graduated from college.
• I don’t know.
How far in school did your father go?
• He did not finish high school.
• He graduated from high school.
• He had some education after high school.
• He graduated from college.
• I don’t know.
The information was combined into one parental-education reporting variable in the following way: If a student indicated the extent of education for only one parent, that level was included in the data. If a student indicated the extent of education for both parents, the higher of the two levels was included in the data. If a student responded “I don’t know” for both parents, or responded “I don’t know” for one parent and did not respond for the other, the parental education level was classified as “I don’t know.” If the student did not respond for either par-ent, the student was recorded as having provided no response. Fourth-graders’ replies to this question are not reported because their responses to previous NAEP assessments were highly variable, and a large percentage of them chose the “I don’t know” option.
AccommodationsIt is important to assess all selected students from the target population, including students with dis-abilities (SD) and students classified by their schools as English language learners (ELL). To accomplish this goal, students who receive accommodations in their state’s assessments, such as extra testing time or individual rather than group administration, are offered most of the same accommodations in NAEP, except where an accommodation would change the nature of what is being tested. For example, passages and questions in the reading test are not permitted to be read aloud to the student, because that accom-modation would make it a test of listening instead of a test of reading. Similarly, reading passages and questions cannot be presented in a language other than English.
It should be noted that students assessed with accommodations typically received some combina-tion of accommodations. For example, students assessed in small groups (as compared with standard NAEP sessions of about 30 students) usually received extended time. In one-on-one administrations, stu-dents often received assistance in recording answers (e.g., use of a scribe or computer) and were afforded extra time.
The most common accommodations are small-group administration, extended time, one-on-one administration, the use of a scribe or computer, and the use of a bilingual book (mathematics only). See http://nces.ed.gov/nationsreportcard/reading/2005readingacctype.asp and http://nces.ed.gov/nationsreportcard/mathematics/2005mathacctype.asp for more details and a complete list of accommodations.

N A T I O N A L I N D I A N E D U C A T I O N S T U D Y : 2 0 0 573
Exclusion RatesSome students identified as SD or ELL who are sampled for NAEP participation may be excluded from the assessment according to carefully defined criteria. School personnel, guided by the student’s Individualized Education Program (IEP) and by sec-tion 504 eligibility, decide whether a student with a disability should be excluded from participating in the assessment. School personnel also decide wheth-er to exclude students identified as ELL, based on NAEP’s guidelines. The process includes evaluating whether the ELL has the capability to participate in the assessment in English, as well as taking into con-sideration the number of years the student has been receiving instruction in English. The percentages of students excluded from NAEP may vary from one state to another, as well as across years. Percentages of SD and/or ELL students identified, excluded, and assessed with accommodations may be found in data appendix tables A-4 through A-8.
When making comparisons across states, it is important to consider the variation in the exclusion rates. Although every effort is made to include as many students as possible, different states have dif-ferent policies. States that are more inclusive—that is, they assess greater percentages of their students with disabilities and English language learners—may have lower average scores than states that exclude greater percentages of these students.
One factor that contributed to the variability in exclusion rates across states is that the percentage of students who are identified as having disabilities or limited English proficiency varies across juris-dictions. Reasons for the variation include (1) lack of standardized criteria for defining students as having specific disabilities or as being English lan-guage learners; (2) changes or differences in policy and practices regarding implementation of the Individuals with Disabilities Education Act (IDEA); and (3) differences in the percentage of students classified as English language learners and, to a lesser extent, as students with disabilities.
Testing all sampled students is the best way for NAEP to ensure that the statistics generated by the assessment are as representative as possible of the performance of the entire national population and the populations of participating jurisdictions. However, all groups of students include certain proportions that cannot be tested in large-scale assessments. For some students, no accommodation would be sufficient to enable them to participate meaningfully because of the specific nature of their disabilities or their deficit in English language skills.
Drawing Inferences From the ResultsThe reported statistics are estimates and are there-fore subject to a measure of uncertainty. There are two sources of such uncertainty. First, NAEP uses a sample of students rather than testing all stu-dents. Second, all assessments have some amount of uncertainty related to the fact that they cannot ask all questions that might be asked in a content area. The magnitude of this uncertainty is reflected in the standard error of each of the estimates. When the percentages or average scale scores of certain groups are compared, the estimated standard error should be taken into account. Therefore, the compari-sons are based on statistical tests that consider the estimated standard errors of the statistics being com-pared and the magnitude of the difference between the averages or percentages.
The differences between statistics—such as comparisons of two groups of students’ average scale scores and percentages of students at vari-ous achievement levels—that are discussed in this report are determined by using standard errors. Comparisons are based on statistical tests that consider both the size of the differences and the standard errors of the two statistics being compared. Estimates based on smaller groups are likely to have relatively large standard errors. As a consequence, a numerical difference that seems large may not be statistically significant. Furthermore, differences of the same magnitude may or may not be statistically significant, depending upon the size of the standard errors of the statistics. For example, a 5-point dif-ference between male and female students may be

T E C H N I C A L N O T E S74
statistically significant, while a 5-point difference between students from North Dakota and stu-dents from Oklahoma may not be. The differences described in this report have been determined to be statistically significant at the .05 level with appro-priate adjustments for part-to-whole and multiple comparisons (Benjamini and Hochberg 1995).
Any difference between scores or percentages that is identified as higher, lower, larger, or smaller in this report, including within-group differences not marked in tables and charts, meets the requirements for statistical significance.
For the data in this report, all the estimates have corresponding standard errors of the estimates. These standard errors can be found in the Data Appendix. The following table shows the standard deviations of the scores of American Indian/Alaska Native students and of all other students for each subject and grade. Standard deviations reflect the variability of scores within a group, in the original scale of measurement. Thus, standard deviations for these two groups can be used to understand both the variability of NAEP reading and mathematics scores among American Indian/Alaska Native students, and among all other students at each grade level.
Weighting and Variance EstimationA complex sample design was used to select the stu-dents who were assessed. The properties of a sample selected through such a design could be very differ-ent from those of a simple random sample, in which every student in the target population has an equal chance of selection and in which the observations from different sampled students can be consid-ered to be statistically independent of one another. Therefore, the properties of the sample for the data collection design were taken into account during the analysis of the assessment data.
One way that the properties of the sample design were addressed was by using sampling weights to account for the fact that the probabilities of selection were not identical for all students. All population and subpopulation characteristics based on the assessment data were estimated using sampling weights. These weights included adjustments for school and student nonresponse.
Not only must appropriate estimates of population characteristics be derived, but appropriate measures of the degree of uncertainty must be obtained for those statistics. Two components of uncertainty are accounted for in the variability of statistics based on student ability: (1) the uncertainty due to sampling only a relatively small number of students, and (2) the uncertainty due to sampling only a relatively small number of cognitive questions. The first com-ponent accounts for the variability associated with the estimated percentages of students who had cer-tain background characteristics or who had a certain rating for their responses to a task.
Standard deviation
American Indian/Alaska Native students
All other students
Grade 4
Reading 37.7 36.1
Mathematics 27.9 28.4
Grade 8
Reading 34.7 35.2
Mathematics 32.6 36.3SOURCE: U.S. Department of Education, Institute of Education Sciences, National Center for Education Statistics, National Assessment of Educational Progress (NAEP), 2005 National Indian Education Study.
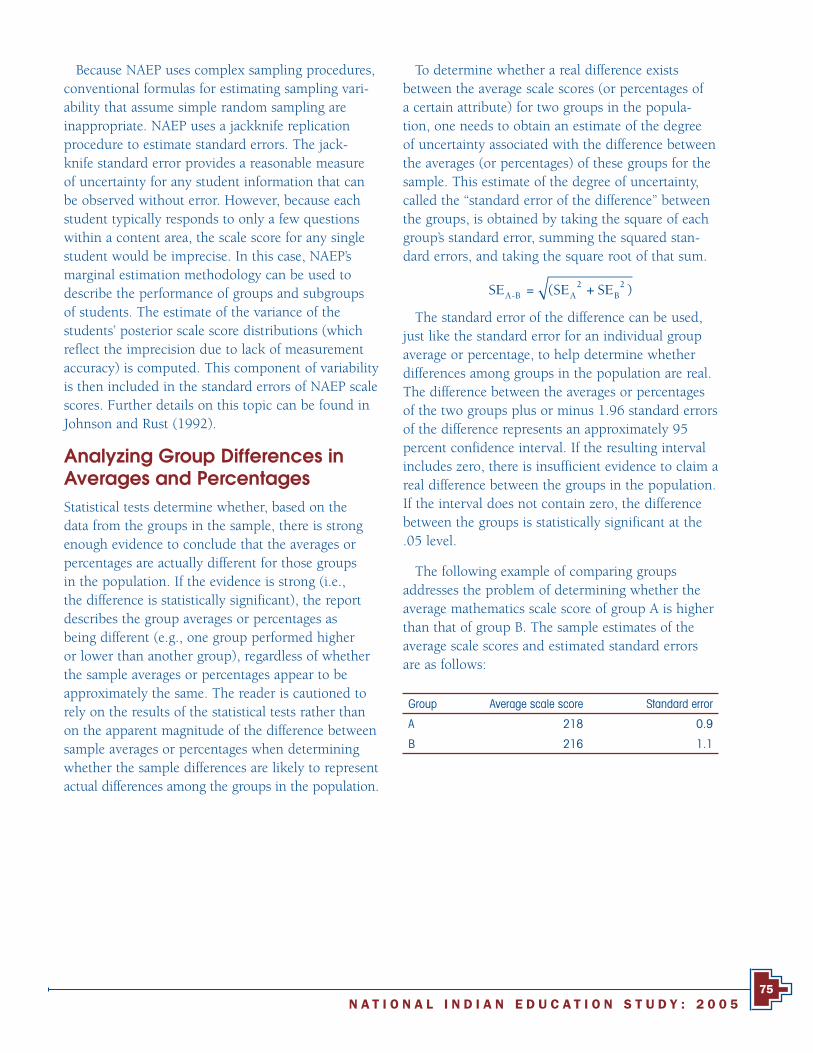
N A T I O N A L I N D I A N E D U C A T I O N S T U D Y : 2 0 0 575
Because NAEP uses complex sampling procedures, conventional formulas for estimating sampling vari-ability that assume simple random sampling are inappropriate. NAEP uses a jackknife replication procedure to estimate standard errors. The jack-knife standard error provides a reasonable measure of uncertainty for any student information that can be observed without error. However, because each student typically responds to only a few questions within a content area, the scale score for any single student would be imprecise. In this case, NAEP’s marginal estimation methodology can be used to describe the performance of groups and subgroups of students. The estimate of the variance of the students’ posterior scale score distributions (which reflect the imprecision due to lack of measurement accuracy) is computed. This component of variability is then included in the standard errors of NAEP scale scores. Further details on this topic can be found in Johnson and Rust (1992).
Analyzing Group Differences in Averages and Percentages Statistical tests determine whether, based on the data from the groups in the sample, there is strong enough evidence to conclude that the averages or percentages are actually different for those groups in the population. If the evidence is strong (i.e., the difference is statistically significant), the report describes the group averages or percentages as being different (e.g., one group performed higher or lower than another group), regardless of whether the sample averages or percentages appear to be approximately the same. The reader is cautioned to rely on the results of the statistical tests rather than on the apparent magnitude of the difference between sample averages or percentages when determining whether the sample differences are likely to represent actual differences among the groups in the population.
Group Average scale score Standard error
A 218 0.9
B 216 1.1
To determine whether a real difference exists between the average scale scores (or percentages of a certain attribute) for two groups in the popula-tion, one needs to obtain an estimate of the degree of uncertainty associated with the difference between the averages (or percentages) of these groups for the sample. This estimate of the degree of uncertainty, called the “standard error of the difference” between the groups, is obtained by taking the square of each group’s standard error, summing the squared stan-dard errors, and taking the square root of that sum.
SE = (SE SE )A-B A2
B2+
The standard error of the difference can be used, just like the standard error for an individual group average or percentage, to help determine whether differences among groups in the population are real. The difference between the averages or percentages of the two groups plus or minus 1.96 standard errors of the difference represents an approximately 95 percent confidence interval. If the resulting interval includes zero, there is insufficient evidence to claim a real difference between the groups in the population. If the interval does not contain zero, the difference between the groups is statistically significant at the .05 level.
The following example of comparing groups addresses the problem of determining whether the average mathematics scale score of group A is higher than that of group B. The sample estimates of the average scale scores and estimated standard errors are as follows:

T E C H N I C A L N O T E S76
The difference between the estimates of the average scale scores of groups A and B is two points (218–216).The standard error of this difference is
(0.92 + =1 1 1 42
. ) .
Thus, an approximately 95 percent confidence interval for this difference is plus or minus 1.96 stan-dard errors of the difference:
2 ± 1.96 × 1.4
2 ± 2.7
(-0.7, 4.7)
The value zero is within the confidence interval; therefore, there is insufficient evidence to conclude that group A’s performance is statistically different from group B.
The procedure above is appropriate to use when it is reasonable to assume that the groups being compared have been independently sampled for the assessment. Such an assumption is clearly war-ranted when comparing results for one state with another. This is the approach used for NAEP reports when comparisons involving independent groups are made. The assumption of independence is vio-lated to some degree when comparing group results for the nation or a particular state (e.g., comparing national 2005 results for males and females), since these samples of students have been drawn from the same schools.
When the groups being compared do not share students (as is the case, for example, of comparing males and females), the impact of this violation of the independence assumption on the outcome of the statistical tests is assumed to be small, and NAEP, by convention, has, for computational convenience, routinely applied the procedures described above to those cases as well.
When making comparisons of results for groups that share a considerable proportion of students in common, it is not appropriate to ignore such depen-dencies. In such cases, NAEP has used procedures appropriate to comparing dependent groups. When the dependence in group results is due to the overlap in samples (e.g., when a subgroup is being compared to a total group), a simple modification of the usual standard error of the difference formula can be used. The formula for such cases is
SE = (SE + SE 2pSETotal-Subgroup Total2
Subgroup2
Subgroup2− )
where p is the proportion of the total group con-tained in the subgroup.This formula was used for this report when a state was compared to the aggre-gate nation.
Conducting Multiple TestsThe procedures used to determine whether group differences in the samples represent actual differ-ences among the groups in the population and the certainty ascribed to intervals (e.g., a 95 percent con-fidence interval) are based on statistical theory that assumes that only one confidence interval or test of statistical significance is being performed. However, there are times when many different groups are being compared (i.e., multiple sets of confidence intervals are being analyzed). For multiple comparisons, sta-tistical theory indicates that the certainty associated with the entire set of comparisons is less than that attributable to each individual comparison from the set. To hold the significance level for the set of com-parisons at a particular level (e.g., .05), the standard methods must be adjusted by multiple comparison procedures (Miller 1981). The procedure used by NAEP is the Benjamini-Hochberg False Discovery Rate (FDR) procedure (Benjamini and Hochberg 1995).

N A T I O N A L I N D I A N E D U C A T I O N S T U D Y : 2 0 0 577
Unlike other multiple comparison procedures that control the familywise error rate (i.e., the probability of making even one false rejection in the set of com-parisons), the FDR procedure controls the expected proportion of falsely rejected hypotheses. (A “fam-ily” in this context is the number of categories to be compared for a given variable. This might be six within the race/ethnicity variable or 50 when consid-ering states.) Furthermore, the FDR procedure used in NAEP is considered appropriately less conserva-tive than familywise procedures for large families of comparisons (Williams, Jones, and Tukey 1999). Therefore, the FDR procedure is more suitable for multiple comparisons in NAEP than are other procedures.
Cautions in InterpretationIt is possible to examine NAEP performance results for groups of students defined by various back-ground factors measured by NAEP, such as whether their teachers use certain instructional techniques or how much reading material is available in their homes. However, a relationship that exists between achievement and another variable does not reveal its underlying cause, which may be influenced by a number of other variables. Similarly, the assessments do not reflect the influence of unmeasured variables. The results are most useful when they are considered in combination with other knowledge about the stu-dent population and the educational system, such as trends in instruction, changes in the school-age population, and societal demands and expectations.
T E C H N I C A L N O T E S78
References
Benjamini, Y., and Hochberg, Y. (1995). Controlling the False Discovery Rate: A Practical and Powerful Approach to Multiple Testing. Journal of the Royal Statistical Society, Series B, no. 1, 289–300.
Braswell, J.S., Dion, G.S., Daane, M.C., and Jin, Y. (2005). The Nations’ Report Card: Mathematics 2003 (NCES 2005-451). U.S. Department of Education, National Center for Education Statistics. Washington, DC: U.S. Government Printing Office.
Donahue, P.L., Daane, M.C., and Jin, Y. (2005). The Nation’s Report Card: Reading 2003 (NCES 2005-453). U.S. Department of Education, National Center for Education Statistics. Washington, DC: U.S. Government Printing Office.
Flanagan, K., and Park, J. (2005). American Indian and Alaska Native Children: Findings From the Base Year of the Early Childhood Longitudinal Study, Birth Cohort (ECLS-B) (NCES 2005–116). U.S. Department of Education, National Center for Education Statistics. Washington, DC: U.S. Government Printing Office.
Freeman, C., and Fox, M. (2005). Status and Trends in the Education of American Indians and Alaska Natives (NCES 2005-108). U.S. Department of Education, National Center for Education Statistics. Washington, DC: U.S. Government Printing Office.
Indian Nations At Risk Task Force. (1991). Indian Nations at Risk: An Educational Strategy for Action. Final Report. Washington, DC: U.S. Department of Education. (ERIC Document Reproduction Service No. ED339587).
Johnson, E.G., and Rust, K.F. (1992). Population Inferences and Variance Estimation for NAEP Data. Journal of Educational Statistics, 17(2), 175–190.
Miller, R.G. (1981). Simultaneous Statistical Inference (2nd ed.). New York: Springer-Verlag.
Williams, V.S.L., Jones, L.V., and Tukey, J.W. (1999). Controlling Error in Multiple Comparisons with Examples From State-to-State Differences in Educational Achievement. Journal of Educational and Behavioral Statistics, 24(1), 42–69.

N A T I O N A L I N D I A N E D U C A T I O N S T U D Y : 2 0 0 579
aPPENDIX
dATA
Table A-1. National school participation rates and national American Indian/Alaska Native student participation rates for reading and mathematics, grades 4 and 8: 2005
School participation1American Indian/Alaska
Native student participation2
Student-weighted School-weighted Number of schools
participating after
substitution
Student-weighted
percent
Number of students
assessedAssessment
Percent before
substitution
Percent after
substitution
Percent before
substitution
Percent after
substitution
Grade 4
Reading 96 98 90 94 9,550 93 3,800
Mathematics 96 98 90 94 9,550 93 3,900
Grade 8
Reading 97 98 86 90 7,220 91 3,400
Mathematics 97 98 86 90 7,220 88 3,5001 National school participation includes all schools, regardless of whether or not any American Indian/Alaska Native students were sampled.2 National American Indian/Alaska Native student participation includes American Indian/Alaska Native students in the participating schools.NOTE: The columns of percentages have different denominators. For columns 1 and 2, the denominator is the estimated number of students repre-sented by the initially selected schools that had eligible students enrolled. For columns 3 and 4, the denominator is the estimated number of schools represented by the initially selected schools that had eligible students enrolled. For column 6, the denominator is the estimated number of American Indian/Alaska Native students represented by the eligible sampled students in participating schools. The numbers of schools are rounded to the nearest ten. The numbers of students are rounded to the nearest hundred. “Substitution” refers to the procedures for preselecting substitute schools for schools that had been originally selected for participation in the assessment. If an original school was unable to participate, a preselected sub-stitute school was used. To minimize bias, a substitute school resembled the original selection as much as possible in affi liation, type of location, estimated number of grade-eligible students, and demographic composition.SOURCE: U.S. Department of Education, Institute of Education Sciences, National Center for Education Statistics, National Assessment of Educational Progress (NAEP), 2005 National Indian Education Study.
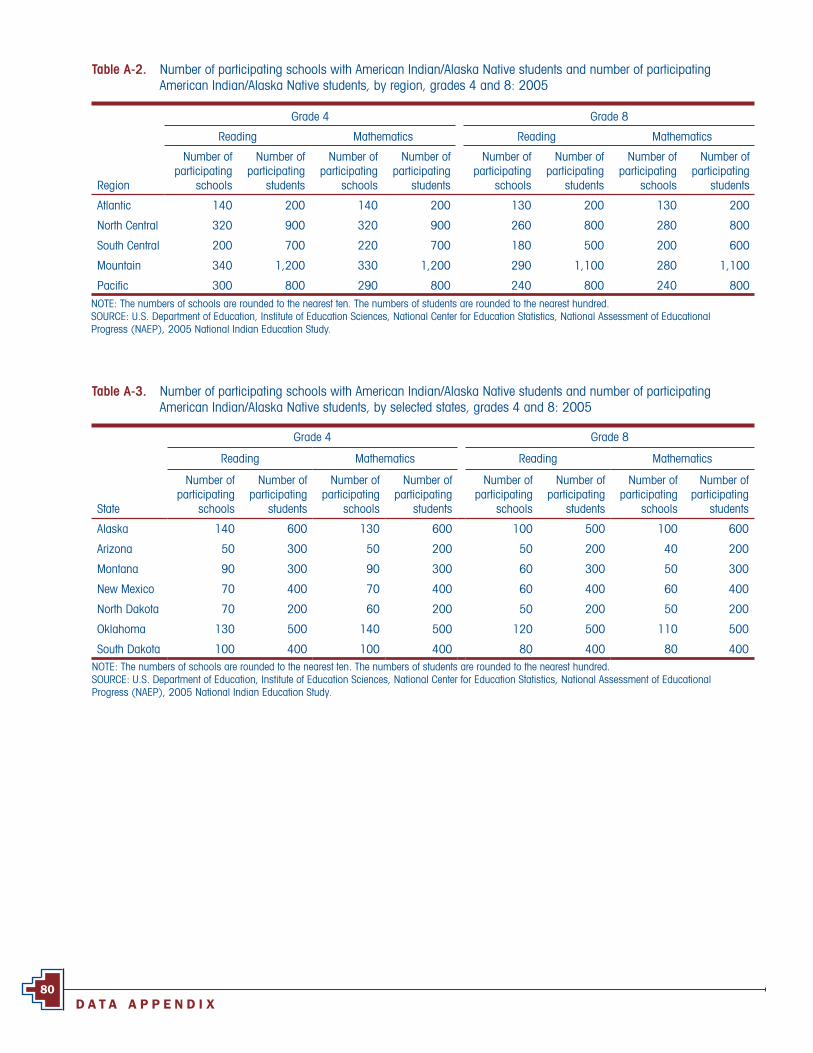
D A T A A P P E N D I X80
Table A-3. Number of participating schools with American Indian/Alaska Native students and number of participating American Indian/Alaska Native students, by selected states, grades 4 and 8: 2005
Grade 4 Grade 8
Reading Mathematics Reading Mathematics
State
Number of participating
schools
Number of participating
students
Number of participating
schools
Number of participating
students
Number of participating
schools
Number of participating
students
Number of participating
schools
Number of participating
students
Alaska 140 600 130 600 100 500 100 600
Arizona 50 300 50 200 50 200 40 200
Montana 90 300 90 300 60 300 50 300
New Mexico 70 400 70 400 60 400 60 400
North Dakota 70 200 60 200 50 200 50 200
Oklahoma 130 500 140 500 120 500 110 500
South Dakota 100 400 100 400 80 400 80 400NOTE: The numbers of schools are rounded to the nearest ten. The numbers of students are rounded to the nearest hundred. SOURCE: U.S. Department of Education, Institute of Education Sciences, National Center for Education Statistics, National Assessment of Educational Progress (NAEP), 2005 National Indian Education Study.
Table A-2. Number of participating schools with American Indian/Alaska Native students and number of participating American Indian/Alaska Native students, by region, grades 4 and 8: 2005
Region
Grade 4 Grade 8
Reading Mathematics Reading Mathematics
Number of participating
schools
Number of participating
students
Number of participating
schools
Number of participating
students
Number of participating
schools
Number of participating
students
Number of participating
schools
Number of participating
students
Atlantic 140 200 140 200 130 200 130 200
North Central 320 900 320 900 260 800 280 800
South Central 200 700 220 700 180 500 200 600
Mountain 340 1,200 330 1,200 290 1,100 280 1,100
Pacifi c 300 800 290 800 240 800 240 800NOTE: The numbers of schools are rounded to the nearest ten. The numbers of students are rounded to the nearest hundred. SOURCE: U.S. Department of Education, Institute of Education Sciences, National Center for Education Statistics, National Assessment of Educational Progress (NAEP), 2005 National Indian Education Study.

N A T I O N A L I N D I A N E D U C A T I O N S T U D Y : 2 0 0 581
Table A-4. Students identifi ed, excluded, and assessed with accommodations, by students with disabilities and/or English language learners, as percentages of all sampled students, grades 4 and 8 public and nonpublic schools: 2005
Grade 4 Grade 8
Student characteristics
American Indian/Alaska Native
studentsAll other students
American Indian/Alaska Native
studentsAll other students
Reading
Total number of students assessed 3,800 161,900 3,400 156,000
SD and/or ELL
Identifi ed 28 21 28 17
Excluded 5 6 5 5
Assessed with accommodations 9 6 10 6
SD only
Identifi ed 15 13 17 12
Excluded 5 5 5 4
Assessed with accommodations 6 5 8 5
ELL only
Identifi ed 16 10 14 6
Excluded 1 2 2 1
Assessed with accommodations 4 1 4 1
Mathematics
Total number of students assessed 3,900 168,100 3,500 158,100
SD and/or ELL
Identifi ed 29 21 28 17
Excluded 3 3 4 3
Assessed with accommodations 14 9 11 7
SD only
Identifi ed 16 13 16 12
Excluded 3 2 4 3
Assessed with accommodations 10 7 9 7
ELL only
Identifi ed 16 9 15 6
Excluded 1 1 1 1
Assessed with accommodations 6 2 4 1
NOTE: SD = students with disabilities. ELL = English language learners. Students identifi ed as both SD and ELL were counted only once under the combined SD and/or ELL category, but were counted separately under the SD and ELL categories. The numbers of students are rounded to the nearest hundred. The percentages presented in the table are based on the number of students selected to be assessed, which is different from the number of students actually assessed shown in the table. SOURCE: U.S. Department of Education, Institute of Education Sciences, National Center for Education Statistics, National Assessment of Educational Progress (NAEP), 2005 National Indian Education Study.

D A T A A P P E N D I X82
SD and/or ELL SD only ELL only
Student group and jurisdiction Identifi ed Excluded
Assessed with
accom-modations Identifi ed Excluded
Assessed with
accom-modations Identifi ed Excluded
Assessed with
accom-modations
American Indian/Alaska Native students
Nation 28 5 9 15 5 6 16 1 4
Regions
Atlantic 16 7 6 14 7 6 3 1 1
North Central 24 8 7 18 8 6 8 1 2
South Central 19 4 7 17 4 6 4 1 1
Mountain 46 6 15 14 5 7 38 3 12
Pacifi c 24 3 7 13 3 6 13 1 2
Selected states
Alaska 50 5 14 18 5 9 37 2 7
Arizona 46 5 11 12 5 4 38 2 9
Montana 35 8 13 19 8 9 23 2 9
New Mexico 64 8 24 16 6 8 60 7 22
North Dakota 22 13 3 23 13 3 # # #
Oklahoma 18 3 9 16 3 7 3 1 1
South Dakota 45 10 12 21 9 7 30 3 8
All other students
Nation 21 6 6 13 5 5 10 2 1
Regions
Atlantic 19 6 9 15 5 7 5 2 2
North Central 17 6 6 13 5 5 4 1 1
South Central 20 8 3 13 6 3 8 3 #
Mountain 23 5 7 12 4 5 13 3 3
Pacifi c 33 5 4 9 3 3 26 3 2
Table A-5. Percentage of students identifi ed as students with disabilities and/or English language learners, excluded, and assessed in reading with accommodations, by student group and jurisdiction, grade 4: 2005
# The estimate rounds to zero. NOTE: SD = students with disabilities. ELL = English language learners. Students identifi ed as both SD and ELL were counted only once under the combined SD and/or ELL category, but were counted separately under the SD and ELL categories. The national and regional results include both public and nonpublic schools. The state results include only public and Bureau of Indian Affairs schools. SOURCE: U.S. Department of Education, Institute of Education Sciences, National Center for Education Statistics, National Assessment of Educational Progress (NAEP), 2005 National Indian Education Study.
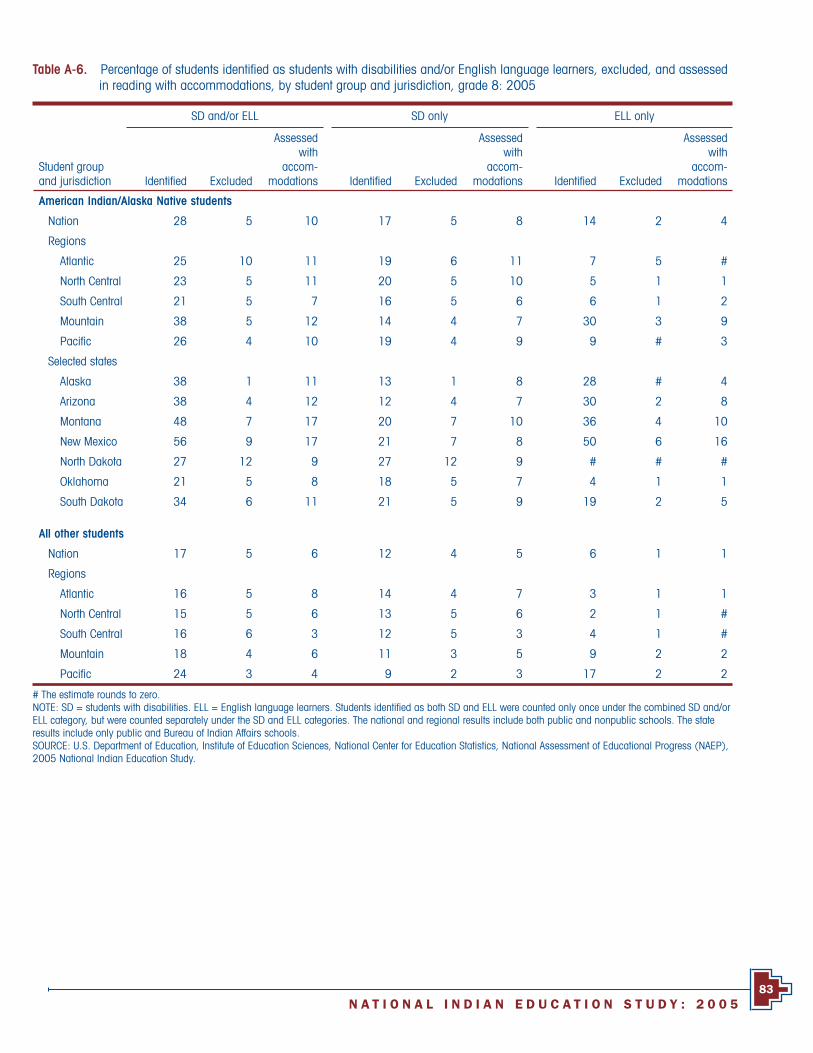
N A T I O N A L I N D I A N E D U C A T I O N S T U D Y : 2 0 0 583
SD and/or ELL SD only ELL only
Student group and jurisdiction Identifi ed Excluded
Assessed with
accom-modations Identifi ed Excluded
Assessed with
accom-modations Identifi ed Excluded
Assessed with
accom-modations
American Indian/Alaska Native students
Nation 28 5 10 17 5 8 14 2 4
Regions
Atlantic 25 10 11 19 6 11 7 5 #
North Central 23 5 11 20 5 10 5 1 1
South Central 21 5 7 16 5 6 6 1 2
Mountain 38 5 12 14 4 7 30 3 9
Pacifi c 26 4 10 19 4 9 9 # 3
Selected states
Alaska 38 1 11 13 1 8 28 # 4
Arizona 38 4 12 12 4 7 30 2 8
Montana 48 7 17 20 7 10 36 4 10
New Mexico 56 9 17 21 7 8 50 6 16
North Dakota 27 12 9 27 12 9 # # #
Oklahoma 21 5 8 18 5 7 4 1 1
South Dakota 34 6 11 21 5 9 19 2 5
All other students
Nation 17 5 6 12 4 5 6 1 1
Regions
Atlantic 16 5 8 14 4 7 3 1 1
North Central 15 5 6 13 5 6 2 1 #
South Central 16 6 3 12 5 3 4 1 #
Mountain 18 4 6 11 3 5 9 2 2
Pacifi c 24 3 4 9 2 3 17 2 2
Table A-6. Percentage of students identifi ed as students with disabilities and/or English language learners, excluded, and assessed in reading with accommodations, by student group and jurisdiction, grade 8: 2005
# The estimate rounds to zero. NOTE: SD = students with disabilities. ELL = English language learners. Students identifi ed as both SD and ELL were counted only once under the combined SD and/or ELL category, but were counted separately under the SD and ELL categories. The national and regional results include both public and nonpublic schools. The state results include only public and Bureau of Indian Affairs schools. SOURCE: U.S. Department of Education, Institute of Education Sciences, National Center for Education Statistics, National Assessment of Educational Progress (NAEP), 2005 National Indian Education Study.
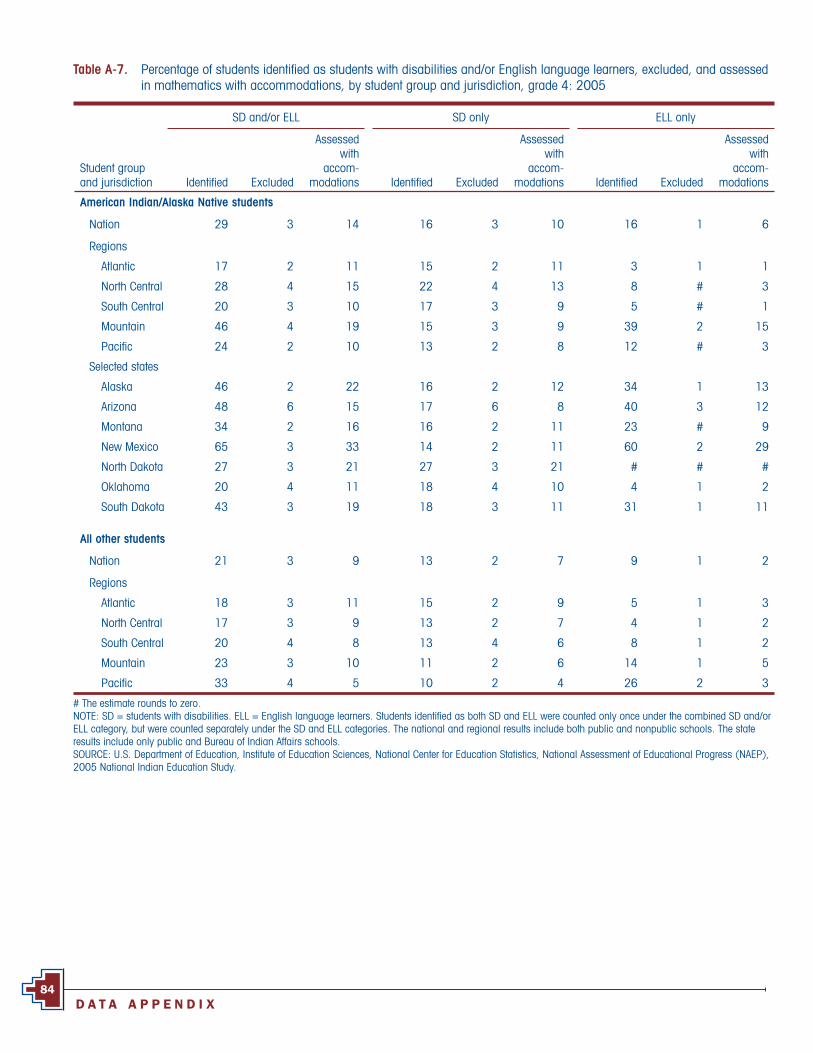
D A T A A P P E N D I X84
SD and/or ELL SD only ELL only
Student group and jurisdiction Identifi ed Excluded
Assessed with
accom-modations Identifi ed Excluded
Assessed with
accom-modations Identifi ed Excluded
Assessed with
accom-modations
American Indian/Alaska Native students
Nation 29 3 14 16 3 10 16 1 6
Regions
Atlantic 17 2 11 15 2 11 3 1 1
North Central 28 4 15 22 4 13 8 # 3
South Central 20 3 10 17 3 9 5 # 1
Mountain 46 4 19 15 3 9 39 2 15
Pacifi c 24 2 10 13 2 8 12 # 3
Selected states
Alaska 46 2 22 16 2 12 34 1 13
Arizona 48 6 15 17 6 8 40 3 12
Montana 34 2 16 16 2 11 23 # 9
New Mexico 65 3 33 14 2 11 60 2 29
North Dakota 27 3 21 27 3 21 # # #
Oklahoma 20 4 11 18 4 10 4 1 2
South Dakota 43 3 19 18 3 11 31 1 11
All other students
Nation 21 3 9 13 2 7 9 1 2
Regions
Atlantic 18 3 11 15 2 9 5 1 3
North Central 17 3 9 13 2 7 4 1 2
South Central 20 4 8 13 4 6 8 1 2
Mountain 23 3 10 11 2 6 14 1 5
Pacifi c 33 4 5 10 2 4 26 2 3
Table A-7. Percentage of students identifi ed as students with disabilities and/or English language learners, excluded, and assessed in mathematics with accommodations, by student group and jurisdiction, grade 4: 2005
# The estimate rounds to zero. NOTE: SD = students with disabilities. ELL = English language learners. Students identifi ed as both SD and ELL were counted only once under the combined SD and/or ELL category, but were counted separately under the SD and ELL categories. The national and regional results include both public and nonpublic schools. The state results include only public and Bureau of Indian Affairs schools. SOURCE: U.S. Department of Education, Institute of Education Sciences, National Center for Education Statistics, National Assessment of Educational Progress (NAEP), 2005 National Indian Education Study.

N A T I O N A L I N D I A N E D U C A T I O N S T U D Y : 2 0 0 585
SD and/or ELL SD only ELL only
Student group and jurisdiction Identifi ed Excluded
Assessed with
accom-modations Identifi ed Excluded
Assessed with
accom-modations Identifi ed Excluded
Assessed with
accom-modations
American Indian/Alaska Native students
Nation 28 4 11 16 4 9 15 1 4
Regions
Atlantic 19 6 9 16 4 9 5 2 #
North Central 26 5 13 21 5 13 7 # 2
South Central 19 3 8 15 3 7 5 # 1
Mountain 41 4 15 16 4 9 31 2 10
Pacifi c 25 3 8 15 3 7 12 # 2
Selected states
Alaska 43 2 16 17 2 12 32 1 8
Arizona 41 8 9 15 8 5 31 4 5
Montana 46 4 21 20 3 14 35 3 14
New Mexico 57 3 26 21 3 14 46 1 20
North Dakota 30 12 12 30 12 12 # # #
Oklahoma 20 4 9 17 4 8 4 # 1
South Dakota 38 2 19 22 2 16 25 1 11
All other students
Nation 17 3 7 12 3 7 6 1 1
Regions
Atlantic 16 3 10 14 3 8 3 1 1
North Central 15 3 8 13 3 8 2 # 1
South Central 16 4 5 12 4 4 4 1 1
Mountain 18 3 7 11 2 6 9 1 2
Pacifi c 23 2 5 9 2 4 16 1 2
# The estimate rounds to zero. NOTE: SD = students with disabilities. ELL = English language learners. Students identifi ed as both SD and ELL were counted only once under the combined SD and/or ELL category, but were counted separately under the SD and ELL categories. The national and regional results include both public and nonpublic schools. The state results include only public and Bureau of Indian Affairs schools. SOURCE: U.S. Department of Education, Institute of Education Sciences, National Center for Education Statistics, National Assessment of Educational Progress (NAEP), 2005 National Indian Education Study.
Table A-8. Percentage of students identifi ed as students with disabilities and/or English language learners, excluded, and assessed in mathematics with accommodations, by student group and jurisdiction, grade 8: 2005
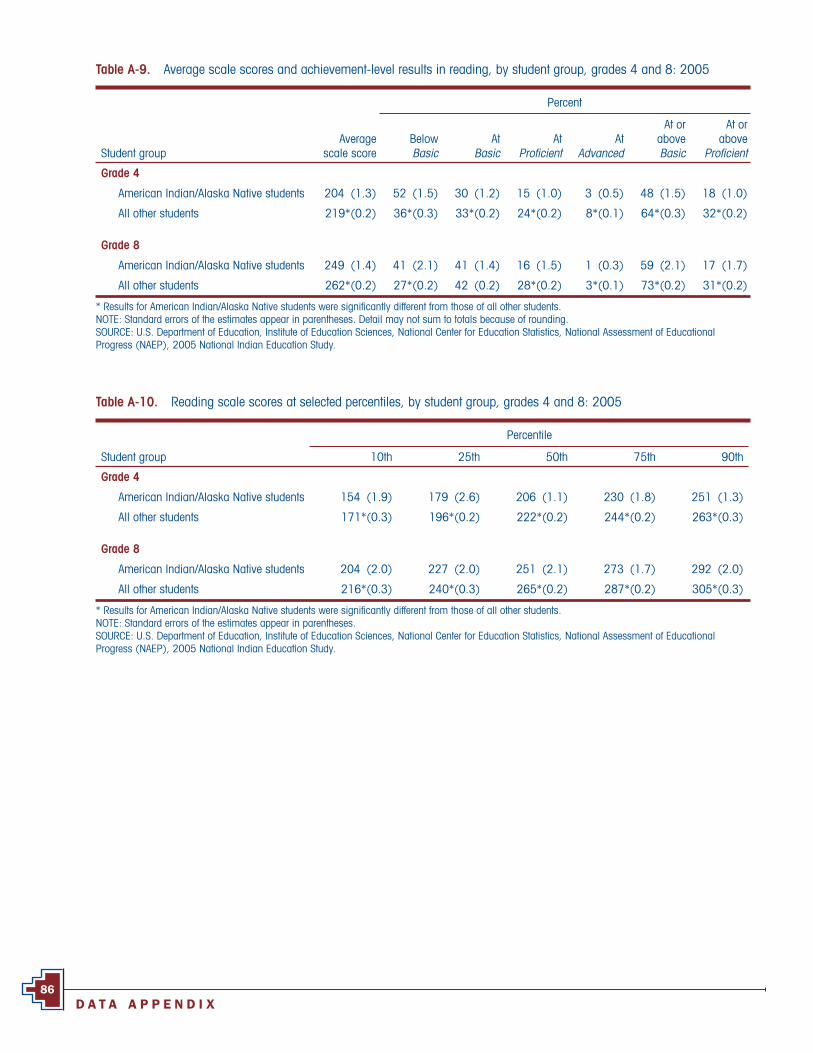
D A T A A P P E N D I X86
Table A-9. Average scale scores and achievement-level results in reading, by student group, grades 4 and 8: 2005
Percent
Student groupAverage
scale scoreBelow Basic
At Basic
At Profi cient
At Advanced
At or above Basic
At or above
Profi cient
Grade 4
American Indian/Alaska Native students 204 (1.3) 52 (1.5) 30 (1.2) 15 (1.0) 3 (0.5) 48 (1.5) 18 (1.0)
All other students 219*(0.2) 36*(0.3) 33*(0.2) 24*(0.2) 8*(0.1) 64*(0.3) 32*(0.2)
Grade 8
American Indian/Alaska Native students 249 (1.4) 41 (2.1) 41 (1.4) 16 (1.5) 1 (0.3) 59 (2.1) 17 (1.7)
All other students 262*(0.2) 27*(0.2) 42 (0.2) 28*(0.2) 3*(0.1) 73*(0.2) 31*(0.2)
* Results for American Indian/Alaska Native students were signifi cantly different from those of all other students.NOTE: Standard errors of the estimates appear in parentheses. Detail may not sum to totals because of rounding.SOURCE: U.S. Department of Education, Institute of Education Sciences, National Center for Education Statistics, National Assessment of Educational Progress (NAEP), 2005 National Indian Education Study.
Table A-10. Reading scale scores at selected percentiles, by student group, grades 4 and 8: 2005
Percentile
Student group 10th 25th 50th 75th 90th
Grade 4
American Indian/Alaska Native students 154 (1.9) 179 (2.6) 206 (1.1) 230 (1.8) 251 (1.3)
All other students 171*(0.3) 196*(0.2) 222*(0.2) 244*(0.2) 263*(0.3)
Grade 8
American Indian/Alaska Native students 204 (2.0) 227 (2.0) 251 (2.1) 273 (1.7) 292 (2.0)
All other students 216*(0.3) 240*(0.3) 265*(0.2) 287*(0.2) 305*(0.3)
* Results for American Indian/Alaska Native students were signifi cantly different from those of all other students.NOTE: Standard errors of the estimates appear in parentheses.SOURCE: U.S. Department of Education, Institute of Education Sciences, National Center for Education Statistics, National Assessment of Educational Progress (NAEP), 2005 National Indian Education Study.
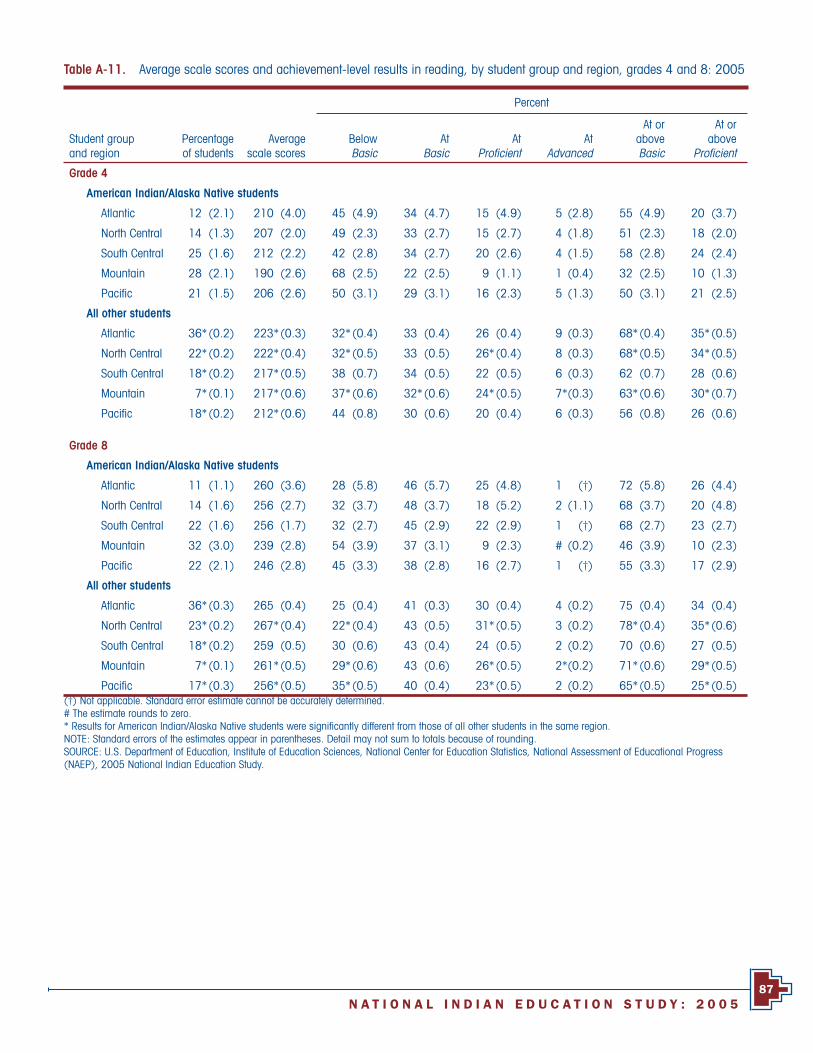
N A T I O N A L I N D I A N E D U C A T I O N S T U D Y : 2 0 0 587
Table A-11. Average scale scores and achievement-level results in reading, by student group and region, grades 4 and 8: 2005
Percent
Student group and region
Percentage of students
Averagescale scores
Below Basic
AtBasic
At Profi cient
At Advanced
At or above Basic
At or above
Profi cient
Grade 4
American Indian/Alaska Native students
Atlantic 12 (2.1) 210 (4.0) 45 (4.9) 34 (4.7) 15 (4.9) 5 (2.8) 55 (4.9) 20 (3.7)
North Central 14 (1.3) 207 (2.0) 49 (2.3) 33 (2.7) 15 (2.7) 4 (1.8) 51 (2.3) 18 (2.0)
South Central 25 (1.6) 212 (2.2) 42 (2.8) 34 (2.7) 20 (2.6) 4 (1.5) 58 (2.8) 24 (2.4)
Mountain 28 (2.1) 190 (2.6) 68 (2.5) 22 (2.5) 9 (1.1) 1 (0.4) 32 (2.5) 10 (1.3)
Pacifi c 21 (1.5) 206 (2.6) 50 (3.1) 29 (3.1) 16 (2.3) 5 (1.3) 50 (3.1) 21 (2.5)
All other students
Atlantic 36*(0.2) 223*(0.3) 32*(0.4) 33 (0.4) 26 (0.4) 9 (0.3) 68*(0.4) 35*(0.5)
North Central 22*(0.2) 222*(0.4) 32*(0.5) 33 (0.5) 26*(0.4) 8 (0.3) 68*(0.5) 34*(0.5)
South Central 18*(0.2) 217*(0.5) 38 (0.7) 34 (0.5) 22 (0.5) 6 (0.3) 62 (0.7) 28 (0.6)
Mountain 7*(0.1) 217*(0.6) 37*(0.6) 32*(0.6) 24*(0.5) 7*(0.3) 63*(0.6) 30*(0.7)
Pacifi c 18*(0.2) 212*(0.6) 44 (0.8) 30 (0.6) 20 (0.4) 6 (0.3) 56 (0.8) 26 (0.6)
Grade 8
American Indian/Alaska Native students
Atlantic 11 (1.1) 260 (3.6) 28 (5.8) 46 (5.7) 25 (4.8) 1 (†) 72 (5.8) 26 (4.4)
North Central 14 (1.6) 256 (2.7) 32 (3.7) 48 (3.7) 18 (5.2) 2 (1.1) 68 (3.7) 20 (4.8)
South Central 22 (1.6) 256 (1.7) 32 (2.7) 45 (2.9) 22 (2.9) 1 (†) 68 (2.7) 23 (2.7)
Mountain 32 (3.0) 239 (2.8) 54 (3.9) 37 (3.1) 9 (2.3) # (0.2) 46 (3.9) 10 (2.3)
Pacifi c 22 (2.1) 246 (2.8) 45 (3.3) 38 (2.8) 16 (2.7) 1 (†) 55 (3.3) 17 (2.9)
All other students
Atlantic 36*(0.3) 265 (0.4) 25 (0.4) 41 (0.3) 30 (0.4) 4 (0.2) 75 (0.4) 34 (0.4)
North Central 23*(0.2) 267*(0.4) 22*(0.4) 43 (0.5) 31*(0.5) 3 (0.2) 78*(0.4) 35*(0.6)
South Central 18*(0.2) 259 (0.5) 30 (0.6) 43 (0.4) 24 (0.5) 2 (0.2) 70 (0.6) 27 (0.5)
Mountain 7*(0.1) 261*(0.5) 29*(0.6) 43 (0.6) 26*(0.5) 2*(0.2) 71*(0.6) 29*(0.5)
Pacifi c 17*(0.3) 256*(0.5) 35*(0.5) 40 (0.4) 23*(0.5) 2 (0.2) 65*(0.5) 25*(0.5)(†) Not applicable. Standard error estimate cannot be accurately determined.# The estimate rounds to zero. * Results for American Indian/Alaska Native students were signifi cantly different from those of all other students in the same region.NOTE: Standard errors of the estimates appear in parentheses. Detail may not sum to totals because of rounding. SOURCE: U.S. Department of Education, Institute of Education Sciences, National Center for Education Statistics, National Assessment of Educational Progress (NAEP), 2005 National Indian Education Study.

D A T A A P P E N D I X88
Table A-12. Average scale scores and achievement-level results in reading for American Indian/Alaska Native students only, by nation and selected states, grades 4 and 8: 2005
Percent
StateAverage
scale scoreBelow Basic
At Basic
At Profi cient
At Advanced
At or above Basic
At or above
Profi cient
Grade 4
Nation 204 (1.3) 52 (1.5) 30 (1.2) 15 (1.0) 3 (0.5) 48 (1.5) 18 (1.0)
Alaska 183*(3.0) 71*(2.3) 20*(2.5) 8*(1.5) 1*(0.4) 29*(2.3) 9*(1.6)
Arizona 184*(5.3) 75*(4.7) 17 (4.9) 7*(1.6) 1*(0.5) 25*(4.7) 8*(1.8)
Montana 201 (2.0) 55 (3.2) 32 (3.6) 12 (2.6) 1*(0.5) 45 (3.2) 13 (2.5)
New Mexico 186*(2.4) 72*(3.4) 22 (3.3) 6*(1.3) # (†) 28*(3.4) 7*(1.5)
North Dakota 198 (2.7) 61*(3.8) 31 (4.7) 8 (3.6) 1 (†) 39*(3.8) 9*(3.8)
Oklahoma 211*(1.8) 43*(2.5) 35 (3.5) 18 (2.7) 3 (1.4) 57*(2.5) 22 (2.8)
South Dakota 194*(2.6) 63*(3.7) 26 (3.1) 10*(1.7) 1*(0.5) 37*(3.7) 11*(1.8)
Grade 8
Nation 249 (1.4) 41 (2.1) 41 (1.4) 16 (1.5) 1 (0.3) 59 (2.1) 17 (1.7)
Alaska 240*(2.1) 51*(3.3) 39 (3.3) 10*(1.8) # (0.2) 49*(3.3) 10*(1.8)
Arizona 238*(4.5) 57 (5.9) 32 (5.5) 10 (3.7) # (†) 43 (5.9) 11 (3.7)
Montana 247 (2.6) 44 (4.3) 41 (4.2) 15 (2.7) 1 (†) 56 (4.3) 16 (2.6)
New Mexico 236*(2.8) 56*(4.2) 39 (4.1) 5*(1.7) # (†) 44*(4.2) 6*(1.7)
North Dakota 248 (2.6) 41 (4.8) 45 (4.8) 13 (2.7) # (†) 59 (4.8) 14 (2.7)
Oklahoma 254*(1.6) 34*(2.7) 47 (3.2) 19 (2.1) # (†) 66*(2.7) 19 (2.1)
South Dakota 238*(2.2) 54*(2.7) 36 (3.2) 10 (2.2) # (†) 46*(2.7) 10*(2.2)
(†) Not applicable. Standard error estimate cannot be accurately determined.# The estimate rounds to zero.* Signifi cantly different from American Indian/Alaska Native students in the nation.NOTE: National and state data presented in this table represent American Indian and Alaska Native students only. Standard errors of the estimates appear in parentheses. Detail may not sum to totals because of rounding.SOURCE: U.S. Department of Education, Institute of Education Sciences, National Center for Education Statistics, National Assessment of Educational Progress (NAEP), 2005 National Indian Education Study.

N A T I O N A L I N D I A N E D U C A T I O N S T U D Y : 2 0 0 589
Table A-13. Average scale scores and achievement-level results in reading, by race/ethnicity, grades 4 and 8: 2005
Percent
Race/ethnicityPercentage of students
Average scale score
Below Basic
At Basic
At Profi cient
At Advanced
At or above Basic
At or above
Profi cient
Grade 4
American Indian/Alaska Native 1 (0.1) 204 (1.3) 52 (1.5) 30 (1.2) 15 (1.0) 3 (0.5) 48 (1.5) 18 (1.0)
White 59*(0.3) 229*(0.2) 24*(0.3) 35*(0.3) 31*(0.2) 10*(0.2) 76*(0.3) 41*(0.3)
Black 16*(0.3) 200*(0.3) 58*(0.5) 29 (0.5) 11*(0.3) 2*(0.2) 42*(0.5) 13*(0.3)
Hispanic 18*(0.2) 203 (0.5) 54 (0.7) 30 (0.4) 13 (0.4) 3 (0.2) 46 (0.7) 16 (0.5)
Asian/Pacifi c Islander 5*(0.1) 229*(0.7) 27*(0.9) 32 (1.1) 29*(0.9) 13*(0.8) 73*(0.9) 42*(0.9)
Unclassifi ed 1 (0.0) 223*(1.3) 32*(1.9) 34 (2.3) 25*(2.5) 9*(1.2) 68*(1.9) 34*(2.2)
Grade 8
American Indian/Alaska Native 1 (0.1) 249 (1.4) 41 (2.1) 41 (1.4) 16 (1.5) 1 (0.3) 59 (2.1) 17 (1.7)
White 61*(0.3) 271*(0.2) 18*(0.2) 43 (0.3) 35*(0.3) 4*(0.1) 82*(0.2) 39*(0.3)
Black 16*(0.3) 243*(0.4) 48*(0.6) 40 (0.5) 12*(0.4) # (0.1) 52*(0.6) 12*(0.4)
Hispanic 16*(0.2) 246 (0.4) 44 (0.6) 41 (0.6) 14 (0.4) 1 (0.1) 56 (0.6) 15 (0.4)
Asian/Pacifi c Islander 4*(0.1) 271*(0.8) 20*(0.8) 40 (1.1) 35*(1.1) 6*(0.5) 80*(0.8) 40*(1.2)
Unclassifi ed 1*(0.1) 266*(1.9) 24*(2.0) 40 (2.2) 32*(2.3) 4*(1.0) 76*(2.0) 36*(2.7)
# The estimate rounds to zero.* Signifi cantly different from American Indian/Alaska Native students.NOTE: Results are based on the national NAEP sample. Black includes African American, Hispanic includes Latino, and Pacifi c Islander includes Native Hawaiian. Race categories exclude Hispanic origin. Unclassifi ed students are those whose school-reported race/ethnicity was other or unavailable, or was missing, and whose race/ethnicity category could not be determined from self-reported information. Standard errors of the estimates appear in parentheses. Detail may not sum to totals because of rounding.SOURCE: U.S. Department of Education, Institute of Education Sciences, National Center for Education Statistics, National Assessment of Educational Progress (NAEP), 2005 National Indian Education Study.
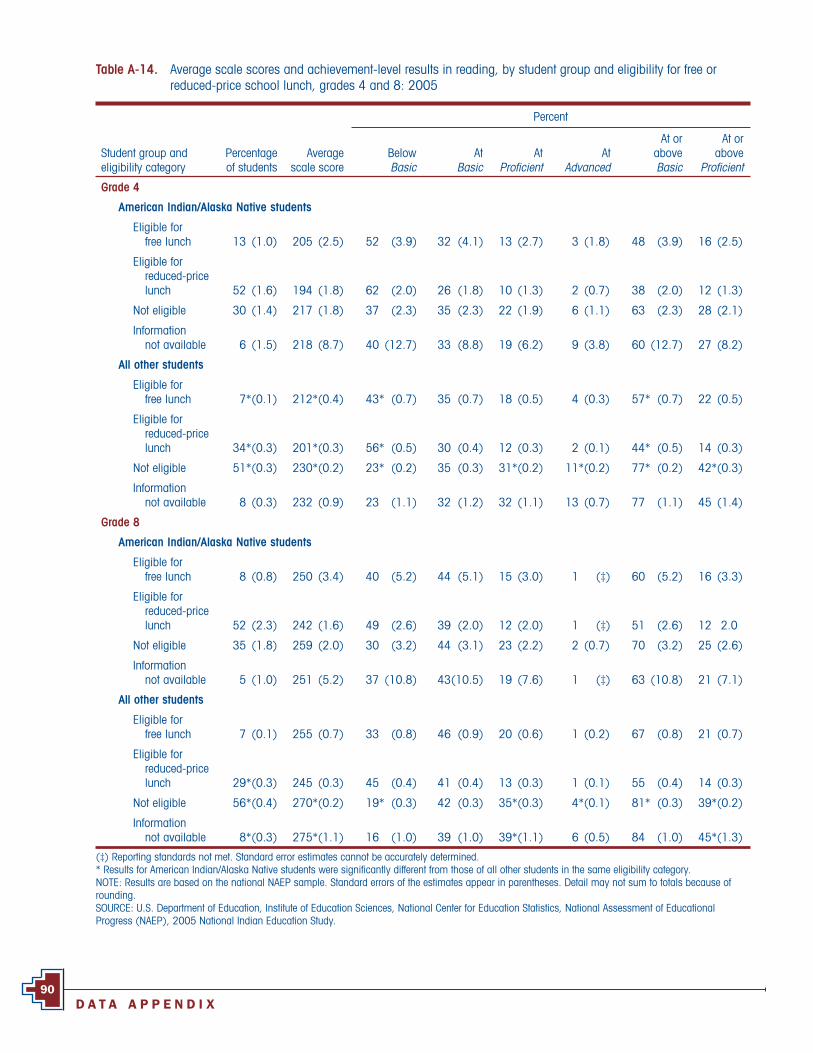
D A T A A P P E N D I X90
Percent
Student group and eligibility category
Percentage of students
Average scale score
Below Basic
At Basic
At Profi cient
At Advanced
At orabove Basic
At or above
Profi cient
Grade 4
American Indian/Alaska Native students
Eligible for free lunch 13 (1.0) 205 (2.5) 52 (3.9) 32 (4.1) 13 (2.7) 3 (1.8) 48 (3.9) 16 (2.5)
Eligible for reduced-price lunch 52 (1.6) 194 (1.8) 62 (2.0) 26 (1.8) 10 (1.3) 2 (0.7) 38 (2.0) 12 (1.3)
Not eligible 30 (1.4) 217 (1.8) 37 (2.3) 35 (2.3) 22 (1.9) 6 (1.1) 63 (2.3) 28 (2.1)
Information not available 6 (1.5) 218 (8.7) 40 (12.7) 33 (8.8) 19 (6.2) 9 (3.8) 60 (12.7) 27 (8.2)
All other students
Eligible for free lunch 7*(0.1) 212*(0.4) 43* (0.7) 35 (0.7) 18 (0.5) 4 (0.3) 57* (0.7) 22 (0.5)
Eligible for reduced-price lunch 34*(0.3) 201*(0.3) 56* (0.5) 30 (0.4) 12 (0.3) 2 (0.1) 44* (0.5) 14 (0.3)
Not eligible 51*(0.3) 230*(0.2) 23* (0.2) 35 (0.3) 31*(0.2) 11*(0.2) 77* (0.2) 42*(0.3)
Information not available 8 (0.3) 232 (0.9) 23 (1.1) 32 (1.2) 32 (1.1) 13 (0.7) 77 (1.1) 45 (1.4)
Grade 8
American Indian/Alaska Native students
Eligible for free lunch 8 (0.8) 250 (3.4) 40 (5.2) 44 (5.1) 15 (3.0) 1 (‡) 60 (5.2) 16 (3.3)
Eligible for reduced-price lunch 52 (2.3) 242 (1.6) 49 (2.6) 39 (2.0) 12 (2.0) 1 (‡) 51 (2.6) 12 2.0
Not eligible 35 (1.8) 259 (2.0) 30 (3.2) 44 (3.1) 23 (2.2) 2 (0.7) 70 (3.2) 25 (2.6)
Information not available 5 (1.0) 251 (5.2) 37 (10.8) 43(10.5) 19 (7.6) 1 (‡) 63 (10.8) 21 (7.1)
All other students
Eligible for free lunch 7 (0.1) 255 (0.7) 33 (0.8) 46 (0.9) 20 (0.6) 1 (0.2) 67 (0.8) 21 (0.7)
Eligible for reduced-price lunch 29*(0.3) 245 (0.3) 45 (0.4) 41 (0.4) 13 (0.3) 1 (0.1) 55 (0.4) 14 (0.3)
Not eligible 56*(0.4) 270*(0.2) 19* (0.3) 42 (0.3) 35*(0.3) 4*(0.1) 81* (0.3) 39*(0.2)
Information not available 8*(0.3) 275*(1.1) 16 (1.0) 39 (1.0) 39*(1.1) 6 (0.5) 84 (1.0) 45*(1.3)
Table A-14. Average scale scores and achievement-level results in reading, by student group and eligibility for free or reduced-price school lunch, grades 4 and 8: 2005
(‡) Reporting standards not met. Standard error estimates cannot be accurately determined.* Results for American Indian/Alaska Native students were signifi cantly different from those of all other students in the same eligibility category.NOTE: Results are based on the national NAEP sample. Standard errors of the estimates appear in parentheses. Detail may not sum to totals because of rounding. SOURCE: U.S. Department of Education, Institute of Education Sciences, National Center for Education Statistics, National Assessment of Educational Progress (NAEP), 2005 National Indian Education Study.

N A T I O N A L I N D I A N E D U C A T I O N S T U D Y : 2 0 0 591
Table A-15. Average scale scores and achievement-level results in reading, by student group and gender, grades 4 and 8: 2005
Percent
Student group and gender
Percentage of students
Average scale score
Below Basic
At Basic
At Profi cient
At Advanced
At or above Basic
At or above
Profi cient
Grade 4
American Indian/Alaska Native students
Male 51(1.0) 199 (1.4) 57 (2.0) 29(1.9) 12 (1.2) 2 (0.6) 43 (2.0) 15 (1.3)
Female 49(1.0) 209 (1.6) 47 (1.9) 31(1.8) 17 (1.6) 4 (1.0) 53 (1.9) 22 (1.6)
All other students
Male 50(0.2) 216*(0.2) 39*(0.4) 33(0.3) 22*(0.3) 6*(0.1) 61*(0.4) 29*(0.3)
Female 50(0.2) 222*(0.3) 33*(0.3) 33(0.3) 26*(0.3) 9*(0.2) 67*(0.3) 35*(0.3)
Grade 8
American Indian/Alaska Native students
Male 51(1.1) 244 (1.9) 46 (2.7) 40(1.9) 13 (1.7) 1 (0.5) 54 (2.7) 15 (1.8)
Female 49(1.1) 254 (1.7) 36 (2.7) 43(2.4) 19 (2.2) 1 (0.4) 64 (2.7) 20 (2.4)
All other students
Male 50(0.2) 257*(0.2) 32*(0.3) 42(0.3) 24*(0.2) 2 (0.1) 68*(0.3) 26*(0.3)
Female 50(0.2) 268*(0.2) 22*(0.3) 42(0.3) 32*(0.3) 4*(0.2) 78*(0.3) 36*(0.3)
* Results for American Indian/Alaska Native students were signifi cantly different from those of all other students of the same gender. NOTE: Results are based on the national NAEP sample. Standard errors of the estimates appear in parentheses. Detail may not sum to totals because of rounding. SOURCE: U.S. Department of Education, Institute of Education Sciences, National Center for Education Statistics, National Assessment of Educational Progress (NAEP), 2005 National Indian Education Study.
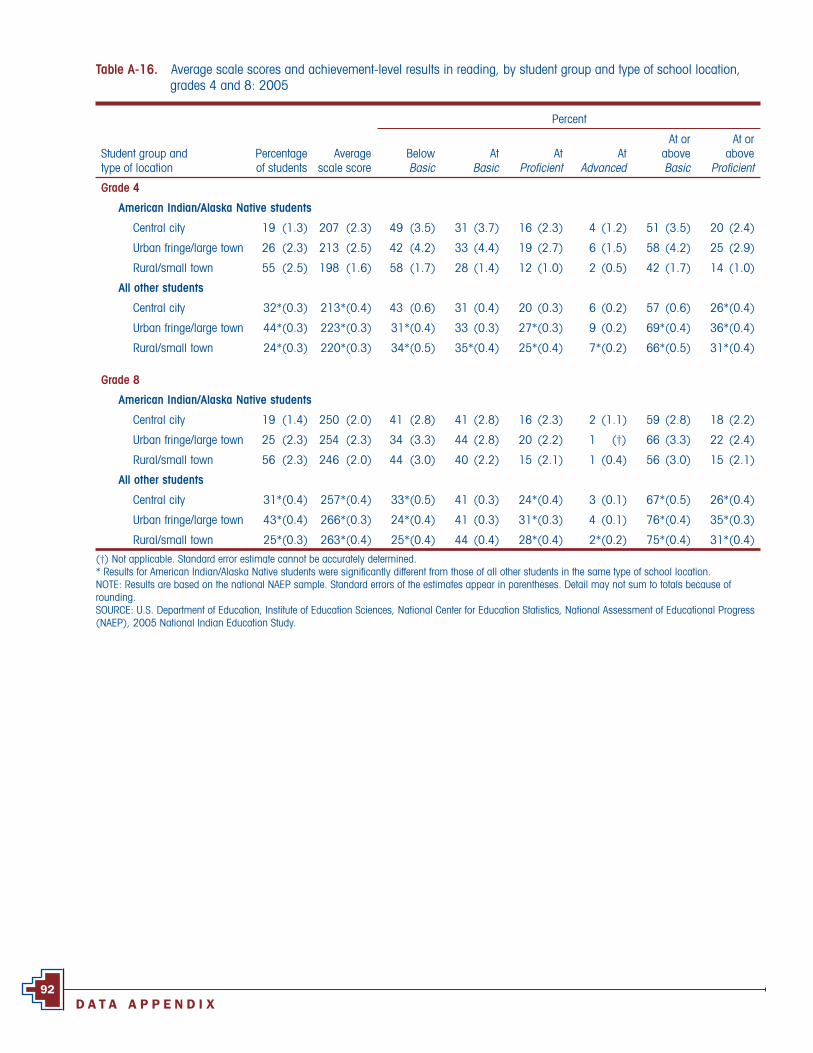
D A T A A P P E N D I X92
Table A-16. Average scale scores and achievement-level results in reading, by student group and type of school location, grades 4 and 8: 2005
Percent
Student group and type of location
Percentage of students
Averagescale score
Below Basic
At Basic
At Profi cient
At Advanced
At or above Basic
At or above
Profi cient
Grade 4
American Indian/Alaska Native students
Central city 19 (1.3) 207 (2.3) 49 (3.5) 31 (3.7) 16 (2.3) 4 (1.2) 51 (3.5) 20 (2.4)
Urban fringe/large town 26 (2.3) 213 (2.5) 42 (4.2) 33 (4.4) 19 (2.7) 6 (1.5) 58 (4.2) 25 (2.9)
Rural/small town 55 (2.5) 198 (1.6) 58 (1.7) 28 (1.4) 12 (1.0) 2 (0.5) 42 (1.7) 14 (1.0)
All other students
Central city 32*(0.3) 213*(0.4) 43 (0.6) 31 (0.4) 20 (0.3) 6 (0.2) 57 (0.6) 26*(0.4)
Urban fringe/large town 44*(0.3) 223*(0.3) 31*(0.4) 33 (0.3) 27*(0.3) 9 (0.2) 69*(0.4) 36*(0.4)
Rural/small town 24*(0.3) 220*(0.3) 34*(0.5) 35*(0.4) 25*(0.4) 7*(0.2) 66*(0.5) 31*(0.4)
Grade 8
American Indian/Alaska Native students
Central city 19 (1.4) 250 (2.0) 41 (2.8) 41 (2.8) 16 (2.3) 2 (1.1) 59 (2.8) 18 (2.2)
Urban fringe/large town 25 (2.3) 254 (2.3) 34 (3.3) 44 (2.8) 20 (2.2) 1 (†) 66 (3.3) 22 (2.4)
Rural/small town 56 (2.3) 246 (2.0) 44 (3.0) 40 (2.2) 15 (2.1) 1 (0.4) 56 (3.0) 15 (2.1)
All other students
Central city 31*(0.4) 257*(0.4) 33*(0.5) 41 (0.3) 24*(0.4) 3 (0.1) 67*(0.5) 26*(0.4)
Urban fringe/large town 43*(0.4) 266*(0.3) 24*(0.4) 41 (0.3) 31*(0.3) 4 (0.1) 76*(0.4) 35*(0.3)
Rural/small town 25*(0.3) 263*(0.4) 25*(0.4) 44 (0.4) 28*(0.4) 2*(0.2) 75*(0.4) 31*(0.4)
(†) Not applicable. Standard error estimate cannot be accurately determined.* Results for American Indian/Alaska Native students were signifi cantly different from those of all other students in the same type of school location. NOTE: Results are based on the national NAEP sample. Standard errors of the estimates appear in parentheses. Detail may not sum to totals because of rounding. SOURCE: U.S. Department of Education, Institute of Education Sciences, National Center for Education Statistics, National Assessment of Educational Progress (NAEP), 2005 National Indian Education Study.

N A T I O N A L I N D I A N E D U C A T I O N S T U D Y : 2 0 0 593
Table A-17. Average scale scores and achievement-level results in reading, by student group and student-reported highest level of education of either parent, grade 8: 2005
Percent
Student group and highest level of parental education
Percentage of students
Average scale score
Below Basic
At Basic
At Profi cient
At Advanced
At or above Basic
At or above
Profi cient
American Indian/Alaska Native students
Less than high school 10 (0.9) 240 (2.9) 51 (7.0) 41(6.8) 8 (3.0) # (†) 49 (7.0) 8 (3.0)
Graduated from high school 22 (1.0) 245 (1.9) 47 (3.5) 39(3.5) 13 (2.1) 1 (†) 53 (3.5) 14 (2.2)
Some education after high school 24 (2.0) 257 (4.7) 32 (5.4) 45(4.3) 22 (5.5) 2 (†) 68 (5.4) 24 (5.6)
Graduated from college 31 (1.8) 257 (1.8) 32 (2.6) 44(2.3) 22 (2.3) 2 (1.2) 68 (2.6) 24 (2.3)
Unknown 13 (0.9) 236 (2.7) 55 (3.8) 38(4.3) 8 (1.9) # (†) 45 (3.8) 8 (2.0)
All other students
Less than high school 7*(0.1) 244 (0.5) 46 (0.7) 42(0.7) 12 (0.5) # (0.1) 54 (0.7) 12 (0.5)
Graduated from high school 17*(0.2) 253*(0.4) 36*(0.6) 45(0.6) 18 (0.4) 1 (0.1) 64*(0.6) 19*(0.4)
Some education after high school 17*(0.1) 266 (0.2) 22 (0.4) 46(0.5) 30 (0.4) 2 (0.2) 78 (0.4) 32 (0.4)
Graduated from college 48*(0.2) 272*(0.2) 18*(0.3) 40(0.4) 37*(0.3) 5*(0.2) 82*(0.3) 42*(0.3)
Unknown 10*(0.1) 243*(0.4) 48 (0.5) 40(0.6) 12 (0.5) # (0.1) 52 (0.5) 12*(0.5)
(†) Not applicable. Standard error estimate cannot be accurately determined.# The estimate rounds to zero. * Results for American Indian/Alaska Native students were signifi cantly different from those of all other students in the same parental education category. NOTE: Results are based on the national NAEP sample. Standard errors of the estimates appear in parentheses. Detail may not sum to totals because of rounding. SOURCE: U.S. Department of Education, Institute of Education Sciences, National Center for Education Statistics, National Assessment of Educational Progress (NAEP), 2005 National Indian Education Study.
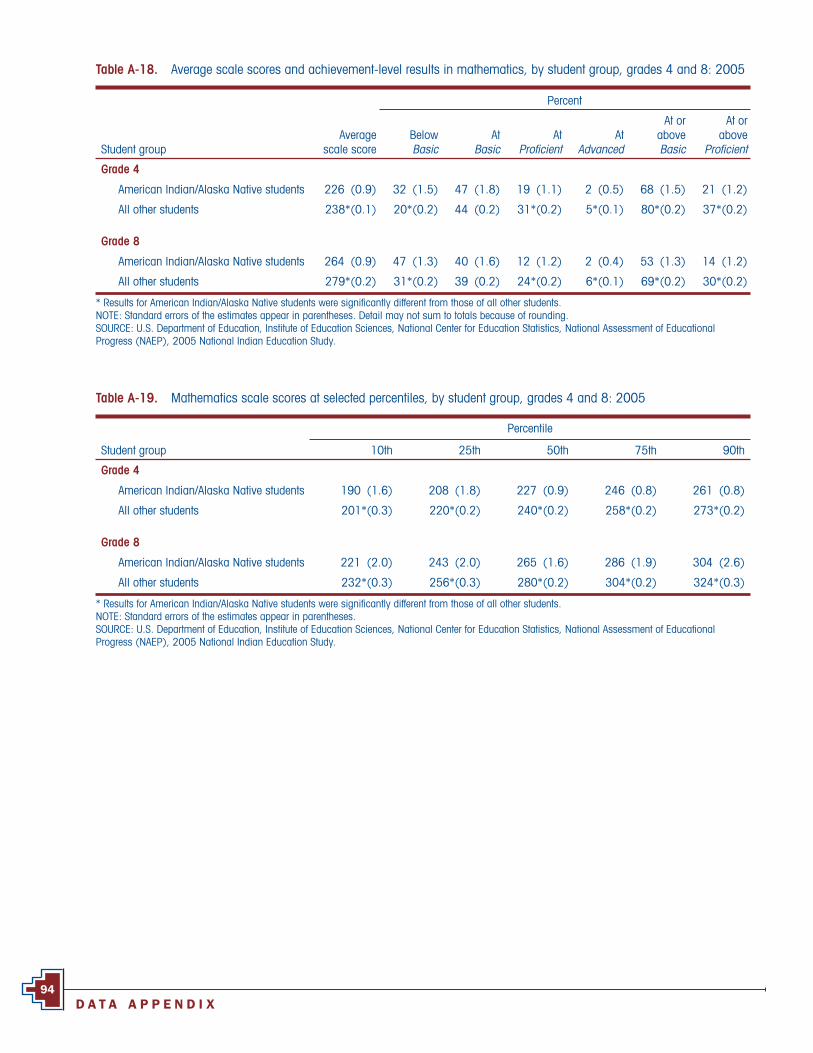
D A T A A P P E N D I X94
Table A-18. Average scale scores and achievement-level results in mathematics, by student group, grades 4 and 8: 2005
Percent
Student groupAverage
scale scoreBelow Basic
At Basic
At Profi cient
At Advanced
At or above Basic
At or above
Profi cient
Grade 4
American Indian/Alaska Native students 226 (0.9) 32 (1.5) 47 (1.8) 19 (1.1) 2 (0.5) 68 (1.5) 21 (1.2)
All other students 238*(0.1) 20*(0.2) 44 (0.2) 31*(0.2) 5*(0.1) 80*(0.2) 37*(0.2)
Grade 8
American Indian/Alaska Native students 264 (0.9) 47 (1.3) 40 (1.6) 12 (1.2) 2 (0.4) 53 (1.3) 14 (1.2)
All other students 279*(0.2) 31*(0.2) 39 (0.2) 24*(0.2) 6*(0.1) 69*(0.2) 30*(0.2)
* Results for American Indian/Alaska Native students were signifi cantly different from those of all other students.NOTE: Standard errors of the estimates appear in parentheses. Detail may not sum to totals because of rounding.SOURCE: U.S. Department of Education, Institute of Education Sciences, National Center for Education Statistics, National Assessment of Educational Progress (NAEP), 2005 National Indian Education Study.
Table A-19. Mathematics scale scores at selected percentiles, by student group, grades 4 and 8: 2005
Percentile
Student group 10th 25th 50th 75th 90th
Grade 4
American Indian/Alaska Native students 190 (1.6) 208 (1.8) 227 (0.9) 246 (0.8) 261 (0.8)
All other students 201*(0.3) 220*(0.2) 240*(0.2) 258*(0.2) 273*(0.2)
Grade 8
American Indian/Alaska Native students 221 (2.0) 243 (2.0) 265 (1.6) 286 (1.9) 304 (2.6)
All other students 232*(0.3) 256*(0.3) 280*(0.2) 304*(0.2) 324*(0.3)
* Results for American Indian/Alaska Native students were signifi cantly different from those of all other students.NOTE: Standard errors of the estimates appear in parentheses.SOURCE: U.S. Department of Education, Institute of Education Sciences, National Center for Education Statistics, National Assessment of Educational Progress (NAEP), 2005 National Indian Education Study.
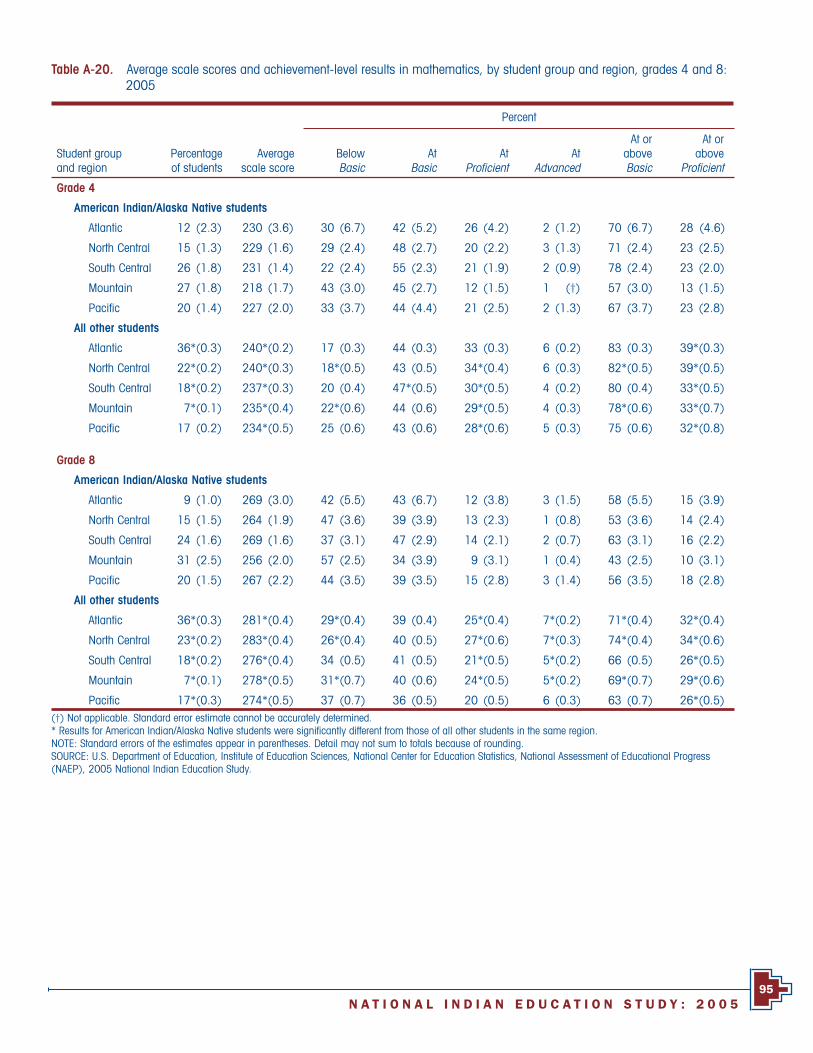
N A T I O N A L I N D I A N E D U C A T I O N S T U D Y : 2 0 0 595
Table A-20. Average scale scores and achievement-level results in mathematics, by student group and region, grades 4 and 8: 2005
Percent
Student group and region
Percentage of students
Average scale score
Below Basic
At Basic
At Profi cient
At Advanced
At or above Basic
At or above
Profi cient
Grade 4
American Indian/Alaska Native students
Atlantic 12 (2.3) 230 (3.6) 30 (6.7) 42 (5.2) 26 (4.2) 2 (1.2) 70 (6.7) 28 (4.6)
North Central 15 (1.3) 229 (1.6) 29 (2.4) 48 (2.7) 20 (2.2) 3 (1.3) 71 (2.4) 23 (2.5)
South Central 26 (1.8) 231 (1.4) 22 (2.4) 55 (2.3) 21 (1.9) 2 (0.9) 78 (2.4) 23 (2.0)
Mountain 27 (1.8) 218 (1.7) 43 (3.0) 45 (2.7) 12 (1.5) 1 (†) 57 (3.0) 13 (1.5)
Pacific 20 (1.4) 227 (2.0) 33 (3.7) 44 (4.4) 21 (2.5) 2 (1.3) 67 (3.7) 23 (2.8)
All other students
Atlantic 36*(0.3) 240*(0.2) 17 (0.3) 44 (0.3) 33 (0.3) 6 (0.2) 83 (0.3) 39*(0.3)
North Central 22*(0.2) 240*(0.3) 18*(0.5) 43 (0.5) 34*(0.4) 6 (0.3) 82*(0.5) 39*(0.5)
South Central 18*(0.2) 237*(0.3) 20 (0.4) 47*(0.5) 30*(0.5) 4 (0.2) 80 (0.4) 33*(0.5)
Mountain 7*(0.1) 235*(0.4) 22*(0.6) 44 (0.6) 29*(0.5) 4 (0.3) 78*(0.6) 33*(0.7)
Pacific 17 (0.2) 234*(0.5) 25 (0.6) 43 (0.6) 28*(0.6) 5 (0.3) 75 (0.6) 32*(0.8)
Grade 8
American Indian/Alaska Native students
Atlantic 9 (1.0) 269 (3.0) 42 (5.5) 43 (6.7) 12 (3.8) 3 (1.5) 58 (5.5) 15 (3.9)
North Central 15 (1.5) 264 (1.9) 47 (3.6) 39 (3.9) 13 (2.3) 1 (0.8) 53 (3.6) 14 (2.4)
South Central 24 (1.6) 269 (1.6) 37 (3.1) 47 (2.9) 14 (2.1) 2 (0.7) 63 (3.1) 16 (2.2)
Mountain 31 (2.5) 256 (2.0) 57 (2.5) 34 (3.9) 9 (3.1) 1 (0.4) 43 (2.5) 10 (3.1)
Pacific 20 (1.5) 267 (2.2) 44 (3.5) 39 (3.5) 15 (2.8) 3 (1.4) 56 (3.5) 18 (2.8)
All other students
Atlantic 36*(0.3) 281*(0.4) 29*(0.4) 39 (0.4) 25*(0.4) 7*(0.2) 71*(0.4) 32*(0.4)
North Central 23*(0.2) 283*(0.4) 26*(0.4) 40 (0.5) 27*(0.6) 7*(0.3) 74*(0.4) 34*(0.6)
South Central 18*(0.2) 276*(0.4) 34 (0.5) 41 (0.5) 21*(0.5) 5*(0.2) 66 (0.5) 26*(0.5)
Mountain 7*(0.1) 278*(0.5) 31*(0.7) 40 (0.6) 24*(0.5) 5*(0.2) 69*(0.7) 29*(0.6)
Pacific 17*(0.3) 274*(0.5) 37 (0.7) 36 (0.5) 20 (0.5) 6 (0.3) 63 (0.7) 26*(0.5)(†) Not applicable. Standard error estimate cannot be accurately determined.* Results for American Indian/Alaska Native students were signifi cantly different from those of all other students in the same region. NOTE: Standard errors of the estimates appear in parentheses. Detail may not sum to totals because of rounding.SOURCE: U.S. Department of Education, Institute of Education Sciences, National Center for Education Statistics, National Assessment of Educational Progress (NAEP), 2005 National Indian Education Study.

D A T A A P P E N D I X96
Table A-21. Average scale scores and achievement-level results in mathematics for American Indian/Alaska Native students only, by nation and selected states, grades 4 and 8: 2005
Percent
StateAverage
scale scoreBelow Basic
At Basic
At Profi cient
At Advanced
At or above Basic
At or above
Profi cient
Grade 4
Nation 226 (0.9) 32 (1.5) 47 (1.8) 19 (1.1) 2 (0.5) 68 (1.5) 21 (1.2)
Alaska 220*(1.3) 43*(2.4) 42 (2.3) 14*(1.7) 2 (0.5) 57*(2.4) 15*(1.6)
Arizona 215*(3.2) 49*(4.9) 39 (4.7) 12*(2.4) # (†) 51*(4.9) 12*(2.3)
Montana 223 (2.3) 38 (4.1) 45 (3.4) 16 (2.8) 1 (†) 62 (4.1) 17 (2.7)
New Mexico 215*(1.4) 46*(3.2) 46 (2.9) 7*(1.6) # (†) 54*(3.2) 7*(1.6)
North Dakota 221*(1.8) 37 (4.1) 51 (4.1) 11 (3.5) # (†) 63 (4.1) 12*(3.5)
Oklahoma 229 (1.4) 24*(2.3) 55*(2.1) 20 (2.0) 1 (0.6) 76*(2.3) 21 (2.1)
South Dakota 217*(1.8) 44*(3.1) 46 (3.1) 10*(1.9) 1 (0.4) 56*(3.1) 11*(1.9)
Grade 8
Nation 264 (0.9) 47 (1.3) 40 (1.6) 12 (1.2) 2 (0.4) 53 (1.3) 14 (1.2)
Alaska 264 (1.8) 47 (3.5) 38 (3.3) 13 (1.6) 2 (0.5) 53 (3.5) 15 (1.5)
Arizona 256 (4.3) 58 (6.5) 33 (6.3) 8 (2.2) 1 (†) 42 (6.5) 9 (2.2)
Montana 259 (2.1) 52 (3.7) 37 (4.1) 10 (1.8) # (†) 48 (3.7) 11 (2.0)
New Mexico 251*(1.9) 64*(3.5) 32 (3.8) 4*(1.2) # (†) 36*(3.5) 4*(1.2)
North Dakota 260 (2.3) 53 (3.6) 39 (3.6) 8 (2.2) # (†) 47 (3.6) 9 (2.2)
Oklahoma 267 (1.9) 40 (3.1) 45 (3.0) 14 (2.2) 1 (0.5) 60 (3.1) 15 (2.2)
South Dakota 250*(2.8) 63*(3.1) 29*(2.8) 8 (1.3) 1 (†) 37*(3.1) 8*(1.4)
(†) Not applicable. Standard error estimate cannot be accurately determined.# The estimate rounds to zero.* Signifi cantly different from American Indian/Alaska Native students in the nation.NOTE: National and state data presented in this table represent American Indian and Alaska Native students only. Standard errors of the estimates appear in parentheses. Detail may not sum to totals because of rounding.SOURCE: U.S. Department of Education, Institute of Education Sciences, National Center for Education Statistics, National Assessment of Educational Progress (NAEP), 2005 National Indian Education Study.

N A T I O N A L I N D I A N E D U C A T I O N S T U D Y : 2 0 0 597
Table A-22. Average scale scores and achievement-level results in mathematics, by race/ethnicity, grades 4 and 8: 2005
Percent
Race/ethnicityPercentage of students
Average scale score
Below Basic
At Basic
At Profi cient
At Advanced
At or above Basic
At or above
Profi cient
Grade 4
American Indian/Alaska Native 1 (0.1) 226 (0.9) 32 (1.5) 47 (1.8) 19 (1.1) 2 (0.5) 68 (1.5) 21 (1.2)
White 58*(0.3) 246*(0.1) 10*(0.2) 42*(0.2) 40*(0.3) 7*(0.2) 90*(0.2) 47*(0.2)
Black 16*(0.2) 220*(0.3) 40*(0.5) 47 (0.6) 12*(0.3) 1*(0.1) 60*(0.5) 13*(0.3)
Hispanic 19*(0.2) 226 (0.3) 32 (0.5) 49 (0.5) 18 (0.3) 1 (0.1) 68 (0.5) 19 (0.3)
Asian/Pacifi c Islander 4*(0.1) 251*(0.7) 10*(0.5) 35*(0.9) 41*(1.1) 14*(0.8) 90*(0.5) 55*(1.1)
Unclassifi ed 1 (0.0) 241*(0.9) 16*(1.2) 44 (2.0) 34*(2.1) 6*(1.0) 84*(1.2) 40*(2.1)
Grade 8
American Indian/Alaska Native 1 (0.0) 264 (0.9) 47 (1.3) 40 (1.6) 12 (1.2) 2 (0.4) 53 (1.3) 14 (1.2)
White 61*(0.3) 289*(0.2) 20*(0.2) 42 (0.3) 31*(0.2) 8*(0.2) 80*(0.2) 39*(0.3)
Black 16*(0.2) 255*(0.4) 58*(0.5) 33*(0.4) 8*(0.2) 1*(0.1) 42*(0.5) 9*(0.3)
Hispanic 16*(0.2) 262*(0.4) 48 (0.6) 38 (0.6) 12 (0.4) 1 (0.1) 52 (0.6) 13 (0.4)
Asian/Pacifi c Islander 5*(0.1) 295*(0.9) 19*(0.8) 34*(1.0) 31*(1.1) 16*(0.9) 81*(0.8) 47*(1.2)
Unclassifi ed 1*(0.1) 280*(1.9) 30*(2.7) 40 (2.3) 24*(1.6) 6*(1.0) 70*(2.7) 30*(2.1)
* Signifi cantly different from American Indian/Alaska Native students.NOTE: Results are based on the national NAEP sample. Black includes African American, Hispanic includes Latino, and Pacifi c Islander includes Native Hawaiian. Race categories exclude Hispanic origin. Unclassifi ed students are those whose school-reported race/ethnicity was other or unavailable, or was missing, and whose race/ethnicity category could not be determined from self-reported information. Standard errors of the estimates appear in parentheses. Detail may not sum to totals because of rounding.SOURCE: U.S. Department of Education, Institute of Education Sciences, National Center for Education Statistics, National Assessment of Educational Progress (NAEP), 2005 National Indian Education Study.

D A T A A P P E N D I X98
Percent
Student group and eligibility category
Percentage of students
Average scale score
Below Basic
At Basic
At Profi cient
At Advanced
At orabove Basic
At or above
Profi cient
Grade 4
American Indian/Alaska Native students
Eligible for free lunch 11 (0.8) 229 (2.4) 29 (3.9) 47 (4.4) 21 (3.6) 2 (‡) 71 (3.9) 23 (3.6)
Eligible for reduced-price lunch 53 (1.7) 219 (1.1) 40 (2.9) 47 (3.0) 12 (1.2) 1 (0.2) 60 (2.9) 12 (1.2)
Not eligible 30 (1.2) 238 (1.2) 18 (1.7) 47 (2.2) 31 (2.1) 4 (1.3) 82 (1.7) 35 (2.1)
Information not available 5 (1.3) 225 (7.5) 32 (11.0) 51 (9.1) 16 (5.9) 1 (‡) 68 (11.0) 17 (5.4)
All other students
Eligible for free lunch 7*(0.1) 234 (0.4) 21 (0.6) 50 (0.6) 26 (0.7) 2 (0.2) 79 (0.6) 29 (0.7)
Eligible for reduced-price lunch 35*(0.3) 224*(0.2) 35 (0.3) 48 (0.3) 16*(0.2) 1*(0.1) 65* (0.3) 17*(0.2)
Not eligible 50*(0.3) 248*(0.2) 10* (0.2) 41* (0.3) 42*(0.3) 8*(0.2) 90* (0.2) 50*(0.3)
Information not available 8 (0.3) 244 (0.7) 13 (0.7) 42 (1.0) 38*(1.2) 7 (0.6) 87 (0.7) 45*(1.2)
Grade 8
American Indian/Alaska Native students
Eligible for free lunch 10 (1.0) 265 (3.1) 48 (5.2) 37 (5.9) 13 (4.6) 2 (1.5) 52 (5.2) 15 (4.3)
Eligible for reduced-price lunch 53 (1.9) 257 (1.2) 56 (1.8) 35 (2.7) 8 (2.1) 1 (0.3) 44 (1.8) 9 (2.2)
Not eligible 33 (1.7) 276 (1.3) 31 (2.5) 47 (2.8) 19 (2.0) 3 (1.1) 69 (2.5) 22 (2.1)
Information not available 3 (0.7) 264 (3.2) 43 (10.1) 45 (11.6) 11 (5.7) 1 (0.4) 57 (10.1) 11 (5.8)
All other students
Eligible for free lunch 7*(0.1) 270 (0.6) 39 (0.9) 42 (0.9) 17 (0.6) 2 (0.2) 61 (0.9) 19 (0.6)
Eligible for reduced-price lunch 29*(0.3) 260*(0.3) 51* (0.5) 36 (0.4) 11 (0.2) 1 (0.1) 49* (0.5) 12 (0.3)
Not eligible 56*(0.4) 289*(0.2) 20* (0.2) 41 (0.3) 30*(0.2) 9*(0.2) 80* (0.2) 39*(0.3)
Information not available 8*(0.3) 289*(1.2) 21* (1.1) 39 (0.8) 30*(1.1) 10*(0.6) 79* (1.1) 40*(1.4)
Table A-23. Average scale scores and achievement-level results in mathematics, by student group and eligibility for free or reduced-price school lunch, grades 4 and 8: 2005
(‡) Reporting standards not met. Standard error estimates cannot be accurately determined. * Results for American Indian/Alaska Native students were signifi cantly different from those of all other students in the same eligibility category. NOTE: Results are based on the national NAEP sample. Standard errors of the estimates appear in parentheses. Detail may not sum to totals because of rounding. SOURCE: U.S. Department of Education, Institute of Education Sciences, National Center for Education Statistics, National Assessment of Educational Progress (NAEP), 2005 National Indian Education Study

N A T I O N A L I N D I A N E D U C A T I O N S T U D Y : 2 0 0 599
Table A-24. Average scale scores and achievement-level results in mathematics, by student group and gender, grades 4 and 8: 2005
Percent
Student group and gender
Percentage of students
Average scale score
Below Basic
At Basic
At Profi cient
At Advanced
At or above Basic
At or above
Profi cient
Grade 4
American Indian/Alaska Native students
Male 48 (1.1) 228 (1.2) 29 (1.9) 48 (1.9) 20 (1.6) 3 (0.8) 71 (1.9) 23 (1.7)
Female 52 (1.1) 225 (1.2) 34 (2.4) 46 (2.7) 18 (1.5) 1 (0.6) 66 (2.4) 19 (1.6)
All other students
Male 51*(0.2) 239*(0.2) 19*(0.2) 43*(0.2) 33*(0.2) 6*(0.1) 81*(0.2) 39*(0.2)
Female 49*(0.2) 237*(0.2) 20*(0.2) 45 (0.2) 30*(0.3) 4*(0.1) 80*(0.2) 34*(0.3)
Grade 8
American Indian/Alaska Native students
Male 49 (1.1) 266 (1.5) 45 (2.0) 40 (2.2) 13 (2.3) 2 (0.5) 55 (2.0) 15 (2.4)
Female 51 (1.1) 262 (1.1) 48 (1.8) 39 (2.1) 12 (1.2) 1 (0.6) 52 (1.8) 13 (1.2)
All other students
Male 50 (0.2) 280*(0.2) 30*(0.3) 39 (0.3) 24*(0.3) 7*(0.2) 70*(0.3) 31*(0.3)
Female 50 (0.2) 278*(0.2) 31*(0.3) 40 (0.3) 23*(0.2) 5*(0.1) 69*(0.3) 29*(0.3)
* Results for American Indian/Alaska Native students were signifi cantly different from those of all other students of the same gender. NOTE: Results are based on the national NAEP sample. Standard errors of the estimates appear in parentheses. Detail may not sum to totals because of rounding. SOURCE: U.S. Department of Education, Institute of Education Sciences, National Center for Education Statistics, National Assessment of Educational Progress (NAEP), 2005 National Indian Education Study.

D A T A A P P E N D I X100
Table A-25. Average scale scores and achievement-level results in mathematics, by student group and type of school location, grades 4 and 8: 2005
Percent
Student group and type of location
Percentage of students
Average scale score
Below Basic
At Basic
At Profi cient
At Advanced
At or above Basic
At or above
Profi cient
Grade 4
American Indian/Alaska Native students
Central city 21 (1.4) 231 (1.8) 27 (2.7) 46 (3.6) 24 (2.5) 3 (1.3) 73 (2.7) 27 (2.5)
Urban fringe/large town 26 (2.6) 230 (2.4) 28 (3.9) 45 (3.8) 23 (2.5) 3 (1.2) 72 (3.9) 26 (2.8)
Rural/small town 52 (2.9) 222 (1.0) 35 (2.0) 49 (2.1) 15 (1.5) 1 (0.4) 65 (2.0) 16 (1.5)
All other students
Central city 32*(0.3) 233 (0.3) 26 (0.4) 43 (0.3) 26 (0.3) 5 (0.2) 74 (0.4) 31 (0.4)
Urban fringe/large town 44*(0.3) 241*(0.2) 16*(0.3) 43 (0.3) 35*(0.3) 6*(0.2) 84*(0.3) 41*(0.4)
Rural/small town 24*(0.3) 238*(0.3) 17*(0.3) 47 (0.4) 32*(0.4) 4*(0.2) 83*(0.3) 36*(0.5)
Grade 8
American Indian/Alaska Native students
Central city 19 (1.4) 268 (2.0) 39 (3.7) 44 (4.8) 14 (2.2) 2 (1.0) 61 (3.7) 16 (2.4)
Urban fringe/large town 24 (1.8) 271 (1.9) 39 (2.8) 43 (3.5) 14 (2.4) 3 (1.2) 61 (2.8) 18 (2.6)
Rural/small town 57 (2.0) 260 (1.3) 52 (1.7) 37 (2.2) 11 (2.0) 1 (0.3) 48 (1.7) 11 (2.0)
All other students
Central city 31*(0.3) 273*(0.4) 38 (0.5) 36 (0.3) 20*(0.4) 6*(0.2) 62 (0.5) 25*(0.5)
Urban fringe/large town 43*(0.4) 283*(0.3) 27*(0.3) 39 (0.3) 27*(0.3) 7*(0.2) 73*(0.3) 34*(0.3)
Rural/small town 25*(0.3) 280*(0.4) 28*(0.4) 43*(0.4) 24*(0.4) 5*(0.2) 72*(0.4) 29*(0.5)* Results for American Indian/Alaska Native students were signifi cantly different from those of all other students in the same type of school location. NOTE: Results are based on the national NAEP sample. Standard errors of the estimates appear in parentheses. Detail may not sum to totals because of rounding. SOURCE: U.S. Department of Education, Institute of Education Sciences, National Center for Education Statistics, National Assessment of Educational Progress (NAEP), 2005 National Indian Education Study.
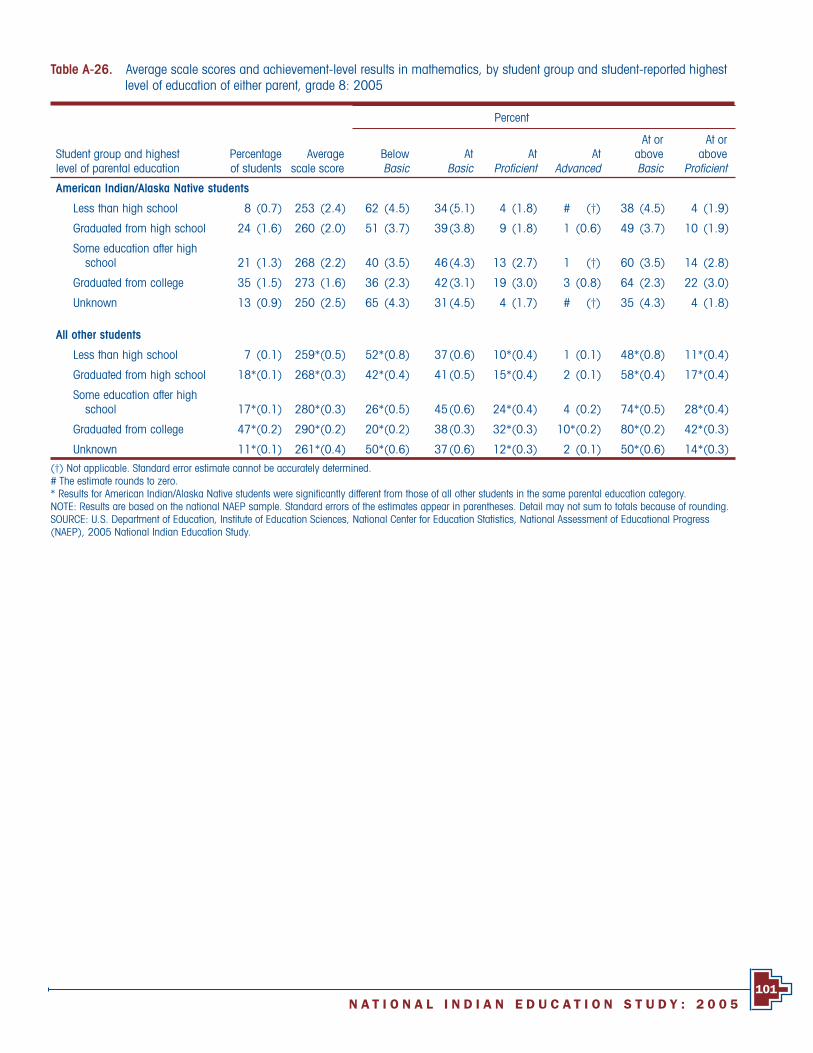
N A T I O N A L I N D I A N E D U C A T I O N S T U D Y : 2 0 0 5101
Table A-26. Average scale scores and achievement-level results in mathematics, by student group and student-reported highest level of education of either parent, grade 8: 2005
Percent
Student group and highest level of parental education
Percentage of students
Average scale score
Below Basic
At Basic
At Profi cient
At Advanced
At or above Basic
At or above
Profi cient
American Indian/Alaska Native students
Less than high school 8 (0.7) 253 (2.4) 62 (4.5) 34(5.1) 4 (1.8) # (†) 38 (4.5) 4 (1.9)
Graduated from high school 24 (1.6) 260 (2.0) 51 (3.7) 39(3.8) 9 (1.8) 1 (0.6) 49 (3.7) 10 (1.9)
Some education after high school 21 (1.3) 268 (2.2) 40 (3.5) 46(4.3) 13 (2.7) 1 (†) 60 (3.5) 14 (2.8)
Graduated from college 35 (1.5) 273 (1.6) 36 (2.3) 42(3.1) 19 (3.0) 3 (0.8) 64 (2.3) 22 (3.0)
Unknown 13 (0.9) 250 (2.5) 65 (4.3) 31(4.5) 4 (1.7) # (†) 35 (4.3) 4 (1.8)
All other students
Less than high school 7 (0.1) 259*(0.5) 52*(0.8) 37(0.6) 10*(0.4) 1 (0.1) 48*(0.8) 11*(0.4)
Graduated from high school 18*(0.1) 268*(0.3) 42*(0.4) 41(0.5) 15*(0.4) 2 (0.1) 58*(0.4) 17*(0.4)
Some education after high school 17*(0.1) 280*(0.3) 26*(0.5) 45(0.6) 24*(0.4) 4 (0.2) 74*(0.5) 28*(0.4)
Graduated from college 47*(0.2) 290*(0.2) 20*(0.2) 38(0.3) 32*(0.3) 10*(0.2) 80*(0.2) 42*(0.3)
Unknown 11*(0.1) 261*(0.4) 50*(0.6) 37(0.6) 12*(0.3) 2 (0.1) 50*(0.6) 14*(0.3)
(†) Not applicable. Standard error estimate cannot be accurately determined.# The estimate rounds to zero. * Results for American Indian/Alaska Native students were signifi cantly different from those of all other students in the same parental education category. NOTE: Results are based on the national NAEP sample. Standard errors of the estimates appear in parentheses. Detail may not sum to totals because of rounding. SOURCE: U.S. Department of Education, Institute of Education Sciences, National Center for Education Statistics, National Assessment of Educational Progress (NAEP), 2005 National Indian Education Study.

THIS PAGE INTENTIONALLY LEFT BLANK.

United StatesDepartment of EducationED Pubs8242-B Sandy CourtJessup, MD 20794-1398
Offi cial BusinessPenalty for Private Use, $300
Postage And Fees PaidU.S. Department of Education
Permit No. G-17