national geochemical survey of australia: implications for ... · geoscience a ustralia patrice de...
TRANSCRIPT

G E O S C I E N C E A U S T R A L I A
Patrice de Caritat, Michelle Cooper, Subhash Jaireth, Evgeniy Bastrakov
APPLYING GEOSCIENCE TO AUSTRALIA’S MOST IMPORTANT CHALLENGES
Record
2011/29
National Geochemical Survey of Australia: Preliminary Implications for Energy and Mineral Exploration
GeoCat # 72581

National Geochemical Survey of Australia: Preliminary Implications for Energy and Mineral Exploration GEOSCIENCE AUSTRALIA RECORD 2011/29 by Patrice de Caritat1, Michelle Cooper1, Subhash Jaireth1, Evgeniy Bastrakov1
1. Geoscience Australia, GPO Box 378 Canberra, ACT 2601

Department of Resources, Energy and Tourism Minister for Resources and Energy: The Hon. Martin Ferguson, AM MP Secretary: Mr Drew Clarke, PSM Geoscience Australia Chief Executive Officer: Dr Chris Pigram
© Commonwealth of Australia (Geoscience Australia) 2011 With the exception of the Commonwealth Coat of Arms and where otherwise noted, all material in this publication is provided under a Creative Commons Attribution 3.0 Australia Licence (http://creativecommons.org/licenses/by/3.0/au/) Geoscience Australia has tried to make the information in this product as accurate as possible. However, it does not guarantee that the information is totally accurate or complete. Therefore, you should not solely rely on this information when making a commercial decision. ISSN 1448-2177 ISBN 978-1-921954-27-6 (Print) ISBN 978-1-921954-26-9 (Web) GeoCat # 72581 Bibliographic reference: Caritat, P. de, Cooper, M., Jaireth, S., Bastrakov, E. 2011. National Geochemical Survey of Australia: Preliminary Implications for Energy and Mineral Exploration. Geoscience Australia, Record 2011/29, 78 pp.
National Geochemical Survey of Australia: Preliminary Implications for Exploration
iii
Contents Executive Summary..................................................................................................... iv Abbreviations Used ...................................................................................................... v Introduction.................................................................................................................. 1 Background to the Project ........................................................................................... 2 Rationale ...............................................................................................................................................2 Objectives .............................................................................................................................................3 Strategy .................................................................................................................................................3
Sampling medium............................................................................................................................4 Sampling sites..................................................................................................................................4 Sample collection ............................................................................................................................6 Sample preparation..........................................................................................................................6 Sample analysis ...............................................................................................................................7 Quality assessment/quality control ..................................................................................................7 Data analysis....................................................................................................................................7 Timeline...........................................................................................................................................7
Preliminary Implications for Energy and Mineral Exploration ..................................... 8 Uranium ................................................................................................................................................8
Calcrete-related U deposits............................................................................................................14 Intrusion-related U deposits...........................................................................................................19 Pine Creek, Northern Territory, case study ...................................................................................24
Thorium ..............................................................................................................................................31 Gold ....................................................................................................................................................37 Copper.................................................................................................................................................47 Lead ....................................................................................................................................................52 Zinc .....................................................................................................................................................57
Mapping continent-scale geochemistry by discrete field model: a pilot study using Zn...............62 Rare Earth Elements ...........................................................................................................................69 Discussion and Conclusion ....................................................................................... 74 Acknowledgments ...................................................................................................... 75 References ................................................................................................................. 76

National Geochemical Survey of Australia: Preliminary Implications for Exploration
Executive Summary The National Geochemical Survey of Australia (NGSA) project has collected catchment outlet sediment samples from 1315 sites located in 1186 catchments (~10% of which were sampled in duplicate) covering over 80% of Australia, in a collaborative venture between Geoscience Australia and the geoscience agencies of all States and the Northern Territory. At each site, composited samples were collected from two depth intervals: (1) the Top Outlet Sediment from 0-10 cm depth, and (2) the Bottom Outlet Sediment from 60-80 cm depth on average. In the laboratory, the samples were dried, homogenised and separated into two grain-size fractions: (1) a ‘coarse’ fraction (0-2 mm), and (2) a ‘fine’ fraction (0-75 µm). All together, thus, 5260 samples were prepared for analysis. Bulk splits were also separated for the determination of bulk properties. Samples were analysed for up to 68 chemical elements after Total, Aqua Regia and Mobile Metal Ion™ digestion methods. Several quality control measures were taken throughout the project and the data quality was assessed in a separate report. This report used the acquired geochemical data to investigate the preliminary implications of this new national dataset on exploration for energy and mineral resources in Australia. This was mostly done by overlaying the NGSA data on coverages of known deposits and occurrences for selected commodities: uranium (U), thorium (Th), gold (Au), copper (Cu), lead (Pb), zinc (Zn) and Rare Earth Elements (REEs). For U, an attempt was made to distinguish between calcrete-related and intrusion-related deposit types, and a local case study in the Pine Creek area is also presented. For Zn, preliminary results from an investigation into discrete field modelling using concentration-area (CA) fractal plots are also presented. Coincidence of known mineral deposits and occurrences with elevated geochemical element concentrations in the same catchment are highlighted. Several catchments have elevated geochemical element concentrations in catchments with no known mineral deposits or occurrences, which provide potential targets for exploration. This technique constitutes a useful and rapid tool for area selection where further, more detailed exploration effort could be expended to test these geochemical anomalies.
iv

National Geochemical Survey of Australia: Preliminary Implications for Exploration
Abbreviations Used AF Alkaline Fusion BOS Bottom Outlet Sediment CA Concentration-Area EC Electrical Conductivity FA Fire Assay ICP-MS Inductively Coupled Plasma-Mass Spectrometry ISE Ion Specific Electrode LPSA Laser Particle Size Analyser MMI™ Mobile Metal Ion™ NGSA National Geochemical Survey of Australia OESP Onshore Energy Security Program PGE Platinum Group Element REE Rare Earth Element TOS Top Outlet Sediment XRF X-Ray Fluorescence
v

National Geochemical Survey of Australia: Preliminary Implications for Exploration
Introduction A five-year Onshore Energy Security Program (OESP) was announced in 2006 to enable Geoscience Australia to deliver high quality pre-competitive geoscience information relating to onshore energy prospectivity (Johnson, 2006). The National Geochemical Survey of Australia (NGSA), which is part of this programme (Baldwin, 2007), collected transported regolith (sediment) samples from across the Australian continent and determined their inorganic chemical composition. The NGSA provides the only nation-wide, internally consistent geochemical dataset with state-of-the-art detection limits. It aimed to:
Help calibrate and ground-truth the airborne radiometrics coverage of Australia (including addressing mother-daughter disequilibrium in the uranium-decay chain);
Fill gaps in the existing airborne radiometric and geochemical coverages of Australia with quality data;
Permit multi-element characterisation and ranking of radiometric anomalies (e.g., differentiation of uranium signatures from ‘hot’ granites, black shales or paleochannels); and
Provide fundamental data to enable first-order characterisation of geothermal hot-spots. As such, the NGSA project (http://www.ga.gov.au/energy/projects/national-geochemical-survey.html) supports and adds value to a number of other OESP projects, particularly the Australia-Wide Airborne Geophysical Survey project (http://www.ga.gov.au/energy/projects/awags.html; Minty et al., 2009a) and the Geothermal Energy project (http://www.ga.gov.au/energy/projects/geothermal-energy.html). Additionally, the NGSA results will have wider applications in mineral exploration for other commodities and natural resource management. At its completion in June 2011, the NGSA delivered:
A geochemical dataset that is national in scope, internally consistent and acquired through the application of state-of-the-art methods and instrumentation;
A web-delivered geochemical atlas of Australia for some 68 elements showing for the first time what the concentrations of these elements are in surface materials and how they vary spatially; and
Reports and papers documenting the project in detail and drawing implications on energy resource potential and other applications.
Samples were collected from 1186 catchments (or 1315 sites, including duplicates), which together cover over 6.174 million km2 or ~81% of Australia at the average sample density of one site per 5200 km2 (statistics based on equal area projection). Approximately 200 catchments in South Australia and Western Australia could not be sampled during this project due to access limitations. Collaboration with State and Northern Territory geoscience agencies was critical for the completion of the project, particularly regarding the sampling phase. Sampling procedures were reported in Lech et al. (2007) and field data was compiled in Cooper et al. (2010). Sample preparation protocols were documented in Caritat et al. (2009) and sample analysis methods were detailed in Caritat et al. (2010). The compilation of NGSA maps was presented in the Geochemical Atlas of Australia (Caritat & Cooper, 2011a). An assessment of the quality of the NGSA data is presented in Caritat & Cooper (2011b). In the present report, which should be used in the context of the above mentioned reports, we present a preliminary interpretation of the geochemical data generated by the NGSA project with respect to exploration for energy and mineral resources.
1

National Geochemical Survey of Australia: Preliminary Implications for Exploration
Background to the Project The NGSA project aimed to provide pre-competitive data and knowledge to support exploration for energy resources in Australia. In particular, it improved existing knowledge of the concentrations and distributions of energy-related elements such as uranium (U) and thorium (Th) at the national scale. The project was underpinned by a series of pilot geochemical surveys carried out in the previous four years by Geoscience Australia and the Cooperative Research Centre for Landscape Environments and Mineral Exploration (CRC LEME) to test robust and cost-effective protocols for sample collection, preparation and analysis. Examples of these are the Riverina (Caritat et al., 2005; Caritat et al., 2007), the Gawler (Caritat et al., 2008a) and the Thomson (Caritat & Lech, 2007; Lech & Caritat, 2007) pilot geochemical surveys. Selected results from these pilot projects were summarised in Caritat et al. (2008b). The current national project, briefly described below, was conducted in collaboration with all the State and the Northern Territory geoscience agencies. RATIONALE The NGSA was initiated because of the absence of a complete geochemical coverage for Australia and because such a data layer is an important complement to national-scale geological and geophysical datasets (Caritat et al., 2008c). The distribution of geochemical data available at the commencement of the survey through the national repository (OZCHEM database) is shown in Figure 1. The map shows that there are vast areas of the country (>60%) that lack any geochemical information. Where geochemical data are available in the public domain, they may often not be internally comparable as a result of:
Inconsistent sampling material (e.g., rocks of various types and/or degree of alteration, mineralisation or weathering);
Inconsistent sample preparation methods (e.g., total analyses versus partial digests with weak acids);
Differences in instrumentation used and between laboratories, leading to variable lower limits of detection between datasets (e.g., older versus state-of-the-art instruments);
Lack of metadata on data quality (e.g., instrument calibration, bias, precision, sample type description, replicates, etc.); and
Variable suite of elements analysed (e.g., sometimes a very limited suite such as gold (Au) only or Au + copper (Cu)).
Although a significantly improved nation-wide, levelled coverage of airborne gamma-ray spectrometric (radiometric) data (Minty et al., 2009a,b) became available (Figure 2) during the course of the NGSA project, field calibration of radiogenic elements potassium (K), uranium (U) or thorium (Th) is perhaps not as systematic as is desirable and the question of disequilibrium in the radiogenic decay chain is poorly constrained as a result. It is hoped the NGSA data, in combination with the new radiometric coverage, will yield insights into this problem. Some regional geochemical surveys have been carried out in parts of Australia (e.g. Morris et al., 1998; Cornelius et al., 2008; the pilot geochemical surveys mentioned above), but no national coverage exists. The modern concept of regional geochemical surveys was first developed in the 1960s, and it has since proven to be a reliable tool for mineral exploration at various scales (Garrett et al., 2008; Smith & Reimann, 2008).
2

National Geochemical Survey of Australia: Preliminary Implications for Exploration
Figure 1. Distribution of whole rock geochemical data in Australia (plus signs) extracted from the OZCHEM national database as at June 2006, overlain on bedrock and regolith coverage. OBJECTIVES The objectives of the NGSA project were to:
Collect transported regolith samples at the outlet of large catchments covering >90% of Australia using an ultra low sampling density approach;
Prepare and analyse the samples to extract the maximum amount of geochemical information (60+ elements/parameters) using internally consistent, state-of-the-art techniques;
Populate the national geochemical database with the resulting new data; and Compile an atlas of geochemical maps for use by the mineral exploration industry to
identify areas of interest in terms of energy-related resources and other mineral commodities, which can then be the focus of targeted exploration efforts.
STRATEGY The sampling method was adapted to Australian landscape and climate conditions (e.g., importance of eolian landforms in some areas, climate ranging from tropical to arid). It was fine-tuned and field-tested during the Riverina, Gawler and Thomson pilot projects (e.g., see Caritat et al., 2008b). The cost of a national survey was minimised by applying an ultra low sampling density approach (generally accepted to mean between one site/1000 km2 and one site/10,000 km2).
3

National Geochemical Survey of Australia: Preliminary Implications for Exploration
Figure 2. Ternary radiometric image (K-red, eU-blue, eTh-green) of Australia derived from the new levelled National Radioelement Database (Minty et al., 2009b) The strategy adopted for the national geochemical survey is briefly described below. Sampling medium Catchment outlet sediments (similar to floodplain sediments in most cases) were sampled at two depths (0-10 cm and ~60-80 cm below the surface). The term ‘catchment outlet sediment’ is deliberately chosen because it is more general than ‘floodplain sediment’ to allow for those cases where eolian influence is important in the regolith formation process. Sampling sites Initially 1385 catchments covering 91% (or about seven million km2) of Australia across all States and Territories were targeted for sampling (Figure 3). Five catchments were assigned a second sampling site (i.e., target site) due to their size and topography so in total, it was expected that 1529 samples (1390 catchments + 10% of which were sampled in duplicate) would be collected. Most catchments were sampled near their outlet, while those exhibiting internal or poorly defined drainage were sampled at, or as close as possible to, their lowest point. Lech et al. (2007) provide details of the method for determining sampling sites. Catchments smaller than 1000 km2 (mostly coastal) and small islands were not included in the survey. The resulting distribution of catchment outlet sites targeted for sampling is shown in Figure 4 and translates to an average sampling density of around one site/5500 km2.
4

National Geochemical Survey of Australia: Preliminary Implications for Exploration
Figure 3. Distribution of catchments for the National Geochemical Survey of Australia.
Figure 4. Distribution of initial target sampling sites for the National Geochemical Survey of Australia.
5

National Geochemical Survey of Australia: Preliminary Implications for Exploration
Sample collection A detailed Field Manual was compiled (Lech et al., 2007) and all sampling equipment and consumables were centrally purchased. Despite best efforts to access all target sites, only 1186 catchments could be sampled before the deadline for field work was reached. Of these 1186 catchments, 123 were sampled in duplicate (on average ~200 m away from the original site) for quality control purposes, and six of the largest catchments were sampled at two widely separated locations (on average 69 km apart), yielding a total of 1315 sampled sites (Figure 5). At each site, a Top Outlet Sediment (TOS) sample was collected from 0-10 cm (below the root zone, if applicable), and a Bottom Outlet Sediment (BOS) sample was collected from a depth of (on average) between 60 and 80 cm. To reduce natural soil heterogeneity, every sample collected was a composite either from a shallow soil pit (TOS) or from at least three auger holes or, rarely, a pit (BOS) at a given site (see Lech et al. (2007) for more information). An average of nine kg of sediment was collected per sample. Sample collection was carried out by the State and Northern Territory geoscience agencies following a hands-on, in-field training period with the Geoscience Australia NGSA team. At each locality a detailed site description, field pH, and dry (if possible) and moist Munsell® soil colours were recorded and several digital photographs were taken (Cooper et al., 2010). All information was recorded digitally to facilitate subsequent uploading into databases.
Figure 5. Final distribution of catchments sampled for the National Geochemical Survey of Australia (1186 catchments, or 86%, completed). Sample preparation All samples were sent to Geoscience Australia, Canberra, for processing, where they were air dried and homogenised. A bulk split (~50%) of each sample was archived for future investigations. The remainder was riffle split and dry sieved to <2 mm and <75 µm fractions. The <2 mm fraction was mechanically ground for most analyses (not for Aqua Regia or PGEs analysis by FA), while the finer
6
National Geochemical Survey of Australia: Preliminary Implications for Exploration
fraction was not. The sample preparation protocols were discussed in detail in the NGSA Sample Preparation Manual (Caritat et al., 2009). Sample analysis The analysis philosophy from the outset was to apply a multi-element approach on two grain-size fractions prepared by at least two digestion methods, in order to maximise the amount of geochemical information extracted from the samples. Samples were analysed for up to 68 elements by:
1. Total element content by (a) lithium borate fusion followed by X-Ray Fluorescence (XRF) for multiple elements, (b) hydrofluoric and nitric acid digestion of fragments of the XRF beads (Pyke, 2000) followed by reaction cell Inductively Coupled Plasma-Mass Spectrometry (ICP-MS) for multiple elements, (c) Fire Assay (FA) followed by ICP-MS for gold (Au), palladium (Pd) and platinum (Pt), and (d) Alkaline Fusion (AF) followed by Ion Specific Electrode (ISE) for fluorine (F),
2. Aqua Regia soluble element content by Aqua Regia (hydrochloric and nitric acid) digestion followed by ICP-MS for multiple elements, including low-level Au and selenium (Se),
3. Ligand extractable element content by Mobile Metal Ion™ (MMI™) digestion followed by ICP-MS for multiple elements (TOS coarse only), and
4. Bulk properties including Munsell® colour, field pH, pH of 1:5 (soil:water) slurries (pH 1:5), electrical conductivity of 1:5 (soil:water) slurries (EC 1:5), and grain size distribution by Laser Particle Size Analyser (LPSA) of bulk samples.
Details of the sample analysis protocols are discussed in the NGSA Analytical Methods Manual (Caritat et al., 2010). Quality assessment/quality control Sample numbers were randomised to minimise regional bias, help separate false from true anomalies and obtain meaningful estimates of the variance of duplicates. Field duplicates, analytical duplicates, internal standards and certified reference materials were introduced at regular intervals in the analytical streams. Care was also taken throughout the project to minimise contamination, cross-contamination and mislabelling risks. A quantitative assessment of the quality of the NGSA data is presented in Caritat & Cooper (2011b). Data analysis National-scale geochemical maps were produced and released as a Geochemical Atlas (Caritat & Cooper, 2011a) and a web-based map collection (www.ga.gov.au/ngsa). Reports providing preliminary interpretations (e.g., this report; Wilford et al., 2011) and including graphical and statistical analysis will be prepared separately and released via the project website (above). Timeline Following planning in the first half of 2007, fieldwork, including initial training, began in mid-2007 and concluded in late 2009. Figure 5 shows the final distribution of catchments actually sampled for NGSA at the end of fieldwork (December 2009). Sample preparation started in early 2008 and concluded in December 2009. Sample analysis started late 2008 and finished in late 2010. Data analysis and reporting took place in 2010 and early 2011. The project concluded in June 2011, with a dataset and product release at the Association of Mining and Exploration Companies (AMEC) convention in Perth, 28-30 June 2011.
7

National Geochemical Survey of Australia: Preliminary Implications for Exploration
Preliminary Implications for Energy and Mineral Exploration The geochemical data generated by the NGSA project is plotted herein on top of maps of known energy and mineral commodity deposits and occurrences. Where a known deposit or occurrence falls in the same catchment as an NGSA sample with anomalously high concentration in that particular commodity (or associated) element, a case can be made for the geochemical survey ‘detecting’ the presence of the mineralisation (see Discussion). As a corollary, where an anomalously high concentration in a commodity (or associated) element is found in a catchment with no known mineral deposit or occurrence, a reasonable question can be raised about that catchment being worthy of further investigation. Investigation is carried out for a selection of energy and mineral commodities: uranium (U), thorium (Th), gold (Au), copper (Cu), lead (Pb), zinc (Zn) and, as a proxy for Rare Earth Elements (REEs), cerium (Ce). More detailed interpretations, including of where elements reside (in terms of depth, grain-size fraction, and potentially even mineral host), will appear in separate publications. The deposits and occurrences shown here are derived from the OZMIN database (Ewers et al., 2002). URANIUM Figure 6 shows the U Total concentrations obtained for the NGSA TOS coarse samples overlain on the airborne radiometrics estimated U (eU) channel (estimated because not measured directly). It shows a reasonably good agreement between the two independent datasets, which are further discussed in Wilford et al. (2011). Figures 7-10 show the NGSA data for U Total concentrations in the four depth/grain-size fraction samples and the NGSA catchment boundaries, overlain on U mineral deposits and occurrences. For instance, in Western Australia (see A on Figure 8) and in the northern parts of the Northern Territory (B) and Queensland (C), there is good coincidence of elevated U concentrations (above the 75th percentile) and known U deposits and occurrences. In eastern South Australia (Gawler and Curnamona regions, see D on Figure 8) the existing deposits and occurrences are not reflected by systematic elevated U concentrations, but there are a few points above the 75th percentile. In the case of Olympic Dam, this is probably due to the very thick cover overlying this rich U-Fe-oxide-Cu-Au deposit (>200 m thick). The geochemical maps (Figures 7-10) also show several catchments with elevated U concentrations that do not contain known U deposits and occurrences. These are particularly visible on the TOS and BOS fine fraction (<75 µm) maps and include a wide coastal fringe in southern Western Australia (E on Figure 8), areas in central eastern and southern Northern Territory (F, G), and the southeastern corner of New South Wales and eastern Victoria (H).
8

9
Figure 6. Distribution of U Total concentrations in TOS samples (<2 mm fraction) overlain on airborne radiometric eU channel image (blue = low; red = high eU values).
National Geochemical Survey of Australia: Preliminary Implications for Exploration

National Geochemical Survey of Australia: Preliminary Implications for Exploration
Figure 7. Distribution of U Total concentrations in TOS samples (<2 mm fraction) overlain on U deposits and occurrences, together with the outlines of the NGSA catchments.
10

National Geochemical Survey of Australia: Preliminary Implications for Exploration
A
C
B
D
E
F
G
H
A
C
B
D
E
F
G
H
Figure 8. Distribution of U Total concentrations in TOS samples (<75 µm fraction) overlain on U deposits and occurrences, together with the outlines of the NGSA catchments. Areas circled in red and annotated with a letter are discussed in the text.
11

National Geochemical Survey of Australia: Preliminary Implications for Exploration
Figure 9. Distribution of U Total concentrations in BOS samples (<2 mm fraction) overlain on U deposits and occurrences, together with the outlines of the NGSA catchments.
12

National Geochemical Survey of Australia: Preliminary Implications for Exploration
Figure 10. Distribution of U Total concentrations in BOS samples (<75 µm fraction) overlain on U deposits and occurrences, together with the outlines of the NGSA catchments.
13

National Geochemical Survey of Australia: Preliminary Implications for Exploration
14
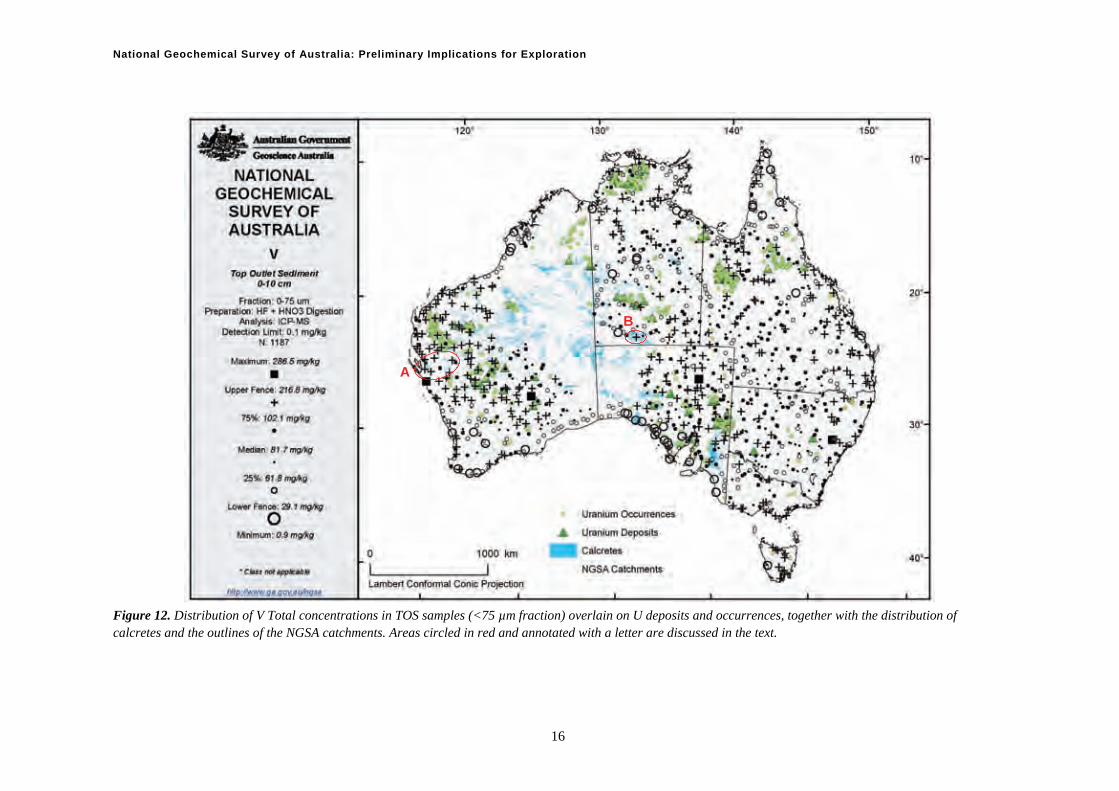
Calcrete-related U deposits Calcrete-related U deposits are characterised by the presence of the mineral carnotite (K2(UO2)2(VO4)2 • 1-3H2O). Figures 11-14 show the NGSA data for vanadium (V) Total concentrations in the four depth/grain-size fraction samples, the NGSA catchment boundaries, and the known distribution of calcretes, overlain on U mineral deposits and occurrences. By comparing these maps with those of U distribution (Figures 7-10), it may be possible to gain insight into catchments with potential for calcrete-type U mineralisation. For instance, two such areas with elevated U and V and the presence of calcretes in the catchments are highlighted in Figure 12, one in Western Australia (A) and one in the Northern Territory (B).

15
ational Geochemical Survey of Australia: Preliminary Implications for Exploration
Fa
igure 11. Distribution of V Total concentrations in TOS samples (<2 mm fraction) overlain on U deposits and occurrences, together with the distribution of calcretes nd the outlines of the NGSA catchments.
N
National Geochemical Survey of Australia: Preliminary Implications for Exploration
A
B
A
B
Figure 12. Distribution of V Total concentrations in TOS samples (<75 µm fraction) overlain on U deposits and occurrences, together with the distribution of calcretes and the outlines of the NGSA catchments. Areas circled in red and annotated with a letter are discussed in the text.
16

National Geochemical Survey of Australia: Preliminary Implications for Exploration
Figure 13. Distribution of V Total concentrations in BOS samples (<2 mm fraction) overlain on U deposits and occurrences, together with the distribution of calcretes and the outlines of the NGSA catchments.
17

National Geochemical Survey of Australia: Preliminary Implications for Exploration
Figure 14. Distribution of V Total concentrations in BOS samples (<75 µm fraction) overlain on U deposits and occurrences, together with the distribution of calcretes and the outlines of the NGSA catchments.
18

National Geochemical Survey of Australia: Preliminary Implications for Exploration
19
Intrusion-related U deposits Igneous intrusion-related U deposits are potentially distinguishable from calcrete-related deposits by using the distribution of elements typically associated with felsic intrusions. A typical element associated with felsic intrusions is fluorine (F). Additionally, if F is present it may enhance the solubility of U by forming hydroxo-fluoro complexes (Parks & Pohl, 1988), potentially leaching U out of intrusive rocks and enabling its deposition elsewhere. Figures 15-18 show the NGSA data for F Total concentrations in the four depth/grain-size fraction samples, and the NGSA catchment boundaries, overlain on U mineral deposits and occurrences. By comparing these maps with those of U distribution (Figures 7-10), it may be possible to gain insight into catchments with potential for intrusion-related U mineralisation.

20
ational Geochemical Survey of Australia: Preliminary Implications for Exploration
Fcatchments
igure 15. Distribution of F Total concentrations in TOS samples (<2 mm fraction) overlain on U deposits and occurrences, together with the outlines of the NGSA .
N

National Geochemical Survey of Australia: Preliminary Implications for Exploration
Figure 16. Distribution of F Total concentrations in TOS samples (<75 µm fraction) overlain on U deposits and occurrences, together with the outlines of the NGSA catchments.
21

National Geochemical Survey of Australia: Preliminary Implications for Exploration
Figure 17. Distribution of F Total concentrations in BOS samples (<2 mm fraction) overlain on U deposits and occurrences, together with the outlines of the NGSA catchments.
22

National Geochemical Survey of Australia: Preliminary Implications for Exploration
Figure 18. Distribution of F Total concentrations in BOS samples (<75 µm fraction) overlain on U deposits and occurrences, together with the outlines of the NGSA catchments.
23
National Geochemical Survey of Australia: Preliminary Implications for Exploration
24
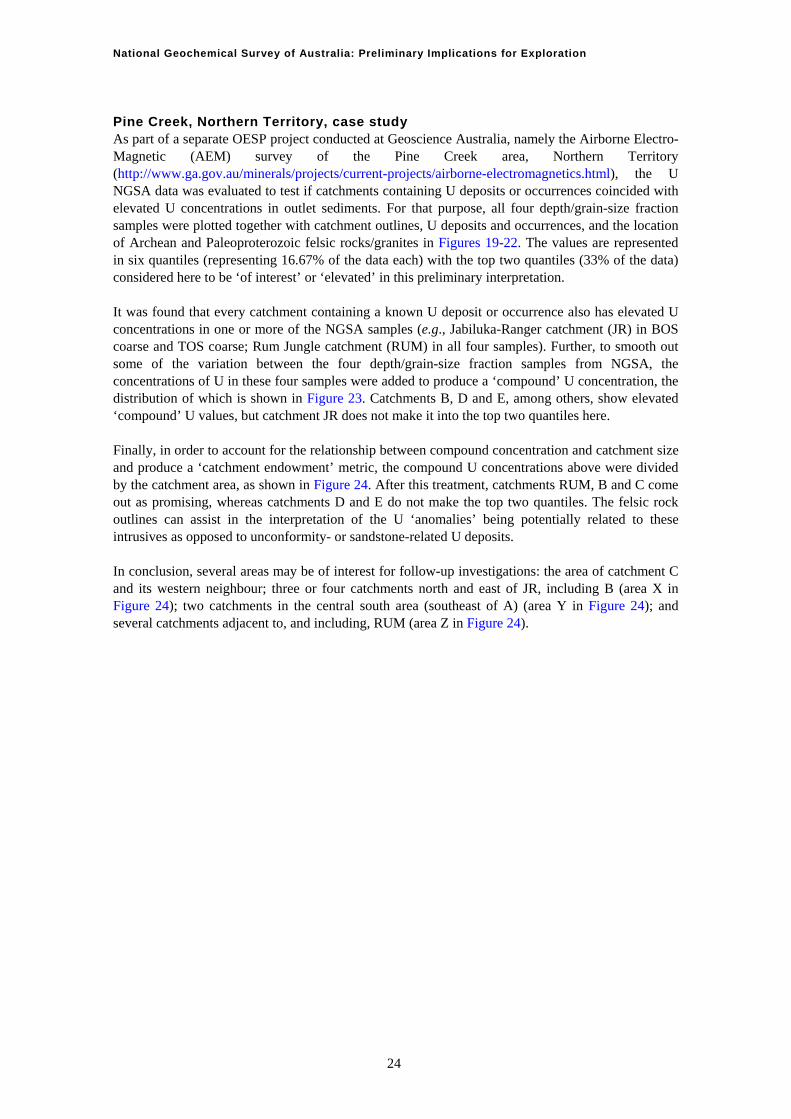
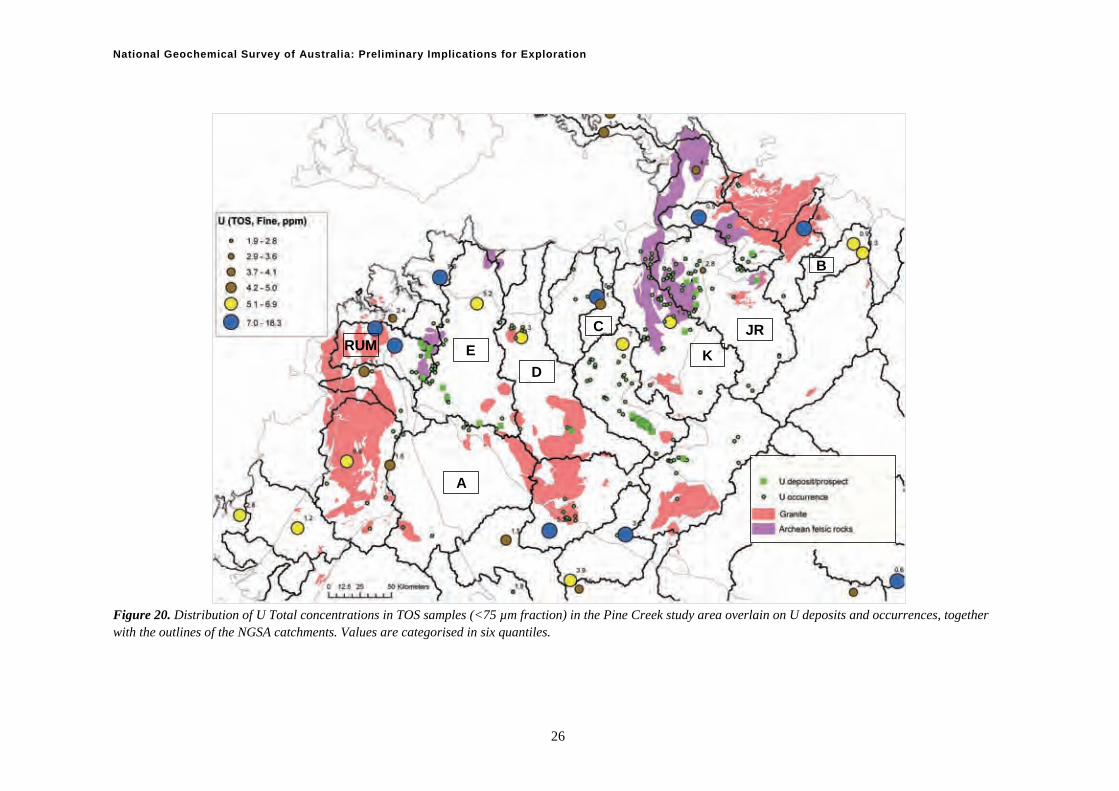
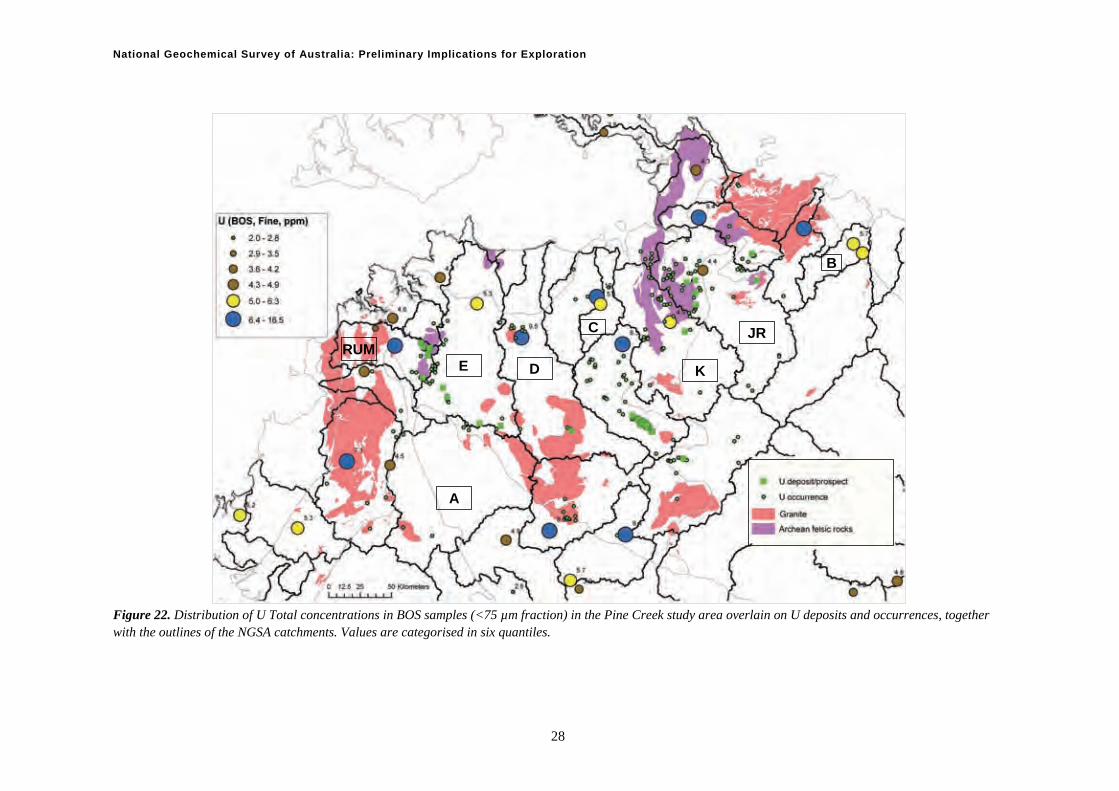
Pine Creek, Northern Territory, case study As part of a separate OESP project conducted at Geoscience Australia, namely the Airborne Electro-Magnetic (AEM) survey of the Pine Creek area, Northern Territory (http://www.ga.gov.au/minerals/projects/current-projects/airborne-electromagnetics.html), the U NGSA data was evaluated to test if catchments containing U deposits or occurrences coincided with elevated U concentrations in outlet sediments. For that purpose, all four depth/grain-size fraction samples were plotted together with catchment outlines, U deposits and occurrences, and the location of Archean and Paleoproterozoic felsic rocks/granites in Figures 19-22. The values are represented in six quantiles (representing 16.67% of the data each) with the top two quantiles (33% of the data) considered here to be ‘of interest’ or ‘elevated’ in this preliminary interpretation. It was found that every catchment containing a known U deposit or occurrence also has elevated U concentrations in one or more of the NGSA samples (e.g., Jabiluka-Ranger catchment (JR) in BOS coarse and TOS coarse; Rum Jungle catchment (RUM) in all four samples). Further, to smooth out some of the variation between the four depth/grain-size fraction samples from NGSA, the concentrations of U in these four samples were added to produce a ‘compound’ U concentration, the distribution of which is shown in Figure 23. Catchments B, D and E, among others, show elevated ‘compound’ U values, but catchment JR does not make it into the top two quantiles here. Finally, in order to account for the relationship between compound concentration and catchment size and produce a ‘catchment endowment’ metric, the compound U concentrations above were divided by the catchment area, as shown in Figure 24. After this treatment, catchments RUM, B and C come out as promising, whereas catchments D and E do not make the top two quantiles. The felsic rock outlines can assist in the interpretation of the U ‘anomalies’ being potentially related to these intrusives as opposed to unconformity- or sandstone-related U deposits. In conclusion, several areas may be of interest for follow-up investigations: the area of catchment C and its western neighbour; three or four catchments north and east of JR, including B (area X in Figure 24); two catchments in the central south area (southeast of A) (area Y in Figure 24); and several catchments adjacent to, and including, RUM (area Z in Figure 24).

25
D
ational Geochemical Survey of Australia: Preliminary Implications for Exploration
A
ERUM
D
C
K
JR
B
D
D
C
K
JR
B
A
ERUM
Fwith
igure 19. Distribution of U Total concentrations in TOS samples (<2 mm fraction) in the Pine Creek study area overlain on U deposits and occurrences, together the outlines of the NGSA catchments. Values are categorised in six quantiles.
N
National Geochemical Survey of Australia: Preliminary Implications for Exploration
A
ERUM
D
C
K
JR
B
A
ERUM
D
C
K
JR
B
Figure 20. Distribution of U Total concentrations in TOS samples (<75 µm fraction) in the Pine Creek study area overlain on U deposits and occurrences, together with the outlines of the NGSA catchments. Values are categorised in six quantiles.
26

National Geochemical Survey of Australia: Preliminary Implications for Exploration
A
ERUM
D
C
K
JR
B
A
ERUM
D
C
K
JR
B
Figure 21. Distribution of U Total concentrations in BOS samples (<2 mm fraction) in the Pine Creek study area overlain on U deposits and occurrences, together with the outlines of the NGSA catchments. Values are categorised in six quantiles.
27
National Geochemical Survey of Australia: Preliminary Implications for Exploration
A
ERUM
D
C
K
JR
B
A
ERUM
D
C
K
JR
B
Figure 22. Distribution of U Total concentrations in BOS samples (<75 µm fraction) in the Pine Creek study area overlain on U deposits and occurrences, together with the outlines of the NGSA catchments. Values are categorised in six quantiles.
28

National Geochemical Survey of Australia: Preliminary Implications for Exploration
A
ERUM
D
C
K
JR
B
A
ERUM
D
C
K
JR
B
Figure 23. Distribution of ‘composite’ U concentrations (sum of U Total concentrations in the four NGSA depth/grain-size fraction samples) in the Pine Creek study area overlain on U deposits and occurrences, together with the outlines of the NGSA catchments. Values are categorised in six quantiles.
29

National Geochemical Survey of Australia: Preliminary Implications for Exploration
A
ERUM
D
C
K
JR
B
A
ERUM
D
C
K
JR
B
X
Y
Z B
A
ERUM
D
C
K
JR
B
C
JRRUME D K
A
X
Y
Z
Figure 24. Distribution of ‘catchment endowment’ for U (‘composite’ U concentrations divided by catchment area) in the Pine Creek study area overlain on U deposits and occurrences, together with the outlines of the NGSA catchments. Values are categorised in six quantiles. Areas circled in red and annotated with a letter are discussed in the text.
30

National Geochemical Survey of Australia: Preliminary Implications for Exploration
31
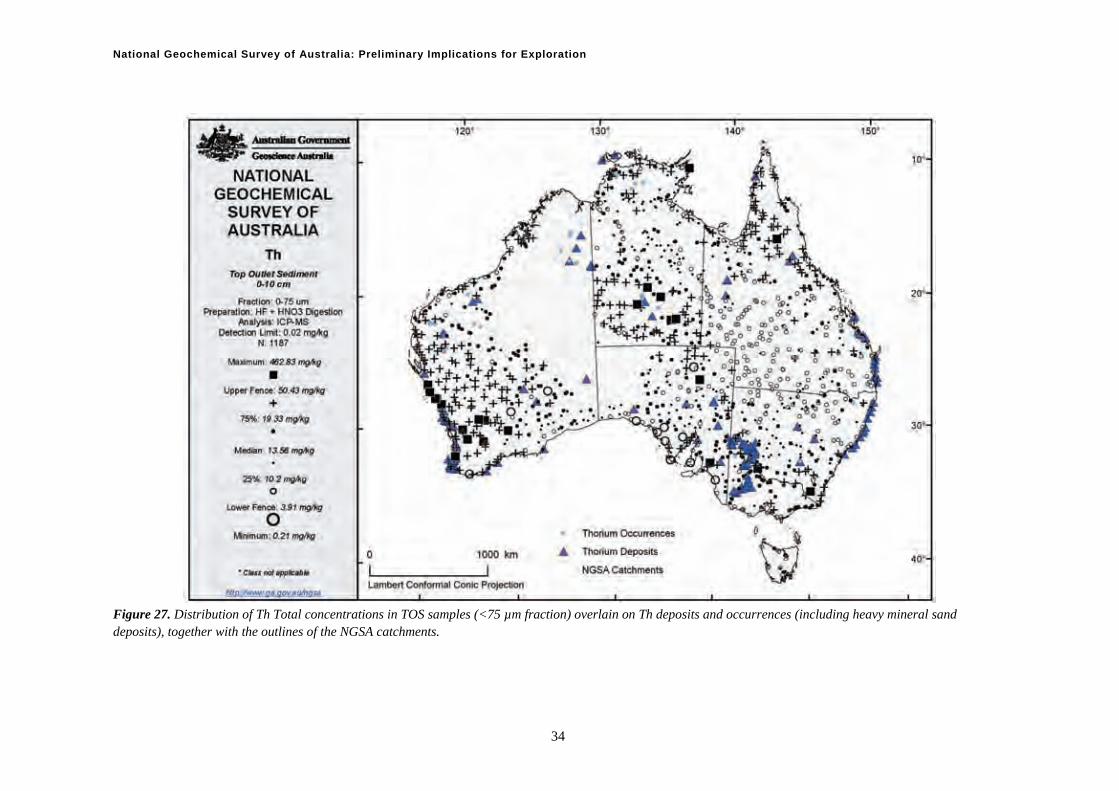
THORIUM Figure 25 shows the Th Total concentrations obtained for the NGSA TOS coarse samples overlain on the airborne radiometrics eTh (estimated Th) channel. It shows an excellent agreement between the two independent datasets, which are further discussed in Wilford et al. (2011). Figures 26-29 show the NGSA data for Th Total concentrations in the four depth/grain-size fraction samples and the NGSA catchment boundaries, overlain on Th mineral deposits and occurrences. Again, there is generally a good coincidence between Th and mineral sands deposits and occurrences and Th geochemical values above the 75th percentile. Exceptions to this are the east coast of New South Wales and the Riverina region on the border between New South Wales and Victoria. Conversely, the following regions have elevated Th values in the sediments but are not proximal to known Th or mineral sands deposits or occurrences: the southwestern Yilgarn Craton (area A in Figure 29), the northeastern corner of South Australia (B) (a fine-grain only geochemical anomaly), the southern part of the Cape York Peninsula (C) and the southeastern corner of New South Wales and adjacent areas of eastern Victoria (D).

32
ational Geochemical Survey of Australia: Preliminary Implications for Exploration
Fe
igure 25. Distribution of Th Total concentrations in TOS samples (<2 mm fraction) overlain on airborne radiometric eTh channel image (blue = low; red = high Th values).
N

National Geochemical Survey of Australia: Preliminary Implications for Exploration
Figure 26. Distribution of Th Total concentrations in TOS samples (<2 mm fraction) overlain on Th deposits and occurrences (including heavy mineral sand deposits), together with the outlines of the NGSA catchments.
33
National Geochemical Survey of Australia: Preliminary Implications for Exploration
Figure 27. Distribution of Th Total concentrations in TOS samples (<75 µm fraction) overlain on Th deposits and occurrences (including heavy mineral sand deposits), together with the outlines of the NGSA catchments.
34

National Geochemical Survey of Australia: Preliminary Implications for Exploration
Figure 28. Distribution of Th Total concentrations in BOS samples (<2 mm fraction) overlain on Th deposits and occurrences (including heavy mineral sand deposits), together with the outlines of the NGSA catchments.
35

National Geochemical Survey of Australia: Preliminary Implications for Exploration
B
A
D
C
B
A
D
C
Figure 29. Distribution of Th Total concentrations in BOS samples (<75 µm fraction) overlain on Th deposits and occurrences (including heavy mineral sand deposits), together with the outlines of the NGSA catchments. Areas circled in red and annotated with a letter are discussed in the text.
36

National Geochemical Survey of Australia: Preliminary Implications for Exploration
37
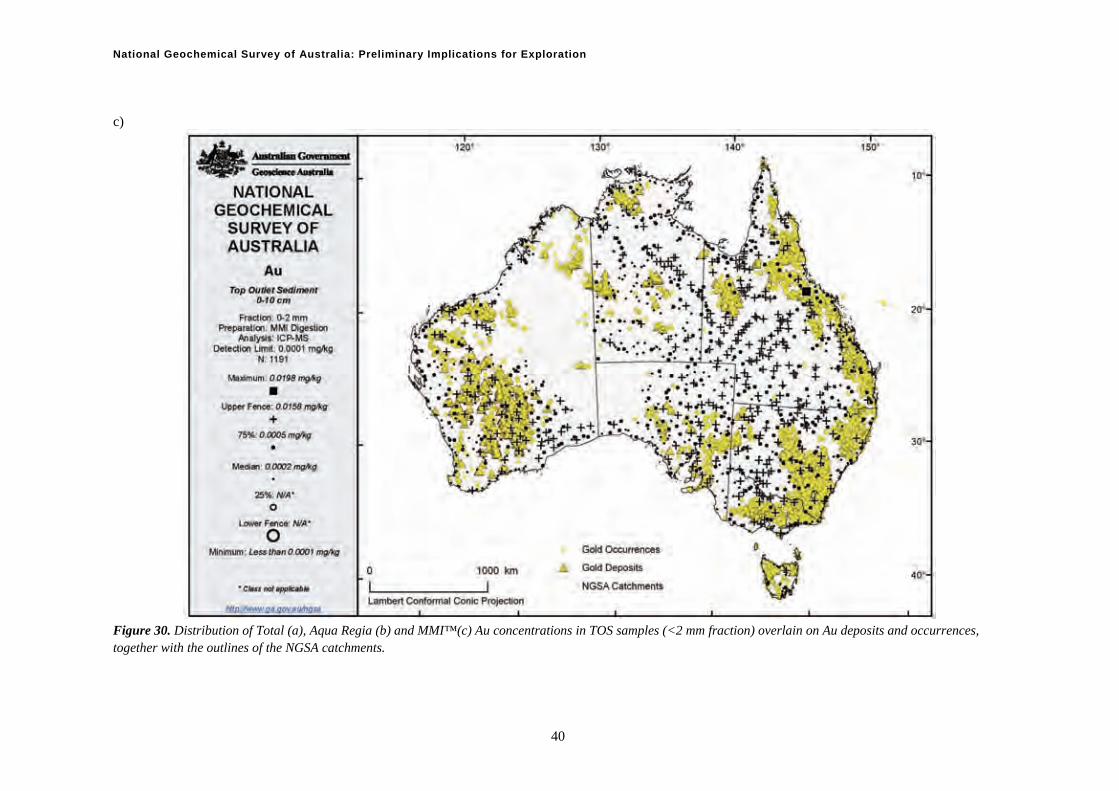
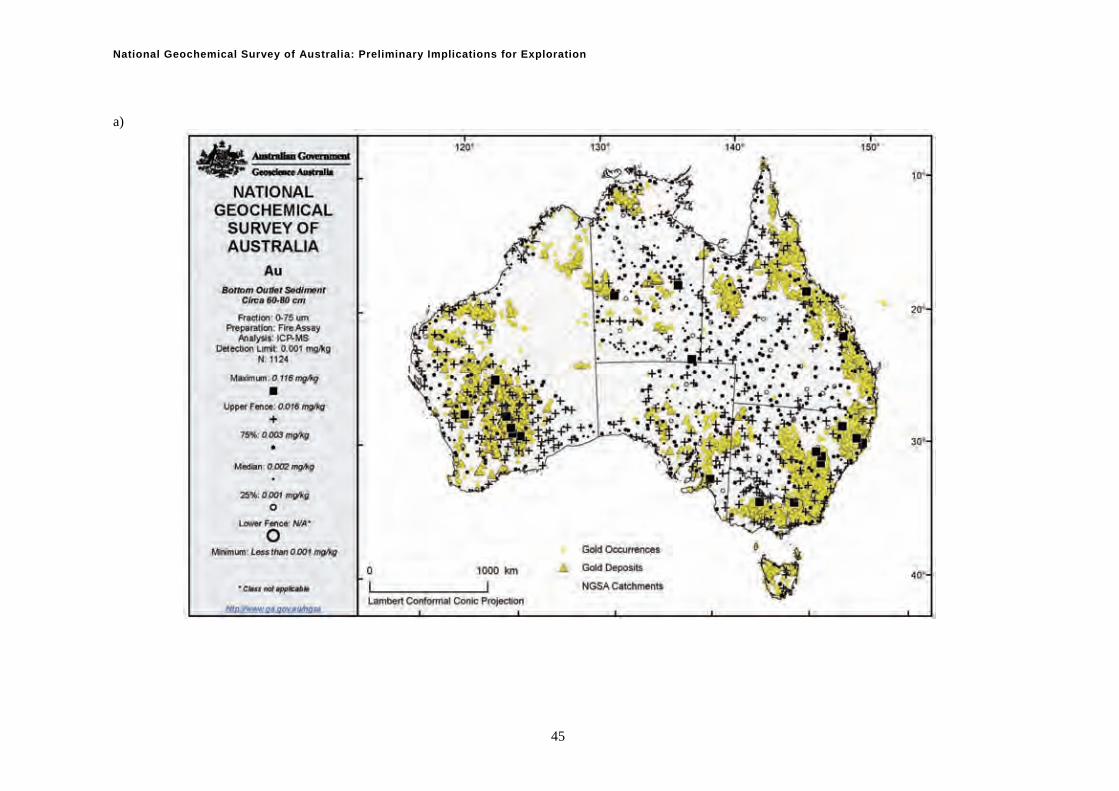
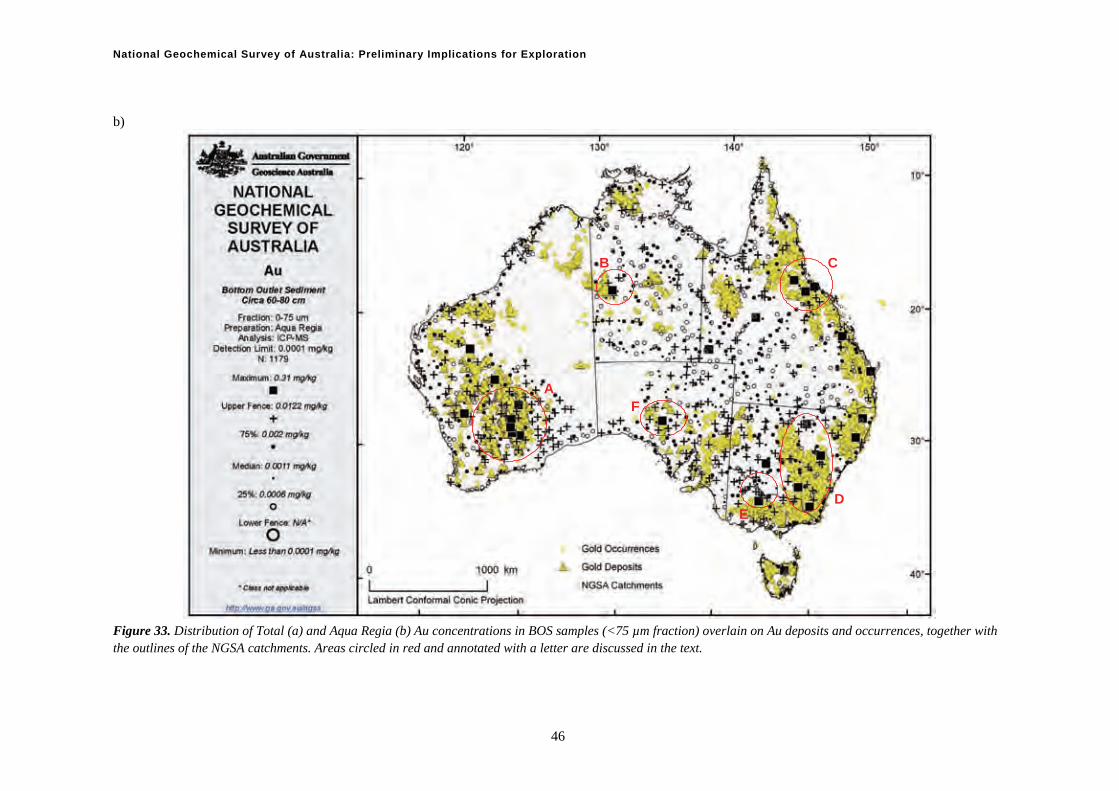
GOLD Figures 30-33 show the NGSA data for Au Total concentrations in the four depth/grain-size fraction samples and the NGSA catchment boundaries, overlain on Au mineral deposits and occurrences. For Au, the Total (Fire Assay), Aqua Regia and, where available, MMI™ concentration maps are shown. Because of the nuggetty behaviour of Au, it may be prudent to be careful about single upper outliers (represented by solid squares on the geochemical maps) that are not surrounded by other elevated values (>75th percentile). There is generally a good agreement between known Au deposits and occurrences and most of the geochemical maps. Focussing on the BOS fine maps, for instance, it is clear that dominant Au provinces are represented in the national geochemical dataset: Yilgarn (label A in Figure 33b), Tanami (B), Charters Towers (C), Lachlan Fold Belt (D), Victorian Goldfields (E) and even the Gawler (F) regions, to name a few. Several of the maps show elevated Au concentrations away from known Au deposits and occurrences in central Australia (near the Northern Territory, Queensland and South Australia borders), in southwestern and central Queensland, and in northern and northeastern South Australia (Figures 30-33).

ational Geochemical Survey of Australia: Preliminary Implications for Exploration
a)
38
N

National Geochemical Survey of Australia: Preliminary Implications for Exploration
b)
39
National Geochemical Survey of Australia: Preliminary Implications for Exploration
c)
Figure 30. Distribution of Total (a), Aqua Regia (b) and MMI™(c) Au concentrations in TOS samples (<2 mm fraction) overlain on Au deposits and occurrences, together with the outlines of the NGSA catchments.
40

National Geochemical Survey of Australia: Preliminary Implications for Exploration
a)
41

National Geochemical Survey of Australia: Preliminary Implications for Exploration
b)
Figure 31. Distribution of Total (a) and Aqua Regia (b) Au concentrations in TOS samples (<75 µm fraction) overlain on Au deposits and occurrences, together with the outlines of the NGSA catchments.
42

National Geochemical Survey of Australia: Preliminary Implications for Exploration
a)
43

National Geochemical Survey of Australia: Preliminary Implications for Exploration
b)
Figure 32. Distribution of Total (a) and Aqua Regia (b) Au concentrations in BOS samples (<2 mm fraction) overlain on Au deposits and occurrences, together with the outlines of the NGSA catchments.
44
National Geochemical Survey of Australia: Preliminary Implications for Exploration
a)
45
National Geochemical Survey of Australia: Preliminary Implications for Exploration
b)
B
A
D
C
E
F
B
A
D
C
E
F
Figure 33. Distribution of Total (a) and Aqua Regia (b) Au concentrations in BOS samples (<75 µm fraction) overlain on Au deposits and occurrences, together with the outlines of the NGSA catchments. Areas circled in red and annotated with a letter are discussed in the text.
46

National Geochemical Survey of Australia: Preliminary Implications for Exploration
47
COPPER Figures 34-37 show the NGSA data for Cu Total concentrations in the four depth/grain-size fraction samples and the NGSA catchment boundaries, overlain on Cu mineral deposits and occurrences.

48
ational Geochemical Survey of Australia: Preliminary Implications for Exploration
Fcatchments
igure 34. Distribution of Cu Total concentrations in TOS samples (<2 mm fraction) overlain on Cu deposits and occurrences, together with the outlines of the NGSA .
N

National Geochemical Survey of Australia: Preliminary Implications for Exploration
Figure 35. Distribution of Cu Total concentrations in TOS samples (<75 µm fraction) overlain on Cu deposits and occurrences, together with the outlines of the NGSA catchments.
49

National Geochemical Survey of Australia: Preliminary Implications for Exploration
Figure 36. Distribution of Cu Total concentrations in BOS samples (<2 mm fraction) overlain on Cu deposits and occurrences, together with the outlines of the NGSA catchments.
50

National Geochemical Survey of Australia: Preliminary Implications for Exploration
Figure 37. Distribution of Cu Total concentrations in BOS samples (<75 µm fraction) overlain on Cu deposits and occurrences, together with the outlines of the NGSA catchments.
51
National Geochemical Survey of Australia: Preliminary Implications for Exploration
52
LEAD Figures 38-41 show the NGSA data for Pb Total concentrations in the four depth/grain-size fraction samples and the NGSA catchment boundaries, overlain on Pb mineral deposits and occurrences. The Pb coarse fraction maps (both TOS and BOS) show a better coincidence of elevated sediment Pb concentrations (>75th percentile) than the fine fraction maps. All, however, show high Pb concentrations in catchments that do not contain known Pb deposits or occurrences. These areas are the southwestern Yilgarn Craton (area A in Figure 41), the Normanton region of the Cape York Peninsula (B), and the southeastern Thomson region in the north central part of New South Wales (C). There are no major development centres in these regions so there is little reason to think that Pb pollution (through leaded fuel) is the fundamental drive for these elevated patterns (which are seen equally in TOS and deeper BOS samples).

53
ational Geochemical Survey of Australia: Preliminary Implications for Exploration
Fcatchments
igure 38. Distribution of Pb Total concentrations in TOS samples (<2 mm fraction) overlain on Pb deposits and occurrences, together with the outlines of the NGSA .
N

National Geochemical Survey of Australia: Preliminary Implications for Exploration
Figure 39. Distribution of Pb Total concentrations in TOS samples (<75 µm fraction) overlain on Pb deposits and occurrences, together with the outlines of the NGSA catchments.
54

National Geochemical Survey of Australia: Preliminary Implications for Exploration
Figure 40. Distribution of Pb Total concentrations in BOS samples (<2 mm fraction) overlain on Pb deposits and occurrences, together with the outlines of the NGSA catchments.
55

National Geochemical Survey of Australia: Preliminary Implications for Exploration
B
AC
B
AC
Figure 41. Distribution of Pb Total concentrations in BOS samples (<75 µm fraction) overlain on Pb deposits and occurrences, together with the outlines of the NGSA catchments. Areas circled in red and annotated with a letter are discussed in the text.
56

National Geochemical Survey of Australia: Preliminary Implications for Exploration
57
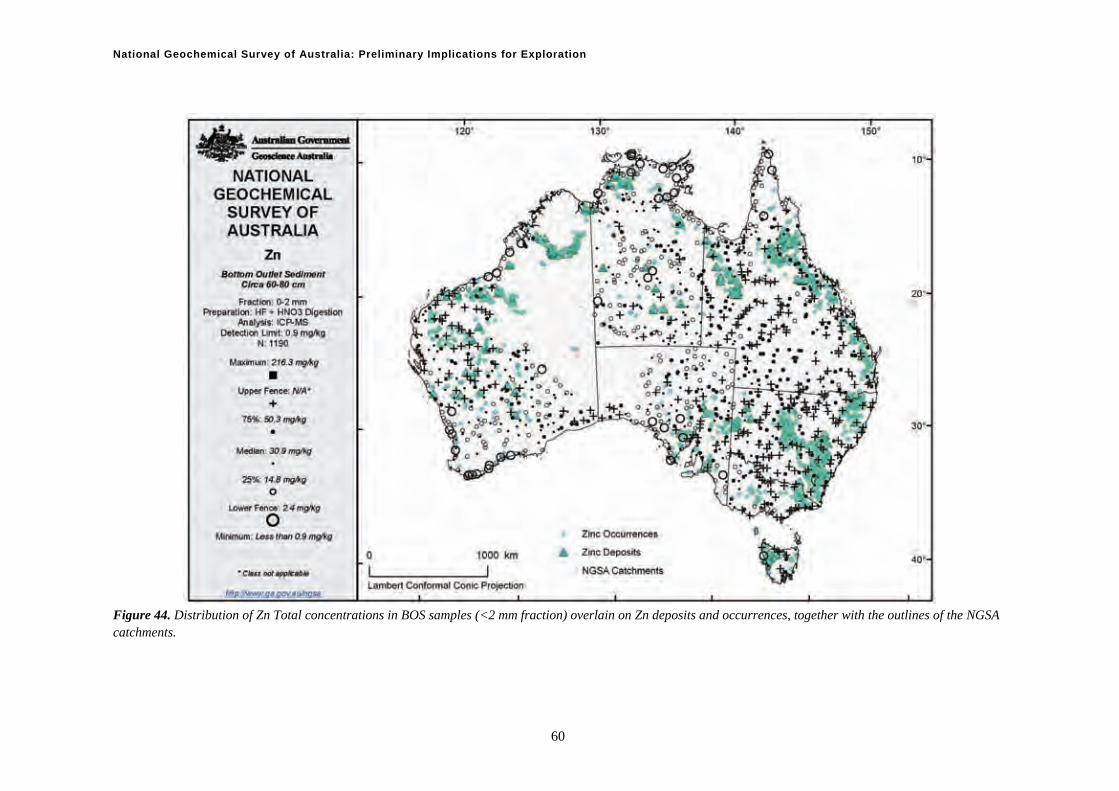
ZINC Figures 42-45 show the NGSA data for Zn Total concentrations in the four depth/grain-size fraction samples and the NGSA catchment boundaries, overlain on Zn mineral deposits and occurrences.

58
ational Geochemical Survey of Australia: Preliminary Implications for Exploration
Fcatchments
igure 42. Distribution of Zn Total concentrations in TOS samples (<2 mm fraction) overlain on Zn deposits and occurrences, together with the outlines of the NGSA .
N

National Geochemical Survey of Australia: Preliminary Implications for Exploration
Figure 43. Distribution of Zn Total concentrations in TOS samples (<75 µm fraction) overlain on Zn deposits and occurrences, together with the outlines of the NGSA catchments.
59
National Geochemical Survey of Australia: Preliminary Implications for Exploration
Figure 44. Distribution of Zn Total concentrations in BOS samples (<2 mm fraction) overlain on Zn deposits and occurrences, together with the outlines of the NGSA catchments.
60

National Geochemical Survey of Australia: Preliminary Implications for Exploration
Figure 45. Distribution of Zn Total concentrations in BOS samples (<75 µm fraction) overlain on Zn deposits and occurrences, together with the outlines of the NGSA catchments.
61

National Geochemical Survey of Australia: Preliminary Implications for Exploration
62
Mapping continent-scale geochemistry by discrete field model: a pilot study using Zn To visualise continental scale geochemical landscapes for a chemical element, Zn in the present case, we tested a discrete field model obtained by attributing catchment outlet sediment geochemical data to their catchment basins. The analysis was completed using Zn for all four types of the sampled material: coarse and fine fractions of the TOS, and coarse and fine fractions of the BOS. Threshold values in the geochemical datasets were identified by the concentration–area (CA) fractal method initially suggested by Cheng (Cheng et al., 1994; Cheng, 1999). It has been demonstrated that the CA fractal method performs best for mapping geochemical anomalies in either continuous or discrete field models of stream sediment geochemical landscapes (Carranza, 2009, 2010). For a succinct summary of practical applications of the CA fractal method the reader is referred to Carranza (2010). A secondary goal of the test study was to correlate the spatial distribution of the identified geochemical classes with the distribution of the Zn mineral deposits and occurrences obtained from the OZMIN database (Ewers et al., 2002). Carranza (2009, 2010), in a study of the Aroroy gold district (Philippines), demonstrated that geochemical anomalies mapped in discrete field models of stream sediment geochemical landscapes have the strongest positive spatial associations with the known epithermal Au deposit occurrences. To prepare the CA-plots, we used the following procedures:
1. Sample duplicates were removed by arbitrarily deleting the duplicate samples with higher Sample IDs of the pairs,
2. For six large catchments with two non-duplicate samples (i.e., deliberately sampled near the catchment outlet as well as in a more central location), we used geometrical means of measured Zn concentrations,
3. For each Zn concentration, we calculated the cumulative catchment areas for concentrations equal to and exceeding a given Zn value, and
4. The CA-plots (Figure 46) were prepared by ranking the observed values in order of decreasing concentrations.
Based on the flexion points observed in the CA-plots for each sample type, we have visually identified the five threshold values that were used for categorisation of geochemical data (Table 1) and their subsequent mapping (Figures 47-50). Table 1. Class ranges for Zn values identified on the basis of the CA-plots.
Depth Size Class fraction Background values (mg/kg) Elevated values (mg/kg) 1 2 3 4 5 TOS Coarse 0-8.9 9-39.9 40-74.9 75-119.9 ≥120 TOS Fine 0-8.9 9-39.9 40-69.9 70-104.9 ≥105 BOS Coarse 0-8.9 9-39.9 40-59.9 60-84.9 ≥85 BOS Fine 0-8.9 9-39.9 40-71.9 72-104.9 ≥105

National Geochemical Survey of Australia: Preliminary Implications for Exploration
TOS_coarse
1.E+03
1.E+04
1.E+05
1.E+06
1.E+07
1 10 100 1000
Zn (mg/kg)
area
(sq
km
s)
TOS_fine
1.E+03
1.E+04
1.E+05
1.E+06
1.E+07
1 10 100 1000
Zn (mg/kg)
area
(sq
km
s)
BOS_coarse
1.E+03
1.E+04
1.E+05
1.E+06
1.E+07
1 10 100 1000
Zn (mg/kg)
area
(sq
km
s)
BOS_fine
1.E+03
1.E+04
1.E+05
1.E+06
1.E+07
1 10 100 1000
Zn (mg/kg)
area
(sq
km
s)
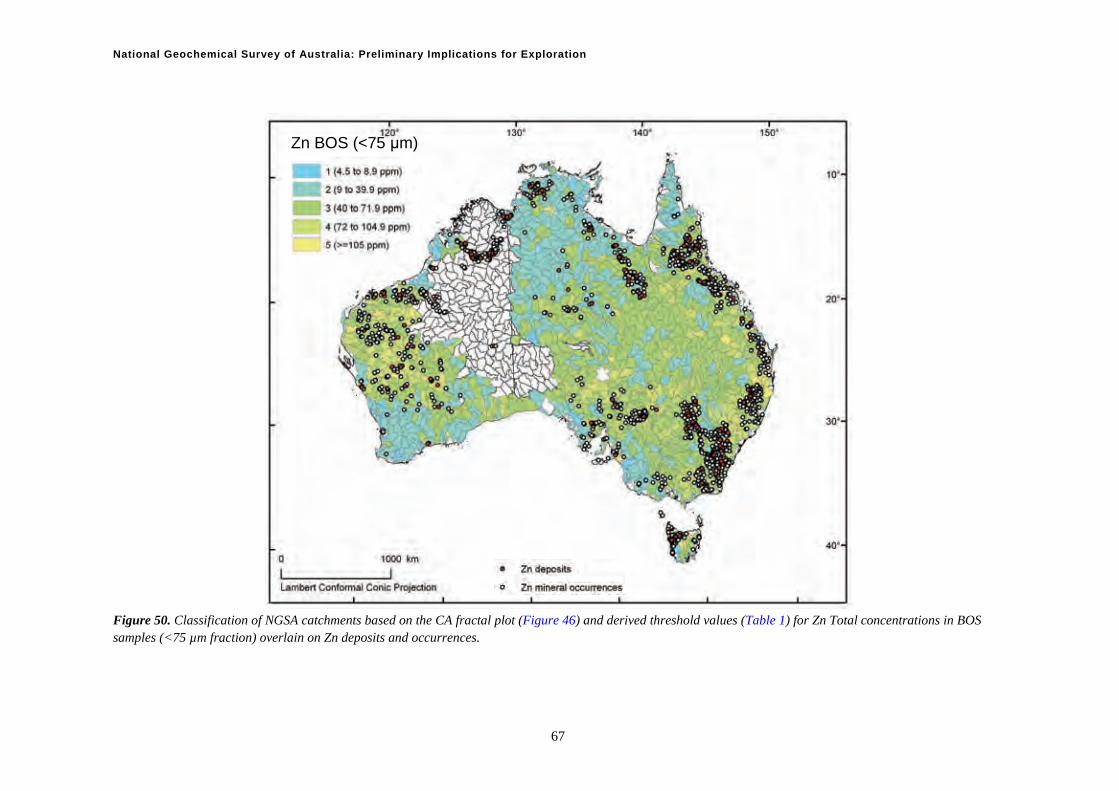
Figure 46. Concentration-area (CA)-plots cumulated downwards for Zn concentrations (mg/kg) in TOS samples (<2 mm and <75 µm fractions) and BOS samples (<2 mm and <75 µm fraction). Thus, Zn values below ~40 mg/kg, the first major flexion point on the CA-plots (Figure 46) were classified as ‘background’ and are depicted in cool blue colours in the following figures. Inspection of the maps provided in Figures 47-50 allows us to make the following preliminary conclusions:
1. The point-to-area transformation via the CA fractal method does facilitate outlining of geochemical provinces (background versus elevated or anomalous values),
2. There is a well-expressed positive correlation between identified catchment Zn Classes and mineral occurrences and deposits that they contain (Figures 47-51); Classes 3 and 4 are consistently characterised by the best endowment in Zn occurrences and deposits, and
3. Depending on the sample type, catchments within Class 5 may not contain Zn deposits but generally are spatially proximal to Zn occurrences and deposits.
63

64
National Geochemical Survey of Australia: Preliminary Implications for Exploration
Zn TOS (<2 mm)Zn TOS (<2 mm)
Figure 47. Classification of NGSA catchments based on the CA fractal plot (Figure 46) and derived threshold values (Table 1) for Zn Total concentrations in TOS samples (<2 mm fraction) overlain on Zn deposits and occurrences.

National Geochemical Survey of Australia: Preliminary Implications for Exploration
Zn TOS (<75 μm)Zn TOS (<75 μm)
Figure 48. Classification of NGSA catchments based on the CA fractal plot (Figure 46) and derived threshold values (Table 1) for Zn Total concentrations in TOS samples (<75 µm fraction) overlain on Zn deposits and occurrences.
65

National Geochemical Survey of Australia: Preliminary Implications for Exploration
Zn BOS (<2 mm)Zn BOS (<2 mm)
Figure 49. Classification of NGSA catchments based on the CA fractal plot (Figure 46) and derived threshold values (Table 1) for Zn Total concentrations in BOS samples (<2 mm fraction) overlain on Zn deposits and occurrences.
66
National Geochemical Survey of Australia: Preliminary Implications for Exploration
Zn BOS (<75 μm)Zn BOS (<75 μm)
Figure 50. Classification of NGSA catchments based on the CA fractal plot (Figure 46) and derived threshold values (Table 1) for Zn Total concentrations in BOS samples (<75 µm fraction) overlain on Zn deposits and occurrences.
67

National Geochemical Survey of Australia: Preliminary Implications for Exploration
68
TOS coarse
0%
5%
10%
15%
20%
1 2 3 4 5Class
De
po
sit
s
TOS fine
0%
5%
10%
15%
20%
1 2 3 4 5Class
Dep
osi
ts
BOS coarse
0%
5%
10%
15%
20%
1 2 3 4 5Class
Dep
osi
ts
BOS fine
0%
5%
10%
15%
20%
1 2 3 4 5Class
Dep
osi
tsTOS coarse
0%
20%
40%
60%
1 2 3 4 5Class
Min
eral
occ
urr
ence
s
TOS fine
0%
20%
40%
60%
1 2 3 4 5Class
Min
eral
occ
urr
ence
s
BOS coarse
0%
20%
40%
60%
1 2 3 4 5Class
Min
eral
occ
urr
ence
s
BOS fine
0%
20%
40%
60%
1 2 3 4 5Class
Min
eral
occ
urr
ence
s
a)
d)
c)
b)
TOS coarse
0%
5%
10%
15%
20%
1 2 3 4 51 2 3 4 5Class
De
po
sit
s
TOS fine
0%
5%
10%
15%
20%
1 2 3 4 51 2 3 4 5Class
Dep
osi
ts
BOS coarse
0%
5%
10%
15%
20%
1 2 3 4 51 2 3 4 5Class
Dep
osi
ts
BOS fine
0%
5%
10%
15%
20%
1 2 3 4 51 2 3 4 5Class
Dep
osi
tsTOS coarse
0%
20%
40%
60%
1 2 3 4 51 2 3 4 5Class
Min
eral
occ
urr
ence
s
TOS fine
0%
20%
40%
60%
1 2 3 4 51 2 3 4 5Class
Min
eral
occ
urr
ence
s
BOS coarse
0%
20%
40%
60%
1 2 3 4 51 2 3 4 5Class
Min
eral
occ
urr
ence
s
BOS fine
0%
20%
40%
60%
1 2 3 4 51 2 3 4 5Class
Min
eral
occ
urr
ence
s
a)
d)
c)
b)
Figure 51. Percentage of catchments within a given Class (see Table 1) that contain known Zn deposits (red, left column) or occurrences (white, right column) for Zn Total concentrations in TOS samples (<2 mm fraction) (a) and (<75 µm) (b) and in BOS samples (<2 mm fraction) (c) and (<75 µm) (d). Discrete field models seem to be a useful tool for data visualisation and correlation with the known mineral deposits/occurrences. Further analysis should include correlation of the observed spatial relationships with the nature of the geographical landscape (namely, erosional versus depositional environments) and solid geology.

National Geochemical Survey of Australia: Preliminary Implications for Exploration
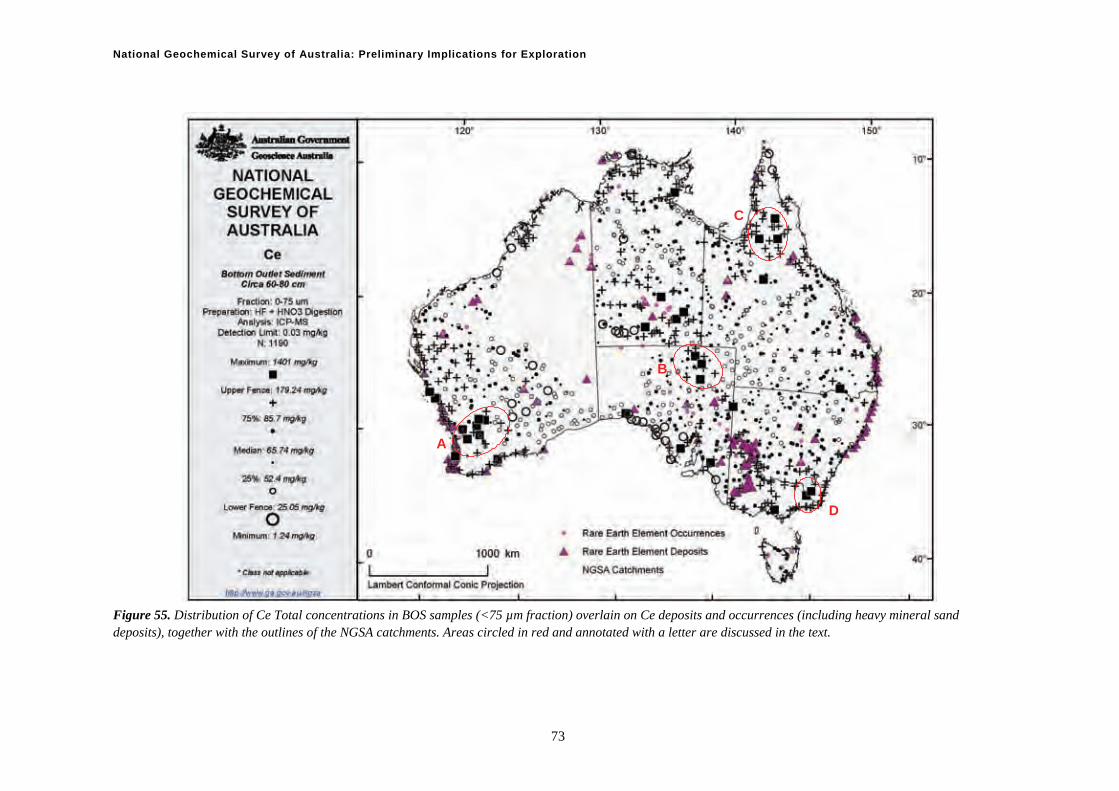
RARE EARTH ELEMENTS Figures 52-55 show the NGSA data for Ce Total concentrations (an important REE in Australia; Hoatson et al., 2011) in the four depth/grain-size fraction samples and the NGSA catchment boundaries, overlain on Ce mineral deposits and occurrences. As for Th, most REEs deposits or occurrences correlate with elevated Ce concentrations in the NGSA samples, except, mainly, the mineral sands of the east coast of Australia. On the other hand, a few areas that are not spatially associated with known REE or heavy mineral sands deposits or occurrences are shown by the geochemical maps. These include the southwestern part of the Yilgarn Craton (area A in Figure 55), the northeastern part of South Australia (B) which shows up only in the fine-grained samples (as discussed above), the southern part of the Cape York Peninsula (C), and the southeastern corner of New South Wales (D).
69

70
ational Geochemical Survey of Australia: Preliminary Implications for Exploration
Fd
igure 52. Distribution of Ce Total concentrations in TOS samples (<2 mm fraction) overlain on Ce deposits and occurrences (including heavy mineral sand eposits), together with the outlines of the NGSA catchments.
N

National Geochemical Survey of Australia: Preliminary Implications for Exploration
Figure 53. Distribution of Ce Total concentrations in TOS samples (<75 µm fraction) overlain on Ce deposits and occurrences (including heavy mineral sand deposits), together with the outlines of the NGSA catchments.
71

National Geochemical Survey of Australia: Preliminary Implications for Exploration
Figure 54. Distribution of Ce Total concentrations in BOS samples (<2 mm fraction) overlain on Ce deposits and occurrences (including heavy mineral sand deposits), together with the outlines of the NGSA catchments.
72
National Geochemical Survey of Australia: Preliminary Implications for Exploration
B
A
D
C
Figure 55. Distribution of Ce Total concentrations in BOS samples (<75 µm fraction) overlain on Ce deposits and occurrences (including heavy mineral sand deposits), together with the outlines of the NGSA catchments. Areas circled in red and annotated with a letter are discussed in the text.
73
National Geochemical Survey of Australia: Preliminary Implications for Exploration
74
Discussion and Conclusion The preliminary interpretations presented here are based on the simple visual analysis of proximity (or coincidence) of known mineral deposits and occurrences with catchments exhibiting elevated concentrations in the commodity (or other relevant) elements. For the commodities discussed, namely U, Th, Au, Cu, Pb, Zn and Ce, it is overwhelmingly the case that the NGSA samples have elevated concentrations (75th percentile or greater) in many catchments containing known mineral deposits and occurrences. This elevated geochemical signal can originate from several sources, including mechanical transport and deposition of sediment containing fresh, weathered or alteration grains and minerals from an ore body zone. In this case, the geochemical anomaly may be significantly displaced down-catchment relative to its source. Another potential source is that chemical elements have migrated upward through the regolith and accumulated at the surface. A number of processes have been discussed in the geochemical literature to account for this type of secondary migration (e.g., Cameron et al., 2004; Mann et al., 2005), and they include chemical elements moving by advection and diffusion in the interstitial water phase (groundwater/pore water) (e.g., Govett et al., 1976; Taufen, 1997), as gases in the unsaturated zone (e.g., Wang et al., 2008; Cao et al., 2009), via the root system of plants (e.g., Cohen et al., 1999; Dunn 2007), or due to electro-chemical currents generated above sulfide ore bodies (e.g., Hamilton, 1998; Smee, 1998) or even caused by lightning strikes (e.g., Garnett, 2005). A third model of genesis for surface anomalies around known mineralisation is the deposition of dust from mining, especially in the case of open-pit mining. This equates to anthropogenic contamination by enhancement of a natural geochemical anomaly (an ore body) by human interference (the mining of the ore body). It is premature in this preliminary comparison of NGSA results with the distribution of mineral occurrences and deposits to draw definite and site-specific conclusions as to the origin of all the elevated geochemical signatures observed in the data. It is clear, however, that elevated concentrations are associated with many mineral deposits and occurrences, some developed as open-pit, others developed underground only, and yet others that are only prospects where little site disturbance has taken place. In addition, where this association is observed in the deeper BOS sample, it is less likely that mining-generated dust plays a significant role in explaining elevated concentrations. Further, if dust was a dominant mode of geochemical dissemination responsible for the anomalies observed in the NGSA data, it would be expected that major transport routes (road or rail) would cause linear patterns in the geochemical maps; none has been observed to date. This suggests that contamination from mining operations is not a dominant process explaining the observed spatial associations. This leaves natural geochemical dispersion, mechanical, hydromorphic, gaseous, electro-chemical, biogenic or otherwise, as the obvious dominant process explaining much or most of the observed juxtaposition of elevated geochemical concentrations in catchments where known mineral deposits or occurrences exist. A corollary of this conclusion is that the NGSA data can be useful in determining catchments and areas where no mineral deposits or occurrences exist but that may have an elevated potential for discovery given a high geochemical concentration in one or several elements. Several such areas have been identified in this document. The new national, pre-competitive geochemical dataset that the NGSA represents has therefore the potential to be of assistance for opening up greenfield areas to exploration, or highlighting the potential of established brownfields for commodities other than those conventionally explored for or exploited there. Further, more detailed work interpreting the geochemical dataset in terms of energy and mineral exploration will be presented elsewhere.

National Geochemical Survey of Australia: Preliminary Implications for Exploration
Acknowledgments The authors are extremely grateful to the Australian government for funding the Onshore Energy Security Program, to the land owners for allowing access to the sampling sties, to the teams from the States and Northern Territory geoscience agencies for collecting the samples in the field, to Geoscience Australia staff for assisting with sample preparation and analysis as well as visualisation and reviews, and to the external laboratories for performing the additional analyses.
75
National Geochemical Survey of Australia: Preliminary Implications for Exploration
References Baldwin, B., 2007. Zeroing in on Australia's onshore energy and minerals, Department of Industry
Tourism and Resources Media Release, 2 March 2007. Available at: http://parlinfo.aph.gov.au/parlInfo/download/media/pressrel/GYKM6/upload_binary/gykm63.pdf;fileType=application%2Fpdf#search=%22Zeroing%20in%22
Caritat, P. de, Lech, M., Jaireth, S., Pyke, J. & Lambert, I., 2005. Riverina geochemical survey – A National First. AusGeo News, 78. Available at: http://www.ga.gov.au/ausgeonews/ausgeonews200506/geochem.jsp
Caritat, P. de, Lech, M.E., Jaireth, S., Pyke, J. & Fisher, A., 2007. Riverina Region Geochemical Survey, Southern New South Wales and Northern Victoria. Cooperative Research Centre For Landscape Environments and Mineral Exploration Open File Report, 234, 843 pp. + CD-ROM. Available at: http://crcleme.org.au/Pubs/OFRSindex.html
Caritat, P. de, Lech, M.E. & Kernich, A., 2008a. Gawler Region Geochemical Survey, South Australia. Cooperative Research Centre For Landscape Environments and Mineral Exploration Open File Report, 211, 987 pp. + CD-ROM. Available at: http://crcleme.org.au/Pubs/OFRSindex.html
Caritat, P. de, Lech, M.E. & McPherson, A.A., 2008b. Geochemical mapping ‘down under’: selected results from pilot projects and strategy outline for the National Geochemical Survey of Australia. Geochemistry: Exploration, Environment, Analysis, 8, 301-312.
Caritat, P. de, Minty, B. & Raymond, O., 2008c. New national geoscience datasets in Australia: geology, geophysics and geochemistry. Explore (Newsletter for the Association of Applied Geochemists), 141, 1-2, 4-8, 10-11.
Caritat, P. de, Cooper, M., Lech, M., McPherson, A. & Thun, C., 2009. National Geochemical Survey of Australia: Sample Preparation Manual. Geoscience Australia Record, 2009/08, 28 pp. Available at: https://www.ga.gov.au/products/servlet/controller?event=GEOCAT_DETAILS&catno=68657
Caritat, P. de, Cooper, M., Pappas, W., Thun, C. & Webber, E., 2010. National Geochemical Survey of Australia: Analytical Methods Manual. Geoscience Australia Record 2010/15, 22 pp. Available at: https://www.ga.gov.au/products/servlet/controller?event=GEOCAT_DETAILS&catno=70369
Caritat, P. de, Cooper, M. & Wilford, J., 2011. The pH of Australian soils: field results from a national survey. Soil Research, 49, 173-182.
Caritat, P. de & Cooper, M., 2011a. National Geochemical Survey of Australia: The Geochemical Atlas of Australia. Geoscience Australia Record, 2009/20, 557 pp, in press.
Caritat, P. de & Cooper, M., 2011b. National Geochemical Survey of Australia: Data Quality Assessment. Geoscience Australia Record, 2009/21, 478 pp, in press.
Caritat, P. de & Lech, M.E., 2007. Thomson Region Geochemical Survey, Northwestern New South Wales. Cooperative Research Centre For Landscape Environments and Mineral Exploration Open File Report, 145, 1021 pp. + CD-ROM. Available at: http://crcleme.org.au/Pubs/OFRSindex.html
Cameron, E.M., Hamilton, S.M., Leybourne, M.I., Hall, G.E.M. & McClenaghan, M.B., 2004. Finding deeply buried deposits using geochemistry. Geochemistry: Exploration, Environment, Analysis, 4: 7-32.
Cao, J., Hu, R., Liang, Z. & Peng, Z., 2009. TEM observation of geogas-carried particles from the Changkeng concealed gold deposit, Guangdong Province, South China. Journal of Geochemical Exploration, 101: 247-253.
Carranza, E.J.M., 2009. Geochemical Anomaly and Mineral Prospectivity Mapping in GIS. Handbook of Exploration and Environmental Geochemistry, 11, 351 pp.
Carranza, E.J.M., 2010. Mapping of anomalies in continuous and discrete fields of stream sediment geochemical landscapes. Geochemistry: Exploration, Environment, Analysis, 10, 171-187.
76
National Geochemical Survey of Australia: Preliminary Implications for Exploration
Chao, T.T., 1984. Use of partial dissolution techniques in geochemical exploration. Journal of Geochemical Exploration, 20, 101-135.
Cheng, Q., 1999. Spatial and scaling modelling for geochemical anomaly separation. Journal of Geochemical Exploration, 65, 175-194.
Cheng, Q., Agterberg, F.P. & Ballantyne, S.B., 1994. The separation of geochemical anomalies from background by fractal methods. Journal of Geochemical Exploration, 54, 109-130.
Cohen, D.R., Silva-Santisteban, Rutherford, N.F., Garnett, D.L. & Waldron, H.M., 1999. Comparison of vegetation and stream sediment geochemical patterns in northeastern New South Wales. Journal of Geochemical Exploration, 66: 469-489.
Cooper, M., Caritat, P. de, Burton, G., Fidler, R., Green, G., House, E., Strickland, C., Tang, J. & Wygralak, A., 2010. National Geochemical Survey of Australia: Field Data. Geoscience Australia Record 2010/18, 93 pp. Available at: https://www.ga.gov.au/products/servlet/controller?event=GEOCAT_DETAILS&catno=70478
Cornelius, M., Robertson, I.D.M., Cornelius, A.J. & Morris, P.A., 2008. Geochemical mapping of the deeply weathered western Yilgarn Craton of Western Australia, using laterite geochemistry. Geochemistry: Exploration, Environment, Analysis, 8, 241-254.
Dunn, C.E., 2007. Biogeochemistry in Mineral Exploration. Handbook of Exploration and Environmental Geochemistry, Volume 9. Elsevier Science B.V.
Ewers, G.R., Evans, N., & Hazell, M., (Kilgour, B., compiler), 2002. OZMIN Mineral Deposits Database. Digital Datasets, Geoscience Australia. Available at: http://www.ga.gov.au/meta/ANZCW0703003393.html
Garnett, D., 2005. Element mobility in transported overburden - Are we looking in the wrong direction? Explore (Newsletter for the Association of Applied Geochemists), 127: 3-5.
Garrett, R.G., Reimann, C., Smith, D.B. & Xie, X., 2008. From geochemical prospecting to international geochemical mapping: a historical overview. Geochemistry: Exploration, Environment, Analysis, 8, 205-217.
Govett, G.J.S., Goodfellow, W.D. & Whitehead, R.E.S., 1976. Experimental aqueous dispersion of elements around sulfides. Economic Geology, 71: 925-940.
Greenberg, A.E., Clesceri, L.S. & Eaton, A.D. (Eds), 1992. Standard Methods for the Examination of Water and Wastewater. American Public Health Association, 18th Edition. Washington, USA.
Hamilton, S.M., 1998. Electrochemical mass-transport in overburden: a new model to account for the formation of selective leach geochemical anomalies in glacial terrain. Journal of Geochemical Exploration, 63: 155-172.
Hoatson, D.M., Jaireth, S. & Miezitis, Y., 2011. The major rare-earth-element deposits of Australia: geological setting, exploration, and resources. Geoscience Australia, 204 pp.
Johnson, J., 2006. Onshore Energy Security Program underway. AusGeo News, 84. Available at: http://www.ga.gov.au/ausgeonews/ausgeonews200612/onshore.jsp
Lech, M. & Caritat, P. de, 2007. Regional geochemical study paves way for national survey – Geochemistry of near-surface regolith points to new resources. AusGeo News, 86. Available at: http://www.ga.gov.au/ausgeonews/ausgeonews200706/geochemical.jsp
Lech, M.E., Caritat, P. de & McPherson, A.A., 2007. National Geochemical Survey of Australia: Field Manual. Geoscience Australia Record, 2007/08, 53 pp. Available at: https://www.ga.gov.au/products/servlet/controller?event=GEOCAT_DETAILS&catno=65234
Mann, A.W., Birrell, R.D., Fedikow, M.A.F. & Souza, H.A.F. de, 2005. Vertical ionic migration: mechanisms, soil anomalies, and sampling depth for mineral exploration. Geochemistry: Exploration, Environment, Analysis, 5: 201-210.
Minty, B., Franklin, R., Milligan, P., Richardson, M. & Wilford, J., 2009b. The radiometric map of Australia. Exploration Geophysics, 40, 325-333.
Minty, B.R.S., Franklin, R., Milligan, P.R., Richardson, L.M. & Wilford, J., 2009a. Radiometric Map of Australia (First Edition), scale 1:5 000 000. Geoscience Australia, Canberra. Available at: http://www.ga.gov.au/minerals/projects/current-projects/awags.html
77
National Geochemical Survey of Australia: Preliminary Implications for Exploration
78
Morris, P.A., Coker, J. & Faulkner, J.A., 1998. Geochemical Mapping of the Mount Egerton 1:250 000 sheet. Department of Minerals and Energy, Geological Survey of Western Australia. Regolith Geochemistry Explanatory Notes.
Parks, G.A. & Pohl, D.C., 1988. Hydrothermal solubility of uraninite. Geochimica et Cosmochimica Acta, 52: 863-875.
Pyke, J., 2000. Minerals laboratory staff develops new ICP-MS preparation method. AGSO Research Newsletter, December 2000, 12-14. Available at: http://www.ga.gov.au/pdf/Corp0026.pdf
Smee, B.W., 1998. A new theory to explain the formation of soil geochemical responses over deeply covered gold mineralization in arid environments. Journal of Geochemical Exploration, 61: 149-172.
Smith, D.B. & Reimann, C., 2008. Low-density geochemical mapping and the robustness of geochemical patterns. Geochemistry: Exploration, Environment, Analysis, 8, 219-227.
Taufen, P.M., 1997. Ground waters and surface waters in exploration geochemical surveys. Exploration Geochemistry. In: Gubins, A.G. (ed), ‘Proceedings of Exploration 97: Fourth Decennial International Conference on Mineral Exploration’: 271-284.
Wang, M.Q., Gao, Y.Y. & Liu, Y.H., 2008. Progress in the collection of Geogas in China. Geochemistry: Exploration, Environment, Analysis, 8: 183-190.
Wilford, J., Caritat, P. de, Minty, B. & Cooper, M. 2011. National Geochemical Survey of Australia: Comparison of Geochemical and Airborne Radiometric Data. Geoscience Australia Record, in press.