national bureau of economic research ... for success? the effect of school uniforms on student...
TRANSCRIPT

NBER WORKING PAPER SERIES
DRESSED FOR SUCCESS? THE EFFECT OF SCHOOL UNIFORMS ON STUDENTACHIEVEMENT AND BEHAVIOR
Elisabetta GentileScott A. Imberman
Working Paper 17337http://www.nber.org/papers/w17337
NATIONAL BUREAU OF ECONOMIC RESEARCH1050 Massachusetts Avenue
Cambridge, MA 02138August 2011
We gratefully acknowledge funding and support from the American Education Finance AssociationNew Scholars Award. We also thank Aimee Chin, Steven Craig, Julie Berry Cullen, Chinhui Juhn,Melinda Sandler Morrill, Stuart Rosenthal, two anonymous referees and seminar and conference participantsat the Institute for Research on Poverty Summer Research Workshop, University of California - SanDiego, University of Texas at Dallas, University of Houston Center for Public Policy, Texas CampEconometrics, as well as the American Education Finance Association and Southern Economic Associationannual meetings. Finally, we thank Mykhailo Sitiuk for excellent research assistance. The views expressedherein are those of the authors and do not necessarily reflect the views of the National Bureau of EconomicResearch.¸˛
NBER working papers are circulated for discussion and comment purposes. They have not been peer-reviewed or been subject to the review by the NBER Board of Directors that accompanies officialNBER publications.
© 2011 by Elisabetta Gentile and Scott A. Imberman. All rights reserved. Short sections of text, notto exceed two paragraphs, may be quoted without explicit permission provided that full credit, including© notice, is given to the source.

Dressed for Success? The Effect of School Uniforms on Student Achievement and BehaviorElisabetta Gentile and Scott A. ImbermanNBER Working Paper No. 17337August 2011JEL No. I21
ABSTRACT
Uniform use in public schools is rising, but we know little about how they affect students. Using aunique dataset from a large urban school district in the southwest United States, we assess how uniformsaffect behavior, achievement and other outcomes. Each school in the district determines adoption independently,providing variation over schools and time. By including student and school fixed-effects we find evidencethat uniform adoption improves attendance in secondary grades, while in elementary schools theygenerate large increases in teacher retention.
Elisabetta GentileUniversity of Houston204 McElhinney HallHouston, TX [email protected]
Scott A. ImbermanDepartment of EconomicsUniversity of Houston204 McElhinney HallHouston, TX 77204and [email protected]
An online appendix is available at:http://www.nber.org/data-appendix/w17337

1 Introduction
In 1996, the US Department of Education found that only 3% of public schools required
uniforms. As a result of this and in the belief that uniforms make “schoolrooms more orderly
[and] more disciplined,” President Clinton and the Department of Education encouraged
schools to adopt uniforms (Mitchell, 1996). This led to substantial growth in the use of
uniforms in public schools. By 2005 uniform adoption had more than quadrupled as it
spread to 14% of public schools.2 Today, many large school districts have some schools
that require students to wear uniforms. Most notably Philadelphia public schools require all
students to wear uniforms while New York City, Long Beach, and Dallas require uniforms in
pre-secondary grades. Other large school districts, including Miami-Dade, Houston, Chicago,
and Boston, permit individual schools to adopt uniforms.
Despite their widespread use and even though politicians and administrators specifi-
cally cite improvements in discipline and achievement as justifications for uniform adoption
(Archibold, 1998; Los Angeles Daily News, 2009; Steinberg, 1998), the effects of uniforms on
students remain unclear. In addition, proponents of uniforms suggest that the largest im-
pacts may be on non-cognitive skills such as self esteem and discipline. Recently researchers
have established that non-cognitive skill formation is an important part of education and
may be just as important a determinant of students’ future social and employment success as
academic ability (Heckman and Rubinstein, 2001; Heckman, Stixrud and Urzua, 2006; Im-
berman, 2011; Jacob, 2002; Segal, 2009).
In this paper, we identify the impact of uniforms on student achievement, attendance and
behavior using student-level panel data from a large urban school district in the southwest
United States (LUSD-SW). Since schools in LUSD are free to set their own uniform policies
and most schools adopt uniforms during the time period for which we have data, we are
able to produce causal estimates of uniform impacts on student outcomes through the use
of school, student and principal fixed-effects.
2US Department of Education, National Center for Education Statistics
1

Theoretically it is unclear how uniforms might affect students’ achievement and behavior.
Uniforms could improve student outcomes through a few mechanisms. First, they potentially
provide direct improvements in safety by making it easy to identify unauthorized visitors to
a school, preventing the use of gang colors and insignia, and reducing theft since students
no longer bring expensive clothing items to school (Stanley, 1996). For example, the Los
Angeles Times argues that “in gang-plagued areas where wearing a certain color is enough
to set off a fight, [uniforms] create a more neutral atmosphere on campus” (Los Angeles
Times, 2009). Second,uniforms may instill respect for authority in students which, in turn,
could improve behavior and reduce classroom disruptions. Third, a concern for adolescents,
particularly girls, is that there may be substantial peer pressure to dress well which could,
in turn, lead to low self esteem if a child is unable to dress “properly” due to low income or
parental preferences. Uniforms negate much of this peer pressure by requiring students to
wear the same clothing.
Uniforms also make the process of dressing for school faster, particularly for adolescent
girls, potentially providing extra time for sleeping or studying. For example, at a high
school near Boston a senior remarks that “for some people it takes hours to get dressed. If
we had a uniform it would take three minutes” (Alspach, 2007). Finally, uniforms provide an
additional tool that administrators and teachers can use for discipline by providing students
with rewards of “uniform-free” days for good behavior.
Nonetheless, uniforms could negatively affect student outcomes. One possibility is that
the restrictiveness of uniforms induces students to become disruptive as a way to rebel against
authority or increased conformity could make school boring. Another possibility is that
improvements generated by uniforms could induce students with behavioral problems who
would otherwise have attended alternative education environments such as charter schools
or dropped out of school to remain in the public school. This could ultimately reverse
improvements from uniforms via negative peer effects (Carrell and Hoekstra, 2010; Gaviria
and Raphel, 2001; Figlio, 2007; Imberman, Kugler and Sacerdote, forthcoming). On the
2

other hand, such an impetus to remain in the public schools could also occur for high quality
students, and thus uniforms could generate a positive peer-effect in the long-run. Finally,
some research has suggested that uniforms may actually reduce self-esteem as it restricts the
ability of students to express themselves (Wade and Stafford, 2003).
There are also considerations beyond student behavior and achievement when schools
decide whether to adopt uniforms. In particular, opponents argue that uniforms restrict
students’ rights and impose financial hardships (Brunsma and Rockquemore, 1998). For
example, a recent report in Britain found that uniform costs varied by a factor of 10 and
climbed as high as £200 (BBC, 2003). While most schools with uniform policies in the US
provide subsidies to low-income families, the remaining share of costs may still be substantial.
Despite the large growth in the use of uniforms in public schools over the past decade,
there is very little empirical research that assesses their impacts on student outcomes. Brun-
sma and Rockquemore (1998) compare students who attend schools with and without uni-
forms in a nationally representative sample of high-school students. They find little difference
in absenteeism, behavior problems, and substance abuse while uniforms correlate negatively
with test scores.3 Brunsma (2004) and Yeung (2009) conduct further analyses using similar
data and find no significant impact on behavior or achievement. Stanley (1996) finds, on the
other hand, that after Long Beach instituted uniforms behavior improved.4
A potential drawback with these studies is that they rely on cross sectional variation
in uniform status.5 The exception is Stanley (1996) who compares results before and after
adoption, but in this case she is limited to a district-wide change which might be contempo-
3Bodine (2003) notes that their sample of schools that require uniforms are almost all private schools andhence the results may not apply to public schools.
4A related paper is Evans, Kremer, and Ngatia (2008) who evaluate a random lottery that gave uniformsto students in Kenya. They find improvements in attendance and, preliminarily, test scores for students whoreceive uniforms. However, while this suggests that uniforms can be effective tools at improving studentoutcomes, the context is very different from the United States. In this case the authors do not evaluatea policy change of imposing uniforms, rather they measure the impact of providing uniforms for free tostudents in schools where they are already required. This reduces the cost of education for those students,who would have had to purchase the uniforms otherwise. Thus, they are not able to evaluate the effect of achange in uniform policy.
5Yeung improves on the regression models by focusing on value-added scores rather than test-score levels.
3

raneous with general trends in behavior. Hence, the estimates are subject to bias as schools
and districts that choose to adopt uniforms may be inherently different from those that do
not. Of particular concern is that schools and districts that adopt uniforms are likely to
have lower achievement and more behavior problems than those that choose not to adopt
uniforms. In addition, students and parents may choose schools in part based on whether or
not they have uniforms. Alternatively, if uniforms have an impact on student outcomes par-
ents may respond to this by changing schools. For example, parents may treat uniforms as a
signal by administrators that they are working to improve a school. In this case, parents who
are more concerned about their children’s education would be inclined to switch to schools
with uniforms. Since parental concern is correlated with student outcomes, estimates that do
not account for this would be biased. While controlling for school and student characteristics
helps address these biases, they are very likely to be insufficient as there are many aspects of
a school’s decision to adopt uniforms, such as principals’ preferences for discipline and the
quality of teachers, and parents’ decisions to send their children to uniformed schools that
affect student outcomes and are inherently unobservable.
The sparseness and identification difficulties of the prior literature provide an unclear
picture of how uniforms affect student outcomes. To fill this gap in the literature, we address
the selection problem by exploiting the panel nature of our data. As such, we include student
and school fixed-effects in our models. These account for unobservable characteristics of
students and schools themselves that are correlated with uniform status and fixed over time.
We also provide models that further control for principal fixed-effects. These help account
for uniform adoption that is correlated with the disciplinary preferences of school leaders.
Using this strategy we are able to provide, to our knowledge, the first causal estimates of the
impact of uniforms on achievement, attendance, behavior, retention and school switching.
We also investigate whether uniforms affect teacher attrition, which has become increasingly
problematic in urban schools.6
6See e.g. Boyd, Lankford Loeb, Ronfeldt and Wyckoff (2010); Clotfelter, Glennie, Ladd and Vidgor(2008); Feng (2010); Rivkin, Hanushek and Kain (2005); and Watlington, Shockley, Guglielmino, and Felsher
4

In contrast to most of the prior literature we find that uniforms generate improvements
in attendance in middle and high/school. The attendance results are particularly strong
for girls. We also find that uniforms significantly reduce teacher attrition in elementary
schools. Nonetheless, uniforms have little impact otherwise. We find no statistically signif-
icant effect on disciplinary infractions, achievement, grade retention or student movements
between schools. Hence, overall we conclude that the effects of uniforms are minimal with
the exceptions of attendance for middle and high-school students and teacher attrition in
elementary schools. Although we cannot completely rule out that other contemporaneous
policy enactments generate the attendance and teacher attrition effects rather than uniforms,
the robustness of our estimates to the inclusion of principal fixed-effects, the finding that
our estimates are similar when we account for adoption under new principals, and the lack
of any increase in disciplinary infractions even in the short term suggest that the results are
unlikely to be due to concurrent changes in enforcement policies.
2 Uniforms in LUSD-SW
LUSD is an urban school district with more than 200,000 students and close to 300 schools,
making it one of the largest in the country. The district has substantial poverty - 59% of
students qualified for free or reduced-price lunch in 2006-07. Like other urban school districts
it is also heavily minority - 59% of students are Hispanic and 29% are African-American.
Parents of students in LUSD have a number of choice options which could allow students to
move in response to uniform policies. First, LUSD itself has a large magnet program. Second,
the LUSD area has a substantial number of charter schools and private schools. In 2004-05
state charter schools near to or within LUSD’s boundaries had a population equal to 9% of
LUSD’s enrollment. LUSD is also surrounded by many suburban school districts.7 Given
these characteristics of the district, we will consider how uniforms affect student movements
(2010).7Eleven districts directly border LUSD.
5

in addition to test scores, attendance, retention and behavior.
LUSD has permitted its schools to require students to wear uniforms since at least 1992.8
Initially, only a handful of schools required uniforms. However, uniform adoption grew
substantially over the following 13 years. Of schools that responded to our survey of uniform
policies, which we describe in more detail below, only 10% required uniforms in 1993. By
2006, 82% of these schools required uniforms. In addition, no schools abandoned uniforms
after adoption. These characteristics suggest that parents and school administrators in LUSD
generally believe that uniforms are helpful.
Schools are given wide latitude by LUSD in designing their uniform policies. Nonetheless,
while certain characteristics of school uniforms vary across schools, such as color choices and
whether a specific shirt purchased from the school is required, the policies are very similar.
As of the 2007-08 school year, all schools that require uniforms mandate specific colors and
styles for both shirts and pants. Almost all of these schools specify between 1 and 3 colors
for shirts, and casual or denim pants in khaki or navy colors. Some schools specifically limit
students to wearing polo style shirts. Only a handful of schools require students to purchase
specific shirts with a school logo. Some middle and high schools also require different grades
to wear assigned colors. The most common uniform includes a polo style shirt in one of the
school’s colors combined with khaki, denim, or navy pants. Girls are generally given the
option of wearing pants or skirts.9
8The earliest any school required uniforms was in 1968, but this was a school operating under contractwith LUSD rather than being directly run by LUSD. Of LUSD’s own schools, the earliest date provided inour survey of uniform policies was 1992.
9Disobeying a mandatory uniform policy is considered a “level II” disciplinary infraction, which requiresintervention by a school administrator. Such a violation can result in a variety of punishments dependingon the severity of the infraction and the student’s prior behavior. These can range from a call to thestudent’s parent to in-school suspension, although the administrator is given discretion to increase or reducethe punishment beyond this range if necessary. Repeated violations can result in out-of-school suspensionor placement in a disciplinary alternative education center.
6

3 Empirical Strategy
The primary concern with an analysis of the effects of school uniforms on student outcomes
is that schools and districts choose whether or not to adopt uniforms. As a result uniform
adoption is likely correlated with unobservable characteristics of the school that could affect
student performance, such as neighborhood characteristics or parental involvement in the
school. If this is the case, then naıve OLS estimates will be biased. The selection process
is further complicated by the possibility that schools adopt uniforms in response to existing
achievement and behavior levels or even trends in student outcomes. For example, schools
may decide to adopt uniforms in response to increasing discipline problems. In addition,
parents and students may respond to uniform policies by changing schools.
We can model this framework as
Yijt = α + βUniformjt + XijtΩ + γi + δj + εijt. (1)
where Yijt is an outcome for student i in school j and academic year t, Uniform is an
indicator for whether or not the student has to wear a uniform, X is a set of student char-
acteristics and grade-by-year fixed-effects. While we use this model to measure behavioral
impacts such as attendance and discipline as well as grade retention and school switching, as
is standard in education production models we look at the impact on changes in achievement
via a restricted value-added model. Hence for achievement models the dependent variable is
Yijt−Yij,t−1. γ, δ and ε are error terms where γ varies over students but not schools or time,
δ varies over schools but not students or time, and ε varies over schools, students and time.
Ideally we would want Uniform to be uncorrelated with γ, δ, and ε, but due to the reasons
described above this is unlikely. Table 1 provides some evidence for this. Using the first
year of our data, 1993, we provide characteristics of schools by whether they never adopt
uniforms, are early adopters, or are late adopters of uniforms. While schools that adopt
late are generally similar to those that adopt early, schools that never adopt uniforms have
7

statistically significantly higher achievement, lower free lunch eligibility rates, and smaller
minority populations.
Thus, a simple regression that compares schools with uniforms to those without uniforms
will likely be biased. The availability of panel data where schools adopt uniforms at different
times and students move between schools with and without uniforms allows us to use student
and school fixed-effects to address this concern. This procedure accounts for any unobserved
characteristics of students and schools that may affect the school’s decision to adopt uniforms,
the parents’ decision to move their child to a school with uniforms, and student outcomes,
as long as these characteristics do not vary over time. Thus, we correct for omitted variables
such as parents’ preferences for discipline, students’ innate tendencies to misbehave, student
ability, and schools’ long-term problems with discipline and test scores.
Hence, in our model bias remains only if students select into uniformed schools or schools
adopt uniforms based on time-varying characteristics. To test the validity of this strategy, we
will provide event-study analyses that track student outcomes in each year before and after
uniform adoption, so that we might identify if there is any evidence of additional trending
after controlling for the fixed-effects. Since uniforms may have different impacts by gender
and grade level, we conduct all of our analyses separately for males and females and for
elementary (grades 1 - 5) and middle/high school (6 - 12) grades as well as providing pooled
estimates. Further, we estimate variations on the model in equation (1) to look at different
effects by student race, economic status and achievement. In addition, we test whether
uniform effects vary by student characteristics given the student is in a school with other
students like him or her - i.e. does the effect on black students in a heavily black school
differ from black students in a heavily white and Hispanic school?.
A second concern is that uniform adoption by a school may be part of a wider pol-
icy change. Of particular concern is that uniforms may be implemented concurrently with
changes in discipline enforcement. To the extent that this is true, then our estimates rep-
resent the reduced-form impact of such a policy combined with uniform adoption. Unfortu-
8

nately there is no way to test for this directly, since enforcement enhancements - as well as
other policy changes - are unobservable.
While we cannot fully rule out that our estimates pick up the effects of other policies
that are adopted contemporaneously with uniforms, we nonetheless provide some analyses
that assess the extent to which changes in policy may be affecting our estimates. First, we
conduct regressions that include principal fixed-effects. This addresses the possibility that
principals who are strict disciplinarians may be more inclined to adopt uniforms or when
certain principals consistently institute a set of policies combined with uniforms in different
schools. Results using this model are similar to our baseline estimates. Our second test
is to interact uniform status with whether a school’s uniform is adopted during the first
two years of a principal’s term. This addresses the possibility that some schools respond
to worsening behavior by bringing in a new principal who includes uniforms as part of a
package of reforms. In addition, new principals may be more willing to experiment with
different strategies, including uniforms. If these phenomena were driving our estimates we
would expect to see statistically significantly different impacts for uniforms adopted early in
a principal’s term relative to later. While we do find that new principals who adopt uniforms
have higher infraction rates than old principals, there is no statistically significant difference
in achievement gains or attendance. Finally, and perhaps most importantly, when we break
down infractions into those resulting in an in-school suspension and those resulting in an
out-of-school suspension, we find no significant impact on either type of punishment. Nor
do we find statistically significant changes in the rates of in-school suspensions relative to
more severe infractions in school-level regressions. If administrators increased enforcement
concurrent with uniform adoption, we would expect to see more incidences of disciplinary
infractions, at least temporarily. Hence, while we cannot rule out the possibility that en-
forcement plays a role in our results, these tests suggest that such a story is unlikely.
9

4 Data
In this paper we utilize two sources of data from a large urban school district in the southwest
United States (LUSD-SW). The first is a set of administrative records for students in LUSD
from 1993 through 2006.10 This data includes student demographics, test scores, disciplinary
records and attendance records for every student in LUSD. Testing data include students’s
scaled scores on the Stanford Achievement Test (9th & 10th editions) which we standardize
within grade and year.11 The Stanford Achievement Test is a nationally normed standardized
exam that LUSD administers annually in grades 1 through 11. The exams are “low stakes” in
the sense that they do not count towards state accountability requirements or requirements
of the Federal “No Child Left Behind” Act. However, students do need to achieve minimum
scores on the reading and math portions to advance to the next grade. Discipline data
includes any infraction that results in an in-school suspension or more severe punishment.
Attendance records include the attendance rate for each student. Test score data is only
available starting in 1998-99, hence while we use all years for estimates of the impacts on
attendance, discipline, grade retention, school switching and the likelihood of leaving LUSD,
we must restrict our analysis to 1998-99 and later for test score analyses.
Unfortunately, LUSD does not keep centralized records of when schools adopted uniforms.
Thus, we emailed and mailed a survey to the principal of each school in LUSD with the
following questions in the fall of 2007:
• Does your school currently require students to wear uniforms? Note that we define
a uniform as any outfit where a particular style of shirt (i.e. polo) and bottom (i.e.
khaki, skirt, etc.) and a specified color are required.
10Since the data used in this study are confidential, researchers interested in replication studies or accessto the data for other reasons should contact the authors to be informed of the district identity. In orderto access the data the researchers will be required to submit a research proposal to LUSD’s research office.Upon receiving written approval from LUSD we will provide the data directly to the requestors.
11In 2005-06 and 2006-07 LUSD received some evacuees from Hurricanes Katrina and Rita. While we keepthese students in the data, they do not contribute to the standardization. Results dropping evacuees arenearly identical.
10

• If your school currently requires uniforms, what school year did you first require them?
Were there any years since then when the requirement was suspended?
• If your school currently does not require uniforms, did you ever require them in the
past, and if so, could you please provide the years during which students were required
to wear uniforms?
We then followed up via telephone with any school that did not respond to the initial survey
or to clarify their answers. If the principal did not know the date we requested that he or
she ask his or her staff members. Data collection was completed in October, 2008.12 For the
292 schools that were in operation in the 2007-08 school year 79% were able to provide dates
of uniform adoption while the date could not be determined for 14% and 7% of the schools
refused to participate in the survey.13 Figure 1 shows the number of schools in LUSD that
require uniforms, do not require uniforms, or for which the uniform requirements could not
be determined. Since our survey was based off of schools existing in 2007-08 earlier years
have higher rates of unknown uniform status than later years. Nonetheless, it is clear that
number of schools requiring uniforms increased substantially over the course of the sample.
Since we use school fixed-effects to help identify the uniform impact it is also important to
know how many schools switch to requiring uniforms over the course of the sample. From
1993-04 to 2006-07 166 schools adopt uniforms. From 1999-00 through 2006-07, the period
after the first year of testing data, 84 schools adopt uniforms. Hence there is substantial
variation in policies during the period for which we have data.14
12In some cases we were provided a range of years or a statement that uniforms had been required sincea certain date. In these cases if the dates provided were after the start of our sample period we followed upand requested that the principal ask other staff and faculty to identify specific dates of adoption. If an exactdate still could not be determined we dropped that school from our sample.
13Some schools responded that the uniform policy was adopted before a certain date. In these cases, unlessthat date was prior to the start of our data in 1993, we considered the uniform adoption date for those schoolsto be unknown. This occurs for 13 schools. In addition three schools stated that they recommended butdid not require uniforms. These schools are considered to not have a uniform for the purposes of this studysince there would be no punishment for the student if they choose not to wear the uniform.
14The LUSD data also includes 39 charter schools directly authorized by LUSD. However, while largein numbers they make up a small portion of the observations (2.4%) and only 8 changed uniform policiesduring the time-span of our data. Hence, due to the school fixed-effects very few charters contribute to theidentification. Indeed, results that exclude charter schools are very similar to our main results.
11

Table 2 provides summary statistics for students by their school’s uniform status split
by grade level. In general, uniform and non-uniform schools have similar demographics, the
exceptions being that students in middle/high grades who attend uniform schools are poorer,
students in uniformed elementary schools are more likely to be at-risk, and students in both
elementary and middle/high schools with uniforms are more likely to be Hispanic.15 In
terms of outcomes, test scores are higher in elementary non-uniform schools than in uniform
schools, albeit generally not significantly so, while for both grade levels uniform schools have
more disciplinary infractions and higher attendacne rates.
In general the schools for which we could not determine uniform policies are demograph-
ically similar to the rest of the schools in LUSD, although elementary schools have more
minority and low-income students. On the other hand, the unknown schools have consis-
tently lower test scores than schools where uniform status is known. This leads to a concern
that our results may be biased due to survey non-response. The school fixed-effects mitigate
this concern as they limit the bias to non-response based on time-varying characteristics of
schools. Nonetheless, some bias may remain. To address this we conduct inverse-probability
weighted regressions where observations are weighted by the inverse of the predicted values
from a propensity score of the likelihood of a school being included in the sample.16 Es-
timates using this procedure are very similar to our main estimates.17 Hence, it appears
unlikely that our results are affected by non-response bias.
15A student is considered at-risk if he or she is low-achieving, has previously been retained, is pregnant ora parent, is LEP, has been placed in alternative education or juvenile detention, is on parole or probation,is homeless, or has previously dropped out of school.
16We estimate a probit of being in the sample from the universe of schools in LUSD from 1993 through2006. Data is from the state education agency. We include year dummies; per-student total and instructionalexpenditures; enrollment shares by race, economic disadvantage, limited-English proficiency, vocational pro-gram, special education, bilingual education, gifted, grade level, and mobility; teacher experience, baselinesalaries, tenure, and specialization; and student-teacher ratios in the regressions. See Wooldridge (2002, pp.587-590) for a technical treatment.
17Results provided in Online Appendix Table 1. The online appendix can be found athttp://class.uh.edu/faculty/simberman.
12

5 Results
5.1 Determinants of Uniform Adoption
Before analyzing the impacts of uniforms, it is useful to understand why schools in LUSD
choose to adopt uniforms. In Table 3 we provide estimates from probit regressions of the
likelihood of adopting uniforms on mean student characteristics in a school the prior year.
In addition to the variables listed in the table, the regressions include year indicators and
controls for the share of the students in each grade level. To avoid contaminating these esti-
mates with changes induced by uniforms we exclude all school-years after uniform adoption.
These results paint a nuanced picture of the determinants of adoption depending on whether
the school is elementary or secondary. First, elementary schools appear to adopt when they
are gaining more students but with less spending per student. One possible explanation is
these schools use uniforms as a way to maintain control in the school when there are fewer
resources available for behavior monitoring. Peculiarly, however, student-teacher ratios fall
prior to adoption. The share of students who have special needs also falls. For secondary
schools, the results provide a clearer picture. The schools adopt uniforms when there is an
increase in low-income non-minority students. Adoption is also associated with having more
at-risk and special education students.
5.2 Impacts on Discipline and Attendance
Since uniform proponents often cite behavioral improvements as the main benefit of uniforms,
we start by considering the impact of uniforms on disciplinary infractions and attendance.
Table 4 provides our primary estimates of these outcomes for elementary and secondary
students, respectively. Columns (1) and (3) include school and student fixed-effects along
with controls for students’ economic status and grade-year fixed-effects. Columns (2) and
(4) provide estimates where we add principal fixed-effects.18
18LUSD principals undergo a substantial amount of churn as 14% of schools in LUSD get a new principaleach year. This common movement of principals between schools is useful for this analysis as it ensures a
13

For elementary students we find little evidence of uniforms having impacts on attendance
or disciplinary infractions.19 On the other hand, for middle and high school students, we
find significant improvements in attendance rates, particularly for females. School fixed-
effects estimates in column (3) indicate that female attendance increases by a statistically
significant 0.3 percentage points after uniform adoption. This is equivalent to an additional
12
day of school per year in a 180 day school-year. For males the point estimate is 0.2 pp
but it is not statistically significant. However, in column (4), when we add the principal
fixed-effects the estimates get larger with female and male impact estimates rising to 0.5
and 0.4 pp, respectively. These estimates are statistically significant for both genders. For
disciplinary infractions estimates for middle/high school students are similar to those for
elementary students.20
As mentioned above, a concern with these estimates is that they may be due to uni-
forms being adopted concurrently with an increase in discipline enforcement and other policy
changes. If this is the case then we may be misidentifying the uniform impact as a more
general impact of school reform. In addition to the robustness of our results to principal
fixed-effects, another piece of evidence against this concern is the lack of significant impacts
on disciplinary infractions. If uniforms are adopted along with an enhanced enforcement
policy we would expect to see an increase in infractions. However, a null finding for over-
all discipline may hide shifts in the types of punishment. In particular, we might expect
enhanced enforcement to lead to a shift towards more severe punishments. To test this,
in Table 5 we provide impact estimates of the number of in-school suspensions, the lowest
level of infraction in our data, or out-of-school suspensions a student receives.21 If there is
substantial amount of variation remains even after controlling for both principal and school fixed-effects. Wealso found that results were similar to baseline if instead of principal fixed-effects we used principal-schoolspell fixed-effects in place of school fixed-effects.
19Online Appendix Table 2A provides counts for each of the fixed-effects in these models.20Estimates for discipline and attendance using gains models are qualitatively similar with the exception of
a significant negative effect for elementary male attendance. These results are provided in Online AppendixTable 3.
21Infractions broken down by type was not collected in 1995-96 and 1996-97. In-school and out-of-schoolsuspensions account for 96% of recorded infractions. The rest are expulsions and referrals to alternativedisciplinary schools.
14
an increase in enforcement we would expect to see a shift from less severe to more severe
punishments. The results in Table 5 provide little evidence for a shift in punishments as
only one estimate is statistically significant at the 10% level and this becomes insignificant
when principal fixed-effects are added. Further, in Online Appendix Table 4 we estimates
school-level regressions of uniform status on infraction, in-school suspension, out-of-school
suspension and other infraction rates. We also estimate the impact of uniforms on the percent
of infractions in a school resulting in an in-school suspension. Only one estimate, in-school
suspension rates in middle/high schools, is statistically significant and only at the 10% level.
Finally, in Online Appendix Table 5 we conduct another test where we interact uniform
status whether the school adopts uniforms during the first two years of a principal’s term.
New principals in particular may be more likely to adopt uniforms as a part of a broader
package of school reform, hence we need to see whether our results hold while accounting
for these principals.22 While we find that when uniforms are adopted under new principals
there is a significant increase in infractions, this appears to have little impact on the overall
estimates as the main effects (e.g. the uniform impact for existing principals) are similar to
the baseline estimates for both attendance and discipline.
Another potential concern is that schools may adopt uniforms when experiencing trends
in attendance and discipline. The latter is of particular concern since schools might be
inclined to adopt uniforms in response to changes in discipline. To address this, we estimate
a variation of equation 1 where instead of using an indicator variable for whether a school
requires a uniform, we use indicators for a school being in a period 6 or more, 5, 4, 3, or 2
years prior to uniform adoption. In addition, so that we might track the evolution of uniform
effects after adoption, we include indicators for the school being in the year of adoption, and
1, 2, 3, 4 and 5 or more years after. Note that we omit one year prior to adoption so
that trends can be detected as significant deviations from that year’s estimate. The overall
impact of being a school that adopts uniforms at some time in the data is captured by the
22These models have school and student fixed-effects but no principal fixed-effects.
15
school fixed-effects. These models do not include principal fixed-effects. The results from
these event study analyses are provided in Figures 2 and 3 where the solid line shows the
coefficient estimates and the dotted lines show 95% confidence intervals.23
Figure 2 provides the event studies for attendance rates. For both elementary and mid-
dle/high schools the graphs show little evidence of pre-adoption trending. Further, we see
clear increases in attendance rates after adoption for middle/high students, although for each
given year they are not statistically significant. Nonetheless, the graph suggests that the the
significant pooled estimates provided in Table 4 are a level shift in attendance rates, rather
than a trend shift.
For disciplinary infractions, we see in Figure 3 that while there is an increase up to four
years prior to adoption for elementary schools, this flattens out afterwards indicating no
significant trending in the four years before adoption. For middle and high schools, the
infraction rates are flat throughout the period prior to adoption. After adoption, the figures
show no significant impact on infractions at any time for both grade levels. We also provide
event study figures for in-school and out of school suspensions. For elementary students
the pattern for out-of-school suspensions is similar to the overall pattern, while for in-school
suspensions there is no evidence of pre-trends and a slight but only marginally significant
uptick in later years. For middle and high school students both in-school and out-of school
suspensions show similar patterns to overall infractions in the years after adoption, but out-
of-school suspensions experience a small increasing trend prior to adoption. This suggests
that our baseline estimates may slightly understate the reduction in out-of-school suspensions
from uniforms.
In Table 6 we investigate whether the impacts (or lack thereof) on attendance and dis-
cipline vary by a student’s race or racial composition of a school and find mixed results.24
For elementary schools, African-Americans and Hispanics respond most positively in terms
23Coefficients and standard errors are provided in Online Appendix Tables 6 - 7.24The left-out category includes whites, asians, and Native Americans. Although we would normally
consider the latter two categories to be separate minorities, their sample sizes are too small to get preciseestimates at 2.9% and 0.1%, respectively. Whites account for 10.2% of the sample.
16

of attendance, particularly African-American students in schools with a higher than average
(in the district) AA population. Nonetheless, when added to the main effects, these do not
differ on net from zero and in fact, the estimates suggest that students from other races are
negatively impacted by uniforms. On the other hand, AA students experience increases in
disciplinary infractions not experienced by other races.
For middle/high students while there are no significant differences in discipline effects, the
attendance results differ sharply from those for elementary students. The results suggest that
most of the improvements in attendance accrue to students in schools that are below median
in their African-American or Hispanic populations, regardless of race. Hence uniforms appear
to be more effective in mixed-race or primarily Caucasian and Asian (the other two major
racial populations in LUSD) schools. The exception to this pattern is that AA students in
schools with high AA populations also experience improvements in attendance.
In the Online Appendix we provide a number of additional specification and heterogeneity
tests. Online Appendix Table 8 provides results when we drop schools that adopt uniforms
early (before 1994) or late (after 2004) and find qualitatively similar results. Similarly
for Appendix Table 9 where we limit the sample to students who take math, reading and
language achievement exams, although in this case we get a marginally significant increase in
middle/high discipline infractions. In Appendix Table 10 we split the elementary estimates
by grades 1 - 3 and grades 4 - 5 while middle/high estimates are split by grades 6 - 8
and 9 - 12. The results are similar to baseline. In Appendix Table 11 we provide models for
heterogeneity by economic disadvantaged status similar to those provided in Table 6 for race.
The results suggest that the attendance improvements mainly accrue to students who are
economically disadvantaged, particularly those who are in high poverty schools. Appendix
Table 12 provides estimates for middle/high students that test whether the uniform impacts
vary by fifth grade achievement where we identify achievement quartiles based on district-
wide performance. The results suggest that the attendance improvements from uniforms are
most prominent in low achieving students. Finally in Appendix Table 13 we run the same
17

analysis but use within high-school quartiles. Results are similar.
5.3 Impacts on Achievement
It is intriguing to see whether the improvements found in attendance rates spill over into
achievement. Additionally, as mentioned in the introduction, there are a number of other
reasons why uniforms may affect achievement directly. Hence, in this section we consider the
impact of uniform adoption on students’ test score outcomes. All test scores are standardized
across LUSD within year and grade, therefore estimates are provided in standard deviation
units. We also use annual changes (gains) in achievement as our outcome measures so that
we can better account for value-added of schools to the student’s performance.25
Table 7 provides our main achievement results for elementary and middle/high respec-
tively.26 The table is structured as in Table 4.27 While the estimates are generally negative,
in only one instance - elementary female reading - is the effect statistically significant. The
results are similar when we add principal fixed-effects. Hence, these results indicate that
uniforms have little impact on achievement gains.
In Figure 4 we provide event-study graphs of the impact estimates for achievement gains
similar to those provided for attendance and discipline in Figures 2 and 3.28 One poten-
tial complication highlighted in this figure is that there appears to be some evidence of
pre-adoption trends. In particular, the figures suggest that schools adopt uniforms after
achievement gains fall. However, upon closer examination these trends are not as problem-
atic as they initially seem. First, for elementary schools while there is a drop up to 3 years
prior to adoption in all three exams, achievement growth flattens and remains roughly con-
stant afterwards until uniform adoption. Hence, we can check whether this trending affects
the results by estimating models that drop all observations more than three years prior to
25Online Appendix Table 14 provides levels models for comparison.26Online Appendix Table 2B provides counts for each of the fixed-effects in these models.27We also estimated basic OLS models that control only for observable characteristics of students. These
results showed slightly negative, but insignificant correlations of uniform status with achievement gains ofup to 0.03 standard deviations. This is consistent with the findings of Yeung (2009).
28Coefficients and standard errors are provided in Online Appendix Tables 15 and 16.
18

uniform adoption. These results are provided in Online Appendix Table 17 and are similar
to the results in Table 7, indicating that the trending in those years have little effect on our
estimates. For middle schools there appears to be little evidence of trending in math or read-
ing. Nonetheless, language achievement does seem to fall consistently throughout the graph.
However, the drop-off prior to adoption is relatively small and the post-adoption estimates
suggest that uniforms did little to either counteract or exacerbate this trend. Post-adoption
achievement is relatively flat in all other cases, consistent with the results in Table 7.
As with discipline and attendance we also estimated models that interact uniform status
with whether uniforms are adopted under new principals. These are provided in Online Ap-
pendix Table 5 and show no significant difference by principal experience. We also analyze
heterogeneity by student race and school racial composition. These are provided in Online
Appendix Table 18 and do not show consistent patterns across achievement exams. Further,
we provide estimates that drop early and late adopters, limit to students who take all three
exams, estimate heterogeneous effects by grade level within elementary and middle/high
grades, interact uniform status with the student’s economic disadvantaged status and dis-
advantaged rates in the school, and interact uniform status with the student’s fifth grade
achievement quartile (middle/high only). These are provided along with the attendance and
discipline results in Online Appendix Tables 8 - 13. In general the estimates differ little from
baseline. The key exceptions are that math achievement effects are significantly higher for
students in the bottom quartile of their own school’s distribution and students who are not
disadvantaged experience some improvements in language scores.
5.4 Impacts on Student Movements, Grade Retention, and Teacher
Attrition
In Table 8 we provide impact estimates for some alternative outcomes of interest.29 A
possible explanation for the results in Table 4 is that certain types of students are more or
29Counts of fixed effects are provided in Online Appendix Table 2B
19

less likely to change schools as a result of uniforms. If this is the case, then we may have
attrition bias. However, such behavior would also be interesting in its own right as student
movements could provide insight into whether parents see uniforms as beneficial. If students
are less likely to leave a school after uniforms are adopted, this potentially shows a revealed
preference by parents for uniforms and their behavioral benefits. Hence, in panels A and B
we estimate linear probability models of whether uniforms affect the likelihood of students to
switch schools within LUSD or leave the district.30 We drop students who are in the highest
grades of their school since a school’s uniform policy would no longer apply for students who
are graduating or leaving to attend another school due to normal grade progression. Hence
including these students may lead to biased estimates.31 We find no statistically significant
impacts of uniforms on either school switching or district leaving, with the exception of a
marginally significant reduction in leaving for middle/high females when we include principal
fixed-effects. Nonetheless, this potential effect is economically small and hence overall the
results indicate that our estimates for other outcomes are unlikely to be biased due to
attrition.
In panel C we investigate whether uniforms have any impact on grade retention. Unfor-
tunately, our data does not provide us with direct measures of retention. Instead we identify
a student as having been retained if his or her grade level is less than or equal to their grade
level the prior year. Note that this limits the analysis to students who are enrolled in LUSD
both in the current and prior year. In models with school and student fixed-effects, we
find a marginally significant reduction in grade retention for males in both elementary and
middle/high schools. However, when we add principal fixed-effects, the estimates drop to
statistical insignificance. Hence, the results do not provide compelling evidence of an impact
of uniforms on grade retention.
In panel D we estimate the impact of uniforms on teacher attrition using school-year
30Leavers in middle/high also include dropouts. While it would be interesting to look at dropouts sepa-rately, our data on dropouts is unreliable due to misreporting of some dropouts as leaving for other reasons.
31Results are similar if we do not make this restriction.
20

level observations. To calculate attrition rates we identify teachers using their first and last
names. If a name does not appear in the same school the following year, we count that as
an attrition. Note that this will likely lead us calculate attrition rates that are too large as
we will count a name change as an attrition. This should only be a problem, however, if the
likelihood of a teacher changing his or her name is correlated with uniform adoption, which
we believe to be highly unlikely. In addition to school fixed-effects, the model controls for year
indicators and the share of students in the school enrolled in each grade, female, free lunch,
reduced-price lunch, other economic disadvantage, black, Hispanic, and white. The results
show a significant reduction in teacher attrition after the adoption of uniforms in elementary
schools of 5 percentage points. This is a large effect relative to the mean attrition rate of 25%.
When we add principal fixed-effects the estimate reduces to 4 percentage points but remains
significant at the 10% level. For middle school the point estimates are also negative, but
smaller and statistically insignificant. In order to investigate this result further, we provide
event study graphs in Figure 5. The figure shows a notable drop in attrition for elementary
schools during the year of uniform adoption that remains at the new level thereafter. There
is also little indication of trending prior to adoption.
6 Conclusion
Concerns about school safety and the desire by administrators to try different strategies to
improve test scores and behavior has led many schools to adopt student uniforms. However,
the current evidence on uniforms is sparse and the existing research relies on cross-sectional
variation. Since schools likely adopt uniforms in response to poor behavior or achievement
the results from this research may suffer from substantial bias.
In this paper we assess whether requiring uniforms in schools affects student outcomes
using administrative data from a large urban school district in the southwest United States.
Since schools in this district independently decide whether or not to adopt uniforms over
21

the time period for which we have data, we are able to incorporate school fixed-effects and
student fixed-effects into our regressions. This allows us to account for schools endogenously
deciding to adopt uniforms off of their fixed characteristics as well as students’ selection
into uniform schools provided that such selection is based on students’ fixed characteristics.
These corrections are very important as evidenced by the fact that while most prior work
has found uniforms to have insignificant to negative impacts, we find that uniforms have a
positive influence on student attendance in secondary grades. Attendance rates in grades
6 through 12 increase by 0.3 to 0.4 percentage points after a school adopts uniforms. On
the other hand, we find little evidence that uniforms have lasting impacts on achievement,
grade retention, or the likelihood of students switching schools or leaving the district for all
genders and grade levels.
In terms of discipline we also find little evidence of uniform effects. We note that these
results are inconsistent with an alternative theory of concurrent strengthening of enforce-
ment policies, since if this were the case we’d expect to see at least a temporary increase.
We also provide evidence from models that include principal fixed-effects to account for
the disciplinary philosophy and quality of school leadership and from models that consider
whether uniform impacts vary by whether uniforms are adopted by a principal who is new
to a school. New principals are likely to be more inclined to adopt changes in many parts of
a school besides uniform adoption and sometimes may be brought in to “shake-up” a school.
Our results are robust to both of these specifications. Nor do we find significant changes
in the severity of punishments. Hence, we believe that our estimates isolate the impacts of
uniforms from potential changes in enforcement, although we cannot rule out the possibility
that uniforms are adopted concurrently with other policies.
Finally, we find that uniforms generate significant reductions in teacher attrition in el-
ementary schools on the order of 5 percentage points. This is a large effect relative to the
mean of 25% annual attrition.
22

References
Alspach, Kyle, “Measured Look at Uniforms: Alternative to Dress Code,” Boston Globe, May
17 2007.
Anonymous, “School Uniform Costs Vary Widely,” BBC.com, May 9 2003.
, “Council Recommends Uniforms at All City Schools,” Los Angeles Daily News, November
4 2009.
, “School Uniforms – Yes, But,” Los Angeles Times, December 9 2009.
Archibold, Randal C., “Advocates of School Uniform Plan Enlist Children to Help Make Their
Case,” New York Times, February 26 1998.
Bodine, Ann, “School Uniforms, Academic Achievement, and Uses of Research,” The Journal
of Educational Research, 2003, 97 (2), 67–73.
Boyd, Don, Hamp Lankford, Susanna Loeb, Mathhew Ronfeldt, and Jim Wyckoff,
“The Role of Teacher Quality in Retention and Hiring: Using Applications to Trans-
fer to Uncovere Preferences of Teachers and Schools,” Journal of Policy Analysis and
Management, 2010, 30 (1), 88–110.
Brunsma, David L., The School Uniform Movement and What it Tells Us About American
Education, Scarecrow Education, 2004.
and Kerry A. Rockquemore, “Effects of Student Uniforms on Attendance, Behavior
Problems, Substance Abuse, and Academic Achievements,” The Journal of Educational
Research, 1998, 92 (1).
Carrell, Scott and Mark Hoekstra, “Externalities in the Classroom: How Children Exposed
to Domestic Violence Affect Everyone’s Kids,” American Economic Journal: Applied
Economics, January 2010, 2 (1), 211–228.
23

Clotfelter, Charles T., Elizabeth J. Glennie, Helen F. Ladd, and Jacob L. Vigdor,
“Teacher Bonuses and Teacher Retention in Low Performing Schools: Evidence from
the North Carolina $1800 Teacher Bonus Program,” Public Finance Review, 2008, 36
(1), 63–87.
Evans, David, Michael Kremer, and Muthoni Ngatia, “The Impact of Distributing School
Uniforms on Children’s Education in Kenya,” World Bank, mimeo, 2008.
Feng, Li, “Hire Today, Gone Tomorrow: New Teacher Classroom Assignments and Teacher
Mobility,” Education Finance and Policy, 2010, 5 (3), 278–316.
Figlio, David, “Boys Named Sue; Disruptive Children and Their Peers,” Education Finance
and Policy, Fall 2007, 2 (4), 376–394.
Gaviria, Alejandro and Steven Raphel, “School-Based Peer Effects and Juvenile Behavior,”
Review of Economics and Statistics, 2001, 83, 257–268.
Heckman, James J. and Yona Rubinstein, “The Importance of Noncognitive Skills: Lessons
from the GED Testing Program,” The American Economic Review - Papers and Pro-
ceedings, 2001, 91 (2), 145–149.
, Jora Stixrud, and Sergio Urzua, “The Effects of Cognitive and Noncognitive Abilities
on Labor Market Outcomes and Social Behavior,” Journal of Labor Economics, 2006,
24 (3), 411–482.
Imberman, Scott A., “Achievement and Behavior of Charter Students: Drawing a More Com-
plete Picture,” Review of Economics and Statistics, 2011, 93 (2), 416–435.
, Adriana D. Kugler, and Bruce I. Sacerdote, “Katrina’s Children: Evidence on
The Structure of Peer Effects from Hurricane Evacuees,” American Economic Review,
forthcoming.
24

Jacob, Brian A., “Where the Boys Aren’t: Non-Cognitive Skills, Returns to School, and the
Gender Gap in Higher Education,” Economics of Education Review, 2002, 21 (6), 589–
598.
Mitchell, Alison, “Clinton Will Advise Schools on Uniforms,” New York Times, February 25
1996.
Rivkin, Steven G., Eric A. Hanushek, and John F. Kain, “Teachers, Schools and Aca-
demic Achievement,” Econometrica, 2005, 73 (2), 417–458.
Segal, Carmit, “Classroom Behavior,” Journal of Human Resources, Fall 2009, 43 (4), 783–814.
Stanley, M.Sue, “School Uniforms and Safety,” Education and Urban Society, 1996, 28 (4),
424.
Steinberg, Jacques, “Guilianai Says He Supports Plan for Requiring School Uniforms,” New
York Times, February 12 1998.
Wade, Kathleen K. and Mary E. Stafford, “Public School Uniforms: Effect on Perceptions
of Gang Presence, School Climate, and Student Self-Perceptions,” Education and Urban
Society, 2003, 35 (4), 399.
Watlington, Eliah, Robert Shockley, Paul Guglielmino, and Rivka Felsher, “The High
Cost of Leaving: An Analysis of the Cost of Teacher Turnover,” Journal of Education
Finance, 2010, 36 (1), 22–37.
Wooldridge, Jeffrey M., Econometric Analysis of Cross Section and Panel Data, MIT Press,
2002.
Yeung, Ryan, “Are Uniforms a Good Fit?: Results from the ECLS-K and the NELS,” Educa-
tional Policy, 2009, 23 (6), 847–874.
25

78 83 91 98 110 103 98 91 92 90 93 88 81
71
18 24
41
54
70 87 100 109 124
140 157 167 178
184
161 156
141
135
121 109 97 90
84 75
59 50 44 41
0
50
100
150
200
250
300
350
1993 1994 1995 1996 1997 1998 1999 2000 2001 2002 2003 2004 2005 2006
Num
ber
of
Sch
ools
Figure 1: Uniform Adoption in LUSD-SW
Unknown/Refused Uniform No UniformDiscipline and Attendance
Data Available Testing Gains Available

Figure 2: Attendance Before and After Uniform Adoption
Graphs show point estimates and 95% confidence intervals for estimates from regressions of the outcome on indicators for each year prior to and after uniform adoption (year t = -1 is omitted), grade-by-year indicators, student economic status, student fixed-effects and school fixed-effects. Numerical values are provided in Online Appendix Tables 6 and 7.
Years Before/After Uniform Adoption Years Before/After Uniform Adoption

Figure 3: Discipline Before and After Uniform Adoption
Graphs show point estimates (solid line) and 95% confidence intervals (dotted lines) for estimates from regressions
of the outcome on indicators for each year prior to and after uniform adoption (year t = -1 is omitted), grade-by-year
indicators, student economic status, student fixed-effects and school fixed-effects. Numerical values are provided in
Online Appendix Tables 6 and 7.
Years Before/After Uniform Adoption Years Before/After Uniform Adoption
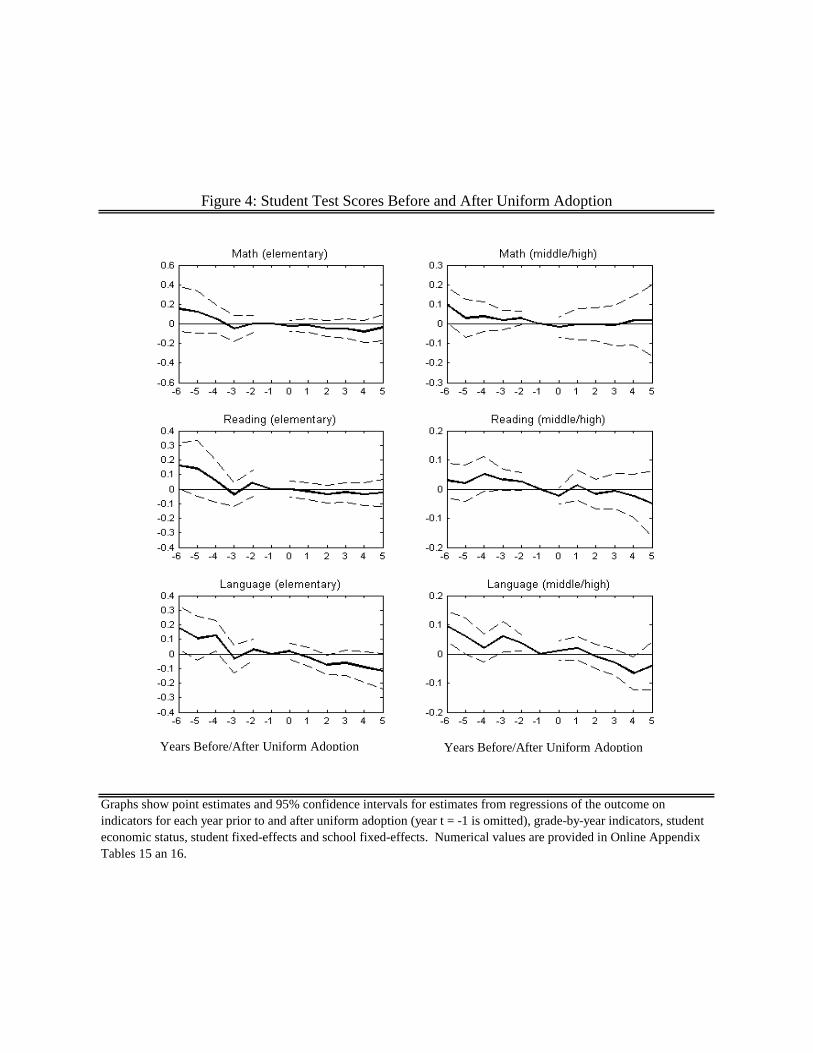
Figure 4: Student Test Scores Before and After Uniform Adoption
Graphs show point estimates and 95% confidence intervals for estimates from regressions of the outcome on
indicators for each year prior to and after uniform adoption (year t = -1 is omitted), grade-by-year indicators, student
economic status, student fixed-effects and school fixed-effects. Numerical values are provided in Online Appendix
Tables 15 an 16.
Years Before/After Uniform Adoption Years Before/After Uniform Adoption

Figure 5: Teacher Attrition Before and After Uniform Adoption
Graphs show point estimates and 95% confidence intervals for estimates from regressions of the
outcome on indicators for each year prior to and after uniform adoption (year t = -1 is omitted), year
indicators, share of school eligible for free-lunch, eligible for reduced-price lunch, otherwise
economically disadvantaged, African-American, Hispanic, white, female, in each grade and and
school fixed-effects. Numerical values are provided in Online Appendix Table 19.
-.1
-.05
0
.05
.1
-6 -5 -4 -3 -2 -1 0 1 2 3 4 5Years Before/After Uniform Adoption
Elementary
-.1
-.05
0
.05
.1
-6 -5 -4 -3 -2 -1 0 1 2 3 4 5Years Before/After Uniform Adoption
Middle/High

Early
Adopter
Late
Adopter
Never
Adopter
Early
Adopter
Late
Adopter
Never
Adopter
Female 0.49 0.49 0.49 0.49 0.49 0.48
(0.02) (0.03) (0.03) (0.10) (0.03) (0.05)
Black 0.31 0.46** 0.25 0.40 0.46 0.43
(0.33) (0.31) (0.30) (0.30) (0.36) (0.34)
Hispanic 0.53 0.42 0.41 0.44 0.44 0.31
(0.33) (0.29) (0.33) (0.27) (0.34) (0.26)
White 0.14 0.09 0.30** 0.14 0.08 0.21
(0.19) (0.14) (0.14) (0.14) (0.11) (0.21)
Free Lunch 0.68 0.69 0.46** 0.46 0.40 0.21***
(0.22) (0.18) (0.29) (0.16) (0.17) (0.11)
Reduced Price Lunch 0.04 0.04 0.04 0.02 0.01 0.01***
(0.02) (0.02) (0.02) (0.01) (0.01) (0.01)
Limited English 0.32 0.28 0.24 0.15 0.15 0.10
Proficiency (0.21) (0.21) (0.24) (0.12) (0.13) (0.13)
At Risk Status 0.56 0.55 0.44* 0.59 0.68* 0.56
(0.17) (0.16) (0.23) (0.18) (0.14) (0.29)
Special Education 0.10 0.10 0.10 0.16 0.12 0.20
(0.03) (0.04) (0.04) (0.19) (0.05) (0.25)
Gifted and Talented 0.08 0.06 0.21 0.11 0.04* 0.22
(0.12) (0.10) (0.27) (0.17) (0.08) (0.36)
TAAS Math 0.37 0.38 0.51** 0.33 0.27 0.46
Pass Rate (0.15) (0.17) (0.19) (0.19) (0.11) (0.20)
TAAS Reading 0.50 0.49 0.62** 0.44 0.38 0.49
Pass Rate (0.15) (0.16) (0.18) (0.20) (0.09) (0.19)
Disciplinary Infractions 0.039 0.027 0.024 0.54 0.44 0.17***
(0.060) (0.023) (0.025) (0.36) (0.39) (0.12)
Attendance Rate 95.9 95.6 96.3 92.1 92.1 93.4
(0.9) (1.1) (0.8) (6.4) (3.1) (2.3)
Observations 72 30 14 21 22 9
Table 1: School Characteristics in 1993
Elementary Middle/High
Early adopters adopt uniforms prior to 2001 Late adopters adopt from 2001 to 2007. Standard deviations in parentheses.
Means shown in table are unweighted averages over school-level means. *, **, *** denote that mean is significantly
different from early adopters at the 10%, 5%, and 1% levels, respectively.

Uniform Not
Required
Uniform
Required
Unknown Uniform Not
Required
Uniform
Required
Unknown
Female 0.49 0.49 0.49 0.49 0.51* 0.48
(0.50) (0.50) (0.50) (0.50) (0.50) (0.50)
Black 0.30 0.27 0.41* 0.36 0.30 0.33
(0.46) (0.44) (0.49) (0.48) (0.46) (0.47)
Hispanic 0.52 0.60** 0.53 0.48 0.58** 0.53
(0.50) (0.49) (0.50) (0.50) (0.49) (0.50)
White 0.15 0.10* 0.04** 0.12 0.09** 0.11
(0.35) (0.30) (0.19) (0.33) (0.28) (0.31)
Free Lunch 0.65 0.67 0.77*** 0.43 0.58*** 0.54*
(0.48) (0.47) (0.42) (0.50) (0.49) (0.50)
Reduced Price Lunch 0.07 0.09*** 0.08** 0.04 0.09*** 0.06***
(0.25) (0.29) (0.26) (0.20) (0.29) (0.24)
Limited English 0.34 0.37 0.35 0.15 0.13 0.16
Proficiency (0.47) (0.48) (0.48) (0.36) (0.34) (0.37)
At Risk Status 0.52 0.59*** 0.58* 0.58 0.59 0.58
(0.50) (0.49) (0.50) (0.49) (0.49) (0.49)
Special Education 0.10 0.09* 0.10 0.12 0.13 0.13
(0.30) (0.29) (0.29) (0.33) (0.33) (0.34)
Gifted and Talented 0.12 0.11 0.05*** 0.12 0.12 0.10
(0.32) (0.31) (0.22) (0.33) (0.32) (0.30)
Observations 402,728 490,802 323,302 704,605 368,928 204,752
Stanford Math 0.15 0.00 -0.13*** 0.01 0.01 -0.05
(1.07) (0.98) (0.96) (1.04) (0.98) (0.95)
Observations 117,571 288,711 140,731 259,019 280,540 106,024
Stanford Reading 0.19 0.00* -0.16*** 0.00 0.01 -0.03
(1.09) (0.98) (0.93) (1.03) (0.99) 0.96
Observations 117,522 288,343 140,719 258,511 280,860 106,289
Stanford Language 0.17 0.00 -0.15*** 0.01 0.02 -0.07
(1.08) (0.98) (0.94) (1.03) (0.99) (0.96)
Observations 117,604 288,718 140,792 258,077 280,291 105,879
Disciplinary Infractions 0.06 0.09*** 0.10*** 0.64 0.92*** 0.82*
(0.40) (0.50) (0.55) (1.60) (2.00) (1.85)
Observations 402,728 490,802 323,302 704,605 368,928 204,752
Attendance Rate 96.1 96.7*** 96.1 92.2 93.7*** 92.2
(6.4) (4.1) (5.0) (11.1) (9.5) (12.0)
Observations 389,968 488,163 317,929 687,822 367,906 200,375
Standard deviations in parentheses. All test scores are measured in standard deviations from the grade-year mean scale score.
Elementary includes students in grades 1 through 5. Middle/high includes grades 6 through 12. *, **, *** denote that estimates
from a regression of the outcome on "uniform required" or "unknown" relative to "uniform not required" is significantly
different from early adopters at the 10%, 5%, and 1% levels, respectively. Standard errors in these regressions are clustered by
school.
Table 2: Student-Level Descriptive Statistics
Elementary Middle/High
A. Demographics
B. Outcomes

All Schools Elementary Middle/High
(1) (2) (3)
Enrollment (in thousands) 0.278* 0.449** -0.470
(0.146) (0.188) (0.319)
[0.045] [0.083] [-0.084]
Female Share 1.452 1.149 4.449**
(1.415) (1.838) (1.779)
[0.237] [0.205] [0.637]
Economic Disadvantage Share 0.497 -0.555 2.388***
(0.539) (0.836) (0.779)
[0.081] [-0.099] [0.342]
Black Share -1.614** -0.484 -3.997***
(0.791) (0.998) (1.380)
[-0.263] [-0.086] [-0.573]
Hispanic Share -1.396 -0.235 -3.280**
(0.876) (1.135) (1.399)
[-0.228] [-0.042] [-0.470]
Other Non-White Share -5.657** -4.472 -9.759**
(2.819) (3.259) (3.841)
[-0.923] [-0.798] [-1.398]
At-Risk Share 0.808 1.085 2.105**
(0.648) (0.950) (0.930)
[0.132] [0.194] [0.302]
Special Education Share 0.216 -2.782** 2.636**
(0.785) (1.319) (1.170)
[0.035] [-0.497] [0.378]
Gifted Share -1.285** -1.569** 0.621
(0.646) (0.797) (0.613)
[-0.210] [-0.280] [0.089]
LEP Share -0.682 -0.701 -2.503**
(0.657) (0.980) (1.001)
[-0.111] [-0.125] [-0.359]
Per-Pupil Total Operating Expenditures -0.041 -0.171*** -0.014
(in $thousands) (0.029) (0.047) (0.041)
[-0.007] [-0.031] [-0.002]
Mean Teacher Experience 0.083 0.002 0.137
(0.062) (0.069) (0.100)
[0.014] [0.000] [0.020]
Mean Teacher Tenure -0.077 0.002 -0.135
(0.066) (0.072) (0.101)
[-0.013] [0.000] [-0.019]
Student-Teacher Ratio -0.074*** -0.087** -0.014
(0.029) (0.036) (0.047)
[-0.012] [-0.015] [-0.002]
Mean Attendance Rate 0.002 0.100 -0.014
(0.027) (0.078) (0.034)
[0.000] [0.018] [-0.002]
Mean Disciplinary Infraction Rate 0.238 0.589 0.196
(0.148) (0.547) (0.157)
[0.039] [0.105] [0.028]
Observations 1,281 795 646
Table 3: Probit Estimates of Uniform Adoption on Prior-Year School Characteristics
Standard errors clustered by school in parentheses. Average marginal effects in brackets. Regressions also include
year indicators and controls for student share in each grade. Some schools are categorized as elementary if they have
any students in grades KG - 5 and middle-high if there are any students in grades 6 - 12. Schools with students in
both grade ranges are included in both elemenatary and middle/high samples. *, **, and *** denote statistical
significance at the 10%, 5%, and 1% levels, respectively.

(1) (2) (3) (4) (5) (6) (7) (8)
Uniform Required -0.018 -0.015 0.261* 0.422*** 0.013 -0.003 0.021 0.018
(0.040) (0.044) (0.143) (0.150) (0.012) (0.008) (0.056) (0.059)
Observations 878,131 862,248 1,055,728 1,027,308 893,530 877,342 1,073,533 1,044,250
Uniform Required 0.037 0.045 0.318** 0.463*** 0.002 -0.003 -0.013 0.016
(0.042) (0.047) (0.141) (0.166) (0.006) (0.004) (0.042) (0.046)
Observations 429,626 421,916 525,447 511,404 436,940 429,092 534,135 519,690
Uniform Required -0.064 -0.069 0.195 0.377** 0.023 -0.004 0.053 0.020
(0.044) (0.050) (0.155) (0.146) (0.019) (0.012) (0.073) (0.074)
Observations 448,505 440,332 530,281 515,904 456,590 448,250 539,398 524,560
X X X X X X X X
X X X X X X X X
X X X X
Standard errors clustered by school in parentheses. Elementary covers grades 1 - 5 and middle high covers grades 6 - 12. Each regression includes grade-by-year
indicators, and the student's free-lunch, reduced-price lunch, or other economic disadvantage status. *, **, and *** denote statistical significance at the 10%, 5%, and 1%
levels, respectively. Counts for the number of student, school and principal fixed-effects in each regression are provided in Online Appendix Table 2.
Student fixed-effects
School fixed-effects
Principal fixed-effects
Males
i. Elementary
Table 4: Effect of Uniforms on Discipline and Attendance
ii. Middle/High
A. Attendance Rate B. Disciplinary Infractions
i. Elementary ii. Middle/High
All
Females

(1) (2) (3) (4) (5) (6) (7) (8)
Uniform Required 0.005 -0.000 0.057 0.047 0.011 -0.002 -0.031 -0.018
(0.006) (0.004) (0.051) (0.062) (0.012) (0.006) (0.023) (0.018)
Observations 768,016 753,495 919,504 894,079 768,016 753,495 919,504 894,079
Uniform Required 0.001 -0.000 0.021 0.041 0.002 -0.004 -0.031* -0.017
(0.002) (0.002) (0.041) (0.049) (0.006) (0.003) (0.016) (0.014)
Observations 375,500 368,460 457,541 445,068 375,500 368,460 457,541 445,068
Uniform Required 0.007 -0.000 0.093 0.054 0.019 -0.002 -0.033 -0.020
(0.010) (0.006) (0.064) (0.075) (0.018) (0.010) (0.032) (0.023)
Observations 392,516 385,035 461,963 449,011 392,516 385,035 461,963 449,011
X X X X X X X X
X X X X X X X XX X X X
LUSD did not report disaggregated suspsension data in 1995-96 and 1996-97. Standard errors clustered by school in parentheses. Elementary covers grades 1 -
5. Middle/high covers grades 6 - 12. Each regression includes student fixed-effects, school fixed-effects, grade indicators, year indicators, interactions of grade
and year indicators, and the student's free-lunch, reduced-price lunch, or other economic disadvantage status. *, **, and *** denote staistical significance at the
10%, 5%, and 1% levels, respectively.
i. Elementary ii. Middle/High
Table 5 - Effect of Uniforms on In-School and Out-of-School Suspensions
Student fixed-effects
School fixed-effects
Principal fixed-effects
ii. Middle/High
A. In-School Suspensions B. Out-of-School Suspensions
i. Elementary
All
Females
Males

All Females Males All Females Males
(1) (2) (3) (4) (5) (6)
Uniform Required -0.376*** -0.405*** -0.354*** -0.027 -0.016* -0.036
(0.092) (0.110) (0.101) (0.018) (0.008) (0.027)
Uniform Required X Above-Median African-American X African-American 0.243*** 0.140 0.345*** 0.047** 0.009 0.082**
(0.085) (0.112) (0.128) (0.021) (0.013) (0.033)
Uniform Required X Above-Median Hispanic X Hispanic 0.037 0.039 0.023 -0.017 -0.011 -0.022
(0.076) (0.083) (0.101) (0.019) (0.012) (0.028)
Uniform Required X Above-Median African-American -0.090 -0.116 -0.062 -0.010 -0.001 -0.019
(0.095) (0.102) (0.105) (0.021) (0.010) (0.033)
Uniform Required X Above-Median Hispanic 0.150 0.176 0.127 0.024 0.007 0.038
(0.093) (0.111) (0.109) (0.026) (0.014) (0.040)
Uniform Required X African-American 0.203** 0.432*** -0.010 0.046*** 0.034*** 0.060**
(0.102) (0.126) (0.143) (0.017) (0.010) (0.027)
Uniform Required X Hispanic 0.281*** 0.347*** 0.242** 0.023 0.011 0.033
(0.088) (0.106) (0.108) (0.015) (0.008) (0.024)
Above-Median African-American -0.098 -0.005 -0.188** 0.031 0.010 0.053
(0.080) (0.106) (0.082) (0.023) (0.011) (0.036)
Above-Median Hispanic 0.012 0.012 0.017 -0.028 -0.009 -0.044
(0.058) (0.093) (0.060) (0.044) (0.022) (0.065)
Observations 878,131 429,626 448,505 893,530 436,940 456,590
Uniform Required 0.538** 0.472* 0.624** -0.066 -0.067 -0.071
(0.244) (0.244) (0.267) (0.095) (0.070) (0.125)
Uniform Required X Above-Median African-American X African-American 0.595*** 0.638*** 0.565*** -0.047 -0.007 -0.081
(0.167) (0.198) (0.186) (0.048) (0.043) (0.063)
Uniform Required X Above-Median Hispanic X Hispanic 0.103 0.180 0.046 -0.014 -0.014 -0.020
(0.171) (0.202) (0.180) (0.045) (0.035) (0.071)
Uniform Required X Above-Median African-American -0.426** -0.374* -0.512** 0.112 0.077 0.142
(0.212) (0.205) (0.250) (0.087) (0.062) (0.119)
Uniform Required X Above-Median Hispanic -0.479** -0.518** -0.506* 0.144 0.116 0.176
(0.241) (0.250) (0.266) (0.098) (0.071) (0.132)
Uniform Required X African-American -0.131 -0.122 -0.129 -0.029 -0.053 0.004
(0.154) (0.155) (0.189) (0.073) (0.063) (0.086)
Uniform Required X Hispanic 0.029 0.151 -0.082 -0.028 -0.034 -0.017
(0.189) (0.203) (0.207) (0.047) (0.038) (0.061)
Above-Median African-American 0.883*** 0.891*** 0.876*** -0.087 -0.069 -0.103
(0.210) (0.216) (0.224) (0.093) (0.071) (0.117)
Above-Median Hispanic 0.150 0.270 0.051 -0.112 -0.075 -0.149
(0.177) (0.163) (0.209) (0.121) (0.083) (0.159)
Observations 1,055,728 525,447 530,281 1,073,533 534,135 539,398
Standard errors clustered by school in parentheses. Each regression includes student and school fixed-effects along with grade indicators, year indicators, interactions of grade and year
indicators, and the student's free-lunch, reduced-price lunch, or other economic disadvantage status. Elementary includes students in grades 1 - 5, while middle/high includes grades 6 -
12. *, **, and *** denote statistical significance at the 10%, 5%, and 1% levels, respectively.
i. Elementary
ii. Middle/High
Table 6: Effect of Uniforms Interacted with Student and School Ethnicity on Attendance and Discipline
A. Attendance B. Discipline

(1) (2) (3) (4) (5) (6) (7) (8)
Uniform Required -0.020 -0.008 -0.024 -0.015 -0.015 -0.024 -0.014 -0.015
(0.029) (0.028) (0.023) (0.025) (0.022) (0.029) (0.011) (0.020)
Observations 239,272 233,891 420,165 412,259 238,759 233,413 420,058 412,114
Uniform Required -0.042 -0.027 -0.015 -0.004 -0.045* -0.061** -0.008 -0.007
(0.032) (0.035) (0.025) (0.028) (0.024) (0.029) (0.012) (0.021)
Observations 117,551 114,878 211,909 207,919 117,338 114,682 211,967 207,975
Uniform Required -0.002 0.005 -0.033 -0.027 0.017 0.012 -0.020 -0.025
(0.031) (0.029) (0.021) (0.024) (0.025) (0.035) (0.013) (0.022)
Observations 121,721 119,013 208,256 204,340 121,421 118,731 208,091 204,139
(9) (10) (11) (12)
Uniform Required 0.006 0.020 0.005 0.018
(0.027) (0.032) (0.013) (0.018)
Observations 239,348 233,975 419,229 411,322
Uniform Required 0.029 0.044 0.003 0.015
(0.028) (0.030) (0.013) (0.018)
Observations 117,619 114,943 211,552 207,550
Uniform Required -0.011 -0.000 0.006 0.021
(0.031) (0.037) (0.015) (0.021)
Observations 121,729 119,032 207,677 203,772
X X X X X X X X
X X X X X X X X
X X X XPrincipal fixed-effects
Standard errors clustered by school in parentheses. Elementary covers grades 1 - 5 and middle high covers grades 6 - 12. Each regression includes grade-by-year
indicators, and the student's free-lunch, reduced-price lunch, or other economic disadvantage status. *, **, and *** denote statistical significance at the 10%,
5%, and 1% levels, respectively. Counts for the number of student, school and principal fixed-effects in each regression are provided in Online Appendix Table
2.
Student fixed-effects
School fixed-effects
All
Females
Males
Males
C. Language
i. Elementary ii. Middle/High
All
Females
Table 7: Effect of Uniforms on Achievement Gains
A. Math B. Reading
i. Elementary ii. Middle/High i. Elementary ii. Middle/High

(1) (2) (3) (4) (5) (6) (7) (8)
Uniform Required -0.002 -0.001 0.012 0.021 -0.004 0.002 -0.007 -0.011*
(0.007) (0.008) (0.010) (0.016) (0.003) (0.003) (0.006) (0.006)
Observations 700,988 688,578 757,637 738,315 700,988 688,578 757,637 738,315
Uniform Required -0.006 -0.004 0.010 0.020 -0.004 0.003 -0.010 -0.013*
(0.007) (0.008) (0.009) (0.015) (0.003) (0.004) (0.006) (0.007)
Observations 342,332 336,253 373,256 363,854 342,332 336,253 373,256 363,854
Uniform Required 0.002 0.002 0.014 0.022 -0.003 0.003 -0.004 -0.010
(0.007) (0.008) (0.010) (0.017) (0.004) (0.004) (0.007) (0.006)
Observations 358,656 352,325 384,381 374,461 358,656 352,325 384,381 374,461
(9) (10) (11) (12) (13) (14) (15) (16)
Uniform Required -0.006* 0.001 -0.007* -0.004 -0.046*** -0.036* -0.019 -0.014
(0.003) (0.004) (0.004) (0.005) (0.014) (0.020) (0.015) (0.020)
Observations 594,032 583,832 885,866 864,795 1,213 1,176 811 737
Uniform Required -0.004 0.000 -0.006 -0.003 - - - -
(0.003) (0.004) (0.004) (0.004) - - - -
Observations 290,486 285,535 442,560 432,087 - - - -
Uniform Required -0.007* 0.001 -0.008* -0.005 - - - -
(0.004) (0.004) (0.004) (0.005) - - - -
Observations 303,546 298,297 443,306 432,708 - - - -
X X X X X X X X
X X X X X X X X
X X X X
Table 8: Effect of Unifroms on Leaving the District, Switching Schools, Grade Retention and Teacher Attrition
B. Leaves LUSD
i. Elementary ii. Middle/High i. Elementary ii. Middle/High
A. Switches Schools in LUSD
Males
i. Elementary ii. Middle/High
All
Females
ii. Middle/High
Standard errors clustered by school in parentheses. Switching, leaving, and grade retention: Elementary covers grades 1 - 5 and middle high
covers grades 6 - 12. A student is identified as being retained if their grade in year t is less than or equal to their grade in year t-1. Each
regression includes grade-by-year indicators, and the student's free-lunch, reduced-price lunch, or other economic disadvantage status. *, **,
and *** denote statistical significance at the 10%, 5%, and 1% levels, respectively. Teacher attrition regressions: Elementary includes any
school with enrollment in grades KG - 5. Middle/High includes any school with enrollment in grades 6-12. Some schools fall into both
categories and hence there is overlap. Each regression includes year indicators and school-level share enrolled in each grade, female, free lunch,
reduced-price lunch, other economic disadvantage, black, Hispanic, and white. Data on teacher attrition covers 1996-07 through 2004-05.
Attrition is calculated by matching teacher names within a school across years. Counts for the number of student, school and principal fixed-
effects in each regression are provided in Online Appendix Table 2.
C. Grade RetentionD. Teacher Attrition
(School-Year Level Regressions)
i. Elementary
Principal fixed-effects
Student fixed-effects
School fixed-effects
All
Females
Males