national bureau of economic research … effect of medicare part d on pharmaceutical prices and ......
TRANSCRIPT

NBER WORKING PAPER SERIES
THE EFFECT OF MEDICARE PART D ON PHARMACEUTICAL PRICES ANDUTILIZATION
Mark DugganFiona Scott Morton
Working Paper 13917http://www.nber.org/papers/w13917
NATIONAL BUREAU OF ECONOMIC RESEARCH1050 Massachusetts Avenue
Cambridge, MA 02138April 2008
We thank Abigail Alpert, Tamara Hayford, and Patrick Healy for outstanding research assistance. We are also grateful to Steve Berry, Jay Bhattacharya, Judith Chevalier, Judith Hellerstein, MelissaKearney, Jeanne Lafortune, and seminar participants at Columbia, Duke, Maryland, Stanford, Syracuse,Toulouse, the NBER, the Centers for Medicare and Medicaid Services, and the 2008 AEA meetingsfor helpful comments. We are grateful to Merck and Co. for providing us IMS data, and to IMS forgiving permission for us to use their data. This project was supported by National Science FoundationResearch Grant 0518858 "The Effect of Government Procurement of Pharmaceuticals." The opinionscontained herein are those of the authors and not necessarily of any funding agency. Copyright heldby Mark Duggan and Fiona Scott Morton. Contact information for authors: [email protected],[email protected]. All errors are our own. The views expressed herein are those of theauthor(s) and do not necessarily reflect the views of the National Bureau of Economic Research.
NBER working papers are circulated for discussion and comment purposes. They have not been peer-reviewed or been subject to the review by the NBER Board of Directors that accompanies officialNBER publications.
© 2008 by Mark Duggan and Fiona Scott Morton. All rights reserved. Short sections of text, not toexceed two paragraphs, may be quoted without explicit permission provided that full credit, including© notice, is given to the source.

The Effect of Medicare Part D on Pharmaceutical Prices and UtilizationMark Duggan and Fiona Scott MortonNBER Working Paper No. 13917April 2008JEL No. H57,I11,I18,L11,L51
ABSTRACT
On January 1, 2006, the federal government began providing insurance coverage for Medicare recipients'prescription drug expenditures through a new program known as Medicare Part D. Rather than settingpharmaceutical prices itself, the government contracted with private insurance plans to provide thiscoverage. Enrollment in Part D was voluntary, with each Medicare recipient allowed to choose fromone of the private insurers with a contract to offer coverage in her geographic region. This paper evaluatesthe effect of this program on the price and utilization of pharmaceutical treatments. Theoretically,it is ambiguous whether the expansion in insurance coverage would increase or reduce pharmaceuticalprices. Insurance-induced reductions in demand elasticities would predict an increase in pharmaceuticalfirms' optimal prices. However, Part D plans could potentially negotiate price discounts through theirability to influence the market share of specific treatments. Using data on product-specific prices andquantities sold in each year in the U.S., our findings indicate that Part D substantially lowered theaverage price and increased the total utilization of prescription drugs by Medicare recipients. Ourresults further suggest that the magnitude of these average effects varies across drugs as predictedby economic theory.
Mark DugganUniversity of MarylandDepartment of Economics3115L Tydings HallCollege Park, MD 20742and [email protected]
Fiona Scott MortonYale School of Management135 Prospect StreetNew Haven, CT 06520and [email protected]

2
I. Introduction
Health care expenditures currently account for 16 percent of gross domestic product in the U.S.,
with this share projected to increase to more than 20 percent by 2016 (Poisal et al, 2007) and to 35
percent by 2035 (CBO, 2007). Almost half of this spending is accounted for by federal, state, and local
governments, primarily through large-scale health insurance programs such as Medicare, Medicaid, and
the Veterans Health Administration (CMS, 2007).
The price that the government pays (either directly or indirectly) to providers for any health care
treatment will influence both the number of individuals who use the treatment and firms’ incentives to
develop potential new substitutes. If a price is suboptimally high, there can be over-utilization of the
treatment, with physicians and other health care providers potentially inducing the demand of consumers
(Evans, 1974), who are likely to be imperfectly informed about the treatment’s effect (Arrow, 1963).
Similarly, a price that is too high can lead to inefficiently high amounts of research and development
(Garber et al, 2006). The reverse would be true with respect to both treatment utilization and innovation
incentives if a price was suboptimally low.
For several reasons, these issues are especially relevant for pharmaceutical treatments. First, the
vast majority of prescription drug expenditures are accounted for by products with patent protection,
which limits the sort of standard competition that reduces prices. Second, because the pharmaceutical
industry has low marginal costs and sunk fixed costs, the government is not constrained by the exit of
providers from the market should it set too low a price (in contrast to the case of a physician, for
example).1 The effect of pharmaceutical prices on most consumers’ incentives is limited because health
insurance partially or fully insulates them (Manning et al, 1987). And finally, physicians both have the
agency problems as discussed above, and are likely to be unaware of market prices of pharmaceutical
products. These forces potentially result in pharmaceutical prices that are not tightly linked to demand.
1 Frank and Newhouse (2007) use the phrase “pennies a pill” to describe marginal costs while Dimasi et al (200?) estimate the average cost of bringing a new drug to market at $802 million.

3
Prescription drug expenditures represent the most rapidly growing component of health care
spending, increasing from 5 percent of health care spending in 1980 to more than 10 percent by 2005
(CMS, 2007). Further, almost 60 percent of all prescriptions in the U.S. are filled for beneficiaries of
Medicare, Medicaid, and other government programs. The adoption of government procurement schemes
that create appropriate market forces to shift the pharmaceutical industry to a more efficient outcome is
therefore critically important both to government expenditure and to continuing technological progress.
In this paper, we show that the institutions and mechanisms used by the government to purchase
prescription drugs can strongly affect market outcomes. By institutions, we have in mind large buyer
groups, incentives for patients to consume certain products, and the development and use of formularies.
A formulary is a formal mechanism that allows a buyer to identify a therapeutically–similar product as a
viable substitute for a patented product. When bargaining with the seller of a patented product, the ability
to shift demand to a substitute drug is a powerful negotiating tool.
Our paper provides evidence for what we consider a surprising outcome: moving consumers
from cash-paying status to insured status lowers optimal prices for branded prescription drugs. This is
surprising because the standard effect of insurance is to create inelastic demand and therefore stimulate
higher prices from a seller with market power (Duggan and Scott Morton, 2006). However, the insurers
that we study bundle insurance with a formulary and other mechanisms to create elastic demand. Our
evidence leads us to conclude that the formulary and other mechanisms perform the special role of
allowing buyers to move market share among drugs with patent protection, thereby raising cross-price
elasticities, and lowering purchase prices for branded drugs. This result contrasts with the common
intuition that an uninsured consumer, paying at the margin for her own purchases, is the best tool with
which to create competition in the market and impose pricing discipline on sellers. Certainly, this is at
least part of the rationale behind many current policies in healthcare such as tax-free healthcare savings
accounts (Cogan et al, 2005). Our evidence suggests that this picture is incomplete; for maximum effect,
the consumer also needs to be part of a group that can substitute one provider for another.

4
Our setting is the recent significant increase in government intervention in the pharmaceutical
industry represented by Medicare Part D. For the first forty years of its existence after its creation in
1965, the Medicare program provided virtually no coverage for beneficiaries’ prescription drug costs
outside of treatments administered in a doctor’s office or hospital.2 But as prescription drug expenditures
increased more rapidly than other health care spending during the last few decades, the political pressure
built for Medicare to cover prescription drugs. In December 2003, the Medicare Prescription Drug
Improvement and Modernization Act created Medicare Part D, which would begin providing coverage for
prescription drug costs in January of 2006 for those Medicare recipients who chose to enroll.
Part D is the largest expansion of Medicare since the program’s inception and has been projected
to cost $780 billion over its first ten years (2006-15). This feature alone made the program controversial
at the outset. Not only is Part D a very large entitlement program, it significantly expands the role of the
government as a buyer of prescription pharmaceuticals. Governments outside the US use their power as
large buyers to pay relatively low prices for new, patent-protected medications. In contrast, Part D is set
up so that the government does not directly purchase drugs, but rather subsidizes participating private
prescription drug plans (PDPs), which then negotiate with pharmaceutical companies over drug prices.
One of the central criticisms of this legislation was that it would lead to higher prices than if the
federal government used its negotiating power on behalf of program participants to bargain for lower
prices. Part D can also be contrasted to Parts A and B of Medicare, in which the Centers for Medicare and
Medicaid Services (CMS) sets prices for each covered service3 and reimburses providers directly per
service; in Part D, CMS pays the participating plan a lump-sum per enrollee and has no control over the
prices paid to manufacturers by the plan or charged to enrollees by the plan. Instead, the legislation
creates competition among plans for the business of enrollees, which is intended to drive drug prices and
premiums to competitive levels. Each Medicare recipient can choose between the plans offered in her area
based on the drugs covered, the prices of those drugs, the monthly premium, and other plan parameters.
2 The program did provide coverage for certain cancer treatments and for some other physician-administered drugs. 3 Hospital inpatient reimbursement in Part A depends both on the patient’s diagnosis and on the treatment.

5
In the empirical work below, we investigate the effect of Medicare Part D on the price and
utilization of branded pharmaceutical treatments. Theoretically, the program could either increase or
reduce prices paid to pharmaceutical companies. On the one hand, once enrolled in Part D, enrollees who
had previously been uninsured would have a lower elasticity of demand than before, leading to an
increase in the manufacturers’ profit-maximizing prices for drugs with market power.4 On the other hand,
Part D plans could exclude certain treatments from their formulary or steer their enrollees away from
certain treatments in response to the prices of those treatments, which a cash-paying individual could not
typically do on her own. This could give these plans a strong lever with which to negotiate price
reductions from pharmaceutical manufacturers.
We are also interested in the effect of the program on utilization.5 In addition to any ex-
manufacturer price effect, the insurance provided by Part D would lower beneficiaries’ out of pocket
prices, and therefore affect utilization (Gibson et al, 2005).
Our estimation strategy exploits variation across branded drugs in their Medicare market shares to
estimate the effect of Part D on pharmaceutical prices and utilization. We measure this drug-specific
share using data from the Medical Expenditure Panel Survey. Our key identifying assumption is that a
treatment’s Medicare market share is orthogonal to other unobserved factors that affect the change in
average prices or total utilization. With this assumption, we model the effect of Part D on the change in
average prices or utilization as a function of the pre-policy Medicare market share.
Our first set of results strongly suggests that Medicare Part D led to a substantial relative decline
in average branded pharmaceutical prices.6 In other words, moving consumers into Medicare Part D plans
significantly reduced the per dose price paid to manufacturers. More specifically, our findings suggest
that each 10 percentage point increase in the pre-policy Medicare market share is associated with a 1.2-
1.4 percent decline in a drug’s average price increase relative to that of other drugs. If one assumes that
4 See Pavcnik (2002) for evidence on the effect of cost-sharing on firms’ profit-maximizing prices. 5 Recent research by Yin et al (2008) and Lichtenberg and Sun (2007) suggests that Part D did increase utilization, though the authors of both studies utilize data from just one pharmacy chain to estimate this. 6 Pharmaceutical prices trend upwards throughout our period, but the impact of Part D is to reduce the increase.

6
all Medicare recipients enroll in Part D, this suggests a reduction of 12-14 percent caused by this group.
However, the actual impact of Part D enrollees is almost twice as large given that approximately half of
Medicare recipients either kept their existing prescription drug insurance coverage or elected to remain
uninsured. Our estimates imply that an enrollee who moves from paying cash to buying through Medicare
Part D pays 24% less for branded prescriptions before the mechanical effects of the insurance itself are
taken into account.
Additionally, our estimates reveal the effect is driven by the consumption of drugs by Medicare
recipients without insurance before Part D. It appears to be the movement of Medicare recipients from
cash-paying uninsured status to insured under a plan that causes the decline in per unit prices. The most
plausible mechanism driving this result is not the insurance per se, but the activities of the insurer.
Enrollees join plans that can create competition for patented brands by identifying therapeutic substitutes,
and creating incentives to switch to those substitutes (known as “moving market share”). An individual
consumer typically does not have the knowledge of which drugs are acceptable therapeutic substitutes;
the consumer’s physician typically has poor knowledge of prices, especially negotiated prices; and any
one consumer is too small a share of demand to negotiate with a pharmaceutical company.
A prescription drug plan can potentially surmount all three of these hurdles. The plan develops a
formulary, which is a list of drugs the plan “prefers” due to their therapeutic and cost profiles. The plan
encourages consumption of preferred drugs with either rules (prior authorization) or prices such as
smaller copayments. A pharmaceutical firm has an incentive to sell its brand at a lower price in exchange
for the market share the plan can deliver.
However, for a small subset of “protected” therapeutic classes (such as HIV antiretrovirals) and
for classes with just one or two brands, plans would not be able to do this because legislation required
them to cover all drugs in the class. Consistent with this prediction, our analyses show that prices do not
decline in relative terms for brands with limited substitutes.
Combining our results with the mechanical effect of Part D on out-of-pocket prices, we expect
that the average cost of prescription drugs for an uninsured Medicare recipient with average prescription
7
drug spending fell substantially.7 In light of this, it is not surprising that our results suggest a substantial
increase in utilization among Medicare-intensive drugs, although our estimated coefficients for utilization
are not as precise as are those for prices.
The outline of the paper is as follows. In section two we provide background on the Medicare
program and on key features of Part D. In section three we develop a model that considers the effect of
Part D on pharmaceutical firms’ profit-maximizing prices. Section four describes our data and the
construction of our sample of drugs. In the next two sections we specify our empirical framework,
summarize our main results, and describe how our estimates vary across therapeutic categories. The final
section concludes.
II. Background on the Medicare Program and Part D
A. Medicare Parts A, B, and C
The federal government’s Medicare program currently provides health insurance to more than 43
million elderly and disabled U.S. residents (SSA, 2007). This program primarily covers the cost of
hospital inpatient and outpatient care as well as physician services, home health care, and some long-term
care. Beneficiaries share in the cost of this care through deductibles, copays, and a monthly premium; 85
percent of beneficiaries are in the fee-for-service version of Medicare.8 While the program began as
health insurance for the elderly, the eligibility criteria for the program were expanded in 1973. At that
time recipients of Social Security Disability Insurance (SSDI) benefits were allowed to enroll in the
program following a two-year waiting period from the onset of their disability.9 By 2005 approximately
84 percent of Medicare enrollees were age 65 or older and the rest received Medicare through their SSDI
enrollment (SSA, 2006).
7 Lichtenberg (2007) uses data from one pharmacy chain to estimate the effect of Part D on the number of prescriptions and on out-of-pocket spending. His results suggest large reductions in out-of-pocket costs, though he does not distinguish between mechanical effects of the plan co-pays and a change in gross pharmaceutical prices. 8 The remaining beneficiaries are enrolled in Medicare HMOs, which bear risk by accepting capitated payments. 9 Recipients of Railroad Retirement benefits and those with end stage renal disease were also made eligible, though they accounted for a much smaller number of Medicare recipients

8
The design of Part A and Part B has remained similar throughout Medicare’s existence.10 Health
care providers are paid a fixed amount for each service provided to recipients that depends on the
patient’s treatment and/or diagnosis. Thousands of fee-for-service prices must therefore be set by CMS,
and then periodically updated. Both Parts A and B include substantial cost-sharing so that recipients
contribute to the cost of their medical care. For example, Part A requires the payment of a deductible for
each hospital admission while Part B incorporates both an annual deductible and a twenty percent co-pay
for covered services.
Beginning in 1982, Medicare recipients could alternatively choose to receive their health care
coverage through a Medicare HMO or similar managed care plan. In contrast to Parts A and B, these
managed care providers are paid a fixed risk-adjusted amount per recipient per month that is independent
of care delivered and thus bear financial risk for the costs of their enrollees’ medical care. Plans are
required to cover a certain level of services, though they have the option to provide additional benefits as
well. The Balanced Budget Act of 1997 changed the name of this part of the program to Medicare Part C,
but its current name is Medicare Advantage.
B. Medicare Part D
While Medicare has provided coverage for the costs of hospital care, physician services, and
many other types of medical care since its inception in 1965, the program provided very little coverage
for prescription drugs until recently. Only those pharmaceutical treatments administered in a physician’s
office or other institutional setting were covered by the program. This omission took on added
significance during the 1990s and early 2000s when prescription drug expenditures were growing twice as
rapidly as all other health care spending (Duggan, 2005). According to data from the Medical
Expenditure Panel Survey, per-person expenditures among Medicare recipients for prescription drugs
10 One important change was the switch in 1984 to a DRG-based system of hospital reimbursement (Cutler, 1995), in which hospital payments depended on both diagnosis and treatment.

9
were equal to $1789 in 2003, with more than half of this paid out-of-pocket and just 7.8 percent paid for
by the Medicare program.
Perhaps partly as a result of this growth in pharmaceutical spending, the U.S. Congress passed the
Medicare Prescription Drug Improvement and Modernization Act in December of 2003. While there
were several components to this legislation, the most important feature was the creation of Medicare Part
D, which would provide insurance coverage for prescription drug costs to Medicare recipients who
voluntarily enrolled in the program beginning in January of 2006. This legislation also created the
Medicare Discount Drug Card program, which took effect in early 2004 and was designed to help
Medicare recipients receive discounts on their prescriptions during the two-year window prior to the
commencement of Part D.
In contrast to Parts A and B of the program, Part D benefits are provided through one of two
types of private insurance plans.11 The first type, known as a prescription drug plan (PDP), provides
coverage only for prescription drug costs while Medicare Advantage plans (MA-PD) insure all Medicare-
covered services, including hospital care and physician services as well as prescription drugs. A plan
sponsor contracts with CMS to offer a plan in one (or more) of the 34 defined regions of the US.
Plans are allowed to develop a formulary that excludes certain drugs from coverage, though they
are required to have at least two drugs on the formulary for each therapeutic class.12 Furthermore, a plan
cannot exclude treatments from any of six protected classes (e.g. HIV antiretrovirals, cancer drugs) from
the formulary. The actuarial value of the benefits offered by a plan must be at least as generous as those
specified in the 2003 MMA legislation. In the 2006 calendar year this included a deductible of $250, a 25
percent co-pay for the next $2000 in spending, no coverage for the next $2850 (this is often referred to as
the “donut hole”), and a 5 percent co-pay once out-of-pocket expenditures reach $3600. These figures
change annually and are displayed graphically in Figure 1.
11 For a detailed discussion please see Duggan, Healy, and Scott Morton (2008). 12 See Huskamp et al (2003) for evidence on the effect of formularies on consumers’ utilization of pharmaceutical treatments. The findings suggest that formularies can substantially alter treatment patterns.
10
Plans are financed through a combination of enrollee monthly premiums and subsidies from the
federal government. Before the start of the year, each PDP and MA-PD must submit an estimate to CMS
of the plan’s average monthly revenue requirement for providing the basic benefit during the upcoming
year. This plan bid would include not only prescription drug expenditures by the plan but also
administrative costs and plan profits. These bids are then used to calculate a national average bid, which
is multiplied by a certain percentage (34 percent in 2007) to calculate the base monthly premium paid by
enrollees. If a plan’s bid differs from the average bid, its monthly premium will differ from the base
premium by the same dollar amount. Thus if a plan increases its bid (costs) by one dollar, its government
subsidy does not change and its monthly premium increases by one dollar.13 This stimulates price
competition at the margin because plans with low bids (costs) offer enrollees lower premiums.
To enroll in Part D, a Medicare recipient can choose among those PDPs and MA-PDs offered in
her region of the country. When making this choice, a Medicare recipient would presumably consider
the plan’s monthly premium, the drugs included on the plan’s formulary, the prices of those drugs, and
service.14 To encourage current Medicare recipients to enroll in Part D early in 2006, monthly premiums
increased by 1 percent for each month that a person delayed beyond May of that year. Thus even an
individual with zero expected prescription drug costs during the coming year might enroll in the program
to keep her future premiums low.
Medicare recipients with incomes below a certain level or who are dually enrolled in the
Medicaid program are eligible for subsidies for their PDP monthly premiums. Medicaid recipients are
required to enroll in a Part D plan and receive the largest possible premium subsidy. If they choose a plan
with average or below average costs, they pay no premium at all. Medicaid recipients also have no
deductible or coverage gap and their copayments are heavily subsidized. Other Medicare recipients with
13 A portion of each plan’s subsidy is based on enrollee characteristics and thus to the extent that premium changes influence the composition of beneficiaries it can influence plan subsidies. Also if a plan’s costs diverge by more than 2.5 percent from their bid the government shares in the profit or the loss. See Merliss (2007) and Duggan, Healy, and Scott Morton (2008) for more details on the bidding process. 14 See Lucarelli and Simon (2007) for an examination of the determinants of plans’ monthly premiums.

11
incomes below the poverty line receive similarly large subsidies, with these subsidies phased out linearly
for those with incomes between 100 and 135 percent of the federal poverty line.
By January of 2007, there were 17.3 million PDP enrollees and 6.7 million MA-PD enrollees.
This information is summarized in Appendix Table 1. Approximately 36 percent of PDP enrollees were
automatically enrolled in a PDP because they were also on Medicaid (6.3 million) and an additional 2.2
million were eligible for low-income subsidies because they had incomes at or below 135 percent of the
poverty line.
To reduce the likelihood that Part D would crowd out15 existing prescription drug coverage to
retired workers by their former firms, CMS subsidized those firms that continued to provide this
insurance. To qualify for the subsidy, a firm’s coverage had to be at least as generous as the standard
benefit described above. In January of 2007 there were 6.9 million Medicare recipients whose coverage
was subsidized in this way. An additional 8.2 million Medicare recipients had coverage from some other
source, such as an existing employer, the VA, or the Federal Employees Health Benefits program.
Given the significance of the changes in insurance coverage described above, and the particular
structure of drug procurement for this program, it seems plausible that Medicare Part D had an impact on
prices and quantities in the pharmaceutical sector. The next section presents an illustrative model to
consider the mechanisms through which these effects would be likely to operate.
III. Theoretical Model
Here we provide some intuition and a formal illustration of the pricing changes that
pharmaceutical manufacturers will find optimal upon commencement of Part D. As a first approximation
of the environment, and because entry is fairly easy, we will assume that the market for Part D plans is
perfectly competitive. Plans set prices and service levels to attract consumers and also bargain with
manufacturers to buy drugs. In every region in the US there are at least 27 plans competing for local Part
15 See Cutler and Gruber (1996) for an examination of the crowdout effects of Medicaid eligibility expansions.

12
D enrollees. While the market is more concentrated than this number would suggest16, we will
nevertheless abstract from the issue of whether plans have market power in the current paper, though this
represents an important topic for future research.
Given that plans are effectively not setting the market price for a patented brand, it is the brand’s
manufacturer which is choosing prices before and after the Part D program. We assume throughout the
paper that generic drugs are competitively supplied. In our data, which we describe in more detail below,
we observe an average price derived from invoice prices across all sales except long term care and
hospitals; loosely speaking, all retail sales including mail order. This is comprised of sales to Medicare
Part D enrollees, other Medicare recipients, Medicaid enrollees, private insurance customers, cash-paying
customers, and all other consumers. Each of these types of buyers could purchase her drugs at the same
pharmacy, but the customer’s price and the pharmacy’s reimbursement would be determined by the set of
contracts in place for that buyer’s insurance scheme.
For simplicity, assume that all Medicare enrollees have no coverage prior to Part D and must pay
cash for their prescription drugs. Further assume that all of them enroll when the plan begins. Consider a
linear differentiated products demand curve for product i (possibly) facing therapeutic substitutes j as in
Deneckere and Davidson (1985) or Shubik (1980):
)1(1∑=
−−−=N
jjigigii p
NppVq γα (1)
Here, consumers within a group are identical with valuation V for a product i. pi is the price of drug i, N is
the total number of products in the therapeutic area market, and qi is the quantity demanded of drug i.
Additionally, γg≥0 is the substitutability parameter for a customer group g while αg is the parameter
measuring the elasticity of demand of the customer group, g.
16 The top three plans (UHC-Pacificare, Humana Inc., and Wellpoint, Inc.) accounted for 50 percent of Part D enrollment in 2006 (Merliss, 2007).

13
These latter two parameters will change when the members of the group move from cash
payment to Part D enrollment. First, when this group paid cash for prescription drugs, its members were
not able to create effective price competition between molecules by threatening to switch to a therapeutic
substitute. This is because a single physician and consumer, even if they are aware of prices, cannot offer
to move their demand in response to a discount under the current system of posted prices at drugstores.
However, PDPs can do exactly this to determine which of several substitutes j they will purchase. The
result of the change in institutional structure is an increase in the substitutability parameter γg.
Optimal prices for firms (with marginal costs equal to c) are
)1(2
)1(
NN
NNcV
pgg
ggi
i −+
+⎟⎠⎞
⎜⎝⎛ −
+=
γα
αγ (2)
As γg rises, it can be shown that the optimal price for drug i falls (provided of course that the consumers’
valuation Vi exceeds the marginal cost of production c). A second effect of moving from cash payment to
a Part D plan is a change in the impact of price on demand. This group is now subsidized at
approximately 75% of the cost of the drug benefit in the main coverage region.17 αg falls as the level of
price that causes the consumer to drop out of the market (buy zero units) declines. The optimal price
increases with a decline in αg.18 As such, there are two effects working in opposite directions, and it is
thus ultimately an empirical question which dominates.
The private pay consumers and the remaining cash-paying consumers do not experience either of
these structural changes upon the implementation of Part D. 19 If the average price that we measure in the
17 As described above, the subsidy depends on an enrollee’s total prescription drug expenditures. An individual in the first coverage area shares in just 25 percent of the cost whereas one in the “donut hole” bears the full cost and someone in the catastrophic region bears just 5 percent. 18 In this case, the condition V>c+1 provides the result. 19 We cannot rule out the existence of some effect on the price to privately insured customers. For example, if the same health insurer is covering both Part D and other customers, then the increase in their enrollment may strengthen their bargaining power with pharmaceutical firms. However in our empirical work below, this would

14
data were comprised of only two groups, privately insured and cash/PartD, we would see a change at the
implementation of Part D that is equal to:
partDcashi
PartDcashii
partDcashi
PartDcashi
privatei
privateii
psp
pspsp//
//
Δ=Δ
Δ+Δ=Δ (3)
The first term is zero because there is no change in the optimal price for private patients due to Part D.
The change in the average price of drug i across all consumers will depend on the fraction of that drug
purchased by cash-paying but Part D eligible consumers as well as the change in price those consumers
pay. In our data we will have a measure of total revenues and units sold for each treatment in each year,
which allows us to calculate the average realized price per unit. Our regression methodology will
estimate the determinants of the price change. Note that the prices we use in our estimation are not the
posted prices at the drugstore but the revenues of each drug divided by units sold from invoice data.
There is one possible spillover between Part D and the private market which might cause private
price changes to be non-zero in equation (3). When dual eligibles move from Medicaid to Medicare, they
shift from purchasing through a fairly inelastic purchaser (the state) to a more elastic purchaser (the
PDP).20 Because the inelastic Medicaid demand pays whatever market price is chosen by the
manufacturer, a reduction in Medicaid demand might lower the optimal price for the brand in the private
market (see Duggan and Scott Morton, 2006). If a drug’s dual share is zero, the equation above holds. We
can measure the share of prescriptions dispensed to duals for each drug in our sample, so we will be able
to explicitly take this effect into account for drugs with substantial dual shares.
According to Part D regulations, there are six “protected” therapeutic classes in which PDPs must
be less aggressive with their formularies than in other therapeutic areas. All products in the HIV, anti-
tend to bias against our finding a large effect of Part D, as the spillover effect would be decreasing in the Medicare market share. 20 It is worth noting that many states were negotiating for supplemental rebates based on state-level Medicaid formularies by 2005, so they are not completely unresponsive to price.

15
cancer, anticonvulsant, immunosuppressant, antipsychotic, and antidepressant categories must be
included in all Part D formularies. While a PDP cannot exclude any drug in these categories, it can create
financial incentives or administrative hurdles to affect a patient’s choice of drug. However, dual eligibles
consume protected drugs disproportionately and do not face significant financial incentives given their
additional subsidies. Thus the PDP has lost two of its important tools to affect brand choice in these
classes. We do not know whether the restrictions applied to these classes have a measurable impact on the
behavior of PDPs because in the first year of the program it was not clear how much CMS would oversee
formularies. If restrictions are binding, their effect will be to reduce Part D’s effect on the substitutability
among drugs (lower γg) and therefore reduce the PDP’s ability to extract manufacturer discounts.
Similarly, CMS required that all PDPs include at least two drugs in each therapeutic class and at
least one in each Formulary Key Drug Type (FKDT), which is a finer category than class. Any
class/FKDT with only one or two brands in it will create a challenge for PDPs bargaining for low prices.
The CMS regulations limit the PDP’s ability to substitute away from drugs in the class, and presumably
the manufacturers of these drugs are aware of their market power. We expect that drugs in these two
situations (protected or “small” categories) will have small or negligible change in γg. We modify our
specification to allow for different effects for drugs in this less competitive environment.
edSubstLimitpartDcash
iipartDcash
iii pspsp ΙΔ+Δ=Δ *// (4)
Taken together, our model suggests an ambiguous effect of Medicare Part D on average
pharmaceutical prices, with the sign depending on whether the policy-induced reduction in the elasticity
of demand more than offsets any plan-induced increase in substitutability across treatments. This latter
effect should be less important for brands in one of the six protected therapeutic categories and for those
brands that are one of just one or two treatments in a class/FKDT.

16
And to the extent that Part D reduces Medicare recipients’ out-of-pocket costs, it should lead to
an increase in the utilization that is increasing in the treatment’s Medicare market share. We will test for
an expansion of demand for “daily doses” in the empirical section of the paper. We now turn to an
examination of these issues using data on prices, quantities, and total sales for large-revenue branded
pharmaceutical treatments both before and after the enactment of Medicare Part D.
IV. Data and Constructing the Analysis Sample
A. IMS Health
To estimate the impact of Medicare Part D on our outcome variables of interest, we begin by
merging together data from two sources. The first was obtained from IMS Health and contains data on
total sales (excluding those to hospitals and long term care) in the U.S. for all pharmaceutical products in
each year from 2001 to 2006. The data also contains the number of standardized units of the product that
were sold and the average number of units per daily dose in each year. This allows us to calculate the
average price per day and the number of daily doses in each year for each product. According to our IMS
data, total sales increased from $162.6 billion in 2001 to $223.9 billion in 2006.21
Each pharmaceutical product is assigned to one of fourteen major therapeutic categories.22 The
top three major categories accounted for 51.3 percent of U.S. sales in 2006 and include drugs used to treat
central nervous system disorders, cardiovascular conditions, and conditions of the alimentary tract. The
data are further divided into 260 subclasses23, with cholesterol reducers, antiulcerants, and antidepressants
accounting for the most sales in 2006.
A related issue that we confront in the IMS data is that there are often multiple products for the
same drug. For example, in 2006 there are four different versions of the drug Prevacid that have strictly
21 Expenditure figures cited here and elsewhere in the paper are adjusted to 2006 dollars using the Bureau of Labor Statistics’ Consumer Price Index for all Urban Consumers (CPI-U). 22 In some cases a product is assigned to more than one category, presumably because it can be used to treat more than one condition. For these products, the data allows us to determine sales by category for the product. More specifically, if a product has $200 in sales in category A and $100 in sales in category B, the data would include two separate observations. By aggregating all observations for each product we can determine total product sales. 23 These do not correspond perfectly with the categories that CMS uses to evaluate Part D plans.

17
positive sales. In this case and related ones we aggregate sales for all versions of the same drug in each
year. When doing this, we do not include any sales for generic competitors as the focus of the current
study is on branded drugs that currently have, or previously had, patent protection.
B. Medical Expenditure Panel Survey
Our second main source of data is the Medical Expenditure Panel Survey, a publicly available
data set that is constructed annually by the Agency for Healthcare Research and Quality (AHRQ). In
carrying out this survey, AHRQ collects data on demographic characteristics, insurance coverage, health
care utilization, and many other variables for a nationally representative sample of the civilian non-
institutionalized population residing in the U.S. The survey is divided into several files with, for
example, one focusing on hospital inpatient care and another on emergency room visits.
The file that is particularly relevant for the current study is the Prescribed Medicines file, which
provides information on household-reported prescriptions that were filled during the year. For each
reported prescription this file lists the drug name, the total amount paid, the amount paid out-of-pocket
and separately by each of ten possible sources of insurance, a person-level identifier, and a person-level
weight. In the 2003 MEPS data (the same year in which the Medicare Modernization Act was signed into
law), there are 304,324 prescriptions reported by 20,475 individuals. According to this survey data, the
top four drugs ranked in terms of 2003 sales are Lipitor, Zocor, Prevacid, and Nexium, which exactly
corresponds with the top four in 2003 from our IMS data described above.
Using the person-level identifier, this data on the utilization of prescription drugs can then be
linked to the MEPS Full Year Consolidated Data File (CDF), which includes the person’s age along with
information about her health insurance coverage in each month during the year. The 2003 CDF includes
information for 34,215 individuals. Comparing this to the number of individuals in the Prescribed
Medicines file, there are no prescriptions reported for 40 percent of the individuals in the sample.
One question summarized in the CDF portion of the survey asks whether the respondent was ever
enrolled in Medicare during the 2003 calendar year. The weighted fraction answering yes to this question

18
is 14.4 percent, which not surprisingly given the eligibility criteria described above is much greater
among those aged 65 and up (98.8 percent) than among the non-elderly (2.2 percent). Figure 2
summarizes the relationship between age and Medicare enrollment for individuals aged 40 or older. As
the figure shows, the fraction on Medicare increases relatively smoothly with age among the non-elderly
because of the increasing rates of SSDI enrollment. This fraction then increases sharply from 15 percent
at the age of 64 to 96 percent at age 65.
Medicare recipients have substantially greater utilization of prescription drugs than their
counterparts not in the program. According to the MEPS, the average number of prescriptions in 2003
among Medicare recipients was 28.0 versus just 6.5 for those not in the program. Because of this, the
fraction of prescriptions accounted for by beneficiaries of this program (40.3 percent) is almost three
times greater than their share of the population (14.4 percent).
The Prescribed Medicines file also has information on the source of payment for each
prescription. The first column of Table 1 summarizes this information for all prescriptions while columns
2 and 3 differentiate between those with and without Medicare coverage, respectively. As the first row of
the table demonstrates, the total amount paid for the average prescription is approximately $69.48 during
this year, with the average slightly higher for Medicare prescriptions ($69.90). Medicare recipients paid
approximately 51 percent of the cost out-of-pocket while those not on Medicare paid substantially less at
41 percent. The table also reveals that Medicare recipients received much less coverage from private
insurers in that year (20 versus 45 percent) but this was partially made up for by greater coverage from
Medicaid, the VA, and Medicare. Recall that Medicare did cover the cost for certain prescription drugs
such as cancer treatments in this time period.
The model developed in Section 3 suggests that an important source of variation across drugs in
the impact of Medicare Part D is the fraction of individuals taking the drug who were eligible for Part D
prior to its enactment and subsequently may have enrolled in it. According to the 2003 MEPS, this
variation is substantial. For example Zoloft, an anti-depressant drug that is ranked 5th in terms of sales in
the IMS data, has a Medicare market share (MMS) of 27.1 percent. The corresponding value for Plavix,

19
which is used primarily by those at risk of heart attack or stroke and was ranked 16th in terms of sales in
that same year, is 72.9 percent.24
C. Constructing the Analysis Sample
The Medicare Prescription Drug Improvement and Modernization Act was signed into law on
December 8, 2003. However, Medicare Part D did not begin operation until more than two years later in
January of 2006. During that interim period, the federal government created the Medicare Discount Drug
Card Program. One stated goal of this program was to aid Medicare recipients in receiving lower prices
for their prescriptions. Thus MMA may have influenced both pharmaceutical prices and utilization before
Part D took effect in 2006. In addition, if the optimal price for a drug was going to change significantly
upon the initiation of Part D, a manufacturer may have wanted to adjust the drug’s price gradually over
time so as to avoid the publicity associated with a sharp price change. We therefore use 2003 as our base
year when estimating the effect of the program.
We focus initially on the top 1000 drugs in the IMS data according to their 2003 sales, which
account for 97.2 percent of the $196.0 billion in total sales in that same year. In constructing this sample,
we took care to combine all versions of the same drug. Thus in the example above, sales and utilization
for all four versions of Prevacid would be aggregated into one drug. We then drop the 113 products that
are available over the counter in 2006, as these drugs would not be covered by Medicare Part D plans and
would also rarely appear in the MEPS Prescribed Medicines file that we use to construct Medicare market
shares. Thus a drug such as Tylenol, which ranked 86 in terms of 2003 sales in our initial sample of 1000
drugs, is not included in our analysis sample.
We next drop the 194 remaining drugs that are generic, given that there will typically be many
manufacturers for each of these drugs and these firms would have significantly less pricing power. We
24 These shares are equal to the weighted fraction of a drug’s prescriptions that are for individuals enrolled in Medicare at some point in 2003. One could alternatively calculate this as the weighted fraction of a drug’s spending, which for Zoloft and Plavix would be .278 and .736, respectively. The correlation between these two shares for the 769 drugs out of the top 1000 that appear in the 2003 MEPS is 0.975.
20
will not ignore generic drugs in our analysis however, as we will control for the presence of generic
competition for the brand drugs remaining in our sample. The exclusion of generic and over-the-counter
products leaves us with a sample of 693 drugs that currently or previously enjoyed patent protection, with
these treatments accounting for $170 billion of the $196 billion (86.7 percent) in 2003 spending in our
IMS data.
We then merge this IMS data on sales and utilization in each year from 2001 to 2006 to the
MEPS data on Medicare market shares. To increase our precision in measuring drug-specific Medicare
market shares and related explanatory variables of interest, we utilize both the 2002 and 2003 versions of
the MEPS Prescribed Medicines file.25 Of the 693 products remaining in our sample, 125 do not appear
in either the 2002 or the 2003 MEPS.26 One important reason for this is that the MEPS does not include
prescriptions that are administered in a physician’s office or in some other institutional setting. Thus the
drug Remicade, which is ranked 39th in total IMS sales and is used to treat autoimmune disorders by IV
infusion in a physician’s office, has zero observations in either the 2002 or the 2003 MEPS.
An additional reason that some products are missing is that the MEPS captures approximately 1
out of every 10,000 prescriptions in a typical year and thus some products with small patient populations
will inevitably not be included. Consistent with this, the average number of daily doses is 16.2 times
greater for the 568 drugs that are in the 2002 or 2003 MEPS than for the 125 that are not.27 The 568
drugs that remain in our sample accounted for $155.0 billion of the $196.0 billion (79.1 percent) in total
2003 IMS spending.
There is a close correspondence between IMS spending in 2003 and the estimate of total spending
from the 2003 MEPS. The correlation between these two is equal to 0.928, with this increasing to 0.981
when drugs are weighted by the number of prescriptions in the MEPS. However, there are some cases in
which drugs have very different rankings in the IMS and MEPS data. To shed light on this issue, Table 2
25 This approximately doubles the number of prescriptions for the typical drug in our sample. The Medicare shares in 2002 and 2003 are very strongly correlated, with a weighted correlation of 0.92. 26 There are 544 products that appear in the 2003 MEPS and an additional 22 appear only in the 2002 MEPS. 27 Similarly the 125 omitted drugs are much more expensive on average, with the average cost per daily dose in 2003 more than 47 times greater than for their counterparts that are in the MEPS.

21
lists drugs that are ranked in the top 20 in terms of 2003 spending in either IMS or the MEPS, with drugs
sorted in terms of their highest rank. The most notable disparity in this table is for the drug Epogen,
which is ranked 6th in the IMS data but just 435th in the MEPS, where it has only 19 prescriptions. Epogen
is administered by injection for the treatment of anemia brought on by kidney disease, so it not common
in MEPS. In our empirical analyses below, we weight our specifications by the number of prescriptions
in the MEPS to account for variation across drugs in the precision with which the Medicare market share
and other explanatory variables are estimated.
A limitation to our focus on the top selling brand drugs in 2003 is that we will miss three
potentially important sets of drugs. First, any drug introduced in 2004 or later will not be included in our
analyses below. Similarly, any drug that had sales in 2003 but was not in the top 1000 sellers in that year
will also not be included. Third, we do not include generic drugs in our analysis. Thus to the extent that
Part D plans influenced the utilization of new products, generic drugs, or relatively low selling drugs, we
will not capture this effect in the analyses that follow.
D. Identifying protected classes and therapeutic substitutes
Our model predicts a different response to the program from both drugs in the protected classes
and drugs without substantial therapeutic competition. To identify the former we rely on IMS drug
classifications. IMS has a category named “cancer and immunomodulators” which covers the protected
classes of anti-cancer drugs and immunosuppressants. IMS also contains categories labeled
“antidepressants,” “antipsychotics,” “anti-epileptics,” and “HIV antivirals.” We use anti-epileptics to
proxy for the Part D class called anticonvulsants, but otherwise the matches are exact in terminology. To
determine which drugs were the only treatments or one out of just two in the therapeutic class, we
consulted a list of top-selling drugs and link it to the US pharmacopaeia and CMS therapeutic classes and
FKDTs.28 Recall PDPs are required to “cover” at least two drugs per class and at least one in each FKDT.
28 One version of this can be found at http://www.usp.org/pdf/EN/mmg/drugListTableV3.0.pdf.

22
V. Empirical Framework and Main Results
The IMS data described above provide us with total sales by product in each year from 2001 to
2006. We can also estimate the number of daily doses for each product by dividing the total quantity (in
standardized units) in each year by the corresponding average number of standardized units per daily dose
in each year. This allows us to form an estimate of the average price per day for each product. We use
these data to estimate specifications of the following type:
ΔPj,2003-6 = α1 + β1MMS j,2003 + γ1ΔP j,2001-2 + μ1Yrs j,2003 + δ1AnyGenericj,2006 + ε1 j,2003 (5)
ΔQj,2003-6 = α2 + β2MMS j,2003 + γ2*ΔQ j,2001-2 + μ2Yrs j,2003 + δ2AnyGenericj,2006 + ε 2j,2003 (6)
with j indexing drugs and ΔPj,2003-6 (ΔQj,2003-6 ) equal to the change in price (quantity) for drug j from 2003
to 2006. As described above, we focus on this three year change because the legislation that created Part
D was enacted in December of 2003 but plans did not start enrolling beneficiaries until January of 2006.
The explanatory variable of particular interest in this specification is MMSj,2003, which represents
our estimate of the Medicare market share for drug j using the MEPS Prescribed Medicines files from
2002 and 2003. This is defined to be equal to the fraction of prescriptions filled in 2002 and 2003 for
individuals who were enrolled at some point in the program during the same year.29 This specification,
which uses one observation per drug, exploits the variation across drugs in their tendency to be used by
Medicare recipients. Given that total utilization and average prices for the same drug typically vary over
the lifecycle of the drug and can be affected by the presence of generic competition, we also control for
the number of years that the drug has been on the market (Yrsj,2003) and for whether the drug faces generic
competition (AnyGenericj,2006). To account for the possibility that drug prices, utilization, or sales may be
trending differentially for Medicare-intensive drugs prior to the policy change, we also include the pre-
existing trend (from 2001 to 2002) for the outcome variable of interest in each specification. 29 In calculating this Medicare market share, we use the person weights in the MEPS. There is variation both across and within therapeutic subcategories in this MMS measure. Specifically the correlation of a drug’s Medicare market share with the average weighted Medicare market share of other drugs in its therapeutic subcategory is .697.

23
Prices tend to move fairly steadily in our data, and tend to trend up. In contrast, quantities
fluctuate much more due to the entry of therapeutic substitutes, new generations of medicines, clinical
news, and other factors we do not observe. Thus in some of our quantity specifications, we include
interactions of the 2001-2 trend with the lifecycle stage of the drug to allow for accelerating or
decelerating sales of a drug depending on its age.
To interpret our estimates for β1 and β2 as the causal effects of Medicare Part D on the outcome
variable of interest, we are assuming that there are no omitted factors that are correlated with the
Medicare market share and that also influence the change in the outcome variable of interest.30 Over the
short period of this study, that assumption seems reasonable to us. By taking first differences of average
prices or total utilization, we remove any unobserved time-invariant differences across drugs.
A. The Impact on Average Prices
An examination of the distribution of average price and the change in average prices for the drugs
in our analysis sample reveals that they are highly skewed to the right. This can be seen in Table 3, in
which we display various summary statistics for average prices and for the change in average prices in
our analysis sample. For example, the change in the average price from 2003 to 2006 for the drugs in our
sample has a skewness of more than 12. Thus following recent research for the effect of the Medicaid
program on pharmaceutical prices (Duggan and Scott Morton, 2006), we take the log of the average price,
which as shown in this same table is much more symmetrically distributed and has a skewness of
approximately zero. This has intuitive appeal as well, as prices are likely to change proportionally rather
than by a fixed dollar amount in response to common factors that affect prices in this sector. With this
transformation, we are essentially exploring whether the growth rate of pharmaceutical prices is
significantly greater for Medicare-intensive drugs following the enactment of Part D after controlling for
the pre-existing trend in the price.
30 In this paper we will not consider insurance-induced changes in practice patterns of physicians, the introduction of new drugs, and similar general equilibrium effects, as is done in Acemoglu et al (2006), Finkelstein (2007), and Finkelstein and McKnight (2007), in which the authors looks at the effect of the introduction of Medicare. See also Cutler (1995) and Dafny (2005) for related research on the effect of other important changes to the Medicare program or Card et al (2007) and Khwaja (2008) for research on the effect of Medicare coverage.

24
Table 4 summarizes the results from several specifications similar to equation (6) above. In this
equation, we exclude 50 of the 568 drugs described above because they either have no sales (and thus no
average price) in 2001 or 2002, no sales in 2006, or are missing the year of FDA approval.31 We weight
the observations in each specification by the number of prescriptions in the MEPS to account for the fact
that the precision of our estimate for the Medicare market share will vary across drugs.32 The estimate of
-0.128 for β1 in the first column, in which no other explanatory variables except a constant are included,
suggests that the introduction of Medicare Part D lowered pharmaceutical prices by approximately 13
percent for beneficiaries of the program. This estimate is significant at the five percent level.
The magnitude of our estimate for β1 increases slightly in the next specification to -0.132, in
which we add the control variables described above. The estimate for μ1, the coefficient on the pre-
existing trend in the log price change, is also significantly negative in this specification. This suggests
that there is some regression to the mean, though the estimate for μ1 declines substantially and is no
longer significant in the third specification, in which we exclude outliers that are in the top one or bottom
one percent of the log price change (from 2003 to 2006) distribution. In this specification our estimate for
β1 increases slightly to -0.138 and remains significant at the five percent level.33
As mentioned in the preceding section, the MEPS Prescribed Medicines files do not include
information for drugs administered in a physician’s office or clinic. One might therefore be concerned
that estimates for the Medicare market share for the cancer drugs that are in the sample are inaccurate. In
the fourth specification we exclude these 20 treatments and obtain a very similar estimate for β1.
One potential concern with our estimate for the Medicare market share is that it weights all
prescriptions equally. If, for example, the number of days covered in the typical prescription for a
Medicare recipient is different than for those not on the program, this estimate may be misleading. We
31 The number of drugs excluded for having no sales in 2002, no sales in 2006, or a missing year of FDA approval are 15, 3, and 2, respectively. 32 More specifically, we use Stata analytic weights. 33 The results in this table suggest that generic competition has little impact on the price of branded pharmaceutical treatments. Previous research provides conflicting evidence on this issue, with Frank and Salkever (1997) finding an increase in prices after generic entry and Caves et al (1991) the opposite.

25
therefore introduce an alternative measure of the Medicare market share in the fifth specification that
represents the fraction of total spending accounted for by Medicare recipients. The statistically
significant estimate of -0.134 for β1 using this measure is virtually identical to the previous estimates. In
the next specification we consider only the top 200 drugs, as we did in our previous work for the
Medicaid program, and find that our estimate is essentially for β1 is unchanged at -0.128.
Overall, our results show that the impact of Part D on average prices was significantly negative.
Absent a change in the optimal price for other segments of the market that is correlated with the Medicare
market share, this implies that the prices obtained by the PDPs serving Part D enrollees were significantly
lower than the prices those consumers paid prior to enrolling in the program.
When interpreting these estimates, it is important to consider that many Medicare recipients
already had insurance for prescription drug costs prior to the enactment of Medicare Part D. To the extent
that the price effects were driven by those shifting into Part D plans as opposed to those remaining with
their previous coverage, the estimates for β1 will understate the average impact on pharmaceutical prices
for Part D enrollees. We explore this issue in more detail in Section Six.
B. The Impact of Part D on the Utilization of Prescription Drugs
The results presented in the preceding section suggest that the enactment of Part D reduced gross
pharmaceutical prices for Medicare recipients by an average of 12 percent. The program reduced the net
price of pharmaceutical treatments even further through an additional channel - the subsidies summarized
in Figure One. For example, the typical plan during the 2006 calendar year covered 75 percent of the first
$2000 in prescription drug costs once a person had reached their annual out-of-pocket deductible of $250.
Additionally, Medicare recipients enrolled in Part D pay just five percent of their costs once their out-of-
pocket spending reaches $3600, with the government covering 80 percent and the plan 15 percent.
Because Part D reduced both the gross price of prescription drugs and the share of that price paid
by Medicare recipients, one would expect average utilization of these treatments to have increased. The
26
magnitude of this increase would presumably depend on several factors, including the elasticity of
demand for the affected treatments as well as the distribution of net price changes for these same
treatments. Note that the standard plan does require the enrollee to face the full marginal price of drugs
for a significant fraction of the expenditure range. To the extent that the utilization of prescription drugs
is very responsive to price, one would expect a substantial effect on utilization (Gibson et al, 2005).
To investigate the effect of Medicare Part D on the total utilization of prescription drugs, in this
section we estimate specifications that are slightly different from those in the preceding section. We use
equation (6) rather than equation (5). In this case, the dependent variable is equal to the change in the log
of the number of daily doses from 2003 to 2006, with the mean and standard deviation of this variable in
the sample equal to -0.62 and 1.12, respectively.34
The results from these specifications are summarized in Table Five. The estimate of 0.516 for β2
in the first specification, in which only the Medicare market share and a constant are included, is positive
but statistically insignificant with a p-value of .108. Even though the estimate is not statistically
significant, the point estimate suggests an increase of more than 67 percent in utilization among Medicare
recipients. In the next specification, we include the pre-existing trend from 2001 to 2002 in utilization,
the number of years that the drug had been on the market as of 2003, and a control for the presence of
generic competition. The estimates for the coefficients on the first two of these variables are statistically
insignificant, while the estimate for δ2, the coefficient on AnyGenj,2006, is significantly negative with a t-
statistic of -5.5. This is consistent with previous evidence that utilization of branded drugs declines
substantially once they face generic competition (Caves et al, 1991). The estimate for β2, the coefficient
on the Medicare market share variable, declines slightly to 0.488 and remains insignificant.
The estimates for β2 in the next four columns are similar in magnitude, ranging from a low of
.374 to a high of .554, though in all cases the estimates are statistically insignificant. In the seventh
specification we interact the pre-existing trend in sales with two indicator variables. The first indicator is
34 Utilization is on average declining because we are focusing on top selling drugs in 2003. Many of these treatments will have seen declines in spending in the subsequent three years.

27
equal to 1 if the drug is “young” (less than 7 years since FDA approval) and 0 otherwise while the second
indicator is 1 if the drug is “old” (more than 15 years since FDA approval) and 0 otherwise.35 The
estimate of 0.452 for the effect of the Medicare market share is similar to the preceding ones.
Interestingly, the estimate for the pre-existing trend is now significantly positive at 0.841, though the
estimates for the two interaction terms are significantly negative. This suggests that the pre-existing trend
is a good predictor of utilization changes but not for very young or old treatments.
The large estimates for δ2 in the first several specifications of Table 5 suggest that utilization
changes among drugs that face generic competition are substantially different from those that do not. To
increase the comparability of the drugs included in our sample, in specification 8 we focus on just the 291
drugs in our sample that did not face generic competition by 2006. While smaller in magnitude than the
previous estimates, the estimate of 0.252 for β in this specification is significant at the ten percent level.
To gauge the plausibility of these results, it is instructive to obtain a back-of-the-envelope
estimate of the implied elasticity of prescription drug purchases for the 548 drugs in our sample. For a
Medicare recipient with average prescription drug spending, the effective co-pay would be 25 percent.
Adding to this a 12 percent average reduction in gross pharmaceutical prices suggests almost an 80
percent reduction in the out-of-pocket cost on the margin for purchases in the coverage area. This is
approximately twice as large as the median implied utilization effect from Table 5, suggesting an
elasticity of approximately 0.5.
This estimate is comparable to the corresponding ones from most previous studies summarized in
Gibson et al (2005). But for many reasons the elasticities calculated here are not strictly comparable
because they are estimated for a different population, consider different drugs, and have a non-linear
relationship between out-of-pocket spending and total prescription drug costs. But taken together the
35 Approximately 25 percent of drugs in our analysis sample are “young” and another 25 percent are “old”.

28
results strongly suggest that the average effect of Medicare Part D was to reduce the price and increase
the utilization of pharmaceutical treatments among the beneficiaries of the program.36
VI. Heterogeneity in Part D’s Impact on Pharmaceutical Prices and Utilization
A. Differentiating between Insured and Uninsured Medicare Recipients
Just prior to the enactment of the Medicare Modernization Act, a substantial fraction of Medicare
recipients already had insurance coverage for prescription drug costs. As shown in Table 1 and described
above, payments by private and public health insurers accounted for 20 and 29 percent, respectively, of
2003 prescription drug expenditures for this group.
We begin this section by investigating whether the price effects estimated above also vary with
the baseline insurance coverage of Medicare recipients. The dual eligibles enrolled in both Medicare and
Medicaid were required to switch from Medicaid drug coverage to a Medicare Part D plan. As recent
research has demonstrated (Duggan and Scott Morton, 2006), the procurement rules used by Medicaid
distort prices upward, suggesting that a shift out of Medicaid may have reduced pharmaceutical prices.
And secondly, the shift from being uninsured to a Part D plan may have affected prices by placing
individuals paying with cash into a large group that could bargain over prices with brands in return for
market share, increasing their sensitivity to price differences.
The specifications summarized in Table 6 shed light on this issue. In column (1), we report the
results from our baseline specification summarized in the preceding section, in which our estimate for the
coefficient on the overall Medicare market share is -0.137. Column (2) presents the results from an
analogous specification in which we differentiate between the Medicare self-pay and Medicare insured
market shares as follows:
ΔYj,2006 = α + β1MMS_Self j,2003 + β2MMS_Ins j,2003 + γΔY j,2003 + μYrs j,2003 + ε j,2003 (7)
36 This remains true when one considers that many Medicare recipients already had prescription drug coverage, and thus our elasticity estimate is even larger.

29
in which Y is the outcome variable, price or quantity. The average values for these two variables in our
sample of 548 drugs are 0.217 and 0.135, respectively, and the latter share variable includes both private
and public insurance.
The estimates for β1 and β2 displayed in column 2 suggest that the price effects of Medicare Part
D do vary with a particular drug’s level of pre-Part D insurance coverage on the part of Medicare
recipients. More specifically, the estimate of -.227 for β1 implies that the average (gross) price of
prescription drugs consumed by uninsured Medicare recipients fell by more than 20 percent from 2003 to
2006 relative to other drugs, and this estimate is significant at the one percent level. The magnitude of the
corresponding estimate for β2 has the opposite sign and is statistically insignificant. This suggests that the
price declines observed for Medicare-intensive drugs were driven by declines for drugs consumed
disproportionately by individuals without health insurance.
In the next specification summarized in column (3), we differentiate between Medicare recipients
also enrolled in Medicaid and those with an alternative source of insurance. Given the price distortions
created by Medicaid’s procurement rules, one might expect the movement of duals into Part D to cause a
reduction in private market prices. If so, we will see the estimate of a drug’s dual share associated with
price reductions, rather than its estimate of MMS. The estimate of -.190 for the coefficient on the dual
eligible share is consistent with this hypothesis, though it is not statistically significant.37 Furthermore,
the estimate of -.247 for β1 remains of similar magnitude and statistically significant at the one percent
level. We thus conclude that the movement of duals is not responsible for the effect we measure.
In the next three columns of this table, we summarize the results from an analogous set of
specifications for the utilization (in terms of number of daily doses) of the 548 drugs in our sample. To
the extent that the enactment of Part D reduced the net cost of prescription drugs by more for uninsured
Medicare recipients than for their counterparts who already had insurance, one would expect a larger
37 Because the shift from Medicaid to Part D would have reduced Medicaid market shares, there could be a spillover effect to Medicaid recipients not enrolled in Medicare. Because we have only aggregate data for the post Part D period, we cannot yet investigate this possibility.

30
increase in utilization for drugs consumed by this group. Consistent with this, the estimate of .483 for β1
in specification (5) is substantially larger than the corresponding estimate for β2, though given the large
standard errors the difference is not statistically significant.
The results in the final columns investigate the effect of Medicare Part D on total U.S. revenues.
Given that the policy intervention reduced pharmaceutical prices, relative to drugs consumed infrequently
by Medicare-eligibles, while increasing the quantity of these treatments that was consumed, it is
theoretically ambiguous whether the revenues of pharmaceutical products consumed by eligibles
increased or declined as a result of this legislation. The estimate of .334 for β1 in column (7) suggests that
the utilization effect more than offset the effect of declining prices, so that sales accelerated for Medicare-
intensive drugs, though this result is not statistically significant. However, because the marginal cost of
most pharmaceuticals is quite low, if utilization increased, it is plausible that manufacturer profits could
have risen despite the significant price declines.
Taken together, the results presented in this section suggest that Medicare Part D reduced prices
for Medicare recipients who lacked insurance coverage for prescription drug costs prior to the enactment
of Part D. These individuals are presumably the ones who are much more likely to have enrolled in Part
D plans. We find little evidence to suggest that there was a corresponding effect on either price or
utilization for drugs sold differentially to Medicare recipients who already had prescription drug
coverage. This is consistent with our model above, which predicts no change in pharmaceutical prices for
those Medicare recipients who already had insurance for prescription drug costs.
B. Protected Therapeutic Categories
While private firms providing Part D benefits had considerable latitude in designing their
formularies, they were required to cover at least two treatments in each eligible therapeutic category.38
This requirement was introduced to reduce plans’ ability to “cream skim” the least costly patients by
excluding all treatments for certain conditions. The ability to exclude certain treatments from the 38 Certain therapeutic categories were excluded from Part D coverage, such as weight loss drugs.

31
formulary provided plans with potentially important leverage when negotiating prices with
pharmaceutical manufacturers.
The requirements for a plan providing Part D coverage were substantially more stringent for a
small subset of the 146 therapeutic categories defined by CMS. Specifically, plans were required to cover
“substantially all” drugs in the following six therapeutic categories: antiretrovirals, antidepressants,
antipsychotics, anticonvulsants, immunosuppressants, and antineoplastics. Part D plans could still try to
steer patients toward certain treatments within these categories through differential co-pays, prior
authorization requirements, step therapy, or fail first provisions. However, plans are restricted in their use
of utilization tools in the protected classes. Further, dual eligibles (who differentially use treatments in
these categories) tend not to pay any marginal price (beyond just a dollar or two) for drugs, so plans
cannot create significant financial incentives for them.
Thus all else equal, a plan’s leverage in negotiating low prices would be less than if they could
exclude the treatment altogether. The same would be true for categories with just one or two available
treatments. Note that this group is therefore missing one of the two effects we discussed above: while the
impact of insurance increasing optimal prices is present, the offsetting effect of therapeutic competition
on substitutes is likely to be very weak.
To investigate whether the price effects of Medicare Part D were different for protected classes or
for those with just one or two treatments, in this section we summarize the results from specifications of
the following type:
ΔYj,2006 = α + βMMS j,2003 + λProtj + σMMS j,2003 * Protj + μSmall + ρMMSj,2003 * Smallj + γΔY j,2002 + ε j,2006 (8)
(with the same additional interactions in the case of quantity specifications). In this equation, Protj is set
equal to one if drug j is in one of the protected categories and is otherwise set equal to zero. Similarly,
Small is set equal to one if drug j is in a therapeutic category with just one or two available treatments.
Both variables are then interacted with the Medicare market share defined above to explore whether the
32
average price effects estimated above differ for drugs in this category. To the extent that Part D plans
were less successful at negotiating price reductions in these two sets of categories, one would expect
positive estimates for σ and ρ.
The results summarized in Table 7 shed light on this prediction. In the first three columns we
include all 488 drugs in the sample (after excluding the 10 outlier and 20 cancer drugs from our initial
sample of 518), with 48 of these treatments falling into one of the six protected classes and 22 of them
belonging to a category with just one or two available treatments. In the first specification we add only
the Protj indicator and its interaction with the Medicare market share to our baseline specification.
Consistent with our prediction, our estimate for σ is positive and at 0.183 is larger in magnitude than the
estimate of -0.142 for β, providing a hint that Medicare-intensive drugs in protected classes did not
experience price declines as did their counterparts in protected classes. However, this estimate is not
statistically significant. Standard errors are clustered by therapeutic subcategory given that the protected
class indicator varies at this level.
In the specification summarized in the next column, we add the indicator for being in a “small”
therapeutic category and its interaction with the Medicare market share to our baseline specification.
Consistent with our theoretical predictions, the estimate for the coefficient on this estimate is positive and
it is statistically significant at the ten percent level. The magnitude of this estimate of .316 is more than
twice as large for the main effect estimate of -.143, suggesting that if anything, Medicare-intensive
treatments in these categories experienced price increases.
These findings for price effects are similar when we include both indicators and their interactions
with the Medicare market share in specification three and when we focus only on treatments without
generic competition in column four. Taken together, our results suggest that Medicare Part D did not
reduce gross pharmaceutical prices for treatments in these categories. Returning to our model above, price
declines would be least likely for these treatments because Part D plans would be less well equipped to
“move market share.”

33
The next four columns report the results from an analogous set of specifications for the utilization
measure defined above. In specifications five, six, and seven, the estimate for both σ and ρ are
significantly negative, suggesting that Medicare-intensive drugs in protected classes and in classes with
just one or two treatments experienced decreases in utilization following the enactment of Part D. The
first of these two estimates becomes small in magnitude and statistically insignificant in specification 8,
where we focus on just treatments that do not face generic competition. However, the significant negative
estimate for ρ remains, suggesting that perhaps Part D plans shifted away from these treatments. While
the CMS formulary discourages such shifting, plans are permitted to develop differentiated formularies,
provided they can justify their choices to CMS as both providing sufficient quality, and not attempting to
cream-skim. The combination of results suggests that brands given market power by the CMS formulary
raised their prices and saw some market share losses due to Part D formulary design. However, because
our quantity results are so imprecise, we do not put emphasis on this explanation.
Taken together, the results in this section suggest that drug prices offered by Medicare Part D
plans grew with others in those therapeutic categories where their ability to move market share was most
limited. This provides some support for our model in section three, which predicted smaller price
declines (or larger price increases) for those treatments without good substitutes.
VII. Discussion
The introduction of Medicare Part D is arguably the most significant change to the Medicare
program since its inception more than forty years ago. The procurement rules that are used by Part D
differ substantially from those used by Medicare for other health care services or by the federal-state
Medicaid program or by the U.S. Department of Veterans Affairs for prescription drugs. One of the
central criticisms of Part D was that it would lead to increases in pharmaceutical prices, to some extent
offsetting the benefit of the additional insurance coverage.
34
In this paper, we investigate this issue using price, quantity, and sales data for all pharmaceutical
brands in the U.S. for the period before and immediately following the enactment of Medicare Part D.
We combine this with information on the payment sources and age of each brand’s consumers, which
allows us to compare price and utilization changes as a function of each treatment’s pre Part D Medicare
market share. Our findings strongly suggest that Part D plans have succeeded in negotiating lower
pharmaceutical prices for Part D enrollees – more than 12% lower – with this effect augmenting the
mechanical effect of the program in subsidizing out-of-pocket prices. Our findings also suggest,
consistent with recent research that used data for one large pharmacy chain (Lichtenberg and Sun, 2007;
Yin et al, 2008), that Part D has led to an increase in the utilization of pharmaceutical treatments.
Our findings do not support the hypothesis that Part D plans would pay higher than current prices
unless they were given the assistance of the federal government in negotiation. Further, in contrast to the
usual intuition that the uninsured customer is the most price-sensitive, we find that the insured customer is
more price-elastic. The most plausible explanation is that in Part D, insurance is bundled with group
purchasing and the implementation of a formulary. The impact of the PDP’s ability to negotiate on prices
paid by consumers indicates that a significant benefit of the program is the way it is organized, regardless
of the subsidy. For example, our results predict that elderly consumers would be better off in a Part D
plan with zero subsidy, compared to paying cash. The PDP’s ability to encourage the use of therapeutic
substitutes outweighs the classic insurance-induced increases in pharmaceutical prices and therefore leads
to an overall reduction in program expenditures. It is perhaps partly because of the price reductions
estimated in this paper that Part D expenditures by the federal government have been substantially lower
than the most widely cited estimates suggested (CMS, 2007b).
When interpreting the results in this paper, a number of caveats should be mentioned. First, given
the available data, we can only investigate the effect of Part D in its first year. To the extent that plans
become more or less successful at negotiating prices in future years, the results may of course change.
Secondly, we are unable to measure any ex post rebates which PDPs may have been able to negotiate and
which affect net prices to PDPs. Such rebates do not appear on the invoice, which is the source of IMS

35
data, and might be causing prices to be even lower than those measured here. If rebates are present, our
estimates are a lower bound to the price reductions achieved by PDPs. The other rebates that we do not
measure are Medicaid rebates paid by manufacturers to the Medicaid program.39 Dual eligibles’
pharmaceutical purchases under Medicaid automatically generated this rebate. Once dual eligibles move
into Medicare Part D plans, their pharmaceutical purchases occur at different prices, which is what we
document here, but they no longer trigger automatic rebates. Any study of the total cost of Part D to the
government would want to consider both sets of rebates. And finally, this paper is focused on brands that
were available in 2003 and thus we do not capture any effect on the price or utilization of more recently
released treatments or the rate at which new treatments are introduced. All of these issues as well as the
effects of Part D on the health and out-of-pocket expenditures of Medicare recipients, remain important
areas for future research.
39 See Scott Morton (1997) for background on the determination of Medicaid rebates.

36
References
Acemoglu, Daron, David Cutler, Amy Finkelstein, and Joshua Linn (2006). “Did Medicare Induce Pharmaceutical Innovation?” AEA Papers and Proceedings.
Arrow, Kenneth (1963). “Uncertainty and the Welfare Economics of Medical Care.” American
Economic Review 53: 941-973. Caves, Richard, Michael Whinston, and Michael Hurwitz (1991). “Patent Expiration, Entry, and
Competition in the U.S. Pharmaceutical Industry.” Brookings Papers on Economic Activity. Centers for Medicare and Medicaid Services (2007a). Medicare and Medicaid Statistical Supplement. Centers for Medicare and Medicaid Services (2007b). “Strong Competition and Beneficiary Choices
Contribute to Medicare Drug Coverage with Lower Costs than Predicted.” CMS Fact Sheet released on August 13, 2007.
Cogan, John, R. Glenn Hubbard, and Daniel Kessler (2005). Healthy, Wealthy, and Wise: Five Steps to a
Better Health Care System. American Enterprise Institute Press. Cutler, David (2995) “The Incidence of Adverse Medical Outcomes under Prospective Payment.”
Econometrica 63: 29-50. Cutler, David and Jonathan Gruber (1996) “Does Public Insurance Crowd Out Private Insurance” The
Quarterly Journal of Economics: 111:2:391-430. Dafny, Leemore (2005). “How Do Hospitals Respond to Price Changes?” American Economic Review.:
95 (5) 1525-47. Davidson, Carl and Deneckere, “Incentives for form coalitions with Bertrand competition” (Winter 1985)
RAND Journal of Economics: 16:4:473-486. Dimasi, Joseph, Ronald Hansen, and Henry Grabowski (2003). “The Price of Innovation: New Estimates
of Drug Development Costs.” Journal of Health Economics 22(2) 151-185. Duggan, Mark (2005). “Do New Prescription Drugs Pay for Themselves? The Case of Second-
Generation Antipsychotics.” Journal of Health Economics, 1-31. Duggan, Mark and Scott Morton, Fiona (2006) “The distortionary effects of government procurement:
evidence from Medicaid prescription drug purchasing” Quarterly Journal of Economics:121:1:1-30.
Duggan, Mark, Patrick Healy, and Fiona Scott Morton (2008) “How Does Medicare Part D Work?”
forthcoming, Journal of Economic Perspectives Evans, Robert (1974). “Supplier-Induced Demand: Some Empirical Evidence and Implications.” In: M.
Perlman, ed., The Economics of Health and Medical Care (Macmillan, London) 162-173. Finkelstein, Amy (2007) “The Aggregate Effects of Health Insurance: Evidence from the Introduction of
Medicare” Quarterly Journal of Economics:122:1:1-37.

37
Finkelstein and McKnight (2007). “What Did Medicare Do? The Initial Impact of Medicare on Mortality and Out-of-Pocket Spending.” Forthcoming in the Journal of Public Economics.
Frank, Richard and David Salkever (1997). “Generic Entry and the Pricing of Pharmaceuticals.” Journal
of Economics and Management Strategy 6: 75-90. Frank, Richard and Joseph Newhouse (2008). “Should Drug Prices Be Negotiated Under Part D of
Medicare? And If So, How?” Health Affairs 27 (1): 33-43. Gibson, Teresa, Ronald Ozminkowski, and Ron Goetzel (2005). “The Effects of Prescription Drug Cost
Sharing: A Review of the Evidence.” American Journal of Managed Care 11: 730-740. Huskamp, Haiden et al. (2003). “The Effect of Incentive-Based Formularies on Prescription Drug
Utilization and Spending.” New England Journal of Medicine 349: 2224-2232. Khwaja, Ahmed. (2008). “A Life Cycle Analysis of the Effects of Medicare on Individual Health
Incentives and Health Outcomes.” Duke University mimeo. Lichtenberg, Frank and Shawn Sun (2007) “The Impact of Part D on Prescription Drug Use By The
Elderly” Health Affairs:26:6:1-10 Lucarelli, Claudio and Kosali Simon (2006) “What Drove First Year Premiums in Stand-Alone Medicare
Drug Plans?” working paper, Cornell University. Manning et al (1987). “Health Insurance and the Demand for Medical Care: Evidence from a
Randomized Experiment.” American Economic Review 77: 251-277. Merlis, Mark (2007). “Medicare Payments and Beneficiary Costs for Prescription Drug Coverage.”
Prepared for the Henry J. Kaiser Family Foundation. Pavcnik, Nina (2002) “Do Pharmaceutical Prices Respond to Potential Patient Out-of-Pocket Expenses?”
RAND Journal of Economics 33 (3): 469-487. Scott Morton, Fiona (1997) “The Strategic Response by Pharmaceutical Firms to the Medicaid Most-
Favored-Customer Rules” The RAND Journal of Economics:28:2:269-290. Shubik, Martin (1980) Market Structure and Behavior. Harvard University Press, Cambridge,
Massachusetts. Social Security Administration (2007). Annual Statistical Supplement to the Social Security Bulletin.
SSA Publication 13-11700. Yang, Zhou, Donna Gilleskie, and Edward Norton (2008) “Health Insurance, Medical Care, and Health
Outcomes: A Model of Elderly Health Dynamics.” forthcoming in the Journal of Human Resources.
Yin, Wesley, Anirban Basu, James Zhang, Atonu Rabbani, David Meltzer, and Caleb Alexander (2008)
“The Effect of the Medicare Part D Prescription Benefit on Drug Utilization and Expenditures.” Annals of Internal Medicine 148 (3): 169-177.

Figure 1: Out-of-Pocket Spending in 2006 for Medicare Part D Recipients
0
500
1000
1500
2000
2500
3000
3500
4000
025
050
075
010
0012
5015
0017
5020
0022
5025
0027
5030
0032
5035
0037
5040
0042
5045
0047
5050
0052
5055
0057
5060
0062
5065
0067
5070
00
Total RX $
Out
-of-P
ocke
t $

Figure 2: Medicare Enrollment by Age: 2003 Medical Expenditure Panel Survey
0%
20%
40%
60%
80%
100%
40 42 44 46 48 50 52 54 56 58 60 62 64 66 68 70 72 74 76 78 80 82 84
Age
% w
ith M
edic
are

All Medicare All Other
Average Total Paid per Prescription $69.48 $69.90 $69.17
% Paid Out-of-Pocket 44.9% 50.9% 40.5%
% Paid by Private Insurance 34.5% 19.8% 45.2%
% Paid by Medicaid 12.4% 13.9% 11.3%
% Paid by VA 3.3% 5.8% 1.5%
% Paid by Medicare 3.3% 7.8% 0.0%
% Paid by TRICARE 1.1% 1.2% 1.0%
% Paid by Other Insurance 0.5% 0.5% 0.5%
Total Number of Prescriptions 298,293 129,990 168,303
Table 1: Source of Payment for Prescriptions in the 2003 MEPS

IMS Rank MEPS Rank MEPS Scripts Medicare Share
Lipitor 1 1 7534 0.455
Zocor 2 2 4208 0.574
Prevacid 3 3 2651 0.417
Nexium 4 4 2093 0.316
Zoloft 5 10 2596 0.271
Celebrex 7 5 2590 0.499
Epogen 6 435 19 0.537
Norvasc 14 6 3926 0.592
Advair 12 7 1788 0.293
Zyprexa 8 35 623 0.463
Paxil 13 8 2435 0.292
Neurontin 9 14 1624 0.515
Allegra 17 9 2654 0.19
Procrit 10 48 74 0.652
Effexor 11 16 1610 0.275
Pravachol 15 11 1772 0.538
Plavix 16 12 1664 0.729
Actos 25 13 1311 0.402
Aciphex 35 15 1227 0.435
Singulair 22 17 2080 0.185
Wellbutrin 18 23 1359 0.116
Ortho 29 18 2254 0.006
Oxycontin 19 81 336 0.376
Protonix 23 19 1341 0.446
Fosamax 20 24 1730 0.662
Vioxx 21 20 1686 0.385
Table 2: Rankings of Top 20 Drugs in IMS and/or the MEPS by 2003 Sales

PPD06 Log(PPD06) Δ PPD06 Δ Log(PPD06)
5th Percentile 0.375 -0.982 -0.018 -0.069
10th Percentile 0.716 -0.334 0.002 0.001
25th Percentile 1.327 0.283 0.172 0.104
50th Percentile 2.611 0.96 0.356 0.172
75th Percentile 3.665 1.299 0.674 0.248
90th Percentile 7.72 2.044 1.277 0.348
95th Percentile 12.671 2.539 2.388 0.442
Mean 4.251 0.809 0.747 0.174
Std Dev 9.573 1.049 3.478 0.199
Skewness 10.548 -0.013 12.098 -0.543
Table 3: Distribution of Price and Price Change: Log and Level
Price per Day 2006 Δ Price per Day 2003-06
First panel summarizes the distribution of the level and log of the price per day in 2006 for the 548 drugs in the sample. Second panel summarizes the change in the per day from 2003 to 2006 and the log change in the price per day from 2003 to 2006. Drugs are weighted by the number of observations in the MEPS.

μ (σ) (1) (2) (3) (4) (5) (6)
Medicare Market Share 2002-03 0.355 -0.128** -0.132** -0.138** -0.137** -0.134** -0.128**(.265) (.057) (.059) (.056) (.057) (.057) (.055)
Δ Log(Price Per Day 2001-2) 0.073 -.333** -0.016 -0.015 -0.012 0.022(.198) (.161) (.138) (.140) (.139) (.177)
Years on the Market 2003 11.5 0.001 0.001 0.001 0.001 0.002(7.2) (.002) (.002) (.002) (.002) (.002)
Any Generic Competition 0.400 0.001 0.011 0.011 0.011 -0.005(.490) (.024) (.024) (.023) (.023) (.023)
Constant - 0.225 0.244 0.217 0.216 0.215 0.207- (.026) (.032) (.032) (.032) (.032) (.037)
# of Observations 518 548 518 508 488 488 200R-squared - 0.016 0.044 0.025 0.025 0.024 0.044
Outliers Excluded? No No No Yes Yes Yes YesCancer Drugs Excluded? No No No No Yes Yes YesRX or Spending MMS? RX RX RX RX RX Spending RX
Top 200 Only: No No No No No No Yes
Table 4: The Impact of Medicare Part D on the Change in Average Pharmaceutical Prices from 2003-06
Dependent Variable: Δ Log(Price Per Dayj,2003-6)
Each column summarizes the results from specifications of the change in the log price per daily dose on the explanatory variables listed in the first column. The unit of observation is the drug and the sample is constructed as described in Section 4C. Specifications 1 through 4 and specification 6 use the share of a drug's prescriptions purchased by Medicare enrolled individuals while specification 5 uses the share of spending for that drug. Specifications 3 through 6 drop those observations with values of the dependent variable in the top 1 percent or the bottom 1 percent of the distribution. Specifications 4 through 6 excludes 20 cancer and immunosuppressant drugs. Specification 6 limits to just the top 200 drugs. Heteroskedasticity-robust standard errors are included in parentheses. *, **, and *** indicate significance at the 10th, 5th, and 1st percentile, respectively. The mean and standard deviation of the dependent variable are equal to .174 and .199, respectively.

μ (σ) (1) (2) (3) (4) (5) (6) (7) (8)
Medicare Market Share 2002-03 0.355 0.516 0.488 0.434 0.445 0.374 0.554 0.452 0.252*(.265) (.320) (.325) (.318) (.321) (.319) (.471) (.314) (.140)
Δ Log(Daily Doses 2001-02) 0.129 0.047 0.031 0.031 0.030 0.029 0.841** -0.011(.841) (.081) (.069) (.069) (.069) (.070) (.336) (.046)
Years on the Market 11.5 0.001 0.003 0.003 0.003 0.014 0.003 -0.023***(7.2) (.011) (.011) (.011) (.011) (.018) (.010) (.008)
Any Generic Competition? 0.400 -1.084*** -1.098*** -1.101*** -1.102*** -1.226*** -1.063*** -(.490) (.193) (.194) (.194) (.195) (.247) (.192)
Δ Log(Daily Doses 2001-02) * Young 0.172 -0.851**(.739) (.336)
Δ Log(Daily Doses 2001-02) * Old -0.055 -.675*(.257) (.350)
Constant - -0.826 -0.333 -0.301 -0.310 -0.280 -0.376 -0.340 -0.005(.161) (.180) (.173) (.174) (.175) (.256) (.171) (.125)
# of Observations 518 548 518 508 489 489 200 489 291R-squared - 0.009 0.268 0.300 0.301 0.299 0.326 0.325 0.301
Outliers Excluded? No No No Yes Yes Yes Yes Yes YesCancer Drugs Excluded? No No No No Yes Yes Yes Yes YesRX or Spending MMS? RX RX RX RX RX Spending RX RX RX
Top 200 Only: No No No No No No Yes No NoExclude if face gen comp? No No No No No No No No Yes
Table 5: The Impact of Medicare Part D on the Change in RX Utilization from 2003-06
Dependent Variable: Δ Log(Daily Dosesj,2003-06)
Each column summarizes the results from specifications of the change in the log number of daily doses on the explanatory variables listed in the first column. The unit of observation is the drug and the sample is constructed as described in Section 4C. Specifications 1 through 4 and specifications 6 through 8 use the share of a drug's prescriptions purchased by Medicare enrolled individuals while specification 5 uses the share of spending for that drug. Specifications 3 through 8 drop those observations with values of the dependent variable in the top 1 percent or the bottom 1 percent of the distribution. Specifications 4 through 8 excludes 20 cancer and immunosuppressant drugs. Specification 6 limits to just the top 200 drugs and specification 8 considers only those sample drugs that do not face generic competition. Heteroskedasticity-robust standard errors are included in parentheses. *, **, and *** indicate significance at the 10th, 5th, and 1st percentile, respectively. The mean and standard deviation of the dependent variable are equal to -0.62 and 1.11, respectively.

μ (σ) (1) (2) (3) (4) (5) (6) (7) (8)
Medicare Market Share 2002-03 0.352 -.137** 0.439 0.334(.263) (.057) (.322) (.319)
Medicare Self-Pay Share 2002-03 0.217 -0.227*** -0.247*** 0.483 0.398 0.255(.191) (.070) (.077) (.426) (.452) (.438)
Medicare Insured Share 2002-03 0.135 0.063 0.341 0.509(.134) (.157) (.879) (.853)
Dual Eligible Share 2002-03 -0.190 -0.838(.276) (1.690)
Other Medicare Insured Share 2002-03 0.202 0.972(.310) (1.222)
Years on the Market 11.4 0.001 0.001 0.001 0.003 0.003 0.003 0.003 0.003(7.2) (.002) (.002) (.002) (.011) (.001) (.011) (.011) (.0109)
Any Generic Competition 0.402 0.011 0.012 0.011 -1.100*** -1.101*** -1.109*** -1.088*** -1.087***(.491) (.023) (.024) (.023) (.194) (.195) (.196) (.188) (.189)
Δ Log(Price Per Day 2001-02) 0.077 -0.015 0.005 0.017(.158) (.140) (.138) (.137)
Δ Log(Daily Doses 2001-02) 0.132 0.030 0.030 0.029(.843) (.068) (.068) (.068)
Δ Log(Total Revenues 2001-02) 0.209 0.044 0.044(.806) (.075) (.076)
Constant - 0.216 0.202 0.205 -0.308 -0.302 -0.286 -0.102 -0.113- (.032) (.033) (.033) (.174) (.187) (.186) (.175) (.186)
# of Observations 488 488 488 488 488 488 488 488 488R-squared - 0.025 0.032 0.035 0.301 0.301 0.303 0.301 0.301
Δ Log(Total Revenues j,2003-06)
Table 6: The Impact of Medicare Market Share: Differentiating between Those with and without RX Insurance
Δ Log(Price Per Dayj,2003-06) Δ Log(Daily Dosesj,2003-06)
Specifications 1 through 3, 4 through 6, and 7 through 8 summarize the results from specifications of the change in the log price per daily dose, the log number of daily doses, and the log of product revenues, respectively, that use the explanatory variables listed in the first column. The unit of observation is the drug and the sample is constructed as described in Section 4C. All eight specifications usethe share of a drug's prescriptions purchased by Medicare enrolled individuals as the measure of Medicare market share, drop those observations with values of the dependent variable in the top 1 percent or the bottom 1 percent of the distribution, and exclude the 20 cancer and immunosuppressant drugs. Heteroskedasticity-robust standard errors are included in parentheses. *, **, and *** indicate significance at the 10th, 5th, and 1st percentile, respectively. The mean and standard deviation of the dependent variable are equal to .174 and .199, respectively.
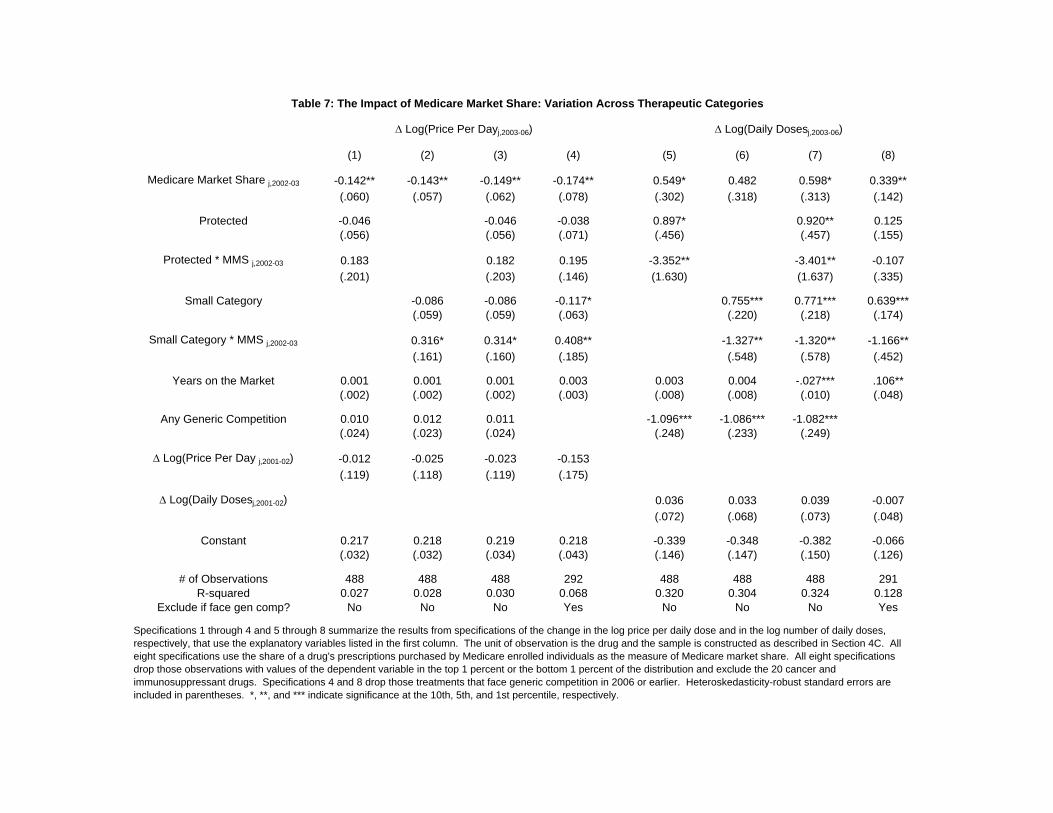
(1) (2) (3) (4) (5) (6) (7) (8)
Medicare Market Share j,2002-03 -0.142** -0.143** -0.149** -0.174** 0.549* 0.482 0.598* 0.339**(.060) (.057) (.062) (.078) (.302) (.318) (.313) (.142)
Protected -0.046 -0.046 -0.038 0.897* 0.920** 0.125(.056) (.056) (.071) (.456) (.457) (.155)
Protected * MMS j,2002-03 0.183 0.182 0.195 -3.352** -3.401** -0.107(.201) (.203) (.146) (1.630) (1.637) (.335)
Small Category -0.086 -0.086 -0.117* 0.755*** 0.771*** 0.639***(.059) (.059) (.063) (.220) (.218) (.174)
Small Category * MMS j,2002-03 0.316* 0.314* 0.408** -1.327** -1.320** -1.166**(.161) (.160) (.185) (.548) (.578) (.452)
Years on the Market 0.001 0.001 0.001 0.003 0.003 0.004 -.027*** .106**(.002) (.002) (.002) (.003) (.008) (.008) (.010) (.048)
Any Generic Competition 0.010 0.012 0.011 -1.096*** -1.086*** -1.082***(.024) (.023) (.024) (.248) (.233) (.249)
Δ Log(Price Per Day j,2001-02) -0.012 -0.025 -0.023 -0.153(.119) (.118) (.119) (.175)
Δ Log(Daily Dosesj,2001-02) 0.036 0.033 0.039 -0.007(.072) (.068) (.073) (.048)
Constant 0.217 0.218 0.219 0.218 -0.339 -0.348 -0.382 -0.066(.032) (.032) (.034) (.043) (.146) (.147) (.150) (.126)
# of Observations 488 488 488 292 488 488 488 291R-squared 0.027 0.028 0.030 0.068 0.320 0.304 0.324 0.128
Exclude if face gen comp? No No No Yes No No No Yes
Table 7: The Impact of Medicare Market Share: Variation Across Therapeutic Categories
Δ Log(Price Per Dayj,2003-06) Δ Log(Daily Dosesj,2003-06)
Specifications 1 through 4 and 5 through 8 summarize the results from specifications of the change in the log price per daily dose and in the log number of daily doses, respectively, that use the explanatory variables listed in the first column. The unit of observation is the drug and the sample is constructed as described in Section 4C. All eight specifications use the share of a drug's prescriptions purchased by Medicare enrolled individuals as the measure of Medicare market share. All eight specifications drop those observations with values of the dependent variable in the top 1 percent or the bottom 1 percent of the distribution and exclude the 20 cancer and immunosuppressant drugs. Specifications 4 and 8 drop those treatments that face generic competition in 2006 or earlier. Heteroskedasticity-robust standard errors are included in parentheses. *, **, and *** indicate significance at the 10th, 5th, and 1st percentile, respectively.

Description June 11, 2006 January 16, 2007(millions) (millions)
Drug Coverage from Medicare or Former Employer Stand-Alone Prescription Drug Plan (PDP) 10.37 10.98 5.9% Medicare Advantage with Prescription Drugs (MA-PD) 6.04 6.65 10.1% Medicare-Medicaid (Automatically Enrolled) 6.07 6.27 3.3% Medicare Retiree Drug Subsidy (RDS) 6.90 6.94 0.6% FEHB Retiree Coverage 1.60 1.47 -8.1% TRICARE Retiree Coverage 1.86 1.86 0.0%TOTAL 32.84 34.17 4.0%
Additional Sources of Creditable Drug Coverage Veterans Affairs (VA) Coverage 2.01 1.85 -8.0% Indian Health Service Coverage 0.11 0.03 -73.6% Active Workers with Medicare Secondary Payer 2.57 2.57 0.0% Other Retiree Coverage, Not Enrolled in RDS 0.10 0.10 0.0% State Pharmaceutical Assistance Programs 0.59 0.31 -47.5%TOTAL 5.38 4.86 -9.7%
Percent change
Appendix Table 1: Total Medicare Beneficiaries with Drug Coverage