national bank of romania - vienna...
TRANSCRIPT
National Bank of Romania
NPL resolution in the case of Romania
Financial Stability Department
National Bank of Romania June 2015
1
Summary
Main features of the Romanian banking sector
Definition of NPL: significant differences across countries
Explanation of NPL levels reached
Reasons for dealing with the NPLs
Factors leading to a reduction of the stock and ratio of NPLs
Measures aimed at reducing the stock of NPLs
2
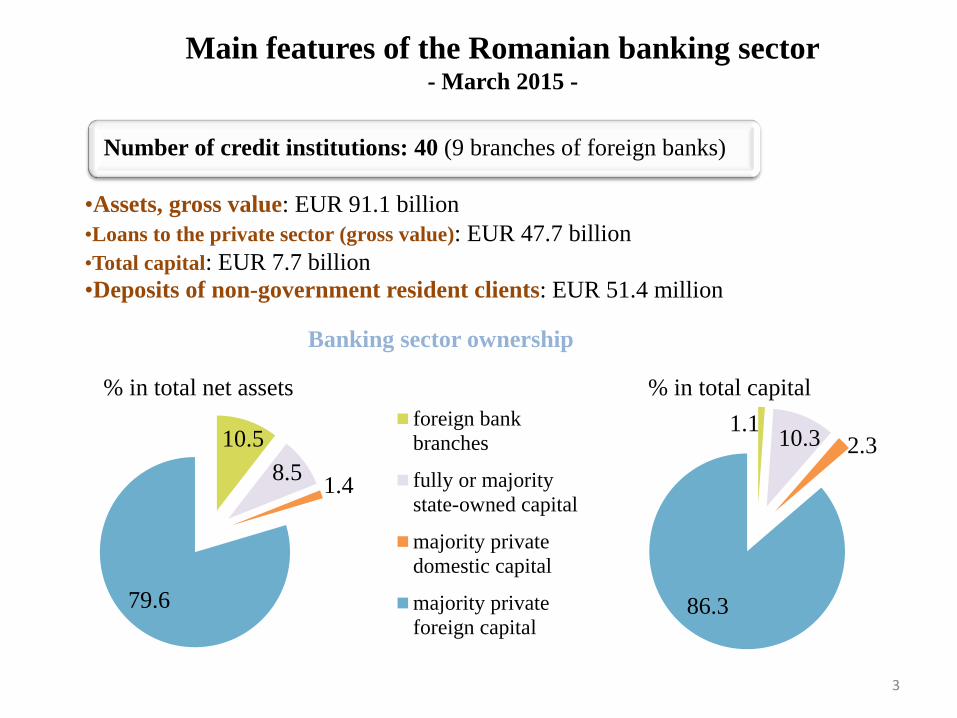
Main features of the Romanian banking sector - March 2015 -
Number of credit institutions: 40 (9 branches of foreign banks)
•Assets, gross value: EUR 91.1 billion •Loans to the private sector (gross value): EUR 47.7 billion •Total capital: EUR 7.7 billion
•Deposits of non-government resident clients: EUR 51.4 million
Banking sector ownership
10.5
8.5 1.4
79.6
foreign bank
branches
fully or majority
state-owned capital
majority private
domestic capital
majority private
foreign capital
% in total net assets % in total capital
1.1 10.3 2.3
86.3
3
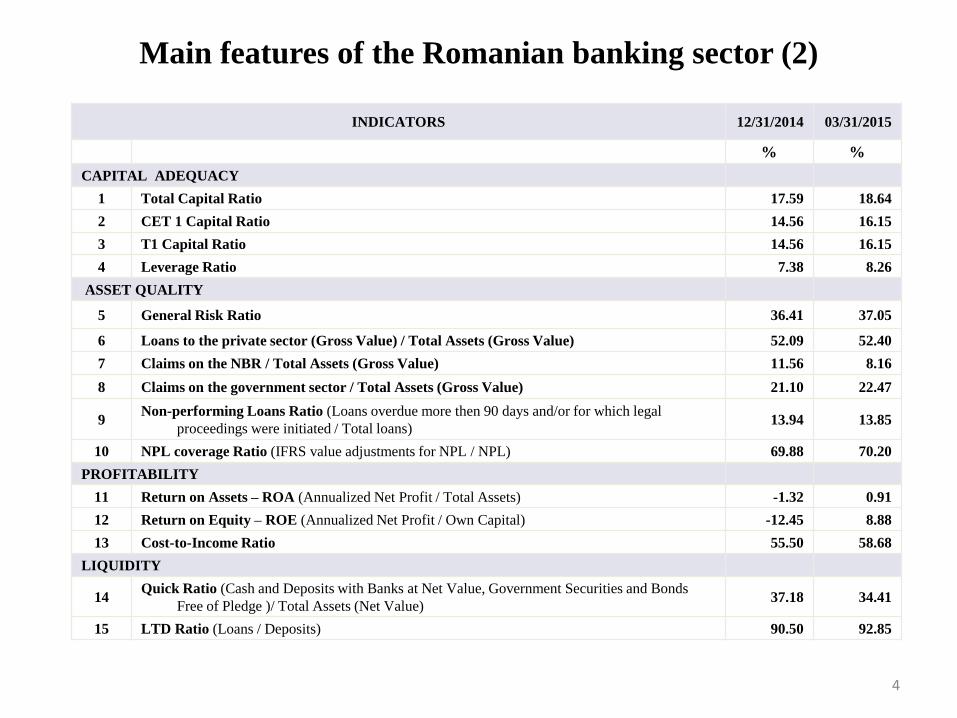
Main features of the Romanian banking sector (2)
INDICATORS 12/31/2014 03/31/2015
% %
CAPITAL ADEQUACY
1 Total Capital Ratio 17.59 18.64
2 CET 1 Capital Ratio 14.56 16.15
3 T1 Capital Ratio 14.56 16.15
4 Leverage Ratio 7.38 8.26
ASSET QUALITY
5 General Risk Ratio 36.41 37.05
6 Loans to the private sector (Gross Value) / Total Assets (Gross Value) 52.09 52.40
7 Claims on the NBR / Total Assets (Gross Value) 11.56 8.16
8 Claims on the government sector / Total Assets (Gross Value) 21.10 22.47
9 Non-performing Loans Ratio (Loans overdue more then 90 days and/or for which legal
proceedings were initiated / Total loans) 13.94 13.85
10 NPL coverage Ratio (IFRS value adjustments for NPL / NPL) 69.88 70.20
PROFITABILITY
11 Return on Assets – ROA (Annualized Net Profit / Total Assets) -1.32 0.91
12 Return on Equity – ROE (Annualized Net Profit / Own Capital) -12.45 8.88
13 Cost-to-Income Ratio 55.50 58.68
LIQUIDITY
14 Quick Ratio (Cash and Deposits with Banks at Net Value, Government Securities and Bonds
Free of Pledge )/ Total Assets (Net Value) 37.18 34.41
15 LTD Ratio (Loans / Deposits) 90.50 92.85
4
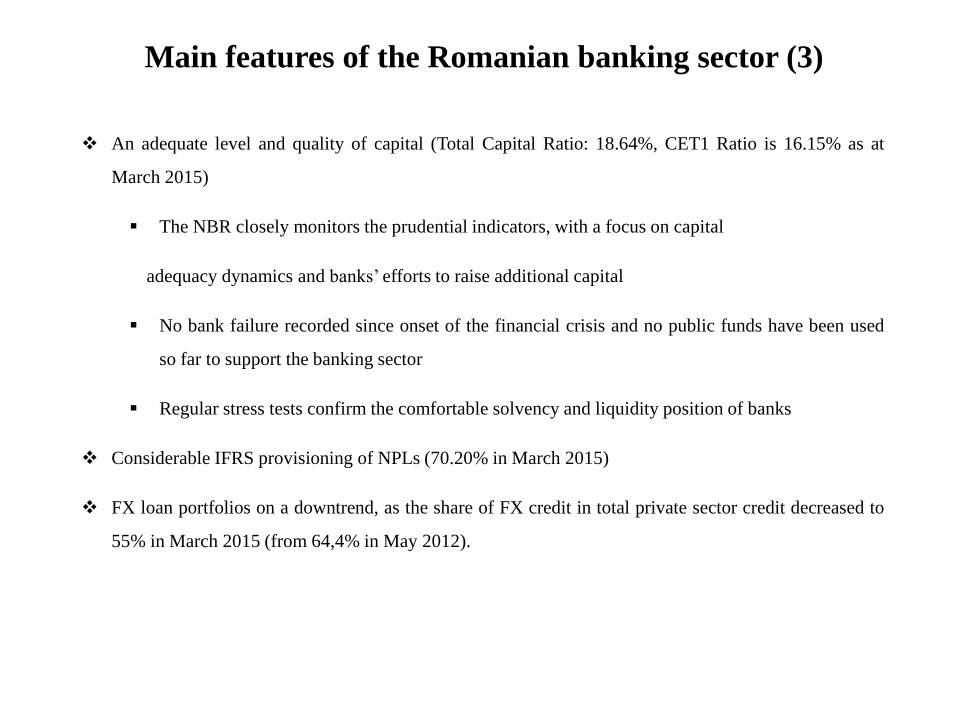
Main features of the Romanian banking sector (3)
An adequate level and quality of capital (Total Capital Ratio: 18.64%, CET1 Ratio is 16.15% as at
March 2015)
The NBR closely monitors the prudential indicators, with a focus on capital
adequacy dynamics and banks’ efforts to raise additional capital
No bank failure recorded since onset of the financial crisis and no public funds have been used
so far to support the banking sector
Regular stress tests confirm the comfortable solvency and liquidity position of banks
Considerable IFRS provisioning of NPLs (70.20% in March 2015)
FX loan portfolios on a downtrend, as the share of FX credit in total private sector credit decreased to
55% in March 2015 (from 64,4% in May 2012).
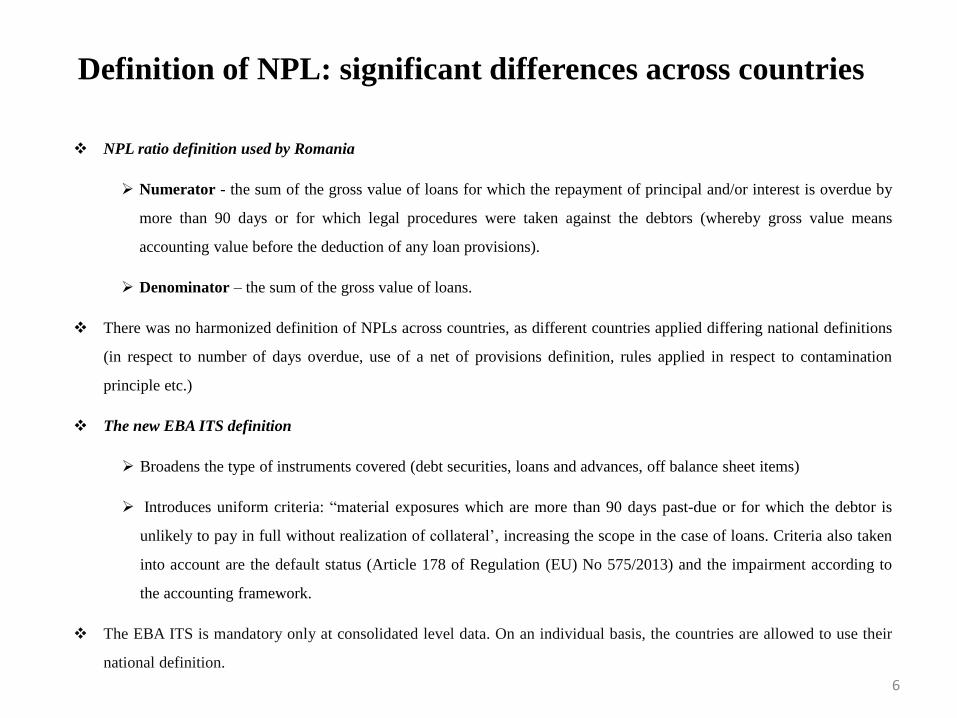
Definition of NPL: significant differences across countries
NPL ratio definition used by Romania
Numerator - the sum of the gross value of loans for which the repayment of principal and/or interest is overdue by
more than 90 days or for which legal procedures were taken against the debtors (whereby gross value means
accounting value before the deduction of any loan provisions).
Denominator – the sum of the gross value of loans.
There was no harmonized definition of NPLs across countries, as different countries applied differing national definitions
(in respect to number of days overdue, use of a net of provisions definition, rules applied in respect to contamination
principle etc.)
The new EBA ITS definition
Broadens the type of instruments covered (debt securities, loans and advances, off balance sheet items)
Introduces uniform criteria: “material exposures which are more than 90 days past-due or for which the debtor is
unlikely to pay in full without realization of collateral’, increasing the scope in the case of loans. Criteria also taken
into account are the default status (Article 178 of Regulation (EU) No 575/2013) and the impairment according to
the accounting framework.
The EBA ITS is mandatory only at consolidated level data. On an individual basis, the countries are allowed to use their
national definition.
6
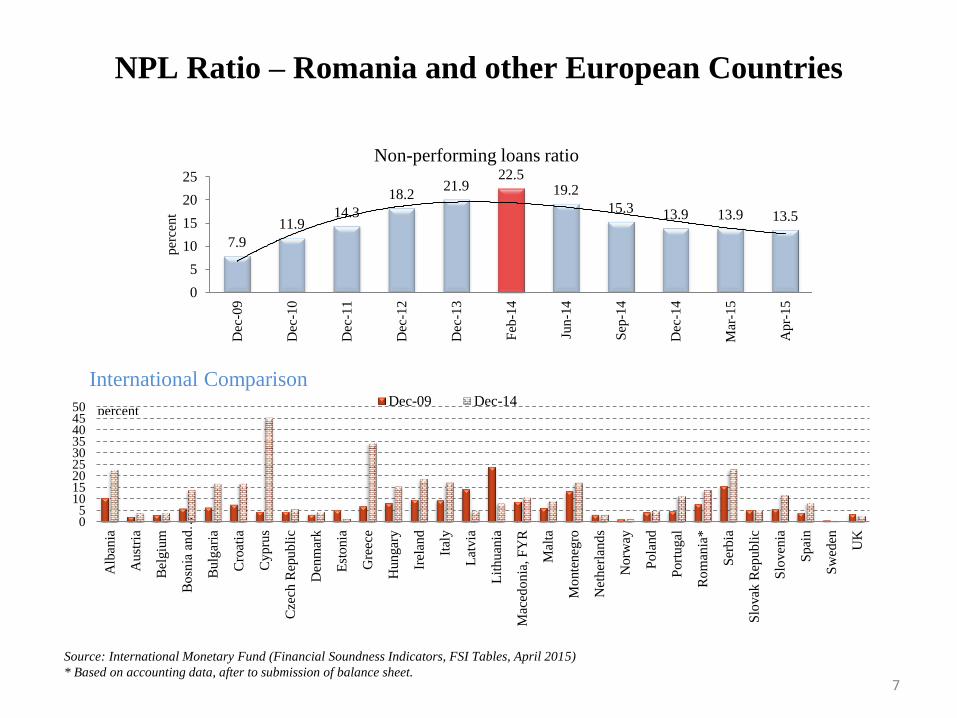
NPL Ratio – Romania and other European Countries
Source: International Monetary Fund (Financial Soundness Indicators, FSI Tables, April 2015)
* Based on accounting data, after to submission of balance sheet.
International Comparison
05
101520253035404550
Alb
ania
Aust
ria
Bel
giu
m
Bosn
ia a
nd…
Bulg
aria
Cro
atia
Cyp
rus
Cze
ch R
epubli
c
Den
mar
k
Est
onia
Gre
ece
Hungar
y
Irel
and
Ital
y
Lat
via
Lit
huan
ia
Mac
edonia
, F
YR
Mal
ta
Monte
neg
ro
Net
her
lands
Norw
ay
Pola
nd
Port
ugal
Rom
ania
*
Ser
bia
Slo
vak
Rep
ubli
c
Slo
ven
ia
Spai
n
Sw
eden
UK
Dec-09 Dec-14percent
7.9
11.9 14.3
18.2 21.9
22.5 19.2
15.3 13.9 13.9 13.5
0
5
10
15
20
25
Dec
-09
Dec
-10
Dec
-11
Dec
-12
Dec
-13
Feb
-14
Jun-1
4
Sep
-14
Dec
-14
Mar
-15
Apr-
15
per
cent
Non-performing loans ratio
7
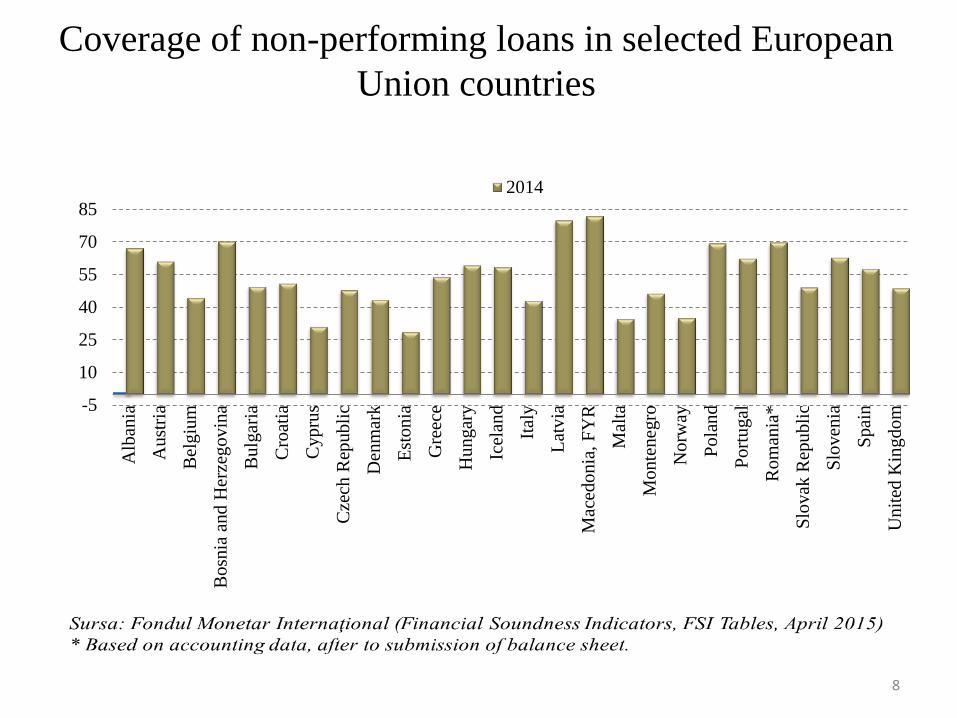
Coverage of non-performing loans in selected European
Union countries
-5
10
25
40
55
70
85
Alb
ania
Au
stri
a
Bel
giu
m
Bosn
ia a
nd
Her
zeg
ovin
a
Bulg
aria
Cro
atia
Cyp
rus
Cze
ch R
epubli
c
Den
mar
k
Est
on
ia
Gre
ece
Hu
ngar
y
Icel
and
Ital
y
Lat
via
Mac
edo
nia
, F
YR
Mal
ta
Monte
neg
ro
No
rway
Pola
nd
Port
ugal
Rom
ania
*
Slo
vak
Rep
ubli
c
Slo
ven
ia
Spai
n
Un
ited
Kin
gdo
m
2014
8
Why did the NPL ratio reach a very high level? (1)
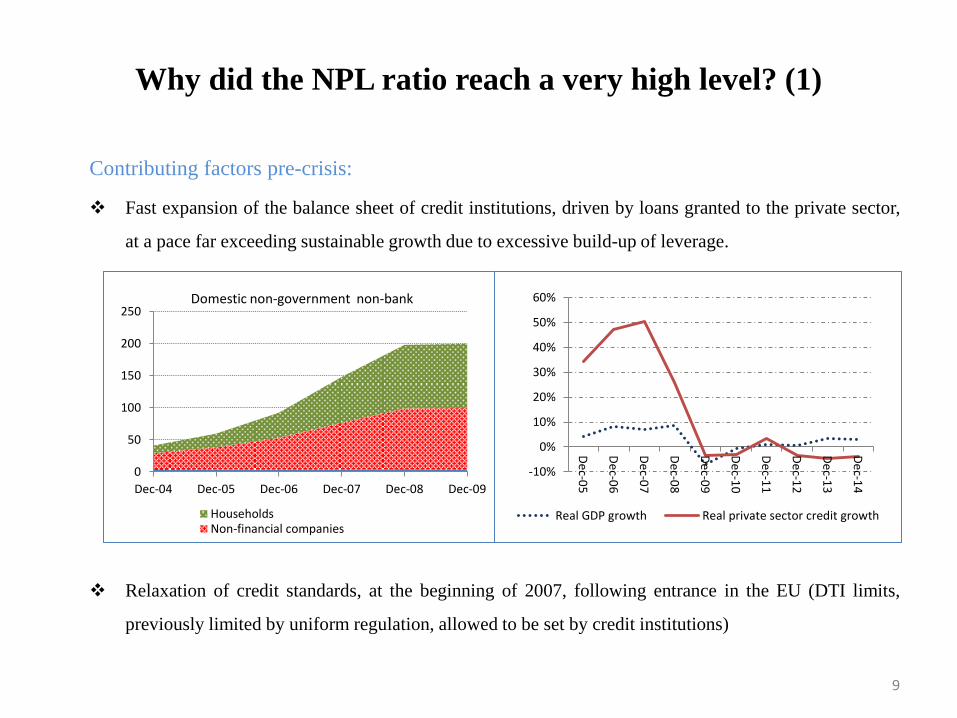
Contributing factors pre-crisis:
Fast expansion of the balance sheet of credit institutions, driven by loans granted to the private sector,
at a pace far exceeding sustainable growth due to excessive build-up of leverage.
Relaxation of credit standards, at the beginning of 2007, following entrance in the EU (DTI limits,
previously limited by uniform regulation, allowed to be set by credit institutions)
0
50
100
150
200
250
Dec-04 Dec-05 Dec-06 Dec-07 Dec-08 Dec-09
HouseholdsNon-financial companies
Domestic non-government non-bank
-10%
0%
10%
20%
30%
40%
50%
60%
De
c-05
De
c-06
De
c-07
De
c-08
De
c-09
De
c-10
De
c-11
De
c-12
De
c-13
De
c-14
Real GDP growth Real private sector credit growth
9
Why did the NPL ratio reach a very high level? (2)
Contributing factors pre-crisis (continued):
Fast increase of FX loans granted to households, also due to lower interest rates: while the NBR tried to
prevent it, the need for a “level playing field” was invoked; this was to become an open door to FX
lending to some of the riskiest debtors
Limited history on new borrowers, despite a comprehensive Credit Register database
Poor understanding of the effects of changing macroeconomic conditions on corporate business models
(banks).
Limited financial culture and lack of constraint, backward looking expectations as regards real estate
developments, stability of exchange rates, income growth on the part of retail customers
In some cases, predatory lending, oriented at portfolio growth, with little regard to the repayment
capacity of the debtor, consequence of a poor corporate governance, leading to misaligned interests
between the management of credit institutions (short-term) and its shareholders
If fully covered with IFRS provisions, the NPL level is neutral from a risk perspective. At low coverage
ratios, if the level is excessive, it can lead to suboptimal decisions in respect to new lending via capital
shortfalls.
10
Why did the NPL ratio reach a very high level? (3)
Post-crisis:
Difficult write-offs: A decision taken in 2007 by the National Bank of Romania, requesting
credit institutions to keep all NPLs in their balance sheet until all legal means to recover the
loss were exhausted, leading to a steady build-up in the stock of NPLs. The decision was
taken so that the balance sheet would be reflective of the lending performance (reversed
after the introduction of IFRS).
Lack of bank-level strategies aimed at addressing the problem of poorly performing
exposures at a very early stage.
Expectations regarding collateral value pick-up, leading to reluctance of credit institutions
to recognize additional losses associated with sales.
Significantly lower pace of the lending activity (both due to increased risk aversion and
rethinking of business strategies and the need to preserve capital in order to cover losses,
leading to a significant increase of the government bonds share in overall assets).
11
Why deal with NPLs?
Considering very high coverage levels, the NPL ratio is not an ongoing risk factor, but
Low coverage with provisions coupled with high levels of NPLs lead to suboptimal decisions in respect
to new lending via concerns in respect to the real solvency position of credit institutions.
Because of capital costs, most efficient credit institutions prefer to operate at low levels of capital
(compliant with regulatory requirements); volatility of collateral values requiring, in a downturn,
increased coverage with provisions for existing non-performing loans would, at the margin, cause banks
to avoid lending bearing high risk-weights, in order to avoid potential capital shortfalls.
For supervisors, one of the main concern are losses stemming from a low interest rate environment,
conducive of forbearance. Coupled with NPLs, it can lead to a substantial build-up of assets for which
value adjustments can cause sudden drops in the level of regulatory capital.
No such concerns were applicable in Romania’s case, where existing capital is able to support a large
increase of RWAs and the coverage with provision of NPLs is considered to be high. The restructuring
practices of banks for the largest exposures are currently monitored to avoid ever-greening of non-
performing loans.
12
Factors leading to a reduction of the stock and ratio of NPLs (1)
Accounting and fiscal measures leading to a reduced NPL ratio:
The adoption of IFRS as accounting standards in 2012 gave credit institutions more
flexibility in applying their internal policies in respect to “write-off” activities. When adopted,
the amount of accounting provisions according to IFRS were lower than the former loan loss
provisions according to the prudential regime. The difference, representing a capital surplus,
was treated as a prudential filter (for prudential purposes, banks were not allowed to
recognize the increase in the level of own funds due to lower provisions requirements).
Under CRD IV, the filter is gradually being phased out until 2018.
For fiscal purposes, companies buying NPLs were allowed to deduct the value of provisions
from the gross value of the purchased loans when determining the taxable base.
13
Factors leading to a reduction of the stock and ratio of NPLs (2)
Economic factors and prudential policy
Gradual improvement of the economic activity, leading to decreased default rates and
slowdown of new NPLs;
Tight lending standards and introduction of new macro-prudential measures (tightening of the
rules applicable to DTI and LTV, also differentiated based on the lending currency).
“Hands-on” supervision, with little forbearance, leading to early recognition of losses in the
years after the crisis
14
Measures aimed at reducing the stock of NPLs (1)
Supervisory measures, taken in 2014:
Letters sent to credit institutions recommending the “write-off “ of NPLs fully covered with IFRS
provisions.
Full coverage with IFRS provisions for all NPLs for which repayment of principal and/or interest was
overdue by more than 360 days and no legal procedures where taken against the debtors. Where the credit
institution chooses not to apply the measure, the accounting value of the exposure is applied a risk weight
of 1250% (equivalent to demanding full coverage in terms of capital).
For all exposures towards debtors in insolvency for which the value of the recovery was small, a coverage
of at least 90% of the gross exposure was demanded. Credit institutions using a value of recoveries above
10% of the gross exposure in order to determine the amount of IFRS provisions to be recognized were
demanded to provide the methodologies used to assess the amount of recoveries as well as to provide
statistical data proving the accuracy of such estimations.
15
Measures aimed at reducing the stock of NPLs (2)
Data provided by credit institutions were very granular nature: name of debtor, its fiscal code, code of the
identification of exposures (as reported in the Credit Register), debt service, data on financial performance, IFRS
provisions and prudential provisions, date at which the debtor applied for insolvency, total amounts repayed after
insolvency, collateral values according to the last evaluation, an estimation of the maximum value of the exposure
that could be repayed taking into consideration collateral values).
External audit of the accounting methodologies used to determine the amount of IFRS provisions, including
approaches taken for collateral valuation (compliant with International evaluation Standards).
Results: In order to release capital that would have otherwise been locked by provisions, credit institutions preferred to
sell some of the NPLs. Where fully covered with IFRS provisions, credit institutions generally complied with NBR’s
recommendations.
16
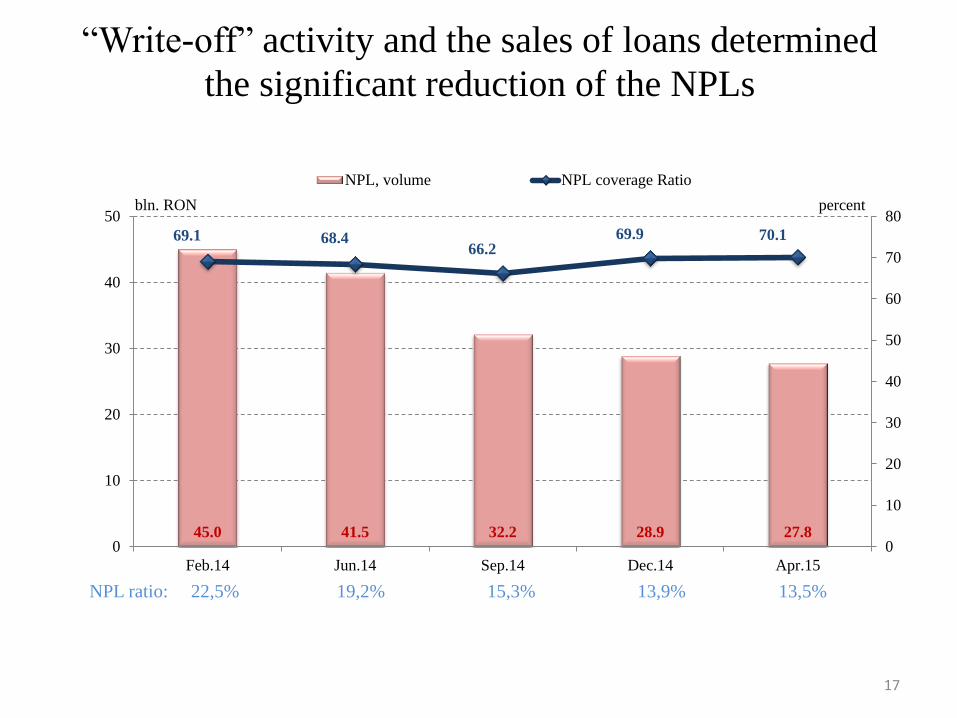
“Write-off” activity and the sales of loans determined
the significant reduction of the NPLs
45.0 41.5 32.2 28.9 27.8
69.1 68.4 66.2
69.9 70.1
0
10
20
30
40
50
60
70
80
0
10
20
30
40
50
Feb.14 Jun.14 Sep.14 Dec.14 Apr.15
NPL, volume NPL coverage Ratio
bln. RON percent
NPL ratio: 22,5% 19,2% 15,3% 13,9% 13,5%
17