national bank of pakistan (nbp) · national bank (nbp) – improving asset quality to narrow...
TRANSCRIPT

Best Local Brokerage House
Brokers Poll 2011, 2012, 2013 & 2014
National Bank of Pakistan(NBP)
Aug 31, 2016
Umair NaseerAC
Topline Securities, PakistanREP-057
www.jamapunji.pk
(NBP)

National Bank (NBP) – Improving asset quality to narrow valuation discount
Economic recovery to drive loan recoveries & lower provision
� Investment Thesis: We upgrade our stance on NBP to ‘Buy’ on the back of 28-36% increase
in 2016-18 earnings estimates. This earnings revision is on the back of 1) asset recoveries &
downward revision in our provisioning estimate, 2) higher than our estimated NII in 2Q2016 and
3) incorporation of 2Q2016 financial results. We revise up our target price by 36% to
Rs82/share. The stock also offers dividend yield of 11%. Our liking for the stock stems from 1)
improved asset quality & expected decline in provisioning, 2) strong capital adequacy ratio &
likelihood of better dividend payout & 3) attractive valuation on PE & PBV basis.
� Macroeconomic recovery & lower provisions to drive bottom-line: Improving macros and
Report completed on Aug 31, 2016Prices as of Aug 30, 2016
KATS Code NBP
Bloomberg Code NBP PA
Reuters Code NBPK.KA
Market Price Rs73.65
Market Cap Rs156.7bn/US$1.5bn
Free float Market Cap Rs37.3bn/US$355.5mn
1-Yr Avg. Daily Vol. (mn) 1.4
1-Yr Avg. Daily Val. (mn) Rs83.2/US$0.8
1-Yr High/ Low Rs73.6/51.2
2
multi-year low interest rates have improved Non-Performing Loans (NPLs) and provisioning
expense outlook for NBP. NBP has one of the highest Gross NPL ratio of 17.8% as compared
to 11% of the industry and is a cause of concern for investors. This has resulted in high
provisioning expense during the last few years. In 2015, it cost NBP Rs10.8bn (Rs3.1/share).
Improved macros and strong surveillance is likely to bring down this number to Rs4bn in 2016
(Rs0.74/share). Provisioning against NPLs is already down 71% YoY in 1H2016 to Rs1.9bn.
� Strong dividend payout to continue: NBP will continue with its strong dividend payout
tradition as the bank enjoys above average CAR of 18% (industry average 16.5%). This is
comfortably higher than SBP target of 10%. In 2015, NBP declared dividend of Rs7.5/share
(payout ratio of 80%).
National Bank of Pakistan (NBP)
Source: PSX, Topline Research
NBP vs KSE-100 Index
Estimated free float 24%
Share outstanding (mn) 2,127.51
Index weight 1.77%
-15%
1%
17%
34%
50%
Aug-1
5
Oct-
15
Dec-1
5
Feb-1
6
Apr-
16
Jun-1
6
Aug-1
6
NBP KSE-100

National Bank (NBP) – Improving asset quality to narrow valuation discount
� In 2016, we expect NBP to announce dividend of Rs8/share which translates into dividend yield of 11%. This is significantly higher than
the prevailing risk free rates of ~6% and average market dividend yield of 5%. NBP also offers one of the highest dividend yields among
the companies in Topline Universe.
� Valuation discount to narrow: NBP has historically traded at a discount to its book value due to concerns over asset quality and
sustainability of its earnings. It has traded at discount to Topline banking universe average PBV of 1.3x. We believe that improving
earnings outlook amid decline in loss ratio and absence of major NPLs on oversees operations, this discount will narrow down and NBP
will converge to its estimated year end book value of Rs81/share with expected ROE of 12-13%.
� Key Risks: We flag 1) resurfacing of NPLs, 2) substantial cut in interest rates, 3) deterioration of Pakistan macros as key risks, & 4)
political interference.
3National Bank of Pakistan (NBP)
political interference.
NBP: Key Numbers
2014A 2015A 2016E 2017F 2018F
EPS 7.6 9.4 9.5 10.5 11.4
Earnings Growth 205% 25% 1% 10% 9%
PE at Rs73.7 9.7 7.8 7.7 7.0 6.4
Dividend Yield 7% 10% 11% 12% 12%
ROE 9% 12% 12% 13% 14%
PBV 0.9 0.9 0.9 0.9 0.9
Source: Company Accounts, Topline Research

Provisioning Expense & NPL ratio to go down
� Provisioning expense that has affected
NBP’s bottom-line significantly over the
years is likely to fall amid major recoveries
and improving macros. In 2016, we expect
provisioning expense to come down to
Rs4bn vs. Rs11bn in 2015. In 1H2016,
provisioning expense has already come
down by 71% to Rs1.9bn.
� Another key issue restricting provisioning
Provisioning Expense & NPL Ratio
8.0%
10.0%
12.0%
14.0%
16.0%
18.0%
20.0%
-
4,000
8,000
12,000
16,000
20,000
2007A 2008A 2009A 2010A 2011A 2012A 2013A 2014A 2015A 2016E
Rsmn Provisioning Charge during the year Gross NPL ratio
4National Bank of Pakistan (NBP)
� Another key issue restricting provisioning
charge is lack of international NPL accretion.
To recall, NBP incurred heavy losses (NPLs
of ~Rs15bn) against Bangladesh operations.
� Multi-year low interest rates and economic
recovery also remain key elements in
improving asset quality.
� Management of the company also expects
a 40-50% decline in provisioning due to this
improved outlook.
Source: Company Accounts, Topline Research
Source: SBP, Company Accounts
Declining rates & NPL ratio
5%
7%
9%
11%
13%
15%
17%
19%
21%
2007A 2008A 2009A 2010A 2011A 2012A 2013A 2014A 2015A 2016E
Kibor Gross NPL ratio

NPL still higher but on declining trend
Bank wise NPL ratio (Jun 30, 2016)
� NBP has the highest NPL ratio amongst
the peers and consequently a higher
provisioning charge. In a declining or
improving NPL scenario, NBP is likely to
benefit more compared to peers due to
profound impact on the bottom-line.
� In 2Q2016, gross NPL ratio improved to
17.8% as against full year 18.5% for 2015.
0.0%
3.0%
6.0%
9.0%
12.0%
15.0%
18.0%
ABL BAFL BAHL HBL MCB NBP UBL
5.9% 5.3%
2.3%
10.8%
5.5%
17.8%
8.4%
5
Company background
National Bank of Pakistan (NBP)
Source: Company Accounts, Topline Research
Source: Company Accounts, Topline Research
Provisioning & Profitability
17.8% as against full year 18.5% for 2015.
Similarly, provisioning expense in 1H2016
has declined by 71% to Rs1.9bn.
Management has highlighted that recoveries
on international front (Bangladesh
operations) and domestic operations (mainly
from Sugar and Textile sectors) has led to
this recovery.
� Management expects this trend to
continue due to increase recovery efforts.
5,000
10,000
15,000
20,000
25,000
-
5,000
10,000
15,000
20,000
25,000
2007A
2008A
2009A
2010A
2011A
2012A
2013A
2014A
2015A
2016E
RsmnRsmn
Provisioning Charge during the year (LHS) Profitability (RHS)

NPLs on international business to decline
International NPL & NPL Ratio
� NPLs on the international operations
constitutes around 25% of the total NPLs of
the bank. NPLs specifically against
Bangladesh operation has led to sharp spike
in provisioning expense in 2013 and 2014 and
thus lower earnings.
� In 1H2016, the bank has not only witnessed
improvement on international operation but
� NPLs on the international operations
constitutes around 25% of the total NPLs of
the bank. NPLs specifically against
Bangladesh operation has led to sharp spike
in provisioning expense in 2013 and 2014 and
thus lower earnings.
� In 1H2016, the bank has not only witnessed
improvement on international operation but0.0%
10.0%
20.0%
30.0%
40.0%
50.0%
60.0%
-
5,000
10,000
15,000
20,000
25,000
30,000
35,000
2011A 2012A 2013A 2014A 2015A
RsmnInternational NPLs International NPL ratio
6National Bank of Pakistan (NBP)
Source: Company Accounts, Topline Research also on local operations. As a result, 1H2016
profitability was up 62% despite lower capital
gains and falling interest rates.
also on local operations. As a result, 1H2016
profitability was up 62% despite lower capital
gains and falling interest rates.
� Over 80% of NBP remains covered and net
NPL ratio of the bank is 2.2% from 5.3% in
2010.
� Over 80% of NBP remains covered and net
NPL ratio of the bank is 2.2% from 5.3% in
2010.
Source: Company Accounts, Topline Research
Coverage & net NPL ratio
0.0%
1.0%
2.0%
3.0%
4.0%
5.0%
6.0%
0%
20%
40%
60%
80%
100%
20
07
A
20
08
A
20
09
A
20
10
A
20
11
A
20
12
A
20
13
A
20
14
A
20
15
A
20
16
E
Coverage Ratio Net NPL ratio

Advances growth to pick up
Advances growth
� Advances growth of NBP during the past
years have remained lackluster however it is
expected to pick up going forward due to
improving macros and higher demand of
infrastructure and power projects.
� Advances growth of NBP during the past
years have remained lackluster however it is
expected to pick up going forward due to
improving macros and higher demand of
infrastructure and power projects.
-10%
-5%
0%
5%
10%
15%
(50,000)
50,000
150,000
250,000
350,000
450,000
550,000
650,000
750,000
850,000
2013A 2014A 2015A 2016E 2017F 2018F
Rsmn Advances Growth
7National Bank of Pakistan (NBP)
Source: Company Accounts, Topline Research � One of the major development on this front
has been Rs100bn Neelum Jhelum Hydro
Power Project under which NBP is likely to
disperse Rs35bn as a lead financer.
� Due to Neelum Jhelum Project and other
related projects we anticipate advances to
grow by 11% in 2016-18 as against decline of
4% during last 3-years.
� One of the major development on this front
has been Rs100bn Neelum Jhelum Hydro
Power Project under which NBP is likely to
disperse Rs35bn as a lead financer.
� Due to Neelum Jhelum Project and other
related projects we anticipate advances to
grow by 11% in 2016-18 as against decline of
4% during last 3-years.
Source: Company Accounts, Topline Research
ADR vs. IDR
0%
10%
20%
30%
40%
50%
60%
70%
80%
2009A 2010A 2011A 2012A 2013A 2014A 2015A 2016E 2017F 2018F
65%
57% 57%
64%
56%51%
41% 41% 40% 40%
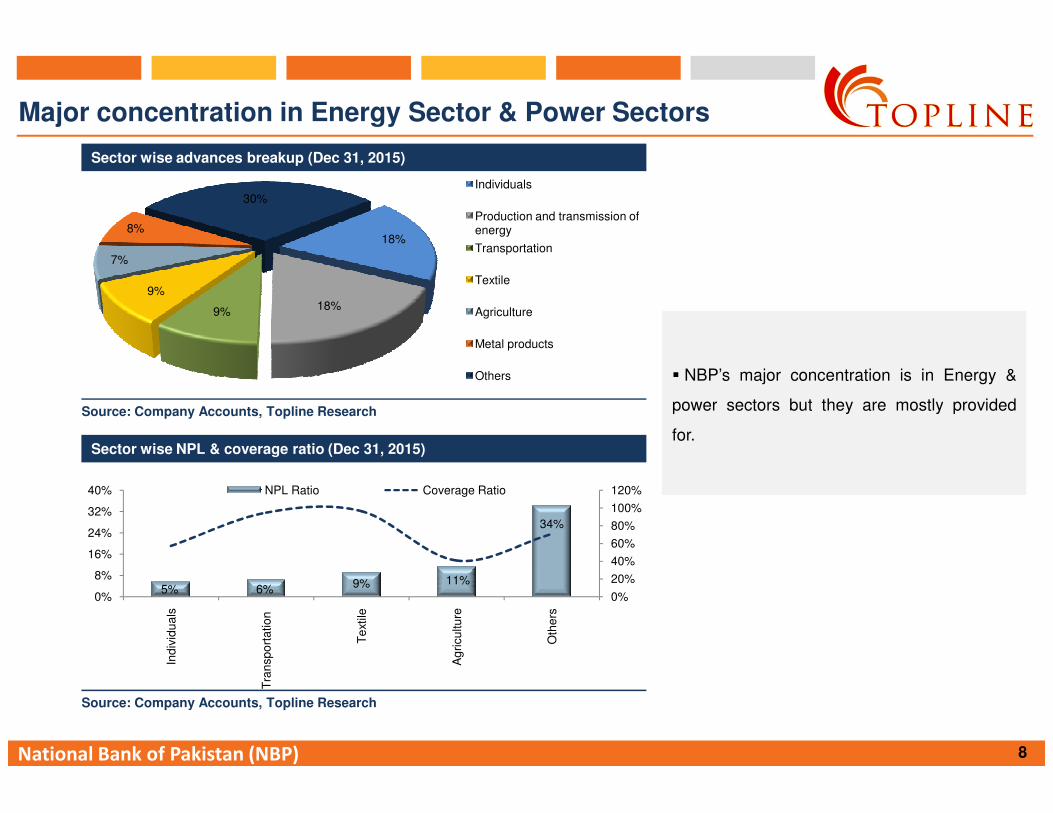
Major concentration in Energy Sector & Power Sectors
Source: Company Accounts, Topline Research
Sector wise advances breakup (Dec 31, 2015)
18%
18%9%
9%
7%
8%
30%Individuals
Production and transmission of energy
Transportation
Textile
Agriculture
Metal products
Others � NBP’s major concentration is in Energy &
power sectors but they are mostly provided
� NBP’s major concentration is in Energy &
power sectors but they are mostly provided
8National Bank of Pakistan (NBP)
Source: Company Accounts, Topline Research
Source: Company Accounts, Topline Research
Sector wise NPL & coverage ratio (Dec 31, 2015)
5% 6% 9% 11%
34%
0%
20%
40%
60%
80%
100%
120%
0%
8%
16%
24%
32%
40%
Ind
ivid
ua
ls
Tra
nsp
ort
atio
n
Te
xtile
Ag
ricu
ltu
re
Oth
ers
NPL Ratio Coverage Ratio
power sectors but they are mostly provided
for.
power sectors but they are mostly provided
for.

NBP enjoys one of the highest CAR ratio
Source: Company Accounts, Topline Research
Bank wise CAR ratio (Dec 31, 2015)
0.0%
5.0%
10.0%
15.0%
20.0%
25.0%
ABL BAFL BAHL HBL MCB NBP UBL
20.9%
13.4% 13.9%
17.0%
19.0% 18.4%
14.7%
Rsmn
� NBP is well covered in terms of capital
adequacy. CAR of 18.4% is well above SBP
requirement of 10% and is highest followed by
ABL and MCB.
� NBP is well covered in terms of capital
adequacy. CAR of 18.4% is well above SBP
requirement of 10% and is highest followed by
ABL and MCB.
9National Bank of Pakistan (NBP)
Source: Company Accounts, Topline Research
Source: Company Accounts, Topline Research
Dividend and Payout ratio (Dec 31, 2015)
5.93 6.09
2.00 5.50
7.50 7.75
8.32 7.32
2.48
7.56
9.42 9.54
70%
73%
76%
79%
82%
85%
-
2.00
4.00
6.00
8.00
10.00
12.00
14.00
16.00
18.00
20.00
2011A 2012A 2013A 2014A 2015A 2016E
Rs/share EPS DPS Dividend Payout
� Strong CAR has led to strong payout ratio
for the company over the years and is
expected to continue going forward.
� Comfortable CAR will help NBP to lend
aggressively in future.
� Strong CAR has led to strong payout ratio
for the company over the years and is
expected to continue going forward.
� Comfortable CAR will help NBP to lend
aggressively in future.

NBP has historically traded at a discount to its book value
Source: Company Accounts, Topline Research
Valuation
0.5
0.6
0.7
0.8
0.9
1.0
Jan-15 Mar-15 May-15 Jun-15 Aug-15 Oct-15 Dec-15 Feb-16 Apr-16 Jun-16 Aug-16
Rsmn PBV Average
Avg PBV of 0.7x � NBP’s has historically traded at a Price to
Book Value (PBV) of less than 1 due to asset
quality concerns and earnings volatility. With
improving asset quality and expected uptick in
ROE to ~13%, we anticipate NBP to converge
to its book value.
� NBP’s has historically traded at a Price to
Book Value (PBV) of less than 1 due to asset
quality concerns and earnings volatility. With
improving asset quality and expected uptick in
ROE to ~13%, we anticipate NBP to converge
to its book value.
10National Bank of Pakistan (NBP)
Source: Company Accounts, Topline Research
Pakistan Banks Valuation
Symbol 2017 PE 2017 PBV 2017 ROE
Allied Bank ABL 6.5 1.1 17%
Bank Al-Falah BAFL 5.9 0.8 13%
Bank Al-Habib BAHL 6.9 1.1 16%
Habib Bank HBL 9.2 1.6 17%
MCB Bank MCB 9.9 1.6 16%
National Bank NBP 7.0 0.9 13%
United Bank UBL 8.0 1.3 17%
Source: Company Accounts, Topline Research

Financial Snapshot
Consolidated Income Statement Key Ratio
Rsmn 2014A 2015E 2016F 2017F 2018F 2014A 2015E 2016F 2017F 2018F
Mark-up / Interest earned 115,250 114,386 110,370 121,750 141,809 Return on performing loans 11.5% 9.7% 7.9% 7.7% 8.2%
Mark-up / Interest expense 70,100 59,999 57,880 66,370 82,290 Cost of deposits 7.5% 5.7% 4.7% 4.5% 5.0%
Net Mark-up / Interest income 45,150 54,387 52,491 55,380 59,519 Net interest margin (NIM) 4.1% 4.2% 3.4% 3.0% 2.9%
Non-Interest Income 31,399 35,104 31,954 34,075 37,510 NII/ Gross Income 59.0% 60.8% 62.2% 61.9% 61.3%
Capital Gain 8,660 12,283 5,835 4,825 5,013 Cost / Income ratio 53.5% 49.0% 56.1% 57.2% 57.0%
Gross Income 76,549 89,491 84,444 89,455 97,029 Deposit growth 12.0% 16.0% 8.3% 13.3% 13.3%
Operating expenses 44,113 45,374 48,150 51,960 56,196 Credit growth 1.6% -8.0% 9.3% 11.9% 11.9%
Pre provision & taxes profits 32,436 44,117 36,294 37,495 40,833 Investment growth 41.7% 47.1% 31.5% 14.1% 14.1%
Provisions/Reversals 9,303 9,945 2,984 3,127 3,399 Return on equity (ROE) 9.4% 11.3% 11.8% 12.8% 13.8%
Profit before taxation 23,133 34,173 33,310 34,368 37,435 Return on assets (ROA) 1.1% 1.2% 1.1% 1.1% 1.0%
Profit after taxation 16,085 20,043 20,285 22,339 24,333 Advance-to-deposit (ADR) 51.1% 40.5% 40.9% 40.4% 39.9%
11National Bank of Pakistan (NBP)
Profit after taxation 16,085 20,043 20,285 22,339 24,333 Advance-to-deposit (ADR) 51.1% 40.5% 40.9% 40.4% 39.9%
EPS (Rs) 7.6 9.4 9.5 10.5 11.4 Investment-to-deposit (IDR) 45.5% 57.7% 70.1% 70.6% 71.1%
Source: Company, Topline Research CASA 76.5% 76.9% 76.9% 76.9% 76.9%
Gross infection ratio (%) 16.6% 18.5% 16.9% 16.1% 15.4%
Consolidated Balance Sheet Net infection ratio (%) 3.7% 2.4% 2.2% 2.1% 1.9%
Rsmn 2014A 2015E 2016F 2017F 2018F Coverage ratio (%) 81.0% 89.1% 89.1% 89.1% 89.1%
Paid-up capital 21,275 21,275 21,275 21,275 21,275 Number of Branches 1,377 1,424 1,434 1,444 1,454
Shareholders' equity 114,023 119,202 123,259 127,727 132,593 Source: Company, Topline Research
Total equity 182,593 171,655 173,125 175,136 177,668
Deposits 1,234,405 1,431,535 1,549,637 1,754,964 1,988,374
Total liabilities 1,367,066 1,540,219 1,790,900 2,016,759 2,273,510
Net advances 630,230 580,094 633,778 709,011 793,194
Net investments 561,768 826,247 1,086,319 1,238,999 1,413,901
Total Assets 1,549,659 1,711,874 1,964,025 2,191,895 2,451,179
Source: Company, Topline Research

The research analyst(s), denoted by an “AC” on the cover of this report, primarily involved in the preparation of this report, certifies that (1) the views
expressed in this report accurately reflect his/her personal views about all of the subject companies/securities/sectors and (2) no part of his/her
compensation was, is or will be directly or indirectly related to the specific recommendations or views expressed in this report.
Furthermore, it is stated that the research analyst or its close relative have neither served as a director/officer in the past 3 years nor received any
compensation from the subject company in the past 12 months.
Additionally, as per regulation 8(2)(i) of the Research Analyst Regulations, 2015, we currently do not have a financial interest in the securities of the
subject company aggregating more than 1% of the value of the company.
Rating System
Topline Securities employs three tier ratings system to rate a stock, as mentioned below, which is based upon the level of expected return for a specific
stock. The rating is based on the following with time horizon of 12-months.
Rating Expected Total Return
Buy Stock will outperform the average total return of stocks in universe
Neutral Stock will perform in line with the average total return of stocks in universe
Analyst Certification and Disclosures
12
Neutral Stock will perform in line with the average total return of stocks in universe
Sell Stock will underperform the average total return of stocks in universe
For sector rating, Topline Securities employs three tier ratings system, depending upon the sector’s proposed weight in the portfolio as compared to
sector’s weight in KSE-100 Index:
Rating Sector’s Proposed Weight in Portfolio
Over Weight > Weight in KSE-100 Index
Market Weight = Weight in KSE-100 Index
Under Weight < Weight in KSE-100 Index
Ratings are updated daily to account for the latest developments in the economy/sector/company, changes in stock prices and changes in analyst’s
assumptions or a combination of any of these factors.
Valuation Methodology
To arrive at our 12-months Target Price, Topline Securities uses different valuation methods which include: 1). Present value methodology, 2). Multiplier
methodology, and 3). Asset-based methodology.
Research Dissemination Policy
Topline Securities endeavors to make all reasonable efforts to disseminate research to all eligible clients in a timely manner through either physical or
electronic distribution such as email, fax mail etc. Nevertheless, all clients may not receive the material at the same time.
National Bank of Pakistan (NBP)

This report has been prepared by Topline Securities and is provided for information purposes only. Under no circumstances this is to be used or
considered as an offer to sell or solicitation of any offer to buy. While reasonable care has been taken to ensure that the information contained therein
is not untrue or misleading at the time of publication, we make no representation as to its accuracy or completeness and it should not be relied upon as
such. From time to time, Topline Securities and/or any of its officers or directors may, as permitted by applicable laws, have a position, or otherwise be
interested in any transaction, in any securities directly or indirectly subject of this report. This report is provided only for the information of professional
advisers who are expected to make their own investment decisions without undue reliance on this report. Investments in capital markets are subject to
market risk and Topline Securities accepts no responsibility whatsoever for any direct or indirect consequential loss arising from any use of this report or
its contents. In particular, the report takes no account of the investment objectives, financial situation and particular needs of investors, who should
seek further professional advice or rely upon their own judgment and acumen before making any investment. The views expressed in this report are
those of Topline Research Department and do not necessarily reflect those of Topline or its directors. Topline as a firm may have business relationships,
including investment-banking relationships, with the companies referred to in this report.
All rights reserved by Topline Securities. This report or any portion hereof may not be reproduced, distributed or published by any person for any
purpose whatsoever. Nor can it be sent to a third party without prior consent of Topline Securities. Action could be taken for unauthorized
reproduction, distribution or publication.
Disclaimer
13
reproduction, distribution or publication.
National Bank of Pakistan (NBP)

CONTACT USMohammed Sohail CEO Dir: +92 (21) 35303333-4 [email protected]
Research Team:
Saad Hashemy Chief Economist & Director Research Dir: +92 (21) 35303346 [email protected]
Umair Naseer Senior Research Analyst +92 (21) 35303330-2 [email protected]
Nabeel Khursheed Senior Research Analyst +92 (21) 35303330-2 [email protected]
Hamza Raza Research Analyst +92 (21) 35303330-2 [email protected]
Zawwar Taufiq Research Analyst +92 (21) 35303330-2 [email protected]
Fahad Qasim Manager Research +92 (21) 35303330-2 [email protected]
14
Uzair Ahmed Research Manager +92 (21) 35303330-2 [email protected]
Equity Sales Team:
Muhammad Rizwan Head of Sales Dir: +92 (21) 35303337 [email protected]
Samar Iqbal VP Equity Sales Dir: +92 (21) 35370799 [email protected]
Muhammad Hammad Aman Manager Equity Sales Dir: +92 (21) 353030297 [email protected]
Kumail Raza Manager Equity Sales Dir: +92 (21) 353030297 [email protected]
Corporate Office:
508, Continental Trade Center,
Block-8, Clifton, Karachi, Pakistan
Tel: +9221-35303330-2
Fax: +9221-35303349
National Bank of Pakistan (NBP)