national account performance scorecard - … · national account performance scorecard ... with...
TRANSCRIPT

SAMPLE3rd Qtr, 2014
QUARTERLY BUSINESS REVIEW
NATIONAL ACCOUNT PERFORMANCE SCORECARD™

At STANLEY Convergent Security Solutions (STANLEY Security) we are committed to operational excellence, unparalleled customer service, and providing you with value added security solutions. We strive to be the most trusted, innovative, and competent security integrator in the world. As a business partner you will have the confidence of knowing the entire STANLEY Security team is committed to achieving excellence for your business. In support of this commitment and to further strengthen our relationship, we provide you with total transparency into our performance on your account. To help us achieve this level of success we use the STANLEY Security National Account Performance Scorecard to measure our performance in the Five Customer Touchpoints: Account Management, Installation, Service, Monitoring, and Billing.
Since our business is built upon people, we facilitate the presentation of this Performance Scorecard with each of our National Account customers during a Quarterly Business Review, or at the frequency that meets your company’s needs. We value our in-person business review meetings. The objective of these meetings is to provide a two-way dialogue for us to discuss how STANLEY Security can better serve you and your company. Want to discuss security trends in your industry? Want to discuss performance benchmarking? Interested in hearing about service offerings STANLEY Security is developing? Looking for some new technology? All these subjects, and more, can be discussed during our in-person Quarterly
Business Review meetings. It provides an opportunity to foster a true business partnership as your security solutions provider.
Nothing like the National Account Performance Scorecard quantitatively exists in the industry today. As we solidify our reputation in the electronic security industry as the preferred provider of choice, our National Account Performance Scorecard offers a quantitative means to measure our performance on such key metrics as “on-time, on-budget and consistent installations”, “same-day service response and first-time fix service delivery”, “prompt, accurate and informative monitoring”, and “accurate and detailed billing”. The National Account Performance Scorecard Satisfaction Survey will also provide an easy means for you to provide frequent feedback to our senior leadership team on how we are performing on your account.
At STANLEY Security, we continue to set the standard of excellence for the electronic security industry, and we continue to raise the bar. If there is ever anything you need, please don’t hesitate to call us at our Field Headquarters 630-245-7100 or contact a member of our leadership team listed on page 20. It’s a privilege to serve your security needs.
Protecting What’s Important to You™
CONTENTS
News ..................................................1
Account Management ........................2
Installation ..........................................4
Service ................................................6
Monitoring .........................................8
High Activity Locations .....................10
Billing................................................12
Benchmarking Metrics ......................14
Customer Satisfaction Review ...........16
Satisfaction Survey ............................18
Your STANLEY Team .........................20
NEWS
The TOGETHER FOR SAFER SCHOOLS Grant Program In 2013, STANLEY Security launched the TOGETHER FOR SAFER SCHOOLS Grant Program, providing a total of $500,000 in security products and services to four K-12 schools. Nearly 1,000 schools were nominated from around the country, with at least one school represented from every state in the continental U.S. With over 2 million votes cast during the 45-day voting period, the votes were tallied to reveal the top four schools as Faith Christian Academy (Sellersville, PA), South Pointe Elementary School (Miami Beach, FL), Montessori School of Dayton (Kettering, OH), and Pioneer Elementary School (Auburn, WA), who came in first, second, third, and fourth respectively.
STANLEY Security hosted award assemblies at each school on January 9, 2014 to announce the school as a winner and provide the students a celebratory pizza party. We are currently working with each school to learn about their security needs and challenges, and to develop a comprehensive security solution to help make their school's campus safer. In addition, STANLEY Security is currently working together with school officials from more than 10,000 schools nationwide to ensure that school safety is a top priority for our communities.
For more information visit www.stanleycss.com/education
Stay current on what's new at STANLEY Security with updates on our cutting edge products, solutions, and programs. To receive email updates on our latest news and wide range of offerings, go to www.stanleycss.com/updates to sign up.
FEATURED PRODUCT
Electronic Article SurveillanceSTANLEY Security now offers a comprehensive line of proactive, intelligent Electronic Article Surveillance (EAS) loss prevention solutions through our partnership with SenTech EAS. Electronic Article Surveillance not only protects against loss from theft, it can also provide operational productivity, valuable business insight, and flexibility when
needed. Gain business insight and marketing analytics such as store traffic volume, store vs. store activity, and consumer behavior with integrated people counting. SenTech EAS is unique in that it can easily integrate with either industry standard technologies – Acousto-Magnetic (AM) and Radio Frequency (RF) – seamlessly working with a new installation or retrofitting into your current application. Plus, with nationwide installation and service available from one of our 75+ offices you’ll receive timely service and support when you need it.
For more information visit www.stanleycss.com/EAS
FEATURED SERVICE
Software Solutions Group (SSG) STANLEY Security strives to make implementing and maintaining an integrated security solution as easy and seamless as possible. The STANLEY Security Software Solutions Group (SSG) streamlines the process of implementing a new system by managing system planning
and programming, custom system integration and design, deployment and installation, management of system upgrades, preventative maintenance, and ongoing, 24 hour technical support as needed to ensure your system runs smoothly and meets your needs for years to come.
Let STANLEY Security SSG Help You:
SAVE TIME – STANLEY Security responds quickly with phone and email support
SAVE MONEY – STANLEY Security’s team manages your software system and provides remote desktop support, so you don’t have to
REDUCE DOWNTIME – STANLEY Security dedicates resources to working quickly and efficiently on your system
STAY UPDATED – STANLEY Security ensures your system is up to date by supporting regular system updates
IMPROVE EFFCIENCY – STANLEY Security works directly with manufacturers on your behalf, and will work to solve any issues that arise
LEVERAGE EXPERIENCE – Utilizing STANLEY Security’s SSG System Analysts, you can leverage over 50 years of combined experience, knowledge, and expertise with over eight industry technology certifications
For more information visit www.stanleycss.com/SoftwareSolutionsGroup
“A True Business Partnership”You
AccountManagement
Billing
Monitoring Service
Installation
ABOUT US NEWS
1

3rd Qtr 2014 Prepared by STANLEY Security exclusively for SAMPLE COMPANY GHQ SAMPLE. Confidential and proprietary information.
Unauthorized use, distribution, copy or dissemination strictly prohibited.
ACCOUNT MANAGEMENT
Total Installation Net Sales $249,975
Total Recurring Monthly Net Sales $2,475
New Locations with STANLEY Security 25
Canceled Locations 0
Existing Locations with STANLEY Security 100
2
ACCOUNT MANAGEMENT
OVERVIEW
The Account Management section of the National Account Performance Scorecard provides a measurement of STANLEY Security's accuracy in managing the customer’s account including number of locations serviced by STANLEY Security and dollars invested by the customer. This section provides a clear overview of the net value of the jobs contracted with STANLEY Security during the calendar quarter. The graphs in this section provide quarter-to-quarter trending data.
METRICS
Total Installation Net SalesTotal installation dollar value of agreements and agreement riders (new jobs, adds to existing systems, system upgrades, new services, added services, etc.) contracted with STANLEY Security during the calendar quarter; including any cancellations or adjustments to agreements, regardless of when the agreements were executed or processed.
Total Recurring Monthly Net Sales Total recurring monthly dollar value of agreements and agreement riders (new jobs, adds to existing systems, system upgrades, new services, added services, etc.) contracted with STANLEY Security during the calendar quarter; including any cancellations or adjustments to agreements, regardless of when the agreements were executed or processed.
New Locations wit h STANLEY SecurityNumber of new locations (based on unique address) contracted with STANLEY Security for monitoring and/or services (including Time & Material service) during the calendar quarter.
Canceled LocationsNumber of locations (based on unique address) canceled with STANLEY Security for monitoring and/or services (including Time & Material service) during the calendar quarter.
Existing Locations with STANLEY Security Number of existing locations (based on unique address) contracted with STANLEY Security for monitoring and/or services (including Time & Material service) as of the end of the calendar quarter.
DEFINITIONS
Recurring Monthly–Monthly fee, regardless of frequency of the invoice, paid for on-going services that can include: Monitoring, Service Plan, Preventative Maintenance, Tests and Inspections, Lease Payment, etc.
DISCUSSION TOPICS
Are you registered for STANLEY Security online, real-time eServices? What are your plans for expanding locations for the next calendar year? Are we tracking and communicating with your construction department? Do you have any changes to your business cycle that would impact your business’s locations?
3
New Locations with STANLEY
Security
Total Recurring Monthly Net Sales
Total Installation Net Sales
Existing Locations with STANLEY
Security
50
40
30
20
10
0
$2,500
$2,000
$1,500
$1,000
$500
$0Q4 Q1 Q2 Q3 Q4 Q1 Q2 Q3 Q4 Q1 Q2 Q3 Q4 Q1 Q2 Q3
$250,000
$225,000
$200,000
$175,000
$150,000
$125,000
$100,000
$75,000
$50,000
$25,000
$0
125
100
75
50
25
0
Log in to eservices.stanleycss.com for additional details.
3rd Qtr 2014 Prepared by STANLEY Security exclusively for SAMPLE COMPANY GHQ SAMPLE. Confidential and proprietary information.
Unauthorized use, distribution, copy or dissemination strictly prohibited.
INSTALLATION
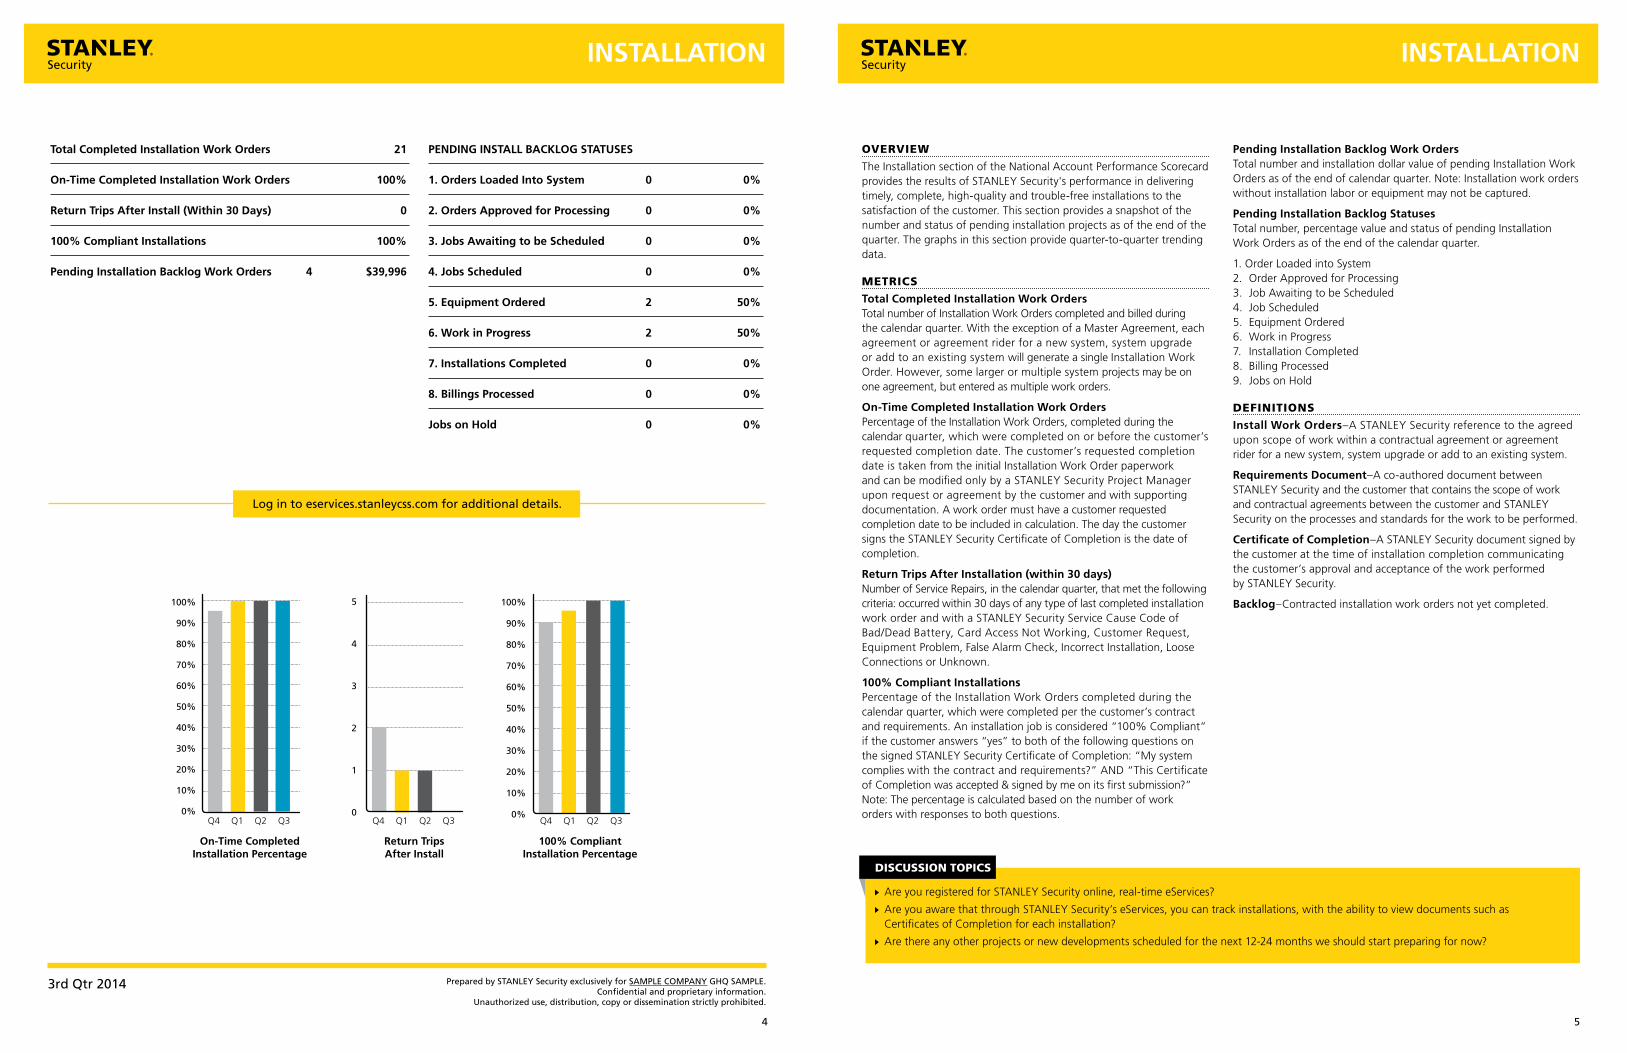
Total Completed Installation Work Orders 21
On-Time Completed Installation Work Orders 100%
Return Trips After Install (Within 30 Days) 0
100% Compliant Installations 100%
Pending Installation Backlog Work Orders 4 $39,996
PENDING INSTALL BACKLOG STATUSES
1. Orders Loaded Into System 0 0%
2. Orders Approved for Processing 0 0%
3. Jobs Awaiting to be Scheduled 0 0%
4. Jobs Scheduled 0 0%
5. Equipment Ordered 2 50%
6. Work in Progress 2 50%
7. Installations Completed 0 0%
8. Billings Processed 0 0%
Jobs on Hold 0 0%
4
INSTALLATION
OVERVIEW
The Installation section of the National Account Performance Scorecard provides the results of STANLEY Security's performance in delivering timely, complete, high-quality and trouble-free installations to the satisfaction of the customer. This section provides a snapshot of the number and status of pending installation projects as of the end of the quarter. The graphs in this section provide quarter-to-quarter trending data.
METRICS
Total Completed Installation Work Orders Total number of Installation Work Orders completed and billed during the calendar quarter. With the exception of a Master Agreement, each agreement or agreement rider for a new system, system upgrade or add to an existing system will generate a single Installation Work Order. However, some larger or multiple system projects may be on one agreement, but entered as multiple work orders.
On-Time Completed Installation Work Orders Percentage of the Installation Work Orders, completed during the calendar quarter, which were completed on or before the customer’s requested completion date. The customer’s requested completion date is taken from the initial Installation Work Order paperwork and can be modified only by a STANLEY Security Project Manager upon request or agreement by the customer and with supporting documentation. A work order must have a customer requested completion date to be included in calculation. The day the customer signs the STANLEY Security Certificate of Completion is the date of completion.
Return Trips After Installation (within 30 days)Number of Service Repairs, in the calendar quarter, that met the following criteria: occurred within 30 days of any type of last completed installation work order and with a STANLEY Security Service Cause Code of Bad/Dead Battery, Card Access Not Working, Customer Request, Equipment Problem, False Alarm Check, Incorrect Installation, Loose Connections or Unknown.
100% Compliant Installations Percentage of the Installation Work Orders completed during the calendar quarter, which were completed per the customer’s contract and requirements. An installation job is considered “100% Compliant” if the customer answers “yes” to both of the following questions on the signed STANLEY Security Certificate of Completion: “My system complies with the contract and requirements?” AND “This Certificate of Completion was accepted & signed by me on its first submission?” Note: The percentage is calculated based on the number of work orders with responses to both questions.
Pending Installation Backlog Work OrdersTotal number and installation dollar value of pending Installation Work Orders as of the end of calendar quarter. Note: Installation work orders without installation labor or equipment may not be captured.
Pending Installation Backlog StatusesTotal number, percentage value and status of pending Installation Work Orders as of the end of the calendar quarter.
1. Order Loaded into System 2. Order Approved for Processing 3. Job Awaiting to be Scheduled 4. Job Scheduled 5. Equipment Ordered 6. Work in Progress 7. Installation Completed 8. Billing Processed 9. Jobs on Hold
DEFINITIONS
Install Work Orders–A STANLEY Security reference to the agreed upon scope of work within a contractual agreement or agreement rider for a new system, system upgrade or add to an existing system.
Requirements Document–A co-authored document between STANLEY Security and the customer that contains the scope of work and contractual agreements between the customer and STANLEY Security on the processes and standards for the work to be performed.
Certificate of Completion–A STANLEY Security document signed by the customer at the time of installation completion communicating the customer’s approval and acceptance of the work performed by STANLEY Security.
Backlog–Contracted installation work orders not yet completed.
DISCUSSION TOPICS
Are you registered for STANLEY Security online, real-time eServices?
Are you aware that through STANLEY Security’s eServices, you can track installations, with the ability to view documents such as Certificates of Completion for each installation?
Are there any other projects or new developments scheduled for the next 12-24 months we should start preparing for now?
5
5
4
3
2
1
0
On-Time Completed Installation Percentage
100%
90%
80%
70%
60%
50%
40%
30%
20%
10%
0%
Return Trips After Install
100% Compliant Installation Percentage
100%
90%
80%
70%
60%
50%
40%
30%
20%
10%
0%Q4 Q1 Q2 Q3 Q4 Q1 Q2 Q3 Q4 Q1 Q2 Q3
Log in to eservices.stanleycss.com for additional details.

3rd Qtr 2014 Prepared by STANLEY Security exclusively for SAMPLE COMPANY GHQ SAMPLE. Confidential and proprietary information.
Unauthorized use, distribution, copy or dissemination strictly prohibited.
SERVICE
Total Completed Service Repairs 12
Repair Response within 24-Hours of Notification 90%
Repair Response within 48-Hours of Notification 100%
Repair Response within 72-Hours of Notification 100%
Average Time for Repair Response (Days) 0.5
First Time Fix 100%
Service Repairs Non-Billable 11
Service Repairs Billable 1
Fire Inspections Past Due 0
Fire Inspections Performed On-Time 100
Preventative Maintenance Past Due 0
Preventative Maintenance Performed On-Time 100
Completed Service Repairs on High Activity Locations
(See High Activity Locations Page)
6
SERVICE
OVERVIEW
The Service section of the National Account Performance Scorecard provides the results of STANLEY Security's performance in delivering prompt, complete, high-quality and trouble-free Service Repairs to the satisfaction of the customer. This section also provides a snapshot of the on-time performance and end of the quarter status of Fire Inspections. The graphs in this section provide quarter-to-quarter trending data.
METRICS
Total Completed Service RepairsTotal number of Completed Service Repairs performed by an on-site STANLEY Security technician during the calendar quarter.
Repair Response within 24-Hours of Notification Percentage of Total Completed Service Repairs during the calendar quarter where the time between the service request and the on-site response is less than or equal to 24-hours, excludes weekends, STANLEY Security holidays and special projects.
Repair Response within 48-Hours of NotificationPercentage of Total Completed Service Repairs during the calendar quarter where the time between the service request and the on-site response is less than or equal to 48-hours, excludes weekends, STANLEY Security holidays and special projects.
Repair Response within 72-Hours of NotificationPercentage of Total Completed Service Repairs during the calendar quarter where the time between the service request and the on-site response is less than or equal to 72-hours, excludes weekends, STANLEY Security holidays and special projects.
Average Time for Repair Response (Days)Average number of days (24-hours), for Completed Service Repairs during the calendar quarter, between the day of service request and the on-site response, excludes weekends, STANLEY Security holidays and special projects.
First Time FixPercentage of Total Completed Service Repairs during the calendar quarter which were completed and fixed during the first service repair call.
Service Repairs Non-Billable Total number of Completed Service Repairs, during the calendar quarter, that were not billed to the customer account due to coverage by Warranty, Service Plan or other.
Service Repairs BillableTotal number of Completed Service Repairs, during the calendar quarter, that were billed to the customer’s account. See Billing page for Service Repair charges.
Fire Inspections Past DueThe number of Fire Inspections past due, as of the end of each month, during the calendar quarter.
Fire Inspections Performed On-TimeThe number of Fire Inspections performed on-time, as of the end of each month, during the calendar quarter.
Preventative Maintenance Past DueThe number of Preventative Maintenance appointments past due, as of the end of each month, during the calendar quarter.
Preventative Maintenance Performed On-Time The number of Preventative Maintenance appointments performed on-time, as of the end of each month, during the calendar quarter.
DEFINITIONS
Time & Material Book Price List–Cost for service repair based on customer’s standard rates for labor and equipment.
Fire Inspections–Contracted on-going scheduled tests and inspections of fire alarm systems. Fire alarm devices to be tested & inspected are often grouped together based on the devices that are due to be tested at one time. A customer location or system may have more than one test & inspection group per location or system. Each test & inspection group is counted as a Fire Inspection.
DISCUSSION TOPICS
Are you registered for STANLEY Security online, real-time eServices?
Are you aware that through STANLEY Security’s eServices, you can view reports on service repairs for all your locations?
Do you currently have a Maintenance Agreement with STANLEY Security?
Is STANLEY Security currently monitoring your fire systems and performing fire system inspections?
7
Average Time For Response (Days)
5
4
3
2
1
0
First Time Fix Percentage
100%
90%
80%
70%
60%
50%
40%
30%
20%
10%
0%Q4 Q1 Q2 Q3 Q4 Q1 Q2 Q3
Log in to eservices.stanleycss.com for additional details.

3rd Qtr 2014 Prepared by STANLEY Security exclusively for SAMPLE COMPANY GHQ SAMPLE. Confidential and proprietary information.
Unauthorized use, distribution, copy or dissemination strictly prohibited.
MONITORING
Total Police/Fire/Medical Dispatches 34
Dispatches Caused by Customer 28
Dispatches Caused by Equipment 1
Dispatches Caused by Monitoring 1
Dispatches Caused by Other 0
Dispatch Cause Unknown 1
Dispatches on “Reported” Actual Alarms 3
Avg. Time to Acknowledgement by Operator on Alarms (secs) 19
Total Monitored Systems 100
Total Incidents* 243
Avg. Incidents Per Monitored System Per Month 0.81
Total Incidents on High Activity Locations
(See High Activity Locations Page)
Total Dispatches on High Activity Locations
(See High Activity Locations Page)
* Incidents – Signals that require the intervention of a monitoring specialist.
8
MONITORING
OVERVIEW
The Monitoring section of the National Account Performance Scorecard provides the results of STANLEY Security's performance in providing timely, accurate, informative and reliable Monitoring services to the satisfaction of the customer. This section provides a snapshot of the total number of monitored systems, incidents and the incident rate of the systems. The graphs in this section provide quarter-to-quarter trending data.
METRICS
Total Police/Fire/Medical DispatchesTotal number of alarm dispatches, during the calendar quarter, where authorities were notified by the STANLEY Security ProtectionNet™ Customer Service Center.
Dispatches Caused By CustomerTotal number of Police/Fire/Medical Dispatches, during the calendar quarter, caused by the customer as determined and recorded by the STANLEY Security Monitoring Specialist.
Dispatches Caused By EquipmentTotal number of Police/Fire/Medical Dispatches, during the calendar quarter, caused by equipment as determined and recorded by the STANLEY Security Monitoring Specialist.
Dispatches Caused By MonitoringTotal number of Police/Fire/Medical Dispatches, during the calendar quarter, caused by STANLEY Security monitoring personnel as determined and recorded by the STANLEY Security Monitoring Specialist.
Dispatches Caused By OtherTotal number of Police/Fire/Medical Dispatches, during the calendar quarter, caused by one of the following Supervisory Alarm reasons as determined and recorded by the STANLEY Security Monitoring Specialist: Power Breaker Off, Industrial Process, Power Outage Area, Room Temperature, Transformer Unplugged, High/Low Air Pressure, Low Battery, Power Out Building, Thermostat/Temperature Alarm or Valve Switch Not Normal.
Dispatch Cause UnknownTotal number of Police/Fire/Medical Dispatches, during the calendar quarter, where the cause was unknown or undetermined by the STANLEY Security Monitoring Specialist.
Dispatches on “Reported” Actual AlarmsTotal number of Police/Fire/Medical Dispatches, during the calendar quarter, where customer or authorities have indicated an actual alarm occurred during the calendar quarter.
Avg. Time to Acknowledgement by Operator on Alarms (seconds)Average time in seconds between alarm signal receipt and acknowledgement by a STANLEY Security Monitoring Specialist for Fire, Burglary, Hold-Up, Panic, Medical and Duress high priority alarm signals on the customer’s account during the calendar quarter.
Total Monitored SystemsTotal number of systems or separate protected areas monitored by STANLEY Security as of the last day of the calendar quarter.
Total IncidentsTotal number of Incidents, during the calendar quarter, on customer’s account.
Avg. Incidents Per Monitored System Per MonthCalculated by dividing the number of Total Incidents by the number of Total Monitored Systems, then dividing the quotient by the number of months (3) in the calendar quarter.
DEFINITIONS
Dispatches–Signals where Police/Fire/Medical authorities were dispatched.
Authorities–Governmental agency(s) responsible for public response to emergencies (Police, Fire, Medical, etc.).
Incidents–Signals that require the intervention of a monitoring specialist.
Signals–Individual electronic signals (ex. Open/Close, Extend Close, Low Battery, Trouble, Alarm, etc.) sent to the STANLEY Security ProtectionNet™ Customer Service Center from premise alarm control panel.
DISCUSSION TOPICS
Are you registered for STANLEY Security online, real-time eServices?
Are you aware that through STANLEY Security’s eServices, you can view your monitoring data online, real-time?
When reviewing the number of total incidents, if the average incidents per monitored system per month is over one, let’s determine the cause of the incidents.
The Dispatch Cause Unknown metric should be low. After an event, it is important that your company notifies STANLEY Security of the source of the incident, in order to reduce the number of incidents in the future.
9
60
50
40
30
20
10
0
5
4
3
2
1
0
Total Police/Fire/ Medical Dispatches
Avg. Incidents Per System Per Month
Total Incidents
300
250
200
150
100
50
0
Avg. Time (Sec.) to Acknowledgement
60
50
40
30
20
10
0Q4 Q1 Q2 Q3 Q4 Q1 Q2 Q3 Q4 Q1 Q2 Q3 Q4 Q1 Q2 Q3
Log in to eservices.stanleycss.com for additional details.

3rd Qtr 2014 Prepared by STANLEY Security exclusively for SAMPLE COMPANY GHQ SAMPLE. Confidential and proprietary information.
Unauthorized use, distribution, copy or dissemination strictly prohibited.
HIGH ACTIVITY LOCATIONSHIGH ACTIVITY LOCATIONS
DISCUSSION TOPICS
Are you registered for STANLEY Security online, real-time eServices?
Are you aware that through STANLEY Security’s eServices, you can view your full locations listing and the activity by location for your account?
When reviewing your total incidents for your High Activity Locations, we need to determine why there are so many incidents for the location. For example, is the location continually Missing Closing? If so, it is possible we need to determine why there is a high number of incidents for the location.
1110
# Name Address City St/PrService
Completed Repairs
Monitoring Incidents*
Monitoring Dispatches**
Service & Monitoring
Total Activity***
1 Sample #57 1000 Industrial Way San Diego CA 2 70 12 84
2 Sample #39 110 Corporate Drive San Francisco CA 2 60 10 72
3 Sample #59 45 Service Street Seattle WA 2 22 6 30
4 Sample #100 101 Production Circle Phoenix AZ 1 18 1 20
5 Sample #48 2500 Telecom Lane Houston TX 1 17 1 19
6 Sample #23 100 Manufacturing Loop New York NY 1 15 1 17
7 Sample #29 660 Sales Boulevard Orlando FL 1 11 1 13
8 Sample #52 700 Main Street Atlanta GA 1 10 1 12
9 Sample #41 100 1st Avenue Columbus OH 1 5 1 7
10 Sample #1 888 Finance Drive Chicago IL 0 5 0 5
* Incidents – Signals that require the intervention of a monitoring specialist.
** Dispatches – Signals where Police/Fire/Medical authorities were dispatched.
*** Total Activity – Sum of Service Completed Repairs, Monitoring Incidents and Dispatches per location.
Customer Top 10 Locations with Highest Activity(Total Service Repairs, Incidents and Dispatches)
Log in to eservices.stanleycss.com for additional details.
OVERVIEW
The High Activity Locations section of the National Account Performance Scorecard provides the results of Total Service Repairs, Monitoring Incidents, Monitoring Dispatches and Total Activity per customer location (based on unique location address). A useful tool in false alarm reduction, by identifying possible “problem” locations and/or systems for further review and evaluation.
METRICS
Service Completed RepairsTotal number of Completed Service Repairs performed by an on-site STANLEY Security technician, during the calendar quarter, per customer location (based on unique location address).
Monitoring IncidentsTotal number of Incidents, during the calendar quarter, per customer location (based on unique location address).
Monitoring DispatchesTotal number of alarm dispatches, during the calendar quarter, where Police/Fire/Medical authorities were notified by the STANLEY Security ProtectionNet™ Customer Service Center, per customer location (based on unique location address).
Service & Monitoring Total ActivityTotal number of Service Completed Repairs, Monitoring Incidents and Monitoring Dispatches, during the calendar quarter, per customer location (based on unique location address). Service & Monitoring Total Activity is used to rank, in descending order, all customer locations.
DEFINITIONS
Customer Location–A unique location address where STANLEY Security provides contracted services that can include monitoring, service repair, preventative maintenance, test and inspection and/or other services on an intrusion alarm system, fire alarm system, camera (CCTV) system, access control system, etc.
Incidents–Signals that require the intervention of a monitoring specialist.
Signals–Individual electronic signals (ex. Open/Close, Extended Close, Low Battery, Trouble, Alarm, etc.) sent to the STANLEY Security ProtectionNet™ Customer Service Center from premise alarm control panel.
Dispatches–Signals where Police/Fire/Medical authorities were dispatched.
Total Activity–Total number of Service Completed Repairs, Monitoring Incidents and Monitoring Dispatches, during the calendar quarter, per customer location (based on unique location address). Service & Monitoring Total Activity is used to rank, in descending order, all customer locations.
LOCATION DETAIL
For a full list of all existing customer locations with STANLEY Security, log on to our online eServices portal at eServices.stanleycss.com. For an eServices login, please visit www.stanleycss.com/eservices_signup.html or contact your National Account Manager.

3rd Qtr 2014 Prepared by STANLEY Security exclusively for SAMPLE COMPANY GHQ SAMPLE. Confidential and proprietary information.
Unauthorized use, distribution, copy or dissemination strictly prohibited.
BILLING
Total Invoices $266,489
Total Corrective Credits 0 $0
Recurring Services Invoices $56,320
Recurring Services Corrective Credits 0 $0
Installation Invoices $209,979
Installation Corrective Credits 0 $0
Service Repair Invoices $190
Service Repair Corrective Credits 0 $0
Total Accounts Receivable 31 $49,250
1. A/R Current $49,250
2. A/R 31+ Days $0
3. A/R 61+ Days $0
4. A/R 91+ Days $0
Note: The dollar amounts reported are the A/R numbers as reported at the end of the previous quarter.
12
BILLING
OVERVIEW
The Billing section of the National Account Performance Scorecard provides the results of STANLEY Security's performance in delivering accurate, informative and timely billing services to the satisfaction of the customer. Accuracy in billing is measured by tracking the credits issued by STANLEY Security to correct billing errors. This section also provides a snapshot of the dollar value of outstanding invoices on the customer’s account as of the end of the quarter. The graphs in this section provide quarter-to-quarter trending data.
METRICS
Total InvoicesTotal dollar value of Invoices billed on customer’s account during the calendar quarter.
Total Corrective CreditsTotal number and dollar value of Corrective Credits issued on customer account, during the calendar quarter, with a STANLEY Security Credit Reason of: CRDBOC –Credit a Balance of Contract, customer does not owe, billed in error; CRDRST–Credit/Reset an Installation, billed before completion in error; CRDTKT–Credit a Service Ticket, billed in error; CRINST–Installation Amount Incorrect; CRTAX–Credit Tax, should not have been billed; CVMAIN–Covered by Maintenance Contract; REBILL–Credit Service Call, billed to wrong account; RMTARM–Remote arm charge credit, billed in error; and RSTSVC–Credit/Reset service due to billed before completion.
Recurring Services InvoicesTotal dollar value of Recurring Services invoices on customer account during the calendar quarter.
Recurring Services Corrective CreditsTotal number and dollar value of Corrective Credits issued on customer account for Recurring Services, during the calendar quarter, with a STANLEY Security Credit Reason of: CRDBOC–Credit a Balance of Contract, customer does not owe, billed in error; CRTAX–Credit Tax, should not have been billed; CVMAIN–Covered by Maintenance Contract; and RSTSVC–Credit/Reset service due to billed before completion.
Installation InvoicesTotal dollar value of Installation invoices on customer account during the calendar quarter.
Installation Corrective CreditsTotal number and dollar value of Corrective Credits issued on customer account for Installations, during the calendar quarter, with a STANLEY Security Credit Reason of: CRDRST–Credit/Reset an Installation, billed before completion in error; CRINST–Installation Amount Incorrect; and CRTAX–Credit Tax, should not have been billed.
Service Repair InvoicesTotal dollar value of Billable Service Repair invoices on customer account during the calendar quarter.
Service Repair Corrective CreditsTotal number and dollar value of Corrective Credits issued on customer account for Service Repairs, during the calendar quarter, with a STANLEY Security Credit Reason of: CRDTKT–Credit a Service Ticket, billed in error; CRTAX–Credit Tax, should not have been billed; CVMAIN–Covered by Maintenance Contract; REBILL–Credit Service Call, billed to wrong account; and RMTARM–Remote arm charge credit, billed in error.
Total Accounts ReceivableTotal number and dollar value of all outstanding invoices on customer’s account on the last day of the calendar quarter.
1. A/R Current: Total number and dollar value of all outstanding invoices which are current.
2. A/R 31+ Days: Total number and dollar value of outstanding invoices beyond 31 days of payment due date.
3. A/R 61+ Days: Total dollars of outstanding invoices beyond 61 days of payment due date.
4. A/R 91+ Days: Total dollars of outstanding invoices beyond 91 days of payment due date.
DEFINITIONS
Corrective Credits–Term used by STANLEY Security to identify credits issued to correct billing errors by STANLEY Security.
Recurring Services–Recurring services fees for on-going contractual services that can include: Monitoring, Service Plan, Preventative Maintenance, Tests and Inspections, Lease Payment, etc.
Accounts Receivable–Outstanding invoices on the customer’s account payable to STANLEY Security.
DISCUSSION TOPICS
Are you registered for STANLEY Security online, real-time eServices?
Are you aware that through STANLEY Security’s eServices, you can receive additional billing details for your account including viewing invoices online?
Do you know that you have a National Account Billing specialist and a National Account A/R specialist?
Are you currently taking advantage of our combined billing options?
13
Total Invoice $’s to Total Corrective Credit $’s Percentage
(Overall Billing Accuracy)
Number of Corrective Credits
Installation
Number of Corrective Credits
Service Repair
Number of Corrective Credits Recurring Services
10
9
8
7
6
5
4
3
2
1
0
10
9
8
7
6
5
4
3
2
1
0
10
9
8
7
6
5
4
3
2
1
0
100%
90%
80%
70%
60%
50%
40%
30%
20%
10%
0%Q4 Q1 Q2 Q3 Q4 Q1 Q2 Q3 Q4 Q1 Q2 Q3 Q4 Q1 Q2 Q3
Log in to eservices.stanleycss.com for additional details.

3rd Qtr 2014 Prepared by STANLEY Security exclusively for SAMPLE COMPANY GHQ SAMPLE. Confidential and proprietary information.
Unauthorized use, distribution, copy or dissemination strictly prohibited.
BENCHMARKING METRICS
STANLEY Security National Account Average SAMPLE COMPANY
+ Your Account vs. all National Account Customers
14
BENCHMARKING METRICS
OVERVIEW
The Benchmarking Metrics section of the National Account Performance Scorecard provides the opportunity for you to benchmark key metrics on your account against all STANLEY Security National Account customers. This section provides a snapshot of the results in key metrics for the quarter. The graphs in this section provide current quarter results, with the exception of Customer Satisfaction which provides previous quarter results.
METRICS
INSTALLATION:On-Time Completed Installation Work Orders Percentage of the Installation Work Orders, completed during the calendar quarter, which were completed on or before the customer’s requested completion date. The customer’s requested completion date is taken from the initial Installation Work Order paperwork and can be modified only by a STANLEY Security Project Manager upon request or agreement by the customer and with supporting documentation. A work order must have a customer requested completion date to be included in calculation. The day the customer signs the STANLEY Security Certificate of Completion is the date of completion.
100% Compliant Installations Percentage of the Installation Work Orders completed during the calendar quarter, which were completed per the customer’s contract and requirements. An installation job is considered “100% Compliant” if the customer answers “yes” to both of the following questions on the signed STANLEY Security Certificate of Completion: “My system complies with the contract and requirements?” AND “This Certificate of Completion was accepted & signed by me on its first submission?” Note: The percentage is calculated based on the number of work orders with responses to both questions.
SERVICE:Average Time for Repair Response (Days)Average number of days (24-hours), for Completed Service Repairs during the calendar quarter, between the day of service request and the on-site response, excludes weekends, STANLEY Security holidays and special projects.
First Time FixPercentage of Total Completed Service Repairs during the calendar quarter which were completed and fixed during the first service repair call.
MONITORING:Avg. Time to Acknowledgement by Operator on Alarms (seconds)Average time in seconds between alarm signal receipt and acknowledgement by a STANLEY Security Monitoring Specialist for Fire, Burglary, Hold-Up, Panic, Medical and Duress high priority alarm signals on the customer’s account during the calendar quarter.
Avg. Incidents Per Monitored System Per MonthCalculated by dividing the number of Total Incidents by the number of Total Monitored Systems, then dividing the quotient by the number of months (3) in the calendar quarter.
15
SERVICE SERVICE
MONITORING
INSTALLATIONINSTALLATION
Average Time For Response (Days)
Q3
5
4
3
2
1
0
5
4
3
2
1
0
First Time Fix Percentage
Q3
Avg. Incidents Per System Per Month
Q3
On-Time Completed Installation Percentage
Q3
100%
80%
60%
40%
20%
0%
100%
80%
60%
40%
20%
0%
100%
80%
60%
40%
20%
0%
100% Compliant Installation Percentage
Q3
MONITORING
Avg. Time (Sec.) to Acknowledgement
60
50
40
30
20
10
0Q3

3rd Qtr 2014 Prepared by STANLEY Security exclusively for SAMPLE COMPANY GHQ SAMPLE. Confidential and proprietary information.
Unauthorized use, distribution, copy or dissemination strictly prohibited.
CUSTOMER SATISFACTION
Account Management Rating (1-10) 10
Installation Rating (1-10) 10
Service Rating (1-10) 10
Average rating of how likely it is that customers would recommend STANLEY Security 8.54
Monitoring Rating (1-10) 10
Billing Rating (1-10) 9
OVERALL RATING 10
Ratings: STANLEY Security is rated on a 1 to 10 scale, with a "10" rating meaning Best in Class, and a "1" rating meaning Not Meeting Expectations.
Customer Rating of STANLEY Security Performance in Five Key Customer Touchpoints (for Previous Quarter)
16
Average rating of how likely it is that
customers would recommend STANLEY
Security
Q4 Q1 Q2
10
9
8
7
6
5
4
3
2
1
CUSTOMER SATISFACTION
OVERVIEW
The Customer Satisfaction section of the National Account Performance Scorecard provides the opportunity to view the customer satisfaction rating on STANLEY Security’s performance in the five Customer Touchpoints: Account Management, Installation, Service, Monitoring and Billing for the previous calendar quarter. The satisfaction ratings are taken from the STANLEY Security Quarterly Customer Satisfaction Survey from the previous quarter’s Performance Scorecard. The graphs in this section provide quarter-to-quarter trending data.
KEY TOUCHPOINTS
Account Management–Responsive, professional and comprehensive account management and system design support.
Installation–Consistent, on-time and on-budget installations, delivered per the customer requirements with proactive project management.
Service–Prompt, thorough and professional service repair, test and inspections, and other service work delivered with accurate scheduling communication.
Monitoring–Accurate, timely and informative monitoring services, delivered in a disciplined and professional manner.
Billing–Accurate, detailed and timely invoice billing, delivered in an easy to understand and professional format.
RATINGS
STANLEY Security is rated on the Five Customer Touchpoints on a 1 to 10 scale, with a "10" rating meaning Best in Class, and a "1" rating meaning Not Meeting Expectations.
DISCUSSION TOPICS
If there is no data in the charts on the prior page, then we have not received a Customer Satisfaction Rating from you for the previous quarter(s). Please complete the Customer Satisfaction Survey this quarter to start tracking trending throughout the year.
17
Account Management Rating Installation Rating
Monitoring Rating Billing Rating Overall Rating
10
8
6
4
2
0
10
8
6
4
2
0
10
8
6
4
2
0
10
8
6
4
2
0
10
8
6
4
2
0
10
8
6
4
2
0
Service Rating
Q4 Q1 Q2 Q4 Q1 Q2 Q4 Q1 Q2
Q4 Q1 Q2Q4 Q1 Q2Q4 Q1 Q2

Prepared by STANLEY Security exclusively for SAMPLE COMPANY GHQ SAMPLE. Confidential and proprietary information.
Unauthorized use, distribution, copy or dissemination strictly prohibited.
3rd Qtr 2014
Account Management Rating
Installation Rating
Service Rating
Monitoring Rating
Billing Rating
OVERALL RATING
How likely is it that you would recommend STANLEY Security to a business or colleague?
1 2 3 4 5 6 7 8 9 10
National Account Program
STANLEY Security Account Manager Name: John Doe
STANLEY Security Signature
Date of Performance Scorecard Review:
Customer Company Name: SAMPLE COMPANY
Customer Signature
Customer Representative Phone Number
Customer Representative Email
Customer Representative Name
Comments:
What can we do to improve your customer experience?
19
SATISFACTION SURVEY SATISFACTION SURVEY
Not Meeting Expectations
Best in Class
18
OVERVIEW
The Satisfaction Survey section of the National Account Performance Scorecard provides the opportunity to communicate to STANLEY Security senior leadership, the performance of STANLEY Security in the five Customer Touchpoints: Account Management, Installation, Service, Monitoring and Billing. In addition, the Satisfaction Survey provides a format for the assigned STANLEY Security Account Manager to sit down and discuss STANLEY Security's performance on a quarterly basis with his/her account. This feedback is critical to STANLEY Security achieving its desired state of being the security industry’s “Gold Standard”.
KEY TOUCHPOINTS
Account Management–Responsive, professional and comprehensive account management and system design support.
Installation–Consistent, on-time and on-budget installations, delivered per the customer requirements with proactive project management.
Service–Prompt, thorough and professional service repair, test and inspections, and other service work delivered with accurate scheduling communication.
Monitoring–Accurate, timely and informative monitoring services, delivered in a disciplined and professional manner.
Billing–Accurate, detailed and timely invoice billing, delivered in an easy to understand and professional format.
NOTES
I. If multiple company employees need to complete the Customer Satisfaction Survey, please have each employee complete the survey via email or online. Average ratings based on the submitted surveys will be displayed in the Customer Satisfaction results.
II. For additional information or questions regarding the National Account Performance Scorecard contact your STANLEY Security National Account Manager or contact a member of our leadership team, listed on page 20.
RATINGS
STANLEY Security is rated on the Five Customer Touchpoints on a 1 to 10 scale, with a "10" rating meaning Best in Class, and a "1" rating meaning Not Meeting Expectations.
Please take a moment to rate STANLEY Security’s performance for the previous quarter. To submit, email this completed form to [email protected] or complete the form online at www.stanleycss.com/NASurvey
Thank you for completing the quarterly satisfaction survey!
Help STANLEY Security Go Green! There are two ways to complete the Customer Satisfaction Survey:1. Online: Visit www.stanleycss.com/NASurvey to complete the survey online in English or French
(select Q3 2014 survey).
2. Email: Complete the survey on page 19, scan it to a computer, and email it to [email protected].
Not likely at all Extremely likely

3rd Qtr 2014 Prepared by STANLEY Security exclusively for SAMPLE COMPANY GHQ SAMPLE. Confidential and proprietary information.
Unauthorized use, distribution, copy or dissemination strictly prohibited.
YOUR STANLEY TEAM
Your dedicated STANLEY Security team is made up of a number of talented STANLEY Security associates across all five customer touchpoints. As your single point of contact with STANLEY Security, your assigned National Account Manager is the leader of your STANLEY Security team and coordinates the STANLEY Security resources needed to achieve your 100% satisfaction with our services. In addition, each customer touchpoint has STANLEY Security Senior Leadership to ensure the proper level of visibility and accountability on your account so we can achieve excellence everyday. If you desire, please feel free to contact any one of the Senior Leaders listed below for assistance on any matter. We are here to support you in your business needs. We have also listed key resources that can be utilized by you or your team. Again, our entire team is committed to achieving excellence on your account. We look forward to serving you.
The STANLEY Security Team is Committed to Excellence & Your Complete Satisfaction!
ACCOUNT MANAGEMENT (Account Management, Sales, Application Engineering, Technical Design, Software Integration, New Technology & Customer Support)
Raymond Radis – Vice President Sales 847-800-1007
Patrick Mulhern – Vice President Sales 847-344-8881
INSTALLATION (Installation, Project Management, Technical Solutions & Customer Support)
Bruce Riesterer – Director, Tactical Operations Center 317-513-8155
SERVICE (Service Repair, Preventative Maintenance, Testing, Software Support, Embedded Services & Customer Support)
Tom Nichols – Sr. Director North America Field Operations 540-659-8488
NORTH AMERICAN NATIONAL ACCOUNTS
NORTH AMERICAN HEADQUARTERS
MONITORING (Monitoring, Service Dispatch, Technical Assistance Center & Customer Support)
Steve Walker – Vice President Customer Service 612-872-3428
BILLING (Billing, Administration and Customer Support)
Lacey Armitage – Manager National Account Billing214-257-1606
CUSTOMER RELATIONS Patrick Dineen – Senior Director Customer Relations 262-521-3904
eSERVICES Rich Mellott – Director of Technology & Channel Strategy 317-558-2959
Kyle Dancho – Chief Operating Officer, STANLEY Security 630-245-7104
David Boccia – Vice President Field Operations 859-657-6294
Brett Bontrager – Group Executive, STANLEY Security 317-558-1600
Marty Guay – Vice President, Commercial – North America 781-305-5203
ABOUT USSTANLEY Security, a division of STANLEY Black & Decker (NYSE: SWK), is a provider of integrated security solutions for commercial and industrial organizations globally. We deliver a comprehensive suite of security products, software and integrated systems with a strong emphasis on service.
Learn more about how STANLEY Security can help meet your security needs.
877-476-4968 | www.stanleycss.com
© 2014 STANLEY Convergent Security Solutions and STANLEY Black & Decker Canada Corporation.
All Rights Reserved. Visit www.stanleycss.com/licenses.html for licensing information. 0034220