nasa rotor 37 cfd code validation · ali a. ameri the ohio state university, columbus, ohio nasa...
TRANSCRIPT
Ali A. AmeriThe Ohio State University, Columbus, Ohio
NASA Rotor 37 CFD Code ValidationGlenn-HT Code
NASA/CR—2010-216235
July 2010
AIAA–2009–1060
https://ntrs.nasa.gov/search.jsp?R=20100029589 2018-08-01T19:29:09+00:00Z
NASA STI Program . . . in Profi le
Since its founding, NASA has been dedicated to the advancement of aeronautics and space science. The NASA Scientifi c and Technical Information (STI) program plays a key part in helping NASA maintain this important role.
The NASA STI Program operates under the auspices of the Agency Chief Information Offi cer. It collects, organizes, provides for archiving, and disseminates NASA’s STI. The NASA STI program provides access to the NASA Aeronautics and Space Database and its public interface, the NASA Technical Reports Server, thus providing one of the largest collections of aeronautical and space science STI in the world. Results are published in both non-NASA channels and by NASA in the NASA STI Report Series, which includes the following report types: • TECHNICAL PUBLICATION. Reports of
completed research or a major signifi cant phase of research that present the results of NASA programs and include extensive data or theoretical analysis. Includes compilations of signifi cant scientifi c and technical data and information deemed to be of continuing reference value. NASA counterpart of peer-reviewed formal professional papers but has less stringent limitations on manuscript length and extent of graphic presentations.
• TECHNICAL MEMORANDUM. Scientifi c
and technical fi ndings that are preliminary or of specialized interest, e.g., quick release reports, working papers, and bibliographies that contain minimal annotation. Does not contain extensive analysis.
• CONTRACTOR REPORT. Scientifi c and
technical fi ndings by NASA-sponsored contractors and grantees.
• CONFERENCE PUBLICATION. Collected papers from scientifi c and technical conferences, symposia, seminars, or other meetings sponsored or cosponsored by NASA.
• SPECIAL PUBLICATION. Scientifi c,
technical, or historical information from NASA programs, projects, and missions, often concerned with subjects having substantial public interest.
• TECHNICAL TRANSLATION. English-
language translations of foreign scientifi c and technical material pertinent to NASA’s mission.
Specialized services also include creating custom thesauri, building customized databases, organizing and publishing research results.
For more information about the NASA STI program, see the following:
• Access the NASA STI program home page at http://www.sti.nasa.gov
• E-mail your question via the Internet to help@
sti.nasa.gov • Fax your question to the NASA STI Help Desk
at 443–757–5803 • Telephone the NASA STI Help Desk at 443–757–5802 • Write to:
NASA Center for AeroSpace Information (CASI) 7115 Standard Drive Hanover, MD 21076–1320
Ali A. AmeriThe Ohio State University, Columbus, Ohio
NASA Rotor 37 CFD Code ValidationGlenn-HT Code
NASA/CR—2010-216235
July 2010
AIAA–2009–1060
National Aeronautics andSpace Administration
Glenn Research CenterCleveland, Ohio 44135
Prepared under Contract NNC06BA07B, Task 269
Prepared for the47th Aerospace Sciences Meetingsponsored by the American Institute of Aeronautics and AstronauticsOrlando, Florida, January 5–8, 2009

Acknowledgments
The author wishes to thank Drs. Rodrick Chima and Mark Celestina for their advice on this work.Thanks are also due to Drs. James Heidmann and Ken Suder for their support of this work.
Available from
NASA Center for Aerospace Information7115 Standard DriveHanover, MD 21076–1320
National Technical Information Service5301 Shawnee Road
Alexandria, VA 22312
Available electronically at http://gltrs.grc.nasa.gov
Trade names and trademarks are used in this report for identifi cation only. Their usage does not constitute an offi cial endorsement, either expressed or implied, by the National Aeronautics and
Space Administration.
This work was sponsored by the Fundamental Aeronautics Program at the NASA Glenn Research Center.
Level of Review: This material has been technically reviewed by NASA technical management.

NASA/CR—2010-216235 1
NASA Rotor 37 CFD Code Validation Glenn-HT Code
Ali A. Ameri
The Ohio State University Columbus, Ohio 43210
Abstract
In order to advance the goals of NASA aeronautics programs, it is necessary to continuously evaluate and improve the computational tools used for research and design at NASA. One such code is the Glenn-HT code which is used at NASA Glenn Research Center (GRC) for turbomachinery computations. Although the code has been thoroughly validated for turbine heat transfer computations, it has not been utilized for compressors. In this work, Glenn-HT was used to compute the flow in a transonic compressor and comparisons were made to experimental data. The results presented here are in good agreement with this data. Most of the measures of performance are well within the measurement uncertainties and the exit profiles of interest agree with the experimental measurements.
Introduction
NASA Rotor 37 test case, designed and tested originally by Reid and Moore (Ref. 1) at NASA Lewis, presently Glenn Research Center, is a low aspect ratio inlet stage for an eight-stage core compressor with a 20:1 pressure ratio (Ref. 2). It was retested at NASA Glenn in isolation to avoid the interaction effects. As such the test case is ideal for code verification. The specifications, given in Table I, are the intended design parameters and are reproduced from Suder (Ref. 2). Much data representing performance and flow field variables can be found in (Ref. 2) which has been used for CFD validation.
Given the steady nature of the flow and the isolation of the rotor blade row, the numerical simulation of this case should be rather straight forward. But, the results of the IGTI 1994 blind test case (unpublished) showed a large variation in the results and often large deviation from the experimental results. A new round of comparison with the data has been undertaken to assess the current state-of-the-art in some of the codes used at NASA. Glenn-HT although used mostly for heat transfer computations in turbine blades and passages was thus assessed by computing the case and comparing with the data.
The code Glenn-HT is a general structured multi-block code. Blocks are full face matching and can be arranged in an unstructured fashion. Alternatively, the computational domain can be formed from grid zones which are brought together at non-matching interfaces though this was not done in the present work. This makes the code ideal for complicated geometries and near wall solutions for which the near wall resolution is important. Glenn-HT uses a finite volume scheme. It uses a second order central difference scheme plus a fourth order artificial dissipation. A pressure switch turns on a second order dissipation that is activated by shocks. Thus near shock solutions are first order accurate. Glenn-HT code uses a multi-grid solver and utilizes a Runge-Kutta explicit smoother. Further acceleration is achieved with residual smoothing. A second order upwind method described by Huynh (Ref. 3) of NASA Glenn is also available. As for turbulence models, Glenn-HT uses Wilcox’s k-as the defaultmodel (Ref. 4). The code also uses other turbulence models including the v2-f model of Durbin (Refs. 5 and 6) and a Reynolds Stress model developed by Wilcox (Ref. 4). Glenn-HT has found use in external and internal flows including heat transfer on turbine blades including tip clearance (Refs. 7 and 8), film cooling flow and heat transfer and conjugate heat transfer (Ref. 9). Other applications have included internal heating of airplane wings (Ref. 10). As for unsteady applications, solutions have been obtained for external turbine flows and heat transfer (Refs. 11, 12, and 13) and external flows resulting from pulse detonation (unpublished). Glenn-HT code has never been used for compressor flows and the present application is new.

NASA/CR—2010-216235 2
TABLE I.—ROTOR 37 DESIGN PARAMETERS
In an earlier incarnation, the code Glenn-HT was called TRAF3D. Arnone and Ameri using TRAF3D participated in the blind test case involving the present data (Ref. 14). The TRAF3D code, at the time, was a single block code that used a ‘C’ grid topology and employed an algebraic turbulence model. In the blind test case the tip clearance was modeled without gridding the gap. In the present work the tip gap was accounted for by meshing the tip clearance.
Results
In Figure 1, two views of the multi-block grid generated for the blade passage and the clearance is shown. The grid was generated using the GridPro commercial software. A close-up view of the tip grid is included that shows the refinement of the tip grid. The grid contains approximately 1.8 million cells. Only one grid resolution was tried but owing to the very large number of grid cells used in the simulations, no further refinement was done for this case. Due to the topology of the grid, the resolution of the grid on the tip of the blade, is as fine as the grid on the suction or the pressure side. Including the resolution of the grid on the casing, the tip region contains 49 grid points across the span of the tip clearance which was 0.4 cm as reported by Suder (Ref. 2).
Earlier studies of tip clearance effect (Refs. 15 and 16) have been made with far fewer points in the tip. The inlet and exit were placed so that they matched the locations recommended by the blind test case. The domain was subdivided into many blocks which was a result of grid generation. The blocks were formed into groups of approximately equal sizes in terms of grid points to take advantage of the multi-processing capability of the code.
For turbulence model, the Low Reynolds number k- model of Wilcox (Ref. 4) was used. Chima (Ref. 17) tested a newer version of the k- model (Ref. 18) and found it to perform better than the older version for the present case. We have not used any other models for this test case.
The dissipation is scaled with the grid resolution in Glenn-HT. Still only small amount of fourth order artificial dissipation was needed to achieve stable solution and convergence. The solution at 70 percent span section, in terms of Mach number for the near peak efficiency condition (discussed later), is shown in Figure 2. The bow shock and the shock/boundary layer interaction can be seen to have been simulated with good resolution. On the blade suction side, shown in Figure 3, the streamlines show a small recirculation zone that extends from the hub to the tip. This recirculation zone results from the interaction of the shock with the boundary layer as seen in Figure 2.

NASA/CR—2010-216235 3
Figure 3.—Flow streamlines showing some important features of the flow.
Figure 2.—Blade to blade Mach number contours, CFD (left) and experiment (right).
Figure 1.—Grid for the rotor 37 computations.
NASA/CR—2010-216235 4
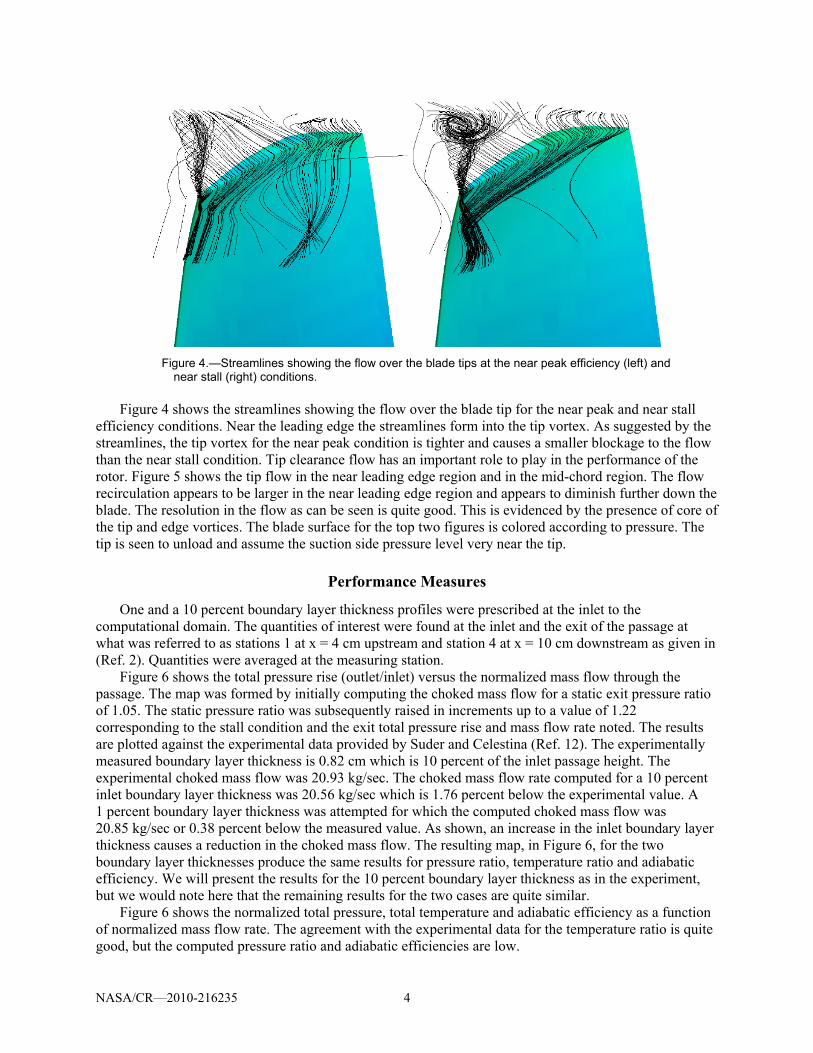
Figure 4.—Streamlines showing the flow over the blade tips at the near peak efficiency (left) and near stall (right) conditions.
Figure 4 shows the streamlines showing the flow over the blade tip for the near peak and near stall
efficiency conditions. Near the leading edge the streamlines form into the tip vortex. As suggested by the streamlines, the tip vortex for the near peak condition is tighter and causes a smaller blockage to the flow than the near stall condition. Tip clearance flow has an important role to play in the performance of the rotor. Figure 5 shows the tip flow in the near leading edge region and in the mid-chord region. The flow recirculation appears to be larger in the near leading edge region and appears to diminish further down the blade. The resolution in the flow as can be seen is quite good. This is evidenced by the presence of core of the tip and edge vortices. The blade surface for the top two figures is colored according to pressure. The tip is seen to unload and assume the suction side pressure level very near the tip.
Performance Measures
One and a 10 percent boundary layer thickness profiles were prescribed at the inlet to the computational domain. The quantities of interest were found at the inlet and the exit of the passage at what was referred to as stations 1 at x = 4 cm upstream and station 4 at x = 10 cm downstream as given in (Ref. 2). Quantities were averaged at the measuring station.
Figure 6 shows the total pressure rise (outlet/inlet) versus the normalized mass flow through the passage. The map was formed by initially computing the choked mass flow for a static exit pressure ratio of 1.05. The static pressure ratio was subsequently raised in increments up to a value of 1.22 corresponding to the stall condition and the exit total pressure rise and mass flow rate noted. The results are plotted against the experimental data provided by Suder and Celestina (Ref. 12). The experimentally measured boundary layer thickness is 0.82 cm which is 10 percent of the inlet passage height. The experimental choked mass flow was 20.93 kg/sec. The choked mass flow rate computed for a 10 percent inlet boundary layer thickness was 20.56 kg/sec which is 1.76 percent below the experimental value. A 1 percent boundary layer thickness was attempted for which the computed choked mass flow was 20.85 kg/sec or 0.38 percent below the measured value. As shown, an increase in the inlet boundary layer thickness causes a reduction in the choked mass flow. The resulting map, in Figure 6, for the two boundary layer thicknesses produce the same results for pressure ratio, temperature ratio and adiabatic efficiency. We will present the results for the 10 percent boundary layer thickness as in the experiment, but we would note here that the remaining results for the two cases are quite similar.
Figure 6 shows the normalized total pressure, total temperature and adiabatic efficiency as a function of normalized mass flow rate. The agreement with the experimental data for the temperature ratio is quite good, but the computed pressure ratio and adiabatic efficiencies are low.

NASA/CR—2010-216235 5
Exit Profiles
Two points on the map were chosen for further comparison. A near peak efficiency and a near stall point. The near peak efficiency was at a normalized mass flow rate of 0.98 and the near stall point was at a normalized mass flow rate of 0.925. We have chosen the pressure ratios of 1.12 and 1.22 as our corresponding points based on the mass flows and proximity to the runs we have made.
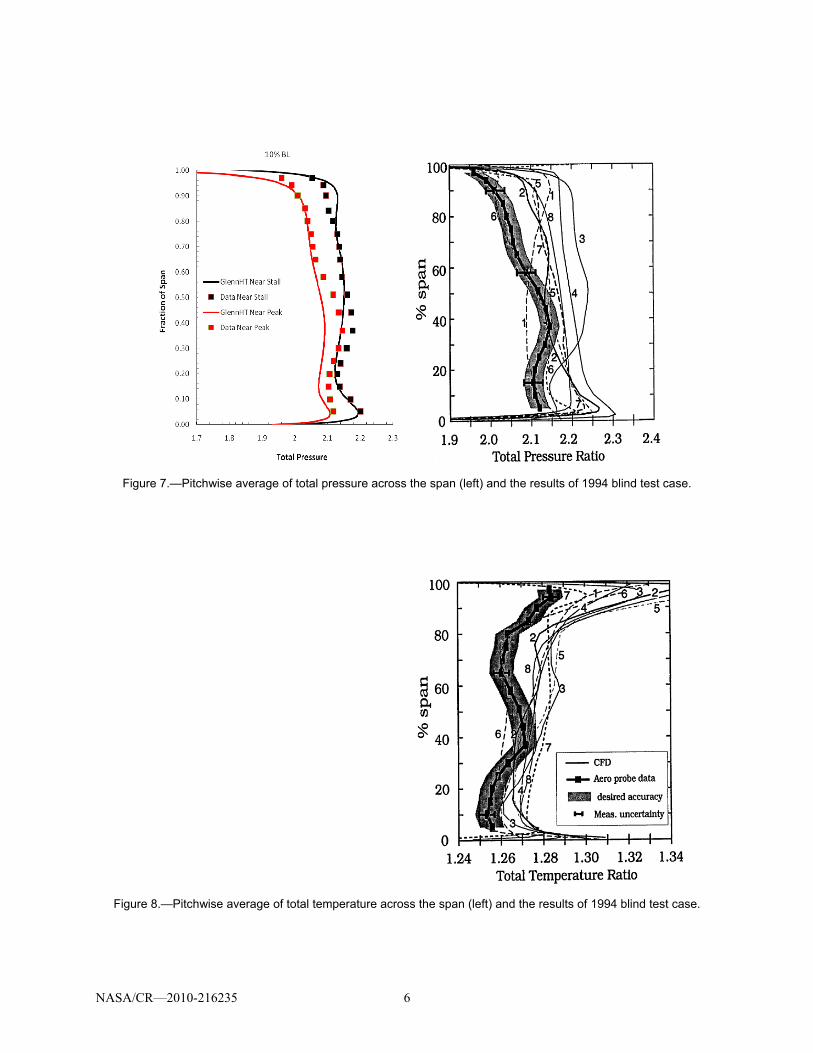
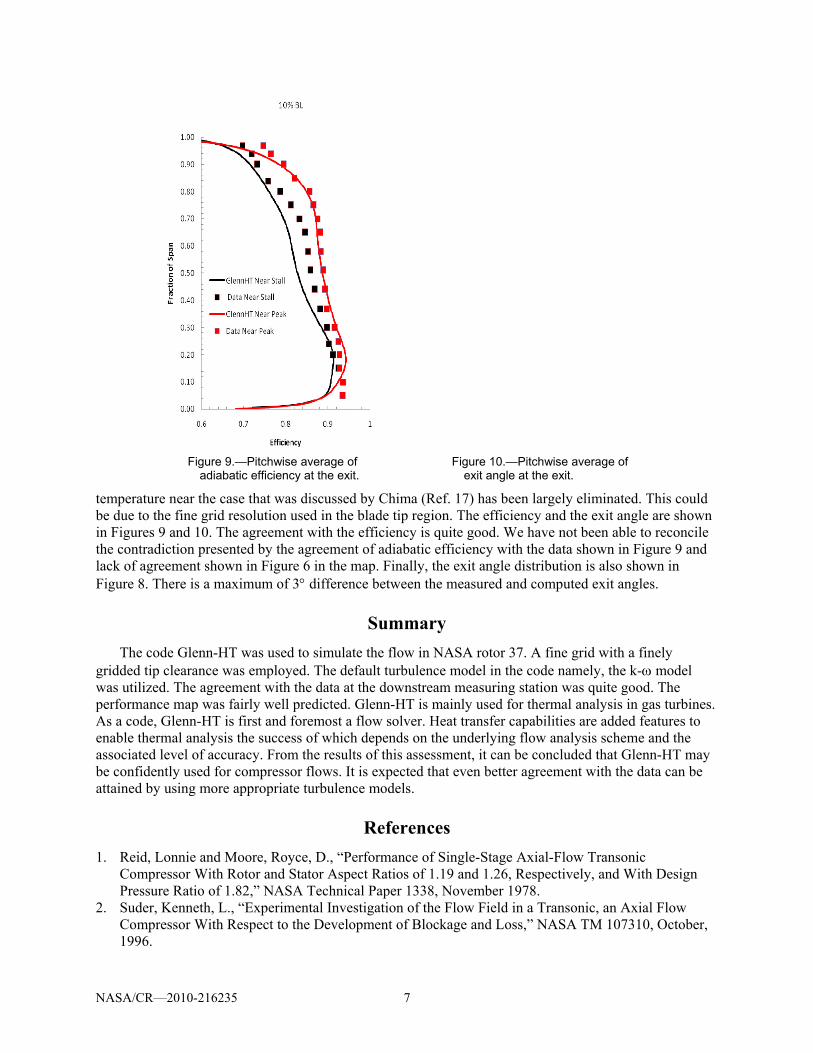
Figure 7 shows the spanwise variation of the tangentially averaged exit (downstream station x = 10 cm) total pressure, for the points on the map designated as near peak efficiency and near stall. The near hub deficit in the total pressure, evident in the data, has been captured. The results of the 1994 blind test case for the near peak efficiency results are also presented for comparison. For the total temperature, in Figure 8, the trends are captured and the agreement is quite good. The bands in which the results would be considered in good agreement with the data are shown for both total temperature and for the total pressure. The agreement is thus quite good for both of these measures. The large over-prediction in total
Figure 5.—Tip flow showing the recirculation zone in the tip clearance, top: near L.E. and middle in the mid chord region. The bottom figure shows the edge vortex along the blade tip.
Figure 6.—Total pressure, total temperature and
adiabatic efficiency versus normalized mass flow.
NASA/CR—2010-216235 6
Figure 7.—Pitchwise average of total pressure across the span (left) and the results of 1994 blind test case.
Figure 8.—Pitchwise average of total temperature across the span (left) and the results of 1994 blind test case.
NASA/CR—2010-216235 7
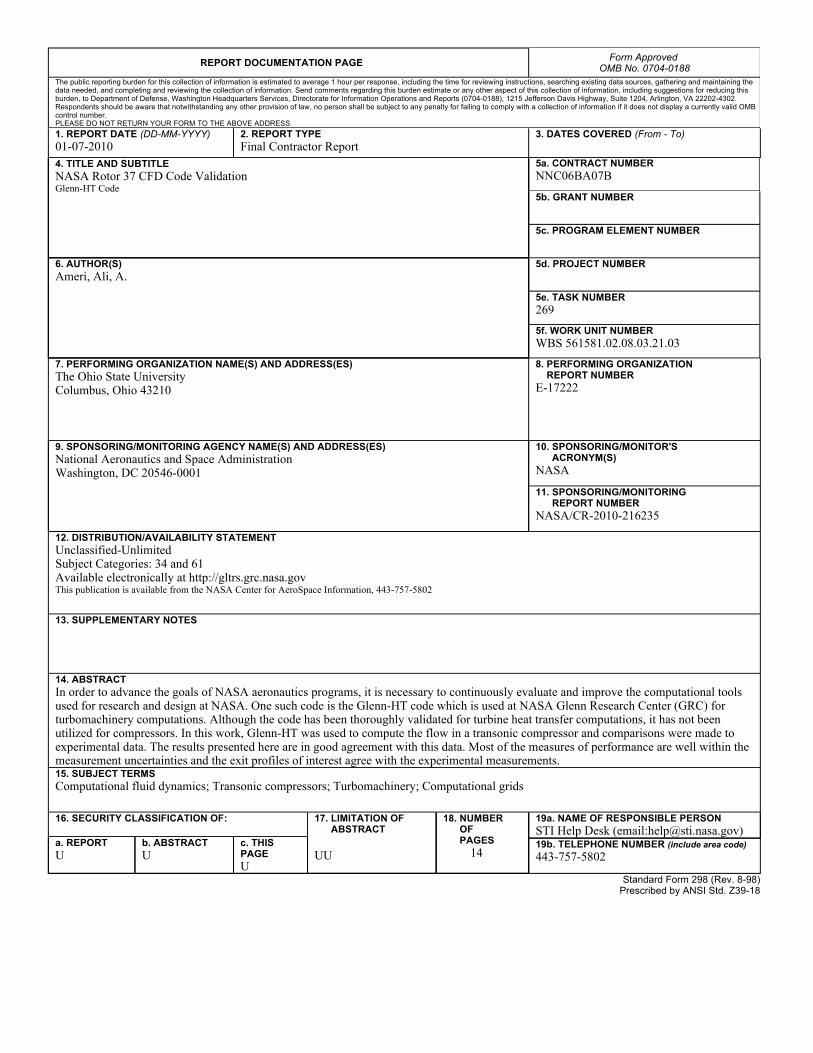
temperature near the case that was discussed by Chima (Ref. 17) has been largely eliminated. This could be due to the fine grid resolution used in the blade tip region. The efficiency and the exit angle are shown in Figures 9 and 10. The agreement with the efficiency is quite good. We have not been able to reconcile the contradiction presented by the agreement of adiabatic efficiency with the data shown in Figure 9 and lack of agreement shown in Figure 6 in the map. Finally, the exit angle distribution is also shown in Figure 8. There is a maximum of 3 difference between the measured and computed exit angles.
Summary
The code Glenn-HT was used to simulate the flow in NASA rotor 37. A fine grid with a finely gridded tip clearance was employed. The default turbulence model in the code namely, the k- model was utilized. The agreement with the data at the downstream measuring station was quite good. The performance map was fairly well predicted. Glenn-HT is mainly used for thermal analysis in gas turbines. As a code, Glenn-HT is first and foremost a flow solver. Heat transfer capabilities are added features to enable thermal analysis the success of which depends on the underlying flow analysis scheme and the associated level of accuracy. From the results of this assessment, it can be concluded that Glenn-HT may be confidently used for compressor flows. It is expected that even better agreement with the data can be attained by using more appropriate turbulence models.
References
1. Reid, Lonnie and Moore, Royce, D., “Performance of Single-Stage Axial-Flow Transonic Compressor With Rotor and Stator Aspect Ratios of 1.19 and 1.26, Respectively, and With Design Pressure Ratio of 1.82,” NASA Technical Paper 1338, November 1978.
2. Suder, Kenneth, L., “Experimental Investigation of the Flow Field in a Transonic, an Axial Flow Compressor With Respect to the Development of Blockage and Loss,” NASA TM 107310, October, 1996.
Figure 9.—Pitchwise average of adiabatic efficiency at the exit.
Figure 10.—Pitchwise average of exit angle at the exit.

NASA/CR—2010-216235 8
3. Huynh, H.T., “Analysis and Improvement of Upwind and Centered Schemes on Quadrilateral and Triangular Meshes,” AIAA–2003–3541.
4. Wilcox, D.C., 1994, Turbulence Modeling for CFD, Third Edition, DCW Industries, Inc., La Canada, CA., 2004.
5. Durbin, P.A. Pettersson Reif, B.A. Statistical Theory and Modeling for Turbulent Flow, Wiley Publishing, 2001.
6. Ameri, Ali A. and Ajmani, Kumud, “Evaluation of Predicted Heat Transfer on a Transonic Blade Using V2-f Models,” IGTI Meeting, Vienna, Austria, ASME 2004–GT–53572, 2004.
7. Ameri, Ali A., Steinthorsson, E. Rigby, D., “Effect of Tip Clearance and Casing Recess on Heat Transfer and Stage Efficiency in Axial Turbines,” ASME Journal of Turbomachinery, 121, No. 4, pp. 683–693, October 1999.
8. Ameri, Ali A. Steinthorsson, E. Rigby, D., “Effect of Squealer Tips on Rotor Heat Transfer and Efficiency,” ASME Journal of Turbomachinery, 120, No. 4, pp. 753–759, Oct. 1998.
9. Heidmann, J., Rigby, D.L Ameri, A.A., “A Three Dimensional Coupled Inetrnal/External Simulation of a Film Cooled Turbine Vane,” ASME Journal of Turbomachinery, 122, pp. 348–359, Apr. 2000.
10. Rigby, D. “Numerical Investigation of Hole Pattern Effect on Piccolo Tube Anti-Icing,” AIAA–2006–1012.
11. Ameri, Ali A. and El-Gabry, Lamyaa, “Computation of Unsteady Heat Transfer on the Casing of a Turbine Blade,” ISROMAC 12, Honolulu, Hawaii, February 2008.
12. Ameri, A.A., Rigby, D.L. Steinthorsson, E., Heidmann, J.D., Fabian, J.C., “Unsteady Turbine Blade and Tip Heat Transfer Due to Wake Passing,” GT2007–27550, Gas Turbine Conference, May 2007, Montreal, Canada.
13. Ameri, A.A. Rigby, D.L., Steinthorsson, E., Heidmann, J.D., Fabian, J.C., “Unsteady Analysis of Blade and Tip Heat Transfer as Influenced by The Upstream Momentum and Thermal Wakes,” GT2008–51242, Gas Turbine Conference, June 2008, Berlin, Germany.
14. Arnone, Andrea and Ameri, Ali A., “Predictions of the NASA Rotor 37 Test Case,” International Gas Turbine Institute Meeting presented at the ASME International Gas Turbine Institute Meeting, June, 1994, The Hague, Netherlands.
15. Chima, Rodrick V., “Calcualtion of Tip Clearance Effects in a Transonic Compressor Rotor,” ASME Paper 96-GT-114, June 1996. Also NASA TM-107216.
16. Yamada, Kazutoyo, Furukawa, Masato, Inoue, Masahiro and Funazaki, Ken-ichi, “Numerical Analysis of Tip Leakage Flow Field in a Transonic Axial Compressor Rotor,” Proceedings of the International Gas Turbine Congress 2003 Tokyo. IGTC2003 Tokyo TS-030.
17. Chima, R.V., “Swift Code Assessment for Two Similar Transonic Compressors,” AIAA paper AIAA–2009–1058 or NASA/TM—2009-215520, Jan. 2009.
18. Wilcox, David C., “Formulation of the k- turbulence model revisited,” AIAA–2007–1408.
REPORT DOCUMENTATION PAGE Form Approved
OMB No. 0704-0188 The public reporting burden for this collection of information is estimated to average 1 hour per response, including the time for reviewing instructions, searching existing data sources, gathering and maintaining the data needed, and completing and reviewing the collection of information. Send comments regarding this burden estimate or any other aspect of this collection of information, including suggestions for reducing this burden, to Department of Defense, Washington Headquarters Services, Directorate for Information Operations and Reports (0704-0188), 1215 Jefferson Davis Highway, Suite 1204, Arlington, VA 22202-4302. Respondents should be aware that notwithstanding any other provision of law, no person shall be subject to any penalty for failing to comply with a collection of information if it does not display a currently valid OMB control number. PLEASE DO NOT RETURN YOUR FORM TO THE ABOVE ADDRESS.
1. REPORT DATE (DD-MM-YYYY) 01-07-2010
2. REPORT TYPE Final Contractor Report
3. DATES COVERED (From - To)
4. TITLE AND SUBTITLE NASA Rotor 37 CFD Code Validation Glenn-HT Code
5a. CONTRACT NUMBER NNC06BA07B
5b. GRANT NUMBER
5c. PROGRAM ELEMENT NUMBER
6. AUTHOR(S) Ameri, Ali, A.
5d. PROJECT NUMBER
5e. TASK NUMBER 269
5f. WORK UNIT NUMBER WBS 561581.02.08.03.21.03
7. PERFORMING ORGANIZATION NAME(S) AND ADDRESS(ES) The Ohio State University Columbus, Ohio 43210
8. PERFORMING ORGANIZATION REPORT NUMBER E-17222
9. SPONSORING/MONITORING AGENCY NAME(S) AND ADDRESS(ES) National Aeronautics and Space Administration Washington, DC 20546-0001
10. SPONSORING/MONITOR'S ACRONYM(S) NASA
11. SPONSORING/MONITORING REPORT NUMBER NASA/CR-2010-216235
12. DISTRIBUTION/AVAILABILITY STATEMENT Unclassified-Unlimited Subject Categories: 34 and 61 Available electronically at http://gltrs.grc.nasa.gov This publication is available from the NASA Center for AeroSpace Information, 443-757-5802
13. SUPPLEMENTARY NOTES
14. ABSTRACT In order to advance the goals of NASA aeronautics programs, it is necessary to continuously evaluate and improve the computational tools used for research and design at NASA. One such code is the Glenn-HT code which is used at NASA Glenn Research Center (GRC) for turbomachinery computations. Although the code has been thoroughly validated for turbine heat transfer computations, it has not been utilized for compressors. In this work, Glenn-HT was used to compute the flow in a transonic compressor and comparisons were made to experimental data. The results presented here are in good agreement with this data. Most of the measures of performance are well within the measurement uncertainties and the exit profiles of interest agree with the experimental measurements.15. SUBJECT TERMS Computational fluid dynamics; Transonic compressors; Turbomachinery; Computational grids
16. SECURITY CLASSIFICATION OF: 17. LIMITATION OF ABSTRACT UU
18. NUMBER OF PAGES
14
19a. NAME OF RESPONSIBLE PERSON STI Help Desk (email:[email protected])
a. REPORT U
b. ABSTRACT U
c. THIS PAGE U
19b. TELEPHONE NUMBER (include area code) 443-757-5802
Standard Form 298 (Rev. 8-98)Prescribed by ANSI Std. Z39-18

