dynamic calibration of the nasa ames rotor test apparatus ... · dynamic calibration of the nasa...
TRANSCRIPT

/, *
NASA Technical Memorandum 110393
Dynamic Calibration of theNASA Ames Rotor Test ApparatusSteady/Dynamic Rotor Balance
Randall L. Peterson and Johannes M. van Aken
April 1996
National Aeronautics and
Space Administration


NASA Technical Memorandum 110393
Dynamic Calibration of theNASA Ames Rotor Test ApparatusSteady/Dynamic Rotor Balance
Randall L. Peterson, Ames Research Center, Moffett Field, California
Johannes M. van Aken, Sterling Federal Systems, Inc., Palo Alto, California
April 1996
National Aeronautics and
Space Administration
Ames Research CenterMoffett Field, California 94035-1000

Dynamic Calibration of the NASA Ames Rotor Test Apparatus
Steady/Dynamic Rotor Balance
RANDALL L. PETERSON AND JOHANNES M. VAN AKEN*
Ames Research Center
Summary Nomenclature
The NASA Ames Rotor Test Apparatus was modified to AF
include a Steady/Dynamic Rotor Balance. The dynamic
calibration procedures and configurations are discussed. NFRandom excitation was applied at the rotor hub, and
vibratory force and moment responses were measured on NFi
the steady/dynamic rotor balance. Transfer functions were
computed using the load cell data and the vibratory force PM
and moment responses from the rotor balance. Calibration
results showing the influence of frequency bandwidth, RMhub mass, rotor RPM, thrust preload, and dynamic loads
through the stationary push rods are presented and SFdiscussed.
Vx
Introduction
Accurate measurements of the vibratory loading of a
rotor system have long been a challenge to the rotorcrafl
community (refs. I-4). In 1987, NASA Ames identified
the requirement to extend the capability of the Rotor TestApparatus (RTA) to measure both the steady and vibra-
tory hub forces and moments to thrust levels of 22,000 lb.
From this requirement a rotor balance was designed,fabricated, and calibrated to measure both the steady and
vibratory thrust, torque, shears, and moments of any rotor
system installed on the RTA.
This report documents the procedures and results of
the dynamic calibration of the Steady/Dynamic RotorBalance (S/DRB) on the RTA. Calibration results show-
ing the influence of frequency bandwidth, hub mass, rotorRPM, thrust preload, and dynamic loads through the
stationary push rods are presented and discussed. Further
results and information regarding the calibration and data
processing procedures for the S/DRB are found inreferences 5 and 6.
*Sterling Federal Systems, Inc., Palo Alto, California.
axial force, positive aft, Ib
normal force, positive up, ib
normal force on flexure i, positive up, Ib
pitch moment, positive nose up, ft-lb
roll moment, positive right wing down, ft-lb
side force, positive to right, Ib
output voltage for strain gage X, mV
Test Hardware
Rotor Test Apparatus
The NASA Ames RTA is a special-purpose drive and
support system for operating helicopter rotors in the
40- by 80- and 80- by 120-Foot Wind Tunnels. The RTAhouses two electric drive motors, the hydraulic servo-
actuators of the primary control system, and a dynamic
control system capable of introducing dynamic pertur-bations to the nonrotating swashplate (collective and tilt)
at frequencies up to 40 Hz. Installed on the RTA is a
five-component S/DRB to measure rotor loads at the hub
moment center. The balance was designed and fabricated
to measure both the steady and vibratory rotor normal,
axial, and side forces, together with rotor pitch and rollmoments to rotor thrust levels of 22,000 lb. An instru-
mented flex-coupling measures rotor torque and residualnormal force. The isolated balance natural frequencies areall above 60 Hz.
Steady/Dynamic Rotor Balance
The five-component S/DRB is located between the RTAtransmission and the upper housing. The S/DRB consists

oftworings with a 28-in. inner diameter and a 32-in.
outer diameter, which are connected to each other by four
rectangular, instrumented flexures. The centers of the fourflexures are located on a 30-in. diameter circle.
Figure 1 shows a schematic top view of the five-
component ring balance. The flexures are identified by
the numbers l through 4. Flexures l and 2 are located in
the longitudinal plane in the forward and aft locations,respectively. Flexures 3 and 4 are located in the lateral
plane at the left and right positions, respectively. The
balance flexures are 2.872 in. tall and have a rectangular
cross section measuring 0.540 by 1.068 in. The flexures
are oriented such that the long side of the rectangular
cross section is tangential to the balance circumference.
Figure 2 shows the balance. The balance was retrofitted to
the existing RTA model and installed on top of the RTA
transmission. The presence of an extrusion to accommo-
date the transmission idler shaft and bearing resulted in alarge cutout in the nonmetric side of the balance. This
45 deg pie shape cutout is clearly visible in figure 2 onthe lower side of the balance. The cutout is located
directly under flexure 2 and resulted in some large
balance gage interactions.
The balance static load limits are: 22,000 Ib of thrust,
4,400 Ib of resultant in-plane shear, and 57,800 ft-lb ofresultant moment at the balance moment center. There-
fore, the maximum allowable resultant hub moment
depends upon the hub height above the balance momentcenter. The balance shares a common centerline with the
rotor shaft. The rotor shaft has an in-line flex-coupling,
which is instrumented to measure rotor torque up to a
maximum of 36,000 ft-lb and the residual shaft thrust upto a calibration limit of 200 lb.
The vibratory (I/2 peak-to-peak) load limits of the
balance are: 5,500 lb of thrust, 1,100 Ib of resultant
in-plane shear, and 8,920 ft-lb of resultant moment withthe balance static load limits listed above as the do not
exceed limits.
Rotor Control System
Figure 3 shows a schematic of the RTA control system.
Static control of the swashplate is provided through the
three primary actuators. The three stationary (nonrotating)
push rods connect the walking beams to the swashplate.
These three push rods are approximately parallel to the
rotor shaft and are located on an approximate radius of
8.4 in. at azimuth locations of 120 (push rod number I),210 (push rod number 3), and 300 deg (push rod
number 2) with zero deg azimuth pointing aft along
the RTA longitudinal axis. The stationary push rods are
instrumented to measure the push rod's axial force.
The rotor control system is installed on the actuator
baseplate of the RTA, which is mounted to the upper
output bearing housing which in turn is installed on top
of the steady/dynamic rotor balance. Loading throughthe stationary push rods results in simultaneous normal
force, pitch moment, and roll moment loading. The rotorbalance measurements represent the total rotor loading
including the loading transferred down from the rotor
through primary load path formed by the rotor shaft and
the RTA upper output bearing housing, and through the
secondary load path formed by the rotating push rods,
swashplate, walking beams, stationary push rods, actuator
baseplate, and the RTA upper housing output bearinghousing. Figure 3 is a schematic of the redundant load
path system on the RTA.
Balance Gaging
Each of the four flexures is instrumented with a four-arm
active Wheatstone bridge to measure loading in theflexure axial direction (balance normal force direction).
These four individual normal force component readings,VNF i, i = 1--4, are summed to provide the balance normal
force reading, VNF = VNF 1 + VNF 2 +VNF 3 + VNF 4. The
readings from the opposing flexures are differenced to
provide pitch and roll moment readings, VpM = VNF 1-
VNF 2 and VRM = VNF 3 - VNF4, respectively.
Each of the four flexures is also instrumented with a four-
arm active Wheatstone bending bridge, measuring the
shear force along the long side of the flexure cross
section. The strain gage outputs of opposing flexures are
wired into a Wheatstone bridge to provide the balance
axial force reading, VAF (from flexures 3 and 4), and the
balance side force reading, VSF (from flexures ! and 2).
Balance Monitoring
The balance provides six gage readings: NFI, NF2, NF3,
NF4, AF, and SF. The summing and differencing of the
NFi gages into the NF, PM, and RM readings are done
digitally in the balance data reduction program.
A Balance Analog Monitoring Box (BAMB) is used for
on-line monitoring to ensure safe operation of the rotor
system and the balance. This box combines the six
balance gage outputs into analog signals representing thevarious forces and moments in both the balance- and the
hub-axis systems. This on-line analog process does not

provideforbalancegageinteractioncorrections.ThevariousanalogoutputsignalsfromtheBAMBaredisplayedonananalogbarchartmonitororonanoscilloscopetoperformtheon-linesafety-of-flightmonitoringduringactualwindtunneltesting.Actualsafety-of-flightmonitoringlimitsaretestdependentduetohubheightabovethebalancemomentcenter.
TheBAMBanalogsignalsforNF,PM,andRMwerealsoacquiredduringthedynamiccalibrationtestforuseindeterminingthedynamiccalibrationmatrix.
Dynamic Balance Calibration
Test Setup
The RTA was mounted on the three-strut model support
system of the 40- by 80-Foot Wind Tunnel. The 8-ft
model support struts with 33-in. tips were installed onto aT-frame, which in turn was supported by the wind tunnel
scale system. The rotor plane was approximately 22 flabove the tunnel floor. An extensive dynamic calibration
test was performed to obtain the balance/stand frequency
response (transfer) functions that represent the dynamicsof the RTA installation. Figures 4 and 5 show the RTA
installed in the test section of the 40- by 80-Foot Wind
Tunnel during the dynamic calibration test.
The rotor hub was replaced by special calibration
hardware, which allowed for applying loading with and
without the rotor shaft rotating. The calibration hardwareconsisted of a shaft with a radial bearing installed at the
appropriate hub height and a thrust bearing at the end of
the shaft. These two bearings allow for the application of
static or dynamic loads on a rotating shaft: in-plane hubshear load for the radial bearing and thrust load for the
thrust bearing. The outer bearing race is prevented from
rotating using guy wires secured to a telescoping man-lift
as shown in figures 6 and 7.
A calibration fixture was attached to the thrust bearing
fixture which allowed for vertical load application at theshaft center and at a radial moment arm. Figure 8 is a
schematic showing the vertical calibration configuration
in the 40- by 80-Foot Wind Tunnel. The moment carrying
capability of the thrust bearing under rotation limited themoment arm to I ft. Vertical dynamic loading at the 1-ft
moment arm (fig. 6) represented the out-of-plane hub
shear (thrust) and dynamic hub moments (pitch and roll).
The two bearings allowed for the dynamic in-plane shear
load application while applying a steady vertical force atthe shaft end, i.e., a thrust force. Figure 9 is a schematic
showing the longitudinal and lateral in-plane calibration
configurations in the 40- by 80-Foot Wind Tunnel.
Two circular platters were secured to the shaft just
below and above the radial hub bearing (figs. 6 and 7).
Semicircular weights of 61.1 Ib (half-donuts) were
installed onto each of these two platters to simulate the
hub and blade weight. By adding or removing weights the
total calibration test mass can be varied to represent the
mass of different rotor systems. The vertical center of
gravity (cg) of the calibration test hardware is located at
the radial bearing center, which represents the hublocation.
Dynamic calibration of the rotor balance through the
stationary push rods was also conducted. To obtain access
to the push rods, it was necessary to remove the calibra-
tion hardware and acquire the balance gage frequency
responses at zero hub and blade mass only. Vibratory
loading was applied directly to the free end of one of the
stationary push rods.
Test Procedures
A hydraulic actuator was used to excite the model and the
support system at the nominal hub height of 6.1 ft abovethe balance moment center. One end of the hydraulic
actuator was attached to a 5-fi long extension arm. Theother end of the actuator was attached to the hub. The
extension arm was attached to an 11,600-1b reaction mass
hung from the gantry crane, as shown in figures 4, 5,and 8. The actuator was aligned with respect to the
extension arm, which was in turn aligned parallel to the
calibration direction. After achieving rough alignment of
the actuator and the extension arm using the gantry crane,
finer alignment was achieved by applying tension to the
guy wires attached between the reaction mass and the
tunnel floor. The guy wires also restrained swinging ofthe reaction mass during actuator excitation. A load cell
located between the hydraulic actuator and the hub
measured the applied force.
A random excitation from 0 to 64 Hz at input force levels
of up to :1.-600lb was applied at the nominal rotor hub
height. A 16-channel GenRad 2515 Computer-Aided Test
System was used to acquire and store the Frequency
Response Functions (FRFs) or transfer functions of thebalance forces and moments with respect to the inputforce load cell. The FRF data were then transferred to a
VAX mainframe computer for further data processing.

Test Envelope
The dynamic calibration test setup did not allow for the
application of pure hub moments. Hub moments were
obtained by applying a vertical force at a l-It radialmoment arm from the hub center. This loading results
in a hub force (thrust) and a hub moment (pitch or roll).The balance also measures a balance force and a balance
moment with respect to the balance moment center. A
pure in-plane hub shear does not result in a hub moment,but results in a balance shear and a balance moment due
to the vertical separation or offset of the hub and balancemoment center. To determine the dynamic calibration
matrix for the five-component S/DRB as a result ofloading through the primary load path, a total of five
loading sequences were used. The five load sequences
are identified in table 1. The five unique load sequences
are: vertical loading at the shaft center (thrust loading),
vertical loading at ! ft forward of the shaft center (thrust
and hub pitch moment loading), vertical loading at 1 ft tothe left of the shaft center (thrust and hub roll moment
loading), and hub horizontal loading in the RTA longi-
tudinal plane (hub axial force loading) and in the RTA
lateral plane (hub side force loading). To determine thedynamic calibration matrix for the five-component
S/DRB as a result of loading through the secondary(redundant) load path, a total of three loading sequences
were used. The three load sequences are also identified in
table 1. The three unique load sequences are: vibratory
loading through stationary push rod number 1, vibratory
loading through stationary push rod number 2, and
vibratory loading through stationary push rod number 3.
As discussed previously, loading through the stationary
push rods results in simultaneous normal force, pitch
moment, and roll moment loading. For each balance
loading setup the FRFs for the following balance readings
were acquired: NFI, NF2, NF3, NF4, AF, and SF from
the balance gages and the resolved NF, PM, and RM
signals from the BAMB.
During the calibration test, data for the set of five loading
sequences through the primary load path and the three
loading sequences through the secondary or redundant
load path shown in table I were acquired at zero shaft
rotation and at zero thrust preload. Data were also
acquired during longitudinal and lateral shear force
shaking while applying a steady thrust force to the hub.
In addition, some data were acquired with shaft rotation
at nominal rotor speeds of 315 and 425 RPM, with andwithout a thrust preload.
A description of the data processing procedures, including
the determination of the dynamic calibration matrices, isprovided in references 5 and 6. Reference 5 describes the
data processing procedures for the dynamic loadingthrough the primary load path, and reference 6 describes
the data processing procedures for the dynamic loading
through both the primary load path and the secondary(redundant) load path.
Test Configurations
Dynamic calibration testing of the RTA S/DRB configu-
ration was performed prior to two 40- by 80-Foot Wind
Tunnel test entries in which the Sikorsky five-bladedBearingless Main Rotor (SBMR) (refs. 6 and 7) and the
BO105 four-bladed hingeless main rotor (ref. 8) weretested. The RTA was not removed from the tunnel
support system between these two tunnel entries. The hub
calibration test hardware, however, was reconfigured torepresent the hub/blade mass of each of these two rotor
systems. The weight difference between the two
hub/blade systems is 740 lb. The hub/balance center
offset was 6.1 ft in both tests. In general, the lower and
upper limits of the RTA test capabilities are representedby the BOI05 and SBMR rotor systems, respectively.
Dynamic Calibration Results
Frequency Response Function data were acquired during
extensive dynamic calibration testing of the RTA in the
40- by 80-Foot Wind Tunnel. Table 2 shows the testenvelope at which these FRFs were obtained for the two
test configurations, representing the SBMR and BO105
rotor systems. These FRF data were acquired at a zero
deg RTA shaft angle, i.e., at zero model angle of attack.
Data were acquired to determine the effects of frequency
bandwidth, hub mass, rotor RPM, thrust preload, and
dynamic loads through the stationary push rods on the
balance response due to the dynamic behavior of the RTA
and the wind tunnel support system.
Effects of Frequency Resolution
Figures 10-14 and 16 present comparisons of the balance
gage output FRFs for two different data acquisition
frequency bandwidth settings (0-32 and 0-64 Hz). These
comparisons were performed to evaluate the influence of
increased frequency resolution on the measured FRFs.
The repeatability of the FRF data from 0 to 32 Hz can
also be evaluated from these comparisons. Figure 15 is a
comparison of balance gage output FRFs for forward and
aft hub (out-of-plane) pitch moment loading. In general,
the influence of reduced frequency bandwidth (from
0-64 Hz to 0-32 Hz) in the data acquisition process

showednosignificantchangesintheFRFswithincreasedfrequencyresolutionin either the directly loaded balance
gages or the interactions.
Figures 10-16 show significant changes in the dynamic
response of the balance over the entire frequency band-width of either 0-32 Hz or 0-64 Hz. Since the balance
flexure design places the balance natural frequencies
above 60 Hz, the changes in the dynamic balanceresponse seen in figures 10-16 are attributed to the
dynamic structural characteristics of both the wind
tunnel support system and the RTA itself. The response/
interaction of the balance gages is changed significantly
by the balance dynamic response shown in figures 10-16,
indicating the necessity of making dynamic corrections to
both the gage sensitivity and gage interaction terms in thebalance calibration matrix.
Figure 10 presents representative FRFs of the balance
gage outputs due to a side force loading at the hub (load
sequence 6). The balance moment center is located 6. i ftbelow the hub, and a hub side force therefore results in
both a balance side force and a balance roll moment
loading. The calibration test hub mass for this FRF data
set represents the mass of the BOi05 hub and blades.
The loading, measured by the input force load cell, was
converted into the corresponding loading seen by the
balance. The FRF magnitude axis dimension is in units of
EUoutput/EUinput, where EU represents engineering unitsof the corresponding balance output. Forces are presented
in Iboutput/lbinput, while the moments are presented in ft-
lboutput/ft-lbinput. At low frequencies (<1 Hz) the FRF forthe side force (fig. 10(e)) and the roll moment (fig. 10(c))
gages show a ratio of approximately I as these are thedirectly loaded gages. The other three gages, normal force
(fig. 10(a)), axial force (fig. 10(d)), and pitch moment
(fig. 10(b)), show a ratio of approximately 0 at low
frequency (<1 Hz) and indicate the amount of load
interaction seen by these gages. The differences in the
balance gage FRFs due to side force loading between (he0-32 Hz and 0-64 Hz bandwidths are small and are
primarily seen in the balance gage interactions. Small
differences in both magnitude and phase are seen in the
normal force interaction (fig. 10(a)), the axial forceinteraction (fig. 10(d)), and the pitch moment interaction
(fig. lO(b)).
Figure 11 presents representative FRFs of the balance
gage outputs due to an axial force loading at the hub (load
sequence 5). As in the case with the side force loading,
the balance moment center is located 6. I ft below the hub,and a hub axial force therefore results in both a balance
axial force and a balance pitch moment loading. At
low frequencies (<! Hz) the FRFs for the axial force
(fig. I I(d)) and the pitch moment (fig. 1 l(b)) gages show
a ratio of approximately I as these are the directly loaded
gages. The other three gages, normal force (fig. 1 i (a)),
side force (fig. I I(e)), and roll moment (fig. I I(c)), show
a ratio of approximately 0 at low frequency (<1 Hz) and
indicate the amount of load interaction seen by these
gages. Again, the differences in the balance gage FRFs
due to axial force loading between the 0-32 Hz and
0--64 Hz bandwidths are small and are primarily seen inthe balance gage interactions.
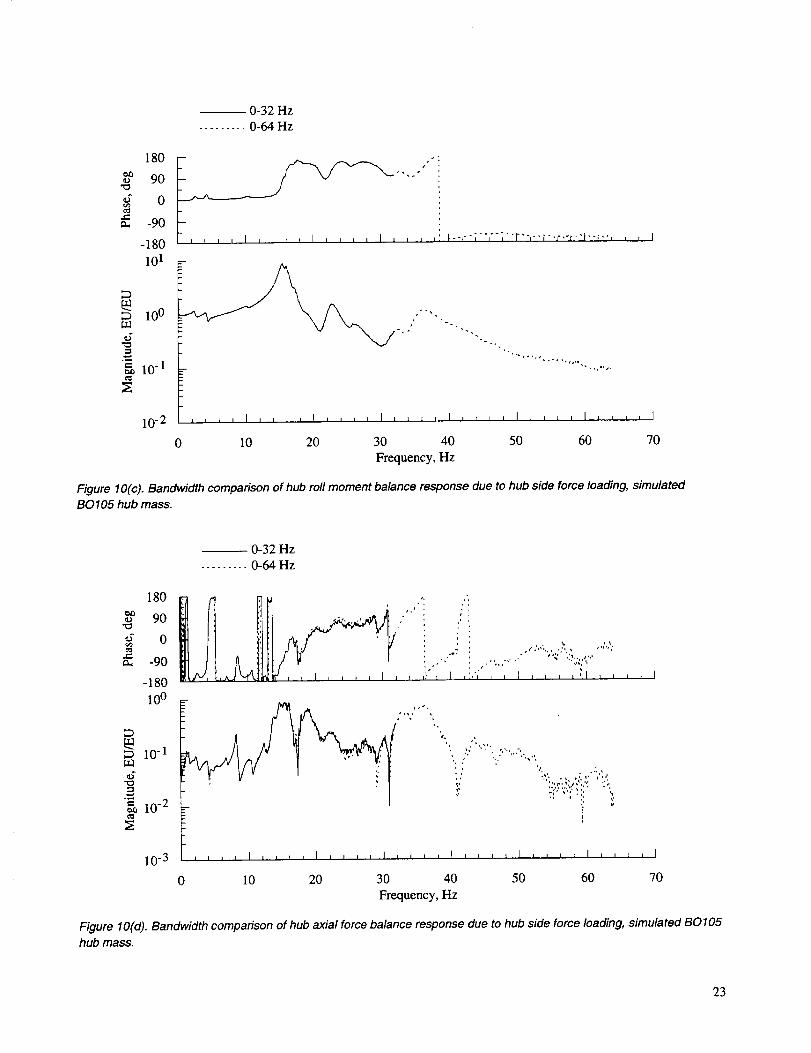
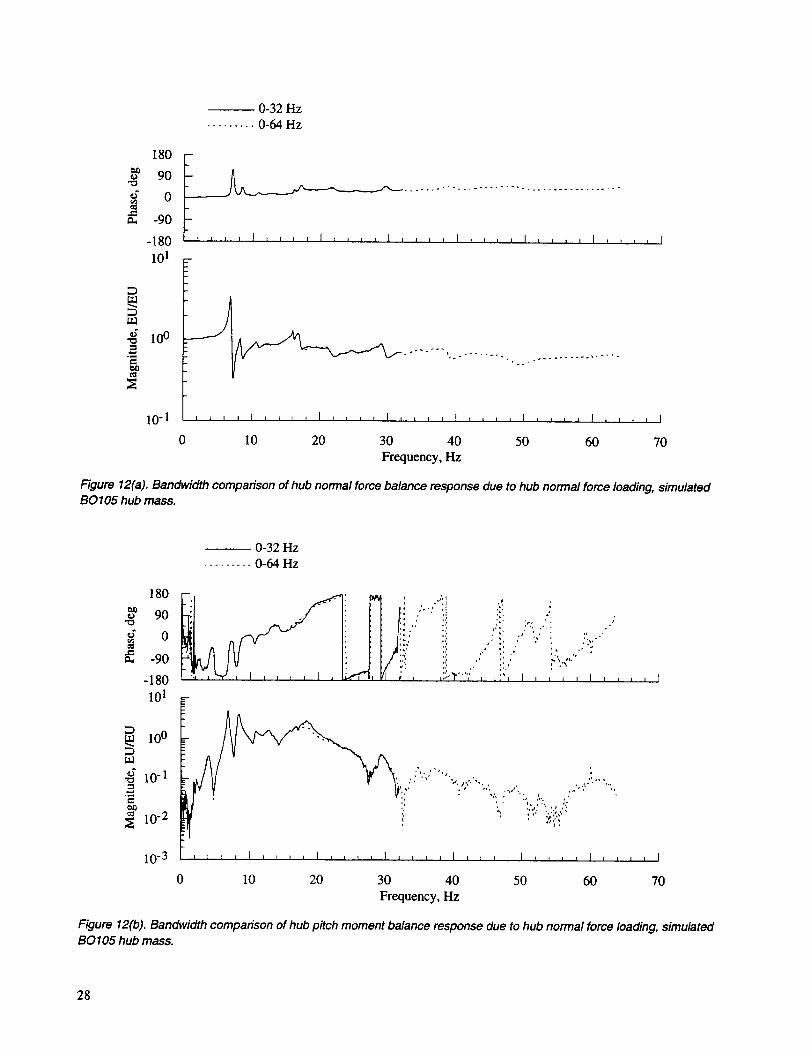
Figure 12 presents representative FRFs of the balance
gage outputs due to a normal force loading at the hub(load sequence I). At low frequencies (<1 Hz) the FRF
for the normal force (fig. 12(a)) gage shows a ratio of
approximately 1 as this is the only directly loaded gage.
The other four gages, axial force (fig. 12(d)), side force
(fig. 12(e)), pitch moment (fig. 12(b)), and roll moment
(fig. 12(c)), show a ratio of approximately 0 at lowfrequency (<1 Hz) and indicate the amount of load
interaction seen by these gages. Again, the differences
in the balance gage FRFs due to normal force loadingbetween the 0-32 Hz and 0-64 Hz bandwidths are small
and are primarily seen in the balance gage interactions.
Figure 13 presents representative FRFs of the balance
gage outputs due to a forward pitch (out-of-plane)moment loading at the hub (load sequence 2). At low
frequencies (<! Hz) the FRFs for the pitch moment
(fig. 13(b)) and the normal force (fig. 13(a)) gages show
a ratio of approximately I as these are the only directly
loaded gages. The other three gages, axial force
(fig. 13(d)), side force (fig. 13(e)), and roll moment
(fig. 13(c)), show a ratio of approximately 0 at low
frequency (<1 Hz) and indicate the amount of load
interaction seen by these gages. Again, the differences
in the balance gage FRFs due to pitch moment loadingbetween the 0-32 Hz and 0--64 Hz bandwidths are small
and are primarily seen in the balance gage interactions.
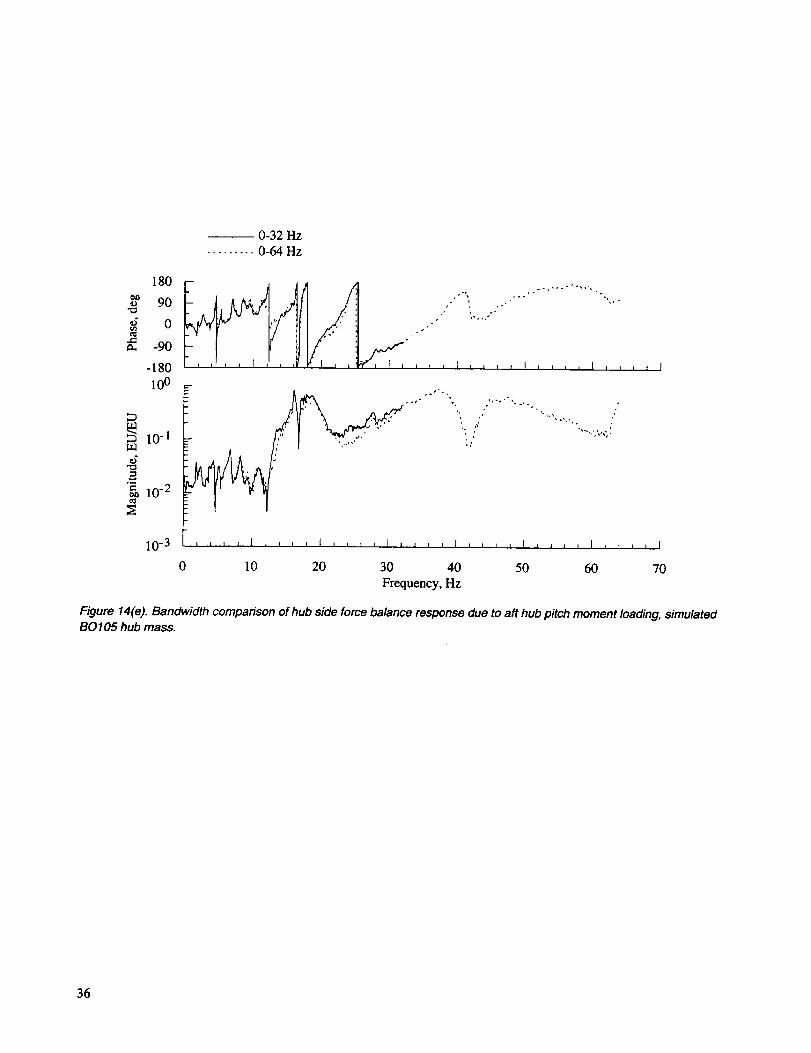
Figure 14 presents representative FRFs of the balance
gage outputs due to an aft pitch (out-of-plane) moment
loading at the hub (load sequence 3). At low frequencies
(<! Hz) the FRFs for the pitch moment (fig. 14(b)) and
the normal force (fig. 14(a)) gages show a ratio of
approximately 1 as these are the only directly loaded
gages. The other three gages, axial force (fig. 14(d)), sideforce (fig. 14(e)), and roll moment (fig. 14(c)), show a
ratio of approximately 0 at low frequency (< I Hz) and
indicate the amount of load interaction seen by these
gages. Again, the differences in the balance gage FRFs
due to roll moment loading between the 0-32 Hz and
0-64 Hz bandwidths are small and are primarily seen in
the balance gage interactions.

Figure15presentsa comparison of the balance gage
output FRFs for the directly loaded gages shown in
figures 13 and 14. Figure 15(a) is a comparison of the
normal force response due to a forward (fig. 13(a)) and
an aft (fig. 14(a)) hub pitch moment loading. Figure 15(b)
is a comparison of the pitch moment response due to the
same forward (fig. 13(b)) and an aft (fig. 14(b)) hub pitch
moment loading. The primary phase difference (180 deg
phase shift) shown in figure 15(b) is due to the positive
sign convention of the load cell and balance under a static
load. Differences in the FRFs of the directly loaded gagesshown in figure 15 and comparisons of the interactions
shown figures 13 and 14 are probably caused by the
physical cutout in the nonmetric portion of the balance
that was discussed previously in this report and shown in
figure 2.
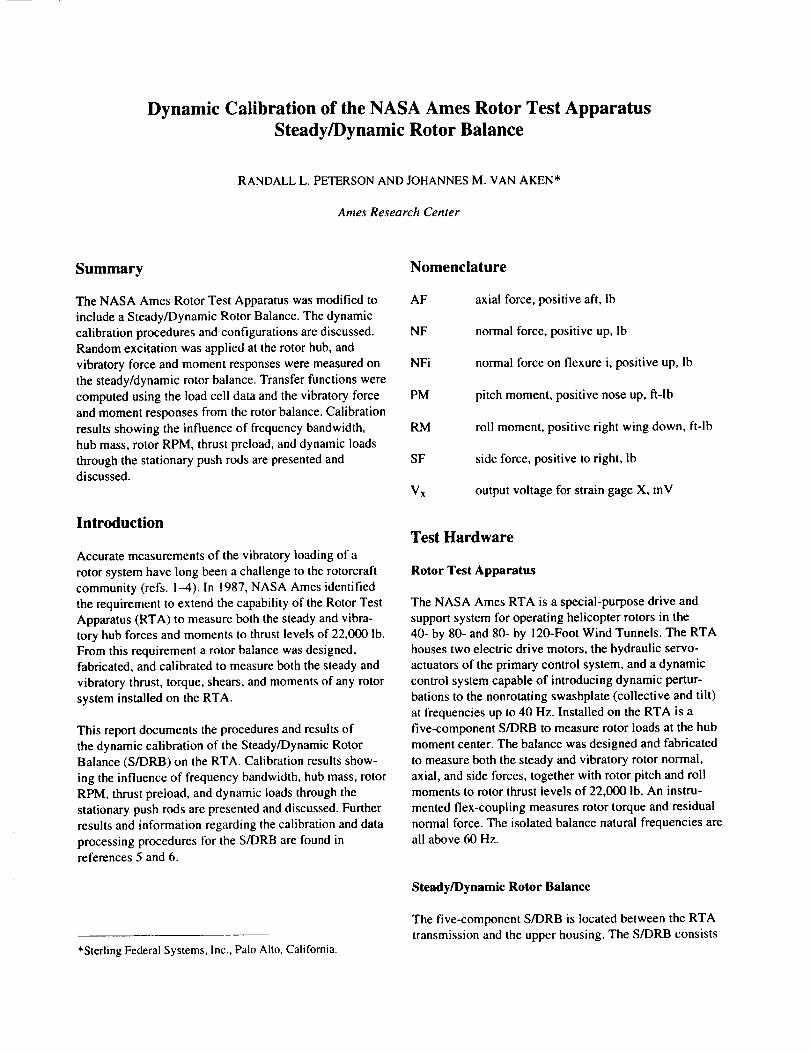
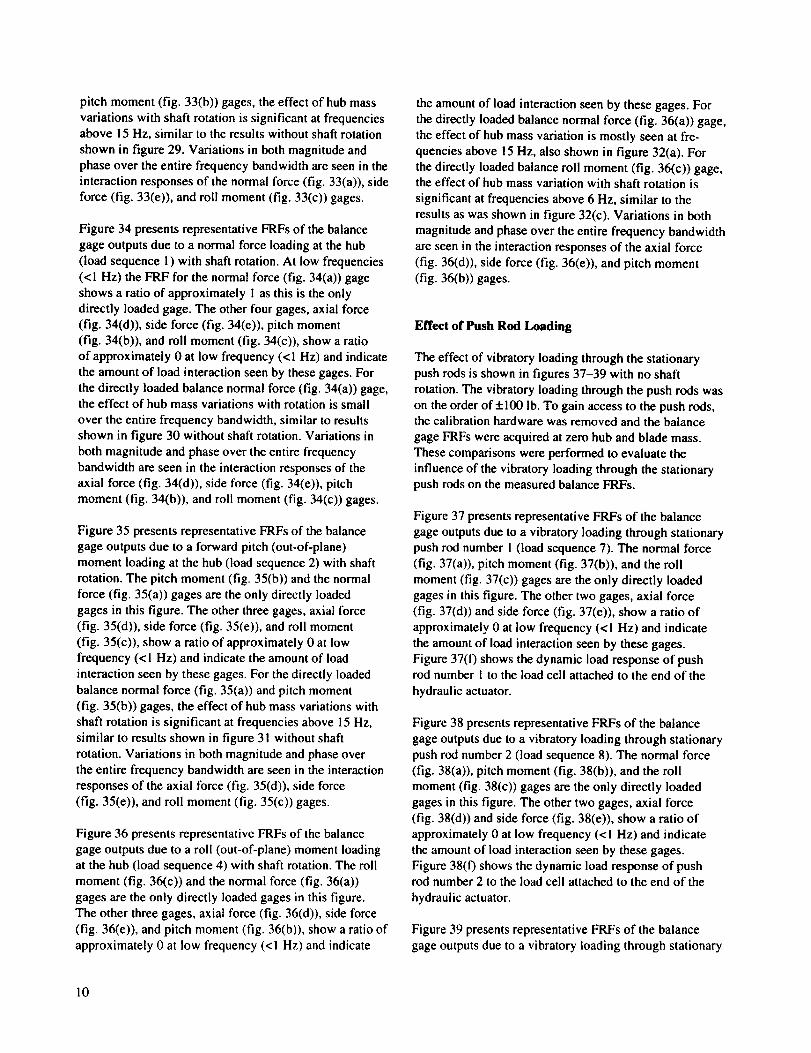
Figure 16 presents representative FRFs of the balance
gage outputs due to a roll (out-of-plane) moment loading
at the hub (load sequence 4). At low frequencies (<1 Hz)
the FRFs for the roll moment (fig. 16(c)) and the normal
force (fig. 16(a)) gages show a ratio of approximately I asthese are the only directly loaded gages. The other three
gages, axial force (fig. 16(d)), side force (fig. 16(e)), and
pitch moment (fig. 16(b)), show a ratio of approximately
0 at low frequency (<1 Hz) and indicate the amount of
load interaction seen by these gages. Again, the differ-
ences in the balance gage FRFs due to roll moment
loading between the 0--32 Hz and 0-64 Hz bandwidths
are small and are primarily seen in the balance gageinteractions.
In-Plane Versus Out-of-Plane Loading
Figure 10(c) shows the FRF data for the roll moment gage
due to a horizontal or in-plane vibratory load at the hub,and figure 1 l(b) shows the FRF data for the pitch moment
gage due to a horizontal or in-plane vibratory load at thehub. During another portion of the calibration test, a
balance roll moment and a balance pitch moment were
also generated by an out-of-plane force: a vertical vibra-
tory load input was applied I ft to the left of the shaft
center (fig. 16(c)) and 1 ft forward of the rotor shaft in the
longitudinal plane (fig. 13(b)) of the RTA, respectively.In the first case, the balance normal force and roll
moment gages are loaded simultaneously, and in the
second case the balance normal force and pitch moment
gages are loaded simultaneously.
The pitch moment and roll moment FRF data obtained
by out-of-plane and in-plane hub force applications are
compared in figure 17. Figure 17(a) presents the compari-son of the hub pitch moment response, and figure 17(b)
presents the comparison of the hub roll moment response.In both cases, the measured pitch moment and roll
moment FRF data are the sum of the response of thePM or RM gage due to a pure moment loading and the
interaction response to a force application. Comparisons
of the two curves in figure 17 show markedly different
balance pitch and roll moment responses due to out-of-
plane versus in-plane force loading, especially forfrequencies greater than 20 Hz. The difference could be
the result of the difference in the magnitude of PM and
RM loading, being 500 ftolb due to the out-of-plane force
loading and 3,660 ft-lb due to the in-plane force loading.
A second explanation is that the RTA/balance response is
considerably different for out-of-plane versus in-planeloading.
Effect of Shaft Rotation
Figures 18-22 present comparisons of the balance gage
output FRFs under vibratory in-plane and out-of-planeloading without and with shaft rotation of 315 and
425 RPM. The calibration test configuration again repre-sents the BOI05 hub and blade mass. These comparisons
were performed to evaluate the influence of shaft rotationon the measured FRFs.
Figure 18 presents representative FRFs of the balance
gage outputs due to an axial force loading at the hub (loadsequence 5) without and with shaft rotation. The axial
force (fig. 18(d)) and the pitch moment (fig. 18(b)) gages
are the directly loaded gages in this figure. Figure 18shows that the effect of rotation is minimal at low
frequencies for the directly loaded gages (AF and PM in
this case). Differences are noted at the higher frequencies
(>30 Hz) for both the magnitude and phase data with the
425 RPM showing the greatest differences. The FRFs for
the normal force (fig. 18(a)), side force (fig. 18(e)), and
roll moment (fig. 18(c)) interactions show some effect of
shaft rotation on magnitude at frequencies greater than
30 Hz, but phase shifts are noticed at frequencies as low
as 12 Hz for the normal force interaction (fig. 18(a)). The
FRF data of figure 18 show a resonance at approximately
19 Hz, which is also observed in figures 10-17. Review
of the FRF data plots shows that rotation influences the
magnitude of this resonance for all balance gages.
Figure 19 presents representative FRFs of the balance
gage outputs due to a normal force loading at the hub(load sequence I) without and with shaft rotation. The
normal force (fig. 19(a)) gage is the only directly loadedgage in this figure. Figure 19 shows that the effect of
rotation is minimal at low frequencies for the directly
loaded gage (NF in this case). Again, differences are

notedatthehigherfrequencies(>!9Hz)forboththemagnitudeandphasedatawiththe425RPMshowingthegreatestdifference.TheFRFsfortheaxialforce(fig.19(d)),sideforce(fig.19(e)),pitchmoment(fig.19(b)),androllmoment(fig.19(c))interactionsshowsmalleffectsonmagnitudeandphaseduetoshaftrotationoverthewholefrequencyrange(0---64Hz).
Figure20presentsrepresentativeFRFsofthebalancegageoutputsduetoaforwardpitch(out-of-plane)momentloadingatthehub(loadsequence2)withoutandwithshaftrotation.Thepitchmoment(fig.20(b))andthenormalforce(fig.20(a))gagesaretheonlydirectlyloadedgagesin thisfigure.Figure20showsthattheeffectofrotationisminimalatlowfrequenciesforthedirectlyloadedgages(PMandNFinthiscase).Again,differencesarenotedatthehigherfrequencies(>19Hz)forboththemagnitudeandphasedata.Exceptforsomeisolatedfrequenciesinthe5-8Hzrange(duetorotationalunbalance),theFRFsfortheaxialforce(fig.20(d)),sideforce(fig.20(e)),androllmoment(fig.20(c))interactionsshowsmalleffectsonmagnitudeandphaseduetoshaftrotationoverthewholefrequencyrange(0-64Hz).
Figure21presentsrepresentativeFRFsofthebalancegageoutputsduetoanaftpitch(out-of-plane)momentloadingatthehub(loadsequence3)withoutandwithshaftrotation.Thepitchmoment(fig.21(b))andthenormalforce(fig.21(a))gagesaretheonlydirectlyloadedgagesin thisfigure.Figure21showsthattheeffectofrotationisminimalatlowfrequenciesforthedirectlyloadedgages(PMandNFinthiscase).Again,differencesarenotedatthehigherfrequencies(>19Hz)forboththemagnitudeandphasedata.Exceptforsomeisolatedfrequenciesinthe5-8Hzrange,theFRFfortheaxialforce(fig.21(d))interactionshowssmalleffectsonmagnitudeandphaseduetoshaftrotationoverthewholefrequencyrange(0--64Hz).Theinteractionsonsideforce(fig.21(e))androllmoment(fig.21(c))forbothmagni-tudeandphasevaryoverthewholefrequencyrange(0--64Hz)duetoshaftrotation.Comparisonoffigures20and21showsthattheaftpitchmomentloadingwithshaftrotationhasamuchgreatereffectontheinteractionscomparedwiththeforwardpitchmomentloading.
Figure22presentsrepresentativeFRFsofthebalancegageoutputsduetoaroll(out-of-plane)momentloadingatthehub(loadsequence4)withoutandwithshaftrotation.Therollmoment(fig.22(c))andthenormalforce(fig.22(a))gagesaretheonlydirectlyloadedgagesinthisfigure.Figure22showsthattheeffectofrotationisminimalatlowfrequenciesforthedirectlyloadedgages(RMandNFinthiscase).Again,differencesarenotedatthehigherfrequencies(>19Hz)forboththemagnitude
andphasedata.Theinteractionsonaxialforce(fig.22(d)),sideforce(fig.22(e)),andpitchmoment(fig.22(b))forbothmagnitudeandphasevaryoverthewholefrequencyrange(0--64Hz)duetoshaftrotation.
Effect of Thrust Preload without and with Shaft
Rotation
The effect of rotor thrust preload is shown in figures 23
and 24 with no shaft rotation and in figure 25 with a shaft
rotation of 315 RPM. The thrust preload was 4,000 Ib
(thrust up, --18% full range). The calibration test mass
represents the BO105 rotor system (hub and blade mass).These comparisons were performed to evaluate the
influence of rotor thrust preload without and with shaftrotation on the measured FRFs.
Figure 23 presents representative FRFs of the balance
gage outputs due to a side force loading at the hub (load
sequence 6) without and with a thrust preload of 4,000 lb.At low frequencies (<1 Hz) the FRFs for the side force
(fig. 23(e)) and the roll moment (fig. 23(c)) gages show a
ratio of approximately I as these are the directly loaded
gages. The other three gages, normal force (fig. 23(a)),
axial force (fig. 23(d)), and pitch moment (fig. 23(b)),
show a ratio of approximately 0 at low frequency (<! Hz)and indicate the amount of load interaction seen by
these gages. For the directly loaded balance side force
(fig. 23(e)) and roll moment (fig. 23(c)) gages, theeffect of thrust load is primarily seen at frequencies above
30 Hz; however, there is also splitting of modes occurring
at approximately 16 Hz for both gages. This split may bea result of the boundary conditions and load path created
by the thrust preioad. Variations in both magnitude andphase over the entire frequency bandwidth are seen in the
interaction responses of the normal force (fig. 23(a)),
axial force (fig. 23(d)), and pitch moment (fig. 23(b))
gages.
Figure 24 presents representative FRFs of the balance
gage outputs due to an axial force loading at the hub (load
sequence 5) without and with a thrust preload of 4,000 lb.At low frequencies (<1 Hz) the FRFs for the axial force
(fig. 24(d)) and the pitch moment (fig. 24(b)) gages show
a ratio of approximately I as these are the directly loaded
gages. The other three gages, normal force (fig. 24(a)),
side force (fig. 24(e)), and roll moment (fig. 24(c)), showa ratio of approximately 0 at low frequency (<1 Hz) and
indicate the amount of load interaction seen by these
gages. For the directly loaded balance axial force
(fig. 24(d)) and pitch moment (fig. 24(b)) gages, theeffect of thrust load is primarily seen at frequencies above
30 Hz. Variations in both magnitude and phase over the

entirefrequencybandwidthareseenintheinteractionresponsesofthenormalforce(fig.24(a)),sideforce(fig.24(e)),androllmoment(fig.24(c))gages.
Figure25presentsrepresentativeFRFsofthebalancegageoutputsduetoanaxialforceloadingatthehub(loadsequence5)withoutandwithshaftrotation(315RPM)andathrustpreloadof4,000lb.At lowfrequencies(<1Hz)theFRFsfortheaxialforce(fig.25(d))andthepitchmoment(fig.25(b))gagesshowaratioofapproxi-mately1asthesearethedirectlyloadedgages.Theotherthreegages,normalforce(fig.25(a)),sideforce(fig.25(e)),androllmoment(fig.25(c)),showaratioofapproximately0atlowfrequency(<! Hz)andindicatetheamountofloadinteractionseenbythesegages.Forthedirectlyloadedbalanceaxialforce(fig.25(d))andpitchmoment(fig.25(b))gages,theeffectof thrustloadisprimarilyseenatfrequenciesabove30Hz.Variationsinbothmagnitudeandphaseovertheentirefrequencybandwidthareseenintheinteractionresponsesofthenormalforce(fig.25(a)),sideforce(fig.25(e)),androllmoment(fig.25(c))gages.
Comparisonsoffigures24and25indicatethatthethrustpreloadhasagreatereffectonthemagnitudeoftheresonanceat19Hzwhentheshaftisrotatingthanwhennotrotating.
Effect of Thrust Inclination
The effect of rotor thrust preload inclined at both 0 and
! 5 deg is shown in figure 26. The thrust preload was
2,000 Ib (thrust up, ---9% full range). Thrust inclination
was accomplished by applying the thrust preload in the
forward longitudinal direction over the nose of the RTA,
resulting in a combined static loading on the balance. The
calibration test mass represents the SBMR rotor system
(hub and blade mass). These comparisons were performedto evaluate the influence of rotor thrust inclination on themeasured FRFs.
Figure 26 presents representative FRFs of the balance
gage outputs due to an axial force loading at the hub (load
sequence 5) with a thrust preload of 2,000 Ib at thrust
inclinations of 0 and 15 deg. At low frequencies (<1 Hz)
the FRF for the axial force (fig. 26(d)) and the pitch
moment (fig. 26(b)) gages show a ratio of approximatelyI as these are the directly loaded gages. The other three
gages, normal force (fig. 26(a)), side force (fig. 26(e)),
and roll moment (fig. 26(c)), show a ratio of approxi-
mately 0 at low frequency (<1 Hz) and indicate the
amount of load interaction seen by these gages. For the
directly loaded balance axial force (fig. 26(d)) and pitch
moment (fig. 26(b)) gages, the effect of thrust preloadinclination is primarily seen at frequencies above 15 Hz.
Small variations in both magnitude and phase over the
entire frequency bandwidth are seen in the interaction
responses of the side force (fig. 26(e)) and roll moment
(fig. 26(c)) gages. Thrust inclination has a fairly large
effect on the normal force (fig. 26(a)) interaction at
frequencies below 5 Hz and small variations at higherfrequencies. Thrust inclination also has the effect of
shifting the resonance at 19 Hz to a slightly higherfrequency (figs. 26(b) and 26(d)).
Combined Effect of Thrust and Shaft Rotation
The effect of rotor thrust variations with shaft rotation
(3 i 5 RPM) is shown in figure 27. The thrust preload was
varied from 2,000 to 4,000 lb (thrust up, 9-18% full
range). The calibration test mass represents the SBMR
rotor system (hub and blade mass). These comparisonswere performed to evaluate the influence of rotor thrustvariations with shaft rotation on the measured FRFs.
Figure 27 presents representative FRFs of the balance
gage outputs due to an axial force loading at the hub
(load sequence 5) with a thrust preload variation from2,000 to 4,000 Ib and a shaft rotation of 315 RPM. At
low frequencies (<1 Hz) the FRFs for the axial force
(fig. 27(d)) and the pitch moment (fig. 27(b)) gages show
a ratio of approximately 1 as these are the directly loaded
gages. The other three gages, normal force (fig. 27(a)),
side force (fig. 27(e)), and roll moment (fig. 27(c)), showa ratio of approximately 0 at low frequency (<1 Hz) and
indicate the amount of load interaction seen by these
gages. Small variations in both magnitude and phase
over the entire frequency bandwidth are seen in both the
directly loaded balance axial force (fig. 27(d)) and pitch
moment (fig. 27(b)) gages, as well as in the interaction
responses of the normal force (fig. 27(a)), side force
(fig. 27(e)), and roll moment (fig. 27(c)) gages.
Comparison of figures 24, 25, and 27 shows that thechange in hub mass from the BOI05 to the SBMR rotor
configuration shifted the resonance frequency at 19 Hz
(figs. 24 and 25) to 17 Hz (fig. 27). Figure 27 shows little
variation in the magnitude of the resonance with a changein thrust preload.
Effect of Hub Mass without and with Shaft Rotation
The effect of hub mass on the balance frequency responseis shown in figures 28-32 with no shaft rotation and in
figures 33-36 with a shaft rotation of 315 RPM. The

calibrationtestmasses(hubandblade)ofboththeBO105andtheSBMRarerepresented.Thesecomparisonswereperformedtoevaluatetheinfluenceofhubmassvaria-tionswithoutandwithshaftrotationonthemeasuredFRFs.
Figure28presentsrepresentativeFRFsofthebalancegageoutputsduetoasideforceloadingatthehub(loadsequence6)withoutshaftrotation.At lowfrequencies(<1Hz)theFRFsforthesideforce(fig.28(e))andtherollmoment(fig.28(c))gagesshowaratioofapproxi-matelyI asthesearethedirectlyloadedgages.Theotherthreegages,normalforce(fig.28(a)),axialforce(fig.28(d)),andpitchmoment(fig.28(b)),showaratioofapproximately0atlowfrequency(<1Hz)andindicatetheamountofloadinteractionseenbythesegages.Forthedirectlyloadedbalancesideforce(fig.28(e))androllmoment(fig.28(c))gages,theeffectofhubmassvaria-tionsissignificantatfrequenciesabove10Hz.Variationsinbothmagnitudeandphaseovertheentirefrequencybandwidthareseenin theinteractionresponsesofthenormalforce(fig.28(a)),axialforce(fig.28(d)),andpitchmoment(fig.28(b))gages.
Figure 29 presents representative FRFs of the balance
gage outputs due to an axial force loading at the hub (load
sequence 5) without shaft rotation. At low frequencies
(<1 Hz) the FRFs for the axial force (fig. 29(d)) and the
pitch moment (fig. 29(b)) gages show a ratio of approxi-
mately 1 as these are the directly loaded gages. The
other three gages, normal force (fig. 29(a)), side force
(fig. 29(e)), and roll moment (fig. 29(c)), show a ratio of
approximately 0 at low frequency (<1 Hz) and indicate
the amount of load interaction seen by these gages. Forthe directly loaded balance axial force (fig. 29(d)) and
pitch moment (fig. 29(b)) gages, the effect of hub mass
variations is significant at frequencies above 15 Hz.
Variations in both magnitude and phase over the entire
frequency bandwidth are seen in the interaction responses
of the normal force (fig. 29(a)), side force (fig. 29(e)), and
roll moment (fig. 29(c)) gages.
Figure 30 presents representative FRFs of the balance
gage outputs due to a normal force loading at the hub(load sequence !) without shaft rotation. At low fre-
quencies (<i Hz) the FRF for the normal force (fig. 30(a))
gage shows a ratio of approximately I as this is the only
directly loaded gage. The other four gages, axial force
(fig. 30(d)), side force (fig. 30(e)), pitch moment
(fig. 30(b)), and roll moment (fig. 30(c)), show a ratio of
approximately 0 at low frequency (<1 Hz) and indicate
the amount of load interaction seen by these gages. For
the directly loaded balance normal force (fig. 30(a)) gage,the effect of hub mass variations is small over the entire
frequency bandwidth. Variations in both magnitude and
phase over the entire frequency bandwidth are seen in the
interaction responses of the axial force (fig. 30(d)), side
force (fig. 30(e)), pitch moment (fig. 30(b)), and rollmoment (fig. 30(c)) gages.
Figure 31 presents representative FRFs of the balance
gage outputs due to a forward pitch (out-of-plane)
moment loading at the hub (load sequence 2) withoutshaft rotation. The pitch moment (fig. 31(b)) and the
normal force (fig. 31(a)) gages are the only directly
loaded gages in this figure. The other three gages, axial
force (fig. 31(d)), side force (fig. 31(e)), and roll moment
(fig. 31 (c)), show a ratio of approximately 0 at low
frequency (<1 Hz) and indicate the amount of load
interaction seen by these gages. For the directly loaded
balance normal force (fig. 3 l(a)) and pitch moment(fig. 31 (b)) gages, the effect of hub mass variations is
significant at frequencies above 15 Hz. Variations in both
magnitude and phase over the entire frequency bandwidth
are seen in the interaction responses of the axial force
(fig. 31(d)), side force (fig. 31(e)), and roll moment
(fig. 31 (c)) gages.
Figure 32 presents representative FRFs of the balance
gage outputs due to a roll (out-of-plane) moment loading
at the hub (load sequence 4) without shaft rotation. The
roll moment (fig. 32(c)) and the normal force (fig. 32(a))
gages are the only directly loaded gages in this figure.
The other three gages, axial force (fig. 32(d)), side force
(fig. 32(e)), and pitch moment (fig. 32(b)), show a ratio of
approximately 0 at low frequency (<1 Hz)and indicate
the amount of load interaction seen by these gages. For
the directly loaded balance normal force (fig. 32(a))
gage, the effect of hub mass variation is mostly seen atfrequencies above 15 Hz. For the directly loaded balance
roll moment (fig. 32(c)) gage, the effect of hub mass
variation is significant at frequencies above 6 Hz.
Variations in both magnitude and phase over the entire
frequency bandwidth are seen in the interaction responses
of the axial force (fig. 32(d)), side force (fig. 32(e)), and
pitch moment (fig. 32(b)) gages.
Figure 33 presents representative FRFs of the balance
gage outputs due to an axial force loading at the hub(load sequence 5) with shaft rotation. At low frequencies
(<1 Hz) the FRFs for the axial force (fig. 33(d)) and the
pitch moment (fig. 33(b)) gages show a ratio of approxi-
mately ! as these are the directly loaded gages. The
other three gages, normal force (fig. 33(a)), side force
(fig. 33(e)), and roll moment (fig. 33(c)), show a ratio of
approximately 0 at low frequency (< 1 Hz) and indicate
the amount of load interaction seen by these gages. For
the directly loaded balance axial force (fig. 33(d)) and
9
pitchmoment(fig.33(b))gages,theeffectof hubmassvariationswithshaftrotationissignificantatfrequenciesabove15Hz,similartotheresultswithoutshaftrotationshowninfigure29.Variationsinbothmagnitudeandphaseovertheentirefrequencybandwidthareseenintheinteractionresponsesofthenormalforce(fig.33(a)),sideforce(fig.33(e)),androllmoment(fig.33(c))gages.
Figure34presents representative FRFs of the balance
gage outputs due to a normal force loading at the hub
(load sequence 1) with shaft rotation. At low frequencies
(<1 Hz) the FRF for the normal force (fig. 34(a)) gage
shows a ratio of approximately I as this is the only
directly loaded gage. The other four gages, axial force
(fig. 34(d)), side force (fig. 34(e)), pitch moment
(fig. 34(b)), and roll moment (fig. 34(c)), show a ratio
of approximately 0 at low frequency (<1 Hz) and indicate
the amount of load interaction seen by these gages. For
the directly loaded balance normal force (fig. 34(a)) gage,the effect of hub mass variations with rotation is small
over the entire frequency bandwidth, similar to results
shown in figure 30 without shaft rotation. Variations in
both magnitude and phase over the entire frequency
bandwidth are seen in the interaction responses of the
axial force (fig. 34(d)), side force (fig. 34(e)), pitch
moment (fig. 34(b)), and roll moment (fig. 34(c)) gages.
Figure 35 presents representative FRFs of the balance
gage outputs due to a forward pitch (out-of-plane)
moment loading at the hub (load sequence 2) with shaft
rotation. The pitch moment (fig. 35(b)) and the normal
force (fig. 35(a)) gages are the only directly loaded
gages in this figure. The other three gages, axial force
(fig. 35(d)), side force (fig. 35(e)), and roll moment
(fig. 35(c)), show a ratio of approximately 0 at lowfrequency (<1 Hz) and indicate the amount of load
interaction seen by these gages. For the directly loaded
balance normal force (fig. 35(a)) and pitch moment
(fig. 35(b)) gages, the effect of hub mass variations with
shaft rotation is significant at frequencies above 15 Hz,similar to results shown in figure 31 without shaft
rotation. Variations in both magnitude and phase over
the entire frequency bandwidth are seen in the interaction
responses of the axial force (fig. 35(d)), side force
(fig. 35(e)), and roll moment (fig. 35(c)) gages.
Figure 36 presents representative FRFs of the balance
gage outputs due to a roll (out-of-plane) moment loadingat the hub (load sequence 4) with shaft rotation. The roll
moment (fig. 36(c)) and the normal force (fig. 36(a))
gages are the only directly loaded gages in this figure.
The other three gages, axial force (fig. 36(d)), side force
(fig. 36(e)), and pitch moment (fig. 36(b)), show a ratio of
approximately 0 at low frequency (<1 Hz) and indicate
the amount of load interaction seen by these gages. For
the directly loaded balance normal force (fig. 36(a)) gage,the effect of hub mass variation is mostly seen at fre-
quencies above 15 Hz, also shown in figure 32(a). For
the directly loaded balance roll moment (fig. 36(c)) gage,the effect of hub mass variation with shaft rotation is
significant at frequencies above 6 Hz, similar to the
results as was shown in figure 32(c). Variations in both
magnitude and phase over the entire frequency bandwidthare seen in the interaction responses of the axial force
(fig. 36(d)), side force (fig. 36(e)), and pitch moment(fig. 36(b)) gages.
Effect of Push Rod Loading
The effect of vibratory loading through the stationary
push rods is shown in figures 37-39 with no shaft
rotation. The vibratory loading through the push rods was
on the order of+100 lb. To gain access to the push rods,the calibration hardware was removed and the balance
gage FRFs were acquired at zero hub and blade mass.
These comparisons were performed to evaluate the
influence of the vibratory loading through the stationarypush rods on the measured balance FRFs.
Figure 37 presents representative FRFs of the balance
gage outputs due to a vibratory loading through stationary
push rod number I (load sequence 7). The normal force
(fig. 37(a)), pitch moment (fig. 37(b)), and the roll
moment (fig. 37(c)) gages are the only directly loaded
gages in this figure. The other two gages, axial force
(fig. 37(d)) and side force (fig. 37(e)), show a ratio of
approximately 0 at low frequency (<1 Hz) and indicate
the amount of load interaction seen by these gages.
Figure 37(f) shows the dynamic load response of pushrod number 1 to the load cell attached to the end of the
hydraulic actuator.
Figure 38 presents representative FRFs of the balance
gage outputs due to a vibratory loading through stationarypush rod number 2 (load sequence 8). The normal force
(fig. 38(a)), pitch moment (fig. 38(b)), and the roll
moment (fig. 38(c)) gages are the only directly loaded
gages in this figure. The other two gages, axial force
(fig. 38(d)) and side force (fig. 38(e)), show a ratio of
approximately 0 at low frequency (<1 Hz) and indicate
the amount of load interaction seen by these gages.
Figure 38(t") shows the dynamic load response of pushrod number 2 to the load cell attached to the end of the
hydraulic actuator.
Figure 39 presents representative FRFs of the balance
gage outputs due to a vibratory loading through stationary
10

pushrodnumber3(loadsequence9).Thenormalforce(fig.39(a)),pitchmoment(fig.39(b)),andtherollmoment(fig.39(c))gagesaretheonlydirectlyloadedgagesinthisfigure.Theothertwogages,axialforce(fig.39(d))andsideforce(fig.39(e)),showaratioofapproximately0atlowfrequency(<1Hz)andindicatetheamountofloadinteractionseenbythesegages.Figure39(f)showsthedynamicloadresponseofpushrodnumber3totheloadcellattachedtotheendofthehydraulicactuator.
Differencesin thedynamicresponseshowninthephaseplotsof figure37(f)(phasevariationwithfrequency)andfigure38(f)(phaseoscillationwithfrequency)relativetofigure39(f)arecausedbyfeedbackthroughthecontrolvalvesofboththecalibrationactuatorandtheprimarycontrolactuatorpushrodsontheRTA.Difficultyinintroducingvibratoryloadingatthehigherfrequencieswasnotedduringthecalibration.Timeconstraintsinthewindtunnelscheduleprecludedasatisfactorysolutiontothisproblem.Theinfluenceofthesephenomenaonthebalancemeasurementsisnotfullyknownandshouldbefurtherinvestigated.
TheFRFspresentedinfigures37-39showthatsignifi-cantchangesin thedynamicresponseofthebalanceexistovertheentirefrequencybandwidthof0-64Hz.ThesechangesinthedynamicresponsearecausedbybalanceinteractionsandthedynamicstructuralcharacteristicsofboththewindtunnelsupportsystemandtheRTA.Thebalancegageresponseduetothedynamicloadingthroughthestationarypushrodsissignificant,indicatingthenecessityofmakingdynamiccorrectionstothedynamichubloadsbasedonloadingthroughtheRTAcontrolsystem.A descriptionoftheproceduresusedtoaccountfordynamicloadingthroughthestationarypushrodsispresentedinreference6.
Concluding Remarks
Calibration results showing the influence of frequencybandwidth, hub mass, rotor RPM, thrust preload, and
dynamic loads through the stationary push rods were
discussed and presented in figures 10-39. The FRFs
shown identify the significant changes in the dynamic
response of the balance from 0 to 64 Hz. Since thebalance flexure design places the isolated balance natural
frequencies above 60 Hz, the changes in the dynamicbalance response shown are attributed to the dynamicstructural characteristics of both the wind tunnel support
system and the RTA. Some of the findings from this
dynamic calibration effort are identified below.
The influence of reduced frequency bandwidth (from
0-64 Hz to 0-32 Hz) in the data acquisition process
showed no significant changes in the FRFs with increased
frequency resolution in either the directly loaded balance
gages or the interactions.
Out-of-plane versus in-plane force loading resulted in
markedly different balance pitch and roll moment
responses, which may be the result of the difference in the
magnitude of PM and RM loading applied in each case,or that the RTA/balance response is considerably
different for out-of-plane versus in-plane loading.
The effects of shaft rotation are mostly seen in the higher
frequency range (above 20-30 Hz) and manifest them-selves most clearly as a phase shift for both the directly
loaded balance gages and the interactions.
The effect of thrust preload without and with shaft
rotation primarily influenced the directly loaded gagesabove 30 Hz and the interactions over the entire fre-
quency bandwidth (0--64 Hz) in both magnitude and
phase.
The effect of thrust preload inclination primarily
influenced the measured magnitudes of the directly
loaded gages above 15 Hz with small variations in both
magnitude and phase for the interactions over the entire
frequency bandwidth (0--64 Hz).
The influence of thrust preload variations from 2,000 to
4,000 Ib (thrust up, 9-18% full range) with shaft rotationshowed small variations in both magnitude and phase
over the entire frequency bandwidth (0-64 Hz) for both
the directly loaded and interaction balance gages.
The effects of hub mass on the measured FRFs with or
without shaft rotation were significant in both magnitude
and phase for frequencies above 10 Hz for either the
directly loaded balance gages or the interactions.
The FRFs for the stationary push rods showed that
significant changes in the dynamic response of thebalance exist over the entire frequency bandwidth of
0-64 Hz and that the balance gage response due to the
dynamic loading through the stationary push rods is
significant. These results clearly indicate that correctionsto the dynamic hub loads are necessary for oscillatory
loading through the RTA control system.
In summary, hub mass variations had the greatest effect
on the directly and indirectly loaded balance gages. Shaft"
rotation had a greater influence on the balance responsemeasurements than the limited thrust preloading that was
11

applied. Inclination of the thrust preload had a greaterinfluence on the measured balance FRFs than a thrust
preloading with no inclination.
developed. Improved procedures for the application ofvibratory loading through the stationary push rods shouldbe determined.
Recommendations for Future Work
Future dynamic calibration tests should acquire acceler-ometer data at the hub in both on-axis and off-axis load
directions to aid in determining the hub displacements
and the effects of inertial loading on the balance response.
The ability to apply off-axis dynamic calibration loading
should be investigated to evaluate the accuracy of the
on-axis response measurements and the influence of the
interactions. The ability to apply multiple dynamic
calibration Ioadings simultaneously should also beconsidered.
The ability to apply greater out-of-plane pitch and roll
moment loading should be developed and investigated.
Future calibration efforts should include both in-planeand out-of-plane loading sequences from the forward and
aft directions, as well as from the left and right sides to
further understand the asymmetric response noted in the
hub pitch moment response.
Dynamic calibration testing of the RTA tunnel
installation at various angles of attack should be per-
formed to investigate the effect of model angle of attack
on the balance dynamic response (FRFs). These data canbe used to determine whether accurate balance load
predictions can be obtained by using a dynamic calibra-
tion matrix obtained from the interpolation over model
angle of attack of the dynamic calibration matrices, which
are determined at only a few model angles of attack.
The accuracy of the balance load predictions was
evaluated against the expected loading from an imbal-
anced hub test in reference 5. This provided only l/rev
balance loading up to 7 Hz. The effects of shaft rotation
and especially hub mass on the balance FRFs are most
noticeable at frequencies above 15 Hz. An ability to
introduce vibratory loading at higher frequencies should
be developed to properly evaluate and quantify the
balance accuracy at higher frequencies. Such loading
should include in-plane and out-of-plane forces and hubmoments.
The capability to properly evaluate the accuracy of
dynamic corrections to the measured balance forces and
moments as a result of vibratory loading through the
stationary push rods (control system) should be
References
1. Lehmann, G.; and Fu, K.-H.: Theoretical and
Experimental Investigations on a Six-
Component Rotor Balance. Eleventh European
Rotorcraft Forum, The City University, London,
ECIV OHB, England, Sept. 1983.
, Gabel, R.; Sheffler, M.; Tarzanin, F.; and Hodder, D.:
Wind Tunnel Modeling of Vibratory Loads.
38th Annual Forum of the American Helicopter
Society, Anaheim, Calif, May 1982.
. Young, D.; and Tarzanin, F.: Structural Optimizationand Mach Scale Test Validation of a Low Vibra-
tion Rotor. 47th Annual Forum of the American
Helicopter Society, Phoenix, Ariz., May i991.
. Staley, J. A.; Matthew, M. B.; and Tarzanin, F.:
Wind Tunnel Modeling of High Order RotorVibration. 49th Annual Forum of the American
Helicopter Society, St. Louis, Mo., May 1993.
, vanAken, J. M.; Peterson, R. L.; and Freedman,C. J.: Calibration Results of the NASA Ames
Rotor Test Apparatus Steady/Dynamic Rotor
Balance. American Helicopter Society
Aeromechanics Specialists Conference,San Francisco, Calif., Jan. 1994.
. Wang, J. M.; and van Aken, J. M.: Correlation of
Vibratory Hub Loads for a Sikorsky Full-Scale
Bearingless Main Rotor. 50th Annual Forum of
the American Helicopter Society, Washington,
D.C., May 1994.
7. Norman, T. R.; Cooper, C. R.; Fredrickson, C. A.;and Herter, J. R.: Full-Scale Wind Tunnel
Evaluation of the Sikorsky Five-Bladed Bear-
ingless Main Rotor. 49th Annual Forum of the
American Helicopter Society, St. Louis, Mo.,
May 1993.
. Peterson, R. L.; Maier, T.; Langer, H. J.; and
Tr_inapp, N.: Correlation of Wind Tunnel and
Flight Test Results of a Full-Scale Hingeless
Rotor. American Helicopter Society
Aeromechanics Specialists Conference,San Francisco, Calif., Jan. 1994.
12

Table1.Identificationofthedirectlyloadedbalancegagesforthevariousdynamiccalibrationtestloadsequences
NF PM RM AF SF
lb ft-lb ft-lb lb lb
Sequence I - Vertical loading at the rotor shaft center a 600
Sequence 2 - Vertical loading at 1 ft forward of the rotor shaft 500 500center a
Sequence 3 - Vertical loading at 1 ft aft of the rotor shaft center 500 500
Sequence 4 - Vertical loading at 1 ft to the left of the rotor shaft 500 500center a
Sequence 5 - Horizontal loading in longitudinal direction a 3,660
Sequence 6 - Horizontal loading in lateral direction a 3,660
Sequence 7 - Push rod number I b 100 34 60
Sequence 8 - Push rod number 2 b 100 34 60
Sequence 9 - Push rod number 3b 100 60 34
600
600
aUsed to determine dynamic calibration matrix for the rotor balance through primary load path.
bUsed to determine dynamic calibration matrix for the rotor balance through secondary (redundant) load
path.
13

Table2.LoadingenvelopefortheBOI05andSBMRdynamiccalibrationtests
(a) BOI05 data set
RPM 0 315 425 0 - - - 315
Thrust (Ib) 0 0 0 4000 - - - 4000
Thrust Inclination (deg) 0 0 0 0 - - - 0
Vertical loading at the rotor shaft center X X X
Vertical loading at 1 ft forward of the X X X
rotor shaft center (longitudinal plane)
Vertical loading at 1 ft aft of the rotor X X X
shaft center (longitudinal plane)
Vertical loading at 1 ft to the left of the X X X
rotor shaft center (lateral plane)
Horizontal loading in longitudinal X X Xdirection
Horizontal loading in lateral direction X
Stationary push rod (1-3) loading in Xvertical direction
X X
X
(b) SBMR data set
RPM 0 315 - 0 0 315 315 315
Thrust (Ib) 0 0 - 2000 2000 2000 3000 4000
Thrust Inclination (deg) 0 0 - 0 15 0 0 0
Vertical loading at the rotor shaft center X X
Vertical loading at ! ft forward of the X X
rotor shaft center (longitudinal plane)
Vertical loading at 1 ft to the left of the X X
rotor shaft center (lateral plane)
Horizontal loading in longitudinal X Xdirection
Horizontal loading in lateral direction X
X X X X X
X X
14

Windf 4
32-indiameter
Flexure 2
diameter
3
Figure 1. Schematic of top view of the Steady�Dynamic Rotor Balance with flexure identification.
Figure 2. Steady�Dynamic Rotor Balance.
15

Rotating Push Rod Main Rotor Shaft
Swashplate
Stationary Push Rod
Path 2
Walking Beam
PrimaryActuator
Push Rod
O
//
Steady/Dynamic /Rotor Balance
! i \
Figure 3. Schematic of the redundant Ioad path system on the RTA.
16

Figure 4. Longitudinal test setup for the installed, dynamic balance calibration in the 40- by 80-Foot Wind Tunnel.
]7

Figure 5. Lateral test setup for the installed, dynamic balance calibration in the 40- by 80-Foot Wind Tunnel.
]8

Figure 6. Vertical moment calibration test setup.
Figure 7, In-plane load calibration test setup.
19

Suspended fromOverhead Crane
Reaction Mass_
Actuatorand Loadcell/ I_ Rotor Hub and ShaftAdapter Interface
Transmiss__ I I I I _
Turmel Floor _--"I 8"W_tnd_ bySe0"F_
_ ____Figure 8. Schematic of side view of RTA vertical calibration configuration in the 40- by 80-Foot Wind Tunnel.
20

Wind
Reaction Mass _
Longitudinal Shake
Direction
Rotor Hub and
Shaft AdapterInterface
RTA Fuselage Outline
40- by 80-Foot WindTunnel Turntable
Figure 9(a). Schematic of top view of RTA longitudinal calibration configuration in the 40- by 80-Foot Wind Tunnel
Lateral Shake
Direction
Wind
l
Rotor Hub and
Shaft AdapterInterface
Fuselage Outline
40- by 80-Foot WindTunnel Turntable
Figure 9(b). Schematic of top view of RTA lateral calibration configuration in the 40- by 80-Foot Wind Tunnel.
21

-- 0-32 Hz
......... 0-64 Hz
O
t-,
180
90
0
-90
-180
lO2
101
100
.-2 lO-te.,(;to
10-2
., ,'
i0-3 _ _ , I , , , , I , , , , I .... I
0 10 20 30 40 50 60 70
Frequency, Hz
Figure lO(a). Bandwidth comparison of hub normal force balance response due to hub side force loading, simulatedB0105 hub mass.
-- 0-32 Hz
......... 0-64 Hz
18o o 90 :"
.... . ,,,.,.,,,.,,,;....!, .,:., _._, -90 ." ,:"
-180 "i,, I, ,,, I::"1 I I I [ i i i i
10o
B _
I10 -I
_ 10-2
+ilO-3e-,
_ 10-4
10-5 , , , l t , , , I , + z , I a , , J I
10 20 30 40
Frequency, Hz
,' ?.;,;', _ ':;-, • '?.,.:, :
I , , , , I .... I
50 60 70
Figure lO(b). Bandwidth comparison of hub pitch moment balance response due to hub side force loading, simulatedB0105 hub mass.
22
-- 0-32 Hz
......... 0-64 Hz
180
_Go 90
g oe.,_. -90
-180
101
10o
.-=lO
_t
10-2 ,, i,l, L, wl L,,,I*, * L l , I, L I J , , ,I K*,,]
0 10 20 30 40 50 60 70
Frequency, Hz
Figure 10(c). Bandwidth comparison of hub roll moment balance response due to hub side force loading, simulatedB0105 hub mass.
0-32 Hz
......... 0-64 Hz
180
_0,_ 90
oa. -90
-180
100
10 -1r_
,--,,I
10 -2
10-3
• e. .
: '":::. ,, , :,,. -;,",_,_: _,t '," _''_'
:.T"'c,:',,:, i!
I
0
,,,, I,,,, I,,, I I,, L, I,,,, I , , I 1 1 , , I , I
10 20 30 40 50 60 70
Frequency, Hz
Figure l O(d). Bandwidth comparison of hub axial force balance response due to hub side force loading, simulated B0105hub mass.
23

-- 0-32 Hz
......... 0-64 Hz
180
o 90
o
-90
-180
°.4
_"l" L i I J i I i I , i , l I i i z , I
101
tm 100
10-1
• ..°_
",--,. o,
• ° .,,4,
, , , , I .... I .... I , _ , , I , n _ L I , , , , I , , , , I
0 10 20 30 40 50 60 70
Frequency, Hz
Figure lO(e). Bandwidth comparfson of hub side force balance response due to hub side force loading, simulated B0105hub mass.
24

0-32 Hz
......... 0-64 Hz
180
90
oc_e-.c_ -90
-180
101
100
._ I0 -1
_ 10 -2
10-3 i L I l I, l i L l,, I i I t I _ I 1 1 t i i I l i I I 1 1 i i I I
10 20 30 40 50 60 70
Frequency, Hz
Figure 1l (a). Bandwidth comparison of hub normal force balance response due to hub axial force loading, simulated
B0105 hub mass.
-- 0-32 Hz
......... 0-64 Hz
180
o 90
oe-
-90
-180
101
10o
¢7
_ lO-1
10-2
.,°
"%,.
,,.'.,,.
"l"_ - °_..,. _,,.,'"
L z I
_,,, I , 1, i I 1, r, I, ,,, I,, 1 I I,, I , I 1 1 , , I
10 20 30 40 50 60 70
Frequency, Hz
Figure 1l (b). Bandwidth comparison of hub pitch moment balance response due to hub axial force loading, simulated
B0105 hub mass.
25

-- 0-32 Hz
......... 0-64 Hz
180
o 90
o
_. -90
-180
101
+ F100
ml_f 10 -1
10 -2
10-3
"! ":":_" .
.... : ,.,: : ::'.', .....,"....... ."
, I , , , i 'h. ''11.,'1 I , + I t i , i I
._ .. + .,.
i i | l i
0 10 20 30 40
Frequency, Hz
"'f. :...., .',.,
_:_ ,', .,'..,.-,: • .
',;,,.,t, , , I _"., , , I , , , , I
50 60 70
Figure 11(c). Bandwidth comparison of hub roll moment balance response due to hub axial force loading, simulatedB0105 hub mass.
-- 0-32 Hz
......... 0-64 Hz
180
_0o 90
o
-90
-180
102
+ I_ 101 _-
"_- 100 ..... ..
10-1 i,, , I , + I, I I,,, I,,,, I,, r , I , , j , I , , , , I
0 10 20 30 40 50 60 70
Frequency. Hz
Figure 1l (d). Bandwidth comparison of hub axial force balance response due to hub axial force loading, simulated B0105hub mass.
26

-- 0-32 Hz
......... 0-64 Hz
180
90
om -90
-180
., ,,.:: ,,,,.'" . ,-,, .... - ,..,:,,, ,,
'c,.', , I , '.-," , , I , , , , I , , , ,
101 -
I0 o
__ _ _ _,, ,'""'"'"',,..q.10_1
_ 10 -2 -
10-3 , , , ,
s, I ,
o,,,°' ",, ,_ t ,_*'.i "'I
I,,,, I,, , i I, , i, I ,,, i i, , , , I , , , , I
10 20 30 40 50 60 70
Frequency, Hz
Figure 1l (e). Bandwidth comparison of hub side force balance response due to hub axial force loading, simulated BO 105hub mass.
2?
0-32 Hz
......... 0-64 Hz
0J_
cos,.C:
90._.°.°o.-._ ........... . ..................
0
-90
-180 i i , ) ) i , , I , i i , I , i , i
101 -
r_¢;•_ 100
10-1 .... I t I I _ I L I I I I I I r I I I L I , I , , , , I .... I
10 20 30 40 50 60 70
Frequency, Hz
Figure 12(a). Bandwidth comparison of hub normal force balance response due to hub normal force loading, simulatedB0105 hub mass.
-- 0-32 Hz
......... 0-64 Hz
180
o 90"O
o,J=_, -90
-180
101
10ouJ
•_ 10-1
e-,
_ 10 -2
10-3
i ,, ,: ,::::,,: ',,
:.':: ., .: !'.,...',.!!
' ": " ii' ":"'
_ "°'1, , 'J
, ;:" .:'"'," :. ,..., -,., .'.,, ' ._ ::'". ,.,
',,' ,¢, . .j ,,-; ,,.....,.,
, ,v, ,,'
tl, III I I I I t t I I I I ; I I I a; r I I I, I, I I I r , I
10 20 30 40 50 60 70
Frequency, Hz
Figure 12(b). Bandwidth comparison of hub pitch moment balance response due to hub normal force loading, simulatedB0105 hub mass.
28

-- 0-32 Hz
......... 0-64 Hz
180
90
o¢..,,_.. -90
-180
101
100
.._ 10-1
:_ lo -2
10-3
- 'X':' ? ' '":":"""" .. ,' ', :,. .:." ',,.:. ,;,' .., ,.:
i t i I I t I I , I i i i i I i i i i r , , L I I I I i I ( I J l I I
0 10 20 30 40 50 60 70
Frequency, Hz
Figure 12(c). Bandwidth comparison of hub roll moment balance response due to hub normal force loading, simulatedB0105 hub mass.
0-32 Hz
......... 0-64 Hz
180
90
oa. -90
-i8o101
:..."4
',.'L ," ,.'" ',, ,-" ,.,'
1'I i l i t J l '] i _ I , I t'l , x I
10o
_ lO-Id
lO-2e-
_ lO-3
10-4
.... . • , ,, 4
, j , , L 1 L , t I A , I t I , i , I I , , , , I L , , I [ , , L L I
10 20 30 40 50 60 70
Frequency, Hz
Figure 12(d). Bandwidth comparison of hub axial force balance response due to hub normal force loading, simulatedB0105 hub mass.
29

0-32 Hz
......... 0-64 Hz
180
,_ 90
oe.a, -90
-180
10o
10_1
,ff
lO-2
,,, •. ,,:.', ', 'let
• :, .' . ,' :':'::' ; :,":i.:':j , _:.. %, t ', %'t
1," t h, i
I I I I I I I I I ',, I i I , "
_ ,..,, .,,::.:;... ,.,,'.:'".
J i i '!
i
10-3 I .... I I , , j I r , _ t I
0 I 0 20 30 40 50 60 70
Frequency, Hz
, , I
Figure 12(e). Bandwidth comparison of hub side force balance response due to hub normal force loading, simulatedB0105 hub mass.
30

-- 0-32 Hz
......... 0-64 Hz
180
_0o 90
oe.,_. -90
-180
101
100
e-.
I0"1 , I , I I , , * , I , f , r I , , , , I , , , , I L , t , I r , , _ I
10 20 30 40 50 60 70
Frequency, Hz
Figure 13(a). Bandwidth comparison of hub normal force balance response due to forward hub pitch moment loading,simulated B0105 hub mass•
-- 0-32 Hz
......... 0-64 Hz
180
90
g oe-_. -90
-180
102 _
• .......... ,.o..+,.,..... .....,-r",",,,"t .... I , , , , [ r t , ] I
101_a
-_ 100
e-
10 -1
10-2
• . .. +'-, .,+-,+,°'" ,,,.,+
0
f,,, I, t, , I L , ,, I J, t, I,,,, I, i , , I , , r , I
I0 20 30 40 50 60 70
Frequency, Hz
Figure 13(b). Bandwidth comparison of hub pitch moment balance response due to forward hub pitch moment loading,simulated B0105 hub mass.
31

-- 0-32 Hz
......... 0-64 Hz
180
90
g o
_ -90
-180
101 .-
100
_ lO-1
10-2 , k, i I + = , , I = , , + I I i i , I l , , ¢ I t , t , [ , , , , I
0 10 20 30 40 50 60 70
Frequency, Hz
Figure 13(c). Bandwidth comparison of hub roll moment balance response due to forward hub pitch moment loading,simulated B0105 hub mass•
-- 0-32 Hz
......... 0-64 Hz
180
90
o
m -90
-180
101
. . •,.,+_,_+-°°"'"
i , I i t I I I i , , i , I , , , i
100
•_ 10-1
¢-
_ 10 -2
10-3
10 20 30 40 50 60 70
Frequency, Hz
Figure 13(d). Bandwidth comparison of hub axial force balance response due to forward hub pitch moment loading,simulated BO 105 hub mass•
32

0-32 Hz
......... 0-64 Hz
180 _,.., . --
90
o ir "' "o. -90 ,, " "
-180 ,!:.',", I, i , i
101
10o
._ lO-1
N 10 -2
10-3
] , , * _ I I I L , I
0
.. ,' ,', .... .,
I , I L I I I , r I I I I I I I I t r I I I I J I L R t I I J I I , I
10 20 30 40 50 60 70
Frequency. Hz
Figure 13(e). Bandwidth comparison of hub side force balance response due to forward hub pitch moment loading,simulated B0105 hub mass.
33

---- 0-32 Hz......... 0-64 Hz
180
o 90
m -90
-180
101 -
•_ 100
e-
10-1
.o
,, *, J J,, _ I,,, J I _ t J i I , , , I I r i I , r i _ , , I
10 20 30 40 50 60 70
Frequency, Hz
Figure 14(a). Bandwidth comparison of hub normal force balance response due to aft hub pitch moment loading,simulated B0105 hub mass.
-- 0-32 Hz
......... 0-64 Hz
180
90
m -90
-180 I r A I I, t I I r,, j I , t , i I
102 .--
101t_,$
"¢1
_=
100
10-1
•....'","1, ,.- '"°'*""
, i, I I, , i, I J,,, I .... I, I r, I i i I I I , i , , I
10 20 30 40 50 60 70
Frequency, Hz
Figure 14(b). Bandwidth comparison of hub pitch moment balance response due to aft hub pitch moment loading,simulated B0105 hub mass.
34

-- 0-32 Hz
......... 0-64 Hz
180
_0 90
ov-_. -90
-180
101
10o
._ 10-1
.5
10 -2
10-3
,-"!i:!iiii .,":::;
",°, ,° ,i*, ,°, ,, ,,,,, ,°, ,, ,,,_', ,,,,. ,,,,,i
,,,o .. . .
0
T i i i 1K i r I L I I I I I I J r r 1 i i , I I t i t i I I I _ A I
I0 20 30 40 50 60 70
Frequency, Hz
Figure 14(c). Bandwidth comparison of hub roll moment balance response due to aft hub pitch moment loading, simulatedB0105 hub mass.
-- 0-32 Hz
......... 0-64 Hz
180
,a 90
g o_, -90
-180
101 _-
, , I
10o
10 -1
10-2
0 10 20 30 40 50 60 70
Frequency, Hz
Figure 14(d). Bandwidth comparison of hub axial force balance response due to aft hub pitch moment loading, simulatedB0105 hub mass.
35
-- 0-32 Hz......... 0-64 Hz
180
,_ 90
o
a. -90
-180
10o
10.!to+3
lO-2
10-3
,.1•,
",,
, , i i I + , , , I , , _ , I , , , , I , , L , I t , , , I .... I
10 20 30 40 50 60 70
Frequency, Hz
Figure 14(e). Bandwidth comparison of hub side force balance response due to aft hub pitch moment loading, simulatedB0105 hub mass•
36

-- Forward pitch moment loading......... Aft pitch moment loading
180
,_ 90
0r.,
m -90
-180
101
d._ 100
e-
10-1 i t i 1
0 10 20 30 40 50 60 70
Frequency, Hz
Figure 15(a). Comparison of hub normal force balance response due to forward and aft hub pitch moment loading,simulated B0105 hub mass.
-- Forward pitch moment loading
......... Aft pitch moment loading
180
,_ 90
g om -90
-180
102
'"'i :_' ...- ..+..... ..-.--+ .......... ................
p t _ i i t I i i i i [ i ! I J
___--
101
ud
•_ lO0.5
_ 10 -1
10-2 , i L i I i i i i I i i I I I L I r I I I F I I I _ L L , I , i r l I
I0 20 30 40 50 60 70
Frequency, Hz
Figure 15(b). Comparison of hub pitch moment balance response due to forward and aft hub pitch moment loading,simulated B0105 hub mass.
3?

-- 0-32 Hz
......... 0-64 Hz
180_0o 90
o
_, -90
-180
101 -
o"._ 100
10-1
• -o,,
• ° ,.'i ,_ . .. -,
0
.... I .... f , , , , I , , , , l , , , , l , , , , I , , , , I
10 20 30 40 50 60 70
Frequency, Hz
Figure 16(a). Bandwidth comparison of hub normal force balance response due to hub roll moment loading, simulatedB0105 hub mass.
-- 0-32 Hz
......... 0-64 Hz
180
o 90
ot_¢..,
m -90
-180
101
100
,3._ 10-1
¢.,
10 -2
10-3
i!!i-';-','",, I .... "_ , ,
0
i i ): I,,, = I, r,, I, i,, I l,,, I,,, , P , I , a I
10 20 30 40 50 60 70
Frequency, Hz
Figure 16(b). Bandwidth comparison of hub pitch moment balance response due to hub roll moment loading, simulatedB0105 hub mass.
38
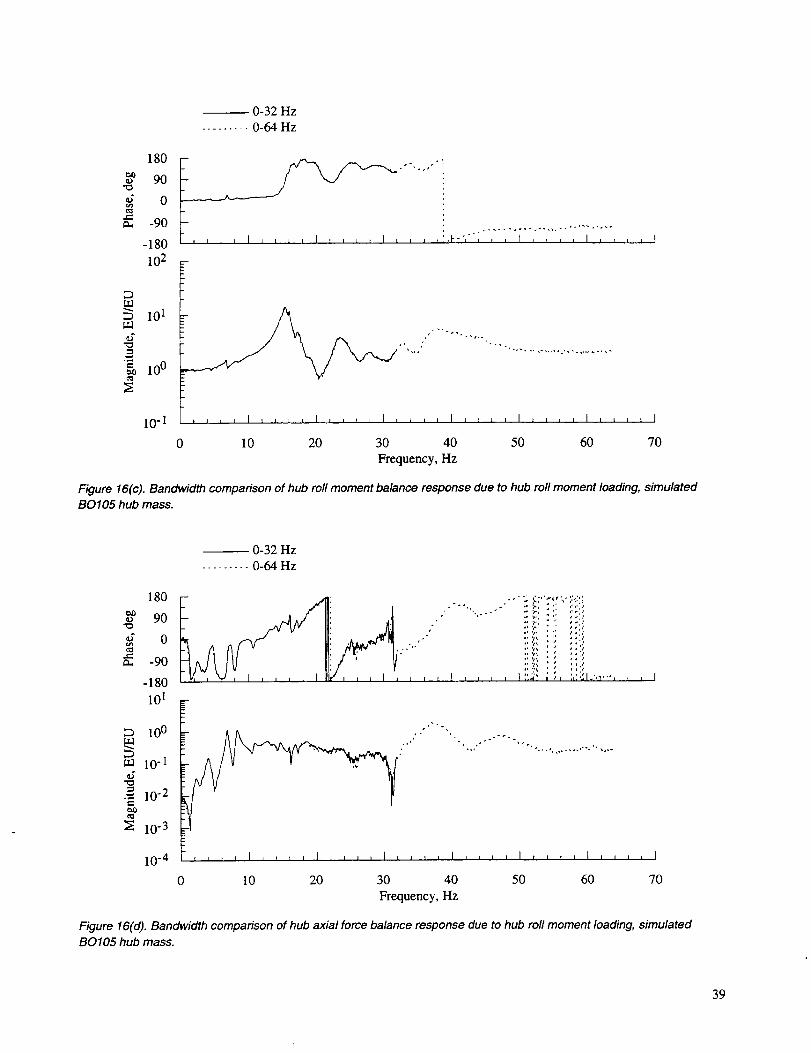
-- 0-32 Hz
......... 0-64 Hz
180I:zD
90
oc_r-m -90
-180
102 _-
101
2
= 100c_
10-1 *, I , I I I t t I,, I I I z I i i I _ 1A r I _ i i i I , , I , I
10 20 30 40 50 60 70
Frequency, Hz
Figure 16(c). Bandwidth comparison of hub roll moment balance response due to hub roll moment loading, simulatedB0105 hub mass.
-- 0-32 Hz
......... 0-64 Hz
GJ) '% o-" _', " " ""o 90 " "" _'. "" "'
_. -90 '" ".....
-180 ,, I .... _::_" ,_, ',::::i.'.,.-',,, I
101
10o
Ud 10-1
-=_lO-Z¢-
10-3
10-4
• ,s" " ", •
0
i , , i I j i , , I , , , t I I , I , I I , [ J I I , , , I , I I , I
10 20 30 40 50 60 70
Frequency, Hz
Figure 16(d). Bandwidth comparison of hub axial force balance response due to hub roll moment loading, simulatedB0105 hub mass.
39
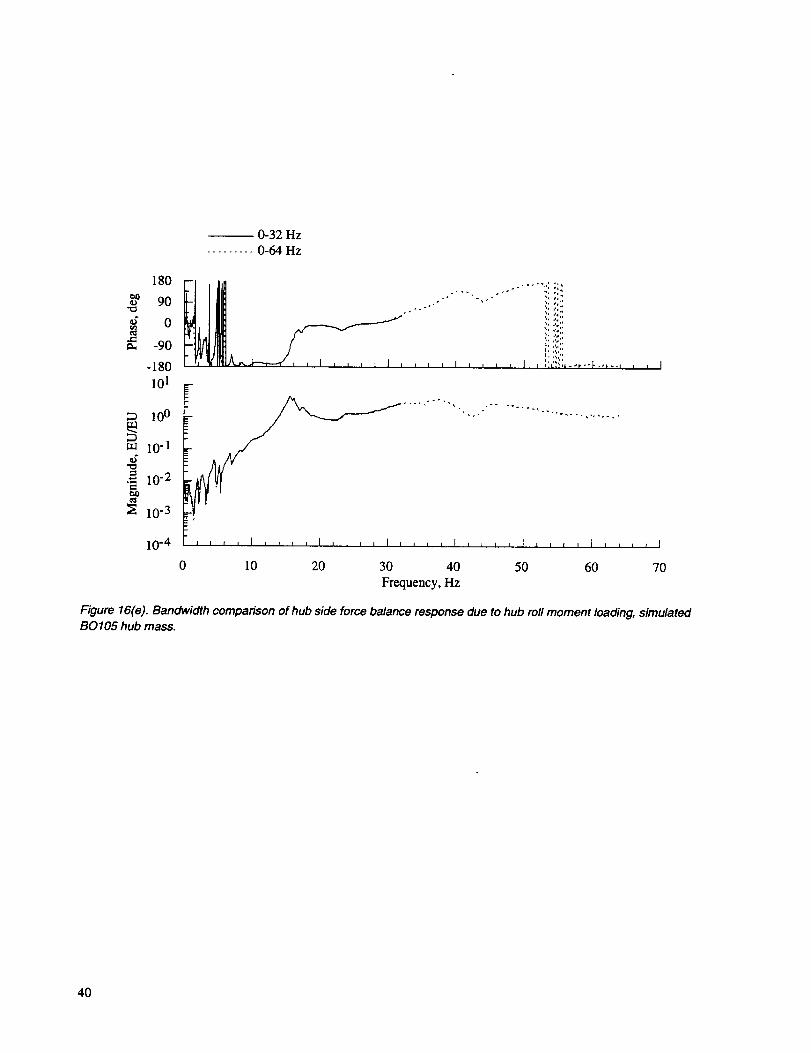
-- 0-32 Hz
......... 0-64 Hz
180
o 90
o¢:1
_. -90
-180
101
100
_ lO.i_2
lO-2
10-3
10-4
o. .... ,.. =.,
J I l I I _ _ I i I I L _ I I , , , , [ , , , , l .... I I i J I I
10 20 30 40 50 60 70
Frequency, Hz
Figure 16(e). Bandwidth comparison of hub side force balance response due to hub roll moment loading, simulatedB0105 hub mass.
40

-- Out-of-plane loading
......... In-plane loading
180
90
oe-,_, -90
-180
102
lO ]
._ 1002-=
lO-1
10-2 I I, , I,, 1, I I L I, I,,,, I I, I, I L P r , 1 1 , , * I
10 20 30 40 50 60 70
Frequency, Hz
Figure 17(a). Comparison of hub pitch moment response due to out-of-plane and in-plane hub forces, simulated B0105hub mass.
-- Out-of-plane loading
......... In-plane loading
180
90
oe-._, -90
-180
102
I , , I
101
x_ 100
¢-,
¢_
10 -I
10-2
10 20 30 40 50 60 70
Frequency, Hz
Figure 17(b). Comparison of hub roll moment response due to out-of-plane and in-plane hub forces, simulated BO 105 hub
mass.
41
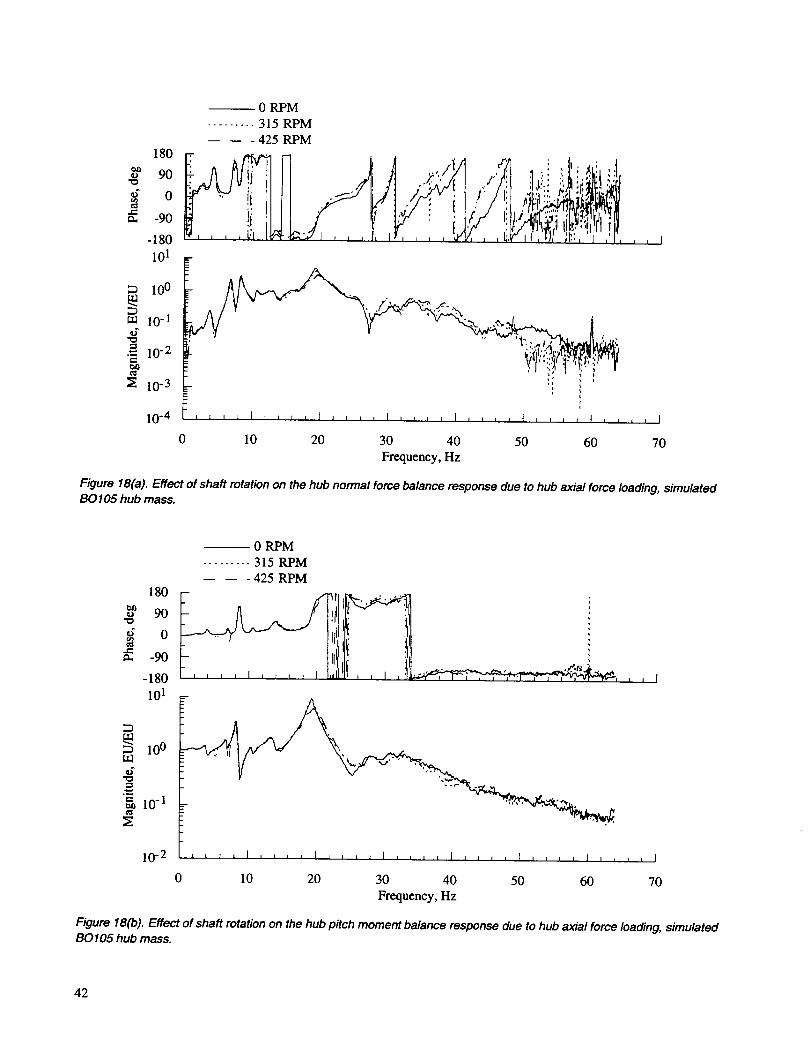
¢:1
_0 RPM
......... 315 RPM
-- -- - 425 RPM
,o .A ..,"/!l ti:.::
-90 i
-180 , I , I , , i i I I
101
". v .-% ,
10-1
._=<<,_lO-2 I10-3
10-4 i i I I l I I i I I I I I I I I I I I I i I I I I I I I I I I i i i
0 10 20 30 40 50 60
Frequency, Hz
I
70
Figure 18(a). Effect of shaft rotation on the hub normal force balance response due to hub axial force loading, simulatedB0105 hub mass.
180
o 90"O
oa. -90
-180
101
10 o
o"
.510 -1
o_
10-2
_0 RPM
......... 315 RPM
-- -- - 425 RPM
t I . .',.'" ;
, ,I ,,,, ,,,,
i i 1 , I , , , , I , , , , I , , , , I , , , , I , , , , I , , , , I
10 20 30 40 50 60 70
Frequency, Hz
Figure 18(b). Effect of shaft rotation on the hub pitch moment balance response due to hub axial force loading, simulatedB0105 hub mass.
42

180
90
oc_
m -90
-180
101
lO0
10-1
lO-2INI
_ 10-3
10-4
-- 0 RPM......... 315 RPM
- 425 RPM
:', _ ." ,. :,
,,, , I 1 1 J 1 I 1 i _, I,,, L I, ,,, I _ _ I, I , , , , I
0 10 20 30 40 50 60 70
Frequency, Hz
Figure 18(c). Effect of shaft rotation on the hub roll moment balance response due to hub axial force loading, simulatedBO 105 hub mass.
180
o 90
g oe-,_. -90
-180
-- 0 RPM
......... 315 RPM
- 425 RPM
102 _-
101
¢- 100
10-1
. . , .... .,
10 20 30 40 50 60 70
Frequency, Hz
Figure 18(d). Effect of shaft rotation on the hub axial force balance response due to hub axial force loading, simulatedB0105 hub mass.
43
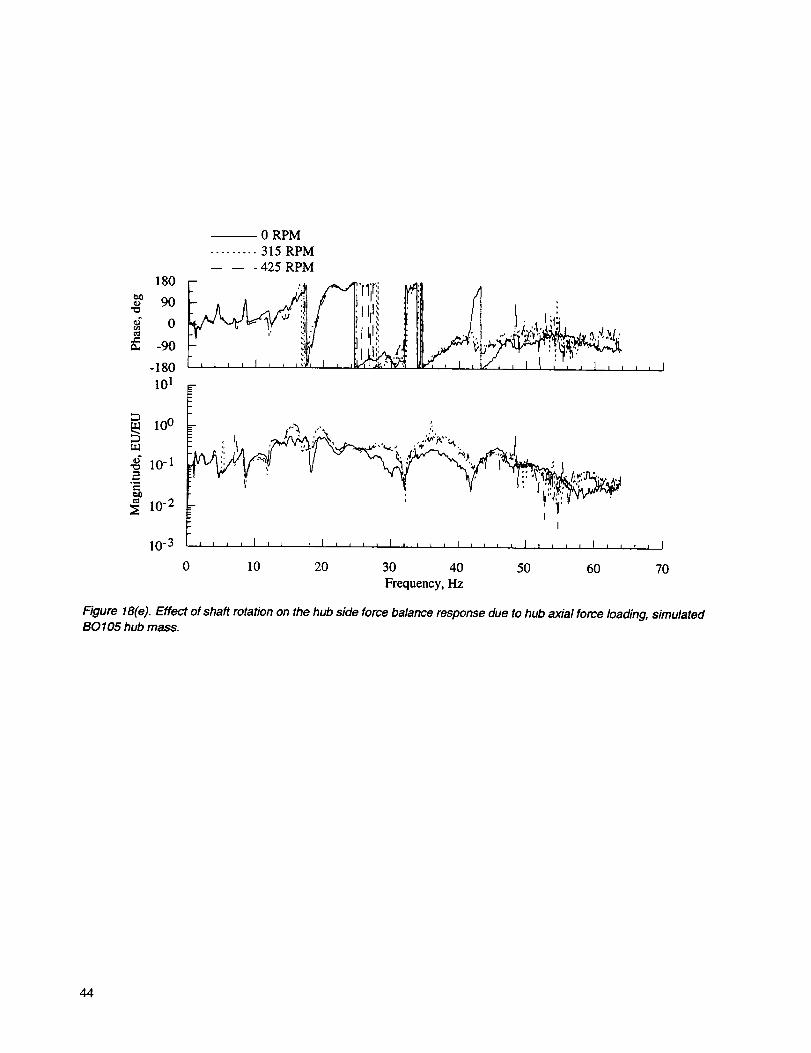
180_m
90
o
m -90
-180
101
100
•_ 10-12
_ 10 -2
10-3
--0 RPM
......... 315 RPM-- -- - 425 RPM
F,,, , , , , ,i!f, , ,_ I:b<, ,_gT,t'!'_ETT,
[. I. .,/,.x,!a ..;,,-,",, .;':,"i,"_
_. .1:,.,:". ,._.
I
I
0
, , I
, , , , I j j , _ I , , , , I , , , , I , , , , I , , , , I , , , , I
10 20 30 40 50 60 70
Frequency, Hz
Figure 18(e). Effect of shaft rotation on the hub side force balance response due to hub axial force loading, simulatedB0105 hub mass.
44

180
o 90
g oe-
-90
-180
0 RPM......... 315 RPM
- 425 RPM
, :'-----
,, ,lJ r, :, , I i ,,, P,,,, I , J, t P ,,,, I , , _ , I
101 -
c5._ I0 0
10-1
j 1
, , I l I 1 ,, i I , r L , I i ¢ J i l l J i , l , , , , l , K i i ]
10 20 30 40 50 60 70
Frequency, Hz
Figure 19(a). Effect of shaft rotation on the hub normal force balance response due to hub normal force loading, simulatedB0105 hub mass.
180e_0o 90
_ o¢-_, -90
-180
101
10o_J
1-_ 10-
e-.IN)c_
10 -2
10-3
0 RPM
......... 315 RPM-- -- - 425 RPM
'r ,/J L ! _' i: ;I_ :Fit, ._ H _L,/n'll_,./.I_,..._,_._i_i_ ._" ,iI!1_li:! /711/Ylli!,;',i,Y'_
i" ' " './ , , ,!, r',' L/,,
0
t
,111 ,,s- Vr _ , i
10 20 30 40 50 60 70
Frequency, Hz
Figure 19(b). Effect of shaft rotation on the hub pitch moment balance response due to hub normal force loading,simulated BO 105 hub mass.
45

180
,_ 90
oe-,m -90
-180
101
I I0 ouJ
-o 10 -1
_ 10 -2
10-3
--0 RPM
......... 315 RPM
-- -- - 425 RPM
F _ 'J "7? "__1\ "J'_"C:_'_n iJ , i
f t11' i, tF.... ,, : ItZ ,, I,lt .... 'iii_7__l
I
0
, , , , I , , , , I .... I , _ , , I , , , , I , , , j I _ , , , I
10 20 30 40 50 60 70
Frequency, Hz
Figure 19(c). Effect of shaft rotation on the hub roll moment balance response due to hub normal force loading, simulatedB0105 hub mass.
180
,a 90
_ o
a, -90
-180
101 P
10o
m 10-16
._ 10-2e-
_ 10-3
10-4
--0 RPM......... 315 RPM
-- -- - 425 RPM
•:i_ ; ,"_:: Jt ,_b.,_..gr_'l
,.. ,./,r:, /W,.,l;t!! .r._li! _!ll il?.r ,'_l
i r , i I
0
i I I I I I I I i I I i i I I I i i i I I i I i I t, I i I .... I
10 20 30 40 50 60 70
Frequency, Hz
Figure l g(d). Effect of shaft rotation on the hub axial force balance response due to hub normal force loading, simulatedB0105 hub mass.
46

180
90
ot_e-_. -90
-180
101
-- 0 RPM
......... 315 RPM
-- -- - 425 RPM
I ,: ; " :..:, J ...,..."
t I .' ',_. ,y' ",:
i , , I
10o
m 10-]
lO-2
¢tlt
10-3
10-4 i i, i t, K h I I i i i I I I i i I I I I, i I , , , , I , , i r I
0 10 20 30 40 50 60 70
Frequency, Hz
Figure 19(e). Effect of shaft rotation on the hub side force balance response due to hub normal force loading, simulatedB0105 hub mass.
4?
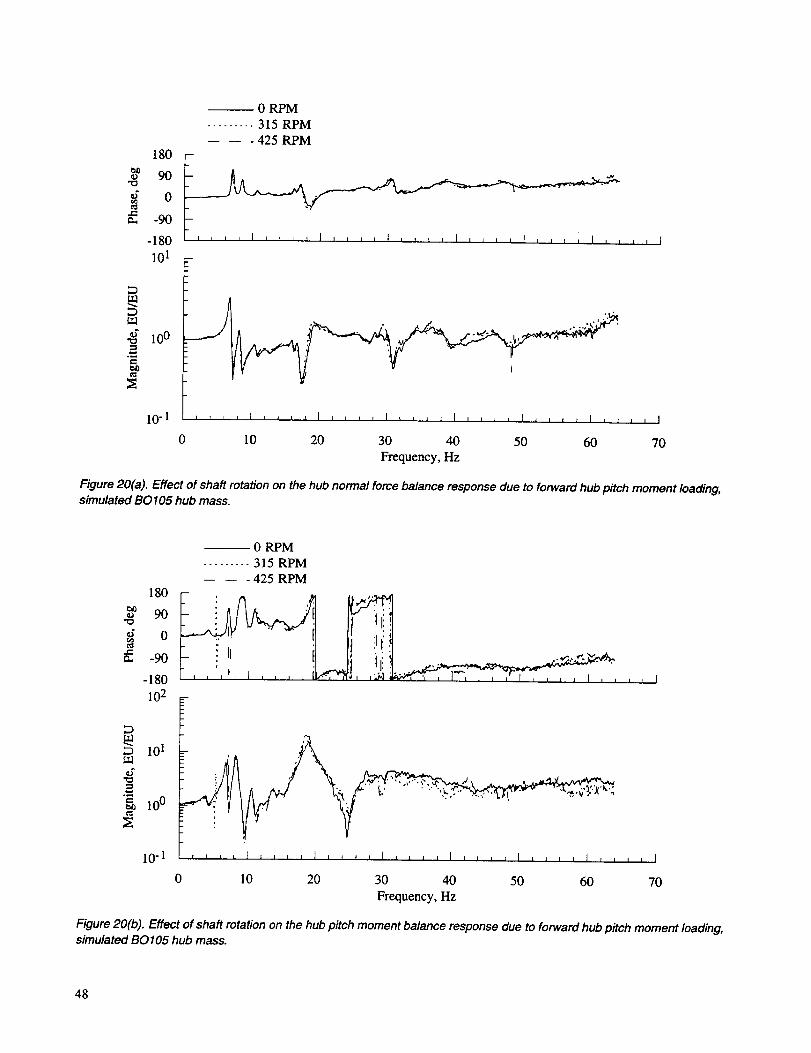
OJ_90
oe,,
-90
-180
0 RPM
......... 315 RPM
-- -- - 425 RPM180
101 -
, , I
•_ 100
10-1
• ° °_,, ,
i
,, i i I J i, I I, * q * I I, i i I i i i L I j I I _ I L i i i I
10 20 30 40 50 60 70
Frequency, Hz
Figure 20(a). Effect of shaft rotation on the hub normal force balance response due to forward hub pitch moment loading,simulated BO 105 hub mass.
180
,_ 90
ot_e-_, -90
-180
--0 RPM
......... 315 RPM
-- -- - 425 RPM
i
• _.%, ,¢% x,-
i
102 _-
, , I
101
¢;
lOo
10-1
0
t t ' ' I i ' i ' I _ _ I t I , , J , I r , , r I i , i , I r , , i [
10 20 30 40 50 60 70
Frequency, Hz
Figure 20(b). Effect of shaft rotation on the hub pitch moment balance response due to forward hub pitch moment loading,simulated B0105 hub mass.
48

180
90
g o
a. -90
-180
101
10o
._ 10-1
_ 10 -2
10-3
-- 0 RPM
......... 315 RPM-- -- - 425 RPM
tll i i t, , I
_,,, I,, i J !,,, I I I l L * I _ , L , I L I , t I , , , I I
10 20 30 40 50 60 70
Frequency, Hz
Figure 20(c). Effect of shaft rotation on the hub roll moment balance response due to forward hub pitch moment loading,simulated BO 105 hub mass.
180c_,_ 90
oa, -90
-180
101
100
c_ 10-1@
.__ 10-2¢-
10-3
10-4
_0 RPM......... 315 RPM
-- -- - 425 RPM
i i I
?
,, I i I i I r I I I I I I I, I I I I I I I r I I I I I I I L _ I I
10 20 30 40 50 60 70
Frequency, Hz
Figure 20(d). Effect of shaft rotation on the hub axial force balance response due to forward hub pitch moment loading,simulated B0105 hub mass.
49

180
o 90
_ o¢-,a. -90
-180
101
10o
m 10-1
.-.= 10-2
t_
10-3
10-4
0
--0 RPM
......... 315 RPM
- 425 RPM
t,,I,, _,,! ,, ,ii, !i, ,l!f,ll_7"t"T,,',,,,,,, ',,__r
I
10 20 30 40 50 60 70
Frequency, Hz
Figure 20(e). Effect of shaft rotation on the hub side force balance response due to forward hub pitch moment loading,simulated BO 105 hub mass.
5O
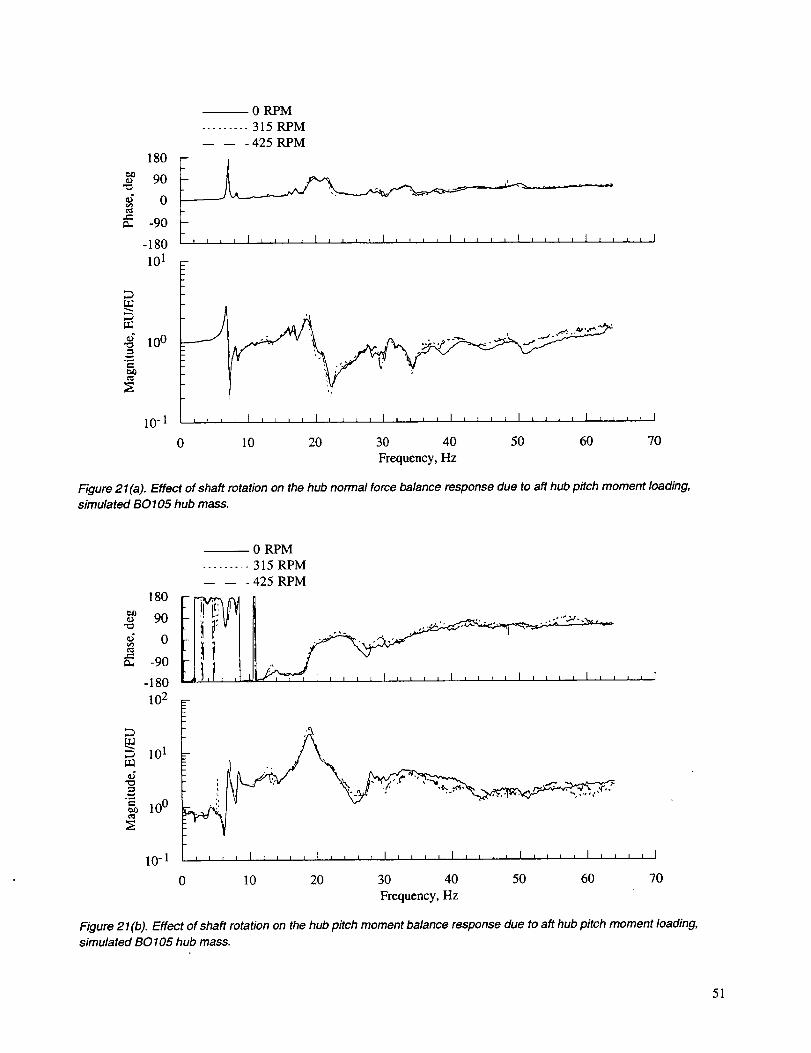
90
g o
-90
-180
-- 0 RPM
......... 315 RPM
-- -- - 425 RPM180
• " " i i i
101 -
m
lO0
lO-1
10 20 30 40 50 60 70
Frequency, Hz
Figure 21(a). Effect of shaft rotation on the hub normal force balance response due to aft hub pitch moment loading,simulated B0105 hub mass.
180
90
o-90
-180
--0 RPM
......... 315 RPM
-- -- - 425 RPM
__1 ii'" "_'" " "" ' "' "
102 .-
101
¢..,_o 100
10-1
,, •
10 20 30 40 50 60 70
Frequency, Hz
Figure 2 l (b). Effect of shaft rotation on the hub pitch moment balance response due to aft hub pitch moment loading,simulated B0105 hub mass.
51

180
,_ 90
_ o
_ -90
-180
-- 0 RPM
......... 315 RPM
-- -- - 425 RPM
i ,' " ' ,.:>
_!1111_,d_l,_!Jl/il J' l/;_f,(1_1_iI_}':1:_:__' tli': ! :J ?. ! I
101 _-
10 o
_ lO-_
10-2
, , I
0
I I + I I t I _ , I 1 _ I, I 11 I I I I I i, I i i i, I,, , I I
10 20 30 40 50 60 70
Frequency, Hz
Figure 21(c). Effect of shaft rotation on the hub roll moment balance response due to aft hub pitch moment loading,simulated BO 105 hub mass.
180
,_ 90
_ o,.=m -90
-180
_0 RPM
......... 315 RPM
-- -- - 425 RPM
,,, .... _,iiiii,,,:,i_LI01 -
10o
_ lO-]
10"2
i
, , I
I I I I I I I I 1 I I I I I I I i I i I _ _ _ _ I , , , , I .... I
10 20 30 40 50 60 70
Frequency, Hz
Figure 21(d). Effect of shaft rotation on the hub axial force balance response due to aft hub pitch moment loading,simulated B0105 hub mass.
52

180
90
g oe-
=. -90
-180
101
10o
m 10-1
,5 lO-2r-
_ 10-3
10-4
--0 RPM
......... 315 RPM
-- -- - 425 RPM
i :!_/t : I : ,," I i!i
, , I
0 10 20 30 40 50 60 70
Frequency, Hz
Figure 21(e). Effect of shaft rotation on the hub side force balance response due to aft hub pitch moment loading,simulated B0105 hub mass.
53

180
o 90
_ o
m -90
-180
--0 RPM
......... 315 RPM
- 425 RPM
. - ii ....
j , ,I, I , , , , I , , , , 1 , j _ _ I , t , ,t I , , ,
101 _
,I,_,,I
._ 100
10-1 .... I , = , i I , , t , t , , , , I , , , , I , , , , I , , , , I
10 20 30 40 50 60 70
Frequency, Hz
Figure 22(a). Effect of shaft rotation on the hub normal force balance response due to hub roll moment loading, simulatedB0105 hub mass.
180
90
o" 0
c_ -90
-180
101
10o
10_1
,_ lO-2¢,,,
10-3
10-4
--0 RPM
......... 315 RPM
- 425 RPM
_ _I:Ill . .:/ " :' :-;,l_!i!'t,_ :,_,J._.df._.)'.,i_if+;i
==--
0 10 20 30 40 50 60 70
Frequency, Hz
Figure 22(b). Effect of shaft rotation on the hub pitch moment balance response due to hub roll moment loading,simulated B0105 hub mass.
54

180
90
g oe-
-90
-180
--0 RPM
......... 315 RPM
-- -- - 425 RPM
102 .-
101
¢.., 100t_
10-1
0 10 20 30 40 50 60 70
Frequency, Hz
Figure 22(c). Effect of shaft rotation on the hub roll moment balance response due to hub roll moment loading, simulatedB0105 hub mass.
180
90
o-90
-180
101
100
_ 10-1
lO-2e,,,
I0-3
10-4
0 RPM
......... 315 RPM
-- -- - 425 RPM
._.':,' ,5
i: iii):i'I!IIII JJLI, , I
, . ."_ t'.... I
" ,,.:" ',,, , ,. s.,.t "
!:L , , , I , , i, I, _ I I I ,,, , I, , _ , I , , , , I , i , _ 1
0 I0 20 30 40 50 60 70
Frequency, Hz
Figure 22(d). Effect of shaft rotation on the hub axial force balance response due to hub roll moment loading, simulatedB0105 hub mass.
55
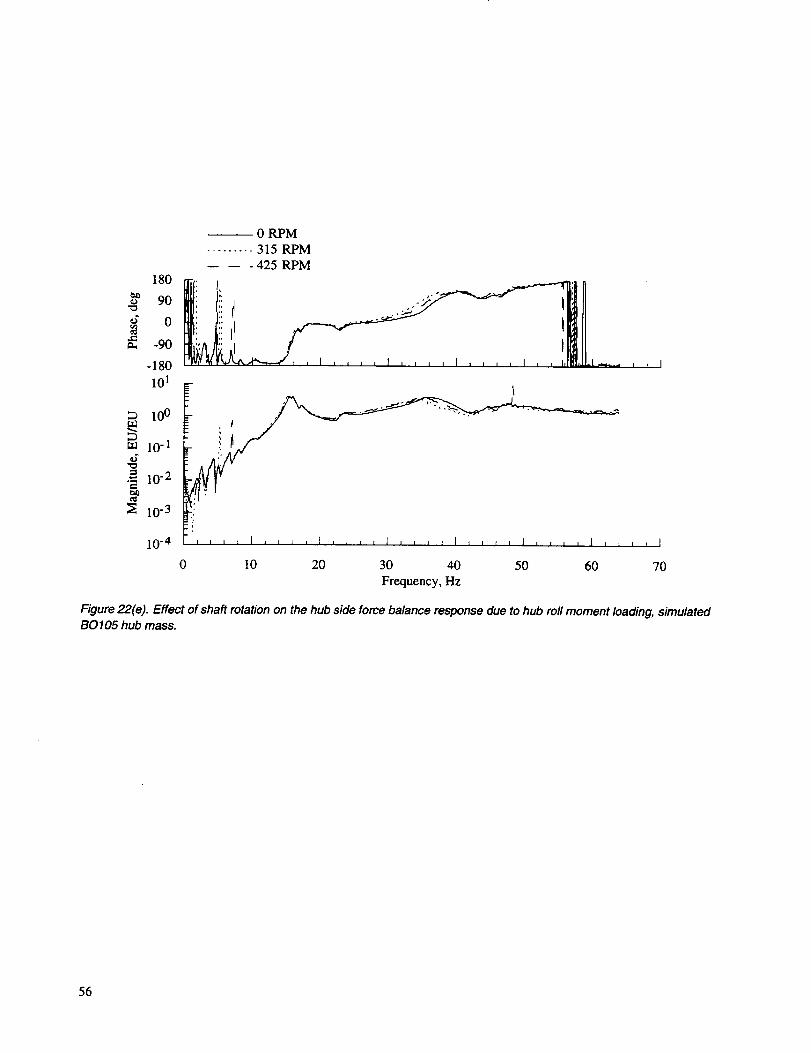
180
90
o
-90
-180
101
100
m 10-1_s
.-2-_=lO-2
N 1o-3
10-4
--0 RPM
......... 315 RPM
- 425 RPM
• "':_ t '
i i i t I , t L _ I , J _ t I , , , , I _ I l i I i , , , I _ , , , I
I 0 20 30 40 50 60 70
Frequency, Hz
Figure 2_2(e). Effect of shaft rotation on the hub side force balance response due to hub roll moment loading, simulatedBO 105 hub mass.
56

-- 0 lb Preload
......... 4000 lb Preload
180
o 90
o¢-_., -90
-180
101
, , I
100
-_ 10"
10 -:2
10-3 I f r, i I i i r , I i A _ i I i J i i I t i i i I i t i i I
10 20 30 40 50 60 70
Frequency, Hz
Figure 23(a). Effect of thrust preload on the hub normal force balance response due to hub side force loading, simulatedB0105 hub mass.
0 lb Preload......... 4000 lb Preload
180Cxl)o 90
g o-90
-180
10o
10 -1
_a 10-2d
.5 1o-3
_ 10-4
10-5
, ; .' . .::. :',! ,, .:
' ' .... ;' : '; t , ,
, , [': , ', ,,,, , .
L L I J I I I I i I l i , , I i , i J I I I I t I * I I I I I I J A I
10 20 30 40 50 60 70
Frequency, Hz
Figure 23(b). Effect of thrust preload on the hub pitch moment balance response due to hub side force loading, simulated
B0105 hub mass.
57

-- 0 lb Preload
......... 4000 lb Preload
180
90
ot_e-
ra -90
-180
101
10 o
¢i
N lo -]¢_
10-2
, ,. : ' . . ;
_ : .: : :
, : , : ',
i i I
.... I i i I I I i I f , I t I i I I k f z I I i i _ t I , , , _ I
10 20 30 40 50 60 70
Frequency, Hz
Figure 23(c). Effect of thrust pre/oad on the hub roll moment balance response due to hub side force loading, simulatedB0105 hub mass.
-- 0 lb Preload
......... 4000 lb Preload
180
90
oe-,m -90
-180
100 ..-
i0_1
,3
lO-2
10-3
' . , ,, : . _,.,, ...%
, i I
I I I i I i i i i I i i J I I i _ i i I , _ _, I .... I, I I J I
10 20 30 40 50 60 70
Frequency, Hz
Figure 23(d). Effect of thrust pre/oad on the hub axial force balance response due to hub side force loading, simulatedBO 105 hub mass.
58

-- 0 lb Preload
......... 4000 lb Preload
180
90
g o-90
-180
102 _-
lO 1
e-,_o lO0
10-1 ,, L, I r j L I I i t i I I, I I I I I I I, I, I, I I, I t t I
10 20 30 40 50 60 70
Frequency, Hz
Figure 23(e). Effect of thrust preload on the hub side force balance response due to hub side force loading, simulatedB0105 hub mass.
59

-- 0 lb Preload
......... 4000 lb Preload
180
90
ot_
_, -90
-180
101
10or.rd
•_ 10-12
_ 10 -2
10-3
0 10 20 30 40 50 60 70
Frequency, Hz
Figure 24(a). Effect of thrust preload on the hub normal force balance response due to hub axial force loading, simulatedB0105 hub mass.
-- 0 lb Preload
......... 4000 Ib Preload
180
,_ 90
ot_
-90
-180
lO2
101
._ 100
e-,
10"I
10-2
10 20 30 40 50 60 70
Frequency, Hz
Figure 24(b). Effect of thrust preload on the hub pitch moment balance response due to hub axial force loading, simulatedB0105 hub mass.
60

-- 0 lb Preload
......... 4000 lb Preload
180
_5o 90
oe-.a, -90
-180
101 -
, , I
10o
._ 10-1
_ 10 -2
•- ,j. ,'.
t , t i I
2 Jm
10-3
0 10 20 30 40 50 60 70
Frequency, Hz
Figure 24(c). Effect of thrust preload on the hub roll moment balance response due to hub axial force loading, simulated
B0105 hub mass•
-- 0 lb Preload
......... 4000 lb Preload
180
90
o
-90
-180
102 .-
l01
_,=
_ 10o
10-1 t, F, I,,,, I t r,, I,,,, I, I, , I, , L, I , , l , I
10 20 30 40 50 60 70
Frequency, Hz
Figure 24(d). Effect of thrust preload on the hub axial force balance response due to hub axial force loading, simulatedBO 105 hub mass•
61

--- 0 lb Preload
......... 4000 lb Preload
180
90
o¢,.,m -90
-180
10"3
, , I
0
t L I I I I I, I I, f i r I i f _ I I J I r , I I , r I f r t A i f
10 20 30 40 50 60 70
Frequency, Hz
Figure 24(e). Effect of thrust preload on the hub side force balance response due to hub axial force loading, simulatedBO 105 hub mass.
62

4000 lb Preload, 0 RPM
......... 4000 lb Preload, 315 RPM
180
e__a 90
o¢-_. -90
-180
: , .',..' . _,,.. ;,
i
100
._ 10-12._.
10 -2
101 -
I I [ I I l I I I I I I I I I I I I I t t t ] t i i t I I I10-3
0 10 20 30 40 50 60
Frequency, Hz
, , I
, I
?0
Figure 25(a). Effect of thrust preload with RPM variation on the hub normal force balance response due to hub axial force
loading, simulated BO 105 hub mass.
-- 4000 lb Preload, 0 RPM
......... 4000 lb Preload, 315 RPM
180
,_ 90
o¢..,_. -90
-180
102
, , I
101
._ 1002-_.ca)
10 -1
10-2 i, i,l r tl,l,,,_ l,,in l,,l II n , , i } .... I
10 20 30 40 50 60 70
Frequency, Hz
Figure 25(b). Effect of thrust preload with RPM variation on the hub pitch moment balance response due to hub axial force
loading, simulated BO 105 hub mass.
63

-- 4000 lb Preload, 0 RPM
......... 4000 lb Preload, 315 RPM
180
o 90
*; 0P,m -90
-180
101
, i I
10o_J
._ 10-1
e-
I0 -2
10-3 i i i i I I = L L I = , t J I , _ , , I , , , , I , , , t I i i J i I
0 10 20 30 40 50 60 70
Frequency, Hz
Figure 25(c). Effect of thrust preload with RPM variation on the hub roll moment balance response due to hub axial forceloading, simulated B0105 hub mass.
4000 lb Preload, 0 RPM
......... 4000 lb Preload, 315 RPM
180
90
o
a, -90
-180
102
i i I
101
•m 100
_ 10 -1
10-2
7
.... I .... I I I I I I I I I _ I t , , , I .... I .... I
10 20 30 40 50 60 70
Frequency, Hz
Figure 25(d). Effect of thrust pre/oad with RPM variation on the hub axial force balance response due to hub axial forceloading, simulated BO 105 hub mass.
64

-- 4000 lb Preload, 0 RPM
......... 4000 lb Preload, 315 RPM
180
eli) 90
•; 0
t-,,- -90
-180
101
i , , I
10o
•t_ 10 -1
_ 10 -2
10-3 ,,,, I, i i i [,,,, I,, l, I , t t , I L , , J I , , A , I
0 10 20 30 40 50 60 70
Frequency, Hz
Figure 25(e). Effect of thrust preload with RPM variation on the hub side force balance response due to hub axial force
loading, simulated BO 105 hub mass.
65

2000 lb, 0o
......... 2000 lb, 15°
180
,_ 90
oe..,m -90
-180
101
;D 10o
i0-I
._ lO-2
10-3
10-4
0 10 20 30 40 50 60 70
Frequency, Hz
Figure 26(a). Comparison of thrust inclination pre/oad on the hub normal force balance response due to hub axial forceloading, simulated SBMR hub mass.
-- 2000 lb, 0 °
......... 2000 lb, 15 °
180
o 90
_ oe.,
-90
-180
101 =-
100
_ 1o-]
10-2
, , I
10 20 30 40 50 60 70
Frequency, Hz
Figure 26(b). Comparison of thrust inclination preload on the hub pitch moment balance response due to hub axial forceloading, simulated $BMR hub mass.
66
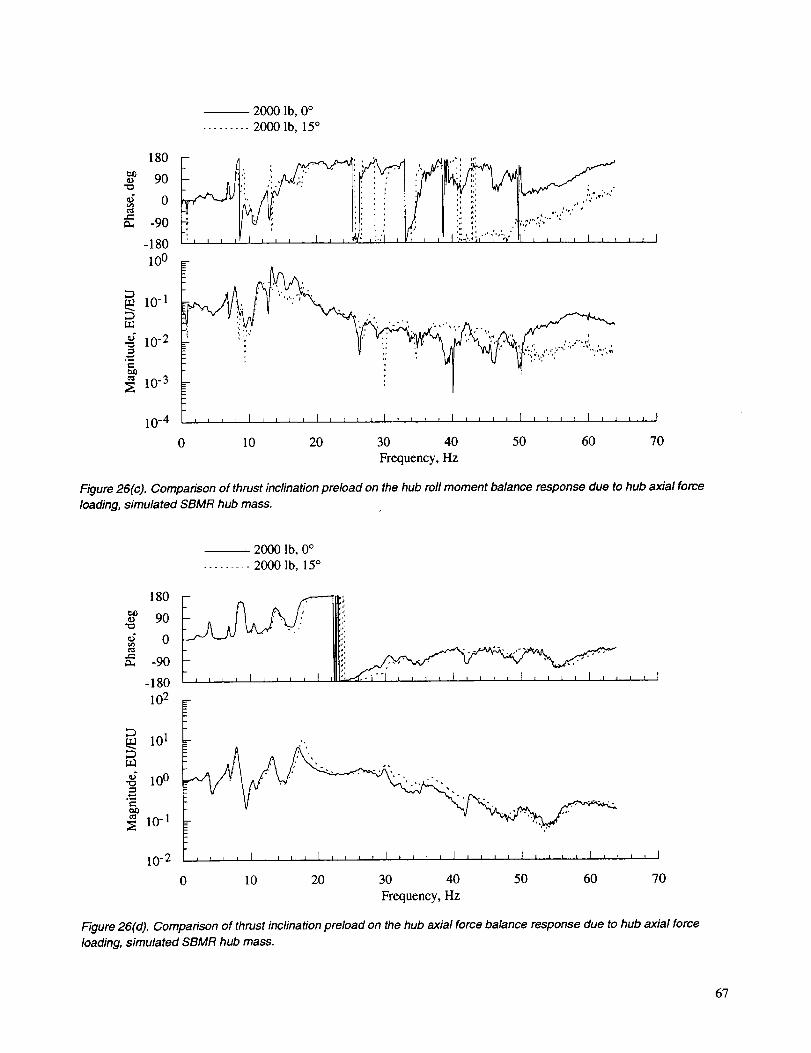
-- 2000 lb, 0 °
......... 2000 lb, 15°
180
,_ 90
g o
_. -90
-180
10o
lO_i
,_ 10-2
,,-..
10 -3
10-4
, ,.,,",.. ,. ,• , ;,,7_ ,;'
, , I
• ',.
0
, , , J I : , J , I , 1 I _ I , J , , 1 , , J , 1 , 1 , r I , _ I , I
10 20 30 40 50 60 70
Frequency, Hz
Figure 26(c). Comparison of thrust inclination preload on the hub roll moment balance response due to hub axial force
loading, simulated SBMR hub mass.
2000 lb, 0 °
......... 2000 lb, 15°
180
90
oe..,m -90
-180
102
I I [
101
._ 100
¢-
_ I0 -1
10-2
0 10 20 30 40 50 60 70
Frequency, Hz
Figure 26(d). Comparison of thrust inclination preload on the hub axial force balance response due to hub axial force
loading, simulated SBMR hub mass.
6?

2000 lb, 0o
......... 2000 lb, 0°
180
¢mo 90
o
m -90
-180
: ., , : . : . • . , ,0 :.' ....;,.,...,
. . .... ,=.,......... , .; .:,,..
.... . _ .... ._,_... ..
Figure 26(e). Comparison of thrust inclination preload on the hub side force balance response due to hub axial forceloading, simulated SBMR hub mass.
68

180
90
_ o
_, -90
-180
2000 lb, 315 RPM
......... 3000 lb, 315 RPM
-- -- -4000 lb, 315 RPM
• J i!' II :: I ,j
101 2---
, , I
10oud
._" 10-1
_ 10 -2
10-3
i
10 20 30 40 50 60 70
Frequency, Hz
Figure 27(a). Comparison of variations in thrust preload with shaft rotation on the hub normal force balance response due
to hub axial force loading, simulated SBMR hub mass.
180
o 90
g oe'- -90
-180
10o
,3
_ lO-1
10-2
-- 2000 Ib, 315 RPM
......... 3000 lb, 315 RPM
-- -- -40001b, 315RPM
r
. I_I!til:
, i i I
101 .--
,, , i [ ,,, , I , i i , I , i _ , I i , , , I , , , i I , , i _ I
0 10 20 30 40 50 60 70
Frequency, Hz
Figure 27(b). Comparison of variations in thrust pre/oad with shaft rotation on the hub pitch moment balance response
due to hub axial force loading, simulated SBMR hub mass.
69

180
90
g oe-
_. -90
-180
100
10_1
_ lO-2
10-3
-- 2000 Ib, 315 RPM
......... 3000 Ib, 315 RPM
- 4000 lb, 315 RPM
:: i' '!
!1:1' li i !111 , ' I ;' '"'
"--" I "o
' !t " /
'" ' a;' " J t 1
,%
, , I
, , , J I , , , _ t .... I .... I , l _ h I + , i , I .... I
10 20 30 40 50 60 70
Frequency, Hz
Figure 27(c). Comparison of variations in thrust preioad withshaft rotation on the hub roll moment balance response dueto hub axial force loading, simulated SBMR hub mass.
¢)
¢<$,J=
lOO¢;
.==10 -1
e_
-- 2000 lb, 315 RPM
......... 3000 lb, 315 RPM- 4000 lb, 315 RPM
90 , I
o ' I ,,.o.-90 l '" "" "" "' """ ',
-180 L,, I
101
+,
i : . I,,,- ..
10-2 i + i I I I J i i I I t I I I i I L i t _ i J , I , , , , I .... I
0 10 20 30 40 50 60 70
Frequency, Hz
Figure 27(d). Comparison of variations in thrust pre/oad with shaft rotation on the hub axial force balance response due tohub axial force loading, simulated SBMR hub mass.
7O

180o 90
_2 o
u. -90
-180
101
-- 2000 lb, 315 RPM
......... 3000 lb, 315 RPM
-- -- -4000 Ib, 315 RPM
l/I : : , ,,
F- - C;_!,f !,"'l,,,_,...!titan__::tr"_l '_r IIl_._,,_i
lO0
._ lO-I
.2
c_
10 -2
10-3
- I ": 4
' ' !' H' '';' . "
I, t, I, 1, I I, 1, J I , , , i I , , , , I , , I , I , , , L I
0 10 20 30 40 50 60 70
Frequency, Hz
Figure 27(e). Comparison of variations in thrust pre/oad with shaft rotation on the hub side force balance response due to
hub axial force loading, simulated SBMR hub mass.
71
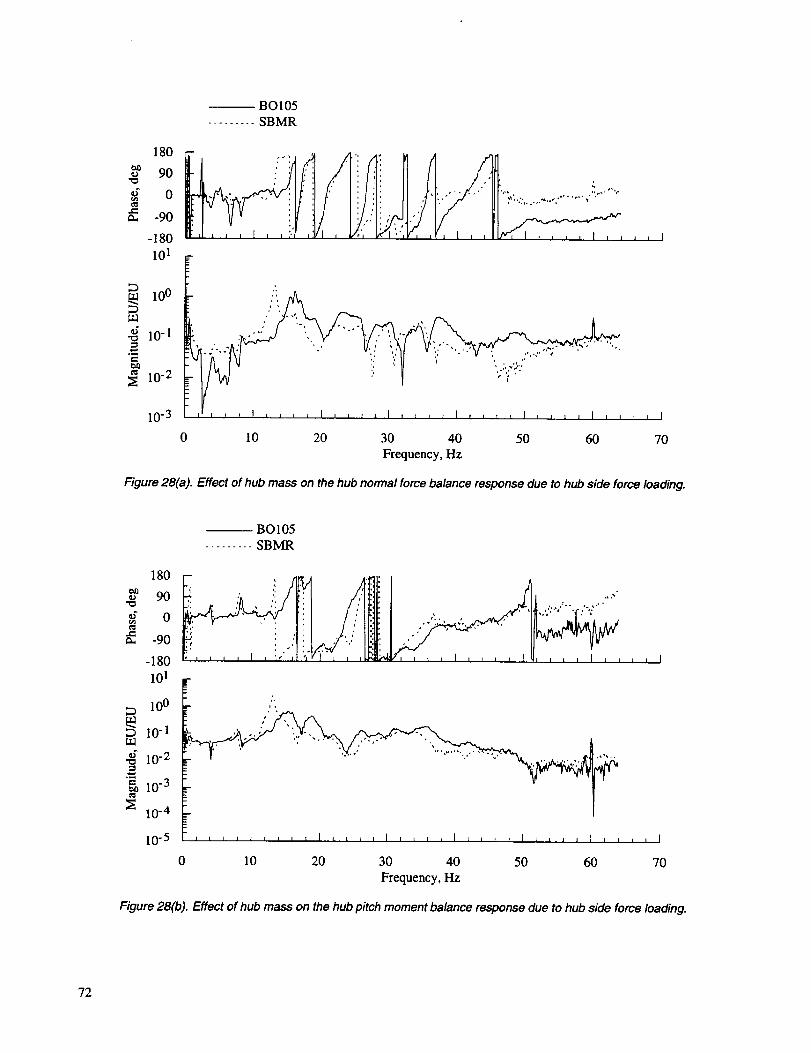
-- BO105
......... SBMR
180
90
oe-_, -90
-180
I01
, , I
100
•_ 10-1
10 -2
10 -3 I I I
0 70I0 20 30 40 50 60
Frequency, Hz
Figure 28(a). Effect of hub mass on the hub normal force balance response due to hub side force loading.
-- BO105
......... SBMR
180
90
o
m -90
-180
101
10 °
10_1
._" 10-2
10 -3
10-4
10-5
i , .', :
': ' ' ' ': : ''""'" ";:' , J , I
F
J,
t
.... J .... I I r I I I I L I , I _ I _ r I I I I , f , _ , , I
0 10 20 30 40 50 60 70
Frequency, Hz
Figure 28(b). Effect of hub mass on the hub pitch moment balance response due to hub side force loading.
72
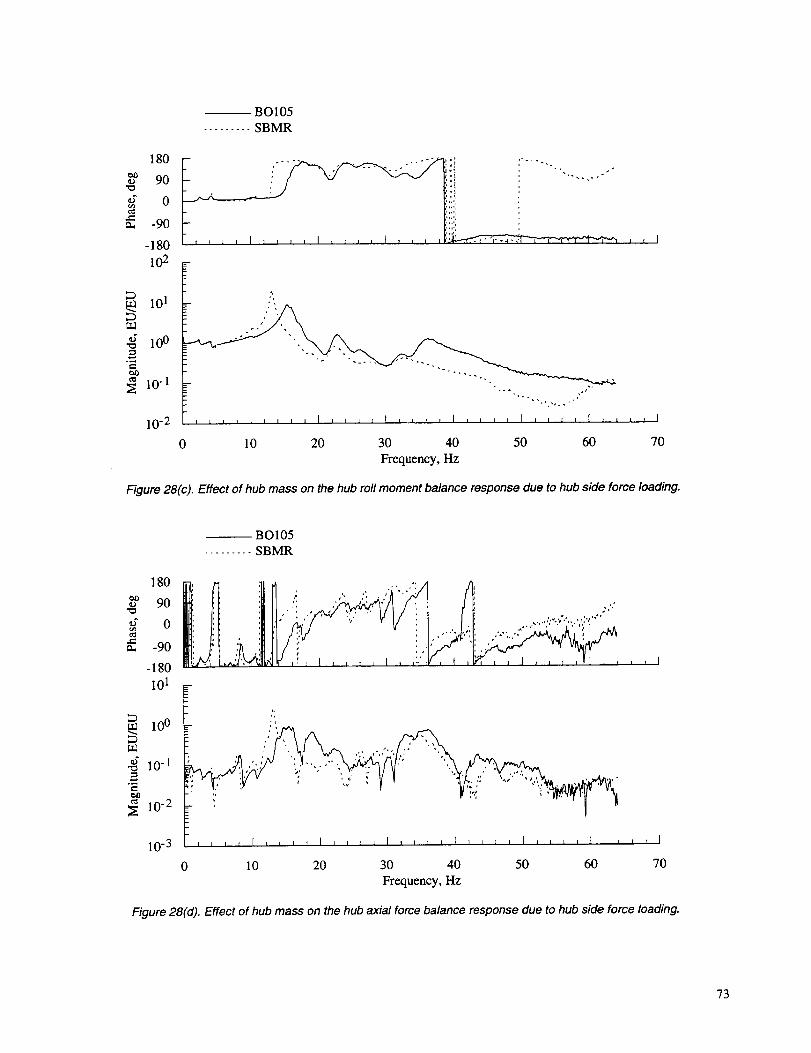
-- BO105
......... SBMR
180
,_ 90
oe-_. -90
-180
102
, , I
10 ]
•_ 100
¢..,
_ 10 -I
10-2 , , _ L , , , , [ , i L t I : r r r I , t , I I i : r , I L i l r I
10 20 30 40 50 60 70
Frequency, Hz
Figure 28(c). Effect of hub mass on the hub roll moment balance response due to hub side force loading.
-- BO105
......... SBMR
180
90
ot_v.,o. -90
-180
I01
: .., .': ,
, : ; ,, .; . , -.- ,
: , . , , ;..,.,,:Vo,.. ,,, .¢,, ; I I I
1o °
10 -1.5¢-
N ]0 -2
10-3 ,,, I I,,, i I,,,, I,, l i I I J 1, I ,,, i I , , I I I
10 20 30 40 50 60 70
Frequency, Hz
Figure 28(d). Effect of hub mass on the hub axial force balance response due to hub side force loading.
?3

BO105
......... SBMR
180
*_ 90
ot_
_, -90
-180
102
i i I
101
"o I0 0
_0
10 -1
10-2
0 10 20 30 40 50 60 70
Frequency, Hz
Figure 28(e). Effect of hub mass on the hub side force balance response due to hub side force loading.
74

-- BO105......... SBMR
180
o 90
o_3
-90
-180
101
10o
10 -1_,=v.-
10-2
,,,
10-3 I i i i I I i i i I i i i i I t = I I I I r I I I J = I I I t = I I I
0 10 20 30 40 50 60 70
Frequency, Hz
Figure 29(a). Effect of hub mass on the hub normal force balance response due to hub axial force loading.
BO105
......... SBMR
180
,_ 90
o-90
-180
.... * . o., - ,,',,, ...... i *• , - , ,., . ::', .; :: : .', -,,; ,.,; ., .--"
ilji!iiiii'..........[ , r ',, .... ,
L I I I
101
10 ot_
._ 10-1
._ ""'.,,,,,:.. ,,,:',."v-,
10 -2
10-3
• .._. ,,%'
.... I , , , , I _ i I I I I I I I I = I I I I I I _ r I = l I I I
10 20 30 40 50 60 70
Frequency, Hz
Figure 29(b). Effect of hub mass on the hub pitch moment balance response due to hub axial force loading.
75

BO105......... SBMR
180
*_ 90
oe.,m -90
-180
101
100
m 10-1d
"0
10-2
10-3
..'.. : ... _ - .....:...
, , . _, ¢ i.,,
,,% ,_.,.,) ..,_ o o)
_,,r, ,:,, ,,
10 -4 ,, I
0 10 20 30 40 50 60 70
Frequency, Hz
, , I
Figure 29(c). Effect of hub mass on the hub roll moment balance response due to hub axial force loading.
-- BO105
......... SBMR
180
o 90
0
_, -90
-180
102
, , I
101
m 100
"0
lO-1
10-2
10-3
0
. ;' i" ' i"
•",:,,.,.,,..,,.. . ._'
i'
,,, ) I ,,, , I i A _ _ I i,, ' I , , ( , I ) , , , I , i , I )
10 20 30 40 50 60 70
Frequency, Hz
Figure 29(d). Effect of hub mass on the hub axial force balance response due to hub axial force loading.
76

-- BO105
......... SBMR
180
¢_ 90
oct_
-90
-180
101
10o
m i0-I
lO-2¢.,
_ 10-3
10-4
.: .- .... ._.:,,, ' 4 o . ..
• ' ;_ ., ' "::":!:: ', ', ':h •
, ,- , ,. .,,:.'.; .... • ,... 'f
. _ ,- . -. ,. ...... ,.,. _:.','.:,
I I
I t I I I t I r I I t I I I I I I I I I I t I I l L I t I I .... I
0 10 20 30 40 50 60 70
Frequency, Hz
Figure 29(e). Effect of hub mass on the hub side force balance response due to hub axial force loading.
77

-- BO105
......... SBMR
180
o 90
_. -90
-180
101
-_ 100
e-,
10-1
, , I
0 10 20 30 40 50 60 70
Frequency, Hz
Figure 30(a). Effect of hub mass on the hub normal force balance response due to hub normal force loading.
-- BO105......... SBMR
180
90
ot_e-
_. -90
-180
101
10o
._ 10-1
e-
10 -2
10-3
0
, , _ , I t , , , l , , , , I .... I , j t i I i i , I I , = = t l
I0 20 30 40 50 60 70
Frequency, Hz
Figure 30(b). Effect of hub mass on the hub pitch moment balance response due to hub normal force loading•
78
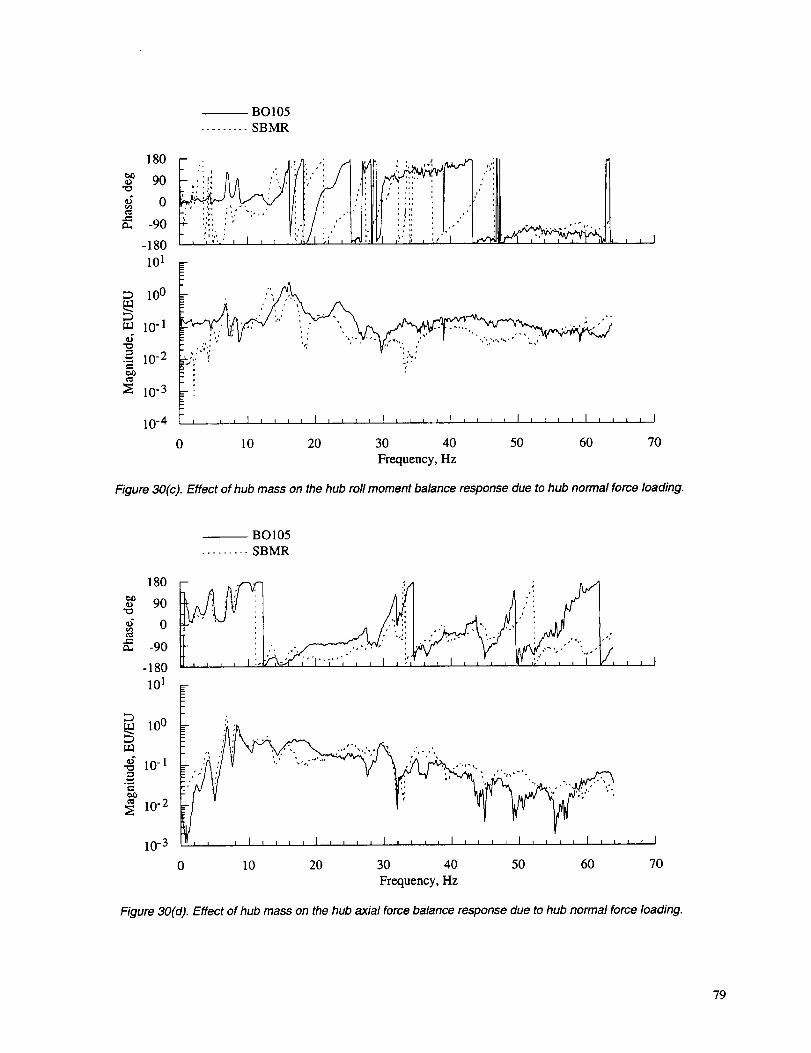
BO105
......... SBMR
180
e_O 90
ot_
¢. -90
-180
101
100
_ 10-1
-._ 10-2
_ 10-3
10_4 ,,. 1
0 10 20 30 40 50 60 70
Frequency, Hz
,It]
Figure 30(c). Effect of hub mass on the hub roll moment balance response due to hub normal force loading.
-- BO105
......... SBMR
180
_) 90
o
_. -90
-180
101
10o
._ 10-1
.5
_ 10 -2
10-3
0
; : , ,-, , ". .
, , , , 1 1 i i , 1 1 , , , i , i , , 1 I , 1 1 1 1 , , , I , , I t I
10 20 30 40 50 60 70
Frequency, Hz
Figure 30(d). Effect of hub mass on the hub axial force balance response due to hub normal force loading.
?9

-- BO105
......... SBMR
180
o 90
o¢,,,_. -90
-180
. s: '.,' " - , .: i, .", ,':
, r',.
100 =-
10-1
"O
10 -2
10-3
, , I
, , , L t , , I , I , I , , I I , I , I , I I _ I i , i i I , i , i I
I0 20 30 40 50 60 70
Frequency, Hz
Figure 30(e). Effect of hub mass on the hub side force balance response due to hub normal force loading.
80

-- BO105
......... SBMR
180
o 90
g oe-,=. -90
-180
t I
1 I I
101 -
•_ 1002
t_
10-1
10 20 30 40 50 60 70
Frequency, Hz
Figure 31(a). Effect of hub mass on the hub normal force balance response due to forward hub pitch moment loading.
-- BO105
......... SBMR
180
_0 90
_ o
-90
-180I I I
102 =-
101
100t_
10-1 ,,, , I l i,, I L,,, I, I, i I T,, t I'''' I I, r , I
0 10 20 30 40 50 60 70
Frequency, Hz
Figure 31(b). Effect of hub mass on the hub pitch moment balance response due to forward hub pitch moment loading.
81

-- BO105
......... SBMR
t_e-.
g_
180 .... +
90 : :,' ' .' ' .'. ..,"' . : ,,h ..-, ' • .' ".'.t " ' ' '
0
-90
-180 , ,
101 .-
10o
10 -1
10-2
• ...... ,'
.... I .... g r i i i I i i r l I i l r i I i t i l 1 1 i i i I
0 10 20 30 40 50 60 70
Frequency, Hz
Figure 31(c). Effect of hub mass on the hub roll moment balance response due to forward hub pitch moment loading.
-- BO105......... SBMR
180
_tjo 90
o
a. -90
-180
101
10o
N 10-1
lO-2
_ 10-3
10-4
0
, i t
.... I I i _ _ I , _ , , I , , , I I I I * , I , , , , 1 , , , t I
10 20 30 40 50 60 70
Frequency, Hz
Figure 31(d). Effect of hub mass on the hub axial force balance response due to forward hub pitch moment loading•
82

-- BO105
......... SBMR
180
90
ot_
m -90
-180
101
10o
._ 10-1
_ 10 -2
10-3 i i i I i p I, I i : i r I i i t I I I I I I I I I I I I i i i I I
10 20 30 40 50 60 70
Frequency, Hz
Figure 31(e). Effect of hub mass on the hub side force balance response due to forward hub pitch moment loading.
83

BO105
......... SBMR
180II0o 90
oe-,_. -90
-180
101 -
tr3,ff._ 100
10-1
0
a I, _ I,,, l I,, , t I,,,, I , , , , I , , , , I , , , , I
10 20 30 40 50 60 70
Frequency, Hz
Figure 32(a). Effect of hub mass on the hub normal force balance response due to hub roll moment loading.
-- BO105
......... SBMR
180
90
o
-90
-180
101
10o
.5_ 1o-l
10-2
_.-=
, , I
, , i , I , , , , I , , , , I , , , , I , , j , I , i , , I , , , , I
10 20 30 40 50 60 70
Frequency, Hz
Figure 32(b). Effect of hub mass on the hub pitch moment balance response due to hub roll moment loading.
84
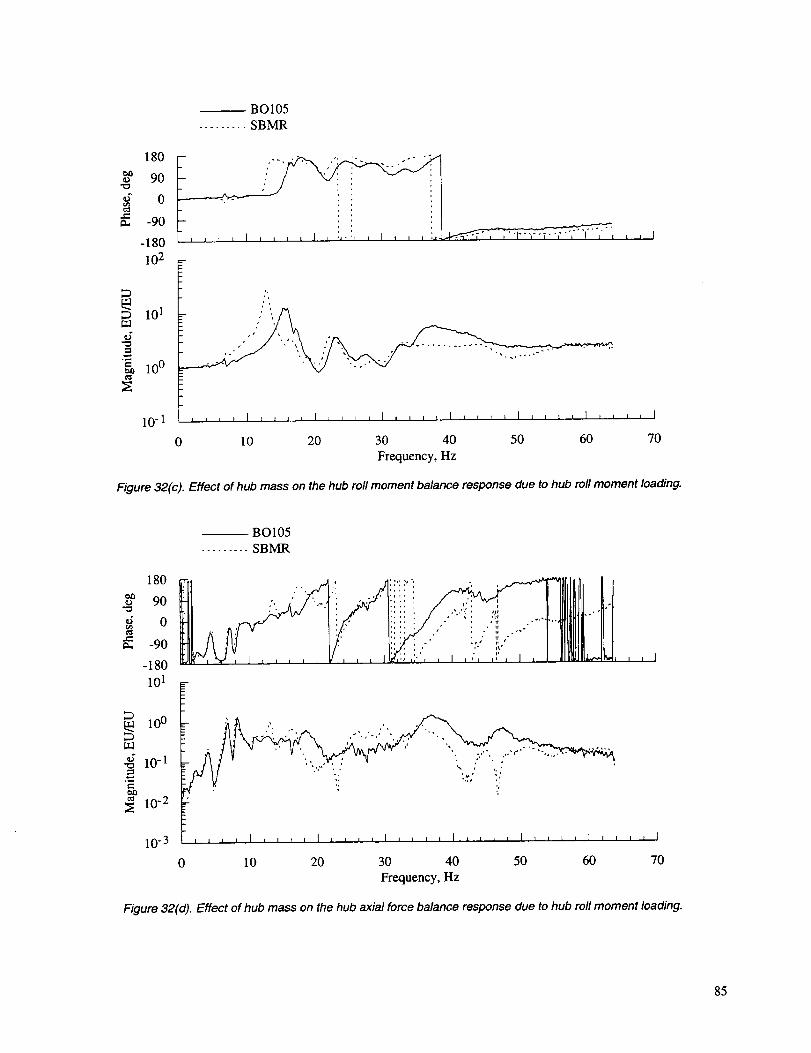
BO105
......... SBMR
180
90
g oe_¢_ -90
-180
10 2 _-
101r.rd¢i
100
10-1
0
i i i t I i r i i I J i i i I i i i _ I i t r L I .... I , , , , I
10 20 30 40 50 60 70
Frequency, Hz
Figure 32(c). Effect of hub mass on the hub roll moment balance response due to hub rofl moment loading.
BO105
......... SBMR
180
e,,o,_ 90
oc_
_. -90
-180
10 i
10oud
x_" 10 -1
N 10-2
10-3
,,,I
F
0
,, r , I i, r, I,, i, I,,,, I i t L, I I I L, I , , i z I
10 20 30 40 50 60 70
Frequency, Hz
Figure 32(d). Effect of hub mass on the hub axial force balance response due to hub roll moment loading.
85

-- BOI05
......... SBMR
180
,a 90
o
-90
-180
: ,,., ...... .- ..•..
, , , .- --° ,,•.,.
L.", : ',:'. , :" ' "'
101
E100
•_ 10-1
_ 10 -2
10-3
10 20 30 40 50 60 70
Frequency, Hz
Figure 32(e). Effect of hub mass on the hub side force balance response due to hub roll moment loading.
86
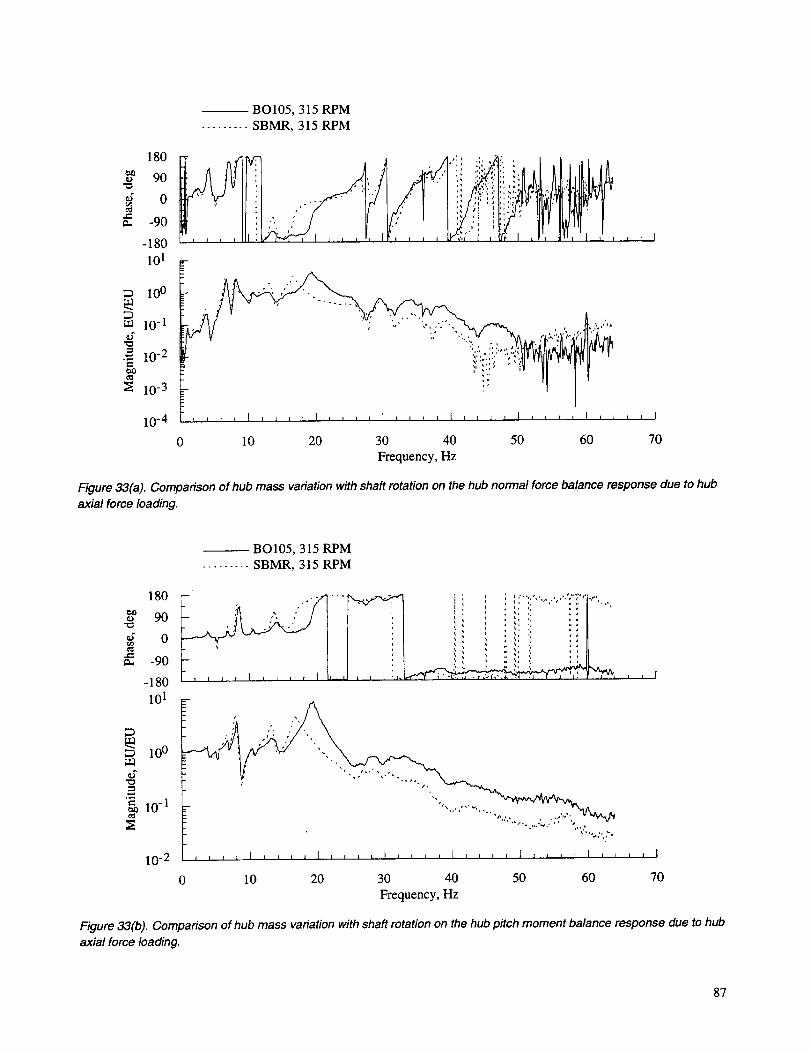
-- BO105, 315 RPM
......... SBMR, 315 RPM
180
Or)o 90
0e-_. -90
-180
101
100
10-1@
._ 10-2
N 10-3
10-4
, , I
__r
• , ,,,, t ,, • '
,,, ,.y,,, ; ,'..
I I r I I r L i i I i i _ i 1 , i i i I i 1 J t I i I I I I I J I I I
0 10 20 30 40 50 60 70
Frequency, Hz
Figure 33(a). Comparison of hub mass variation with shaft rotation on the hub normal force balance response due to hub
axial force loading.
BO105, 315 RPM
......... SBMR, 315 RPM
180
o 90
od 0
-90
-180
101
100
g_ lO-_
10-2
i i: i:: :i ::
,' °¢°
"',:,.,_:. :..
I r r I ] I t I I I I I I I } I I 1 I [ I t I I I t I I I I I I I I I
0 10 20 30 40 50 60 70
Frequency, Hz
Figure 33(b). Comparison of hub mass variation with shaft rotation on the hub pitch moment balance response due to hub
axial force loading.
87

-- BO105, 315 RPM
......... SBMR, 315 RPM
180
,a 90
oe,,_. -90
-180
10o
10.1to
._ 10-2
"r.
_ 10 -3
10-4
I , I
0
L i r, I _ I I I I ; I I I I ; I I, I .... t, ,, , I, I I I I
10 20 30 40 50 60 70
Frequency, Hz
Figure 33(c). Comparison of hub mass variation with shaft rotation on the hub roll moment balance response due to hubaxial force loading.
-- BO105, 315 RPM
......... SBMR, 315 RPM
180t_0,_ 90
oe-,0, -90
-180
102
, i I
101to
-_ 100
_ 10 -l
10-2 ,,,, I I, I I I,, I I I I,, I I r J , , I I I I I I , = r , I
10 20 30 40 50 60 70
Frequency, Hz
Figure 33(d). Comparison of hub mass variation with shaft rotation on the hub axial force balance response due to hubaxial force loading.
88

--BO105, 315 RPM
......... SBMR, 315 RPM
e-
180 . ": ,.,.:'!!'i
90 .... . :',,. .;.
0 ' ' ' : _'. " ', ,:
-90
-180
101 _-
, , I
10otr3_5
_ lO-1
' t I I I I
10-2
0 10 20 30 40 50 60 70
Frequency, Hz
Figure 33(e). Comparison of hub mass variation with shaft rotation on the hub side force balance response due to hub
axial force loading.
89

BO105, 315 RPM
......... SBMR, 315 RPM
180
,_ 90
_ o
-90
-180
101
._ 100
10-1
, , I
0
.... I .... J , , l , I , , , , I , , , , I i , , , I , , , , I
10 20 30 40 50 60 70
Frequency, Hz
Figure 34(a). Comparison of hub mass variation with shaft rotation on the hub normal force balance response due to hubnormal force loading.
BO105, 315 RPM
......... SBMR, 315 RPM
180_at)
90
o
m -90
-180
101
10 o
._ 10-1
10 -2
10-3
I I I , , I
0
.,. .:.,_i_ .:'"" :" ,:...... .. ,""., ,.
, , I , I , I , i 1 1 + + , l , = , , I [ J , i I , , , , I t , = , I
10 20 30 40 50 60 70
Frequency, Hz
Figure 34(b). Comparison of hub mass variation with shaft rotation on the hub pitch moment balance response due to hubnormal force loading.
90

-- BO105, 315 RPM
......... SBMR, 315 RPM
180
90
g oc_¢-
-90
-180
101 ___---
i l I
10o
._ 10-1
e-,
_ 10 -2
10-3
0
," !
, r ,, I L ,, : I A, ,, I t =, _ I , i, I i, L , i I .... I
10 20 30 40 50 60 70
Frequency, Hz
Figure 34(c). Comparison of hub mass variation with shaft rotation on the hub roll moment balance response due to hub
normal force loading.
BO105, 315 RPM
......... SBMR, 315 RPM
180
90
0
t...-a, -90
-180
101
10o
m 10-1@
-_ 10-2e-,
_ 10-3
10-4
0
, , J , I , , , , I I J , , I , k t , I = i s t I , , , t I .... I
10 20 30 40 50 60 70
Frequency, Hz
Figure 34(d). Comparison of hub mass variation with shaft rotation on the hub axial force balance response due to hub
normal force loading.
91

-- BO105, 315 RPM
......... SBMR, 315 RPM
180
90
oe,,
_. -90
-180
101
10o
m 10-1
lO-2
10-3
10-4
, , 1
z, i i I,,,, I, j i, l,,,, I t,,, I, ,,, I .... I
10 20 30 40 50 60 70
Frequency, Hz
Figure 34(e). Comparison of hub mass variation with shaft rotation on the hub side force balance response due to hubnormal force loading.
92

-- BOI05, 315 RPM
......... SBMR, 315 RPM
180
o 90
g o
-90
-180
101 -
, , I
,#•_ 100
10-1 j , , , I , , , _ I , , , , I , , , , I , , , , I , , , , I , , , , I
10 20 30 40 50 60 70
Frequency, Hz
Figure 35(a). Comparison of hub mass variation with shaft rotation on the hub normal force balance response due toforward hub pitch moment loading.
-- BO105, 315 RPM
......... SBMR, 315 RPM
180
o 90
g oa. -90
-180
102 _-
101
100
10-1
10 20 30 40 50 60 70
Frequency, Hz
Figure 35(b). Comparison of hub mass variation with shaft rotation on the hub pitch moment balance response due to
forward hub pitch moment loading.
93

--BOI05, 315 RPM
......... SBMR, 315 RPM
180
90
ot_
_, -90
-180
101
100
,==lO-1
10-2
, , I
, , , I .... I _ I I I I J I i I I J I I I t 1 J I I I i I i i I
10 20 30 40 50 60 70
Frequency, Hz
Figure 35(c). Comparison of hub mass variation with shaft rotation on the hub roll moment balance response due toforward hub pitch moment loading.
-- BO105, 315 RPM
......... SBMR, 315 RPM
180
_0o 90
ot_e-
ra -90
-180
I01
10o
m 10-1
._ 10-2
c_
10-3
10"4 , , _ _ I .... I , , _ i I , , , I [ , , , i I _ , , , I , , , , I
10 20 30 40 50 60 70
Frequency, Hz
Figure 35(d). Comparison of hub mass variation with shaft rotation on the hub axial force balance response due to forwardhub pitch moment loading.
94

BO105, 315 RPM
......... SBMR, 315 RPM
180
o 90
oe-,_., -90
-180
101
, I
10o
10_1
,ff
.== 10-2
10-3
10-4 l i1111111111riillr a [i+l t [I A A i (' ' l I [
10 20 30 40 50 60 70
Frequency, Hz
Figure 35(e). Comparison of hub mass variation with shaft rotation on the hub side force balance response due to forward
hub pitch moment loading.
95

-- BO105, 315 RPM
......... SBMR, 315 RPM
O
t_e=
eL 190 .. . ..... .°-
-90
-180 I , , , ,
101 -
m
•_ 100
10-1 I i I I I J I i I I I i I i I I t I i I I I _ , I , , , , I , , , , I
10 20 30 40 50 60 70
Frequency, Hz
Figure 36(a). Comparison of hub mass variation with shaft rotation on the hub normal force balance response due to hubroll moment loading.
-- BOI05, 315 RPM
......... SBMR, 315 RPM
180
,_ 90
o
a, -90
-180
101
10o
m 10-]
._ 10-2
10-3
10-4
..... ' 4:,
I I I
I I * I F I , , I I , = , t I , t , I I r , I i I , , = , I , t L , I
10 20 30 40 50 60 70
Frequency, Hz
Figure 36(b). Comparison of hub mass vatYationwith shaft rotation on the hub pitch moment balance response due to hubroll moment loading.
96

BO105, 315 RPM
......... SBMR, 315 RPM
180
,_ 90
oe-_, -90
-180
102 .--
101
10 0
10-1
0
l ,, L }, L, , [ , i i , I , r , , I , L , , I t , , , I , , , t I
10 20 30 40 50 60 70
Frequency, Hz
Figure 36(c). Comparison of hub mass variation with shaft rotation on the hub roll moment balance response due to hub
roll moment loading.
-- BO105, 315 RPM
......... SBMR, 315 RPM
180
o 90
o_, -90
-180
101
• , ',,-', .... _,,; :,
, , I
10o
i0_1
lO-2e-_0
10-3
10-4 ,, l, I,,,, I J,,, I, J J, I _, ,, I,,, , I , , 1 , I
10 20 30 40 50 60 70
Frequency, Hz
Figure 36(d). Comparison of hub mass variation with shaft rotation on the hub axial force balance response due to hub roll
moment loading.
9?

BO105, 315 RPM
......... SBMR, 315 RPM
180
o 90
oc_
_, -90
-180
101
10o
_ lO_l
lO-2ols
10-3
10-4
uL,.'l'_'_-_...;_ , _ I
I I,, I a I I I I L I I I I I : : i I i i * i I,, *, I _,,, I
10 20 30 40 50 60 70
Frequency, Hz
Figure 36(e). Comparison of hub mass variation with shaft rotation on the hub side force balance response due to hub rollmoment loading.
98

180
90
oe-,_. -90
-180
101 -
i , I
•_ 100
e,,,,,
10-1 l L ,, I I , I z I i, , I I T I l L I i i , i I J I I ,
10 20 30 40 50 60
Frequency, Hz
lllll
70
Figure 37(a). Hub normal force balance response due to push rod number 1 loading.
180
90
oe-,_. -90
-180
102 .-
101
t--,¢_ 100
10-1 ,,, , I,,, , I , L,, I,,,, I J,, I I, , 2 , I I I I I
0 10 20 30 40 50 60 70
Frequency, Hz
Figure 37(b). Hub pitch moment balance response due to push rod number I loading.
99

180
,_ 90
o-90
-180
101
•_ 100
r-
10-I
, I I
II I t [ Ill r I Jl I I I _ ,,, 1,,,, I .... I, J I I I
0 10 20 30 40 50 60 70
Frequency, Hz
Figure 37(c). Hub roll moment balance response due to push rod number I loading.
180
90
g o-90
-180
101
10ou_
•_ 10-1
:_ 10 -2
10-3
i
'l I , I I I J * r I _ , i , I i t i i f , i i i I , _ , , I .... t
0 10 20 30 40 50 60 70
Frequency, Hz
Figure 37(d). Hub axial force balance response due to push rod number I loading.
100

180
o 90
_ 0 ,-90
-180 ,, t
I00
10_1
"_ 10-2
10-3
0 10 20 30 40 50 60 70
Frequency. Hz
Figure 37(e). Hub side force balance response due to push rod number 1 loading.
180 I
o 90
o
_. -90
-180 ' '' '
102 .-
10 !
.3
.5100
10-1
! , , , , I , , , _ I , L , , I , , _, , t I
10 20 30 40 50 60 70
Frequency, Hz
Figure 37(f). Push rod 1 response due to push rod number I loading.
101

180o 90
oc_
=_ -90
-180
101 -
, , I
m
100
e-,
10-1
0
, , , , I , , , , I , , J , I , , , , I , , i = I _ , , _ I , , _ , I
10 20 30 40 50 60 70
Frequency, Hz
Figure 38(a). Hub normal force balance response due to push rod number 2 loading.
180
90
o
a. -90
-180
lO2 =--
, , I
101
e- 100e_
10-1 , , A L I , z K I I , , L , I , , _ , I , , , , I , , , , I .... I
10 20 30 40 50 60 70
Frequency, Hz
Figure 38(b). Hub pitch moment balance response due to push rod number 2 loading.
102

180o 90
0c_
-90
-180
101
-_ lO 0
10-1
I I I
F
0 10 20 30 40 50 60 70
Frequency, Hz
Figure 38(c). Hub roll moment balance response due to push rod number 2 loading.
180
90
o
-90
-180
101
10o
._ 10-1
o_
10 -2
10-3
i i 1
_r
I I I I I I I I I I I I I I I J I I J I .... I , , , , I , , , I 1
0 I0 20 30 40 50 60 70
Frequency, Hz
Figure 38(d). Hub axial force balance response due to push rod number 2 loading.
103
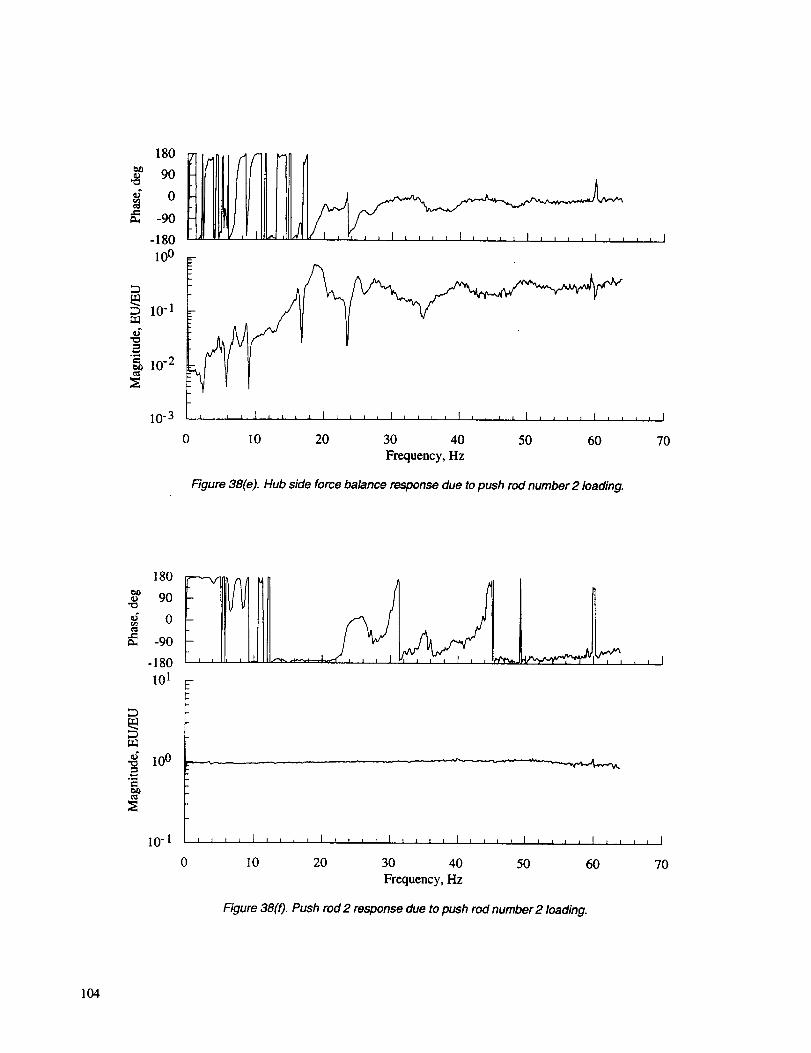
180
90"0
g oe-,
-90
-180
10o
10.1
,3
lO"2o_
10-3
0
, , I
: , I J I , r, *I , li, I,, , ,I , I , , I .... I .... I
10 20 30 40 50 60 70
Frequency, Hz
Figure 38(e). Hub side force balance response due to push rod number 2 loading.
180
90
oe-,_, -90
-180
101 -
•_ 10 0.-,l
,e-
c_
10-1
t I I
0
I , I I 1 i i i i I i ' I I I i i , i [ i i i l I i i i i I i i i i I
10 20 30 40 50 60 70
Frequency, Hz
Figure 38(0. Push rod 2 response due to push rod number 2 loading.
104

180
o 90
oe-
-90
-180 I I I
101 -
•_ 100
10-1 K I, J I , i , , I , i , , ] , , , , I , , , , I , I , t I , I , , I
10 20 30 40 50 60 70
Frequency, Hz
Figure 39(a). Hub normal force balance response due to push rod number 3 loading.
180
90
o
-90
-180
102
101
o"_= 100
¢-
N 10-1
10-2
i I I
,,,, I, L,, I ,, i, I, I, L I ,,, , I k L f , I,, L , I
0 10 20 30 40 50 60 70
Frequency, Hz
Figure 39(b). Hub pitch moment balance response due to push rod number 3 loading.
105

18090
_ o
m -90
-180
101 -
100
._
I0-1
o 10 20 30 40 50 60
Frequency, Hz
Figure 39(c). Hub roll moment balance response due to push rod number 3 loading.
iii
180
==0o 90
_d or.=. -90
-180
101
100
o"•m 10 -l
e_
:_ lo -2
10-3
, , I
0 I0 20 30 40 50 60 70
Frequency, Hz
Figure 39(d). Hub axial force balance response due to push rod number 3 loading.
106
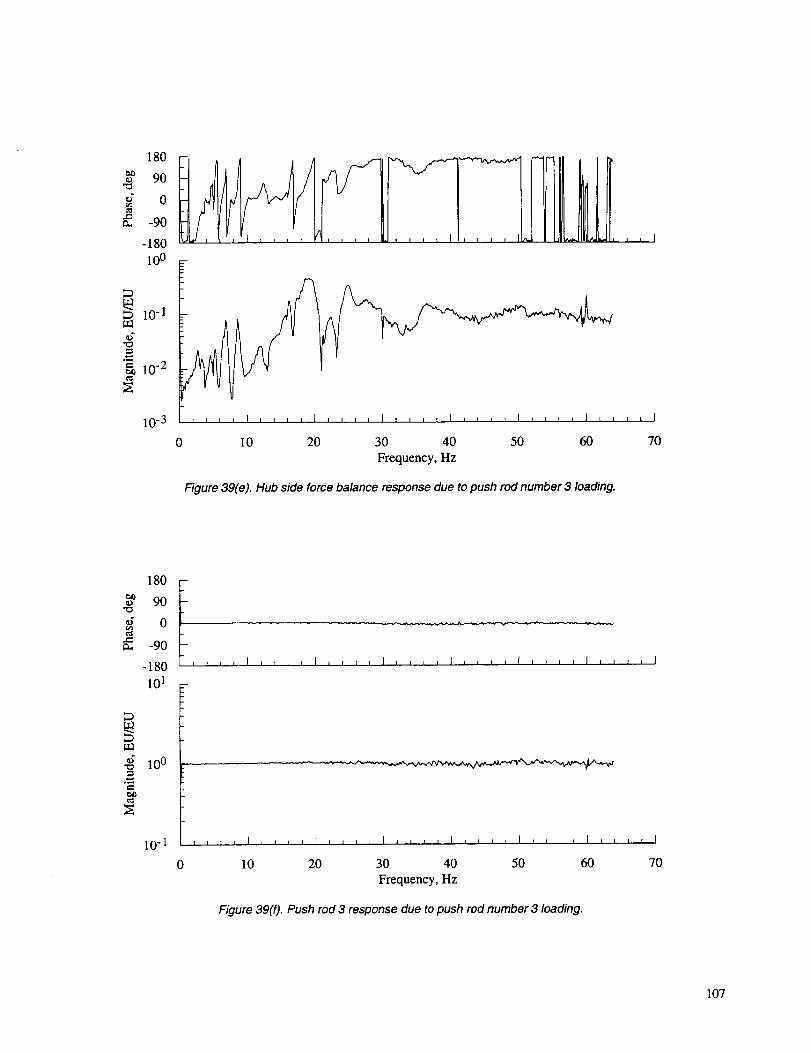
180
90
oe-,0. -90
-180
100 _-
, , I
10_1
10 -2
10-3 I tl t IIIIII rllltlllltlIllll I i l I l _ l l I
0 I 0 20 30 40 50 60 70
Frequency, Hz
Figure 39(e). Hub side force balance response due to push rod number 3 loading.
180 I
o 90
oe_
_, -90
-180 i i / I
101 -
._ 100
10-1
0
I , , , , I , , t I I I _ t I I J I t I ( I t I t I r I I I I
t I I I I I I I I I I I I I I I I _ I I I I I I [ I I I 1 I I I I I [
10 20 30 40 50 60 70
Frequency, Hz
Figure 39(f). Push rod 3 response due to push rod number 3 loading.
107

Form Approved
REPORT DOCUMENTATION PAGE OleNo. o7o4-o188Public reportingburden for thiscollection of informationis estimated to average 1 hour perresponse, includingthe time for reviewing instructions,searching existingdata sources,gathering and maintaining the data needed, and completing and reviewingthe collectionof information. Send comments regardingthis burdenestimate or any other aspect of thiscollection of information,includingsuggestions for reducingthis burden, to WashingtonHeadquartersServices, Directoratefor information Operations and Reports, 1215 JeffersonDavis Highway, Suite 1204. Arlington,VA 22202-4302. and to the Office of Managementand Budget, PaperworkReductionProject (0704-0188), Washington, DC 20503.
1. AGENCY USE ONLY (Leave blank) 2. REPORT DATE 3. REPORT TYPE AND DATES COVERED
April 1996 Technical Memorandum4. TITLE AND SUBTITLE 5. FUNDING NUMBERS
Dynamic Calibration of the NASA Ames Rotor Test Apparatus
Steady/Dynamic Rotor Balance
6. AUTHOR(S)
Randall L. Peterson and Johannes M. van Aken*
7. PERFORMING ORGANIZATION NAME(S) AND ADDRESS(ES)
Ames Research Center
Moffett Field, CA 94035-1000
9. SPONSORING/MONITORINGAGENCY NAME(S)AND ADDRESS(ES)
National Aeronautics and Space Administration
Washington, DC 20546-0001
505-59-36
8. PERFORMING ORGANIZATIONREPORT NUMBER
A-961452
10. SPONSORING/MONITORINGAGENCY REPORT NUMBER
NASA TM-110393
11. SUPPLEMENTARY NOTES
Point of Contact: Randall L. Peterson, Ames Research Center, MS T-I2B, Moffett Field, CA 94035-1000
(415) 604-5044
*Sterlin_ Federal S_,stems, Inc., Palo Alto, California12a. DISTRIBUTION/AVAILABILITY STATEMENT 12b. DISTRIBUTION CODE
Unclassified -- Unlimited
Subject Category 05
13. ABSTRACT (Maximum 200 words)
The NASA Ames Rotor Test Apparatus was modified to include a Steady/Dynamic Rotor Balance.
The dynamic calibration procedures and configurations are discussed. Random excitation was applied at
the rotor hub, and vibratory force and moment responses were measured on the steady/dynamic rotor
balance. Transfer functions were computed using the load cell data and the vibratory force and moment
responses from the rotor balance. Calibration results showing the influence of frequency bandwidth, hub
mass, rotor RPM, thrust preload, and dynamic loads through the stationary push rods are presented anddiscussed.
14. SUBJECT TERMS
Rotor balance, Rotor loads, Balance calibration, Dynamic response
17. SECURITY CLASSIFICATION
OF REPORT
Unclassified
NSN 7540-01-280-5500
18. SECURITY CLASSIFICATIONOF THIS PAGE
Unclassified
15. NUMBER OF PAGES
1]016. PRICE CODE
A0619. SECURITY CLASSIFICATION 20. LIMITATION OF ABSTRACT
OF ABSTRACT
Standard Form 298 (Rev. 2-89)Prescribed by ANSI Std, Z39-18

