nasa-isro sar mission: sensors and potential applications
TRANSCRIPT
NASA-ISRO SAR Mission: Sensors and Potential ApplicationsPaul A Rosen, Scott Hensley, Scott Shaffer, Wendy Edelstein, Yunjin Kim, Dankai Liu, Pam Hoffman, Phil Barela, Peter XaypraseuthJet Propulsion Laboratory, California Institute of Technology
Raj Kumar, Tapan Misra, Rakesh Bhan Raju SagiISRO Space Applications Centre ISRO Satellite Centre
Asian Conference on Remote Sensing 2017New Delhi, IndiaOctober 24, 2017
Copyright 2017 California Institute of Technology. Government sponsorship acknowledged.

NISAR Mission Overview
• Major partnership between US National Aeronautics and Space Administration (NASA) and Indian Space Research Organisation (ISRO)
• Baseline launch date: No earlier than December 2020• Dual frequency L- and S-band Synthetic Aperture
Radar (SAR)• L-band SAR from NASA and S-band SAR from ISRO
• NASA 4 Gbps Ka-band telecom system to polar ground stations (> 26 Tbits/day downlink capability)
• ISRO I3K Spacecraft with 2.8 Gbps telecom system• ISRO Geosynchronous Satellite Launch Vehicle
(GSLV) Mark-II (4-m fairing)• 3 years NASA science operations (5+ years
consumables)• All science data (L- and S-band) will be made available
free and openSurface deformation; geo-hazards; water resource management
Ice velocity, thickness; response of ice sheets to climate change and sea level rise
Biomass disturbance; effects of changing climate on habitats and CO2
Ecosystem Structure
Cryosphere
Solid Earth
Mission Science

NISAR Mission Objectives Responsive to US National AcademyKey Scientific Objectives:
• Understand the response of ice sheets to climate change and the interaction of sea ice
and climate
• Understand the dynamics of carbon storage and uptake in wooded, agricultural, wetland,
and permafrost systems
• Determine the likelihood of earthquakes, volcanic eruptions, and landslides
Key Applications Objectives:• Understand societal impacts of dynamics of groundwater, hydrocarbon, and sequestered
CO2 reservoirs
• Provide agricultural monitoring capability in support of food security objectives
• Apply NISAR’s unique data set to explore the potentials for urgent response and hazard
mitigation
To be accomplished in partnership with the Indian Space Research Organisation
(ISRO) through the joint development and operation of a space-borne, dual-
frequency, polarimetric, synthetic aperture radar (SAR) satellite mission with
repeat-pass interferometry capability

ISRO Science and Applications Objectives
NISAR Science & Mission Systems FTM: Jul 10-12, 2017, SAC
1. Ecosystem Structure: 1.1 Agriculture Biomass & Crop Monitoring; 1.2 Forest Biomass; 1.3Biomass Change; 1.4 Mangroves / Wetlands; 1.5 Alpine Vegetation; #Vegetation Phenology andVulnerability; #Vegetation soil moisture; #Ecosystem stress assessment.
2. Land Surface Deformation: 2.1 Inter-seismic / Co-seismic Deformations; 2.2 Landslides; 2.3 LandSubsidence; 2.4 Volcanic Deformations
3. Cryosphere: 3.1 Polar Ice Shelf / Ice sheet; 3.2 Sea Ice Dynamics; 3.3 Mountain Snow/ Glacier 3.4Glacier Dynamics (Himalayan Region); #Glacier hazards; #Climate response to glaciers; #Advisory onsafer marine navigation and sea ice.
4. Coastal Studies & Oceanography: 4.1 Coastal erosion / shoreline change; 4.2 Coastalsubsidence and vulnerability to sea-level rise; 4.3 Coastal bathymetry; 4.4 Ocean surface wind; 4.5Ocean wave spectra; 4.6 Ship detection; #Possible use of SAR for tropical cyclone; #Coastal watchservices
5. Disaster Response: 5.1 Floods; 5.2 Forest Fire; 5.3 Oil Spill; 5.4 Earthquakes / Others
6. Geological Applications: 6.1 Structural & Lithological mapping; 6.2 Lineament mapping; 6.3Paleo-Channel study; 6.4 Geomorphology; #Land degradation mapping; #Geo-archaeology; #Mineralexplorations
NISAR: Proposed Applications
2

NISARNASA-ISRO SAR Mission
NISAR Uniquely Captures the Earth in Motion
NISAR Characteristic: Enables:
L-band (24 cm wavelength) Low temporal decorrelation and foliage penetration
S-band (12 cmwavelength)
Sensitivity to lighter vegetation
SweepSAR technique withImaging Swath > 240 km
Global data collection
Polarimetry(Single/Dual/Quad)
Surface characterization and biomass estimation
12-day exact repeat Rapid Sampling
3 – 10 meters mode-dependent SAR resolution
Small-scale observations
Pointing control < 273arcseconds
Deformation interferometry
Orbit control < 500 meters Deformation interferometry
L/S-band > 50/10% observation duty cycle
Complete land/ice coverage
Left/Right pointing capability
Polar coverage, north and south

NISAR SweepSAR• SweepSAR allows simultaneous
• Wide swath• Fine resolution• polarimetry
• SweepSAR method:• Transmit pulse with full feed illumination• Track echo digitally with individual
receivers (12 at L-band; 24 at S-band)• Assemble individually received signals
into a full-swath measurement
• SweepSAR implemented independently by both JPL and ISRO
• But radars are time-synced for dual-frequency operations
~236 km Earth-fixed ground track spacing at equator for 12-day repeat orbit

NISAR Instrument Overview
Radar Antenna Reflector
Radar Antenna Boom
Radar AntennaStructure
Boom AttachPoint
S-SAR Feed RFAperture
L-SAR Digital Signal Proc Electronics
S-SAR Electronic
s(Inside)
L-SAR RadarInstrument Controller
and RF Back-End(inside)
L-SAR TransmitReceive Modules
Instrument Subsystems:• L-Band SAR (JPL)• S-Band SAR (ISRO)• Instrument Structure (JPL)• Radar Antenna (JPL)
L-SAR Feed RFAperture
Instrument Structure also houses GPS unit and Solid State Recorder

Progress in Development Phase CL-band SAR Hardware (1/2)
Prototype and Pathfinder
TRMs
EM TRM-ESSEM Front-End
Subassembly (FES)TRM Pathfinder EM
EM QFSP
EM RIC-PCU
EM RIC-CTB EM RIC-SIF
EM RBE Stack
EM WaveformGenerator
EM Up ConverterDriver
EM FrequencySynthesizer EM RBE-PCU
EM RIC-HKT
EM SSP
Digital Signal Processor
RIC- RAD750 QualModel
FM RIC-NVM (SEAKR)

Progress in Development Phase CL-band SAR Hardware (2/2)
Feed Tile EM(without radome)
Boom and Hinge Development Hardware
10” Development Boom Stability Test
7” Prototype Boom/Hinge in fabrication
Hinge Deploy & Latching H/W
PT Spring Assemblies
Boom Harness Torque Test
Boom Actuator PT
L-FRAP Feed Tile Development Hardware
Hinge Spring Cartridge Torque Test
Feed Array EM in Test
Prototype 7” Spring/Damper Deploy Test

Front-end Radiating Aperture S-band Development and Joint L+S compatibility
NISAR Project Assessment Meeting @ ISAC – 13th July 2017 S-SAR Development Status- 4
SFRAp Development
• S-FRAp DVM – Delivered• Radiation pattern characterization of DVM S-FRAp with JPL L-FRAp - Complete• QA approval of QM S-FRAp drawings (Elec. & Mech.) - In progress
• PT 210 Cable delivery confirmed by vendor
• Fabrication process qualification – in progress
• Multipaction test on 1/3 antenna tile – in progress
• QA Clarence - torqueing on TNC connector
• Bending radius relaxed to 60mm
DVM Antenna TilesS-band
L-band aperture
L+S structure

NISAR Observatory

NISAR Imaging and Orbit Geometry74
7 km
Earth surface
Observation Geometry
>240 km
12 m diameter Reflector
33o
47o 6 AM / 6 PM Orbit98.5o inclinationArctic Polar Hole: 87.5R/77.5LAntarctic Polar Hole: 77.5R/87.5L
• Wide swath in all modes• Data acquired ascending and descending• Left/right pointing capability
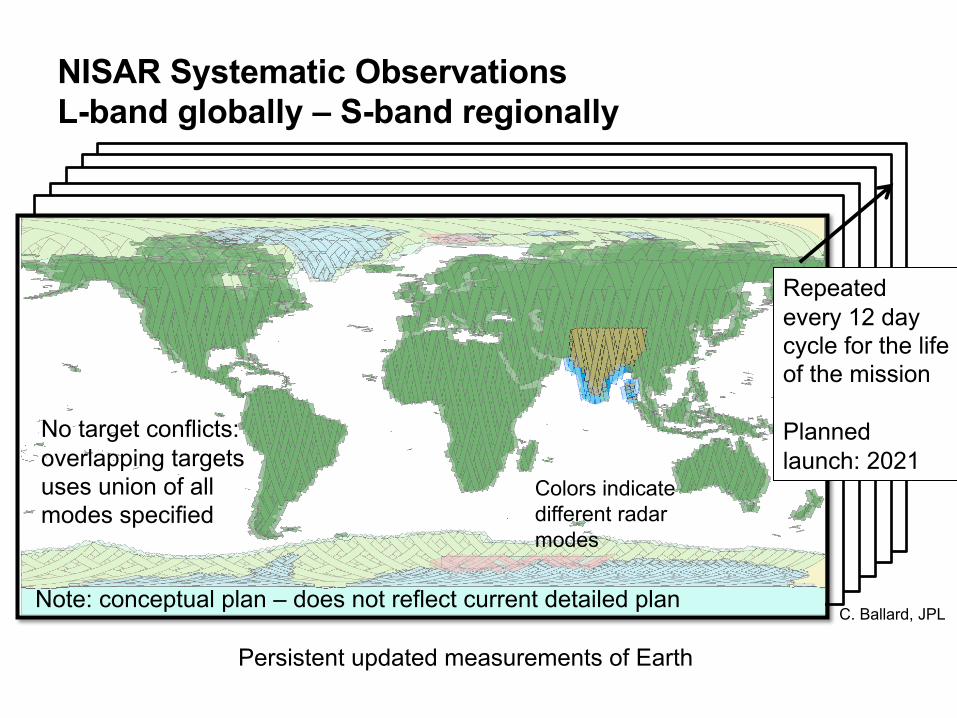
NISAR Systematic ObservationsL-band globally – S-band regionally
Repeated every 12 day cycle for the life of the mission
Planned launch: 2021
C. Ballard, JPL
No target conflicts: overlapping targets uses union of all modes specified
Persistent updated measurements of Earth
Colors indicate different radar modes
Note: conceptual plan – does not reflect current detailed plan
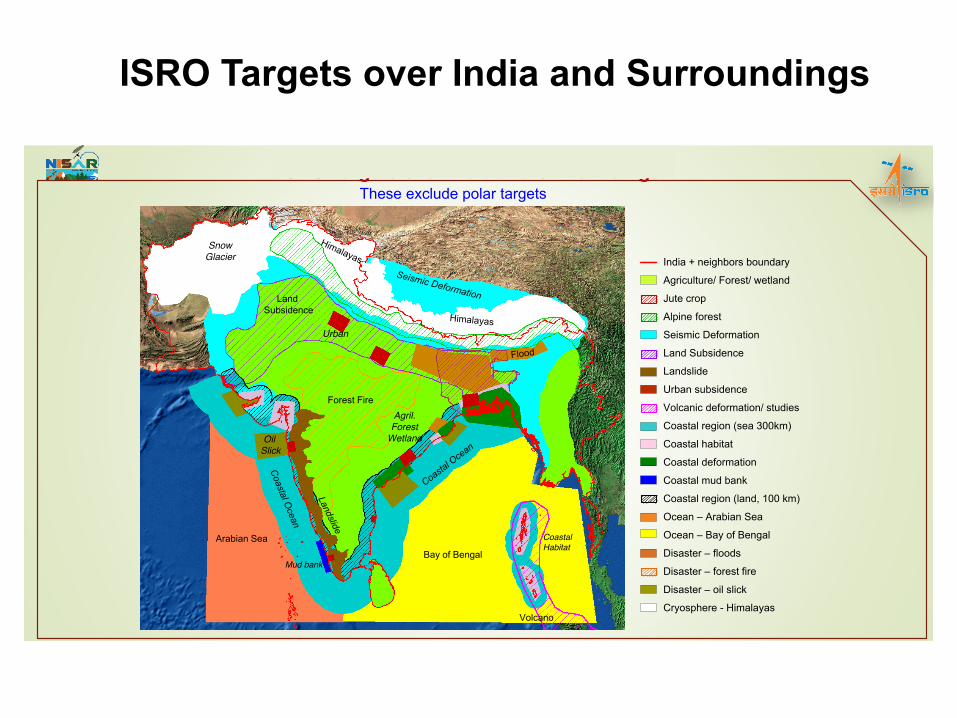
ISRO Targets over India and Surroundings
NISAR Science & Mission Systems FTM: Jul 10-12, 2017, SAC
India + neighbors boundary
Agriculture/ Forest/ wetland
Jute crop
Alpine forest
Seismic Deformation
Land Subsidence
Landslide
Urban subsidence
Volcanic deformation/ studies
Coastal region (sea 300km)
Coastal habitat
Coastal deformation
Coastal mud bank
Coastal region (land, 100 km)
Ocean – Arabian Sea
Ocean – Bay of Bengal
Disaster – floods
Disaster – forest fire
Disaster – oil slick
Cryosphere - Himalayas
ISRO Targets over India and SurroundingsThese exclude polar targets
Arabian Sea
Bay of Bengal
Forest Fire
Land Subsidence
Oil Slick
Agril.Forest
Wetland
SnowGlacier
Mud bank
Coastal Habitat
Volcano
Urban
4
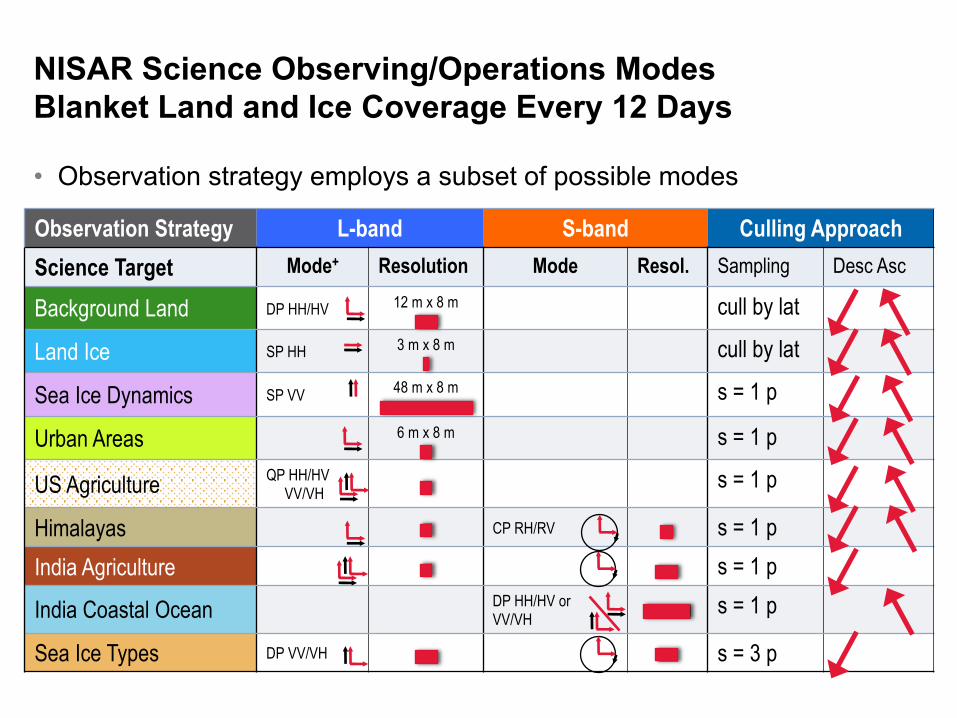
NISAR Science Observing/Operations ModesBlanket Land and Ice Coverage Every 12 Days
• Observation strategy employs a subset of possible modes
Observation Strategy L-band S-band Culling ApproachScience Target Mode+ Resolution Mode Resol. Sampling Desc Asc
Background Land DP HH/HV 12 m x 8 m cull by lat
Land Ice SP HH 3 m x 8 m cull by lat
Sea Ice Dynamics SP VV 48 m x 8 m s = 1 p
Urban Areas 6 m x 8 m s = 1 p
US Agriculture QP HH/HVVV/VH
s = 1 p
Himalayas CP RH/RV s = 1 pIndia Agriculture s = 1 p
India Coastal Ocean DP HH/HV orVV/VH
s = 1 p
Sea Ice Types DP VV/VH s = 3 p 15

NISAR Radar Modes
BW PRF PW Swath L-SAR S-SARL-DataRate
S-DataRate
(MHz) (Hz) [µ sec] [km] DC[W]+ DC[W]# [Mbps] [Mbps]#128 L1 L DPHH/HV 20+5 1650 25 242 1406 635 893 -
129 L QQ 20+5 1650 25 242 635 -
130 L QQ 20+5 1650 20 242 635 -131 L2 L SPHH 80 1650 40 121 1426 635 706 -132 L SPHH 40+5 1650 45 242 635 -133 L SPHH 20+5 1650 25 242 635 -134 L3 L SPVV 5 1600 25 242 1355 635 91 -135 L QDHH/VV 5+5 1650 20 242 635 -136 L4 IndiaLandCharacterization L DPVV/VH 20+5 1650 25 242 635137 L5 L DPHH/HV 40+5 1650 45 242 1495 635 1627 -138 L QQ 40+5 1650 45 242 635 -139 L QQ 40+5 1650 40 242 635 -140 L6 USAgriculture,IndiaAgriculture L QPHH/HV/VH/VV 40+5 1600* 45 242 1683 635 3156 -141 LX USAgriculture,IndiaAgricultureLowRes L QPHH/HV/VH/VV 20+5 1600* 45 242 1683 635 3156 -142 L7 ExperimentalCPmode L CPRH/RV 20+20 1650 40 242 635 -143 L8 ExperimentalQQmode L QQ 20+20 1650 20 242 635 -144 L9 ExperimentalSPmode L SPHH 80 1650 20 242 635 -145 ISROIce/sea-ice L DPVV/VH 5 1650 25 242 635 -146 ISROIce/sea-ice-alternate L QDHH/VV 5 1650 25 242 635 -
64 S1 SolidEarth/Ice/Veg/Coast/Bathym S Quasi-Quad 37.5 2200 10+10 244 1201 1604 - 371465 S2 Ecosystem/CoastalOcean/Cryosphere S DPHH/HV 10 2200 25 244 1201 1836 - 62666 S3 Agriculture/SeaIce S CPRH/RV 25 2200 25 244 1201 3020 - 124267 S4 GlacialIce-HighRes S CPRH/RV 37.5 2200 25 244 1201 3020 - 185768 SX Newmode S DPHH/HV 37.5 2200 25 244 1201 3020 - 185769 S5 Deformation S SPHH(orSPVV) 25 2200 25 244 1201 1563 - 62070 S6 Deformation-MaxRes S SPHH(orSPVV) 75 2200 25 244 1201 1563 - 1857
UrbanAreas,HimalayasSMUrbanAreas,HimalayasSMHiPwr
OpenOcean
LowDataRateStudyModeSinglePolLandIceLowRes
Science Performance Resources
FreqBand
PolarizationConfig.ID
LandIce
BackgroundLand
SeaIceDynamics
UrbanAreas,Himalayas
PrimaryScienceTarget
BackgroundLandSoilMoisture
BackgroundLandSoilMoistureHiPwr
OldMode#

BW PRF PW Swath L-SAR S-SARL-DataRate
S-DataRate
(MHz) (Hz) [µ sec] [km] DC[W]+ DC[W]# [Mbps] [Mbps]#128 L1 L DPHH/HV 20+5 1650 25 242 1406 635 893 -
129 L QQ 20+5 1650 25 242 635 -
130 L QQ 20+5 1650 20 242 635 -131 L2 L SPHH 80 1650 40 121 1426 635 706 -132 L SPHH 40+5 1650 45 242 635 -133 L SPHH 20+5 1650 25 242 635 -134 L3 L SPVV 5 1600 25 242 1355 635 91 -135 L QDHH/VV 5+5 1650 20 242 635 -136 L4 IndiaLandCharacterization L DPVV/VH 20+5 1650 25 242 635137 L5 L DPHH/HV 40+5 1650 45 242 1495 635 1627 -138 L QQ 40+5 1650 45 242 635 -139 L QQ 40+5 1650 40 242 635 -140 L6 USAgriculture,IndiaAgriculture L QPHH/HV/VH/VV 40+5 1600* 45 242 1683 635 3156 -141 LX USAgriculture,IndiaAgricultureLowRes L QPHH/HV/VH/VV 20+5 1600* 45 242 1683 635 3156 -142 L7 ExperimentalCPmode L CPRH/RV 20+20 1650 40 242 635 -143 L8 ExperimentalQQmode L QQ 20+20 1650 20 242 635 -144 L9 ExperimentalSPmode L SPHH 80 1650 20 242 635 -145 ISROIce/sea-ice L DPVV/VH 5 1650 25 242 635 -146 ISROIce/sea-ice-alternate L QDHH/VV 5 1650 25 242 635 -
64 S1 SolidEarth/Ice/Veg/Coast/Bathym S Quasi-Quad 37.5 2200 10+10 244 1201 1604 - 371465 S2 Ecosystem/CoastalOcean/Cryosphere S DPHH/HV 10 2200 25 244 1201 1836 - 62666 S3 Agriculture/SeaIce S CPRH/RV 25 2200 25 244 1201 3020 - 124267 S4 GlacialIce-HighRes S CPRH/RV 37.5 2200 25 244 1201 3020 - 185768 SX Newmode S DPHH/HV 37.5 2200 25 244 1201 3020 - 185769 S5 Deformation S SPHH(orSPVV) 25 2200 25 244 1201 1563 - 62070 S6 Deformation-MaxRes S SPHH(orSPVV) 75 2200 25 244 1201 1563 - 1857
DPHH/HV 20+5 1910^ 25 242CPRH/RV 25 25 244DPHH/HV 20+5 1910^ 25 242DPHH/HV 37.5 25 244DPHH/HV 20+5 1910^ 25 242
SPHH(orSPVV) 25 25 244SPVV 5 1910^ 25 242
DPVV/VH 10 25 244L:DPVV/VH 20+5 1910^ 25^ 242S:CPRH/RV 25 25 244L:DPHH/HV 40+5 1910^ 45^ 242S:CP/RH/RV 37.5 25 244L:DPHH/HV 40+5 1910^ 45^ 242
S:SPHH(orSPVV) 75 25 244L:QPHH/HV/VH/VV 40+5 1550*^ 45^ 242
S:CPRH/RV 25 3100 10' 244L:QPHH/HV/VH/VV 40+5 1550*^ 45^ 242
S:DPHH/HV 37.5 3100 10' 244L:QPHH/HV/VH/VV 20+5 1550*^ 45^ 242
S:CPHH/HV 25 3100 10' 244
L:QPHH/HV/VH/VV 20+5 1550*^ 45^ 242
S:DPHH/HV 3100 10' 244
DPVV/VH 5 1910^ 25 242
CPRH/RV 25 25 244
DPVV/VH 5 1910^ 25 242
DPVV/VH 10 25 244
201 LX+S3 Coastal-X L+S
202 LX+SX Coastal-X L+S
203 L?+S3 ISROIce/sea-ice L+S
204
192
SystematicCoverage&Deformation L+S193
L+S
UrbanAreas,HimalayasSMUrbanAreas,HimalayasSMHiPwr
OpenOcean
L+S
L1+S3
L1+S4
L1+S5
L3+S2
L6+SX
L+S
LowDataRateStudyModeSinglePolLandIceLowRes
Science Performance Resources
SystematicCoverage
FreqBand
PolarizationConfig.ID
198 L+S
L?+S2 ISROIce/sea-ice-JjointAlternate
LandIce
BackgroundLand
SeaIceDynamics
UrbanAreas,Himalayas
PrimaryScienceTarget
194 Coastal-Mudbank(wetsoil????)
199 IndiaAgriculture
BackgroundLandSoilMoisture
BackgroundLandSoilMoistureHiPwr
195 Ocean
200 Coastal-Land
197 GlacialIce-Himalayas L+S 1528 2710
OldMode#
196 SeaIceTypes L+S 1033
L+S 1670 1990
L4+S3
L5+S4
L5+S6
L6+S3
High-ResDeformation(Disaster/UrgentResponse)
L+S
1078
L+S
1610
3057 1754
1528 1407 1883
1425 2710
1883 1616
NISAR Joint Radar Modes
BW PRF PW Swath L-SAR S-SARL-DataRate
S-DataRate
(MHz) (Hz) [µ sec] [km] DC[W]+ DC[W]# [Mbps] [Mbps]#128 L1 L DPHH/HV 20+5 1650 25 242 1406 635 893 -
129 L QQ 20+5 1650 25 242 635 -
130 L QQ 20+5 1650 20 242 635 -131 L2 L SPHH 80 1650 40 121 1426 635 706 -132 L SPHH 40+5 1650 45 242 635 -133 L SPHH 20+5 1650 25 242 635 -134 L3 L SPVV 5 1600 25 242 1355 635 91 -135 L QDHH/VV 5+5 1650 20 242 635 -136 L4 IndiaLandCharacterization L DPVV/VH 20+5 1650 25 242 635137 L5 L DPHH/HV 40+5 1650 45 242 1495 635 1627 -138 L QQ 40+5 1650 45 242 635 -139 L QQ 40+5 1650 40 242 635 -140 L6 USAgriculture,IndiaAgriculture L QPHH/HV/VH/VV 40+5 1600* 45 242 1683 635 3156 -141 LX USAgriculture,IndiaAgricultureLowRes L QPHH/HV/VH/VV 20+5 1600* 45 242 1683 635 3156 -142 L7 ExperimentalCPmode L CPRH/RV 20+20 1650 40 242 635 -143 L8 ExperimentalQQmode L QQ 20+20 1650 20 242 635 -144 L9 ExperimentalSPmode L SPHH 80 1650 20 242 635 -145 ISROIce/sea-ice L DPVV/VH 5 1650 25 242 635 -146 ISROIce/sea-ice-alternate L QDHH/VV 5 1650 25 242 635 -
64 S1 SolidEarth/Ice/Veg/Coast/Bathym S Quasi-Quad 37.5 2200 10+10 244 1201 1604 - 371465 S2 Ecosystem/CoastalOcean/Cryosphere S DPHH/HV 10 2200 25 244 1201 1836 - 62666 S3 Agriculture/SeaIce S CPRH/RV 25 2200 25 244 1201 3020 - 124267 S4 GlacialIce-HighRes S CPRH/RV 37.5 2200 25 244 1201 3020 - 185768 SX Newmode S DPHH/HV 37.5 2200 25 244 1201 3020 - 185769 S5 Deformation S SPHH(orSPVV) 25 2200 25 244 1201 1563 - 62070 S6 Deformation-MaxRes S SPHH(orSPVV) 75 2200 25 244 1201 1563 - 1857
DPHH/HV 20+5 1910^ 25 242CPRH/RV 25 25 244DPHH/HV 20+5 1910^ 25 242DPHH/HV 37.5 25 244DPHH/HV 20+5 1910^ 25 242
SPHH(orSPVV) 25 25 244SPVV 5 1910^ 25 242
DPVV/VH 10 25 244L:DPVV/VH 20+5 1910^ 25^ 242S:CPRH/RV 25 25 244L:DPHH/HV 40+5 1910^ 45^ 242S:CP/RH/RV 37.5 25 244L:DPHH/HV 40+5 1910^ 45^ 242
S:SPHH(orSPVV) 75 25 244L:QPHH/HV/VH/VV 40+5 1550*^ 45^ 242
S:CPRH/RV 25 3100 10' 244L:QPHH/HV/VH/VV 40+5 1550*^ 45^ 242
S:DPHH/HV 37.5 3100 10' 244L:QPHH/HV/VH/VV 20+5 1550*^ 45^ 242
S:CPHH/HV 25 3100 10' 244
L:QPHH/HV/VH/VV 20+5 1550*^ 45^ 242
S:DPHH/HV 3100 10' 244
DPVV/VH 5 1910^ 25 242
CPRH/RV 25 25 244
DPVV/VH 5 1910^ 25 242
DPVV/VH 10 25 244
201 LX+S3 Coastal-X L+S
202 LX+SX Coastal-X L+S
203 L?+S3 ISROIce/sea-ice L+S
204
192
SystematicCoverage&Deformation L+S193
L+S
UrbanAreas,HimalayasSMUrbanAreas,HimalayasSMHiPwr
OpenOcean
L+S
L1+S3
L1+S4
L1+S5
L3+S2
L6+SX
L+S
LowDataRateStudyModeSinglePolLandIceLowRes
Science Performance Resources
SystematicCoverage
FreqBand
PolarizationConfig.ID
198 L+S
L?+S2 ISROIce/sea-ice-JjointAlternate
LandIce
BackgroundLand
SeaIceDynamics
UrbanAreas,Himalayas
PrimaryScienceTarget
194 Coastal-Mudbank(wetsoil????)
199 IndiaAgriculture
BackgroundLandSoilMoisture
BackgroundLandSoilMoistureHiPwr
195 Ocean
200 Coastal-Land
197 GlacialIce-Himalayas L+S 1528 2710
OldMode#
196 SeaIceTypes L+S 1033
L+S 1670 1990
L4+S3
L5+S4
L5+S6
L6+S3
High-ResDeformation(Disaster/UrgentResponse)
L+S
1078
L+S
1610
3057 1754
1528 1407 1883
1425 2710
1883 1616

NISAR Noise Performance of 20 MHz DP Mode
Slide 18
• Assumes fixed PRF
Transmit blanking gaps

Multiplicative Noise with Varied PRF at Dual Pol
Slide 19

Staggered SAR – Quad Pol
NESZ ASR
Mean PRF = 2 X 1600 Hz

NISAR Level-2 Solid Earth Science Requirements Summary
Attribute Secular Deformation (658) Co-Seismic Deformation (660) Transient Deformation (663)
Measurement Spatially averaged relativevelocities in two dimensions
Point-to-point relative displacements in two dimensions
Point-to-point relative displacements in two dimensions
Method Interferometry, Speckle tracking Interferometry, Speckle tracking Interferometry, Speckle tracking
Duration 3 years 3 years Episodic over mission, depending on science target
Product resolution
100 m; smoothed according to distance scale L
100 m 100 m
Accuracy 2 mm/yr or better,0.1 km < L < 50 km, over > 70% of coverage areas
4 (1+L1/2) mm or better, 0.1 km < L < 50 km, over > 70% of coverage areas
3 (1+ L1/2) mm or better, 0.1 km < L < 50 km,over > 70% of ~2,000 targeted sites
Sampling One estimate over 3 years, two directions
4 times per year to guarantee capture of any earthquake on land before surface changes too greatly
Every 12-days, two directions
Coverage Land areas predicted to move faster than 1 mm/yr
All land, as earthquake locations are unknown a priori
Post-seismic events, volcanoes, ground-water, gas, hydrocarbon reservoirs, landslide-prone
Response latency
N/A 24 hour tasking, 5 hour data deliveryBest effort basis on event
24/5Best effort basis on event
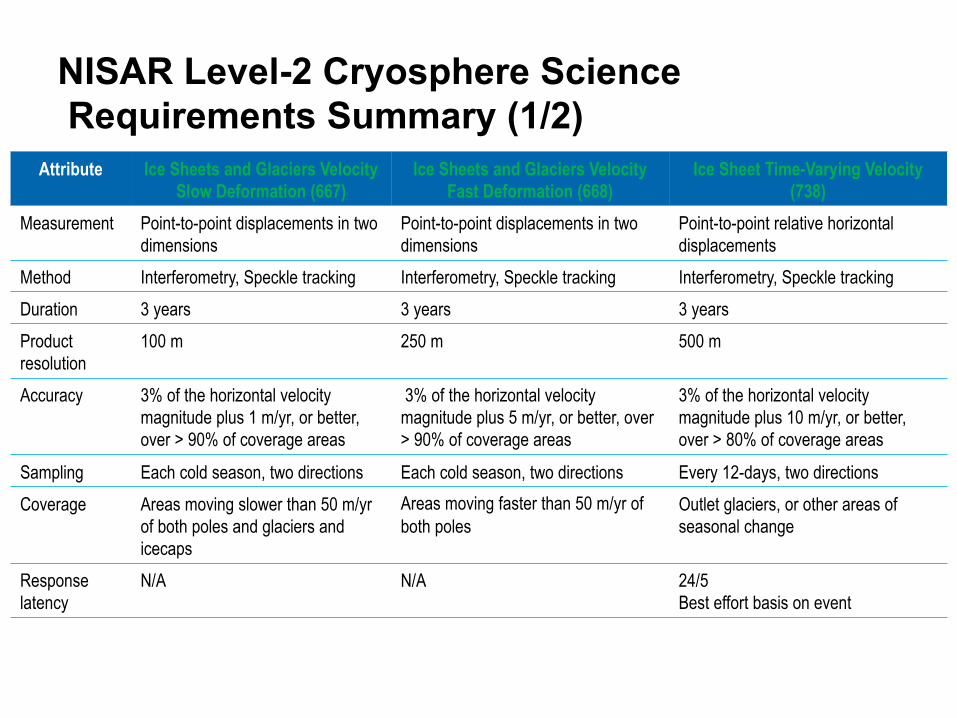
NISAR Level-2 Cryosphere ScienceRequirements Summary (1/2)
Attribute Ice Sheets and Glaciers VelocitySlow Deformation (667)
Ice Sheets and Glaciers VelocityFast Deformation (668)
Ice Sheet Time-Varying Velocity (738)
Measurement Point-to-point displacements in two dimensions
Point-to-point displacements in two dimensions
Point-to-point relative horizontal displacements
Method Interferometry, Speckle tracking Interferometry, Speckle tracking Interferometry, Speckle tracking
Duration 3 years 3 years 3 years
Product resolution
100 m 250 m 500 m
Accuracy 3% of the horizontal velocity magnitude plus 1 m/yr, or better, over > 90% of coverage areas
3% of the horizontal velocity magnitude plus 5 m/yr, or better, over > 90% of coverage areas
3% of the horizontal velocitymagnitude plus 10 m/yr, or better,over > 80% of coverage areas
Sampling Each cold season, two directions Each cold season, two directions Every 12-days, two directions
Coverage Areas moving slower than 50 m/yr of both poles and glaciers and icecaps
Areas moving faster than 50 m/yr ofboth poles
Outlet glaciers, or other areas of seasonal change
Response latency
N/A N/A 24/5Best effort basis on event

NISAR Level-2 Cryosphere ScienceRequirements Summary (2/2)
Attribute Permafrost Displacement(671)
Grounding Line Vertical Displacement (445)
Sea Ice Velocity (670)
Measurement Spatially averaged relativevelocities in two dimensions
Point-to-point relative displacements in two dimensions
Point-to-point relative horizontal displacements
Method Interferometry Interferometry Backscatter image feature tracking
Duration 3 years 3 years 3 years
Product resolution
100 m 100 m Gridded at 5 km
Accuracy 10 mm or better,over > 80% of coverage areas
100 mm or better,over 95% coverage areas annuallyover 50% coverage areas monthly
100 m / day,over 70% of coverage area
Sampling In snow-free months sufficient to meet accuracy (semi-monthly)
Monthly Every 3 days
Coverage Targeted priority regions in Alaska and Canada
Greenland and Antarctic coastal zones
Seasonally-adjusted Arctic and Antarctic sea ice cover
Response latency
N/A 24 hour tasking, 5 hour data deliveryBest effort basis on event
24/5Best effort basis on event

NISAR Level-2 Ecosystem Science Requirements Summary
Attribute Biomass (673) Disturbance (675) Inundation (677) Crop Area (679)
Measurement Biomass Areal extent Areal extent Areal extent
Method Polarimetric backscatter to biomass
Polarimetric backscattertemporal change
Polarimetric backscattercontrast
Polarimetric backscatter contrast and temporal change
Duration 3 years 3 years 3 years 3 years
Product resolution
100 m 100 m 100 m 100 m
Accuracy 20 Mg/ha or better where biomass is < 100 Mg/ha, over 80% of coverage areas
80% or better classification accuracywhere canopy cover changes by > 50%
80% or better classification accuracy
80% or better classification accuracy
Sampling Annual Annual Seasonal, sampled every 12 days to track beginning and end of flooding events
Quarterly; sampled every 12 days to track beginning and end of growing season
Coverage Global areas of woody biomass
Global areas of woody biomass
Global inland and coastal wetlands
Global agricultural areas
Response latency
N/A 24/5Best effort basis on event
24/5Best effort basis on event
N/A

End-to-End Science Measurement Performance Simulations for Deformation and Biomass
Radar SensorPerformance
Tool
MissionScenario
Tool
SAR/InSARPerformance
Tool
Radar Parameters
Data Types
EphemerisGeneration
Tool
Power, gain, BW, etc.
Backscatter typeSlope
Con Ops RulesData prioritiesObservation timelines
Mission ConstraintsPowerData rate/volumeDownlink masks
Radar PerformanceSNRAmbiguitiesQNRISLRAzimuth resolutionRange resolutionEtc.
Observation ListTimes points observedPlatform locationRadar modeIncidence angle
Data Masks
L1 and L2 Parameter Performance MetricsDeformation errorBiomass error
Troposphere (seasonal)Ionosphere (time of day)Snow cover (8-day sampling)Terrain classification mapDEM and DEM slopeGlobal tree height map

MPREFOBS307f Solid Earth Analysis Summary
Category Coverage Req.
Coverage Est.
Uncertainty Req.
Uncertainty Est.
Status
Level 1 in mm
70% 82.3% 3.5 * (1+sqrt(L))
2.96 * (1+sqrt(L))
OK - OK
Coseismic (660) in mm
70% 80.9% 4 * (1+sqrt(L))
3.05 * (1+sqrt(L))
OK - OK
Transients (663) in mm
70% 85.7% 3 * (1+sqrt(L))
2.56 * (1+sqrt(L))
OK - OK
Active (658) in mm/yr
70% 99.6% 2 1.63 OK - OK
0.1 km < L < 50 kmMeets requirements with > 10% marginMeets requirements with < 10% marginDoes not meet requirements

MPREFOBS 307f Biomass Performance Results: 5-Class Backscatter-to-Biomass Model
0 20 40 60Biomass Retrieval Error (Mg/ha)
Histo
gram
Cou
nt
• Points where retrievals were attempted: 21,674
• Points with biomass < 100 Mg/ha: 14,272
• Such points with error < 20 Mg/ha: 13,526
• Percent of such points meeting error threshold:
13,526/14,272 = 94.8% (requirement is 80%)
• Assumes geographically-dependent surface
backscatter variability and 0.5 dB calibration
uncertainty, 5-class backscatter-to-biomass model
Biom
ass R
etrie
val E
rror (
Mg/
ha)
5.2%94.8%
Biomass Performance Model predicts NISAR meets its biomass requirements

Summary
• NISAR Mission now in development, planning for launch in 2021
• Project has demonstrated it can meet mission science performance requirements using fixed PRF observations
• Transmit blanking gaps are not desirable to scientists, but schemes to mitigate raise ambiguity noise
• Current algorithmic efforts seek to understand impacts on science performance, and develop mitigation schemes
