name date test on friday review sheet - olma.org sheet.pdf · what is the approximate latitude and...
TRANSCRIPT
Name DateTest on Friday Review Sheet
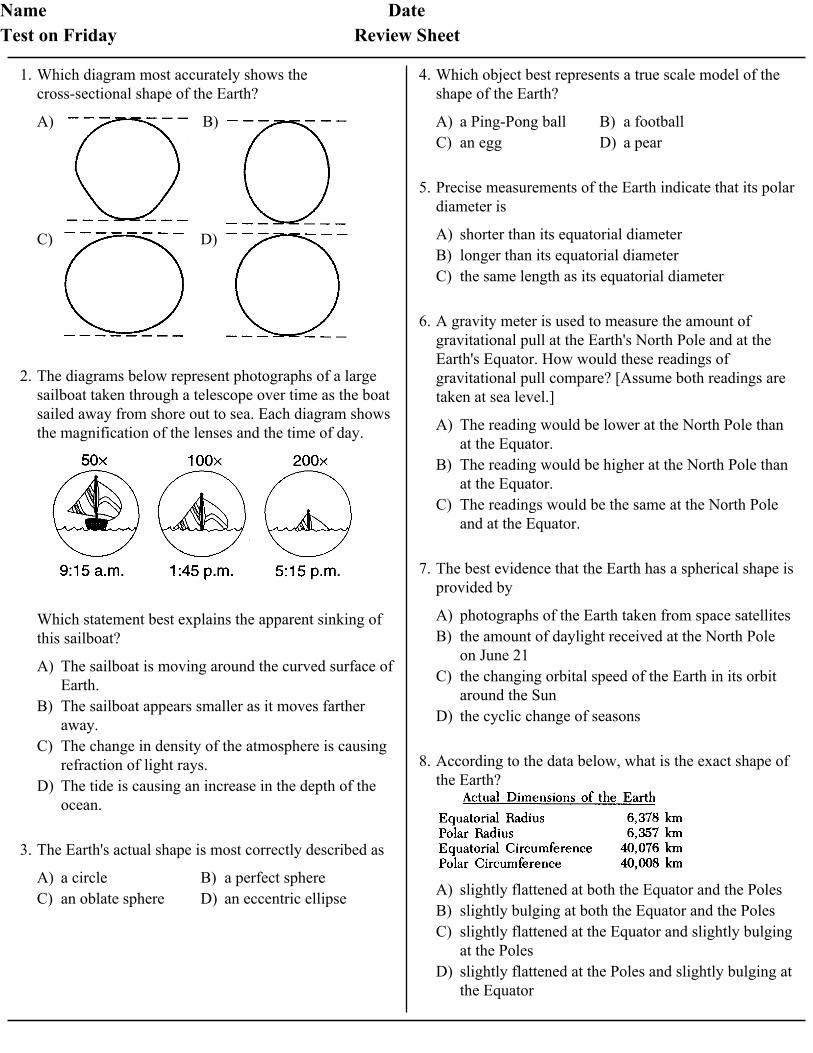
A) B)
C) D)
1. Which diagram most accurately shows thecross-sectional shape of the Earth?
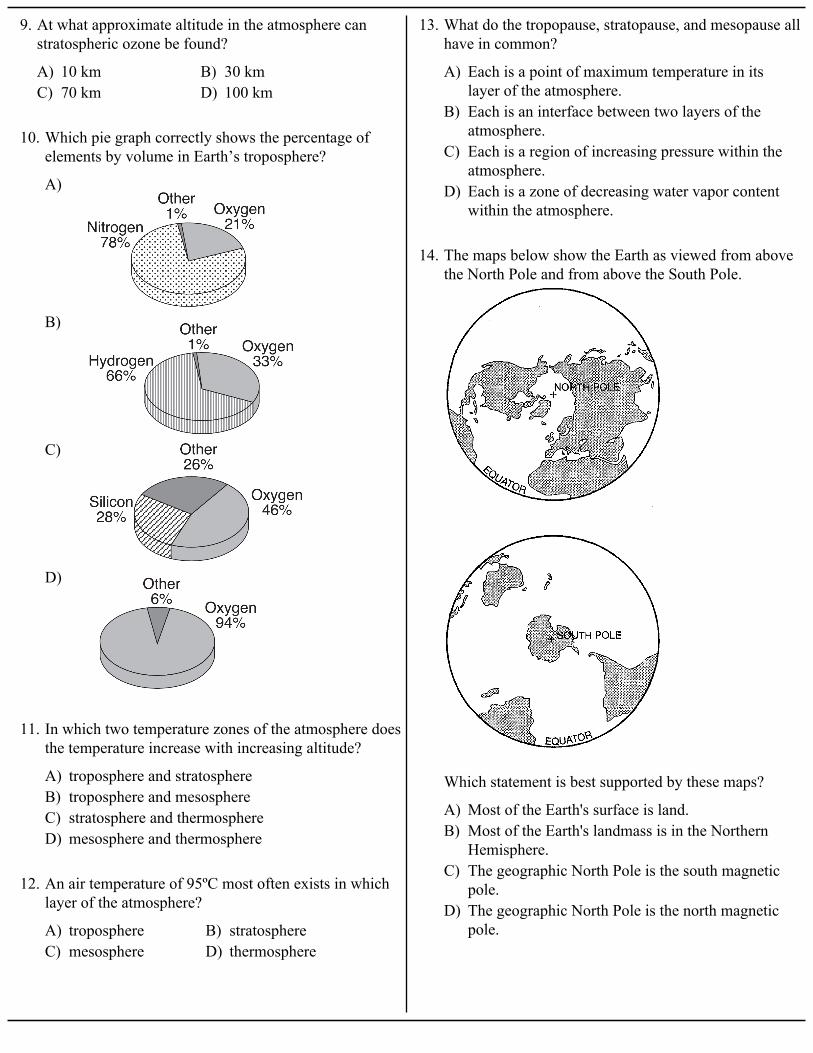
A) The sailboat is moving around the curved surface ofEarth.
B) The sailboat appears smaller as it moves fartheraway.
C) The change in density of the atmosphere is causingrefraction of light rays.
D) The tide is causing an increase in the depth of theocean.
2. The diagrams below represent photographs of a largesailboat taken through a telescope over time as the boatsailed away from shore out to sea. Each diagram showsthe magnification of the lenses and the time of day.
Which statement best explains the apparent sinking ofthis sailboat?
A) a circle B) a perfect sphereC) an oblate sphere D) an eccentric ellipse
3. The Earth's actual shape is most correctly described as
A) a Ping-Pong ball B) a footballC) an egg D) a pear
4. Which object best represents a true scale model of theshape of the Earth?
A) shorter than its equatorial diameterB) longer than its equatorial diameterC) the same length as its equatorial diameter
5. Precise measurements of the Earth indicate that its polardiameter is
A) The reading would be lower at the North Pole thanat the Equator.
B) The reading would be higher at the North Pole thanat the Equator.
C) The readings would be the same at the North Poleand at the Equator.
6. A gravity meter is used to measure the amount ofgravitational pull at the Earth's North Pole and at theEarth's Equator. How would these readings ofgravitational pull compare? [Assume both readings aretaken at sea level.]
A) photographs of the Earth taken from space satellitesB) the amount of daylight received at the North Pole
on June 21C) the changing orbital speed of the Earth in its orbit
around the SunD) the cyclic change of seasons
7. The best evidence that the Earth has a spherical shape isprovided by
A) slightly flattened at both the Equator and the PolesB) slightly bulging at both the Equator and the PolesC) slightly flattened at the Equator and slightly bulging
at the PolesD) slightly flattened at the Poles and slightly bulging at
the Equator
8. According to the data below, what is the exact shape ofthe Earth?
A) 10 km B) 30 kmC) 70 km D) 100 km
9. At what approximate altitude in the atmosphere canstratospheric ozone be found?
A)
B)
C)
D)
10. Which pie graph correctly shows the percentage ofelements by volume in Earth’s troposphere?
A) troposphere and stratosphereB) troposphere and mesosphereC) stratosphere and thermosphereD) mesosphere and thermosphere
11. In which two temperature zones of the atmosphere doesthe temperature increase with increasing altitude?
A) troposphere B) stratosphereC) mesosphere D) thermosphere
12. An air temperature of 95ºC most often exists in whichlayer of the atmosphere?
A) Each is a point of maximum temperature in itslayer of the atmosphere.
B) Each is an interface between two layers of theatmosphere.
C) Each is a region of increasing pressure within theatmosphere.
D) Each is a zone of decreasing water vapor contentwithin the atmosphere.
13. What do the tropopause, stratopause, and mesopause allhave in common?
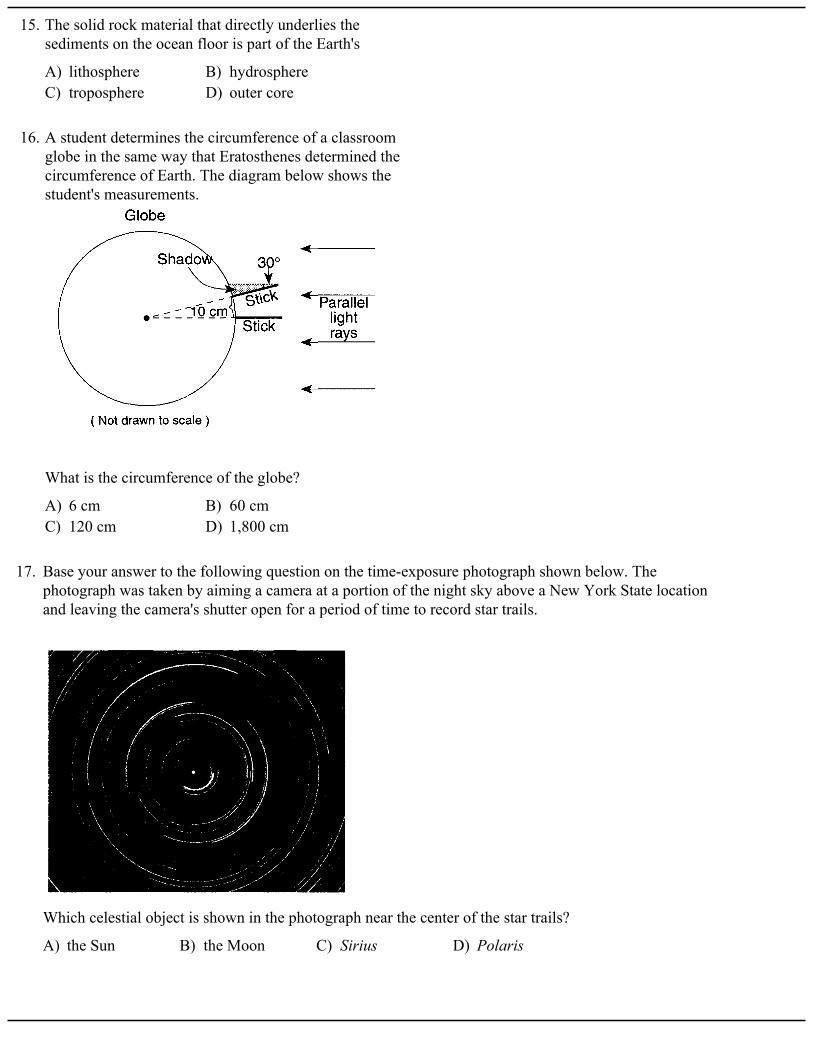
A) Most of the Earth's surface is land.B) Most of the Earth's landmass is in the Northern
Hemisphere.C) The geographic North Pole is the south magnetic
pole.D) The geographic North Pole is the north magnetic
pole.
14. The maps below show the Earth as viewed from abovethe North Pole and from above the South Pole.
Which statement is best supported by these maps?
A) lithosphere B) hydrosphereC) troposphere D) outer core
15. The solid rock material that directly underlies thesediments on the ocean floor is part of the Earth's
A) 6 cm B) 60 cmC) 120 cm D) 1,800 cm
16. A student determines the circumference of a classroomglobe in the same way that Eratosthenes determined thecircumference of Earth. The diagram below shows thestudent's measurements.
What is the circumference of the globe?
17. Base your answer to the following question on the time-exposure photograph shown below. Thephotograph was taken by aiming a camera at a portion of the night sky above a New York State locationand leaving the camera's shutter open for a period of time to record star trails.
A) the Sun B) the Moon C) Sirius D) Polaris
Which celestial object is shown in the photograph near the center of the star trails?

18. Base your answer to the following question on the following map and passage. The map shows the extentof summer ice-melt zones on Greenland in 1992 and 2002. The summer melt zone is an area wheresummer heat turns snow and ice around the edges of the ice sheet into slush and ponds of meltwater. Threecoastal locations are shown on the map.
Arctic Meltdown
Scientists are concerned because average arctic temperatures are rising. The Greenland Ice Sheet, thedominant area of continental ice in the arctic region, broke all previous records for melting in 2002.In 2004, the total amount of ice resting on top of the continental crust in the arctic region was estimated tobe about 3,100,000 cubic kilometers. If all this ice were to melt, the ocean levels would rise approximately8.5 meters. A reduction in ice-covered areas exposes more land surfaces. This increases absorption ofinsolation and accelerates arctic warming. Scientists continue to collect data to define the role ofgreenhouse gases in the warming of the arctic region.
A) 51.5° N 64° W B) 70.5° N 22° W C) 64° N 51.5° W D) 22° N 70.5°W
What is the approximate latitude and longitude of Godthab, Greenland?

A) 43º B) 47º C) 75º D) 90º
19. From Utica, New York, Polaris is observed at analtitude of approximately
A) New York City B) Slide MountainC) Niagara Falls D) Plattsburgh
20. At which New York State location would an observermeasure the highest altitude of Polaris?
A) 20° N B) 20° S C) 70° N D) 70° S
21. The diagram below shows an observer measuring thealtitude of Polaris.
What is the latitude of the observer?
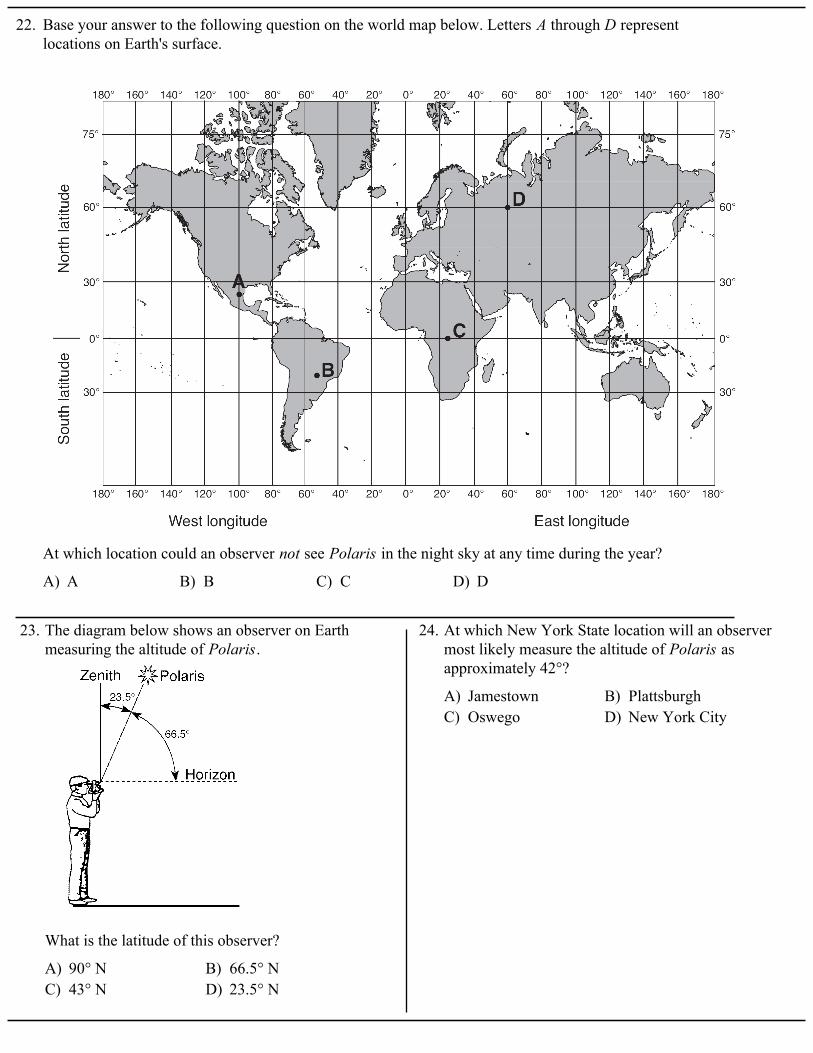
22. Base your answer to the following question on the world map below. Letters A through D representlocations on Earth's surface.
A) A B) B C) C D) D
At which location could an observer not see Polaris in the night sky at any time during the year?
A) 90° N B) 66.5° NC) 43° N D) 23.5° N
23. The diagram below shows an observer on Earthmeasuring the altitude of Polaris.
What is the latitude of this observer?
A) Jamestown B) PlattsburghC) Oswego D) New York City
24. At which New York State location will an observermost likely measure the altitude of Polaris asapproximately 42°?
A) 43° N B) 43° S C) 47° N D) 47° S
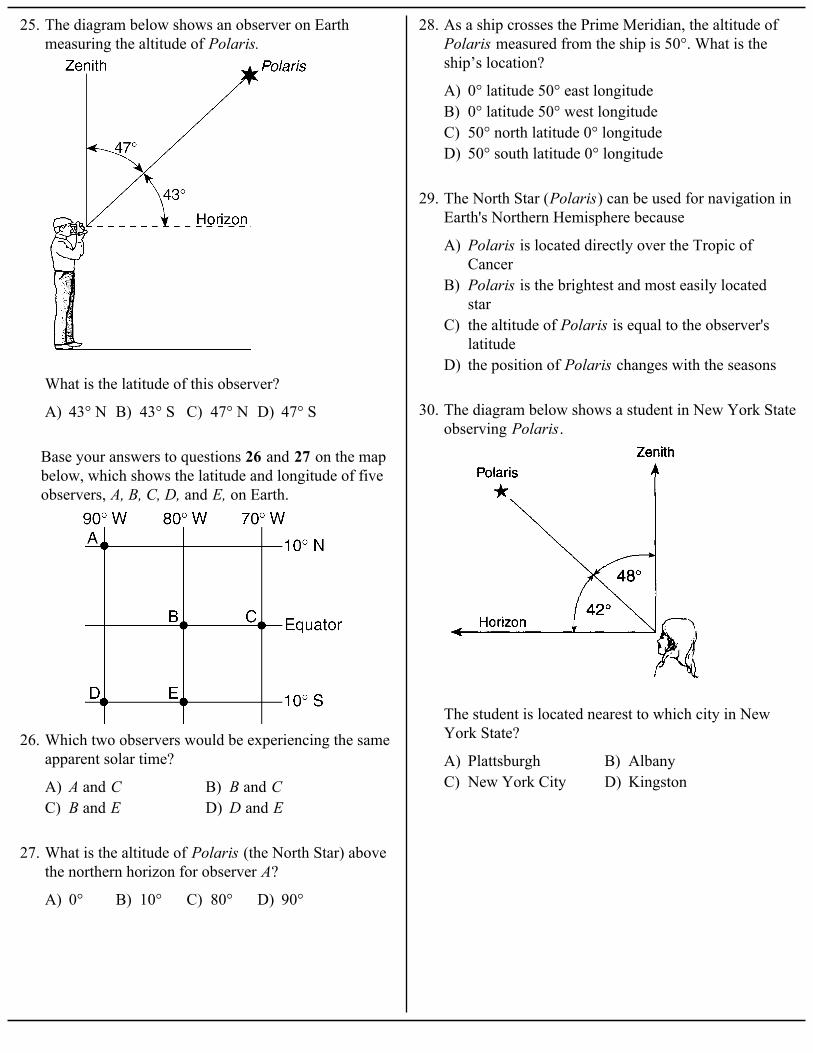
25. The diagram below shows an observer on Earthmeasuring the altitude of Polaris.
What is the latitude of this observer?
Base your answers to questions 26 and 27 on the mapbelow, which shows the latitude and longitude of fiveobservers, A, B, C, D, and E, on Earth.
A) A and C B) B and CC) B and E D) D and E
26. Which two observers would be experiencing the sameapparent solar time?
A) 0° B) 10° C) 80° D) 90°
27. What is the altitude of Polaris (the North Star) abovethe northern horizon for observer A?
A) 0° latitude 50° east longitudeB) 0° latitude 50° west longitudeC) 50° north latitude 0° longitudeD) 50° south latitude 0° longitude
28. As a ship crosses the Prime Meridian, the altitude of Polaris measured from the ship is 50°. What is theship’s location?
A) Polaris is located directly over the Tropic ofCancer
B) Polaris is the brightest and most easily locatedstar
C) the altitude of Polaris is equal to the observer'slatitude
D) the position of Polaris changes with the seasons
29. The North Star (Polaris) can be used for navigation inEarth's Northern Hemisphere because
A) Plattsburgh B) AlbanyC) New York City D) Kingston
30. The diagram below shows a student in New York Stateobserving Polaris.
The student is located nearest to which city in NewYork State?
A) 10° N B) 40° N C) 50° N D) 90° N
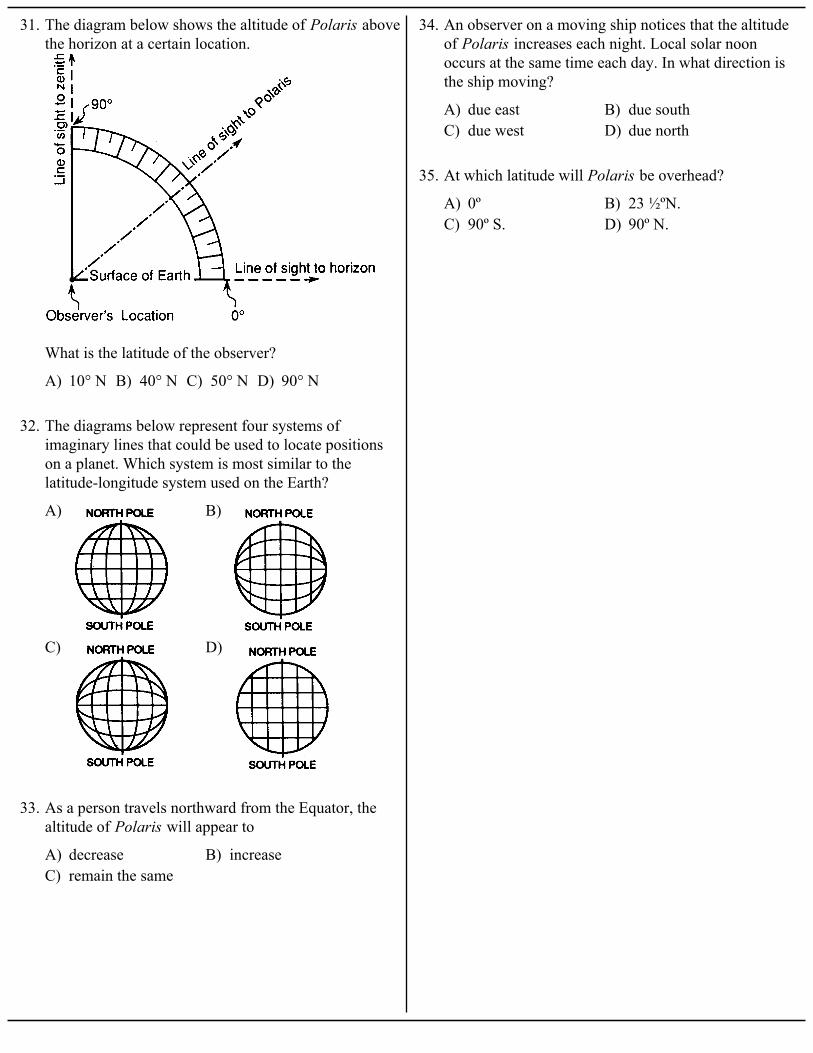
31. The diagram below shows the altitude of Polaris abovethe horizon at a certain location.
What is the latitude of the observer?
A) B)
C) D)
32. The diagrams below represent four systems ofimaginary lines that could be used to locate positionson a planet. Which system is most similar to thelatitude-longitude system used on the Earth?
A) decrease B) increaseC) remain the same
33. As a person travels northward from the Equator, thealtitude of Polaris will appear to
A) due east B) due southC) due west D) due north
34. An observer on a moving ship notices that the altitudeof Polaris increases each night. Local solar noonoccurs at the same time each day. In what direction isthe ship moving?
A) 0º B) 23 ½ºN.C) 90º S. D) 90º N.
35. At which latitude will Polaris be overhead?

Base your answers to questions 36 and 37 on the diagram below and on your knowledge of Earth science.The diagram represents a time-exposure photograph taken by aiming a camera at Polaris in the night skyand leaving the shutter open for a period of time to record star trails. The angular arcs (star trails) show theapparent motions of some stars.
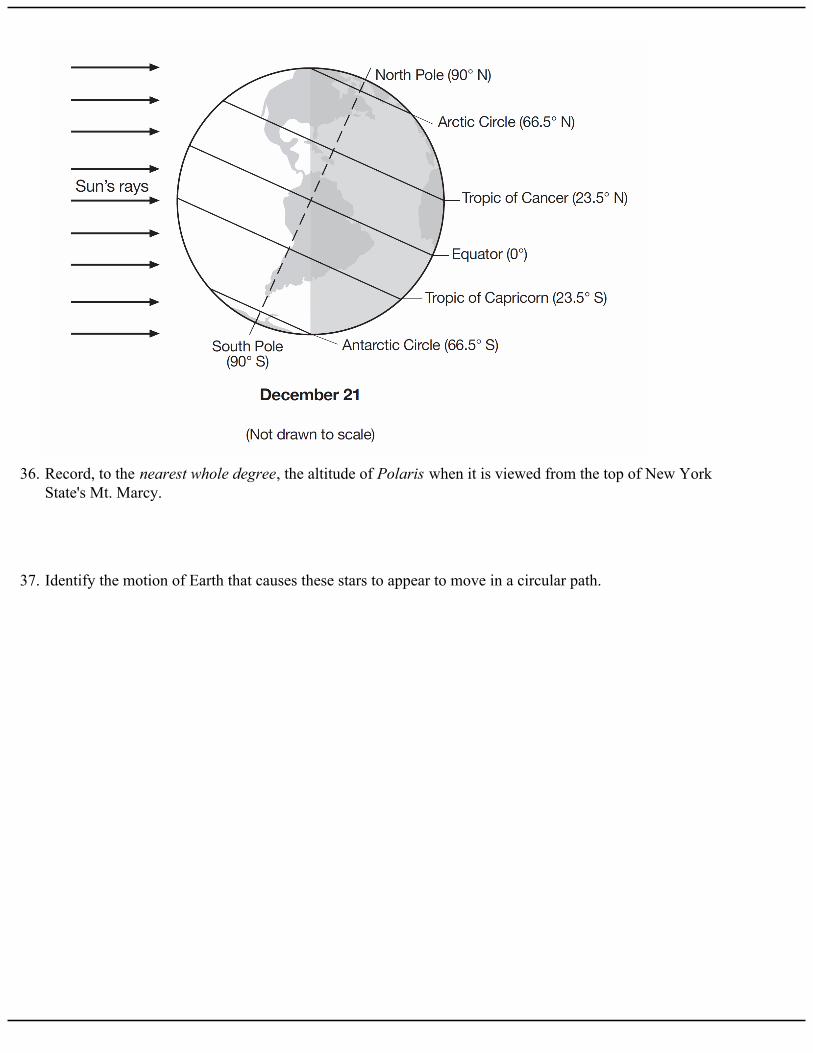
36. Record, to the nearest whole degree, the altitude of Polaris when it is viewed from the top of New YorkState's Mt. Marcy.
37. Identify the motion of Earth that causes these stars to appear to move in a circular path.
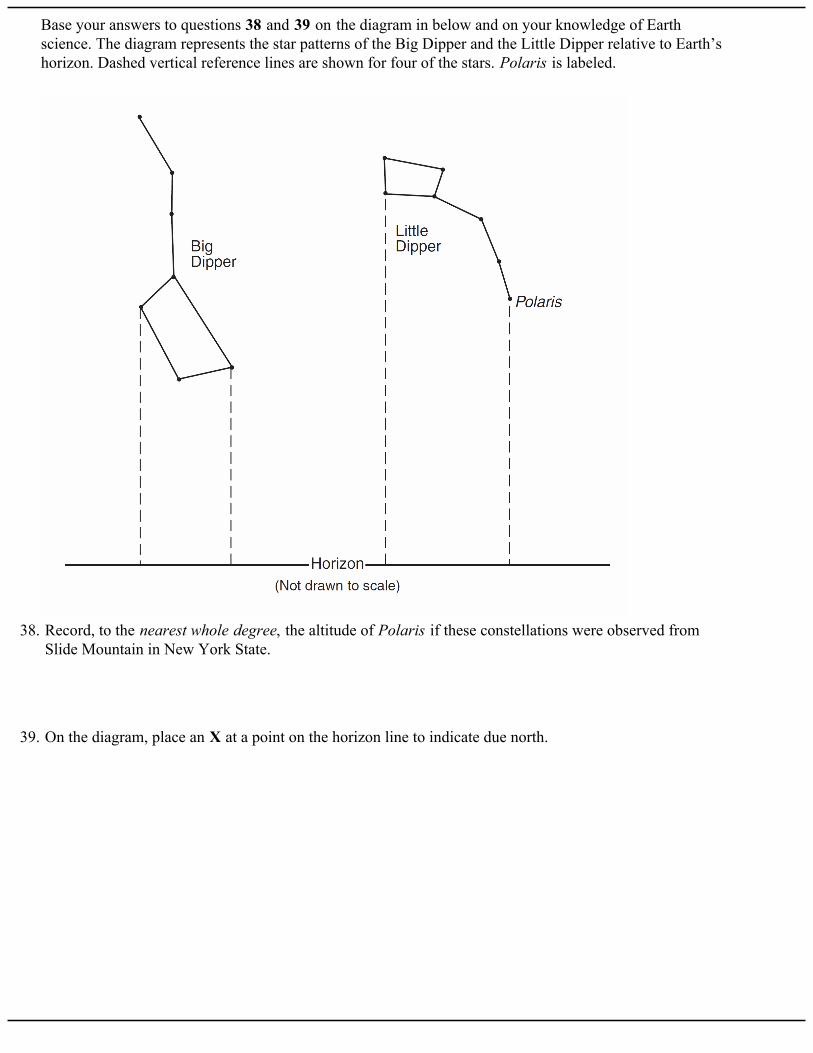
Base your answers to questions 38 and 39 on the diagram in below and on your knowledge of Earthscience. The diagram represents the star patterns of the Big Dipper and the Little Dipper relative to Earth’shorizon. Dashed vertical reference lines are shown for four of the stars. Polaris is labeled.
38. Record, to the nearest whole degree, the altitude of Polaris if these constellations were observed fromSlide Mountain in New York State.
39. On the diagram, place an X at a point on the horizon line to indicate due north.
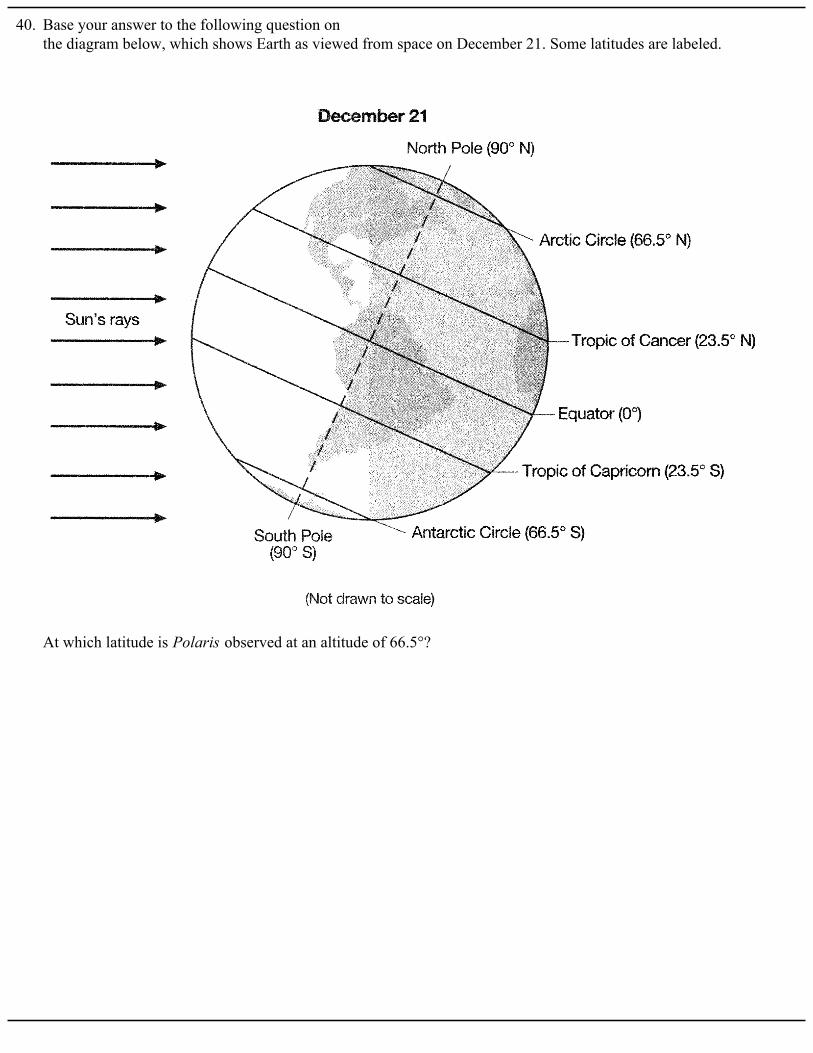
40. Base your answer to the following question on the diagram below, which shows Earth as viewed from space on December 21. Some latitudes are labeled.
At which latitude is Polaris observed at an altitude of 66.5°?