nahrep houston 4.22.15 building your business in the hispanic community
Upload: better-homes-and-gardens-real-estate-gary-greene-international-division
Post on 16-Jul-2015
260 views
TRANSCRIPT

Building Your Business in
the Hispanic Community
Oscar Gonzales, MBA, PhD – International Division Director

Population Trends

U.S. Population by Race 2010 - 2030
0%
10%
20%
30%
40%
50%
60%
70%
White Hispanic Black Asian Other
2010 64% 16% 13% 4% 3%
2030 56% 22% 13% 5% 4%
U.S. Population by Race
2010-2030

Projected Hispanic Population Growth

Projected Hispanic Population Growth

Projected Hispanic Population Growth

Projected Hispanic Population Growth
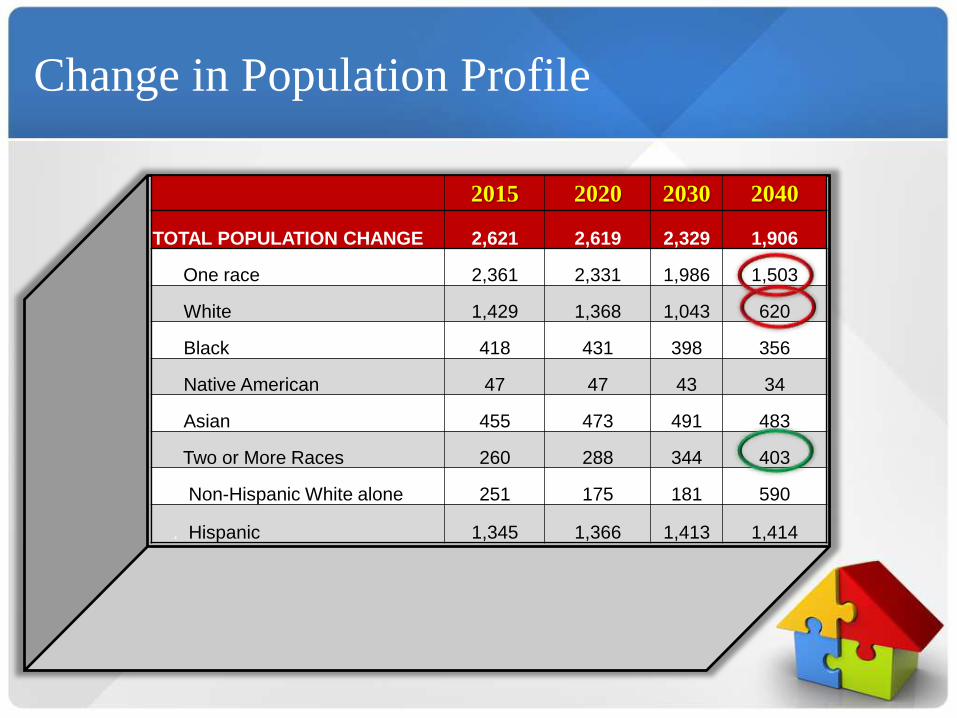
Change in Population Profile
2015 2020 2030 2040
TOTAL POPULATION CHANGE 2,621 2,619 2,329 1,906
. One race 2,361 2,331 1,986 1,503
White 1,429 1,368 1,043 620
Black 418 431 398 356
Native American 47 47 43 34
Asian 455 473 491 483
Two or More Races 260 288 344 403
. Non-Hispanic White alone 251 175 181 590
. Hispanic 1,345 1,366 1,413 1,414

Change in Population Births
2015 2020 2030 2040
BIRTHS 3,999 4,125 4,198 4,266
.One race 3,735 3,831 3,839 3,836
White 2,867 2,909 2,874 2,833
Black 596 624 628 633
Native American 59 62 63 63
Asian 203 225 262 296
Two or More Races 263 294 359 430
. Non-Hispanic White alone 2,017 2,000 1,846 1,711
. Hispanic 995 1,066 1,210 1,334

Change in Population Deaths
2015 2020 2030 2040
DEATHS 2,619 2,777 3,224 3,787
. One race 2,595 2,749 3,185 3,735
White 2,161 2,269 2,592 3,001
Black 306 334 398 475
Native American 21 24 31 39
Asian 104 119 160 213
Two or More Races 24 28 38 52
. Non-Hispanic White alone 1,991 2,058 2,278 2,565
. Hispanic 186 233 346 484

The Houston Region is now the most ethnically
and culturally diverse large metropolitan area in
the country.
Fort Bend County is the most diverse county in
the country.
Sugar Land is the most diverse city in the
country.

Houston Population by Race
1960 - 2012


White Hispanic Black Other Asian
2014 2,246,213 2,411,829 1,072,748 1,024,832 396,677
2019 2,331,122 2,916,914 1,191,317 1,161,964 439,254
Change 3.78% 20.94% 11.05% 13.38% 10.73%
-
500,000
1,000,000
1,500,000
2,000,000
2,500,000
3,000,000
3,500,000
Houston Population by Race
2014 - 2019
Houston’s Population 2014 - 2019

Houston’s Population by Age & Ethnicity

Houston’s Foreign Born Population
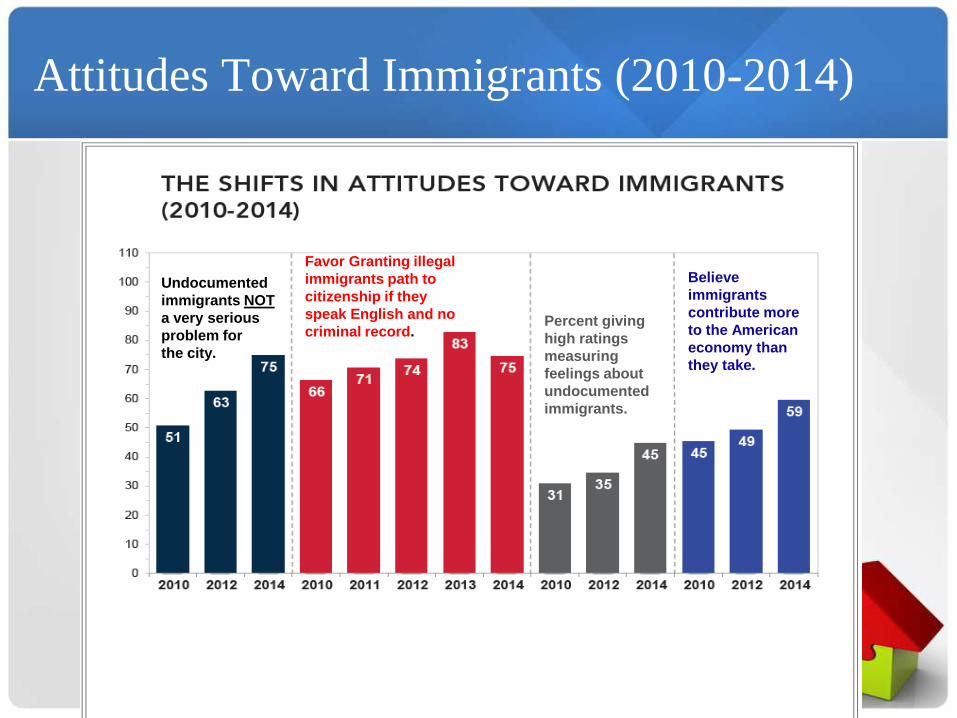
Attitudes Toward Immigrants (2010-2014)
Undocumented
immigrants NOT
a very serious
problem for
the city.
Favor Granting illegal
immigrants path to
citizenship if they
speak English and no
criminal record.Percent giving
high ratings
measuring
feelings about
undocumented
immigrants.
Believe
immigrants
contribute more
to the American
economy than
they take.

White Hispanic Black Other Asian
2014 2,246,213 2,411,829 1,072,748 1,024,832 396,677
2019 2,331,122 2,916,914 1,191,317 1,161,964 439,254
Change 3.78% 20.94% 11.05% 13.38% 10.73%
-
500,000
1,000,000
1,500,000
2,000,000
2,500,000
3,000,000
3,500,000
Houston Population by Race2014 - 2019
Houston’s Population 2014 - 2019

Under 5 years 5 to 17 years 18 to 24 years 25 to 34 years 35 to 44 years 45 to 54 years 55 to 64 years 65 to 74 years75 years and
over
Age Segment 10.60% 24.60% 11.60% 17.20% 15.10% 10.80% 6.10% 2.60% 1.50%
0.00%
5.00%
10.00%
15.00%
20.00%
25.00%
30.00%
Houston MSA – Hispanic Population by Age
Median Age
26.9
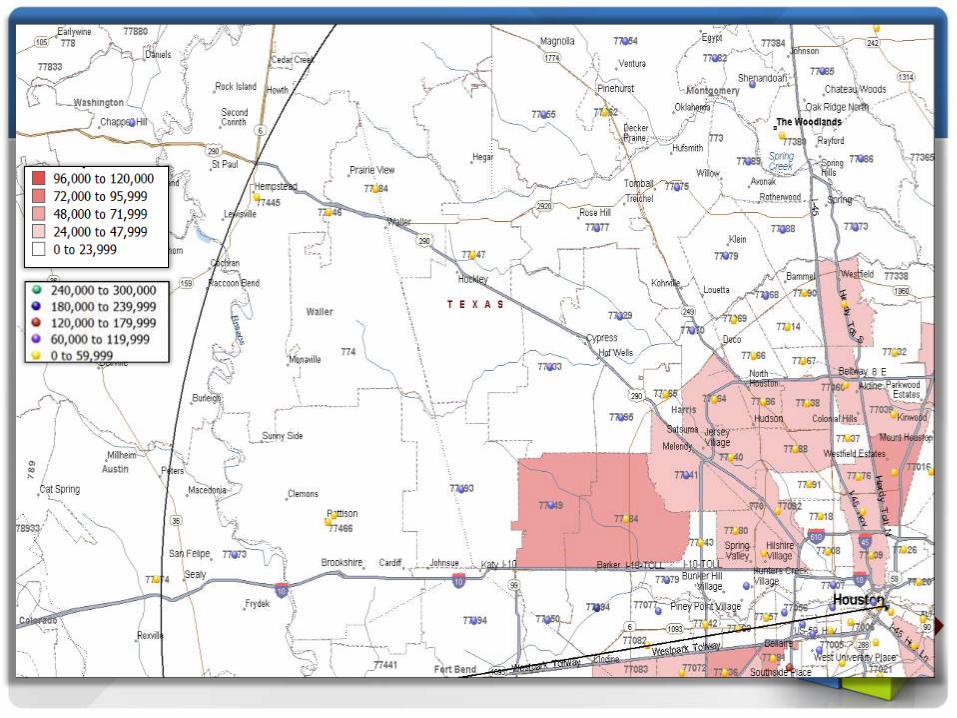
Houston Hispanic Population by Zip Code


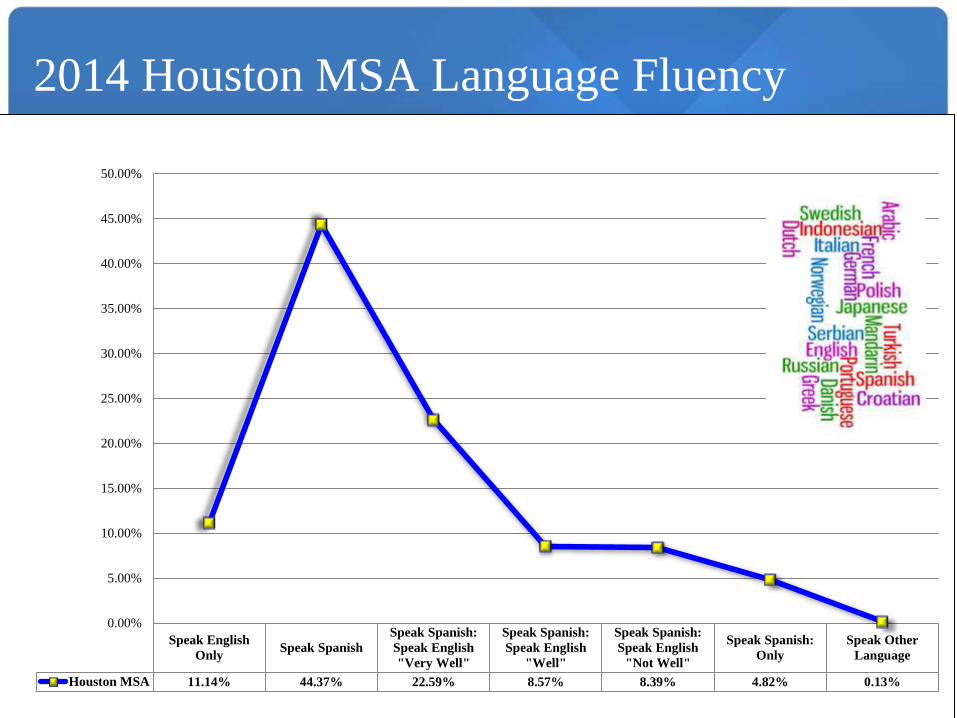
2014 Houston MSA Language Fluency
Speak English
OnlySpeak Spanish
Speak Spanish:
Speak English
"Very Well"
Speak Spanish:
Speak English
"Well"
Speak Spanish:
Speak English
"Not Well"
Speak Spanish:
Only
Speak Other
Language
Houston MSA 11.14% 44.37% 22.59% 8.57% 8.39% 4.82% 0.13%
0.00%
5.00%
10.00%
15.00%
20.00%
25.00%
30.00%
35.00%
40.00%
45.00%
50.00%

Distributions by Education – Houston MSA

Houston MSA – Hispanic: Poverty
Individuals28%
Families25%
Single Females Head of HH
47%
Houston MSA
Hispanic Poverty Rates by Segment

Houston Hispanic Facts
46.7%Rent
53.3% Own
Median Income
$41,867Median Home
Value
$103,100

So What Does This All Mean?
The Hispanic Market is More Diverse Than Ever.
You Can’t Always Rely on Your Own Point of
“Hispanic Reference” to Serve the Broad Market.
Your Marketing Materials Do Not
Always Require Translation.
Your Role Must Be Educational and Consultative:
Not Just “Facilitating.”

Oscar Gonzales, MBA, PhD – International Division Director

Building Your Business in
the Hispanic Community
Oscar Gonzales, MBA, PhD – International Division Director