n86-24534 - nasa · n86-24534 1985 nasa/asee summer faculty research fellowship program marshall...
TRANSCRIPT

N86-24534
1985
NASA/ASEE SUMMER FACULTY
RESEARCH FELLOWSHIP
PROGRAM
MARSHALL SPACE FLIGHT CENTER
THE UNIVERSITY OF ALABAMA IN HUNTSVILLE
INVESTIGATIONS OF TOUGHENING MECHANISMS
OF EPOXY RESINS
Prepared by:
Academic Rank:
University and Department:
T. Koenig
Professor
University of OregonDepartment of Chemistry
NASA/MSFC:
Division:
Branch:
MSFC Counterpart:
Non-Metallic Materials
Polymers and Coatings
Dr. W. J. PattersonM. L. Semmel
Date: August 1, 1985
Contract No.: NASA-NGT-002-099
The University of Alabama in Huntsville
XXVII-i
https://ntrs.nasa.gov/search.jsp?R=19860015063 2018-07-17T16:05:17+00:00Z

INVESTIGATION OF TOUGHENING MECHANISMS
OF EPOXY RESINS
by
T. KOENIG
Professor of ChemistryUniversity of OregonEugene, Oregon 97403
ABSTRACT
Composite material technology has been applied to thesolid rocket booster by the development of a carbon filament-epoxy resin case which yields a net increase of 4000 Ibs. inpayload in the shuttle. The question of reusability of thenew composite tanks has not yet been answered and will dependon the toughness of the matrix resin. The present study wasaimed at providing conditions whereby test specimens of theepoxy resin (EPON/825) and curing agents of systematicallyvaried structures could be produced in a controlled manner.Three sets of conditions were found that might allow theisolation of the structural effects on toughness from thecure effects. The kinetic methods leading to the determina-tion of these conditions are described.
XXVII-ii
I. Introduction and Objective
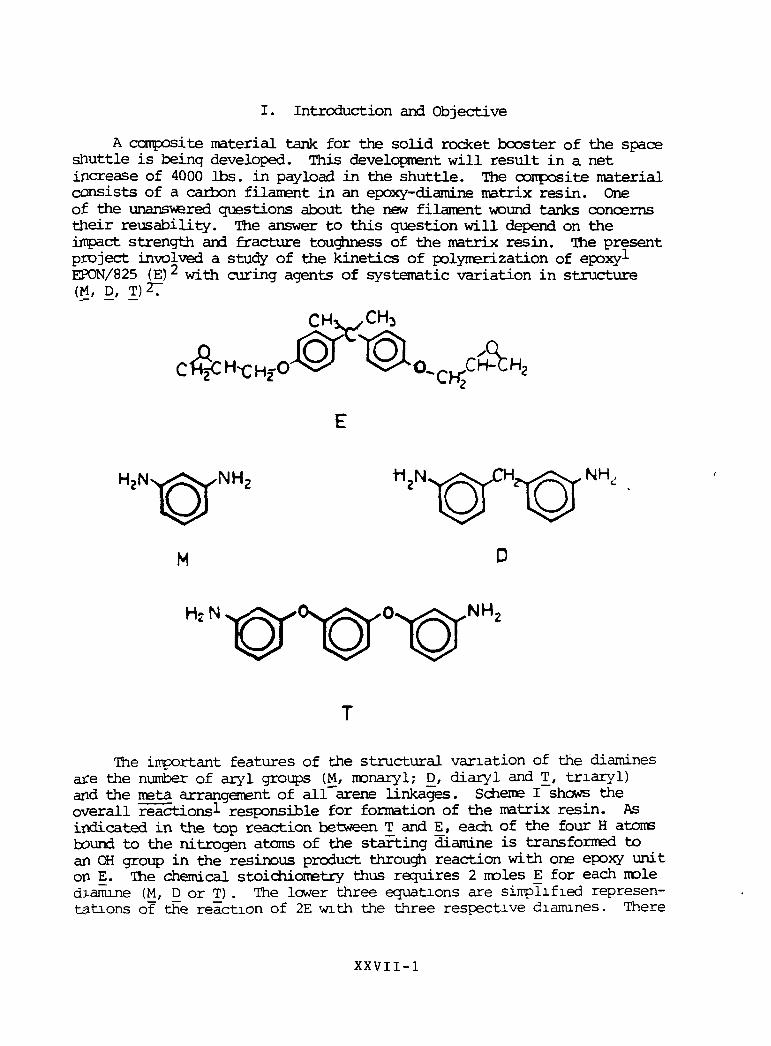
A composite material tank for the solid rocket booster of the spaceshuttle is being developed. This development will result in a netincrease of 4000 Ibs. in pay load in the shuttle. The conposite materialconsists of a carbon filament in an epoxy-diamine matrix resin. Oneof the unanswered questions about the new filament wound tanks concernstneir reusability. The answer to this question will depend on theimpact strength and fracture toughness of the matrix resin. The presentproject involved a study of the kinetics of polymerization of epoxylEPON/825 (E) with curing agents of systematic variation in structure(M, D, T)27
H,N
M
H2N
The important features of the structural variation of the diaminesare the number of aryl groups (M, monaryl; E), diary 1 and T, triaryl)and the meta arrangement of all arene linkages. Scheme I shows theoverall reactions responsible for formation of the matrix resin. Asindicated in the top reaction between T and E, each of the four H atomsbound to the nitrogen atoms of the starting diamine is transformed toan OH group in the resinous product through reaction with one epoxy uniton E. The chemical stoichiometry thus requires 2 moles E for each moledJ-amine (M, D or T) . The lower three equations are simplified represen-tations of the reaction of 2E with the three respective diamines. There
XXVII-1

is a good theoretical basis to expect that the present variation ofmeta-aryl diamines should produce materials of variable impact strengthas suggested by the simplified representation of the three products inScheme I. An increase in the number of meta-aryl groups between thecross-linked chains should provide a mechanism for dissipation of theenergy of impact through the increased number of random coil conforma-tional possibilities associated with the increase in number of meta-arylsubgroups.
SCHEME
' T * 2 E —
D + 2E
M+ 2E
Hie objective of the present work was to find reaction conditionsthat will allow the production of test specimens of matrix resins withvariable diamine structure and conmon (E) epoxy structure. The challengein this objective is to be able to produce specimens that will isolatethe effects of the diamine structural variation from effects simply dueto the extent of polymerization. Meeting this challenge requires afairly detailed study of the kinetics of the polymerization reaction witheach of the three diamines. The results of these studies suggest severalconditions where specimens can be produced that will allow the desiredisolation of the structural variation effects.
XXVII-2

II. Materials and Methods
Sane attention was paid to the purity of the starting materials.Appendix I contains the proton magnetic resonance spectra of each of thefoxor compounds (E, M, D and T) at low (60 MHz) and high (30Q on 360 MHz)field which confirm the structure and purity in each case. The nonoarylsystem (M) is easily oxidized in air and pure material required threedistillations at 0.5 torr/80-90°C, m.p. 63-65°C; lit.3, 64.5°. Twosources of the diary1 diamine (D) were available. The Fairfield ChemicalCo. material was found to be of excellent purity (m.p. 85-86°; lit.4,82-83 ), The Synmet Inc. batch of D was grossly the correct material butcontained colored impurities and had a low melting point (80-82°). Thespectral data on T indicated it was of high purity (m.p. 106-108°) buta previous chromatographic analysis showed minor impurities were present.This material was used without further purification.
The infrared spectra were also examined for each of the compoundsand found to confirm the structures. Figure 1 contains a portion of theinfrared spectrum and the gel permeation chromatogram of EPON/825 (E) .The infrared in this case shows the presence of a small amount of OHgroup which is characteristic of a small amount of the dimer of E usually 5present in this product. This impurity is important since it affects theepoxy equivalents of the resin. The gel permeation chromatogram indi-cates a relative area of 0.9% for the dimer. This translates into anepoxy equivalent weight of 170.2±.2 vs. 170.0 for the pure material. Allexperiments used 170 as the epoxide equivalent weight of the EPON/825barcli which was the same for all runs.
INFRARED51 CHLOROFORM
0.0
GEL PERMEATION OWOMATOG.EPON/8253X10B ANG.1B0LAMDAIX TVF SOLUTION1 ML/MINUTE
1.0
'clCM-> 4000 3000
ML
1.3
II
FIGURE 1.
X X V I I - 3

Kinetic determinations were by differential scanning calorimetry(DSC) with a DuPont 1090 system. Figure 2 shows the principal observableswith this equipment. The polymerization reaction is exothermic and theheat released by the reaction can be measured by integration (Figure 1,upper) of the DSC peak (Figure 1, lower) . Melting transitions and glasstransition temperatures are also revealed by this method.
DIFFERENTIAL SCANNING CALORIMETRY
a._j<a:
400
280
r
*
'RXN
-^ _ _ _ Joa2UJ
OXUJ
REACTION
\
FUS
MELTING
GLASF
TRANSITION
50 80 70 ee 90
FIGURE 2.Kinetic samples were prepared by dissolving 2 mmolar equivalents
(4 epoxy mequivalents) of E and 1 mmolar equivalent (4-H mequivalents)of diamine (M, D or T) in 1 to 1.5 g of methylene chloride. Only Tpresented any solubility difficulties and at least 1.5 g of solvent wasrequired to obtain a homogeneous solution in this case. Constant aliquots(usually 25 microliters) were added to tared DSC pans. Most (90%) of thesolvent evaporated in 1 hour at room temperature and 3 of a particularsample set were heated at 103° for ca. 1 hour to complete evaporation.The residual weights of resin mixture obtained in this way were generallywithin a 1% range. The average residual weights were taken as constantsfor the remaining samples prepared from the same original solution. Therate of reaction at room temperature was shown to be slow during the firsttwo hours for all three systems. However, the monoaryl system (M) doesbegin to react at an appreciable rate after a ferf hours at 25°. Kinetic
XXVII-4
samples, prepared in this way, were heated for variable times in ovensregulated to ± 1°< C. Temperature calibration was to the DSC through acommon thermocouple also to ± 1° C.
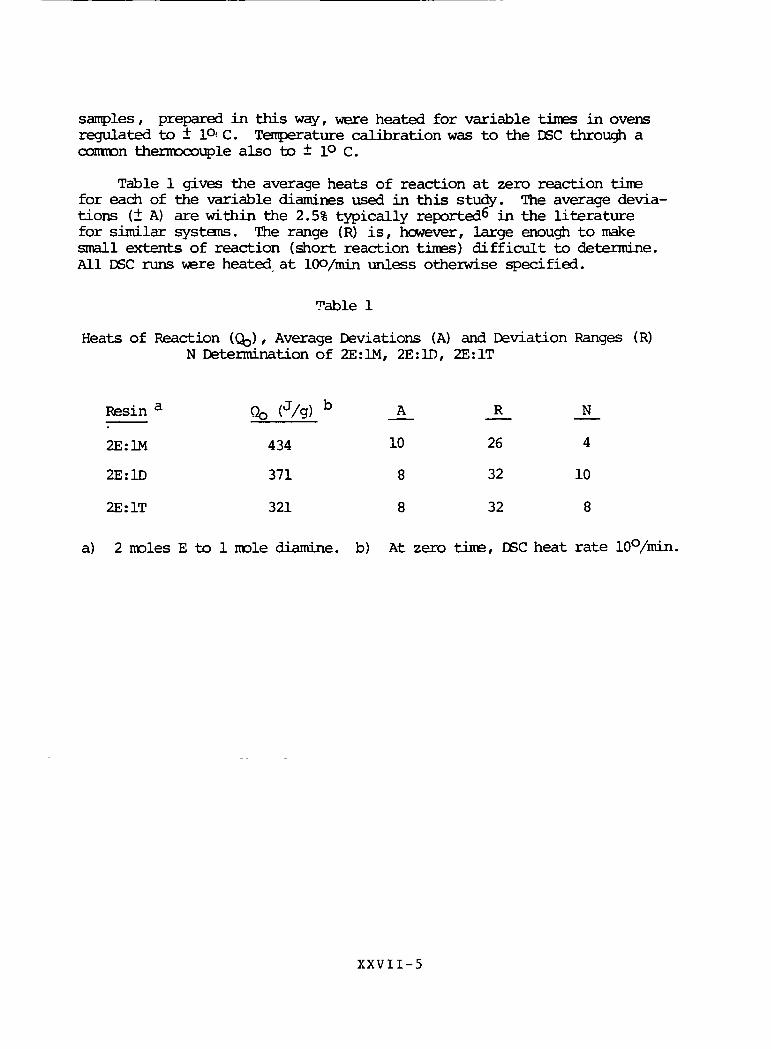
Table 1 gives the average heats of reaction at zero reaction timefor each of the variable diamines used in this study. The average devia-tions (± A) are within the 2.5% typically reported in the literaturefor similar systems. The range (R) is, however, large enough to makesmall extents of reaction (short reaction times) difficult to determine.All DSC runs were heated at 10o/min unless otherwise specified.
Table 1
Heats of Reaction (Q-,), Average Deviations (A) and Deviation Ranges (R)N Determination of 2E:1M, 2E:1D, 2E:1T
(J/g) b A R N
434 10 26 4
371 8 32 10
321 8 32 8
a) 2 moles E to 1 mole diamine. b) At zero time, DSC heat rate 10°/min.
XXVII -5

Ill. Results
Figure 3 represents the simplest method of kinetic determinationin these systems which is the batch version. In this method, a sampleof the resin mixture of known weight is simply heated for a time,quenched and subjected to a standard DSC scan. The integrated area (A.Q)divided by the appropriate Qb (Table 1) can be taken to Treasure theFraction cure (F) or percent cure (FxlOO) as shown.
BATCH KINETICS
ET 108* CDSC
FIGURE 3.
A second .rethcc _ -r.-^-is of a DSC can is a icdau =Muares fitof the shape of the DSC exotherm to equation (1) (Borchardt-Danielsanalysis7) .
(1) dF/dt = (l-F)n • Z • exp f-Ea/RT
Here (equation 1) , dF/dt is the normalized DSC scan measurement,F is fraction cure (conversion) , Z is an Arrhenius frequency factorand Ea is the corresponding activation energy. The inset of Figure 3shows the predicted F - time curve usina this (1) analysis of the zerotime DSC scan.
XXVII-6

The assumption of the Borchardt-Danielsin mechanism occurs during the cure reaction,pancy between the predicted F - time and thesuggestive of an autocatalytic change in theproceeds. The same implication is suggestedtemperature of the maximum rate of the batch
method is that no changeThe very large discre-
pointwise batch cure ismechanism as the reactionby the decrease in thesamples of Figure 3.
Figure 4 shows the variation in the predicted cure rates by theBorchardt-Daniels fits to each of the first three batch samples ofFigure 3. As expected, the activation energy is reduced with thetemperature of maximum heat flow. The reaction order (n) also changessignificantly, further indications of autocatalysis during the first75% in apparent conversion. A plausible explanation of the apparentautocatalysis is shown in Scheme II.
BORCHAROT-DANIELS--BATCH KINETIC METHODS
ET—106 UEU. C
F«FRACTION CUKE
= kCI-F)"
«-BATCH
£ : 0.747T. : 187 t
fteootlon Or-din 1.05
tog Zl 7.63 l/«»r>
tuoi fUoofe ai. i J/sSid ETTOT 0.0168 l/~o
0.297
189 *C
1. IB81.38.78 1/Btn228 J/g
0.0100'C
i.a
0.0
FIGURE 4.
X X V I I - 7

Scheme II
R-NH2
(2)
R-t5H2~CH2~CH~Ar
(zwitter ion 2)<?«
R-NH-CH2-CH-Ar
(R'-OH)
Catalysis:
R'-OH [R'-OHVH-AT
(Catalytic Intermediate, I)
© ©R-NH2 + (I)
(ID
(ID
2 R'-OH
Figure 5 shows an example of the isothermal heat flow method forfollowing the cure reaction. In this method, the kinetic sample isquickly brouqht to a temperature of appreciable reaction rate and heldconstant while the heat flow is recorded. The shape of the heat flow(reaction rate) curve at the top is indicative of an autocatalysis inthat the reaction rate increases for a time before it begins todecrease. The lower portion shows the agreement between the batchdata and the normalized integration of the peak at the top. As isevident, the agreement is good for the integrated curve at 107° and thebatch data at 106°. The 101.7° curve gives a calibration of the sen-sitivity of this system to change in oven or isothermal temperature.
Figure 6 shows isothermal heat flow measurements which confirmthe gross features of the catalysis that are depicted in Scheme II. Theheat flow peak in the upper right is a portion of that shown in Figure 5.A system undergoing simple reaction should show a monotonous decreasein rate as starting material is consumed, like the peak shape shownfor the BT system after pretreatment at 106° to 75% apparent cure(Figure 5, middle, right). The lower pair of curves of Figure 6 wereobtained for a comparable sample of the ET system with 1.1 equivalentsof triethylene glycol as an additive. The temperature of maximum rateof the diol sample is reduced to 186° without prior heat treatmentand the form of the isothermal rate curve shows almost no increase afterreaching reaction temperature (107°).
X X V I I - 8

ORIGINAL PAGE ISOF POOR QUALfTY
FIGURE 5.
S"'s
i
>.
4AL3-ET
140 t"J^
f r — "" "9\^
"III** // • «*tCM
f/ ET-2-.J
7/ ' , , , , , T , , T !
T«« »• «^« -»• **« •»«T|M
3. 2 —
ET f-a.0 1U7. B*C
2.8
10
aa i2B IBB 200
ET ^ = B.« *1.1 EO.DIX
I8S.7*C
240 2B(
2.4
2.2
Z.B
3.2
2.8
2,4
ET ff- .73\B3-8-C
42.4 J/9
UB.7*C
120 160 200 24B 260 0.0 40.8 80.0 120.0 160.0 200 0T«,p T-.
FIGURE 8. AUTOCATALYSIS
XXVII -9
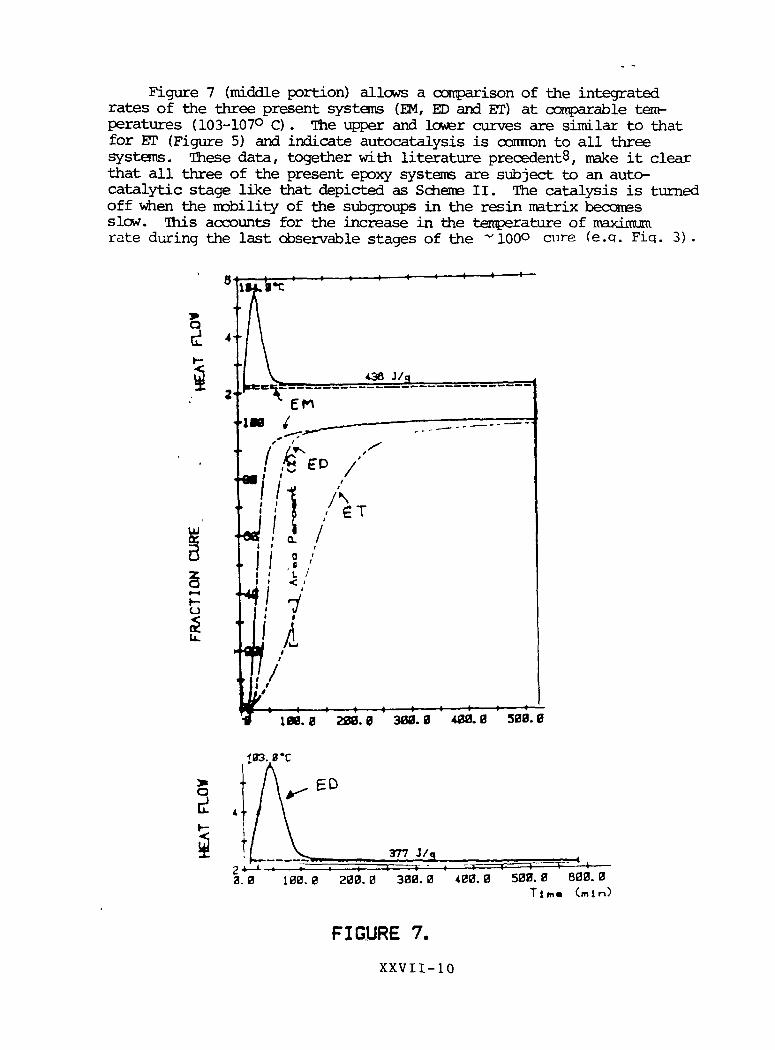
Figure 7 (middle portion) allows a comparison of the integratedrates of the three present systems (EM, ED and ET) at comparable tem-peratures (103-107° C). The upper and lower curves are similar to thatfor ET (Figure 5) and indicate autocatalysis is common to all threesystems. These data, together with literature precedents, make it clearthat all three of the present epoxy systems are subject to an auto-catalytic stage like that depicted as Scheme II. The catalysis is turnedoff when the mobility of the subgroups in the resin matrix becomesslow. This accounts for the increase in the temperature of maximumrate during the last observable stages of the ~ 100° cmre (e.q. Fiq. 3) .
IX. 0 2OT. 0 sea. 0 400.0 500.0
133. 0*C
377 J/g
3.0 100.0 208.0 300.0 400. 0 500.0 600.0T l m « (mln)
FIGURE 7.
XXVII-10

Figure 8 shews the DSC curves of each of the three resin systemsobtained from a 103-107° cure temperature and at relatively long curetines after the reaction exotherm appears to have ceased. Ihe sharplypeaked endothermic transitions are like melting transitions but are"ascribed to enthalpy relaxation which differs only in the nature ofinitial state. That is, these sharply peaked transitions do correspondto the change from an ordered to a disordered state but do not requirecrystallinity in the ordered state. For our purposes, the results ofthis figure suggest the first important point whereby tests respondingto structure variation, separated from cure, could be made. The slowlychanging nature of the cure process in this temperature range and thesimilarity in transition temperatures suggest that it should be possibleto prepare specimens of the three structurally different resins withidentical transition temperature. Tests of toughness of these specimenswould at least be on resins of constant transition temperature and"complete" cure insofar as exothermal behavior is concerned. Resultsof such tests could be very interesting.
ED: ic_--iB3'c
-2
-4
I -0
u! -e
-IB
-12-
-14-
10
131.1«C
138.0*C
-2
-4-
is
131. I*C
134. 7*C
138.3*C
120 IBB 200 120 100
12
135. S*C
135,5 C
120 16B* <°C)
FIGURE 8.
XXVII-11

ORIGINAL PAGE B$OF POOR QUALITY
Figure 9 is a composite of the types of measurements which were madeon the EM resin system. It shows that the features already discussedfor the ET system are present in the EM system as well. It shows, inaddition, the effects of subjecting the resins to a second higher curetemperature after the cure at ca. 103° C is apparently complete. Theisothermal method reveals an appreciable amount of additional heat flowat the higher second temperature which can be used to further quantifythe systems.
120. 0 160.0 ?00
F R A C T I O N CURE I-
4H/ ST
e e
IB,
120 160 200
T « m « - ~ o t o ' ~ « C O
FIGURE 9. EM-SYSTEM
» H / K EXO
X X V I I - 1 2

Figure 10 gives a more detailed view of the measureable heat flowfor the EM system. The upper portions show the isothermal exotherm mea-sured at temperatures of 103° c for the first 9 hours, 164.4° C for thenext 200 minutes and 196.7° C for the final hour. The lower portionshows the integral of the 103° exotherm normalized for the first 9 hoursand compared to batch samples at the same temperature. The agreementbetween the integral and batch methods is quite good. However, theobserved exotherms at the higher temperatures clearly show that the batchmethod gives an apparent cure which is too high. The (+) points markthe F (fraction cure) values after correction for the higher temperatureexotherm measurements. The dotted curves below the 164.4° isotherm andthe 196.7° isotherm show the integrals of the corresponding exothermsafter approximate normalization to the total measureable heat evolution.Corresponding determinations with the ET and ED systems show corres-ponding exotherms at 150-164° but no measureable heat evolution at ahigher temperature (175°).
EM ISOTHERMAL KINETICS
,, ,--44--J f2T*.2aa &B45I. 432
«-*»
AFMIWTF
.*/>
• wnw
184. 4*C
8
T
* — -
\^ 1W.7*C
03. 9 J/9 8.
f' ""
& J/g
i
1
5BB.0 eaa.0 7aa. a aaa. a\Tlm« Cm In)
a, a 4&a SB. a 122.0 IBB.H e.
FIGURE 10.
320.0
XXVII-13

Figure 11 shews the glass transitions of the resins obtained fromthe three systems after a long-term cure at 164° C. The ED and ETsystems show an apparently constant glass transition temperature after7 hours and 17 hours respectively. The ultimate glass transition tem-peratures (1510 c and 157° respectively) for these two sytems are wellbelow the final cure temperature (164°) . The results for the ED andET systems indicate that it should be possible to prepare specimensof these two matrix resins at "complete" cure as defined by the absenceof a measureable exotherm at a higher temperature and no change in glasstemperature on extended reaction time at the final (164°) cure temperature.
FIGURE 11.FINAL CURE 164°C
ET ED EM8.0
2.0B J/g
3H
152. 9*C
-1.2"
-1.8-
-2.0-
-2.4--
-2.8-
7H
17H
ISO. 1*C
23H
——» 1 1 1 1—120 160 200
13H
185. 0 *C
180.9'c 13H-A 193°C>»
187. 6 *C
13H-A 164°C.• ••••
l85.'l*C
120 180 200 120 160 200 0 4bi3 5I •mp«ra-fc.ur-« ( C)
55H
188. 2*C
-t
X X V I I - 1 4
The results of Figure 11 for the EM system are more involved. Thetransition temperature in this case is above the final cure temperature(164° C). The sharply peaked exotherm is again indicative of the enthalpyrelaxation observed for all three systems at the lower cure temperature(103-107°, Figure 8). The curve marked 13H-A is from the identicalsample that gave the 13H curve except that the sample was annealed for10 minutes at 193° and cooled quickly. The curve marked 13H-A2 wastreated in an identical fashion to 13H-A and then re-annealed at 164°for 24 hours. These observations are a demonstration of the enthalpyrelaxation phenomenon which is generally known9 to be a characteristicof such epoxy systems.
The enthalpy relaxation phenomenon is especially important for thepresent purposes because it demonstrates that these systems exist intwo states which may have different mechanical properties. Furthermorethe present results demonstrate the possibility of producing specimensat comparably "complete" cures in each of the two (ordered and dis-ordered) states for all three resin systems.
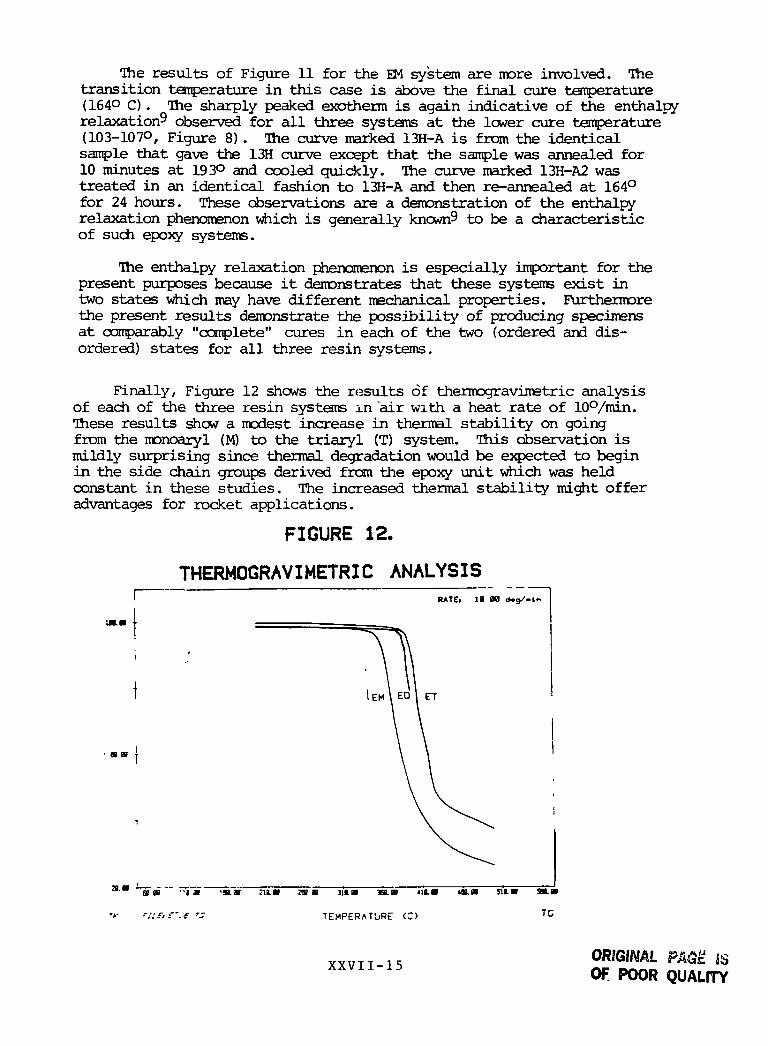
Finally, Figure 12 shows the results of thermogravimetric analysisof each of the three resin systems in "air with a heat rate of 10°/min.These results show a modest increase in thermal stability on goingfrom the monoaryl (M) to the triaryl (T) system. This observation ismildly surprising since thermal degradation would be expected to beginin the side chain groups derived from the epoxy unit which was heldconstant in these studies. The increased thermal stability might offeradvantages for rocket applications.
FIGURE 12.
THERMOGRAVIMETRIC ANALYSISRATE. IB X <*.g/.tn
im.m
a a • •>• -m.m mm 701 m mm HL» 4111
'*• '!i£,---.e r: TEMPERATURE (C) TG
XXVII -15ORIGINALOf POOR QUALITY

IV. Discussion
The present results provide the suggestion of three sets of condi-tions under which toughness test specimens might be prepared such thatthe diamine structural variation effects can be isolated. They are,first, after complete apparent cure at a temperature near 103° C.These specimens could possibly be made so that they show identicalenthalpy relaxation peak temperatures. Second, the three-resin systemcould be prepared at complete cure at a final-cure temperature near164° C. Complete cure in this case would be defined as no additionalexotherm at higher temperature and no change in observed glass transi-tion temperature on extended cure times. Finally, the latter specimenscould be induced to populate their more stable states by annealing themfor 24 hours at temperatures 10° below their glass transition tempera-tures. These conditions are summarized in Table II.
Table II
Conditions for Preparation of Comparable Specimens of EM, ED
and ET Matrix Resins
Resin TOC Tirae(hr.>
EM 103 30 138.9 164 23± 6 180 a 170
ED 103 50 138.3 164 23+ 6 157b 147
ET 106 40 135.5 164 17 151b 141
a) Specimens must be annealed at 190° for 10-15 min. to be free of enthalpyrelaxation.
b) Specimens without enthalpy relaxation.
c) Temperature of annealment for 24 hours producing the stable statesof the resins that will show the characteristic sharp enthalpyrelaxation transition peak.
It should be mentioned in closing that the present results applyto the milligram scale of sampling. Technical problems remain intranslating these results to the 100-gram scale necessary for mech-anical specimens. Some of these problems relate to the fact that allof the materials here are solids and must be melted in order to obtainthe resin mixture. Some attention to cure rates in the 60-70° Crange is needed. Also, the degree of overheating by the exothermicreaction in a large sample requires some attention.
XXVII-16

V. References
1. Martin T. Goosey, "Plastics for Electronics", Elsevier AppliedScience Publishers, New York, 1985, pp. 99-135.
2. The chemical nomenclature of E, M, D and T is problematic, beingconsistent in neither time nor convention. The epoxide (E) isusually referred to as the bis-glycidyl diether of bisphenol A.Diamine M is m-phenylenediamine or 1,3-benzenediamine. Diamine Dis 3 - [(3-aminophenyl)methylj benzenamine or 3,3'-diaminodiphenyl-methane. Diamine T is listed in Chemical Abstracts under3,3'- p.,3-phenylenebis(oxyf] bis-benzenamine.
3. Syst. No. 1756, "Beilsteins Handbuch Der Organishen Chemie", EdwardsBrothers Inc., Ann Arbor, Michigan. 1944.
4. V. Bell, B. L. Stump and H. Gager, J. Polymer Sci. (Polymer Chem.Sec.), 14, 2275-2292 (1976).
5. S. C. Misra, J. A. Manson and L. H. Sperling in "Epoxy ResinChemistry", ACS Symposium Series 114, R. S. Bauer Ed., AmericanChemical Society, Washington, D.C., 1979, pp. 137-155.
6. R. Riesen and H. Sommerauer, Amer. Lab., Jan. 1983, pp. 30-37.
7. H. F. Borchardt and F. Daniels, J. Am. Chem. Soc., 79, 41 (1957).More sophisticated methods are forthcoming. H. Hsich, R. Zurn andR. Ambrose, Polymer, 20, 203(1979); C. Douglas and D. Roylance in"Chemorheology of Thermosetting Polymers", ACS Symposium Series 227,Clayton May Ed., American Chemical Society, Washington D.C., 1985,pp. 263-279.
8. S. Sourour and M. R. Kamal, Thermochimica Acta, 14, 41 (1976);T. Oleese and 0. Spelta, J. Polymer Sci., Symposium No. 53, 113-126(1975); J. Barton, Die Makromolekulare Chemie, 171, 247 (1973);R. A. Fava, Polymer, 9_, 137 (1968) ; L. Shechter, J. Wynstra andR. Kurlejy, Ind. and Eng. Chem., 48, 94 (1956). For a dissentingopinion see M. Acitelli, R., B. Prune and E. Sacher, Polymer, 12,335 (1971).
9. R. Riessen and Horst Wyden, Mettler Application No. 3408, 1984;S. Petrie, J. Macromol. Sci.-Phys., B12(2), 225-247 (1976).
XXVIl-1?
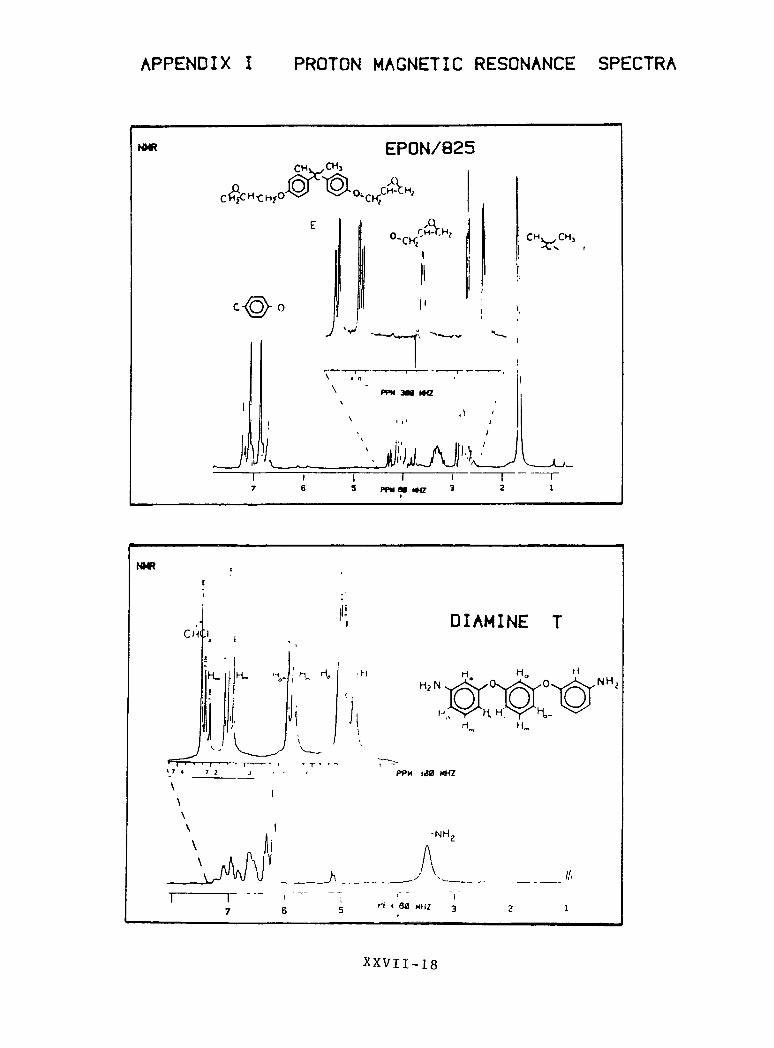
APPENDIX I PROTON MAGNETIC RESONANCE SPECTRA
EPON/825CHv/CHj
\ .'
PPM 3M WZ
- ^ C-VN.
PPMM tta
NMR
DIAMINE T
PPM <40 KHZ
-NH
XXVII -18

PROTON MAGNETIC RESONANCE SPECTRA
DIAMINE M
1[
10 66 6 6 PPM aea MHZ 6 2 60 PPM•
\\\
8\1
I T"-T T
/
/ I| 1 1 T "I—*"! 1 1 T T • | 1 1 T ' 1
6 PPM 380 MHZ H
18
17
16 WN 68 »MZ
14
13
XXVII -19

PROTON MAGNETIC RESONANCE SPECTRA
DIAMINE 0
IT—l—i—r
^ PPM 360 MHZ
CR,
360 MHZ
• i •:
• \J ' ' . __ . . .
I5
I3
PPM R0IIH7
XXVH-20