n correlation with histopathologic findings1mri/journal_club/2014 program_files/lanzman... ·...
TRANSCRIPT
Original research n
Genitourinary imaGinG
Radiology: Volume 265: Number 3—December 2012 n radiology.rsna.org 799
arterial spin-labeling Mr imaging of renal Masses: Correlation with Histopathologic Findings1
Rotem S. Lanzman, MDPhil M. Robson, PhDMaryellen R. Sun, MDAmish D. Patel, MDKimiknu Mentore, MAAndrew A. Wagner, MDElizabeth M. Genega, MDNeil M. Rofsky, MDDavid C. Alsop, PhDIvan Pedrosa, MD
Purpose: To assess the value of arterial spin-labeling (ASL) per-fusion magnetic resonance (MR) imaging in the charac-terization of solid renal masses by using histopathologic findings as the standard of reference.
Materials and Methods:
This prospective study was compliant with HIPAA and approved by the institutional review board. Informed con-sent was obtained from all patients before imaging. Forty-two consecutive patients suspected of having renal masses underwent ASL MR imaging before their routine 1.5-T clinical MR examination. Mean and peak tumor perfusion levels were obtained by one radiologist, who was blinded to the final histologic diagnosis, by using region of inter-est analysis. Perfusion values were correlated with histo-pathologic findings by using analysis of variance. A linear correlation model was used to evaluate the relationship between tumor size and perfusion in clear cell renal cell carcinoma (RCC). P , .05 was considered indicative of a statistically significant difference.
Results: Histopathologic findings were available in 34 patients (28 men, six women; mean age 6 standard deviation, 60.4 years 6 11.7). The mean perfusion of papillary RCC (27.0 mL/min/100 g 6 15.1) was lower than that of clear cell RCC (171.6 mL/min/100 g 6 61.2, P = .001), chromo-phobe RCC (152.9 mL/min/100 g 6 80.7, P = .04), unclas-sified RCC (208.0 mL/min/100 g 6 41.1, P = .001), and oncocytoma (373.9 mL/min/100 g 6 99.2, P , .001). The mean and peak perfusion levels of oncocytoma (373.9 mL/min/100 g 6 99.2 and 512.3 mL/min/100 g 6 146.0, re-spectively) were higher than those of papillary RCC (27.0 mL/min/100 g 6 15.1 and 78.2 mL/min/100 g 6 39.7, P , .001 for both), chromophobe RCC (152.9 mL/min/100 g 6 80.7 and 260.9 mL/min/100 g 6 61.9; P , .001 and P = .02, respectively), and unclassified RCC (208.0 mL/min/100 g 6 41.1 and 273.3 mL/min/100 g 6 83.4; P = .01 and P = .03, respectively). The mean tumor perfusion of oncocytoma was higher than that of clear cell RCC (P , .001).
Conclusion: ASL MR imaging enables distinction among different his-topathologic diagnoses in renal masses on the basis of their perfusion level. Oncocytomas demonstrate higher perfusion levels than RCCs, and papillary RCCs exhibit lower perfusion levels than other RCC subtypes.
q RSNA, 2012
1 From the Department of Diagnostic and Interventional Radiology, University of Dusseldorf, Medical Faculty, Dusseldorf, Germany (R.S.L.); Translational and Molecular Imaging Institute, Mount Sinai School of Medicine, New York, NY (P.M.R.); Departments of Radiology (M.R.S., A.D.P., K.M., D.C.A., I.P.), Surgery (A.A.W.), and Pathology (E.M.G.), Beth Israel Deaconess Medical Center, Boston, Mass; and Department of Radiology, UT Southwestern Medical Center, 5323 Harry Hines Blvd, Dallas, TX 75390 (N.M.R., I.P.). Received October 23, 2011; revision requested December 14; revision received May 16, 2012; accepted June 1; final version accepted June 5. Supported in part through the Harvard Catalyst/The Harvard Clinical and Translational Science Center (NIH grant 1 UL1 RR 025758-01, principal investigator: I.P.). Address correspondence to I.P. (e-mail: [email protected]).
q RSNA, 2012
Note: This copy is for your personal non-commercial use only. To order presentation-ready copies for distribution to your colleagues or clients, contact us at www.rsna.org/rsnarights.
800 radiology.rsna.org n Radiology: Volume 265: Number 3—December 2012
GENITOURINARY IMAGING: Arterial Spin-labeling MR Imaging of Renal Masses Lanzman et al
board, and written informed consent was prospectively obtained from all pa-tients before imaging. Forty-two consec-utive patients (34 men, eight women; mean age 6 standard deviation, 60.1 years 6 11.3) scheduled to undergo presurgical MR imaging evaluation of suspected renal masses agreed to par ticipate in this study. Patients under-went MR imaging evaluation of the renal masses between October 2008 and June 2010 with a noncommercially available ASL sequence (see below) fol-lowed by our standard clinical MR im-aging protocol for renal masses.
Clinical MR Imaging ProtocolAll patients were imaged in the su-pine position with a commercial 1.5-T unit (Excite TwinSpeed; GE Medical Systems, Waukesha, Wis) by using an eight-channel phased-array surface coil. In all patients, image acquisition consist-ed of a T2-weighted coronal half-Fouri-er single-shot fast spin-echo sequence (repetition time msec/echo time msec = 884/65, 4-mm-thick sections, no gap, 192 3 256 matrix, 130° flip angle, 40-cm field of view; 662-kHz bandwidth), an axial dual-echo T1-weighted in-phase and opposed-phase gradient-echo sequence (180/2.1, 4.4; 7-mm-thick sections; 1-mm gap; 160 3 256 matrix;
to the contributions of both blood flow and vascular permeability to tissue en-hancement, these estimations of tumor perfusion are imperfect (13).
Alternatively, tumor perfusion can be determined without the injection of contrast material by using arterial spin-labeling (ASL) MR imaging (14–17). This technique uses blood as an en-dogenous contrast material by noninva-sively labeling inflowing spins with the radiofrequency and gradient fields of the MR unit. The difference between im-ages acquired with and without labeling provides the basis for the calculation of tissue perfusion. Potential advantages of ASL MR imaging include the ability to obtain a direct determination of tissue perfusion that is not affected by vessel permeability, the possibility of numer-ous acquisitions in the same patient, and the ability to safely assess patients with renal impairment because intravenous contrast material is not necessary (18).
Recently, the value of ASL MR imaging for characterizing nonrenal tumors on the basis of their angiogen-esis has been highlighted (19). A cor-relation between ASL signal intensity changes and both histologically derived microvascular area in meningiomas and tumor grade in brain tumors has been shown (20,21). Furthermore, the utility of ASL MR imaging to monitor the response to antiangiogenic therapy and radiofrequency ablation in RCC has been recently reported in both human and animal studies (22–24).
The purpose of our study was to assess the value of ASL perfusion MR imaging in the characterization of solid renal masses by using histopathologic findings as the standard of reference.
Materials and MethodsThis Health Insurance Portability and Accountability Act–compliant study was approved by the institutional review
Renal cell carcinoma (RCC) accounts for 3% of all adult malignancies and is the most lethal urogenital
tumor (1). Clear cell (frequency, 65%–70%), papillary (frequency, 10%–15%), and chromophobe (frequency, 6%–11%) RCCs are the most common RCC sub-types and differ in their histologic ap-pearance and response to anticancer therapy (2,3). Percutaneous biopsy can provide a histologic diagnosis, although erroneous characterization of renal masses (4) and insufficient material for diagnosis (5) represent important limi-tations. Furthermore, inaccurate RCC subtyping may occur in 12%–14% of re-nal biopsies and tumor grade has been shown to be unreliable (6).
Magnetic resonance (MR) imaging has emerged as a pivotal imaging tech-nique in the characterization of renal le-sions (7,8). Histologic subtypes of RCC can be differentiated with MR imaging on the basis of morphologic features and enhancement patterns (9–11). Fur-thermore, perfusion measurements like the initial area under the contrast ma-terial concentration–time curve and the transfer constant between the blood plasma and extracellular extravascular space (Ktrans) derived from dynamic contrast material–enhanced (DCE) MR imaging have shown promising initial results in the assessment of histologic grades of RCC (12). However, owing
Implication for Patient Care
n ASL MR imaging may improve the noninvasive characterization of renal masses and has the potential, if confirmed in larger studies, to help avoid unneces-sary biopsies and surgery in patients with renal masses.
Advances in Knowledge
n In our preliminary experience, quantification of tumor perfusion in renal masses was feasible by using arterial spin-labeling (ASL) MR imaging without the need for contrast material administration.
n The mean and peak perfusion levels of oncocytoma (373.9 mL/min/100 g 6 99.2 and 512.3 mL/min/100 g 6 146.0, respectively) were significantly higher than those of renal cell carcinoma (RCC) (P , .01).
n The mean and peak perfusion levels in papillary RCC (27.0 mL/min/100 g 6 15.1 and 78.2 mL/min/100 g 6 39.7, respectively) were significantly lower than those for other RCC subtypes (P , .01).
Published online before print10.1148/radiol.12112260 Content code:
Radiology 2012; 265:799–808
Abbreviations:ASL = arterial spin labelingDCE = dynamic contrast material enhancedRCC = renal cell carcinomaROI = region of interest
Author contributions:Guarantor of integrity of entire study, I.P.; study concepts/study design or data acquisition or data analysis/interpreta-tion, all authors; manuscript drafting or manuscript revision for important intellectual content, all authors; manuscript final version approval, all authors; literature research, R.S.L., D.C.A., I.P.; clinical studies, M.R.S., K.M., E.M.G., D.C.A., I.P.; experimental studies, P.M.R., I.P.; statistical analysis, R.S.L., A.D.P., D.C.A., I.P.; and manuscript editing, R.S.L., P.M.R., M.R.S., A.D.P., A.A.W., E.M.G., N.M.R., D.C.A., I.P.
Funding:This research was supported by the National Institutes of Health (grant 1 UL1 RR 025758-01).
Conflicts of interest are listed at the end of this article.
Radiology: Volume 265: Number 3—December 2012 n radiology.rsna.org 801
GENITOURINARY IMAGING: Arterial Spin-labeling MR Imaging of Renal Masses Lanzman et al
ROI values obtained from these perfusion images represent blood flow in milliliters per minute per 100 g of tissue (27).
Preliminary experience indicates that a small positive perfusion value can be measured even in the absence of per-fusion (30). This offset results from noise in the difference ASL images in combi-nation with magnitude imaging. This effect can be reduced, although not en-tirely eliminated, with use of homodyne reconstruction and phased coil combina-tion (30). To estimate this noise-induced offset in the perfusion measurement, we took advantage of the linearity of blood flow quantification, that is, blood flow = calibration constant 3 difference ASL signal, where the calibration constant is dependent on the signal intensity on the reference image and other parameters unrelated to the ASL difference signal (27). The mean signal intensity in the whole tumor and the mean signal in-tensity in an ROI outside the body, in an area without apparent ghosting arti-facts, were measured on the difference ASL images. Because noise is uniformly distributed in the difference ASL image, the mean signal intensity in an ROI out-side the body should reflect the signal intensity that would be measured in the lesion ROI (mean signal intensity in the whole tumor) in the absence of perfu-sion. To convert the mean signal inten-sity in an ROI outside the body (Diffnoise) to an estimated perfusion offset (Pnoise), we used the same calibration constant as for the lesions: Pnoise = Pwhole 3 Diff-noise/Diffwhole, where Pwhole is the measured perfusion in the lesion and Diffwhole the mean signal intensity in the whole tu-mor. The estimated perfusion offset was averaged across lesions to estimate the contribution to perfusion from noise.
In addition, another radiologist with 4 years of experience in body MR imag-ing (M.R.S.), who was blinded to the his-topathologic and ASL results, analyzed the enhancement patterns of the renal masses on dynamic three-dimensional T1-weighted spoiled gradient-recalled images. For maximum enhancement, an ROI of approximately 1 cm2 was drawn in the area with the highest enhance-ment at visual assessment in the cortico-medullary phase. In addition, a second ROI was drawn around the entire tumor on a section corresponding to the ASL
resulting in a total acquisition time of ap-proximately 3.5 minutes.
Image reconstruction.—Off-line re-construction was performed with cus-tom programs in the IDL programming language (ITT Visual Information Solu-tions, Boulder, Colo). ASL label-control pairs were subtracted and averaged in complex k space before image recon-struction. Each image acquisition was reconstructed to generate (a) a proton density–weighted reference image, (b) a difference image (ie, labeled image mi-nus control image), and (c) a quantita-tive perfusion image, which assumes the labeled water spends most of the time after labeling within the blood of arteries and microvasculature (27–29). Although the recovery of the longitudinal magne-tization of the labeled spins is potentially influenced by the T1 of the perfused tis-sue, this assumption has likely minimal effect in the calculation of tumor per-fusion because viable, perfused tumor tissues characteristically have a longer T1, not much shorter than that of blood. Perfusion calculations were not based on tissue T1 determinations because mis-registration between images at different inversion times, common in the abdomen due to respiratory motion, can lead to re-construction artifacts (27).
Image analysis.—All data were an-alyzed with a Mac Pro platform (OS X; Apple Computer, Cupertino, Calif) equipped with an open-source Digital Imaging and Communications in Med-icine viewer (Osirix X, version 3.1, 32 bit, Bernex, Switzerland). A radiologist with 4 years of experience in body MR imaging (R.S.L.), who was unaware of the histologic diagnosis, analyzed the ASL data. Standard MR images, includ-ing T1-weighted, T2-weighted, and DCE T1-weighted images, were reviewed to assess the extent of the renal mass. ASL perfusion was measured with a region of interest (ROI) drawn around the outer contour of the target lesions on the pro-ton density–weighted reference images to assess whole tumor perfusion. ROIs were then copied to the ASL perfusion image obtained at the same level. To as-sess peak tumor perfusion, an additional ROI of approximately 1 cm2 was placed within the region of the tumor that dem-onstrated the highest signal intensity with visual assessment of the perfusion image.
80° flip angle; 37-cm field of view; 631.25-kHz bandwidth), and coronal and sagittal three-dimensional frequen-cy-selective fat-saturated T1-weight-ed spoiled gradient-echo sequences (3.7/1.7, preinterpolation section thick ness = 3 mm, 192 3 256 matrix, 10° flip angle, 40-cm field of view, 662-kHz bandwidth) (11). Dynamic three-dimensional T1-weighted spoiled gra-dient-echo imaging was performed in the coronal plane after administration of a bolus of 0.1 mmol per kilogram body weight gadopentate dimeglu-mine (Magnevist; Berlex Laboratories, Wayne, NJ) at a rate of 2 mL/sec fol-lowed by a 20-mL saline flush. A test bolus of 2 mL was used to time the first pass based on corticomedullary arrival (25). The early and late nephrographic phases were started 20 seconds and 40 seconds, respectively, after com-pletion of the initial (corticomedullary) acquisition.
ASL MR ImagingASL MR imaging was performed before the administration of contrast material by using a single section through the center of the renal mass in the coronal plane in all but four patients, who underwent imaging in the axial plane owing to the location of the mass. All ASL acquisitions were prescribed following directions of a radiologist (I.P.) who selected the best imaging plane based on the anatomic lo-cation of the mass. Perfusion imaging was achieved with pseudocontinuous labeling (26), optimized background suppression, and a single-shot fast spin-echo sequence (27). For control images, single-shot fast spin-echo images were obtained with a 40-cm field of view, a 128 3 128 matrix, and 10-mm-thick sections. Then, labeling was performed in an axial plane 8–10 cm upstream from the center of the tar-get lesion in the upper abdominal aorta for 1500 msec followed by a 1500-msec postlabeling delay. A repetition time of 6 seconds was used to allow for recov-ery of blood signal, and patients were instructed to breathe in the quiet pe-riods between the 6-second acquisitions. Patient respiratory motion was moni-tored with abdominal rubber bellows, and good compliance was confirmed in all patients. Sixteen label and con-trol pairs were acquired and averaged,
802 radiology.rsna.org n Radiology: Volume 265: Number 3—December 2012
GENITOURINARY IMAGING: Arterial Spin-labeling MR Imaging of Renal Masses Lanzman et al
radiofrequency ablation (n = 1) without evidence of recurrent disease or meta-chronous renal tumors. Thus, 34 patients (28 men, six women; mean age, 60.4 years 6 11.7) represent our final study group. Histopathologic diagnosis was ob-tained by means of radical nephrectomy (n = 14), partial nephrectomy (n = 15), or percutaneous core biopsy (n = 5). The mean interval between MR imaging and histologic analysis was 27.4 days 6 22.1. Histopathologic analysis revealed RCC in 28 patients, with clear cell RCC being the most common subtype (n = 15). Eight clear cell RCCs were classified as low grade (Fuhrman grade 1–2) and seven were classified as high grade (Fuhrman grade 3–4). Nine clear cell RCCs were classified as stage pT1 and six were clas-sified as stage pT3. The final diagnosis in the remaining masses included chromo-phobe RCC (n = 4), papillary RCC (n = 5), unclassified RCC (n = 4), and onco-cytoma (n = 4). Two cases in our series, one poorly differentiated urothelial car-cinoma and one tubulocystic RCC, were not included in the statistical analysis be-cause of their low prevalence.
Imaging FeaturesThe maximum tumor diameter ranged from 1.4 to 15.7 cm (mean, 5.5 cm 6 3.5) and did not differ significantly among papillary RCC (mean, 7.9 cm 6 5.5), clear cell RCC (mean, 5.7 cm 6 3.3), chromophobe RCC (mean, 6.6 cm 6 3.4), unclassified RCC (mean, 3.6 cm 6 1.8), and oncocytoma (mean, 3.5 cm 6 1.6) (P = .31, F test) (Table 1).
tumor perfusion, and maximum tumor perfusion. The mean, standard devi-ation, and median of these variables for each tumor type were calculated. A Levene test was used to test the homo-geneity of variance for ASL perfusion among different groups, and homoge-neity of variances was assumed for P . .05 (mean tumor perfusion with ASL [P = .06] and peak perfusion with ASL [P = .1]). Analysis of variance was used to evaluate size and perfusion differ-ences between the different histologic subtypes of renal masses. For those analyses resulting in a significant F ra-tio, a Tukey honestly significant differ-ence test was performed to determine differences among means for each group. Differences in mean perfusion between low-grade and high-grade RCC as well as tumor stage were assessed with the Student t test. The Spearman rank-order correlation was used to as-sess the correlation between tumor size and tumor perfusion as well as ASL perfusion and DCE MR imaging param-eters. P , .05 was considered indica-tive of a significant difference.
ResultsImage acquisition was completed suc-cessfully in all 42 patients. Eight patients were excluded from further analysis be-cause there was no evidence of renal masses on MR images (n = 3), a histo-pathologic diagnosis of the renal mass was not obtained before this analysis (n = 3), or imaging was performed af-ter either partial nephrectomy (n = 1) or
acquisition for assessment of the con-trast enhancement of the whole tumor. These ROIs were then transferred to the automatically coregistered precon-trast and early nephrogenic phase im-ages. When required because of slight variations in position owing to different respiratory efforts, manual corrections were performed to ensure that the same areas in the tumor were sampled within the different acquisitions. Data for both whole tumor and maximum enhance-ment were recorded as percentage en-hancement, which was calculated as follows: (postcontrast signal intensity 2 precontrast signal intensity)/precontrast signal intensity.
Standard of reference.—Results of the histopathologic analysis served as the standard of reference. The final diagnosis was provided by one of two uropatholo-gists (including one author, E.M.G.), both with more than 10 years of experience. All tumors were classified into one of the following categories: (a) low-grade clear cell RCC (Fuhrman I–II), (b) high-grade clear cell RCC (Fuhrman III–IV), (c) pap-illary RCC, (d) chromophobe RCC, (e) unclassified RCC, or (f) oncocytoma. Papillary and chromophobe RCCs were not assigned a Furhman grade (31,32).
Statistical analysis.—Tumors were analyzed according to both pathologic subtype and grade (high-grade clear cell RCC, low-grade clear cell RCC, papillary RCC, chromophobe RCC, unclassified RCC, and oncocytoma). Subsequent statistical analysis used the outcome variables of tumor size, whole
Table 1
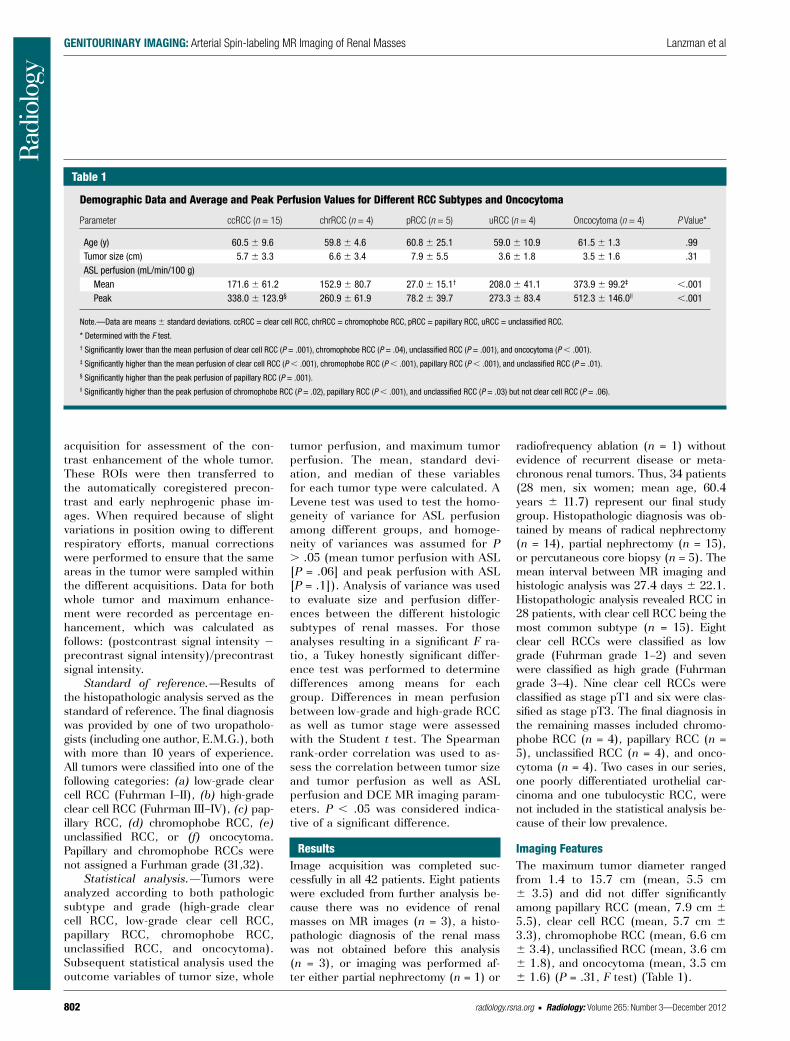
Demographic Data and Average and Peak Perfusion Values for Different RCC Subtypes and Oncocytoma
Parameter ccRCC (n = 15) chrRCC (n = 4) pRCC (n = 5) uRCC (n = 4) Oncocytoma (n = 4) P Value*
Age (y) 60.5 6 9.6 59.8 6 4.6 60.8 6 25.1 59.0 6 10.9 61.5 6 1.3 .99Tumor size (cm) 5.7 6 3.3 6.6 6 3.4 7.9 6 5.5 3.6 6 1.8 3.5 6 1.6 .31ASL perfusion (mL/min/100 g) Mean 171.6 6 61.2 152.9 6 80.7 27.0 6 15.1† 208.0 6 41.1 373.9 6 99.2‡ ,.001 Peak 338.0 6 123.9§ 260.9 6 61.9 78.2 6 39.7 273.3 6 83.4 512.3 6 146.0|| ,.001
Note.—Data are means 6 standard deviations. ccRCC = clear cell RCC, chrRCC = chromophobe RCC, pRCC = papillary RCC, uRCC = unclassified RCC.
* Determined with the F test.† Significantly lower than the mean perfusion of clear cell RCC (P = .001), chromophobe RCC (P = .04), unclassified RCC (P = .001), and oncocytoma (P , .001).‡ Significantly higher than the mean perfusion of clear cell RCC (P , .001), chromophobe RCC (P , .001), papillary RCC (P , .001), and unclassified RCC (P = .01).§ Significantly higher than the peak perfusion of papillary RCC (P = .001).|| Significantly higher than the peak perfusion of chromophobe RCC (P = .02), papillary RCC (P , .001), and unclassified RCC (P = .03) but not clear cell RCC (P = .06).

Radiology: Volume 265: Number 3—December 2012 n radiology.rsna.org 803
GENITOURINARY IMAGING: Arterial Spin-labeling MR Imaging of Renal Masses Lanzman et al
Figure 1
Figure 1: Box plot of mean ASL perfusion levels (Pwhole
) according to histologic type. Boxes depict interquartile ranges, bounded inferiorly by the first quartile and superiorly by the third quartile. Horizontal lines within boxes represent the median. Smallest and largest nonoutlier values are marked with horizontal ticks, which are connected to boxes with a vertical line. ccRCC = clear cell RCC, chrRCC = chromophobe RCC, pRCC = papillary RCC, uRCC = unclassified RCC.
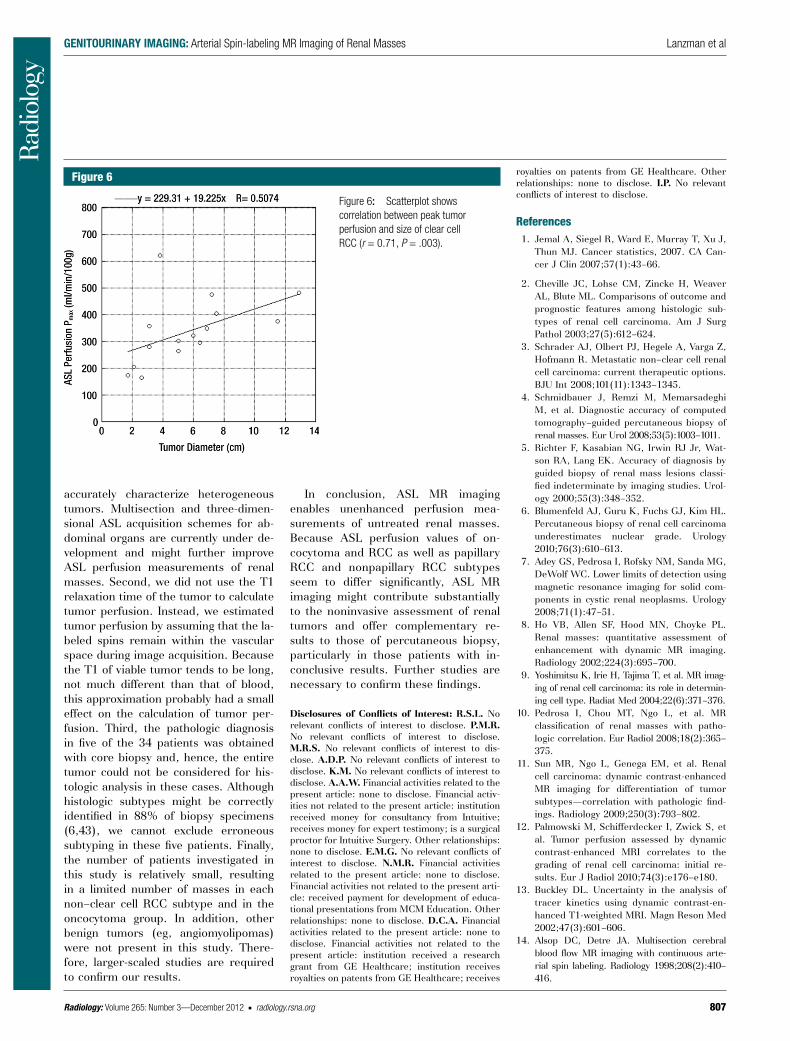
vs high-grade clear cell RCC) or stage (ie, pT1 tumors vs pT3 tumors) (Table 2). We observed a significant correla-tion between peak perfusion and clear cell RCC (r = 0.71, P = .003) (Fig 6), whereas no relationship was found be-tween tumor size and mean perfusion for these tumors (r = 0.03, P = .92).
The mean and median perfusion values measured from pure noise were 13.1 mL/min/100 g 6 5.3 and 11.9 mL/min/100 g, respectively. The lowest mean and peak perfusion levels detect-ed in a renal mass were 27 mL/min/100 g and 78 mL/min/100 g, respectively, in a papillary RCC.
DCE MR ImagingChanges in tumor enhancement during the corticomedullary and nephrogenic phases are summarized in Table 3. The enhancement of the whole tumor was slightly higher than the maxi-mum enhancement for chromophobe RCC (corticomedullary phase) and
ASL PerfusionTable 1 summarizes the perfusion of all renal masses tabulated on the basis of their histologic diagnosis. Using analysis of variance, we found a significant differ-ence among histologic subtypes for both mean tumor perfusion (P , .001, F test) and peak tumor perfusion (P , .001, F test). The mean perfusion of oncocytoma was significantly higher than that of pap-illary RCC, clear cell RCC, chromophobe RCC (P , .001 for all), and unclassified RCC (P = .01). The mean perfusion of papillary RCC was significantly lower than that of clear cell RCC, chromophobe RCC (P = .001 for both), unclassified RCC (P = .04), and oncocytoma (P , .001). The mean peak perfusion of oncocytoma was significantly higher than that of papillary RCC (P , .001), chromophobe RCC (P = .02), and unclassified RCC (P = .03). Furthermore, the mean peak perfusion of papillary RCC was significantly lower than that of clear cell RCC (P = .001) (Table 1; Figs 1–5).
There were no differences in mean and peak perfusion on the basis of tu-mor grade (ie, low-grade clear cell RCC
Figure 2
Figure 2: Box plot of peak ASL perfusion levels (Pmax
) according to histologic type. Boxes depict interquartile ranges, bounded inferiorly by the first quartile and superiorly by the third quartile. Horizontal lines within boxes represent the median. Smallest and largest nonoutlier values are marked with horizontal ticks, which are connected to boxes with a vertical line. Boxes depict interquartile ranges, bounded inferiorly by the first quartile and superiorly by the third quartile. Horizontal lines within boxes rep-resent the median. Open circles denote outliers. ccRCC = clear cell RCC, chrRCC = chromophobe RCC, pRCC = papillary RCC, uRCC = unclassified RCC.
unclassified RCC (nephrogenic phase). We found significant differences in contrast enhancement of the whole tumor (P = .002) and maximum con-trast enhancement (P = .004) among histologic subtypes. There was a signif-icant correlation between mean whole tumor perfusion at ASL imaging and mean whole tumor contrast enhance-ment at the corticomedullary phase (r = 0.54, P = .002) and nephrogenic phase (r = 0.56, P = .001). Similarly, we observed a significant correlation for the maximum perfusion with ASL and maximum tumor enhancement at the corticomedullary phase (r = 0.56, P = .001) and nephrogenic phase (r = 0.55, P = .001).
Discussion
Recent improvements in MR imaging techniques allow for a new paradigm in oncologic imaging by shifting from a pure morphologic evaluation of tumors
804 radiology.rsna.org n Radiology: Volume 265: Number 3—December 2012
GENITOURINARY IMAGING: Arterial Spin-labeling MR Imaging of Renal Masses Lanzman et al
intermediate enhancement of chromo-phobe RCC (11,38,39). However, tumor perfusion was not quantified in previous studies and the percentage of signal in-tensity and/or attenuation changes fol-lowing the administration of contrast material varied widely depending on the imaging technique used.
In contrast to the findings reported by Palmowski et al (12) with DCE MR imaging, we did not observe a signifi-cantly higher perfusion in high-grade compared with low-grade clear cell
tumor perfusion as measured with ASL and tumor vascularity based on levels of enhancement after contrast material administration may not be possible, our findings with ASL MR imaging are in good concordance with the DCE MR imaging results in our cohort and those of previous contrast-enhanced com-puted tomographic (CT) and MR im-aging studies that reported significantly lower enhancement for papillary RCC compared with the relatively high en-hancement levels of clear cell RCC and
(ie, measurements of tumor size and extent) toward an assessment of the physiologic characteristic of tumors, in-cluding evaluation of tumor perfusion, oxygenation, and diffusion character-istics (12,22,33–35). Assessment of tumor perfusion is of particular inter-est in renal cancer because of the in-trinsic molecular alterations promoting angiogenesis that characterize these tumors. Studies in clear cell RCC have highlighted the connection between tu-mor angiogenesis and prognosis and its ability to metastasize (36,37). Recent improvements in ASL MR imaging tech-niques (eg, pulsed continuous labeling and background suppression strategies) have enabled consistent measurements of renal perfusion; there is good cor-relation between ASL perfusion mea-surements and total renal blood flow as measured with phase-contrast MR im-aging, and the test-retest repeatability of ASL MR imaging for renal perfusion is 7% (27). The development of these improved ASL MR imaging acquisitions together with the hypervascular nature of RCC have provided a unique scenario for assessment of the angiogenic char-acteristics of these tumors. For exam-ple, de Bazelaire et al (22) showed that early changes in ASL perfusion of RCC metastases 1 month after initiation of antiangiogenic therapy correlated with changes in tumor size at 4 months as well as with progression-free survival. Furthermore, the potential of ASL MR imaging for assessing differences in baseline perfusion of distinct RCC xenograft cell lines in a mouse model and monitoring perfusion changes in response to an antiangiogenic therapy have been demonstrated (23). How-ever, to the best of our knowledge, our data represent the first report regard-ing ASL MR imaging in the character-ization of untreated solid renal masses in humans.
Our initial results suggest that ASL imaging has the potential to help in the MR characterization of renal masses by providing a quantification of tumor perfusion. Perfusion levels in papillary RCCs were significantly lower than those for all other RCC subtypes. Al-though a direct comparison between
Figure 3
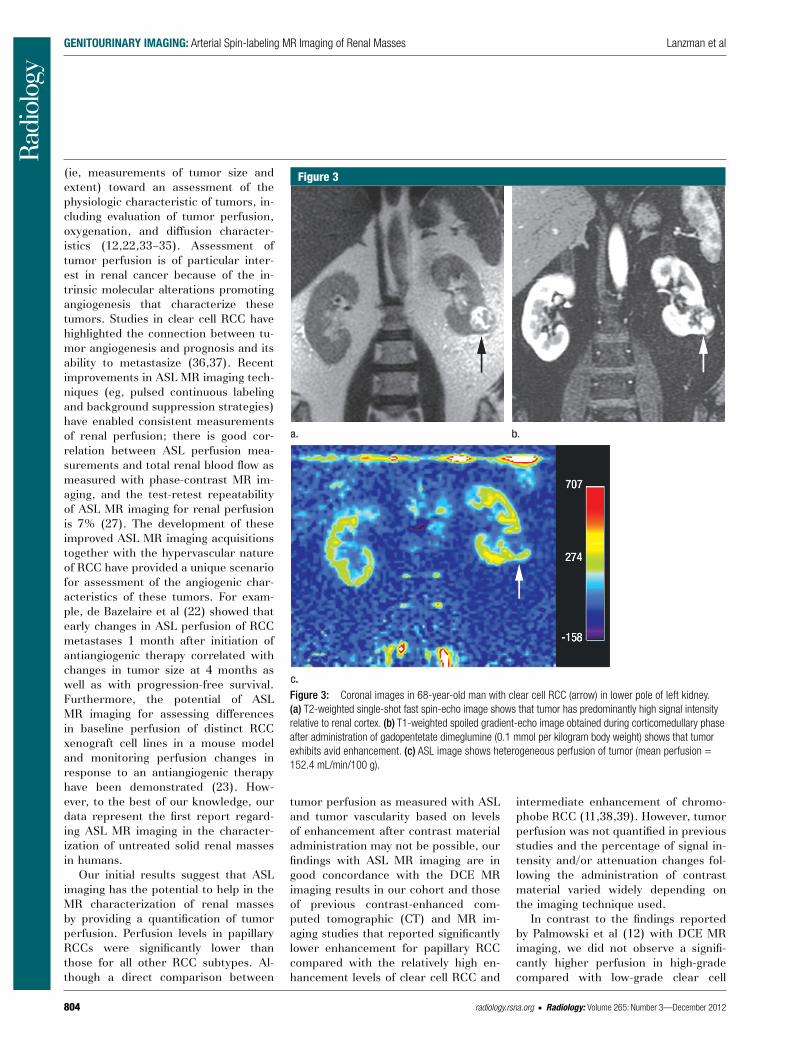
Figure 3: Coronal images in 68-year-old man with clear cell RCC (arrow) in lower pole of left kidney. (a) T2-weighted single-shot fast spin-echo image shows that tumor has predominantly high signal intensity relative to renal cortex. (b) T1-weighted spoiled gradient-echo image obtained during corticomedullary phase after administration of gadopentetate dimeglumine (0.1 mmol per kilogram body weight) shows that tumor exhibits avid enhancement. (c) ASL image shows heterogeneous perfusion of tumor (mean perfusion = 152.4 mL/min/100 g).
Radiology: Volume 265: Number 3—December 2012 n radiology.rsna.org 805
GENITOURINARY IMAGING: Arterial Spin-labeling MR Imaging of Renal Masses Lanzman et al
tumor perfusion was correlated with tumor grade for all histologic subtypes. We did not correlate perfusion with tumor grade in papillary RCC because of the characteristic very low perfusion levels for these tumors and the fact that papillary RCC has been relatively recently classified into two different subvariants (types 1 and 2) that have distinct biologic behavior and progno-sis independent of their Fuhrman grade (40).
We observed a statistically signifi-cant relationship between maximum tumor perfusion and increasing tumor size for the clear cell RCC subtype (r = 0.71, P = .003). However, we found no similar relationship for whole-tumor perfusion determinations. This finding likely illustrates the heterogeneous na-ture of clear cell RCC and may reflect the presence of focal areas of intense angiogenesis coexisting with areas of low angiogenesis and/or necrosis in the same tumor. Indeed, tumor size and necrosis, both at histopathologic exam-ination (41) and MR imaging (10), have been associated with a higher histologic grade in clear cell RCC. The potential implications of perfusion heterogeneity at ASL MR imaging for tumor growth, aggressiveness, and metastatic poten-tial deserve further investigation.
Our study cohort included four onco-cytomas. Traditional MR imaging features of oncocytoma may be indistinguishable from those of chromophobe RCC (42). However, Zhang et al (39) reported avid enhancement in oncocytomas on con-trast-enhanced CT scans but did not find a significant difference between these and clear cell RCCs. Similarly, oncocytomas
techniques, and the grading of only the clear cell RCC subtype in our cohort; in the study by Palmowski et al (12),
RCC tumors. This discrepancy might be attributed to our relatively small sample size, the differences in imaging
Figure 4
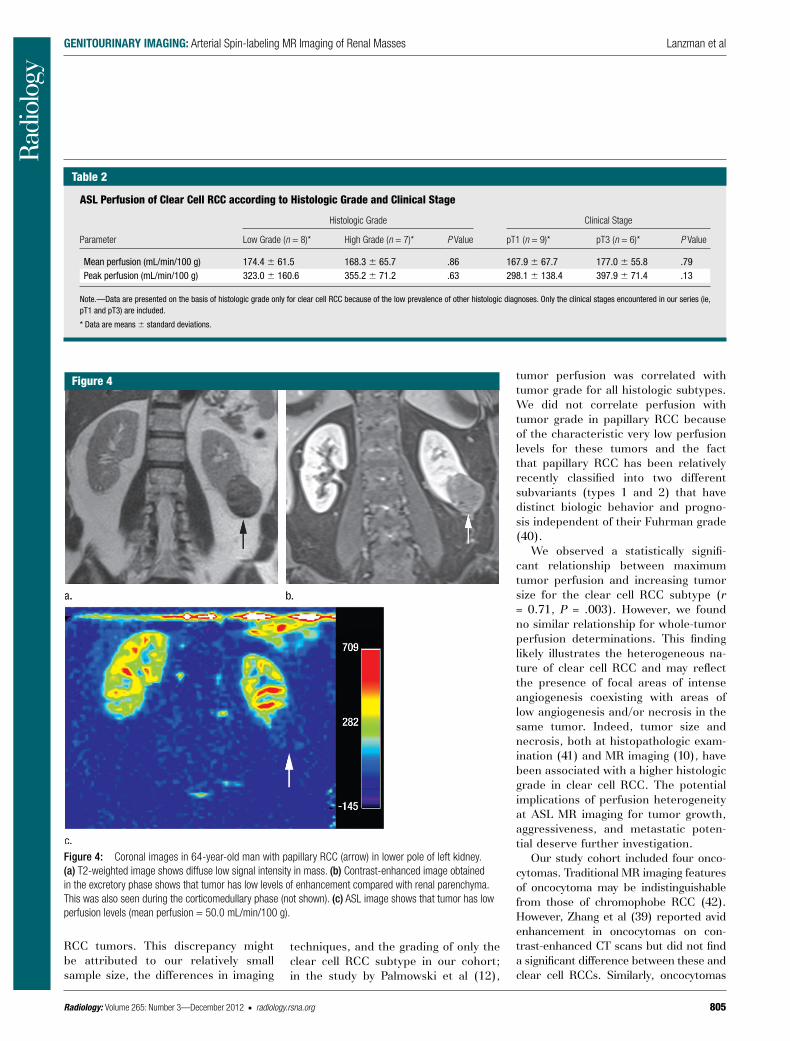
Figure 4: Coronal images in 64-year-old man with papillary RCC (arrow) in lower pole of left kidney. (a) T2-weighted image shows diffuse low signal intensity in mass. (b) Contrast-enhanced image obtained in the excretory phase shows that tumor has low levels of enhancement compared with renal parenchyma. This was also seen during the corticomedullary phase (not shown). (c) ASL image shows that tumor has low perfusion levels (mean perfusion = 50.0 mL/min/100 g).
Table 2
ASL Perfusion of Clear Cell RCC according to Histologic Grade and Clinical Stage
Parameter
Histologic Grade Clinical Stage
Low Grade (n = 8)* High Grade (n = 7)* P Value pT1 (n = 9)* pT3 (n = 6)* P Value
Mean perfusion (mL/min/100 g) 174.4 6 61.5 168.3 6 65.7 .86 167.9 6 67.7 177.0 6 55.8 .79Peak perfusion (mL/min/100 g) 323.0 6 160.6 355.2 6 71.2 .63 298.1 6 138.4 397.9 6 71.4 .13
Note.—Data are presented on the basis of histologic grade only for clear cell RCC because of the low prevalence of other histologic diagnoses. Only the clinical stages encountered in our series (ie, pT1 and pT3) are included.
* Data are means 6 standard deviations.

806 radiology.rsna.org n Radiology: Volume 265: Number 3—December 2012
GENITOURINARY IMAGING: Arterial Spin-labeling MR Imaging of Renal Masses Lanzman et al
and clear cell RCCs could not be differ-entiated with DCE MR imaging in our co-hort. In contrast, our results suggest that oncocytomas can be differentiated from clear cell, chromophobe, unclassified, and papillary RCCs on the basis of their significantly higher perfusion at ASL MR imaging. If validated in larger series, ASL may help characterize renal oncocytomas and therefore provide a tool to avoid un-necessary percutaneous biopsies and/or surgical resections.
A potential limitation of ASL MR im-aging is the lower sensitivity for the de-tection of viable tumor with low levels of perfusion compared with contrast-enhanced techniques. This may have implications for characterizing papillary RCC and predominantly cystic lesions with very small nodular components (7). The lowest mean and peak perfu-sion levels detected in our series were 27 mL/min/100 g and 78 mL/min/100 g, respectively. The mean value is roughly at three standard deviations of the mean measured perfusion value derived from pure noise (~28 mL/min/100 g), indicating that the detection of tumor perfusion in extremely hypovascular renal masses with the proposed ASL technique may be challenging.
Our study has several limitations. First, ASL perfusion measurements were performed with a single section through the center of the mass. This ap-proach may have limited our ability to
Table 3
Whole Tumor Enhancement and Maximum Tumor Enhancement at Corticomedullary and Nephrogenic Phases
Parameter ccRCC chrRCC pRCC uRCC Oncocytoma P Value*
Whole tumor enhancement (%) Corticomedullary phase 109.0 6 57.1 61.0 6 34.6 14.2 6 10.0† 90.2 6 53.5 159.7 6 60.7 .002 Nephrogenic phase 195.8 6 86.0 107.8 6 15.2 37.7 6 23.4‡ 223.6 6 106.4 240.7 6 69.8 .001Maximum enhancement (%) Corticomedullary phase 214.9 6 124.9§ 59.6 6 22.4 22.3 6 14.8 99.0 6 46.7 175.3 6 53.7 .002 Nephrogenic phase 280.8 6 110.0 118.0 6 17.6 77.7 6 41.5|| 213.6 6 133.2 251.1 6 129.1 .004
Note.—Enhancement was compared with that on precontrast images and is given as mean 6 standard deviation. ccRCC = clear cell RCC, chrRCC = chromophobe RCC, pRCC = papillary RCC, uRCC = unclassified RCC.
* Determined with the F test.† Significantly lower than that of clear cell RCC (P = .01) and oncocytoma (P = .002).‡ Significantly lower than that of clear cell RCC (P = .003), unclassified RCC (P = .009), and oncocytoma (P = .004).§ Significantly higher than that of chromophobe RCC (P = .04) and papillary RCC (P = .004).|| Significantly lower than that of clear cell RCC (P = .005).
Figure 5
Figure 5: Coronal images in 61-year-old man with oncocytoma (arrow in b and c) in lower pole of right kid-ney. (a) T2-weighted im-age shows intermediate-signal-intensity tumor. (b) Image obtained in corticomedullary phase after administration of contrast material shows homogeneous tumor enhancement. (c) ASL image shows marked perfusion of entire mass (mean perfusion = 309.6 mL/min/100 g).
Radiology: Volume 265: Number 3—December 2012 n radiology.rsna.org 807
GENITOURINARY IMAGING: Arterial Spin-labeling MR Imaging of Renal Masses Lanzman et al
accurately characterize heterogeneous tumors. Multisection and three-dimen-sional ASL acquisition schemes for ab-dominal organs are currently under de-velopment and might further improve ASL perfusion measurements of renal masses. Second, we did not use the T1 relaxation time of the tumor to calculate tumor perfusion. Instead, we estimated tumor perfusion by assuming that the la-beled spins remain within the vascular space during image acquisition. Because the T1 of viable tumor tends to be long, not much different than that of blood, this approximation probably had a small effect on the calculation of tumor per-fusion. Third, the pathologic diagnosis in five of the 34 patients was obtained with core biopsy and, hence, the entire tumor could not be considered for his-tologic analysis in these cases. Although histologic subtypes might be correctly identified in 88% of biopsy specimens (6,43), we cannot exclude erroneous subtyping in these five patients. Finally, the number of patients investigated in this study is relatively small, resulting in a limited number of masses in each non–clear cell RCC subtype and in the oncocytoma group. In addition, other benign tumors (eg, angiomyolipomas) were not present in this study. There-fore, larger-scaled studies are required to confirm our results.
In conclusion, ASL MR imaging enables unenhanced perfusion mea-surements of untreated renal masses. Because ASL perfusion values of on-cocytoma and RCC as well as papillary RCC and nonpapillary RCC subtypes seem to differ significantly, ASL MR imaging might contribute substantially to the noninvasive assessment of renal tumors and offer complementary re-sults to those of percutaneous biopsy, particularly in those patients with in-conclusive results. Further studies are necessary to confirm these findings.
Disclosures of Conflicts of Interest: R.S.L. No relevant conflicts of interest to disclose. P.M.R. No relevant conflicts of interest to disclose. M.R.S. No relevant conflicts of interest to dis-close. A.D.P. No relevant conflicts of interest to disclose. K.M. No relevant conflicts of interest to disclose. A.A.W. Financial activities related to the present article: none to disclose. Financial activ-ities not related to the present article: institution received money for consultancy from Intuitive; receives money for expert testimony; is a surgical proctor for Intuitive Surgery. Other relationships: none to disclose. E.M.G. No relevant conflicts of interest to disclose. N.M.R. Financial activities related to the present article: none to disclose. Financial activities not related to the present arti-cle: received payment for development of educa-tional presentations from MCM Education. Other relationships: none to disclose. D.C.A. Financial activities related to the present article: none to disclose. Financial activities not related to the present article: institution received a research grant from GE Healthcare; institution receives royalties on patents from GE Healthcare; receives
royalties on patents from GE Healthcare. Other relationships: none to disclose. I.P. No relevant conflicts of interest to disclose.
References 1. Jemal A, Siegel R, Ward E, Murray T, Xu J,
Thun MJ. Cancer statistics, 2007. CA Can-cer J Clin 2007;57(1):43–66.
2. Cheville JC, Lohse CM, Zincke H, Weaver AL, Blute ML. Comparisons of outcome and prognostic features among histologic sub-types of renal cell carcinoma. Am J Surg Pathol 2003;27(5):612–624.
3. Schrader AJ, Olbert PJ, Hegele A, Varga Z, Hofmann R. Metastatic non–clear cell renal cell carcinoma: current therapeutic options. BJU Int 2008;101(11):1343–1345.
4. Schmidbauer J, Remzi M, Memarsadeghi M, et al. Diagnostic accuracy of computed tomography–guided percutaneous biopsy of renal masses. Eur Urol 2008;53(5):1003–1011.
5. Richter F, Kasabian NG, Irwin RJ Jr, Wat-son RA, Lang EK. Accuracy of diagnosis by guided biopsy of renal mass lesions classi-fied indeterminate by imaging studies. Urol-ogy 2000;55(3):348–352.
6. Blumenfeld AJ, Guru K, Fuchs GJ, Kim HL. Percutaneous biopsy of renal cell carcinoma underestimates nuclear grade. Urology 2010;76(3):610–613.
7. Adey GS, Pedrosa I, Rofsky NM, Sanda MG, DeWolf WC. Lower limits of detection using magnetic resonance imaging for solid com-ponents in cystic renal neoplasms. Urology 2008;71(1):47–51.
8. Ho VB, Allen SF, Hood MN, Choyke PL. Renal masses: quantitative assessment of enhancement with dynamic MR imaging. Radiology 2002;224(3):695–700.
9. Yoshimitsu K, Irie H, Tajima T, et al. MR imag-ing of renal cell carcinoma: its role in determin-ing cell type. Radiat Med 2004;22(6):371–376.
10. Pedrosa I, Chou MT, Ngo L, et al. MR classification of renal masses with patho-logic correlation. Eur Radiol 2008;18(2):365–375.
11. Sun MR, Ngo L, Genega EM, et al. Renal cell carcinoma: dynamic contrast-enhanced MR imaging for differentiation of tumor subtypes—correlation with pathologic find-ings. Radiology 2009;250(3):793–802.
12. Palmowski M, Schifferdecker I, Zwick S, et al. Tumor perfusion assessed by dynamic contrast-enhanced MRI correlates to the grading of renal cell carcinoma: initial re-sults. Eur J Radiol 2010;74(3):e176–e180.
13. Buckley DL. Uncertainty in the analysis of tracer kinetics using dynamic contrast-en-hanced T1-weighted MRI. Magn Reson Med 2002;47(3):601–606.
14. Alsop DC, Detre JA. Multisection cerebral blood flow MR imaging with continuous arte-rial spin labeling. Radiology 1998;208(2):410–416.
Figure 6
Figure 6: Scatterplot shows correlation between peak tumor perfusion and size of clear cell RCC (r = 0.71, P = .003).

808 radiology.rsna.org n Radiology: Volume 265: Number 3—December 2012
GENITOURINARY IMAGING: Arterial Spin-labeling MR Imaging of Renal Masses Lanzman et al
nance imaging pharmacodynamic biomarker study of sorafenib in metastatic renal car-cinoma. J Clin Oncol 2008;26(28):4572–4578.
35. Taouli B, Thakur RK, Mannelli L, et al. Re-nal lesions: characterization with diffusion-weighted imaging versus contrast-enhanced MR imaging. Radiology 2009;251(2):398–407.
36. Mertz KD, Demichelis F, Kim R, et al. Auto-mated immunofluorescence analysis defines microvessel area as a prognostic parameter in clear cell renal cell cancer. Hum Pathol 2007;38(10):1454–1462.
37. Minardi D, Lucarini G, Filosa A, et al. Prog-nostic role of tumor necrosis, microvessel density, vascular endothelial growth fac-tor and hypoxia inducible factor-1alpha in patients with clear cell renal carcinoma after radical nephrectomy in a long term follow-up. Int J Immunopathol Pharmacol 2008;21(2):447–455.
38. Scialpi M, Di Maggio A, Midiri M, Loper-fido A, Angelelli G, Rotondo A. Small renal masses: assessment of lesion characteriza-tion and vascularity on dynamic contrast-enhanced MR imaging with fat suppression. AJR Am J Roentgenol 2000;175(3):751–757.
39. Zhang J, Lefkowitz RA, Ishill NM, et al. Solid renal cortical tumors: differentiation with CT. Radiology 2007;244(2):494–504.
40. Delahunt B, Eble JN, McCredie MR, Beth-waite PB, Stewart JH, Bilous AM. Mor-phologic typing of papillary renal cell car-cinoma: comparison of growth kinetics and patient survival in 66 cases. Hum Pathol 2001;32(6):590–595.
41. Sengupta S, Lohse CM, Leibovich BC, et al. Histologic coagulative tumor necrosis as a prognostic indicator of renal cell carcinoma aggressiveness. Cancer 2005;104(3):511–520.
42. Rosenkrantz AB, Hindman N, Fitzgerald EF, Niver BE, Melamed J, Babb JS. MRI features of renal oncocytoma and chro-mophobe renal cell carcinoma. AJR Am J Roentgenol 2010;195(6):W421–W427.
43. Lebret T, Poulain JE, Molinie V, et al. Per-cutaneous core biopsy for renal masses: indications, accuracy and results. J Urol 2007;178(4 Pt 1):1184–1188; discussion 1188.
relapse after RF ablation of renal cell carci-nomas. Eur Radiol 2006;16(6):1226–1236.
25. Earls JP, Rofsky NM, DeCorato DR, Krinsky GA, Weinreb JC. Breath-hold single-dose gadolinium-enhanced three-dimensional MR aortography: usefulness of a timing exam-ination and MR power injector. Radiology 1996;201(3):705–710.
26. Dai W, Garcia D, de Bazelaire C, Alsop DC. Continuous flow-driven inversion for arterial spin labeling using pulsed radio frequency and gradient fields. Magn Reson Med 2008;60(6):1488–1497.
27. Robson PM, Madhuranthakam AJ, Dai W, Pedrosa I, Rofsky NM, Alsop DC. Strategies for reducing respiratory motion artifacts in renal perfusion imaging with arterial spin la-beling. Magn Reson Med 2009;61(6):1374–1387.
28. Roberts DA, Detre JA, Bolinger L, et al. Re-nal perfusion in humans: MR imaging with spin tagging of arterial water. Radiology 1995;196(1):281–286.
29. Chalela JA, Alsop DC, Gonzalez-Atavales JB, Maldjian JA, Kasner SE, Detre JA. Mag-netic resonance perfusion imaging in acute ischemic stroke using continuous arterial spin labeling. Stroke 2000;31(3):680–687.
30. Bydder M, Larkman DJ, Hajnal JV. Combi-nation of signals from array coils using im-age-based estimation of coil sensitivity profiles. Magn Reson Med 2002;47(3):539–548.
31. Delahunt B, Eble JN. Papillary renal cell car-cinoma: a clinicopathologic and immunohis-tochemical study of 105 tumors. Mod Pathol 1997;10(6):537–544.
32. Reuter VE, Presti JC Jr. Contemporary ap-proach to the classification of renal epithe-lial tumors. Semin Oncol 2000;27(2):124–137.
33. Gilad AA, Israely T, Dafni H, Meir G, Co-hen B, Neeman M. Functional and molecu-lar mapping of uncoupling between vascular permeability and loss of vascular maturation in ovarian carcinoma xenografts: the role of stroma cells in tumor angiogenesis. Int J Cancer 2005;117(2):202–211.
34. Hahn OM, Yang C, Medved M, et al. Dy-namic contrast-enhanced magnetic reso-
15. Martirosian P, Klose U, Mader I, Schick F. FAIR true-FISP perfusion imaging of the kid-neys. Magn Reson Med 2004;51(2):353–361.
16. Fenchel M, Martirosian P, Langanke J, et al. Perfusion MR imaging with FAIR true FISP spin labeling in patients with and without renal artery stenosis: initial experience. Ra-diology 2006;238(3):1013–1021.
17. Lanzman RS, Wittsack HJ, Martirosian P, et al. Quantification of renal allograft perfu-sion using arterial spin labeling MRI: initial results. Eur Radiol 2010;20(6):1485–1491.
18. Pedrosa I, Rafatzand K, Robson P, et al. Ar-terial spin labeling MR imaging for charac-terisation of renal masses in patients with impaired renal function: initial experience. Eur Radiol 2012;22(2):484–492.
19. Barrett T, Brechbiel M, Bernardo M, Choyke PL. MRI of tumor angiogenesis. J Magn Reson Imaging 2007;26(2):235–249.
20. Noguchi T, Yoshiura T, Hiwatashi A, et al. Perfusion imaging of brain tumors using arterial spin-labeling: correlation with his-topathologic vascular density. AJNR Am J Neuroradiol 2008;29(4):688–693.
21. Kimura H, Takeuchi H, Koshimoto Y, et al. Perfusion imaging of meningioma by using continuous arterial spin-labeling: compar-ison with dynamic susceptibility-weighted contrast-enhanced MR images and histo-pathologic features. AJNR Am J Neurora-diol 2006;27(1):85–93.
22. de Bazelaire C, Alsop DC, George D, et al. Magnetic resonance imaging–measured blood flow change after antiangiogenic ther-apy with PTK787/ZK 222584 correlates with clinical outcome in metastatic renal cell car-cinoma. Clin Cancer Res 2008;14(17):5548–5554.
23. Schor-Bardach R, Alsop DC, Pedrosa I, et al. Does arterial spin-labeling MR imaging–measured tumor perfusion correlate with renal cell cancer response to antiangio-genic therapy in a mouse model? Radiology 2009;251(3):731–742.
24. Boss A, Martirosian P, Schraml C, et al. Morphological, contrast-enhanced and spin labeling perfusion imaging for monitoring of