n & k mineral nutrition of grapevines, assessing status
TRANSCRIPT

N and K Mineral Nutrition of Grapevines, Assessment of N and
K Nutrient Status for Vines and Fertilization Guidelines
Larry E. Williams
Dept. Vit. and Enol. UC-Davis
& Kearney Ag Center

The following slides refer to the concentration of N (% dry
weight basis) in the petioles, leaves, stems and clusters of
grapevines.

The concentration of N within the leaves and stems decreases throughout the season.

The concentration of N within the cluster decreases throughout the season.

KAC is Thompson Seedless, Oakville is Cabernet Sauvignon and Carneros
is Chardonnay.

Org
an N
(% d
ry w
eigh
t)

The previous slides demonstrate that the concentration of N in the various organs of the grapevine decrease throughout the growing season. This decrease is a function of degree-days, regardless where the vines are grown

The following slides refer to the production of vine biomass (leaves, stems and clusters) and the uptake of potassium (K) and N, in the above mentioned organs, as a function of whole vine water use. Biomass and N and K were also measured on the roots and trunks one year.

Background•
Many have shown that there is a linear relationship between transpiration of plants and dry biomass production on a seasonal basis.
•
This is due to the fact that CO2
assimilation (photosynthesis) by the plant’s canopy is highly correlated with transpiration, water vapor loss from the stomata.
•
As far as I am aware, no such relationship has been demonstrated for grapevines (Vitis vinifera L.) grown in the field.

Background•
Several plant growth models have assumed that N uptake by plants is a linear function of transpiration. This would indicate that ion movement in the soil, ion uptake by the roots and distribution within the plant was due to mass flow.
•
It has been demonstrated that transpiration is not necessary for the uptake of mineral nutrients by plants.
•
Others have assumed that N (and perhaps K) uptake by plants is driven by growth under non-
stress conditions.

Objectives:•
Determine the relationship between grapevine ET and above-ground (leaves, stems and clusters) dry biomass production of field-grown Thompson Seedless grapevines.
•
Determine whether N and K uptake were related with grapevine ET and/or biomass accumulation.
•
Quantify the seasonal dynamics of N and K in the trunk and root system.


A
V
5,500 L = 728 mm or 28.6 inches of water

Summary:•
Dry biomass production of field-grown Thompson Seedless grapevines was a linear function of grapevine water use.
•
Dry biomass production of field-grown Thompson Seedless was also a linear function of degree-days (temperature).
•
Cluster dry weight accounted for ~ 70% of the total biomass produced in 1992.
•
Only 7% of the current season’s biomass production was allocated to the permanent structures of the vine under the conditions of this study.

A
V

A
V

= 47 lbs N/acre
= 71 lbs K/acre

Summary:•
Nitrogen and K uptake by the vines were curvilinearly
related to both seasonal vine water
use and biomass accumulation of Thompson Seedless grapevines.
•
The curvilinear relationship was due to the separation of vegetative and reproductive growth demands of N and K during the season.
•
It is unknown whether the greater N and K uptake during the early portion of the growing season was due to an active uptake of both mineral nutrients or redistribution of N and K from the permanent structures of the vine.


A VBB

BBA
V

Summary:•
Root biomass decreased from budbreak to shortly after anthesis
and then increased thereafter until
harvest.•
The K concentrations in the trunk and root system remained constant throughout the season. Therefore the differences in the amount of K in those two organs reflected seasonal variations in total root and trunk biomass. It would appear that no K was redistributed from those two permanent structures to the leaves, stems and clusters.
•
This would indicate that under the conditions of the study, K used for growth of the leaves, stems and clusters was derived only from the soil.

Summary:•
Root N concentration and N content (g N vine-1) varied throughout the season. The decrease in N concentration was due to both a reduction in total N content in the root and an increase in biomass accumulation.
•
Based upon the metrics derived from the 1992 data, N stored in the root system was used to support shoot growth early in the growing season, from one month after budbreak to anthesis.
•
The N content in the root system at harvest was similar to the amount found in the root system at budbreak.

N BUDGET OF THOMPSON N BUDGET OF THOMPSON SEEDLESS GRAPEVINESSEEDLESS GRAPEVINES
Growth PeriodGrowth PeriodLeavesLeaves ~35 g/vine~35 g/vineShootsShoots ~10 g/vine~10 g/vineClustersClusters ~30 g/vine~30 g/vine
75 g/vine75 g/vineAfter HarvestAfter Harvest
Fallen leavesFallen leaves ~20 g/vine~20 g/vinePruningsPrunings ~15 g/vine~15 g/vineRemolilizationRemolilization ~ 5 g/vine~ 5 g/vine
40 g/vine40 g/vine

Potassium Budget of Thompson Potassium Budget of Thompson Seedless Grapevines (g/vine)Seedless Grapevines (g/vine)
RequirementsRequirements LeavesLeaves ~12~12StemsStems ~26~26ClustersClusters ~43~43
TotalTotal 8383LossesLosses Shoot trimmingShoot trimming ~5~5
Fallen leavesFallen leaves ~8~8PruningsPrunings ~11~11Fruit harvestFruit harvest ~45~45
TotalTotal 6969

MineralMineralNutrientNutrient
AverageAverage HighHigh LowLow---------------------------- (lbs / t) (lbs / t) --------------------------------
NN 2.922.92 4.124.12 1.801.80PP 0.560.56 0.780.78 0.440.44KK 4.944.94 7.927.92 3.183.18
CaCa 1.001.00 1.861.86 0.540.54MgMg 0.200.20 0.320.32 0.100.10
The average and high and low amounts of several mineral The average and high and low amounts of several mineral nutrients in one ton of fruit from grapevines.nutrients in one ton of fruit from grapevines.

Soil Nitrogen Soil Nitrogen or or
FertilizerFertilizer
RootsRoots
TrunkTrunk
CordonsCordons
LeavesLeaves
StemsStems
ClustersClusters
Fallen leavesFallen leaves
PruningsPrunings
Nitrogen Cycling within a VineyardNitrogen Cycling within a Vineyard
RootsRoots
TrunkTrunk
CordonsCordons
LeavesLeaves
StemsStems
ClustersClusters
Nitrogen Cycling within a VineyardNitrogen Cycling within a Vineyard
RootsRoots
TrunkTrunk
CordonsCordons
StemsStems
ClustersClusters
Nitrogen Cycling within a VineyardNitrogen Cycling within a Vineyard
Soil Nitrogen Soil Nitrogen or or
FertilizerFertilizer
Fallen leavesFallen leaves
TrunkTrunk
CordonsCordons ClustersClusters
Nitrogen Cycling within a VineyardNitrogen Cycling within a Vineyard
CordonsCordons ClustersClusters
Nitrogen Cycling within a VineyardNitrogen Cycling within a Vineyard
Dead Dead RootsRoots
Nitrogen Nitrogen ReservesReserves
Grapevine N Fertilizer ProgramGrapevine N Fertilizer Program
1.)1.) Assessing vineyard/vine N statusAssessing vineyard/vine N status
2.)2.) Determination of N fertilizer amountsDetermination of N fertilizer amounts
3.)3.) Kinds of N fertilizersKinds of N fertilizers
4.)4.) Timing of fertilization eventsTiming of fertilization events
5.)5.) Effects of N on vegetative and Effects of N on vegetative and reproductive growthreproductive growth

1.)1.) Assessing vine nutrient statusAssessing vine nutrient status
a.)a.)
deficiency symptomsdeficiency symptomsb.)b.)
soil analysissoil analysis
c.)c.)
tissue analysistissue analysis

1.)1.) Assessing vine nutrient statusAssessing vine nutrient status
a.)a.) deficiency symptoms deficiency symptoms ––by the time this is observedby the time this is observedvine growth may already bevine growth may already beadversely affected.adversely affected.

Nitrogen deficiency: Leaf symptoms
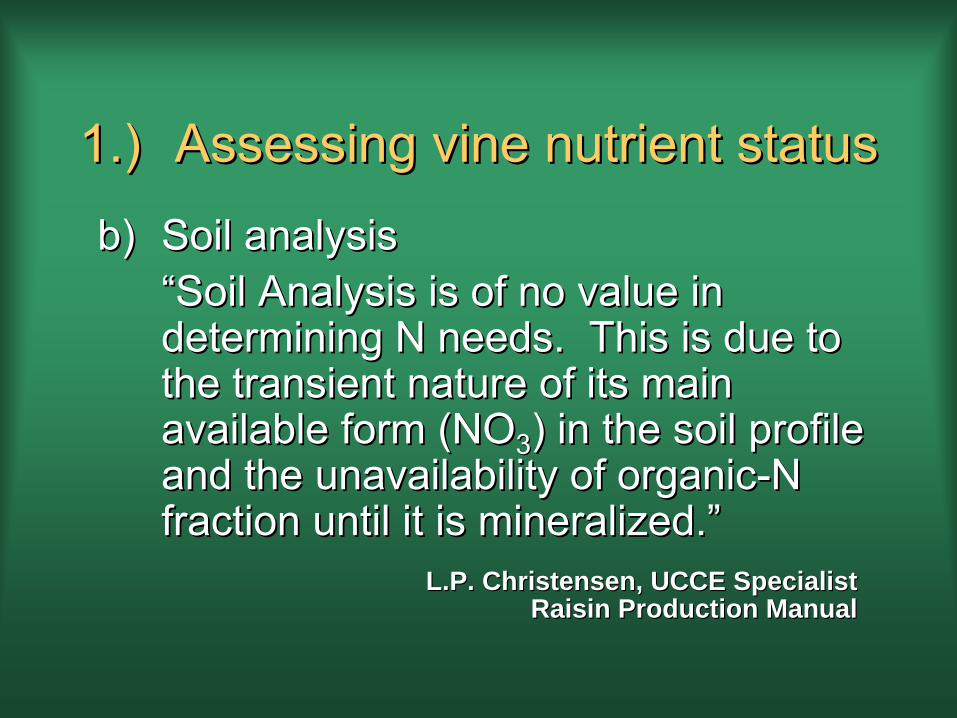
1.)1.) Assessing vine nutrient statusAssessing vine nutrient status
b)b)
Soil analysisSoil analysis““Soil Analysis is of no value in Soil Analysis is of no value in determining N needs. This is due to determining N needs. This is due to the transient nature of its main the transient nature of its main available form (NOavailable form (NO33
) in the soil profile ) in the soil profile and the unavailability of organicand the unavailability of organic--N N fraction until it is mineralized.fraction until it is mineralized.””
L.P. Christensen, UCCE SpecialistL.P. Christensen, UCCE SpecialistRaisin Production ManualRaisin Production Manual

1.)1.) Assessing vine nutrient statusAssessing vine nutrient status
c.) Tissue Analysis c.) Tissue Analysis ––
criteria for usefulnesscriteria for usefulness
The tissue used and the mineral nutrient The tissue used and the mineral nutrient measured should be related to the mineral measured should be related to the mineral nutrient status or its concentration in other nutrient status or its concentration in other organs of the vine.organs of the vine.The tissue used and the mineral nutrient The tissue used and the mineral nutrient measured should be related to vegetative and measured should be related to vegetative and reproductive growth of the vine.reproductive growth of the vine.A critical value or its range for the mineral A critical value or its range for the mineral nutrient in the organ measured should be nutrient in the organ measured should be robust enough to cover a wide range of robust enough to cover a wide range of vineyard or grapevine situations.vineyard or grapevine situations.

1.)1.) Assessing vine nutrient statusAssessing vine nutrient status
c.) Tissue Analysisc.) Tissue Analysis
Time of SamplingTime of SamplingType of Tissue SampledType of Tissue SampledForm of NitrogenForm of Nitrogen
Time of SamplingTime of Sampling
Bloom and/or VeraisonBloom and/or Veraison
Definite Growth StageDefinite Growth StageRepeatableRepeatableConvenientConvenient

Type of Tissue SampledType of Tissue Sampled
Petioles opposite the cluster at bloomPetioles opposite the cluster at bloomPetioles of mature leaves at veraisonPetioles of mature leaves at veraisonLeaf bladesLeaf bladesFruit at harvestFruit at harvestCanes during dormancyCanes during dormancy

Form of NitrogenForm of Nitrogen
Petioles Petioles ––
NONO33
--N, NHN, NH44
--N, total NN, total N
Leaf Blades Leaf Blades ––
total Ntotal N
Fruit Fruit ––
total N, arginine, yeast total N, arginine, yeast assimilableassimilable nitrogen concentration (YANC) nitrogen concentration (YANC)
Canes Canes ––
total N, arginine total N, arginine

NITRATENITRATE--NITROGENNITROGEN Bloom Petiole Levels (ppm)Bloom Petiole Levels (ppm)
NitrateNitrate--Nitrogen Nitrogen (ppm)(ppm)
DeficientDeficient Less than 350Less than 350
QuestionableQuestionable 350 350 --
500500
AdequateAdequate 500 500 ––
1,2001,200
ExcessiveExcessive Over 2,000Over 2,000
Possibly toxicPossibly toxic Over 3,000Over 3,000

Other suggested critical values for N nutrient status
•
Total N in petioles at bloom less than 0.8% indicates deficiency and those > 0.8% adequate
•
In S. Africa, petiole total N at berry set less than 0.6% is deficient while sufficient ranges from 0.6 to 1.0%.
•
Kliewer (1991) suggested than a total N value for leaf blades less than 1.5% is deficient while those from 1.5 to 3.0% is sufficient.
•
Robinson (1992) suggests a leaf blade total N concentration of 2.9% at bloom and 1.6% at veraison is adequate

What factors may influence petiole What factors may influence petiole values when analyzed for N or NOvalues when analyzed for N or NO33
??A.A. Time of day petioles are sampledTime of day petioles are sampled ––
I have found that time of day I have found that time of day may may influence the concentrations of NOinfluence the concentrations of NO33
and K in the petioles. I recommend and K in the petioles. I recommend that petioles should only be collected that petioles should only be collected between 10 a.m. and 2 p.m. to between 10 a.m. and 2 p.m. to minimize the effects of time of day on minimize the effects of time of day on measured nutrient values.measured nutrient values.

Effect of time of day on nitrate-N of Perlette
and nitrate-N and K of Flame Seedless petioles at bloom. Vines were growing in the Coachella Valley. Means within a column followed by a different
letter are significantly different at P < 0.05.
Perlette ----
Flame Seedless ----Time of Day Nitrate -
N Nitrate -
N K
-----ppm (dry wt) ----- % dry wt.0800 h 890 b 825 b 2.51 b
1200 h 985 ab 968 ab 2.74 a
1600 h 1038 a 1025 a 2.65 ab

What factors may influence petiole What factors may influence petiole values when analyzed for N or NOvalues when analyzed for N or NO33
??B.B.
Location of the leaves where petioles Location of the leaves where petioles are collected are collected ––
I conducted a study where I conducted a study where
petioles were collected from leaves petioles were collected from leaves opposite a cluster, leaves in full sunlight opposite a cluster, leaves in full sunlight and leaves growing in the shade. There and leaves growing in the shade. There were some minor differences, depending were some minor differences, depending upon nutrient analyzed, among the leaf upon nutrient analyzed, among the leaf types selected. I am of the opinion that the types selected. I am of the opinion that the leaf selected makes little difference as long leaf selected makes little difference as long as it is a mature, fully expanded leaf.as it is a mature, fully expanded leaf.

The effect of time of day and petiole location of leaves on nitrate-N of Chardonnay petioles sampled at bloom. Nitrate-N is expressed in ppm (dry weight basis). Leaf blades were exposed to direct sunlight
(sun), shaded (shade) or located opposite a cluster at the time of sample.
Time of Location of Leaves Ave. Effect of Day Sun Shade Opposite Cluster Time of Day
0800 h 1847 2411 1935 2064
1200 h 2121 2395 1893 2136
1600 h 1970 2348 2135 2151
Ave. Eff. Loc. 1979 2384 1988
LSD0.05 Time of Day = ns Location = 173 Interaction = ns

What factors may influence petiole What factors may influence petiole values when analyzed for N or NOvalues when analyzed for N or NO33
??A.A.
CultivarCultivar
B.B.
RootstockRootstockC.C.
Time petioles sampled (during growing Time petioles sampled (during growing season)season)
D.D.
Irrigation/rainfall prior to sampleIrrigation/rainfall prior to sampleE.E.
Type of irrigation (flood or drip)Type of irrigation (flood or drip)
F.F.
Environment just prior to or the day of Environment just prior to or the day of sample collectionsample collection
G.G.
When last fertilized or fertility of soil in When last fertilized or fertility of soil in the vineyardthe vineyard

BloomBloom--time petiole analysis for NOtime petiole analysis for NO33
-- nitrogen of four table grape cultivars over a nitrogen of four table grape cultivars over a
four year period. four year period. Vines were grown at the Kearney Ag. CenterVines were grown at the Kearney Ag. Center
------------------------------YearYear----------------------------CultivarCultivar 19901990 19911991 19921992 19931993
---------------------------------- NONO33 (ppm) (ppm) ----------------------------------
Flame SeedlessFlame Seedless 7474 274274 187187 926926PerlettePerlette 6666 215215 4949 703703Ruby SeedlessRuby Seedless 132132 949949 10881088 10291029Thompson SeedlessThompson Seedless 316316 12441244 787787 ----

Effect of irrigation practices on petiole Effect of irrigation practices on petiole analysis of Thompson Seedless analysis of Thompson Seedless
at bloomat bloom
PracticePractice NONO33
--N N (ppm)(ppm)
KK(%)(%)
IrrigatedIrrigated 836836 ------Not irrigatedNot irrigated 217217 ------
DripDrip 383383 3.33.3FurrowFurrow 14651465 2.32.3

Studies have measured petiole N, Studies have measured petiole N, NONO33
--N and NHN and NH33
--N and they are N and they are usually highly correlated with one usually highly correlated with one another. However most studies another. However most studies have not compared petiole nutrient have not compared petiole nutrient status with the nutrient status of status with the nutrient status of other vegetative or reproductive other vegetative or reproductive organs within the vine at that time organs within the vine at that time or at other phenological stages.or at other phenological stages.


Relationships among bloomRelationships among bloom-- time petiole N and K nutrient time petiole N and K nutrient
status and N and K nutrient status and N and K nutrient status in the vinestatus in the vine’’s other s other
organs.organs.


Relationships among bloomRelationships among bloom-- time petiole nutrient status and time petiole nutrient status and
return fruitfulness on three return fruitfulness on three cultivars grown in CA and yield cultivars grown in CA and yield of grapes grown in Washington of grapes grown in Washington
State.State.


It has always been assumed that rootstocks differ in their ability
to take up mineral nutrients from the soil profile.

Bloom-time petiole nitrate concentration at four locations and rootstock/scion combinations for three years.
----NO3 (ppm dry wt)----
Location Rootstock 1997 1998 1999Carneros 5C 911 500 484
110R 718 340 396Gonzalez 5C 768 486 650
110R 638 481 555Freedom 587 695 599
Oakville 5C 68 1655 47110R 56 1338 573309C 52 1586 55
P. Robles 5C 6191 1359 2754110R 4042 964 1358
Freedom 9876 1486 1387140Ru 7462 1518 19471103P 7878 1575 1562

The amount of labeled N (N15), total N, dry biomass and %N of the biomass accumulated by Chardonnay vines at two locations. Vines at Carneros and Gonzales were fertilized with 12 and 20 g N vine-1, respectively, at berry set in 1997.
Location/ Total Total Total PercentRootstock 15N N Dry Wt. N
-----------------------
( g vine-1) ------------------------ % dry wt.
Carneros5C 0.066 44.1 6255 0.71
110R 0.078 52.7 7482 0.70Gonzales
5C 0.049 52.7 6694 0.79 a110R 0.051 54.5 7591 0.72 b
Freedom 0.047 49.9 7889 0.73 b

The amount of labeled N (N15), total N, dry biomass and %N of the biomass accumulated by Cabernet Sauvignon vines at Oakville. Vines were fertilized with 6 g N vine-1
at berry set in 1997.Location/ Total Total Total PercentRootstock 15N N Dry Wt. N
-----------------------
( g vine-1) ------------------------ % dry wt.
Oakville5C 0.039 26.6a 4480a 0.59 b
110R 0.043 24.0ab 3760 b 0.64a3309 0.044 20.6 b 3761 b 0.62ab

Cultivar/Site: Cabernet at Paso Robles Data: 15N, Total N and biomass for three years
Applied Fertilizer: 17g N vine-1
Rootstock Total 15N
Total N Total Dry Wt.
%N
------------------(g vine-1)----------------
5C 0.035 c 65.3 8261 0.79 c
110R 0.049 b 67.5 8394 0.80 bc
Freedom 0.074a 69.7 8701 0.80 bc
1103P 0.072a 74.0 8949 0.83 b
140Ru 0.051 b 79.7 9171 0.87a

Conclusions:Conclusions:Bloom petiole analysis of N does not indicate Bloom petiole analysis of N does not indicate that one rootstock is more efficient at taking up that one rootstock is more efficient at taking up N than another under the conditions of this N than another under the conditions of this study.study.
The relationship between petiole nitrateThe relationship between petiole nitrate--nitrogen and N concentration in the leaves, fruit nitrogen and N concentration in the leaves, fruit and canes in this study indicates that a bloomand canes in this study indicates that a bloom--time petiole value of 200 ppm NOtime petiole value of 200 ppm NO33 would be would be ““adequate.adequate.”” Nitrate values in the petioles at Nitrate values in the petioles at bloom below 100 ppm decreased percent N in bloom below 100 ppm decreased percent N in those organs only slightlythose organs only slightly

Grapevine Fertilization ProgramGrapevine Fertilization Program
2.)2.) Determination of fertilizer amountsDetermination of fertilizer amountsIt will depend upon whether it is a It will depend upon whether it is a maintenance program or one to correct maintenance program or one to correct a deficiencya deficiency
a.)a.) for a maintenance program one needs for a maintenance program one needs to determine how much of the mineralto determine how much of the mineralnutrient is removed from the vineyard nutrient is removed from the vineyard (i.e. develop a N budget)(i.e. develop a N budget)
b.)b.) determine the efficiency with whichdetermine the efficiency with whichfertilizer is taken up.fertilizer is taken up.

MineralMineralNutrientNutrient
AverageAverage HighHigh LowLow---------------------------- (lbs / t) (lbs / t) --------------------------------
NN 2.922.92 4.124.12 1.801.80PP 0.560.56 0.780.78 0.440.44KK 4.944.94 7.927.92 3.183.18
CaCa 1.001.00 1.861.86 0.540.54MgMg 0.200.20 0.320.32 0.100.10
The average and high and low amounts of several mineral The average and high and low amounts of several mineral nutrients in one ton of fruit from grapevines.nutrients in one ton of fruit from grapevines.

Grapevine Fertilization ProgramGrapevine Fertilization Program
3.)3.) Kinds of N fertilizersKinds of N fertilizers
““Generally the choice of theGenerally the choice of theformulation of nitrogen can beformulation of nitrogen can bebased mostly upon cost.based mostly upon cost.””
L.P. Christensen, UCCE SpecialistL.P. Christensen, UCCE Specialist

Grapevine Fertilization ProgramGrapevine Fertilization Program
4.)4.) Timing of fertilization eventsTiming of fertilization events
One must know when the N is beingOne must know when the N is beingutilized by the vine to choose the utilized by the vine to choose the appropriate date to apply the fertilizer.appropriate date to apply the fertilizer.


When do vines require the most N When do vines require the most N during the growing season?during the growing season?
1.)1.)
Approximately two thirds of the current seasonApproximately two thirds of the current season’’ssabove ground requirement goes to the leaves and above ground requirement goes to the leaves and stems (main axis of the shoot), the other third goes stems (main axis of the shoot), the other third goes to the fruit.to the fruit.
2.)2.)
Approximately two thirds of the current seasonApproximately two thirds of the current season’’s N s N requirement is taken up between budbreak and requirement is taken up between budbreak and sometime between berry set and veraison.sometime between berry set and veraison.
3.)3.)
Some of the nitrogen required by the current Some of the nitrogen required by the current seasonseason’’s above ground growth may be obtained s above ground growth may be obtained from N in the trunk (or cordons if present) and the from N in the trunk (or cordons if present) and the root systemroot system

L.E. WilliamsL.E. Williams’’
recommendation for recommendation for N fertilization application timingN fertilization application timing
Split Split applicationsapplicationsaa
11st st application application ––
one month after BBone month after BB22ndnd
application application ––
just after berry set.just after berry set.
a a apply one half the total fertilizer to be used each time.apply one half the total fertilizer to be used each time.

When do you When do you notnot
want to apply a want to apply a nitrogen fertilizer?nitrogen fertilizer?
1.)1.)
Avoid applying N in winter/early spring if the Avoid applying N in winter/early spring if the fertilizer is susceptible to leaching during thisfertilizer is susceptible to leaching during thisseason.season.
2.)2.)
An application of N fertilizer just prior to or at An application of N fertilizer just prior to or at bloom will increase the amount of berries that fail bloom will increase the amount of berries that fail to set.to set.
3.)3.)
A postA post--harvest application of an N fertilizer is harvest application of an N fertilizer is probably not as efficient as some thought. For probably not as efficient as some thought. For one to consider this time as appropriate, one one to consider this time as appropriate, one needs to assess vine health, length of season needs to assess vine health, length of season remaining and soil type. remaining and soil type.

Effect of irrigation type and form of N on nitrogen fertilizer use efficiency (FUE).
Treatment FUE 1
Drip NO3 42%Drip NH4
+ 37%Furrow (NO3
) 14%Furrow (NH4
+) 10%Drip (cont) 38%1 FUE = Total Fert. in Vine/Total Fert. N Applied.

Pruned FruitingTreatment Clusters Leaves Canes Canes Trunk Roots
---------------
(15N in organ/15N taken up by vine) x 100
----------------
Drip Irr.NO3 35.1 b 12.4 11.4 b 2.7 9.1 29.3 aNH3 46.9 a 12.6 10.1 b 2.0 10.0 18.4 b
NO3
/Cont 29.6 b 15.7 19.4 a 2.4 10.4 22.6 ab
Furrow Irr.NO3 42.6 14.3 10.4 3.9 14.6 14.2NH3 35.9 13.8 11.7 5.4 14.6 18.6
Relative distribution of 15N labeled fertilizer in the organs ofThompson Seedless grapevines.

Pruned FruitingTreatment Clusters Leaves Canes Canes Trunk Roots
---------------
(15N in organ / total N organ-1) x 100
----------------
Drip Irr.NO3 12.6 9.6 ab 11.1 ab 10.9 9.1 9.2 aNH3 12.2 6.9 b 8.4 b 7.6 7.6 4.4 b
NO3
/Cont 12.7 10.5 a 15.6 a 11.5 11.0 10.8 a
Furrow Irr.NO3 6.9 4.8 6.8 4.6 4.4 2.6NH3 3.9 3.0 4.0 4.8 3.2 2.3
Nitrogen derived from fertilizer (NDF) in the organs ofThompson Seedless grapevines.

Distribution of fertilizer N in Distribution of fertilizer N in individual vine organsindividual vine organs
----------------------------Vine organsVine organs----------------------------TreatTreat-- mentment
Year Year HarvestedHarvested ClustersClusters LeavesLeaves StemsStems22 TrunkTrunk RootsRoots TotalTotal
--------------------------(g N vine(g N vine--1 1 ))------------------------------Drip Drip (cont)(cont) 19891989 3.233.23 1.811.81 0.860.86 1.141.14 2.472.47 9.519.51
Drip Drip (cont)(cont) 19901990 1.781.78 1.401.40 0.780.78 0.580.58 2.322.32 6.866.86
1 Vines fertilized with 15 N every two weeks during 1989 growing season for a total of 27.6 g N vine-1.
2
Stems include main axis of shoot and fruiting canes.

Soil Nitrogen Soil Nitrogen or or
FertilizerFertilizer
RootsRoots
TrunkTrunk
CordonsCordons
LeavesLeaves
StemsStems
ClustersClusters
Fallen leavesFallen leaves
PruningsPrunings
Nitrogen Cycling within a VineyardNitrogen Cycling within a Vineyard
RootsRoots
TrunkTrunk
CordonsCordons
LeavesLeaves
StemsStems
ClustersClusters
Nitrogen Cycling within a VineyardNitrogen Cycling within a Vineyard
RootsRoots
TrunkTrunk
CordonsCordons
StemsStems
ClustersClusters
Nitrogen Cycling within a VineyardNitrogen Cycling within a Vineyard
Soil Nitrogen Soil Nitrogen or or
FertilizerFertilizer
Fallen leavesFallen leaves
TrunkTrunk
CordonsCordons ClustersClusters
Nitrogen Cycling within a VineyardNitrogen Cycling within a Vineyard
CordonsCordons ClustersClusters
Nitrogen Cycling within a VineyardNitrogen Cycling within a Vineyard
Dead Dead RootsRoots
Nitrogen Nitrogen ReservesReserves

Grapevine Fertilization ProgramGrapevine Fertilization Program
5.)5.)
Effects of N on vegetative and Effects of N on vegetative and reproductive growthreproductive growth

Effects of N Fertilization on Growth, Effects of N Fertilization on Growth, Yield and Fruit CharacteristicsYield and Fruit Characteristics
ParameterParameter Deficient Deficient VineyardsVineyards
NonNon--deficient deficient vineyardsvineyards
Vegetative growthVegetative growth
YieldYield **
Berry SugarBerry Sugar ?? ? or? or
N Compounds in FruitN Compounds in Fruit
-
increase and decrease respectively; * -
no effect; ? :-
may or may not have effect

San Joaquin Valley N and K Fertilizer Study: Objectives
•
Determine the correlations among the various means to assess vine N nutrient status with nitrogenous compounds found the the fruit at harvest of Merlot and Thompson Seedless grapevines grown in the San Joaquin Valley.
•
The nitrogenous compounds measured in the fruit are those used by yeast during fermentation. They include ammonia and α-
amino acids.•
Determine the effects of K fertilizer on juice characteristics and correlations with vine K nutrient status.

San Joaquin Valley N and K Fertilizer Study: Materials and Methods –
Fertilizer treatments
•
Treatments consisted of N and K fertilizers being applied at berry set in 2004 using two rates (75 and 100 kg (N or K) ha-1
and another treatment
being applied at 75 kg (N or K) ha-1
at veraison.
The 75 kg rate was approximately 67 lbs of N or K per acre while the 150 rate was equivalent to 134 lbs of N or K per acre.
•
The N fertilizer was ammonium nitrate and the K fertilizer was potassium sulfate.
•
The control treatment received no fertilizer

San Joaquin Valley N and K Fertilizer Study: Materials and Methods –
Samples
•
The fruit of both cultivars were harvested at fruit maturity (except for T.S. in 2005).
•
The fruit was transported to UC-Davis, grapes were separated from their stems and juice samples taken. Wine was made from the Merlot fruit in 2004.
•
The juice and wine were analyzed for ammonia and α-Amino nitrogen content or nitrogen by OPA (NOPA).
•
Ammonia + NOPA = yeast assimilable nitrogenous compounds or YANC

Critical values of YANC in grapes for wine production
Various studies have attempted to estimate the minimum concentration of juice N needed to achieve a satisfactory completion of fermentation as judged by low residual sugar, i.e. minimum concentration of N in juice at which the risk of slow or stuck fermentation is low. Estimates range from 70 –
267 mg/L YANC, with a value of
~ 140 mg N/L for clarified musts of moderate sugar concentration being considered a practical minimal limit.

N Total N --- NO3 -N --- --- NH4 -N ---Treatment (% dry wt.) ---------------- (ppm, dry wt.) -----------------
2004 Bloom Veraison Bloom Veraison Bloom VeraisonN 0 1.02 0.61 b 660 185 c 260 75 bN 75 BS --- 0.86 a --- 795 b --- 95 abN 150 BS --- 0.78 ab --- 1407 a --- 125 a
N 75 V --- 0.60 b --- 137 c --- 70 b2005
N 0 1.19 0.76 2022 1600 447 ab 112N 75 BS 1.11 0.74 1777 1465 387 b 90N 150 BS 1.16 0.82 2010 1952 445 ab 117N 75 V 1.20 0.78 2070 1720 525 a 110
Effects of applied N fertilizer at berry set (BS) or veraison (V) in 2004 on petiole N status of Merlot grapevines grown inMadera County.

N Soluble Solids
TA NH4+ NOPA YANC
Treatment (oBrix) pH (g L-1) ---------------- (mg L-1) -------------2004
N 0 25.5 3.66 5.35 a 50 c 98 b 144 bN 75 BS 26.0 3.67 5.32 a 67 b 123 a 181 abN 150 BS 25.5 3.63 5.45 a 79 a 115 a 184 aN 75 V 25.3 3.71 4.65 b 63 b 118 a 188 a
2005N 0 22.4 3.46 3.47 62 b 143 b 205 bN 75 BS 22.3 3.44 4.04 81 a 140 b 220 abN 150 BS 21.9 3.45 3.85 82 a 156 a 238 aN 75 V 21.7 3.42 4.06 86 a 149 ab 235 a
Effects of applied N fertilizer at berry set (BS) or veraison (V) in 2004 on must characteristics of Merlot grapevines grown inMadera County.

N/K Ethanol TA NH4+ NOPA YANC
Treatment (% v/v) pH (g L-1) ---------------- (mg L-1) -------------2004
N 0 14.1 3.98 b 5.63 a 5.9 b 34 b 40N 75 BS 14.3 4.04 b 5.33 ab 4.5 b 40 a 44N 150 BS 14.0 4.04 b 5.10 b 6.7 ab 39 a 46N 75 V 13.9 4.11 a 4.93 b 9.4 a 40 a 49
2004K 0 14.4 a 4.02 5.60 7.1 36 43K 75 BS 14.0 ab 3.98 5.74 9.8 39 49K 150 BS 14.3 ab 3.99 5.78 6.8 35 42K 75 V 13.7 b 4.00 5.46 6.4 34 40
Effects of applied N/K fertilizer at berry set (BS) or veraison (V) in 2004 on
wine characteristics of Merlot grapevines grown in
Madera County.

N/K ----- Merlot Must ----- ---- Merlot Wine ----Treatment NH4
+ NOPA YANC NH4+ NOPA YANC
2004 ---------------------------------- (mg L-1) -------------------------------N 0 50 98 144 5.9 34 40N 75 BS 67 123 181 4.5 40 44N 150 BS 79 115 184 6.7 39 46N 75 V 63 118 188 9.4 40 49
2004K 0 59 108 166 7.1 36 43K 75 BS 62 106 178 9.8 39 49K 150 BS 57 87 141 6.8 35 42K 75 V 53 92 149 6.4 34 40
Effects of applied N/K fertilizer at berry set (BS) or veraison (V) in 2004 on must/wine nitrogenous compounds of Merlot.

The line represents the minimal limit of YANC

The line represents the minimal limit of YANC

Grapevine K Fertilization ProgramGrapevine K Fertilization Program
1.)1.) Assessing vineyard/vine nutrient statusAssessing vineyard/vine nutrient status
2.)2.) Determination of fertilizer amountsDetermination of fertilizer amounts
3.)3.) Kinds of fertilizersKinds of fertilizers
4.)4.) Timing of fertilization eventsTiming of fertilization events
5.)5.) Effects of mineral nutrients on Effects of mineral nutrients on vegetative and reproductive growth.vegetative and reproductive growth.

POTASSIUMPOTASSIUM
Potassium (%)Potassium (%)Bloom Petiole LevelsBloom Petiole Levels
DeficientDeficient Less than 1.0Less than 1.0QuestionableQuestionable 1.0 to 1.51.0 to 1.5AdequateAdequate Over 1.5Over 1.5
Midsummer Petiole LevelsMidsummer Petiole LevelsDeficientDeficient Below 0.5Below 0.5AdequateAdequate Above 0.8Above 0.8

BloomBloom--time petiole analysis of K for four time petiole analysis of K for four table grape cultivars over four year period. table grape cultivars over four year period. Vines were grown at the Kearney Ag. CenterVines were grown at the Kearney Ag. Center
----------------------------------YearYear----------------------------CultivarCultivar 19901990 19911991 19921992 19931993
------------------
K (% dry wt) K (% dry wt) --------------------FlameFlame 2.302.30 2.202.20 1.901.90 1.501.50PerlettePerlette 2.902.90 2.502.50 2.302.30 2.502.50Ruby SeedlessRuby Seedless 2.302.30 2.302.30 2.602.60 2.002.00Thompson SeedlessThompson Seedless 2.302.30 2.102.10 1.501.50 ------

The effect of irrigation treatments on bloomThe effect of irrigation treatments on bloom-- time petiole analysis of furrow irrigation time petiole analysis of furrow irrigation Thompson Seedless grapevines grown at KAC.Thompson Seedless grapevines grown at KAC.
------------------------Petiole analysisPetiole analysis--------------------------YearYear Irrigation Irrigation
TreatmentTreatmentNONO33 KK PP
(ppm)(ppm) (% dry wt.)(% dry wt.) (% dry wt.)(% dry wt.)19901990 IrrigatedIrrigated 836836 1.531.53 ------aa
NonNon--irrigatedirrigated 217217 1.201.20 ------aa
19911991bb IrrigatedIrrigated 304304 1.831.83 0.540.54NonNon--IrrigatedIrrigated 871871 1.401.40 0.210.21
19921992bb IrrigatedIrrigated 371371 1.801.80 0.480.48NonNon--irrigated irrigated ------aa ------aa ------aa
19931993bb IrrigatedIrrigated 298298 2.072.07 0.560.56NonNon--irrigatedirrigated 837837 1.301.30 0.290.29
aaNotNot
sampled or analyzed.sampled or analyzed.bbIrrigationIrrigation
resumed in 1991 for the Nonresumed in 1991 for the Non--irrigated treatments and continued for irrigated treatments and continued for the 1992 and 1993 growing seasons.the 1992 and 1993 growing seasons.

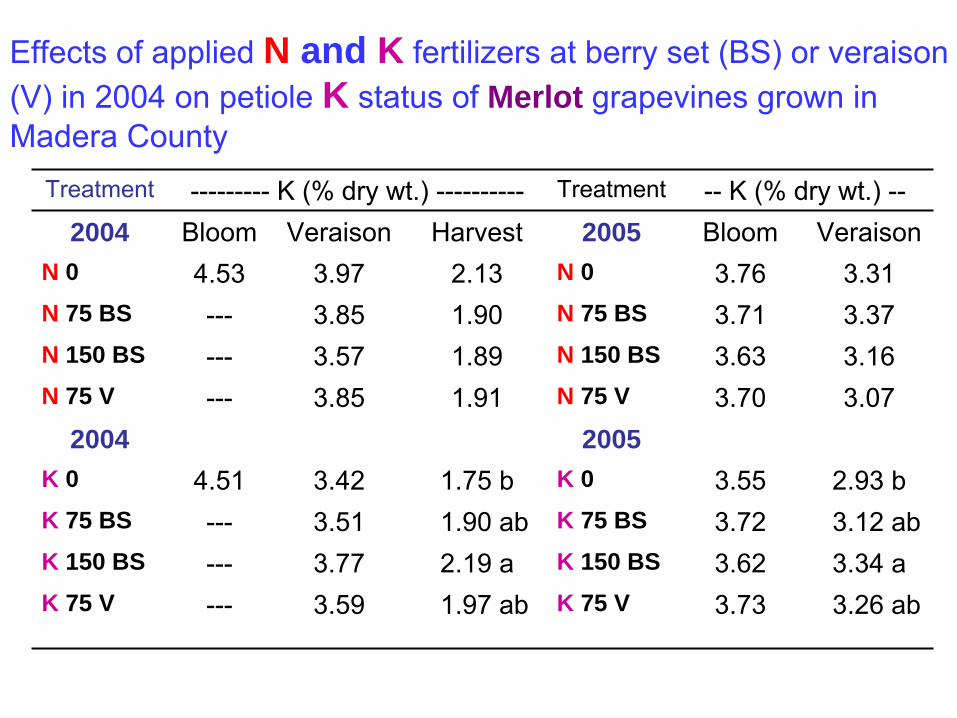
Treatment ---------
K (% dry wt.) ---------- Treatment --
K (% dry wt.) --2004 Bloom Veraison Harvest 2005 Bloom Veraison
N 0 4.53 3.97 2.13 N 0 3.76 3.31N 75 BS --- 3.85 1.90 N 75 BS 3.71 3.37N 150 BS --- 3.57 1.89 N 150 BS 3.63 3.16N 75 V --- 3.85 1.91 N 75 V 3.70 3.07
2004 2005K 0 4.51 3.42 1.75 b K 0 3.55 2.93 bK 75 BS --- 3.51 1.90 ab K 75 BS 3.72 3.12 abK 150 BS --- 3.77 2.19 a K 150 BS 3.62 3.34 aK 75 V --- 3.59 1.97 ab K 75 V 3.73 3.26 ab
Effects of applied N and K fertilizers at berry set (BS) or veraison (V) in 2004 on petiole K status of Merlot grapevines grown inMadera County

Treatment ---------
K (mg L-1) ---------- Treatment --
K (mg L-1) --2004 Juice
1922 ab2001 a1727 b2006 a
Wine 2005 Juice1432140914421353
N 0 1694 c N 0N 75 BS 1951 b N 75 BSN 150 BS 2503 a N 150 BSN 75 V 1922 b N 75 V
2004 2005K 0 1913 b
1908 b2364 a1887 b
1972 K 0 1406 b1474 ab1620 a1363 b
K 75 BS 1989 K 75 BSK 150 BS 2008 K 150 BSK 75 V 1985 K 75 V
Effects of applied N and K fertilizers at berry set (BS) or veraison (V) in 2004 on juice or wine K status of Merlot grapevines grownin Madera County