n = 52 3 4 5 by number of plans 6 7 8 9 52 state agencies with approved snap-ed plans approved...
TRANSCRIPT

Food and Nutrition ServiceSupplemental Nutrition Assistance Program Education
SNAP-Ed
Alice Lockett MS, RD, LDSNAP Senior Nutritionist

SNAP-Ed
Facts Figures
&

2010 National PictureSubmissions and Approvals
0%
10%
20%
30%
40%
50%
60%
70%
80%
90%
100%
67%
29%
2% 2%
On Time Submissions--Approved by 01 Oct
Late Submission--Approved by 01 Oct
Late Submission--Not Approved
On Time Submission--Not Approved
N = 523

On Time Su
bmissions
Approve
d by Oct.
1st
Late Su
bmission
Approve
d By Oct.
1st
Late Su
bmission
Not Appro
ved
On Time Su
bmission
Not Appro
ved
0%
20%
40%
60%
80%
100% 87%
13%0% 0%
67%
29%
2% 2%
2009 2010
National PictureSubmissions and Approvals for FY 2009 &
FY 2010
4

Historical View of Regional Approvals by October 1st
Deadline
0%
20%
40%
60%
80%
100%
2005 2006 2007 2008 2009 2010
52%
68%
94%100% 100% 98%
5
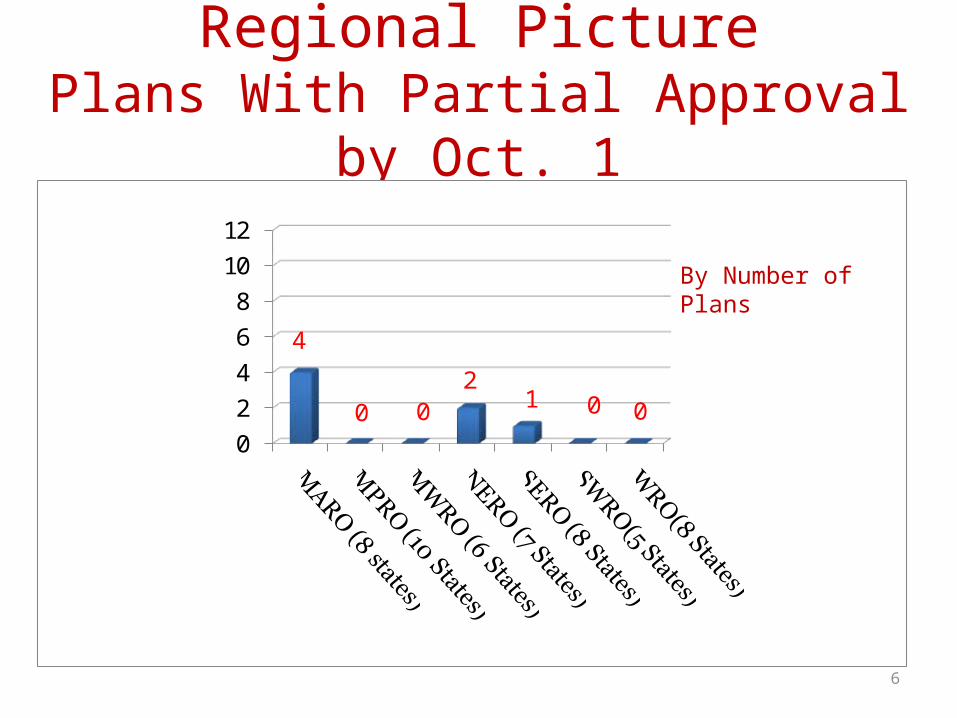
Regional PicturePlans With Partial Approval by
Oct. 1
02468
1012
4
0 02
1 0 0
By Number of Plans
6

Regional PicturePlans With Full Approval by
Oct. 1
By Number of Plans
7
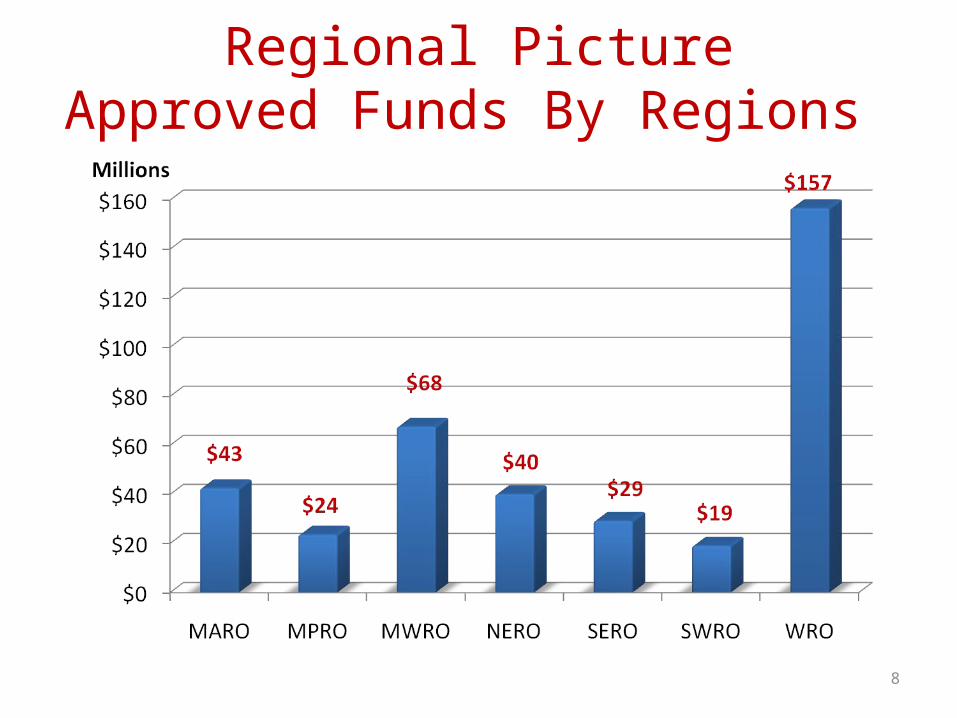
Regional PictureApproved Funds By Regions
8
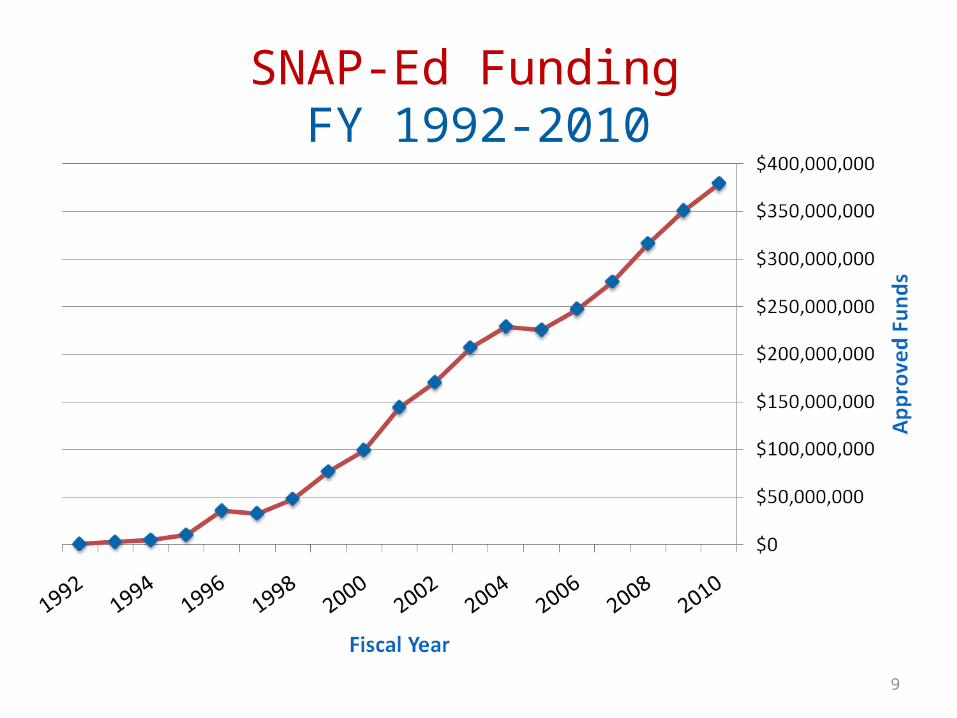
SNAP-Ed Funding FY 1992-2010
9
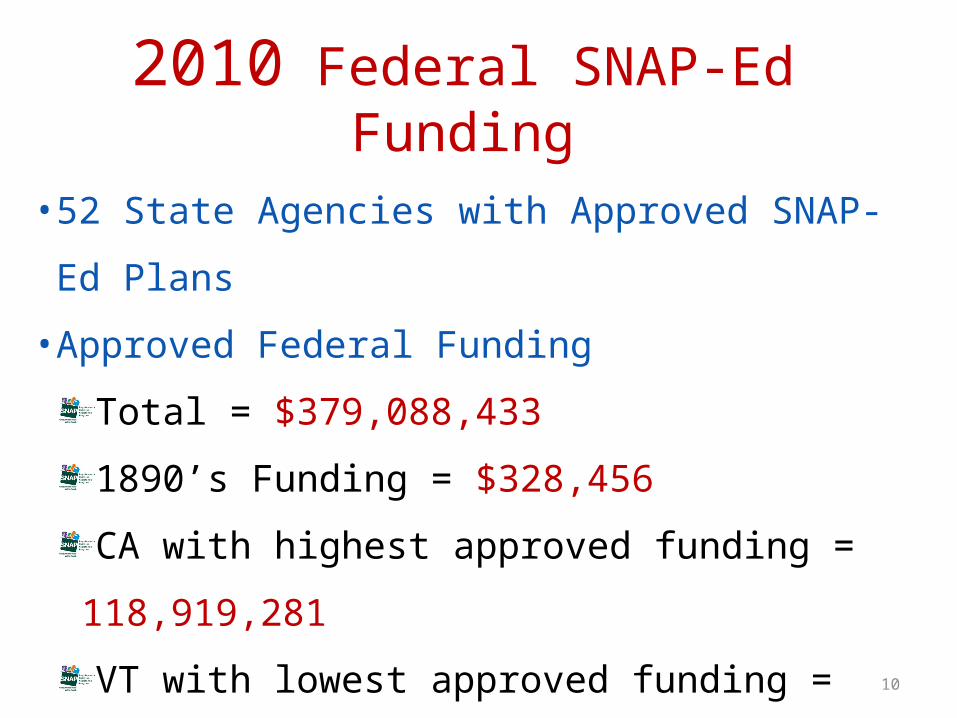
2010 Federal SNAP-Ed Funding
• 52 State Agencies with Approved SNAP-Ed Plans
• Approved Federal Funding
Total = $379,088,433
1890’s Funding = $328,456
CA with highest approved funding = 118,919,281
VT with lowest approved funding = $69,250
10

2010 SNAP-Ed National Picture
• AVG Funding Requested:$6,849,374
• AVG Funding Approved: $6,161,973
11

SNAP-Ed Guidance
• No Changes for 2011
• Changes for 2012
– Dietary Guidelines Update– Any other revisions deemed Necessary– Revised Annual Final Report
12

Ratio of SNAP-ED administrative costs to SNAP-ED delivery costs.
Ratio of SNAP-ED Direct Education Participants Receiving Food Stamps to All SNAP-ED Direct Education Participants.
Ratio of Persons Reached by SNAP-ED Social Marketing Who Receive Food Stamps to All Persons Reached by
SNAP-ED Social Marketing.
Supplemental Nutrition Assistant Program Education PART ReviewFY 2007
Results Not Demonstrated
SNAP-Ed Performance Measures Approved by OMB FY2008
- No standard performance measures- Program mission and goals not clearly established in stature or Regs- Unclear if funds spent effectively to increase participation and improve nutrition related behavior.
Supplemental Nutrition Assistant Program PART ReviewFY 2003
Education Administrative Reporting System (EARS)
FY 2003
SNAP-Ed Research· SNAP-ED Systems Review FY2006·Models Of SNAP-Ed and Evaluation (on-going)
SNAP-ED Guiding PrinciplesFY 2005
EARS Data Available to OMB, FNS Administrators and Managers FNS 759 Data Uploaded into NDB
SNAP-Ed Implementing Agencies Provide EARS Data to State Agency
State Agencies Enter into FPRS
FNS Regional Staff Certify the FNS-759 (EARS)
Data In FPRS
Implementation of EARS Form Approved by OMB FY 2007
EARS Fully Implemented by FY 2010FY08 Financial Questions # 9 and #10 Due October 1 - December 31, 2008
Released October 2008
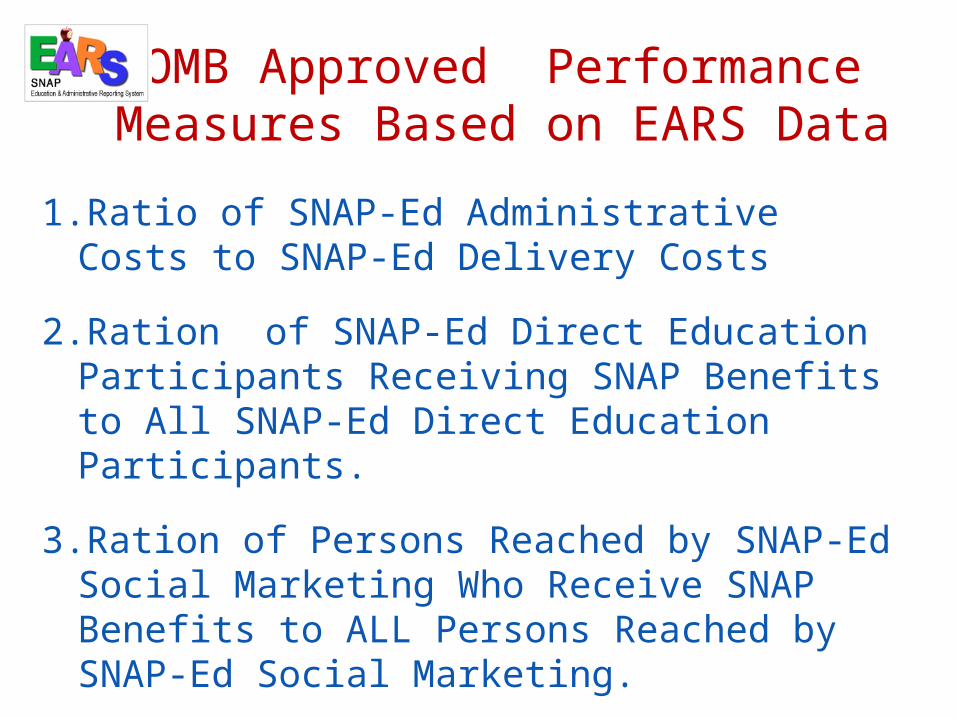
OMB Approved Performance Measures Based on EARS Data
1.Ratio of SNAP-Ed Administrative Costs to SNAP-Ed Delivery Costs
2.Ration of SNAP-Ed Direct Education Participants Receiving SNAP Benefits to All SNAP-Ed Direct Education Participants.
3.Ration of Persons Reached by SNAP-Ed Social Marketing Who Receive SNAP Benefits to ALL Persons Reached by SNAP-Ed Social Marketing.

What is EARS?
• EARS is a reporting form – not a data collection tool•It provides descriptive information and data, not outcome data•Annual report of prior Fiscal Year’s activities and expenditures

Why do we need EARS?
• EARS has established uniform definitions for SNAP-Ed participants and contacts•Data will provide a picture of SNAP-Ed activities on a state, regional and national level
•Allow for trend analysis over time•Data will be available to respond to and support policy and legislative efforts

EARS will not meet all our needs…
EARS is one of several actions FNS has taken to enhance our
understanding of State and local SNAP-Ed activities…it will not tell us
everything.
It will NOT:Replace the year end report.Tell us about all aspects of SNAP-Ed.
Provide evaluation data. 17
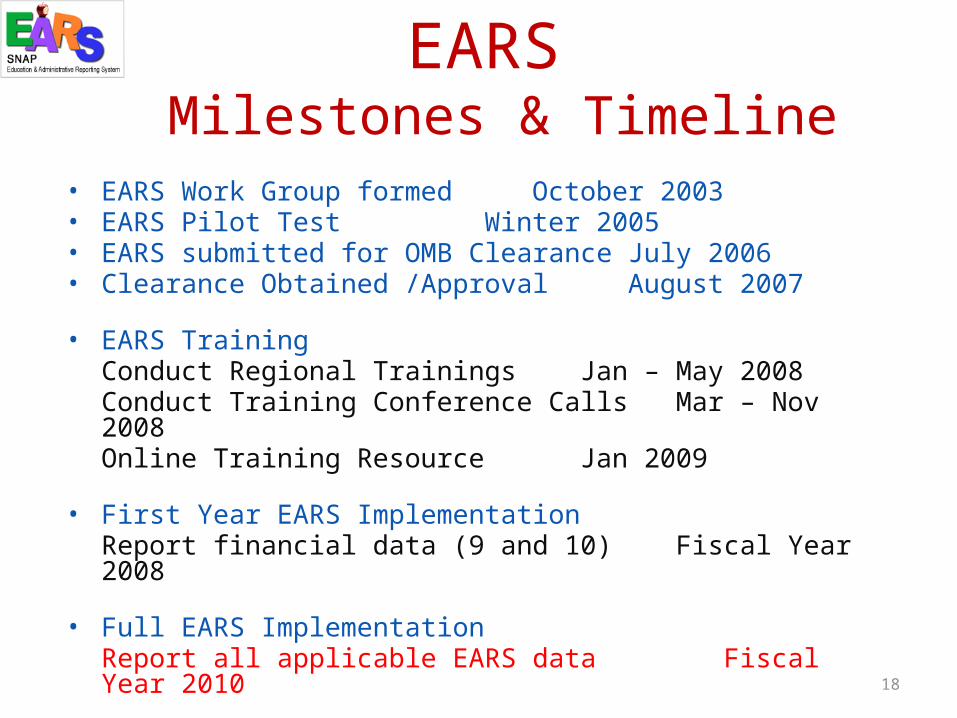
EARS Milestones & Timeline
• EARS Work Group formed October 2003• EARS Pilot Test Winter 2005• EARS submitted for OMB Clearance July 2006• Clearance Obtained /Approval August 2007
• EARS TrainingConduct Regional Trainings Jan – May 2008Conduct Training Conference CallsMar – Nov 2008Online Training Resource Jan 2009
• First Year EARS ImplementationReport financial data (9 and 10) Fiscal Year 2008
• Full EARS Implementation Report all applicable EARS data Fiscal Year 2010
18

EARS
• Results of the First Year
– Outputs:
• What we know thus far
19

Implementation
States have 3 years for full implementation
States required to report financial data for FY 2008
States encouraged to report reliable data for applicable components 2009
December 30, 2010 Full data implementation by all States.
20

FY 2008 Reporting
0
50
100
Financial Data
Direct Data Indirect Data Social Marketing
95
34 29 8
Number of Implementing Agencies Reporting for FY 2008
21

Total 2008 Expenditures by Source
t
$214 M
$174 M
$61 M
Federal
SA/LA
0ther
22

Program Delivery & Administrative Costs
$350 M
$99 M
Program DeliveryAdministrative
77%
22%
23

SNAP –Ed Participants by Program Status
1,018,957 55%
825,745 45%
Total Number of People Receiving SNAP-ED
SNAP Program
Non-SNAP
24

Primary Content of Social Marketing (% of agencies addressing)
24%
19%
14%
10%
33%
Fat Free & Low Fat Milk Or Equiv (& Alternate Calcium Sources)
Fruits & Vegetables
MyPyramid
Physical Activity
Others
N=8
25

SNAP Actual19%
SNAP Estimated
37%Others Actual10%
Others Es-timated
35%
SNAP Actual
SNAP Estimated
Others Actual
Others Es-timated
EARS-R1 - Analysis Data - US
SNAP-ED Participants by SNAP Status

4%
19%
1%
69%
1%
5%
American Indian or Alaska NativeBlack or African AmericanAsianWhiteNative Hawaiian or Other Pacific IslanderIndividuals Reporting Mul-tiple Races
EARS-R2 - Analysis Data - US
SNAP-ED Participants by Race
27

Direct & Indirect Education¤
Social Marketing All Education Efforts$0.00 $2.00 $4.00 $6.00 $8.00
$10.00 $12.00 $14.00 $16.00 $18.00 $20.00 $18.10
$0.03
$3.41
Type of Nutrition Education
Cost
EARS-R6 - Analysis Data - US
Cost per Person Reached* by Type of Nutrition Education
28
23%
20%
13%
9%
35%
MyPyramidFruits & VegetablesPhysical ActivityFood SafetyOthers
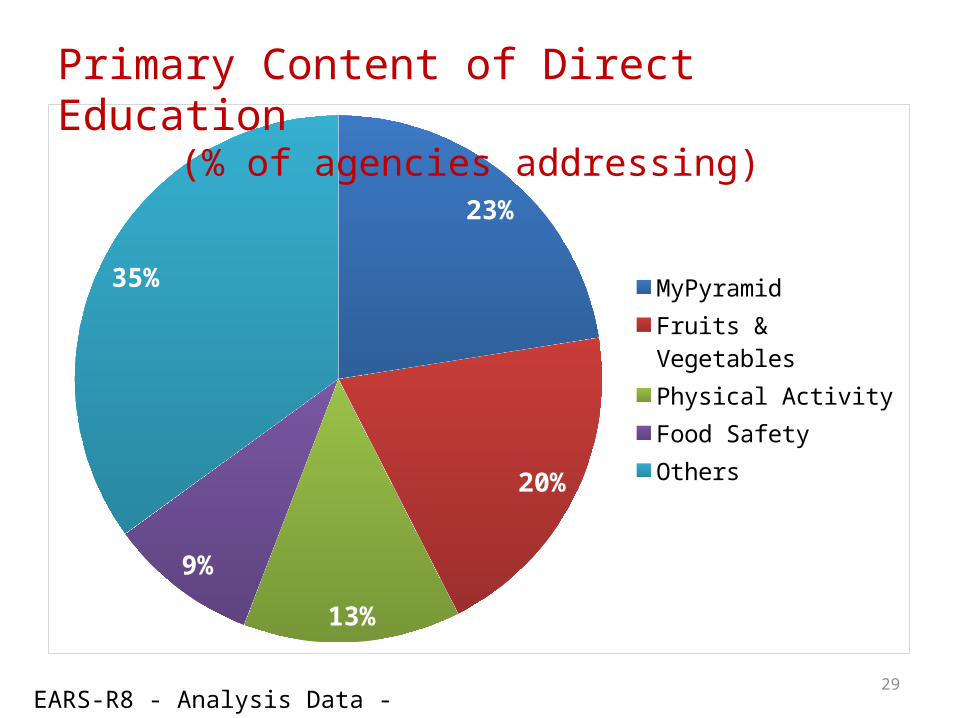
EARS-R8 - Analysis Data - US
Primary Content of Direct Education (% of agencies addressing)
29

24%
19%
14%
10%
33%
Fat Free & Low Fat Milk Or Equiv (& Alternate Calcium Sources)
Fruits & Vegetables
MyPyramid
Physical Activity
Others
Primary Content of Social Marketing
(% of agencies addressing)
EARS-R8 - Analysis Data - US 30
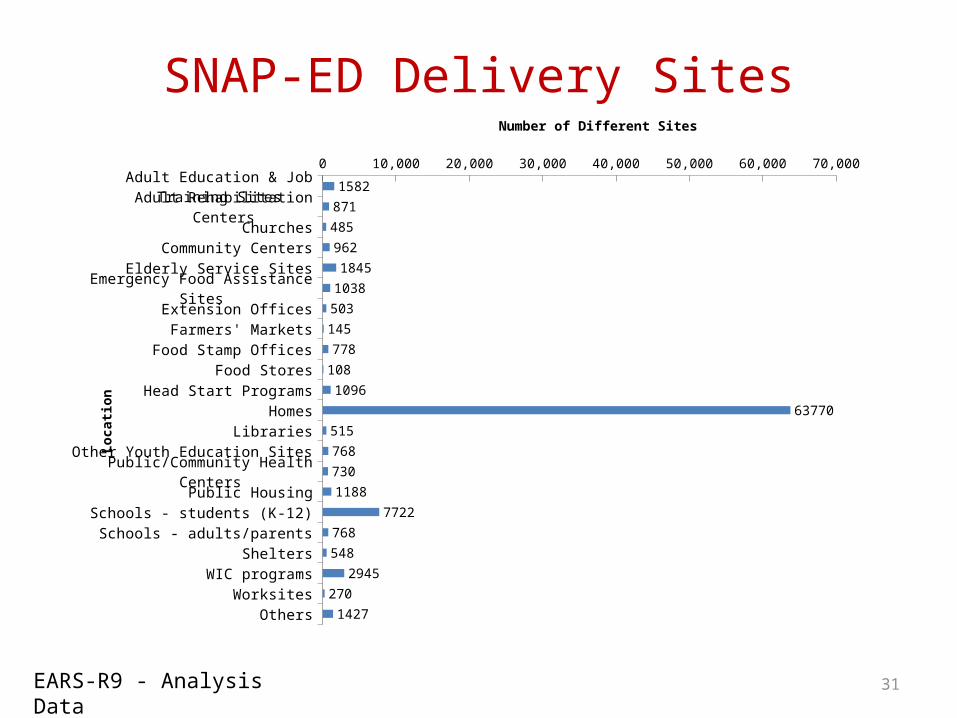
EARS-R9 - Analysis Data
Adult Education & Job Training SitesAdult Rehabilitation Centers
ChurchesCommunity Centers
Elderly Service SitesEmergency Food Assistance Sites
Extension OfficesFarmers' Markets
Food Stamp OfficesFood Stores
Head Start ProgramsHomes
LibrariesOther Youth Education Sites
Public/Community Health CentersPublic Housing
Schools - students (K-12)Schools - adults/parents
SheltersWIC programs
WorksitesOthers
0 10,000 20,000 30,000 40,000 50,000 60,000 70,000
1582
871
485
962
1845
1038
503
145
778
108
1096
63770
515
768
730
1188
7722
768
548
2945
270
1427
Number of Different Sites
Lo
cati
on
SNAP-ED Delivery Sites
31

32
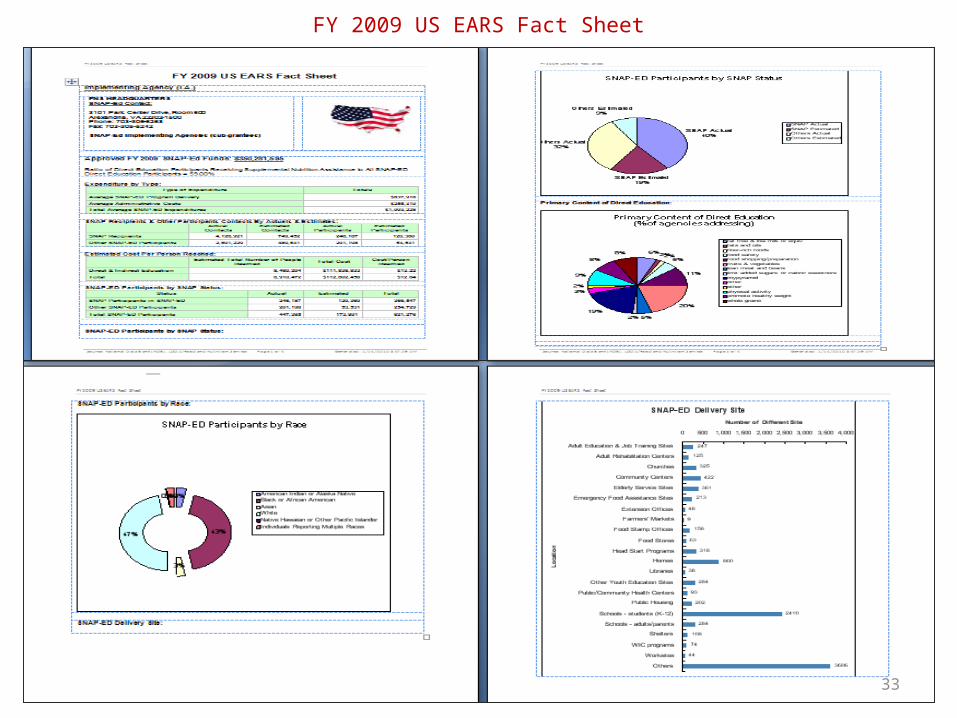
FY 2009 US EARS Fact Sheet
33
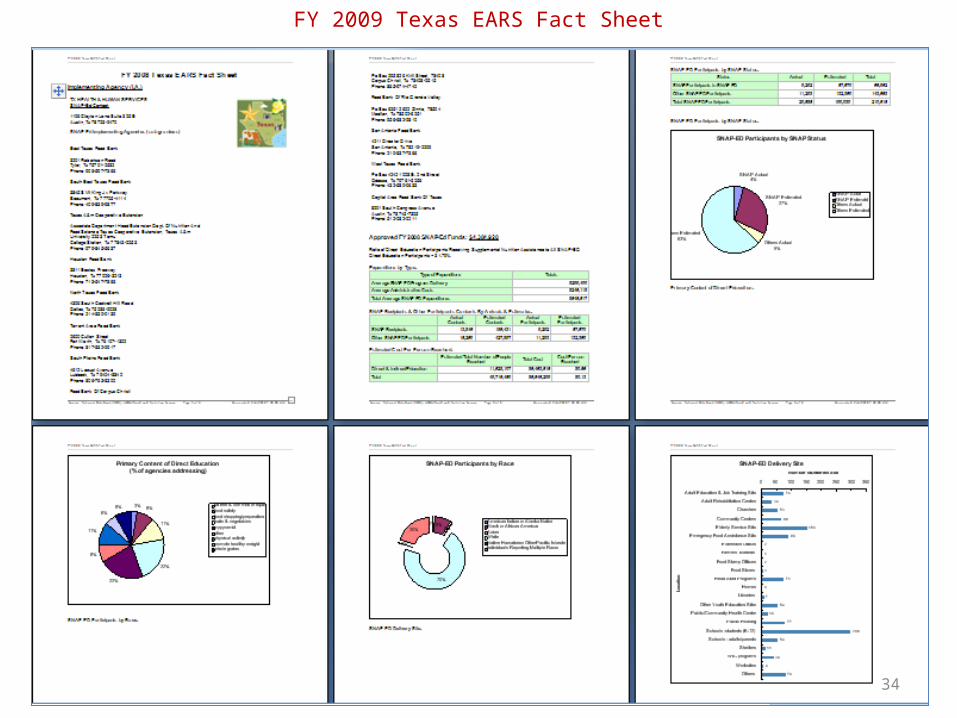
FY 2009 Texas EARS Fact Sheet
34
Revised Final Annual Report
• Eliminates redundancies with EARS
• Highlights Key Elements not illustrated on
EARS Form
• Submitted for OMB approval 2/6/09
• Relevant when EARS fully implemented
• FY 2010 Plans.
35
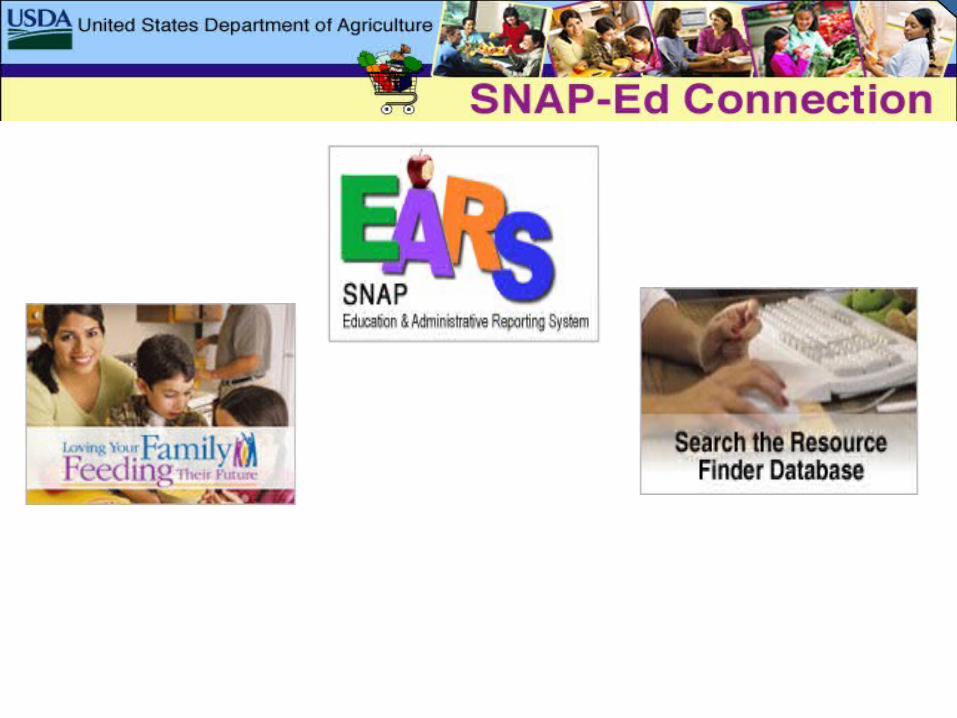
Loving Your Family…
• Significant utilization by all regions
• Order Stats as of December 2009:
– 4.9 million individual pieces ordered
– Over 100,000 web hits
• Possible future update
– new name of SNAP
– new 2010 DGA’s
36

Eat Smart Live Strong
• 2 Key Behaviors for healthy low-income 60-74 years olds– Increase Fruit and Vegetables to 3 ½
cups/day– Participate in at least 3037 minutes of P.A.
37

Multi-Year Plans
• Year 3 Regional Reports
– Easy to follow templates– Shorter plans to review– Time Savings– Lack of long-term strategy – Program stability is key
38

Multi-Year Plans
• Where do we go from here?–Completion of Year 3 –Conclusion of the Pilot – FY 2010
• Analysis of Pilot
39

Web Site Stats– FY 2009 Annual Hits- 3,798,901– Monthly Average = 316,575 hits– Resource Finder Database – 378-356
resources– SNAP-Ed Talk- 450-407 members = 9%
increase– Recipe Finder Database- 600-408 recipes
available in both English and Spanish
41

Recipe Finder Database
–Module translated into Spanish• Search in English or Spanish• View/Print recipes in English or Spanish
• Printed recipe cards
42

Nutrition Through The Seasons
43

Eating Right When Money’s Tight
44

SNAP-Ed Connection Information Super-Hub
– Education Resources and Curriculums
– Training Materials (EARS, Loving Your Family…)
– Current Guidance and Policy Memos
– SNAP-Ed Opportunities
• Models of SNAP-Ed and Evaluation
• Future Evaluations45

What Are The FNS Core Messages
• … a set of actions designed to assist mothers and children in making specific diet-related changes
46
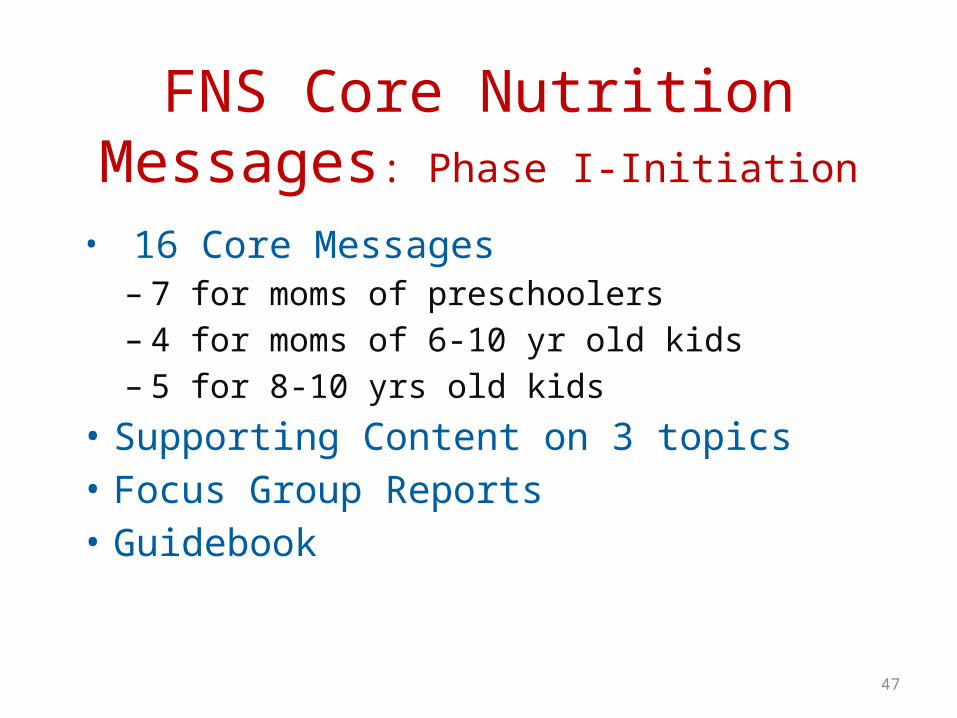
FNS Core Nutrition Messages: Phase I-Initiation
• 16 Core Messages– 7 for moms of preschoolers– 4 for moms of 6-10 yr old kids– 5 for 8-10 yrs old kids
• Supporting Content on 3 topics• Focus Group Reports• Guidebook
47

FNS Core Nutrition Messages: Phase 2 Expansion
• Develop new message to promote whole grains
• Expand messages on low and fat-free milk products
• For Moms of preschool and Elementary school kids.– Supporting content– Complementary photos
48

QUESTIONS?