mutual funds and market performance: new … funds and market performance: new evidence from asean...
TRANSCRIPT
Full Terms & Conditions of access and use can be found athttp://www.tandfonline.com/action/journalInformation?journalCode=riaj20
Download by: [University of Malaya] Date: 18 December 2016, At: 22:38
Investment Analysts Journal
ISSN: 1029-3523 (Print) 2077-0227 (Online) Journal homepage: http://www.tandfonline.com/loi/riaj20
Mutual funds and market performance: Newevidence from ASEAN markets
Fiza Qureshi, Izlin Ismail & Sok Gee Chan
To cite this article: Fiza Qureshi, Izlin Ismail & Sok Gee Chan (2016): Mutual funds andmarket performance: New evidence from ASEAN markets, Investment Analysts Journal, DOI:10.1080/10293523.2016.1253137
To link to this article: http://dx.doi.org/10.1080/10293523.2016.1253137
Published online: 14 Dec 2016.
Submit your article to this journal
Article views: 2
View related articles
View Crossmark data
Mutual funds andmarket performance: New evidence from ASEANmarketsFiza Qureshi, Izlin Ismail and Sok Gee Chan
Department of Finance & Banking, Faculty of Business and Accountancy, University of Malaya, Kuala Lumpur,Selangor, Malaysia
ABSTRACTThe contemporaneous growth in ASEAN financial markets over the lasttwo decades raises empirical questions regarding the role of institutionalinvestors in financial market performance. Our study examines thedynamic relationship of aggregate mutual fund flows with marketperformance variables, i.e. stock market returns and volatility in ASEANfinancial markets. Findings suggest that equity and balanced flows havea positive (negative) relationship with market returns (volatility), whereasbond and money market flows have a negative (positive) linkage withmarket returns (volatility). Furthermore, equity and balanced mutualfunds contribute towards reducing market volatility. In addition, mutualfunds respond concurrently to risk-related information as compared toreturns-related information in the stock market. We also identify thatrisky securities have a stronger relationship with the market variablesthan less risky securities do. Moreover, investors direct flows away fromequity-based funds to fixed income-type funds in times of highmarket risk.
ARTICLE HISTORYReceived 21 May 2016Accepted 20 October 2016
KEYWORDSMutual funds; market returns;market volatility; ASEAN
Introduction
Mutual funds are developed financial intermediaries in advanced financial markets. The develop-ment of mutual funds can be witnessed by the extent to which research both at the theoreticaland the technical level has been carried out in these markets. However, in emerging markets, mutualfunds are at an embryonic stage. Although the number of mutual funds is lower in Asian marketscompared to the US market, their growth has exhibited a significant increase. These growing invest-ment patterns of mutual funds are noticeable globally, particularly in the Asian developing econom-ies in the aftermath of the Asian and global financial crises. In addition, the signs of recovery werehigher in economies after the financial crises. Considering this phenomenal growth in these Asianmarkets, questions may arise such as: What is the role of mutual funds in financial markets? Dothey influence the variables that are linked with market performance? Which fund category performsbetter in times of high financial market crisis? This paper addresses these questions. In particular, itaims to evaluate the relationship of mutual funds with market returns and market risk.
Few studies exist on the relationship between mutual funds and financial markets, despite theimportance and growth of mutual funds worldwide, for example Warther (1995) and Edelen(1999). However, the majority of such studies have been conducted on the mutual funds’ perform-ance at firm level, while only handful1 investigate the relationship of mutual funds and marketreturns at the aggregate level, for example Edelen and Warner (2001) and Ben-Rephael, Kandel,and Wohl (2011). Moreover, the findings of these studies are inconclusive and contradictory.Some of the existing literature explains that investments by funds are mostly driven by investors’
© 2016 Investment Analysts Society of South Africa
CONTACT Dr Izlin Ismail [email protected]
INVESTMENT ANALYSTS JOURNAL, 2016http://dx.doi.org/10.1080/10293523.2016.1253137

sentiments (price pressure) against economic fundamentals (Harris & Gurel, 1986; Shleifer, 1986). Incontrast, Oh and Parwada (2007) explain that investors make their investment decisions based onrecent performance. Research in this strand is necessary in order to determine the role of mutualfunds for devising investment decisions based on exposure to growing financial market instabilityand deteriorating economic conditions (Bali, Brown, & Caglayan, 2014). Furthermore, there isenough evidence2 of the association between stock market returns and volatility, but the literatureon mutual fund flows and stock market variables (risk and return) has received scant attentiondespite the importance of mutual funds in stock trading. Moreover, researchers’ interest in micro-analysis of mutual funds and market variables has been on the rise over the last two decades(Cohen, Gompers, & Vuolteenaho, 2002). However, literature on macro-analysis of this relationshipis scarce.3 In addition, the studies are conducted mostly in the context of developed countries such asthe USA, China, Korea and Japan – see, for instance, studies by Wermers (1999); Barber and Odean(2008); Li and Wang (2010). Hardly any literature exists on fund flows and stock market risk andreturn from the perspective of developing markets.
We provide evidence on the empirical relationship of mutual funds with the stock market returnand stock market volatility of five ASEAN countries over the period 2001 to 2015. The stock marketrisk and return topic has been of special interest to international portfolio managers, researchers andpractitioners, particularly in emerging markets over the last two decades. The emergent interdepen-dence of stock markets is attributed to the increase in capital flows and prospective benefits of invest-ment diversification across national boundaries and at an international level. After the financialreforms that erupted out of deregulation, the growth rates in ASEAN economies have become thehighest in the world. ASEAN stock market integration has been the focus of attention specificallyafter the Asian financial crises. Studies suggest that the opportunities for international portfoliodiversification exist within the context of the ASEAN equity market. Moreover, the integratedregional markets are more proficient compared with the fragmented national markets (Azman-Saini, Azali, Habibullah, & Matthews, 2002). Thus, owing to the importance of investment infinancial markets, investigating the role of mutual funds as institutional investors in ASEANstock markets is relevant and beneficial.
This study aims to fill the gap in the existing literature and to provide empirical evidence on therelationship of mutual funds with market performance variables in five ASEAN countries. The studycontributes to the body of literature in several ways. First, it provides a comparative analysis of thefour main types of mutual fund flows (aggregate equity, bond, balanced and money market flows).Second, it examines fund flows with respect to both stock market returns and stock market volatility.The study tests a price-pressure hypothesis and a feedback trading hypothesis to determine theempirical flow-return-volatility relationship together, and therefore it takes into account both mar-ket returns and market volatility (risk-return evaluation) in analysing the performance of mutualfunds at the macro level. By looking at the role and behaviour of different mutual funds in financialmarkets, the study provides comprehensive insights into the strategies of portfolio managers andmarket analysts in asset allocation decisions. Third, previous studies follow a time series approach;however, our study uses panel data on multiple countries and exploits cross-country dimensions ofthe data set. Lastly, the study adds new empirical evidence on flow, market return and market riskrelationships in the ASEAN-5 financial stock market.
The findings suggest that equity and balanced flows are positively (negatively) related with stockmarket returns (stock market volatility), whereas bond and money market flows are negatively (posi-tively) associated with stock market returns (stock market volatility). Moreover, mutual fundsrespond more quickly to risk-related information than to returns-related information in the stockmarket. The rest of the paper is organized as follows. The literature is explained in the next section,while the data and variables description are discussed in the section after that. The third section dealswith empirical models and estimation techniques, after which the empirical analysis is reported onand the results discussed. The final section concludes the study.
2 F. QURESHI ET AL.

Literature review
A vast amount of literature appears to be devoted to the determinants of mutual funds at the indi-vidual level. Numerous studies4 examine the factors affecting the performance and growth of variousmutual fund classes with the main focus being on risk-adjusted performance at the micro firm/sectorlevel or domestic/international level. A study by Warther (1995) is a pioneering one on the relation-ship between funds flows and market returns at macro level. However, although it contributestowards documenting the relationship of aggregate market returns and aggregate fund flows, itfails to draw conclusive evidence and provide a thorough explanation of the phenomena.
Some of the existing literature explains that investment by funds is mostly driven by investors’sentiments, in contrast to the real fundamentals of the economy (Edelen, 1999; Ben-Rephaelet al., 2011). Other studies, such as those by Hendricks, Patel, and Zeckhauser (1993) and Oh andParwada (2007) explain that investors make their investment decisions based on recent performance.In another context, some studies find strong evidence that fund flows and market returns are con-currently correlated to macro-economy fundamentals (Jank, 2012), while other studies find a causalrelationship between fund flows and market returns (Aydoğan, Vardar, & Tunç, 2014). Overall, it isevident that the research related to determining the relationship between fund flows and marketreturns has been mostly mixed and inconclusive.
In the context of the flow-volatility relationship, pioneering theoretical studies5 state that soph-isticated institutional investors respond rationally to stock market volatility and are less likely to beaffected. They are called ‘smart investors’, who counterbalance individual irrational investment andreduce market noises (Cao, Chang, & Wang, 2008). However, certain studies provide contradictoryevidence. For instance, institutional investors may find riskier and volatile securities more attractiveas these are likely to outperform the average market securities.6 It is argued that prudent behaviourby institutional investors should result in market stability, due to the accessible information thathelps in controlling price deviation from the fundamentals (Brown, Harlow, & Starks, 1996; Dennis& Strickland, 2002; Bohl, Brzeszczyński, & Wilfling, 2009). Overall, one can recognise the difficultyof inferring a clear-cut conclusion in the prevailing theoretical and empirical debate, as studies yieldambiguous results and their findings have been inconclusive and contradictory. Therefore, our studyprovides an empirical analysis of the association of the four main mutual fund classes; i.e., equity,bond, balanced and money market mutual funds, with market variables to bridge this gap.
Data and variables
We use data from five ASEAN countries. The sample countries include Malaysia, Indonesia, Thai-land, Philippines and Singapore. The total sample consists of 1 863 equity mutual funds, 2 410balanced mutual funds, 1 047 bond mutual funds and 226 money market mutual funds. We focuson the time span from 2001 to 2015 for three reasons. First, the major growth of the mutual fundindustry has been observed in these countries after the Asian financial crisis of 1997 (Klapper,Sulla, & Vittas, 2004). Second, in this time span the growth of mutual funds has doubled all aroundthe world, including in the Asian economies.7 Third is the availability of data.
We calculate aggregate fund flows on a monthly basis. According to Sirri and Tufano (1998),flows are defined as the net growth in mutual fund assets excluding reinvested dividends. Netflows are explained as net sales or net trading (net buying less net selling) which is a proxy of mutualfund trading behaviour in financial markets (Warther, 1995; Ferreira, Keswani, Miguel, & Ramos,2012; Thomas, Spataro & Mathew, 2014). This shows that fund flows represent net trading or netinvestment by mutual funds in financial markets. According to Ferreira et al. (2012), the flowsare defined as the new money growth rate, as the net growth in total net assets (TNAs) is not domi-nated due to dividends and capital gains on the assets under management but is due to new externalmoney earned through investment (net trading by mutual funds) in the financial markets. Thus,flows are a proxy of mutual funds’ investment or trading behaviour. Monthly data is used to perform
INVESTMENT ANALYSTS JOURNAL 3
tests to check the dynamics of the flow-return-volatility relationship. We follow Sirri and Tufano(1998) and Ferreira et al. (2012) to calculate fund flows through Equation 1.
Flowsi,t = [TNAi,t − TNAi,t−1(1+ Ri,t)]/TNAi,t−1 (1)
where TNAi,t is the total net asset in dollar amount of fund i at the end of month t, and Ri,t is fund і’sraw return in dollar value in month t. Monthly TNA and fund returns’ data of each individual fundof each category of funds (equity, bond, balanced and money market funds) have been extracted.Then flows of each individual fund are calculated through Equation 1 of each country. Finally,the flows of each period of all individual funds of each country are summed up to obtain the aggre-gated fund flows of each period (in our case, one month). For instance, the flows of the sample of 189equity mutual funds in Indonesia has been summed up for each period (i.e., January 2001 to Decem-ber 2015), to obtain the monthly aggregated equity flows of Indonesia.8 We follow this procedure ofaggregating flows suggested by Ferreira et al. (2012) and Cao et al. (2008).
Fund flow variables data are taken from the Bloomberg database. Market performance variablesdata are taken from the Thomson Reuter database. All variables data are expressed in US dollars as acommon currency. Mutual funds data have been winsorised at 1% at country level to ensure thatoutliers do not affect our results (Verardi & Dehon, 2010). Following Cao et al. (2008), we estimatethe stock market volatility by GARCH model. Previous literature explains that the stock marketreturns reveal conditional heteroscedasticity (Nelson, 1991; Bekaert & Harvey, 1997); thus, weadopt a two-step procedure to estimate the volatility. First, we estimate a GARCH (1, 1) modelwith an AR (2) specification for the daily return on the stock markets index. Second, we estimateconditional variance to obtain volatility estimators.9 We take the stock price index daily. In eachcountry, this index is computed by the respective stock markets or central banks and it coversmore than 85% of total market capitalisation. Mixed results are expected between fund flows and
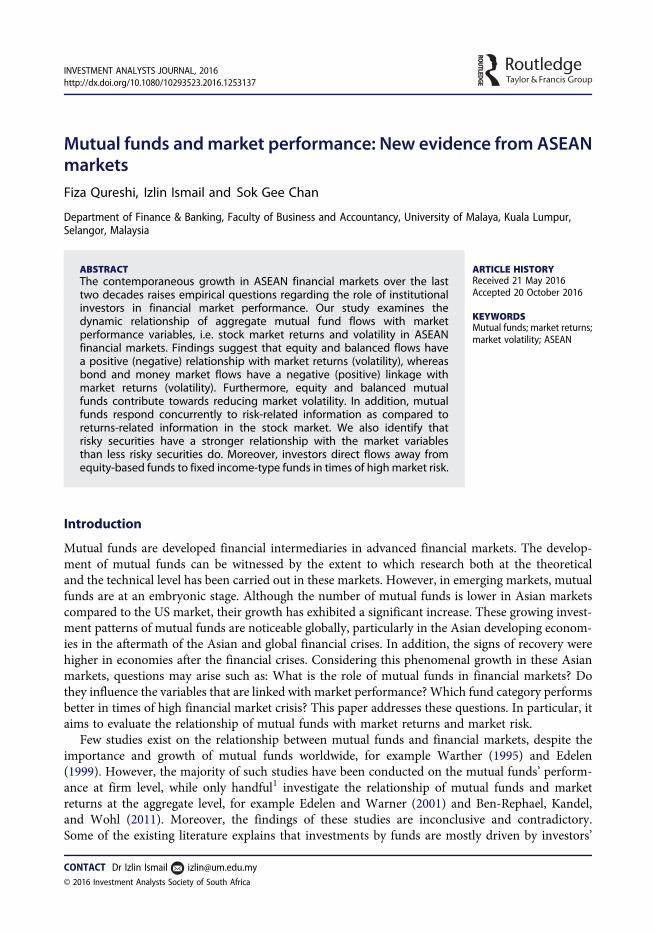
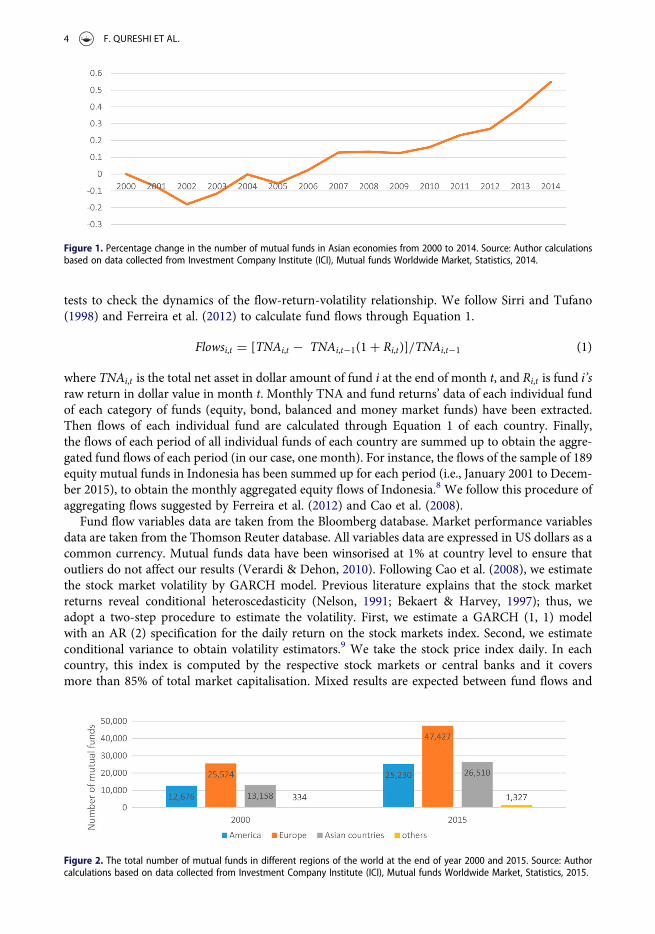
Figure 1. Percentage change in the number of mutual funds in Asian economies from 2000 to 2014. Source: Author calculationsbased on data collected from Investment Company Institute (ICI), Mutual funds Worldwide Market, Statistics, 2014.
Figure 2. The total number of mutual funds in different regions of the world at the end of year 2000 and 2015. Source: Authorcalculations based on data collected from Investment Company Institute (ICI), Mutual funds Worldwide Market, Statistics, 2015.
4 F. QURESHI ET AL.

stock market variables due to the different categories of mutual fund classes, based on their invest-ment objectives and risk-taking strategies. We expect a positive relation between fund flows andmarket returns and a negative relation between fund flows and market volatility, since increasedmarket returns increase investment activities and increased market volatility reduces the tradingactivities by mutual funds.
Empirical models
The study applies a panel vector autoregressive model (PVAR) which helps to evaluate the inter-action between endogenous variables and permits an unobserved heterogeneity (Love & Zicchino,2006). Earlier studies on this topic, such as those by Ben-Rephael, Kandel & Wohl (2012) andJank (2012) also use the VAR model; however, they apply VAR in the time series setting. Thisstudy uses a reduced-form panel VAR in a generalised method of moments (GMM)10 environment,following Love and Zicchino (2006).11 The purpose is to find the dynamic relationship betweenmutual funds and market variables (returns, volatility). Before the VAR analysis, it is importantto check the stationarity, model selection and the optimal lag order selection of variables. To testthe stationarity of variables, we perform both the Fisher type augmented Dickey-Fuller test unitroot test and the Phillips-Perron unit root test (with and without drift). The results suggest thatall variables are stationary at level. The lag selection is based on the Bayesian information criteria(BIC), the Akaike information criteria (AIC) and the Hannan-Quinn information criteria (HQIC).
Flows-return relationship
The following bivariate VAR equations are estimated to determine relationship:
Flowsi,t = a1 +∑2
i=1
b1Flowsi,t−1+∑2
i=1
b2MRi,t−1 + 11it (2)
MRi,t = a2 +∑2
i=1
b3Flowsi,t−1+∑n
i=1
b4MRi,t−1 + 12it (3)
where Flowsi,t stands for net fund flows of country i at the end of quarter t and MRi,t stands forreturns of the market index for country i at the end of quarter t. In a bivariate VAR model, flowsof equity, bond, balanced and money market mutual funds are expected to be affected by stock mar-ket returns. The equity fund flows are expected to be positively associated with stock market returns,whereas bond, balanced and money market mutual funds are presumed to have a negative relation-ship with them, because higher market returns entail higher equity flows and vice versa for otherclasses of mutual fund flows. The popular stock market index of each country is used as a proxyfor market returns.12
Flows-volatility relationship
Equation (4) and Equation (5) are set to determine the dynamic relationship of mutual funds andstock market volatility.
Flowsi,t = a1 +∑2
i=1
b1Flowsi,t−1+∑2
i=1
b2MVi,t−1 + 11i,t (4)
MVi,t = a2 +∑2
i=1
b3Flowsi,t−1+∑2
i=1
b4MVi,t−1 + 12i,t (5)
INVESTMENT ANALYSTS JOURNAL 5

where MVi,t stands for returns of stock market volatility for country i at the end of quarter t. Vola-tility and fund flows are expected to have a negative relationship because increasing volatility indi-cates that adverse economic conditions lie ahead.
Empirical results
The descriptive statistics and correlation matrix
Table 1 presents the summary statistics of the aggregate net fund flows, market returns and marketvolatility in percentages. The mean of aggregate equity flows over the sample period is 0.063% permonth, which is marginally higher than the mean of other fund flows (0.0431%, 0.0201% and0.0234%). The standard deviation of equity flows and money market flows is 0.0976% and0.970%, which is slightly greater as compared to the balanced and bond flows (0.0813%,0.0651%). A plausible reason may be the higher liquidity factor in these asset classes, which impliesmore fluctuations in their flows or trade. We find the mean is positive in all the fund flows classwhich indicates more inflows than outflows during the sample time period. The mean of marketreturns is approximately 0.03%; however, the mean of market volatility is the highest (1.246%).Moreover, the standard deviation of market volatility is also the highest (2.22%), which is obviouslydue to the market crashes and the effect of the world financial crises in the emerging economies.
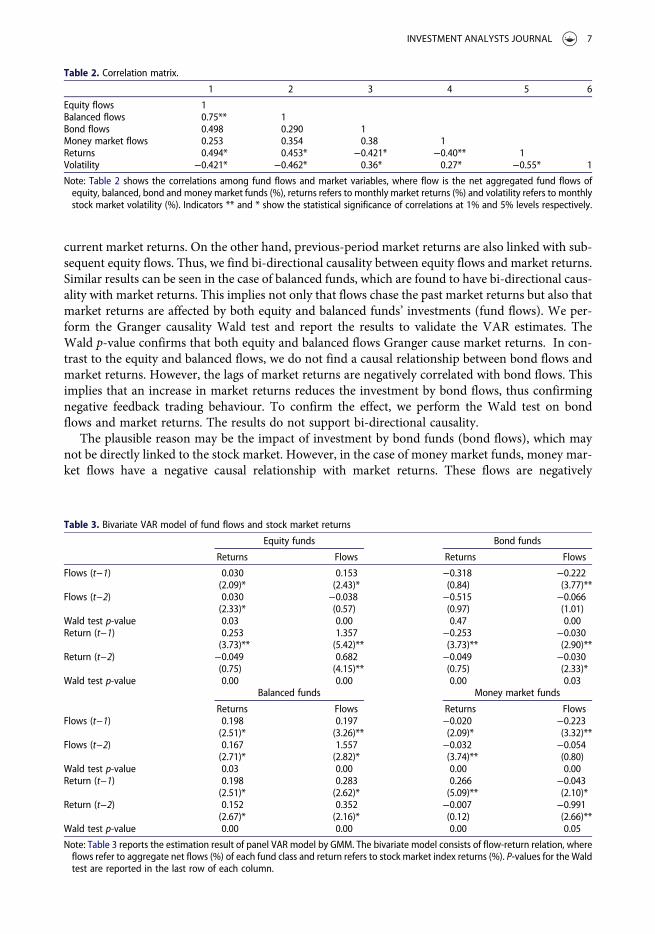
Table 2 presents the correlation matrix for the preliminary analysis of all the variables. The cor-relations among variables are significant and show a rough picture of the relationships. The coeffi-cient of correlation confirms the co-movement of the fund flows and stock market variables. Equityflows and market returns are positively correlated (0.49%). The same applies to the balanced flowsand market returns (0.45%). However, a negative correlation is observed between the bond flows andmarket returns, which is significant at 0.42%. Similarly, the money market flows and market returnsare significant at 0.40%. The equity and balanced flows are negatively correlated with market vola-tility, whereas bond and money markets are positively correlated with market volatility. We observe ahigher correlation between equity mutual funds and balanced mutual funds at 0.75%, which is sig-nificant. A higher proximity between equity funds and balanced funds implies that balanced fundsfollow a moderate investment approach.13 Moreover, correlation between market returns with mar-ket volatility is negatively significant at 0.55%, which is not so high as to create the problem ofmulticollinearity.
Results and discussions
Flow-return modelWe first estimate a bivariate model to obtain an idea of the dynamic relationship between fund flowsand market returns. Table 3 presents the results of the four fund flows and market returns. Theequity flows are positively associated with market returns. Lagged flows are positively related to
Table 1. Descriptive statistics.
Mean (%) Std (%) Min (%) Max (%)
Equity flows 0.0631 0.0976 0.0234 1.03Balanced flows 0.0431 0.0813 0.0204 0.99Bond flows 0.0201 0.0651 0.0234 0.13Money market flows 0.0234 0.0970 0.0234 1.43Returns 0.0276 0.1174 0.0106 0.504Volatility 1.246 2.221 1.190 2.36
Note: Table 1 reports descriptive statistics for each variable. Each column in the table shows average value, standard deviation, andminimum value, maximum value for fund flows, market returns and market volatility. Where flows refer to aggregate net flows(%), returns refers to monthly market returns (%) which are calculated using market indices of each country, and volatility refersto monthly stock market volatility (%) calculated using daily returns of each country index returns. The data is from January 2001to December 2015.
6 F. QURESHI ET AL.
current market returns. On the other hand, previous-period market returns are also linked with sub-sequent equity flows. Thus, we find bi-directional causality between equity flows and market returns.Similar results can be seen in the case of balanced funds, which are found to have bi-directional caus-ality with market returns. This implies not only that flows chase the past market returns but also thatmarket returns are affected by both equity and balanced funds’ investments (fund flows). We per-form the Granger causality Wald test and report the results to validate the VAR estimates. TheWald p-value confirms that both equity and balanced flows Granger cause market returns. In con-trast to the equity and balanced flows, we do not find a causal relationship between bond flows andmarket returns. However, the lags of market returns are negatively correlated with bond flows. Thisimplies that an increase in market returns reduces the investment by bond flows, thus confirmingnegative feedback trading behaviour. To confirm the effect, we perform the Wald test on bondflows and market returns. The results do not support bi-directional causality.
The plausible reason may be the impact of investment by bond funds (bond flows), which maynot be directly linked to the stock market. However, in the case of money market funds, money mar-ket flows have a negative causal relationship with market returns. These flows are negatively
Table 2. Correlation matrix.
1 2 3 4 5 6
Equity flows 1Balanced flows 0.75** 1Bond flows 0.498 0.290 1Money market flows 0.253 0.354 0.38 1Returns 0.494* 0.453* −0.421* −0.40** 1Volatility −0.421* −0.462* 0.36* 0.27* −0.55* 1
Note: Table 2 shows the correlations among fund flows and market variables, where flow is the net aggregated fund flows ofequity, balanced, bond and money market funds (%), returns refers to monthly market returns (%) and volatility refers to monthlystock market volatility (%). Indicators ** and * show the statistical significance of correlations at 1% and 5% levels respectively.
Table 3. Bivariate VAR model of fund flows and stock market returns
Equity funds Bond funds
Returns Flows Returns Flows
Flows (t−1) 0.030 0.153 −0.318 −0.222(2.09)* (2.43)* (0.84) (3.77)**
Flows (t−2) 0.030 −0.038 −0.515 −0.066(2.33)* (0.57) (0.97) (1.01)
Wald test p-value 0.03 0.00 0.47 0.00Return (t−1) 0.253 1.357 −0.253 −0.030
(3.73)** (5.42)** (3.73)** (2.90)**Return (t−2) −0.049 0.682 −0.049 −0.030
(0.75) (4.15)** (0.75) (2.33)*Wald test p-value 0.00 0.00 0.00 0.03
Balanced funds Money market funds
Returns Flows Returns FlowsFlows (t−1) 0.198 0.197 −0.020 −0.223
(2.51)* (3.26)** (2.09)* (3.32)**Flows (t−2) 0.167 1.557 −0.032 −0.054
(2.71)* (2.82)* (3.74)** (0.80)Wald test p-value 0.03 0.00 0.00 0.00Return (t−1) 0.198 0.283 0.266 −0.043
(2.51)* (2.62)* (5.09)** (2.10)*Return (t−2) 0.152 0.352 −0.007 −0.991
(2.67)* (2.16)* (0.12) (2.66)**Wald test p-value 0.00 0.00 0.00 0.05
Note: Table 3 reports the estimation result of panel VAR model by GMM. The bivariate model consists of flow-return relation, whereflows refer to aggregate net flows (%) of each fund class and return refers to stock market index returns (%). P-values for the Waldtest are reported in the last row of each column.
INVESTMENT ANALYSTS JOURNAL 7

associated with lags of market returns, which show that money market flows chase the past marketreturns negatively. Moreover, we also find that the lagged money market flows cause market returnsto decline, implying that excessive trading by short-term investors (for example, money marketfunds) leads to the reduction in stock market trading, thus reducing market returns. This suggeststhat money market funds being short term and highly liquid, securities are safe havens in timesof financial market crisis and can also become one of the causes of temporary reduction in marketactivities. What is noticeable is that bond flows, money market flows and market returns are inver-sely related. This implies that a decline in stock market prices and returns also subsequently brings adecline in equity investment in the stock market. On the other hand, a decline in the stock marketreturns increases investments by bond and money market investors. This shows that investors directflows away from equity-based funds and towards fixed income-type funds in times of low marketreturns and reduced market activity. These findings are different from those of earlier studies(Warther, 1995; Edelen & Warner, 2001; Oh & Parwada, 2007; Rakowski & Wang, 2009) whichfind a positive causal relationship of aggregate mutual funds and market returns.
Flow-volatility relationshipTable 4 depicts the panel VAR results of all four mutual fund total flows and stock market volatility.We discover that market volatility is negatively related to previous-period flows, suggesting thatequity flows have a negative impact on successive market volatility. Moreover, equity flows arealso negatively related to previous-period market volatility. This shows that equity funds not onlyfollow the lagged market volatility but also have a dampening effect on market volatility. Similar pat-terns can be seen in balanced flows. We observe that market volatility is negatively associated withprevious-period balanced flows. Moreover, balanced flows are also negatively associated with laggedmarket volatility. Overall, we observe negative causal relationship of equity flows and balanced flowswith market volatility which suggest that both equity and balanced fund are found to have contrarianbehaviour (negative feedback trading) with respect to market volatility. This also suggests that equity
Table 4. Bivariate VAR model of fund flows and stock market volatility
Equity funds Bond funds
Volatility Flows Volatility Flows
Flows (t−1) −0.006 0.007 −0.063 0.197(2.28)* (0.14) (0.98) (3.26)**
Flows (t−2) −0.059 0.060 −0.030 0.280(2.45)* (2.72)* (1.07) (3.95)**
Wald test p-value 0.03 0.00 0.34 0.00Volatility (t−1) 0.245 −0.998 0.134 0.498
(3.30)** (2.55)* (3.89)** (3.50)**Volatility (t−2) 0.414 −1.264 0.264 0.370
(3.91)** (2.08)* (3.23)** (3.28)**Wald test p-value 0.00 0.02 0.00 0.00
Balanced funds Money market funds
Volatility Flows Volatility FlowsFlows (t−1) −0.010 0.031 0.024 −0.026
(2.15)* (0.61) (2.43)* (0.60)Flows (t−2) −0.196 −0.019 0.030 0.117
(2.43)* (2.35)* (2.97)* (2.82)*Wald test p-value 0.04 0.00 0.01 0.04Volatility (t−1) 0.233 −0.561 0.044 0.044
(2.95)** (2.86)** (2.92)** (2.97)**Volatility (t−2) 0.324 −0.181 0.136 0.148
(3.22)** (2.42)* (3.27)** (2.57)*Wald test p-value 0.00 0.00 0.00 0.01
Note: Table 4 reports the estimation result of panel VAR model by GMM. The bivariate model consists of flow-volatility relation,where volatility refers to stock market volatility (%) and flows refer to aggregate net flows (%) of each fund class. P-valuesfor the Wald test are reported in the last row of each column.
8 F. QURESHI ET AL.
and balanced funds may time the market volatility. A theoretical explanation that may be offered isthat equity and balanced funds are characterised as risky securities, and investment by these secu-rities reduces in times of high financial market crises. In addition, trading by these funds may reducethe market volatility temporarily. The overall results suggest that equity and balanced flows have anegative causal relationship with market volatility, which confirms the findings by Cao et al. (2008)and Thomas et al. (2014).
However, in the case of bond flows, we find that these flows are positively linked with previous-period volatility. However, we do not observe any relation with lagged bond flows and succeedingmarket volatility. A relatively similar pattern can be observed in money market flows, which followthe market volatility positively associated with previous-period lags. However, it can be seen thatlagged money market flows have a negative association with subsequent market volatility. Thisimplies that money market flows may create hype in the market and lead stock prices to fluctuateabnormally due to their excessive speculation and investment. Overall, we observe that bondfunds and money market funds have momentum behaviour (positive feedback trading) with marketvolatility. A plausible explanation of this behaviour may be the risk-averse nature of the investors inthe financial markets, who reallocate the money from risky (equity-based) securities to less risky(fixed-income based) securities and safe havens in case of high market volatility and risk. Our find-ings on this are different from those of earlier studies (Cao et al., 2008; Thomas et al., 2014), whichfind contrarian behaviour in between fund flows and stock market volatility. Overall, Panel VARestimates support both the price-pressure and feedback trading hypotheses, except for bondfunds. We observe feedback trading behaviour in bond funds with market variables. A possiblereason may be the indirect effect of bond fund investment, which may not be clearly perceptibleon stock markets. The findings corroborate those of Ben-Rephael et al. (2011) and Aydogan et al.(2014), who find evidence of both temporary price-pressure and feedback trading hypotheses.
Robustness check
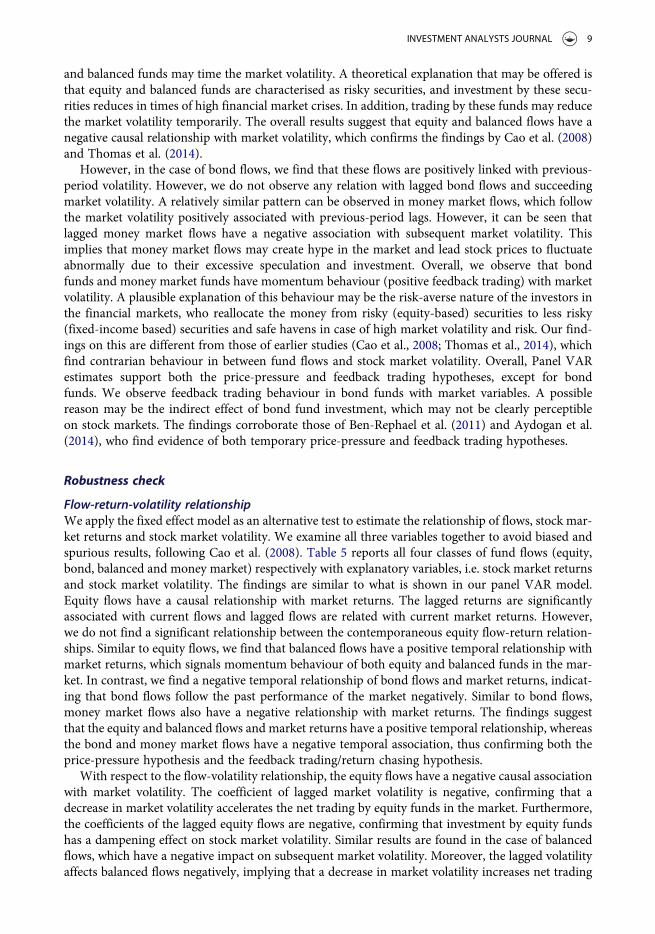
Flow-return-volatility relationshipWe apply the fixed effect model as an alternative test to estimate the relationship of flows, stock mar-ket returns and stock market volatility. We examine all three variables together to avoid biased andspurious results, following Cao et al. (2008). Table 5 reports all four classes of fund flows (equity,bond, balanced and money market) respectively with explanatory variables, i.e. stock market returnsand stock market volatility. The findings are similar to what is shown in our panel VAR model.Equity flows have a causal relationship with market returns. The lagged returns are significantlyassociated with current flows and lagged flows are related with current market returns. However,we do not find a significant relationship between the contemporaneous equity flow-return relation-ships. Similar to equity flows, we find that balanced flows have a positive temporal relationship withmarket returns, which signals momentum behaviour of both equity and balanced funds in the mar-ket. In contrast, we find a negative temporal relationship of bond flows and market returns, indicat-ing that bond flows follow the past performance of the market negatively. Similar to bond flows,money market flows also have a negative relationship with market returns. The findings suggestthat the equity and balanced flows and market returns have a positive temporal relationship, whereasthe bond and money market flows have a negative temporal association, thus confirming both theprice-pressure hypothesis and the feedback trading/return chasing hypothesis.
With respect to the flow-volatility relationship, the equity flows have a negative causal associationwith market volatility. The coefficient of lagged market volatility is negative, confirming that adecrease in market volatility accelerates the net trading by equity funds in the market. Furthermore,the coefficients of the lagged equity flows are negative, confirming that investment by equity fundshas a dampening effect on stock market volatility. Similar results are found in the case of balancedflows, which have a negative impact on subsequent market volatility. Moreover, the lagged volatilityaffects balanced flows negatively, implying that a decrease in market volatility increases net trading
INVESTMENT ANALYSTS JOURNAL 9
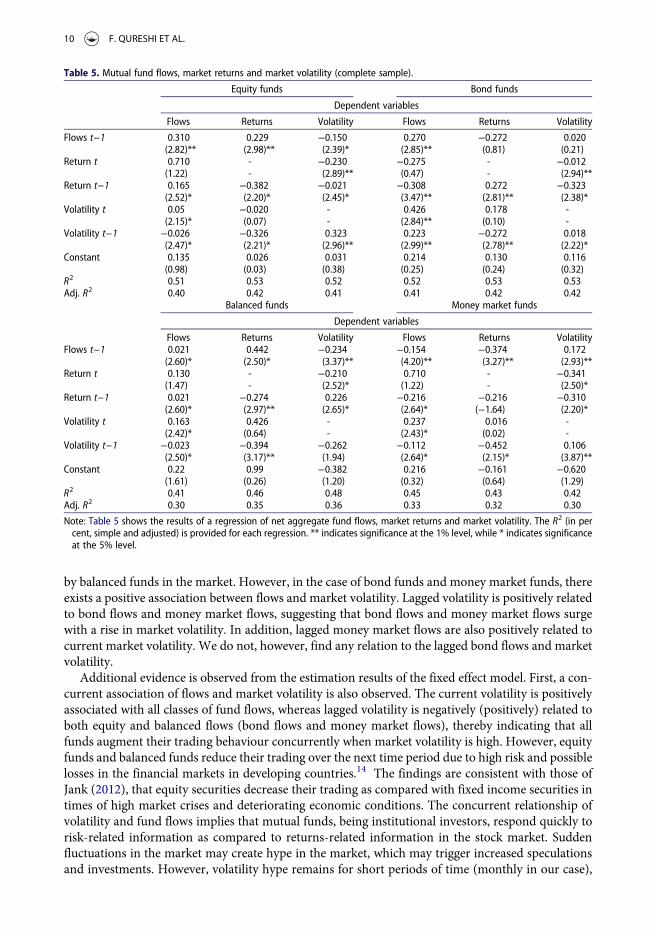
by balanced funds in the market. However, in the case of bond funds and money market funds, thereexists a positive association between flows and market volatility. Lagged volatility is positively relatedto bond flows and money market flows, suggesting that bond flows and money market flows surgewith a rise in market volatility. In addition, lagged money market flows are also positively related tocurrent market volatility. We do not, however, find any relation to the lagged bond flows and marketvolatility.
Additional evidence is observed from the estimation results of the fixed effect model. First, a con-current association of flows and market volatility is also observed. The current volatility is positivelyassociated with all classes of fund flows, whereas lagged volatility is negatively (positively) related toboth equity and balanced flows (bond flows and money market flows), thereby indicating that allfunds augment their trading behaviour concurrently when market volatility is high. However, equityfunds and balanced funds reduce their trading over the next time period due to high risk and possiblelosses in the financial markets in developing countries.14 The findings are consistent with those ofJank (2012), that equity securities decrease their trading as compared with fixed income securities intimes of high market crises and deteriorating economic conditions. The concurrent relationship ofvolatility and fund flows implies that mutual funds, being institutional investors, respond quickly torisk-related information as compared to returns-related information in the stock market. Suddenfluctuations in the market may create hype in the market, which may trigger increased speculationsand investments. However, volatility hype remains for short periods of time (monthly in our case),
Table 5. Mutual fund flows, market returns and market volatility (complete sample).
Equity funds Bond funds
Dependent variables
Flows Returns Volatility Flows Returns Volatility
Flows t−1 0.310 0.229 −0.150 0.270 −0.272 0.020(2.82)** (2.98)** (2.39)* (2.85)** (0.81) (0.21)
Return t 0.710 - −0.230 −0.275 - −0.012(1.22) - (2.89)** (0.47) - (2.94)**
Return t−1 0.165 −0.382 −0.021 −0.308 0.272 −0.323(2.52)* (2.20)* (2.45)* (3.47)** (2.81)** (2.38)*
Volatility t 0.05 −0.020 - 0.426 0.178 -(2.15)* (0.07) - (2.84)** (0.10) -
Volatility t−1 −0.026 −0.326 0.323 0.223 −0.272 0.018(2.47)* (2.21)* (2.96)** (2.99)** (2.78)** (2.22)*
Constant 0.135 0.026 0.031 0.214 0.130 0.116(0.98) (0.03) (0.38) (0.25) (0.24) (0.32)
R2 0.51 0.53 0.52 0.52 0.53 0.53Adj. R2 0.40 0.42 0.41 0.41 0.42 0.42
Balanced funds Money market funds
Dependent variables
Flows Returns Volatility Flows Returns VolatilityFlows t−1 0.021 0.442 −0.234 −0.154 −0.374 0.172
(2.60)* (2.50)* (3.37)** (4.20)** (3.27)** (2.93)**Return t 0.130 - −0.210 0.710 - −0.341
(1.47) - (2.52)* (1.22) - (2.50)*Return t−1 0.021 −0.274 0.226 −0.216 −0.216 −0.310
(2.60)* (2.97)** (2.65)* (2.64)* (−1.64) (2.20)*Volatility t 0.163 0.426 - 0.237 0.016 -
(2.42)* (0.64) - (2.43)* (0.02) -Volatility t−1 −0.023 −0.394 −0.262 −0.112 −0.452 0.106
(2.50)* (3.17)** (1.94) (2.64)* (2.15)* (3.87)**Constant 0.22 0.99 −0.382 0.216 −0.161 −0.620
(1.61) (0.26) (1.20) (0.32) (0.64) (1.29)R2 0.41 0.46 0.48 0.45 0.43 0.42Adj. R2 0.30 0.35 0.36 0.33 0.32 0.30
Note: Table 5 shows the results of a regression of net aggregate fund flows, market returns and market volatility. The R2 (in percent, simple and adjusted) is provided for each regression. ** indicates significance at the 1% level, while * indicates significanceat the 5% level.
10 F. QURESHI ET AL.

and fund classes – according to their investment objectives – adjust their investment strategies to thevery next period.15 This is true in the case of ASEAN financial markets as highly risky emerging mar-kets which prompt investors to respond swiftly to the risk-related information.
Second, by looking at the results of Table 5, we conclude that the estimation results of the bivariatemodel still hold. Thus, the flow-return relationship is not driven by the flow-volatility relationshipand vice versa. Third, we observe a negative causal relationship between market returns and marketvolatility, indicating that higher returns lead to lower volatility and vice versa. Overall, the fixed effectmodel does validate our panel VAR model. From Table 5, we do not observe any noticeable differ-ence in the sign of the estimated coefficients and their respective t-values, when comparing the panelVAR results (Table 4). Overall, we find that equity and balanced flows are positively (negatively)associated with the lagged market returns (lagged market volatility), while concurrent bond andmoney market flows are negatively (positively) associated with the lagged market returns (laggedmarket volatility). The results confirm that fund flows and market variables exert their effect oneach other. The findings corroborate those of Cao et al. (2008), Ben-Rephael et al. (2011) and Aydo-gan et al. (2014) who find evidence for both temporary price-pressure and feedback tradinghypotheses.
Dealing with a biased sampleThe sample data for fund flows is dominated by the Singapore figures, comprising approximately44%; therefore, to avoid biased estimates, we also run the analysis without the Singapore figures.
Table 6. Mutual fund flows, market returns and market volatility (sample without Singapore).
Equity funds Bond funds
Dependent Variables
Flows Returns Volatility Flows Returns Volatility
Flows t−1 0.220 0.125 −0.120 0.265 −0.172 0.019(2.73)** (2.82)** (2.28)* (2.65)* (0.51) (0.19)
Return t 0.620 - −0.200 −0.234 - −0.011(1.23) - (2.81)** (0.45) - (2.84)**
Return t−1 0.115 −0.281 −0.011 −0.218 0.142 −0.123(2.40)* (2.10)* (2.23)* (3.17)** (2.79)** (2.18)*
Volatility t 0.03 −0.019 - 0.236 0.138 -(2.02)* (0.06) - (2.81)** (0.09) -
Volatility t−1 −0.016 −0.306 0.221 0.113 −0.122 0.013(2.23)* (2.14)* (2.86)** (2.91)** (2.88)** (2.12)*
Constant 0.101 0.021 0.021 0.114 0.120 0.101(0.88) (0.02) (0.28) (0.21) (0.14) (0.22)
R2 0.41 0.42 0.44 0.46 0.56 0.43Adj. R2 0.30 0.32 0.33 0.34 0.43 0.32
Balanced funds Money market funds
Flows Returns Volatility Flows Returns VolatilityFlows t−1 0.011 0.341 −0.222 −0.150 −0.244 0.164
(2.50)* (2.48)* (3.27)** (3.23)** (3.12)** (2.13)**Return t 0.120 - −0.207 0.620 - −0.214
(1.23) - (2.42)* (1.23) - (2.42)*Return t−1 0.020 −0.261 0.224 −0.234 −0.117 −0.211
(2.59)* (2.87)** (2.53)* (2.54)* (−1.53) (2.10)*Volatility t 0.153 0.326 - 0.230 0.012 -
(2.41)* (0.54) - (2.33)* (0.01) -Volatility t−1 −0.020 −0.254 −0.253 −0.101 −0.362 0.096
(2.41)* (2.99)** (1.89) (2.54)* (2.05)* (3.37)**Constant 0.21 0.89 −0.281 0.201 −0.121 −0.540
(1.31) (0.23) (1.23) (0.22) (0.44) (1.01)R2 0.51 0.56 0.48 0.43 0.48 0.44Adj. R2 0.40 0.45 0.36 0.31 0.35 0.32
Note: Table 6 shows the results of a regression of net aggregate fund flows, market returns and market volatility. The R2 (in percent, simple and adjusted) is provided for each regression. ** indicates significance at the 1% level, while * indicates significanceat the 5% level.
INVESTMENT ANALYSTS JOURNAL 11
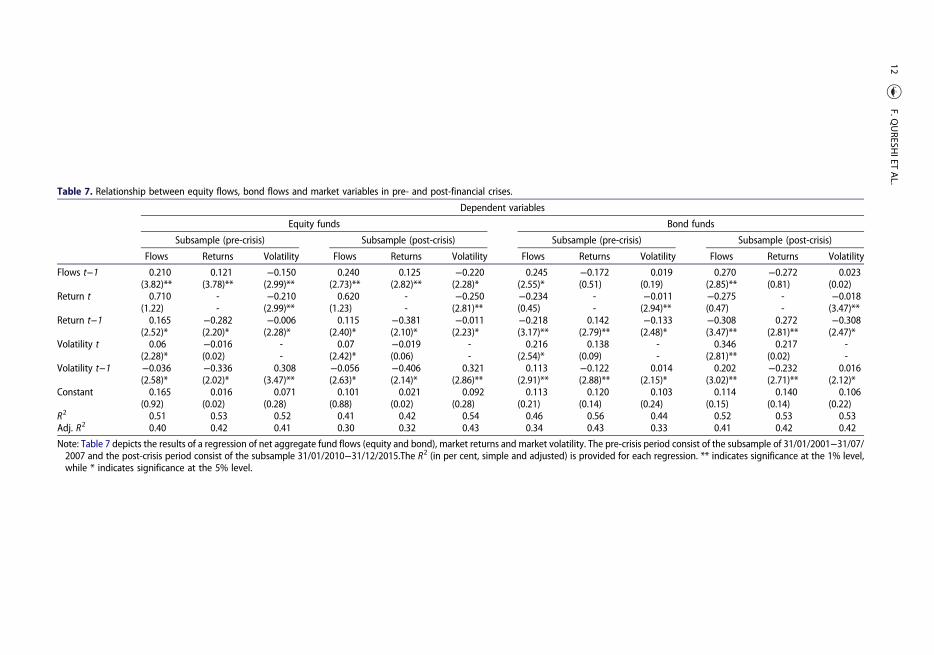
Table 7. Relationship between equity flows, bond flows and market variables in pre- and post-financial crises.
Dependent variables
Equity funds Bond funds
Subsample (pre-crisis) Subsample (post-crisis) Subsample (pre-crisis) Subsample (post-crisis)
Flows Returns Volatility Flows Returns Volatility Flows Returns Volatility Flows Returns Volatility
Flows t−1 0.210 0.121 −0.150 0.240 0.125 −0.220 0.245 −0.172 0.019 0.270 −0.272 0.023(3.82)** (3.78)** (2.99)** (2.73)** (2.82)** (2.28)* (2.55)* (0.51) (0.19) (2.85)** (0.81) (0.02)
Return t 0.710 - −0.210 0.620 - −0.250 −0.234 - −0.011 −0.275 - −0.018(1.22) - (2.99)** (1.23) - (2.81)** (0.45) - (2.94)** (0.47) - (3.47)**
Return t−1 0.165 −0.282 −0.006 0.115 −0.381 −0.011 −0.218 0.142 −0.133 −0.308 0.272 −0.308(2.52)* (2.20)* (2.28)* (2.40)* (2.10)* (2.23)* (3.17)** (2.79)** (2.48)* (3.47)** (2.81)** (2.47)*
Volatility t 0.06 −0.016 - 0.07 −0.019 - 0.216 0.138 - 0.346 0.217 -(2.28)* (0.02) - (2.42)* (0.06) - (2.54)* (0.09) - (2.81)** (0.02) -
Volatility t−1 −0.036 −0.336 0.308 −0.056 −0.406 0.321 0.113 −0.122 0.014 0.202 −0.232 0.016(2.58)* (2.02)* (3.47)** (2.63)* (2.14)* (2.86)** (2.91)** (2.88)** (2.15)* (3.02)** (2.71)** (2.12)*
Constant 0.165 0.016 0.071 0.101 0.021 0.092 0.113 0.120 0.103 0.114 0.140 0.106(0.92) (0.02) (0.28) (0.88) (0.02) (0.28) (0.21) (0.14) (0.24) (0.15) (0.14) (0.22)
R2 0.51 0.53 0.52 0.41 0.42 0.54 0.46 0.56 0.44 0.52 0.53 0.53Adj. R2 0.40 0.42 0.41 0.30 0.32 0.43 0.34 0.43 0.33 0.41 0.42 0.42
Note: Table 7 depicts the results of a regression of net aggregate fund flows (equity and bond), market returns and market volatility. The pre-crisis period consist of the subsample of 31/01/2001−31/07/2007 and the post-crisis period consist of the subsample 31/01/2010−31/12/2015.The R2 (in per cent, simple and adjusted) is provided for each regression. ** indicates significance at the 1% level,while * indicates significance at the 5% level.
12F.Q
URESH
IETAL.
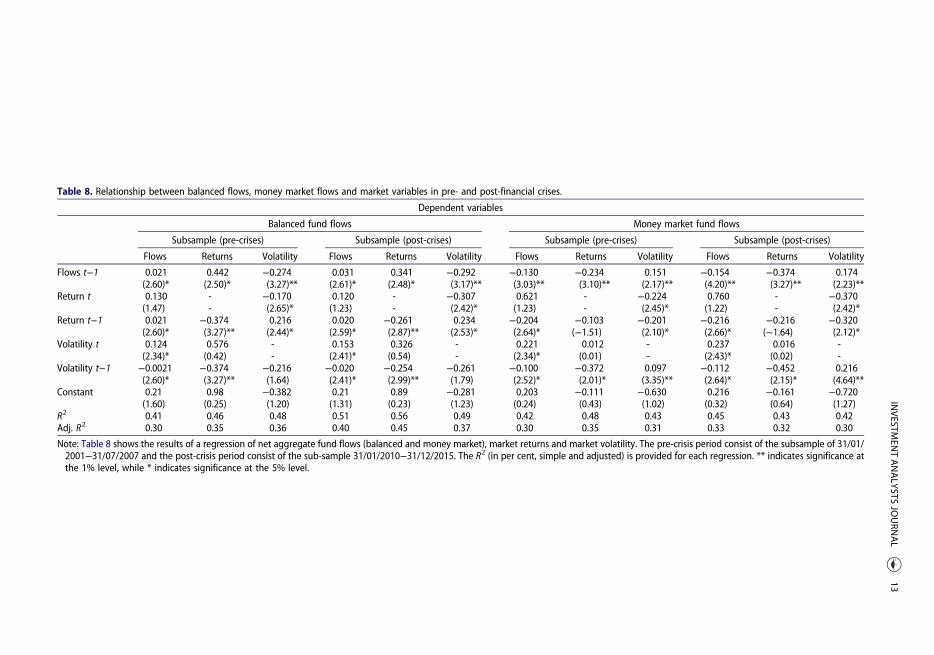
Table 8. Relationship between balanced flows, money market flows and market variables in pre- and post-financial crises.
Dependent variables
Balanced fund flows Money market fund flows
Subsample (pre-crises) Subsample (post-crises) Subsample (pre-crises) Subsample (post-crises)
Flows Returns Volatility Flows Returns Volatility Flows Returns Volatility Flows Returns Volatility
Flows t−1 0.021 0.442 −0.274 0.031 0.341 −0.292 −0.130 −0.234 0.151 −0.154 −0.374 0.174(2.60)* (2.50)* (3.27)** (2.61)* (2.48)* (3.17)** (3.03)** (3.10)** (2.17)** (4.20)** (3.27)** (2.23)**
Return t 0.130 - −0.170 0.120 - −0.307 0.621 - −0.224 0.760 - −0.370(1.47) - (2.65)* (1.23) - (2.42)* (1.23) - (2.45)* (1.22) - (2.42)*
Return t−1 0.021 −0.374 0.216 0.020 −0.261 0.234 −0.204 −0.103 −0.201 −0.216 −0.216 −0.320(2.60)* (3.27)** (2.44)* (2.59)* (2.87)** (2.53)* (2.64)* (−1.51) (2.10)* (2.66)* (−1.64) (2.12)*
Volatility t 0.124 0.576 - 0.153 0.326 - 0.221 0.012 - 0.237 0.016 -(2.34)* (0.42) - (2.41)* (0.54) - (2.34)* (0.01) - (2.43)* (0.02) -
Volatility t−1 −0.0021 −0.374 −0.216 −0.020 −0.254 −0.261 −0.100 −0.372 0.097 −0.112 −0.452 0.216(2.60)* (3.27)** (1.64) (2.41)* (2.99)** (1.79) (2.52)* (2.01)* (3.35)** (2.64)* (2.15)* (4.64)**
Constant 0.21 0.98 −0.382 0.21 0.89 −0.281 0.203 −0.111 −0.630 0.216 −0.161 −0.720(1.60) (0.25) (1.20) (1.31) (0.23) (1.23) (0.24) (0.43) (1.02) (0.32) (0.64) (1.27)
R2 0.41 0.46 0.48 0.51 0.56 0.49 0.42 0.48 0.43 0.45 0.43 0.42Adj. R2 0.30 0.35 0.36 0.40 0.45 0.37 0.30 0.35 0.31 0.33 0.32 0.30
Note: Table 8 shows the results of a regression of net aggregate fund flows (balanced and money market), market returns and market volatility. The pre-crisis period consist of the subsample of 31/01/2001−31/07/2007 and the post-crisis period consist of the sub-sample 31/01/2010−31/12/2015. The R2 (in per cent, simple and adjusted) is provided for each regression. ** indicates significance atthe 1% level, while * indicates significance at the 5% level.
INVESTM
ENTANALYSTS
JOURN
AL
13
The results are reported in Table 6. These results suggest that the equity and balanced mutual flowsand market returns have a positive causal relationship, whereas the bond and money market flowshave a negative association with market returns. Moreover, a similar relationship can be observedbetween fund flows and market volatility. Fund flows are positively related with contemporaneousmarket volatility. However, the relationships turn negative in the next period in the case of equityand balanced flows. These findings are in accordance with the main estimation results reported inTable 5.
Flow-return-volatility relationship and the financial crisisAlthough the instability in financial markets in pre- and post-financial crisis periods has been con-sidered in analysing the data, by introducing country and time-fixed effects, the analysis has alsobeen conducted on different sample periods: subsample January 2001−July 2007 (pre-crisis) andJanuary 2010 to December 2015 (post-crisis), as a supplementary robustness check. The pre-crisissubsample ends in the month of July 2007 because the financial crisis started showing its expliciteffects in the month of August 2007.16 The sample has been segregated into two groups, on thebasis of the analysis conducted by earlier studies (Kenourgios, Samitas, & Paltalidis, 2011; Khan,Ahmad, & Gee, 2016a; Khan, Ahmad, & Gee, 2016b). The estimation results for subsamples arereported in Table 7 and Table 8. The analysis has been performed using all classes of fund flowsand market variables. A noticeable observation for this analysis is that the coefficients of fundflows and market volatility are found to be greater in the post-financial crisis period. This indicatesthat the mutual funds and market volatility have a greater impact on each other after a global finan-cial crisis. Overall, the behaviour of all other variables across all the sample periods is similar to theresults from the main estimation. Therefore, our findings are robust across different sample periods.
Summary and conclusion
We examine the dynamic relationship between aggregate mutual fund flows and market variables,i.e. stock market returns and stock market volatility. Using data from five ASEAN countries, we esti-mate the relationship between mutual funds and market variables by applying a panel VAR model.The results of the panel VAR suggest that equity and balanced flows have a positive causal relation-ship with market returns, whereas money market flows have a negative causal association with mar-ket returns, which supports both the temporary price-pressure and feedback trading hypotheses. Wefind that bond flows and market returns have a temporal relationship such that bond flows follow thepast performance of the market, supporting the feedback trading hypothesis. Our results are consist-ent with the findings by Ben-Rephael et al. (2011).
Furthermore, empirical results reveal that there exists a nexus of causalities among all fundflows and stock market volatility, except the bond funds. The equity and balanced flows have anegative causal relationship, whereas bond and money market flows have a positive associationwith stock market volatility. Furthermore, we discover the positive concurrent relationship offlow-volatility, whereas lagged volatility is negatively (positively) related to both equity andbalanced flows (bond flows and money market flows), thus indicating that all funds augmenttheir trading behaviour simultaneously when market volatility is high. This implies that mutualfunds, being institutional investors, respond quickly to risk-related information as comparedwith returns-related information in the stock market, due to sudden hype and fluctuations. Thebond flows and money market flows are negatively (positively) linked with market returns (marketvolatility). This behaviour of mutual funds cannot be witnessed in earlier studies – see, forexample, Warther (1995), Edelen and Warner (2001), Oh and Parwada (2007) Cao et al. (2008),Rakowski and Wang (2009) and Thomas et al. (2014). The equity and balanced flows, beingrisky securities, are more reactive and rational regarding the information related to stock marketvariables compared with less risky securities like bond and money market flows. They invest morein times of high market returns and low market volatility, while less risky securities such as bond
14 F. QURESHI ET AL.
and money market funds invest in times of low market returns and high market risk. The findingcorroborates those of Jank (2012), who finds that risky securities have a stronger relationship withthe market premium than less risky securities do.
From these findings, we can conclude that all fund flows exert an influence on the market per-formance variables differently, according to their risky nature. Investors respond swiftly to therisk-related information due to high risk in emerging markets. Moreover, volatile financial marketslike ASEAN instigate the investors to invest in more secure and safer avenues like bond funds moneymarket funds or other fixed income securities in times of high market risk. Thus, investors directflows away from equity-based funds to fixed income-type funds in times of high financial marketrisk. We also find that money market mutual funds may practise herding and speculation, which,in turn, upsurge stock price fluctuations. On the other hand, investments by equity and balancedmutual funds contribute to increased market returns and dampened volatility in the ASEAN finan-cial markets due to their rational behaviour, which is unlikely to digress stock prices away from theirfundamental values. There is the possibility of market timing by mutual funds, which can be inves-tigated further by taking daily data for future research. The investment and asset allocation decisionsby mutual funds investors are beneficial to the financial market performance of ASEAN. The study isexpected to help policy makers and portfolio managers better to understand and implement theirinvestment and asset allocation decisions. The role played by other mutual fund classes in developingeconomies is an interesting avenue for future research.
Acknowledgments
We are thankful to the editors of the Investment Analysts Journal, the anonymous referees, Abdul Ghafoor, Habib Hus-sain Khan, Dr Ijaz Ur Rahman, Saba Qureshi and Penny Ann McKeon for their encouragement and insightfulcomments.
Notes
1. Studies such as Fant (1999), Warther (1995) and Ben-Rephael, Kandel, and Wohl (2012).2. Studies such as Poon and Taylor (1992), Duffee (1995), De Santis and İmrohoroğlu (1997) and Adrian and
Rosenberg (2008).3. A few studies exist on pension funds and market volatility on the macro-level; for example Thomas, Spataro,
and Mathew (2014).4. For example, Sirri and Tufano (1998), Jain and Wu (2000), Lynch and Musto (2003), and D’Arcangelis and
Rotundo (2015), among others.5. See, for example, Daigler and Wiley (1999), Kaniel, Saar, and Titman (2008) and Sias (1996).6. See, for example, Klemkosky (1977), De Long, Shleifer, Summers, and Waldmann (1990), Nofsinger and Sias
(1999) and Sias (2004).7. See Figure 1 and Figure 2. Figure 1 shows the growth trend of mutual funds in Asian economies. Figure 2 shows
the double-digit growth of mutual funds along with other regions of the world. Figure A1-5 and Figure A6-10show data of assets under management (AuM) of mutual funds relative to stock market capitalisation and bondmarket capitalisation, to better gauge the mutual fund industry growth of each country. We are grateful to ananonymous source for this valuable insight.
8. Details of total number of funds of each country are given in Table A1.9. We are most grateful to an anonymous source for suggesting the GARCH model in calculating volatility.10. Wooldridge (2001) state that GMM is feasible for estimating interesting extensions of the basic unobserved
effects model; for example, models where unobserved heterogeneity interacts with observed covariates.11. To avoid the problem of mean-differencing procedures to eliminate fixed effects, the Helmert procedure trans-
formation is used to estimate coefficients by GMM. For a detailed discussion, see Arellano and Bover (1995)and Love and Zicchino (2006).
12. Stock market index data includes the Jakarta Stock Exchange Composite Index, the FTSE Bursa Malaysia KualaLumpur Composite Index, the Philippines Stock Exchange Composite Index, the Stock Exchange of ThailandIndex and the Strait Times Index.
13. A moderate investment approach entails a higher equity component in the mix of securities by balanced funds/hybrid funds. An opposite investment strategy is a conservative investment approach, which implies a higherfixed-income component in hybrid securities.
INVESTMENT ANALYSTS JOURNAL 15

14. Klapper et al. (2004) find that developing economies have poor information mechanisms and are found to havehigh information asymmetries. Because of this, it is possible that mutual funds may be not able to make rational,contemporaneous decisions, due to abrupt volatility in stock markets.
15. This is what we observe in Table 5, that there exists a positive concurrent association of flows and market vola-tility. However, a negative relationship is observed in the next period, in the case of equity and balanced flows.
16. We are thankful to an anonymous source for the guidance.
References
Adrian, T., & Rosenberg, J. (2008). Stock returns and volatility: Pricing the short-run and long-run components ofmarket risk. The Journal of Finance, 63(6), 2997–3030. http://dx.doi.org/10.1111/j.1540-6261.2008.01419.x
Arellano, M., & Bover, O. (1995). Another look at the instrumental variable estimation of error-components models.Journal of Econometrics, 68(1), 29–51. http://dx.doi.org/10.1016/0304-4076(94)01642-D
Aydoğan, B., Vardar, G., & Tunç, G. (2014). The interaction of mutual fund flows and stock returns: Evidence from theTurkish capital market/Yatirim fonlari ile hisse senedi piyasasinin etkilesimi: Türk sermaye piyasasindan bulgular.Ege Akademik BakisEge Academic Review, 14(2), 163–173. http://dx.doi.org/10.21121/eab.2014218048
Azman-Saini, W., Azali, M., Habibullah, M. S., & Matthews, K. (2002). Financial integration and the ASEAN-5 equitymarkets. Applied Economics, 34(18), 2283–2288. http://dx.doi.org/10.1080/00036840210139364
Bali, T. G., Brown, S. J., & Caglayan, M. O. (2014). Macroeconomic risk and hedge fund returns. Journal of FinancialEconomics, 114(1), 1–19. http://dx.doi.org/10.1016/j.jfineco.2014.06.008
Barber, B. M., & Odean, T. (2008). All that glitters: The effect of attention and news on the buying behavior of indi-vidual and institutional investors. Review of Financial Studies, 21(2), 785–818. http://dx.doi.org/10.1093/rfs/hhm079
Bekaert, G., & Harvey, C. R. (1997). Emerging equity market volatility. Journal of Financial Economics, 43(1), 29–77.http://dx.doi.org/10.1016/S0304-405X(96)00889-6
Ben-Rephael, A., Kandel, S., &Wohl, A. (2011). The price pressure of aggregate mutual fund flows. Journal of Financialand Quantitative Analysis, 46(02), 585–603. http://dx.doi.org/10.1017/S0022109010000797
Ben-Rephael, A., Kandel, S., & Wohl, A. (2012). Measuring investor sentiment with mutual fund flows. Journal ofFinancial Economics, 104(2), 363–382. http://dx.doi.org/10.1016/j.jfineco.2010.08.018
Bohl, M. T., Brzeszczyński, J., & Wilfling, B. (2009). Institutional investors and stock returns volatility: Empirical evi-dence from a natural experiment. Journal of Financial Stability, 5(2), 170–182. http://dx.doi.org/10.1016/j.jfs.2008.02.003
Brown, K. C., Harlow, W. V., & Starks, L. T. (1996). Of tournaments and temptations: An analysis of managerial incen-tives in the mutual fund industry. The Journal of Finance, 51(1), 85–110. http://dx.doi.org/10.1111/j.1540-6261.1996.tb05203.x
Cao, C., Chang, E. C., &Wang, Y. (2008). An empirical analysis of the dynamic relationship between mutual fund flowand market return volatility. Journal of Banking & Finance, 32(10), 2111–2123. http://dx.doi.org/10.1016/j.jbankfin.2007.12.035
Cohen, R. B., Gompers, P. A., & Vuolteenaho, T. (2002). Who underreacts to cash-flow news? Evidence from tradingbetween individuals and institutions. Journal of Financial Economics, 66(2-3), 409–462. http://dx.doi.org/10.1016/S0304-405X(02)00229-5
D’Arcangelis, A. M., & Rotundo, G. (2015). Mutual funds relationships and performance analysis. Quality & Quantity,49(4), 1573–1584. http://dx.doi.org/10.1007/s11135-014-0066-z
Daigler, R. T., &Wiley, M. K. (1999). The impact of trader type on the futures volatility-volume relation. The Journal ofFinance, 54(6), 2297–2316. http://dx.doi.org/10.1111/0022-1082.00189
De Long, J. B., Shleifer, A., Summers, L. H., &Waldmann, R. J. (1990). Noise trader risk in financial markets. Journal ofPolitical Economy, 98(4), 703–738. http://dx.doi.org/10.1086/261703
De Santis, G., & İmrohoroglu, S. (1997). Stock returns and volatility in emerging financial markets. Journal ofInternational Money and Finance, 16(4), 561–579. http://dx.doi.org/10.1016/S0261-5606(97)00020-X
Dennis, P. J., & Strickland, D. (2002). Who blinks in volatile markets, individuals or institutions? The Journal ofFinance, 57(5), 1923–1949. http://dx.doi.org/10.1111/0022-1082.00484
Duffee, G. R. (1995). Stock returns and volatility a firm-level analysis. Journal of Financial Economics, 37(3), 399–420.http://dx.doi.org/10.1016/0304-405X(94)00801-7
Edelen, R. M. (1999). Investor flows and the assessed performance of open-end mutual funds. Journal of FinancialEconomics, 53(3), 439–466. http://dx.doi.org/10.1016/S0304-405X(99)00028-8
Edelen, R. M., & Warner, J. B. (2001). Aggregate price effects of institutional trading: A study of mutual fund flow andmarket returns. Journal of Financial Economics, 59(2), 195–220. http://dx.doi.org/10.1016/S0304-405X(00)00085-4
Fant, L. F. (1999). Investment behavior of mutual fund shareholders: The evidence from aggregate fund flows. Journalof Financial Markets, 2(4), 391–402. http://dx.doi.org/10.1016/S1386-4181(99)00006-3
16 F. QURESHI ET AL.
Ferreira, M. A., Keswani, A., Miguel, A. F., & Ramos, S. B. (2012). The flow-performance relationship around theworld. Journal of Banking & Finance, 36(6), 1759–1780. http://dx.doi.org/10.1016/j.jbankfin.2012.01.019
Harris, L., & Gurel, E. (1986). Price and volume effects associated with changes in the S&P 500 list: New evidence forthe existence of price pressures. The Journal of Finance, 41(4), 815–829. http://dx.doi.org/10.1111/j.1540-6261.1986.tb04550.x
Hendricks, D., Patel, J., & Zeckhauser, R. (1993). Hot hands in mutual funds: Short-run persistence of relative perform-ance, 1974–1988. The Journal of Finance, 48(1), 93–130. http://dx.doi.org/10.1111/j.1540-6261.1993.tb04703.x
Jain, P. C., & Wu, J. S. (2000). Truth in mutual fund advertising: Evidence on future performance and fund flows. TheJournal of Finance, 55(2), 937–958. http://dx.doi.org/10.1111/0022-1082.00232
Jank, S. (2012). Mutual fund flows, expected returns, and the real economy. Journal of Banking & Finance, 36(11),3060–3070. http://dx.doi.org/10.1016/j.jbankfin.2012.07.004
Kaniel, R., Saar, G., & Titman, S. (2008). Individual investor trading and stock returns. The Journal of Finance, 63(1),273–310. http://dx.doi.org/10.1111/j.1540-6261.2008.01316.x
Kenourgios, D., Samitas, A., & Paltalidis, N. (2011). Financial crises and stock market contagion in a multivariate time-varying asymmetric framework. Journal of International Financial Markets, Institutions and Money, 21(1), 92–106.http://dx.doi.org/10.1016/j.intfin.2010.08.005
Khan, H. H., Ahmad, R. B., & Gee, C. S. (2016a). Market structure, financial dependence and industrial growth:Evidence from the banking industry in emerging Asian economies. PLoS One, 11(8), e0160452. http://dx.doi.org/10.1371/journal.pone.0160452
Khan, H. H., Ahmad, R. B., & Gee, C. S. (2016b). Bank competition and monetary policy transmission through thebank lending channel: Evidence from ASEAN. International Review of Economics & Finance, 44, 19–39. http://dx.doi.org/10.1016/j.iref.2016.03.003
Klapper, L., Sulla, V., & Vittas, D. (2004). The development of mutual funds around the world. Emerging MarketsReview, 5(1), 1–38. http://dx.doi.org/10.1016/j.ememar.2003.12.001
Klemkosky, R. C. (1977). The impact and efficiency of institutional net trading imbalances. The Journal of Finance, 32(1), 79–86. http://dx.doi.org/10.1111/j.1540-6261.1977.tb03243.x
Li, W., &Wang, S. S. (2010). Daily institutional trades and stock price volatility in a retail investor dominated emergingmarket. Journal of Financial Markets, 13(4), 448–474. http://dx.doi.org/10.1016/j.finmar.2010.07.003
Love, I., & Zicchino, L. (2006). Financial development and dynamic investment behavior: Evidence from panel VAR.The Quarterly Review of Economics and Finance, 46(2), 190–210. http://dx.doi.org/10.1016/j.qref.2005.11.007
Lynch, A. W., & Musto, D. K. (2003). How investors interpret past fund returns. The Journal of Finance, 58(5), 2033–2058. http://dx.doi.org/10.1111/1540-6261.00596
Nelson, D. B. (1991). Conditional heteroskedasticity in asset returns: A new approach. Econometrica, 59(2), 347–370.http://dx.doi.org/10.2307/2938260
Nofsinger, J. R., & Sias, R. W. (1999). Herding and feedback trading by institutional and individual investors. TheJournal of Finance, 54(6), 2263–2295. http://dx.doi.org/10.1111/0022-1082.00188
Oh, N. Y., & Parwada, J. T. (2007). Relations between mutual fund flows and stock market returns in Korea. Journal ofInternational Financial Markets, Institutions and Money, 17(2), 140–151. http://dx.doi.org/10.1016/j.intfin.2005.10.001
Poon, S.-H., & Taylor, S. J. (1992). Stock returns and volatility: An empirical study of the UK stock market. Journal ofBanking & Finance, 16(1), 37–59. http://dx.doi.org/10.1016/0378-4266(92)90077-D
Rakowski, D., &Wang, X. (2009). The dynamics of short-term mutual fund flows and returns: A time-series and cross-sectional investigation. Journal of Banking & Finance, 33(11), 2102–2109. http://dx.doi.org/10.1016/j.jbankfin.2009.05.001
Shleifer, A. (1986). Do demand curves for stocks slope down? The Journal of Finance, 41(3), 579–590. http://dx.doi.org/10.1111/j.1540-6261.1986.tb04518.x
Sias, R. W. (1996). Volatility and the institutional investor. Financial Analysts Journal, 52(2), 13–20. http://dx.doi.org/10.2469/faj.v52.n2.1976
Sias, R. W. (2004). Institutional herding. Review of Financial Studies, 17(1), 165–206. http://dx.doi.org/10.1093/rfs/hhg035
Sirri, E. R., & Tufano, P. (1998). Costly search and mutual fund flows. The Journal of Finance, 53(5), 1589–1622. http://dx.doi.org/10.1111/0022-1082.00066
Thomas, A., Spataro, L., & Mathew, N. (2014). Pension funds and stock market volatility: An empirical analysis ofOECD countries. Journal of Financial Stability, 11, 92–103. http://dx.doi.org/10.1016/j.jfs.2014.01.001
Verardi, V., & Dehon, C. (2010). Multivariate outlier detection in Stata. The Stata Journal, 10(2), 259–266.Warther, V. A. (1995). Aggregate mutual fund flows and security returns. Journal of Financial Economics, 39(2-3),
209–235. http://dx.doi.org/10.1016/0304-405X(95)00827-2Wermers, R. (1999). Mutual fund herding and the impact on stock prices. The Journal of Finance, 54(2), 581–622.
http://dx.doi.org/10.1111/0022-1082.00118Wooldridge, J. M. (2001). Applications of generalized method of moments estimation. The Journal of Economic
Perspectives, 15(4), 87–100. http://dx.doi.org/10.1257/jep.15.4.87
INVESTMENT ANALYSTS JOURNAL 17

Appendix
Figures A1-5. Total asset under management (AuM) relative to total stock market capitalisation of each country of ASEAN-5.Source: Total asset under management (total net assets) data is taken from Bloomberg database. Stock market capitalizationdata is taken from Thomson Reuter DataStream.
Table A1. Total number of different types of mutual funds taken under study in ASEAN-5.
Countries Equity funds Balanced funds Bond funds Money market funds Total
Indonesia 189 140 191 54 574Malaysia 315 143 124 58 640Philippines 27 19 73 13 132Singapore 963 238 418 71 1 690Thailand 369 137 241 30 777Total 1 863 677 1 047 226 3 813
18 F. QURESHI ET AL.

Figures A6-10. Total asset under management (AuM) relative to total bond market capitalisation of each country of ASEAN-5.Source: Total asset under management (total net assets) data is taken from Bloomberg database. Bond market capitalizationdata is taken from asianbondsonline.adb.org
INVESTMENT ANALYSTS JOURNAL 19