mutants, overexpressors, and interactors of arabidopsis
TRANSCRIPT

Mutants, Overexpressors, and Interactors of Arabidopsis Plastocyanin Isoforms: Revised Roles of Plastocyanin in Photosynthetic Electron Flow and Thylakoid Redox State
Paolo Pesaresia, Michael Scharfenbergb, Martin Weigelc, Irene Granlundd, Wolfgang P. Schro derd, Giovanni Finazzie, Fabrice Rappaporte, Simona Masierof, Antonella Furinig, Peter Jahnsh and Dario Leisterb,1
a Dipartimento di Produzione Vegetale, Universita degli studi di Milano c/o Parco Tecnologico Padano Via Einstein, Loc. Cascina Codazza, I-26900 Lodi, Italy b Lehrstuhl fu r Botanik, Department Biologie I, Ludwig-Maximilians-Universita t Mu nchen, Großhaderner Str. 2, D-82152 Planegg-Martinsried, Germany c Abteilung fu r Pflanzenzu chtung und Genetik, Max-Planck-Institut fu r Zu chtungsforschung, Carl-von-Linne -Weg 10, D-50829 Ko ln, Germany d Institute of Chemistry and Umea Plant Science Centre (UPSC), Umea University, SE-901 87 Umea , Sweden e Institut de Biologie Physico-Chimique, UMR 7141 CNRS-Universite P. et M. Curie, 13, rue Pierre et Marie Curie, F-75005 Paris, France f Dipartimento di Biologia, Universita degli studi di Milano, Via Celoria 26, I-20133 Milano, Italy g Dipartimento Scientifico e Tecnologico, Universita degli studi di Verona, Strade le Grazie 15, I-37134 Verona, Italy h Institut fu r Biochemie der Pflanzen, Heinrich-Heine-Universita t Du sseldorf, Universita tsstr. 1, D-40225 Du sseldorf, Germany
ABSTRACT Two homologous plastocyanin isoforms are encoded by the genes PETE1 and PETE2 in the nuclear genome of Arabidopsis thaliana. The PETE2 transcript is expressed at considerably higher levels and the PETE2 protein is the more abundant isoform. Null mutations in the PETE genes resulted in plants, designated pete1 and pete2, with decreased plas- tocyanin contents. However, despite reducing plastocyanin levels by over ;90%, a pete2 null mutation on its own affects rates of photosynthesis and growth only slightly, whereas pete1 knockout plants, with about 60–80% of the wild-type plastocyanin level, did not show any alteration. Hence, plastocyanin concentration is not limiting for photosynthetic elec- tron flow under optimal growth conditions, perhaps implying other possible physiological roles for the protein. Indeed, plastocyanin has been proposed previously to cooperate with cytochrome c6A (Cyt c6A) in thylakoid redox reactions, but we find no evidence for a physical interaction between the two proteins, using interaction assays in yeast. We observed homodimerization of Cyt c6A in yeast interaction assays, but also Cyt c6A homodimers failed to interact with plastocyanin. Moreover, phenotypic analysis of atc6-1 pete1 and atc6-1 pete2 double mutants, each lacking Cyt c6A and one of the two plastocyanin-encoding genes, failed to reveal any genetic interaction. Overexpression of either PETE1 or PETE2 in the pete1 pete2 double knockout mutant background results in essentially wild-type photosynthetic performance, excluding the possibility that the two plastocyanin isoforms could have distinct functions in thylakoid electron flow.
INTRODUCTION
Plastocyanin is a soluble copper-binding protein located in the thylakoid lumen and serves as an electron carrier from cyto- chrome f (Cyt f) in the cytochrome b6/f complex (Cyt b6/f) to P700
+ in photosystem I (PSI) (Katoh, 1960; Gorman and Levine, 1965; for a review, see Redinbo et al., 1994). Plastocyanin levels
et al., 2004). Moreover, intra-specific variation in photosyn- thetic electron transport is linked to differences in plastocya- nin content in tall fescue (Krueger et al., 1984), barley (Burkey, 1994), and soybean (Burkey et al., 1996).
Recently, the strict association of photosynthetic perfor- mance and plastocyanin content has been challenged by
depend on various conditions, and a close correlation between plastocyanin contents and photosynthetic electron transport activity has been reported. For instance, in barley, the size of the plastocyanin pool correlates with photosynthetic elec- tron transport activity (Burkey, 1993), and, in tobacco, the pho- tosynthetic electron flux is sensitive to variations in the amount of plastocyanin relative to PSI and Cyt b6/f (Scho ttler

mutant analyses in Arabidopsis thaliana. In the paa1 and paa2 mutants, affected in Cu transport over plastid envelope and thylakoid membranes, respectively (Shikanai et al., 2003; Abdel-Ghany et al., 2005), even drastic reductions in plastocy- anin contents resulted in only mild alterations in thylakoid electron flow. Moreover, A. thaliana RNA interference (RNAi) lines without detectable plastocyanin levels still reached a plant height of 50% with respect to wild-type (WT) plants (Gupta et al., 2002). This implies that even relatively low amounts of plastocyanin are capable of supporting efficient electron transport rates under optimal growth conditions.
Besides its role as an inter-systemic electron carrier, addi- tional functions for plastocyanin have been proposed recently. Thus, plastocyanin and Cyt c6A, a Cyt c6-like protein (Gupta et al., 2002; Wastl et al., 2002), might cooperate within the thy- lakoid lumen in the redox-dependent modulation of lumenal protein activities (Schlarb-Ridley et al., 2006). In detail, Cyt c6A
could donate electrons derived from the formation of disul- phide bridges in thylakoid lumen proteins to plastocyanin, whereas in the absence of Cyt c6A, the target protein(s) might be oxidized directly by plastocyanin. In contrast to the stromal ferredoxin–thioredoxin system, this hypothetical mechanism would activate thylakoid proteins upon illumination by oxida- tion rather than by reduction (Buchanan and Luan, 2005). Con- sistent with this model, rapid electron transfer between Cyt c6A
and plastocyanin has been observed in vitro (Marcaida et al., 2006). A major role in copper (Cu) homeostasis has also been proposed for plastocyanin (Ma rschner, 2002; Puig et al., 2007).
Several angiosperms, including A. thaliana (Kieselbach et al., 2000), poplar (Shosheva et al., 2005), parsley (Dimitrov et al., 1990), tobacco (Dimitrov et al., 1993), rice (Yu et al., 2005), and the moss Physcomitrella patens (Rensing et al., 2008), ex- press two plastocyanin isoforms. This feature seems to be the result of a relatively recent evolutionary event, characteristic of land plants, because only one plastocyanin isoform has been detected in cyanobacteria and algae, such as Synechocystis and Chlamydomonas (Merchant and Bogorad, 1987; Briggs et al., 1990). In vitro, the two poplar plastocyanin isoforms have different electrostatic properties, melting temperatures, and unfolding enthalpies (Shosheva et al., 2004, 2005), but it is not clear whether these differences are functionally relevant in planta.
In this work, we have investigated to which degree plasto- cyanin amounts can limit the photosynthetic electron flow in A. thaliana and whether the two plastocyanin isoforms exhibit functional differences by employing knockout and overex- pressing lines for each isoform. The data clearly indicate that the two Arabidopsis plastocyanins have redundant functions in photosynthetic electron transport, and accumulate in thyla- koids to levels higher than those necessary to support efficient photosynthetic electron flow. Additional experiments imply that plastocyanin does not interact with Cyt c6A, either func- tionally or physically. However, reduced plastocyanin levels drastically increase the susceptibility of plants to Cu stress, im- plying that the protein does play a major role as a Cu sink.
RESULTS Sequence Analysis of PETE1 and PETE2
In A. thaliana, plastocyanin is encoded by two genes—PETE1 (At1g76100) and PETE2 (At1g20340)—which show 73% iden- tity at the DNA level (Weigel et al., 2003). Both genes are lo- cated on chromosome 1, and inspection of the level of synteny between the chromosomal regions surrounding the two genes indicated that PETE1 and PETE2 result from a relatively recent segmental duplication in the Arabidopsis lineage (Blanc et al., 2003; http://wolfe.gen.tcd.ie/athal/dup).
PETE1 and PETE2 code for homologous proteins, which share 82/92% identity/similarity. After cleavage of the bipar- tite transit peptides, the mature proteins differ in 18 of 99 amino acid residues, with more than half of the substitutions being conservative replacements (Figure 1). They also show high degrees of identity/similarity with plastocyanins from other flowering plants, moss, algae, and cyanobacteria. In par- ticular, the hydrophobic surface formed by residues G10, L12, G34, F35, and A90, which is important for interactions with re- dox partners (Haehnel et al., 1994; Olesen et al., 1999), is highly conserved in plant and algal plastocyanins and partially also in cyanobacteria (see circles in Figure 1). Residues Y83 and H87 are involved in the two possible routes for electron transfer (Taneva et al., 2000), and are also strictly conserved in all plas- tocyanin protein sequences displayed in Figure 1 (see + sym- bols). Moreover, the acidic patch formed by residues 42–44 (see asterisks in Figure 1), thought to be involved in the reac- tion with PSI (Haehnel et al., 1994; Olesen et al., 1999), is al- most totally maintained in flowering plants, moss, algae, and bacteria. Clearly, their high degree of homology, espe- cially in the domains involved in interactions and electron transfer between Cyt b6/f and PSI, points to conserved func- tions for both plastocyanin isoforms in A. thaliana.
A Large Excess of Plastocyanin is Present in the Thylakoid Lumen of Arabidopsis Plants
To investigate whether the plastocyanin pool size plays a critical role in regulating thylakoid electron flow, En-transposon inser- tion mutants were isolated for both plastocyanin-encoding genes (Weigel et al., 2003). Quantitative reverse-transcription PCR (QRT–PCR), designed to discriminate between PETE1 and PETE2 transcripts, indicated that PETE2 mRNA was 10 times more abundant than PETE1 transcripts in WT leaves (Figure 2). In the pete1-1 (pete1::En1) mutant, PETE1 transcript accumula- tion was completely suppressed, while in pete2-1 (pete2::En1), residual amounts of PETE2 transcript were present, most prob- ably due to somatic En-transposon excision events. However, no change in the expression of the remaining functional plas- tocyanin-encoding gene was detected in either of the single mutants.
Stable pete1-1.1 (abbreviated in the following as pete1) and pete2-1.1 (abbreviated as pete2) null alleles, bearing frame- shift mutations, were obtained after germline transposon ex- cision (Weigel et al., 2003), and analyzed for their growth rate,

Figure 1. Comparison of Mature Plastocyanin Sequences from Flowering Plants, Moss, Algae, and Cyanobacteria. The amino acid sequence of the Arabidopsis PETE1 protein (At1g76100) was compared with the PETE2 sequence (At1g20340) and with other plastocyanin sequences from Populus nigra (gi:494451; gi:225877), Petroselinum crispum (gi:640354; gi:640355), Nicotiana tabacum (gi:544647; gi:544646), Oryza sativa (gi:3885896; gi:125595738), Physcomitrella patens (gi:162691402; gi:162696737), Chlamydomonas rein- hardtii (gi:167430), Ostreococcus lucimarinus (gi:144579889), and Synechocystis sp. PCC 6803 (gi:2781074). Black boxes indicate strictly con- served amino acids, and grey boxes closely related ones. The characteristic hydrophobic patch, essential for the interactions with redox partners (see circles), is indicated according to Olesen et al. (1999). The tyrosine and histidine residues (see ‘+’ symbol), involved in electron transfer are indicated according to Taneva et al. (2000). The asterisks refer to the acidic patch (Olesen et al., 1999).
photosynthetic performances, and plastocyanin content. Whereas pete1 mutants developed similarly to WT, pete2 lines exhibited a decrease in growth by about 30% (Figure 3). The effective quantum yield of PSII (UII), measured under an actinic light intensity of 80 lmol m-2 s-1, was altered slightly in the pete2 mutant, while no impairment could be observed in pete1 leaves (WT: 0.76 6 0.01; pete1: 0.75 6 0.01; pete2: 0.67 6 0.01). A similar behavior could be observed for the rate of electron transport (ETR) measured under different actinic light intensities (Table 1). Western analyses showed minor reductions (10–30%) in the abundance of the major thylakoid multiprotein complexes only in pete2 (Figure 4 and Table 2), implying no major alterations in photosynthetic electron flow.
Because the abundance of the thylakoid multiprotein com- plexes is only weakly affected in pete2 (see Figure 4 and Table 2), the impairment in linear electron transport might result from an alteration in the rate of plastocyanin-mediated elec- tron transport between Cyt b6/f and PSI. To investigate this as- pect further, the absorption changes associated with P700
+
reduction and Cyt f oxidation following a single turnover flash were analyzed in dark-adapted leaves from the two single
Figure 2. Plastocyanin Expression Analyses. Detection of PETE transcripts in light-adapted transposon insertion mutants (pete1-1 and pete2-1) and WT plants. The analysis on 4.5% PA gels was performed with 33P-labeled products of quantitative reverse transcriptase–PCR (QRT–PCR) obtained from leaves after PCR for 25 cycles with PETE-specific primers. Primers specific for the ACTIN1 gene were used in the same PCR reaction to check for equal loading (data not shown). The assay was confirmed to be quantitative by testing dilution series for each sample (data not shown). mutants (Figure 5). Under these conditions, the rate of Cyt f oxidation and P700
+ reduction is strictly proportional to the ef- ficiency of plastocyanin-mediated electron transfer between the two complexes and independent of the relative absorption

cross-section of PSI and of the redox state of the intersystem electron flow (Finazzi et al., 2005). The pete1 and WT plants were characterized by a fast unresolved phase accounting for about 60% of the absorption decay, followed by a slow phase developing over hundreds of ls, but the pete2 mutant displayed a distinct delay in P700
+ reduction (t1/2: ;1 ms) (Figure 5A). The picture observed for Cyt f oxidation (Figure 5B) was consistent with the kinetic data for P700
+ reduc- tion: in WT, the kinetic profile of Cyt f oxidation consists of a fast phase (t1/2: ;100 ls) with an amplitude that accounts for 75% of the absorption decay, and a slow phase with a half-time decay of about 1 ms and an amplitude of 25%, as previously described (Joliot and Joliot, 2002). However, the amplitude of the slow phase was slightly increased (be-
Figure 3. Growth Phenotypes of Mutant (pete1 and pete2), Over- expressor (35S::PETE1 and 35S::PETE2) and WT Plants. (A) Four-week-old plants propagated in growth chamber. (B) Total leaf area measured at different times (in days) after ger- mination. Average values for 50 plants of each genotype are reported. Bars indicate standard deviations.
tween 25 and 45%) in pete1, and became dominant (between 85 and 95%) in pete2. Since the fast (,100 ls) reduction of P700
+ is commonly interpreted as reflecting rapid electron transfer between pre-bound plastocyanin and P700
+ (Farah et al., 1995), the marked slowdown in P700
+ reduction observed in the pete2 mutant may simply result from the absence of pre-bound plastocyanin in this genotype, rather than from significant differences between the intrinsic rate constants of electron transfer from PETE2 or PETE1 to P700
+. In agreement with this, oxidation of Cyt f was also slowed significantly, as in C. reinhardtii mutants lacking the F subunit of PSI, which is involved in the docking of plastocyanin to its oxidation site (Farah et al., 1995). In addition, as will be discussed below, these kinetic-altered phenotypes were reverted to WT when the relative abundances of PETE2 or PETE1 were increased by overexpression.
In order to correlate the characteristics of photosynthetic electron flow of pete1 and pete2 mutant plants with their plas- tocyanin pool sizes and composition, thylakoid lumen samples isolated from WT and mutant leaves were fractionated by iso- electric focusing (IEF) followed by SDS polyacrylamide (2D- PAGE), and quantified by the difference gel electrophoresis (DIGE) technique (Figure 6A and 6B; Supplemental Figure 1). N-terminal sequencing and MALDI–TOF analysis allowed to as- sign four major spots to the two WT plastocyanin isoforms, with isoelectric points around pH 3 and molecular weights ranging between 15 and 10 kDa. Spots 1, 2, and 4 corre- sponded to PETE2 and spot 3 to PETE1 (Figure 6A). As expected, in pete2, the PETE1 isoform was the major form present and, in pete1, the PETE2 isoform predominated. No post-translational modifications of PETE1 and PETE2 could be detected by MALDI–TOF analysis and the molecular weights of the different spots do not support the presence of multiple plas- tocyanin aggregates.
Quantification of the plastocyanin spots revealed that, in WT leaves, the relative level of the two plastocyanin isoforms was similar to the PETE1/PETE2 RNA ratio, indicating that a good correlation between transcript and protein amounts exists (Figure 6B). As a matter of fact, in pete2 thylakoids, the plastocyanin content was reduced to 6% of WT level, whereas, in pete1, a reduction of 20–45% was observed. The plastocyanin-to-PSI ratio can also be estimated in vivo by measuring the absorption changes associated with the
Table 1. Light-Dependent Electron Transport Rate (ETR) in Leaves of WT, Mutants (pete1 and pete2), and Overexpressors (35S::PETE1 and 35S::PETE2).
PPFD (lmol m-2 s-1) WT pete1 pete2 35S::PETE1 35S::PETE2 60 19.40 6 0.09 19.15 6 0.13 17.89 6 0.05 19.53 6 0.08 19.68 6 0.11 150 37.82 6 0.11 36.54 6 0.08 33.39 6 0.08 38.43 6 0.06 37.8 6 0.05 300 54.18 6 0.09 54.18 6 0.12 41.58 6 0.07 54.18 6 0.09 55.44 6 0.06 600 70.56 6 0.13 68.65 6 0.18 55.44 6 0.17 70.56 6 0.19 73.08 6 0.23
PPFD, photosynthetic photon flux density; ETR unit: lmol m-2 s-1.

Figure 4. Protein Composition of Thylakoid Membranes. Thylakoid proteins obtained from identical amounts (fresh weight) of light-adapted WT, mutant (pete1 and pete2), and overexpressor (35S::PETE1 and 35S::PETE2) leaves were fractionated by SDS–PAGE. Decreasing levels of WT thylakoid proteins were loaded in the lanes marked 0.75xWT, 0.5xWT, and 0.25xWT and filters were probed with antibodies specific for the proteins indicated on the left. The results shown are representative of those obtained in three in- dependent experiments.
oxidation of plastocyanin and P700+ (Seigneurin-Berny et al.,
2006). This approach revealed an overall trend for the differ- ent genotypes that was very similar to the one found by 2D- PAGE: a significant decrease in plastocyanin content in pete2 (to 15% of WT levels) and slight decrease in pete1 (80% of WT).
Taking this analysis and the phenotypic characterization of plastocyanin mutants together, the data imply that even dras- tic reductions of the plastocyanin pool size—although altering the electron flow between Cyt b6/f and PSI, as seen in pete2
Table 2. Amounts of Representative Thylakoid Proteins in Light-Adapted Plastocyanin Mutants (pete1 and pete2) and Overexpressors (35S::PETE1 and 35S::PETE2).
Protein pete1 pete2 35S::PETE1 35S::PETE2 Lhca1 100 92 100 100 Lhca2 100 69 100 100 Lhca3 100 86 94 100 Lhcb1 100 73 100 97 Lhcb2 100 88 93 100 Lhcb5 89 73 94 100 PSI-C 100 71 100 100 PSI-E 100 69 100 100 PSI-G 100 81 100 100 PSI-K 100 71 100 100 PSII-D1 100 95 100 100 Cyt b6 100 100 100 100 Cyt f 100 96 100 100 ATPase (a+b) 100 61 72 100
Average values were derived from three independent Western analyses (as in Figure 4). Values are expressed as percentages of WT protein levels. Standard deviations were less than 5%. plants—limit photosynthetic performance and growth only marginally under optimal growth conditions. In agreement with that, pete1 plants with about 60–80% of WT plastocyanin levels showed a WT-like phenotype, indicating that a large excess of plastocyanin is present in the thylakoid lumen of Arabidopsis. Plastocyanin Isoforms Play a Redundant Role in Thylakoid Electron Transport
The great similarity in sequence between the two mature plastocyanin proteins suggests that PETE1 and PETE2 have re- dundant functions. To investigate this aspect further, lines expressing comparable levels of either PETE1 or PETE2 RNA, in the absence of the other transcript, were obtained by intro- ducing into the pete1 pete2 double mutant background (Weigel et al., 2003) a PETE1 or PETE2 gene under the transcrip- tional control of the 35S promoter of Cauliflower Mosaic Virus. N-terminal sequencing and MALDI–TOF analysis, together with the quantification of plastocyanin spots, indeed, con- firmed that the two overexpressors contained similar amounts of only one plastocyanin isoform each, both slightly higher than WT levels (Figure 6A and 6B). Similar results were also obtained when the plastocyanin-to-PSI ratio was estimated in vivo (see above), revealing an almost WT or somewhat larger amount of plastocyanin in the two overexpressors (95 and 137% of WT in 35S::PETE2 and 35S::PETE1, respectively). The increased dosage of either PETE1 (35S::PETE1) or PETE2 (35S::PETE2) in pete1 pete2 resulted in the production of WT-like plants. The effects of pete1 pete2 on thylakoid protein accumulation (Figure 4 and Table 2), leaf coloration (Figure 3A), and pigment content (data not shown) were fully

Figure 5. Measurements of Linear Electron Flow in Plastocyanin Mutant (pete1 and pete2), Overexpressor (35S::PETE1 and 35S::PETE2), and WT Leaves. Six independent experiments on different biological samples were performed, and representative results are shown.
+ (A) The reduction kinetics of P700 following a single turnover actinic flash. A laser flash of 5 ns duration was applied at t = 0 and the
+ absorption changes associated with the reduction of the photo-oxidized P700 were followed. Data were normalized to the pete2 maximum value. WT, pete1, and overexpressor lines were characterized by an unresolved fast-phase (,100 ls) accounting for about 60% of the ab- sorption decay and a slow phase developing over 5 ms. The pete2 mutant was characterized by a prominent slow phase with a half-life of 1 ms. (B) Kinetics of Cyt f oxidation following a single turnover actinic flash. A laser flash of 5 ns duration was applied at t = 0 and the absorption changes associated with the oxidation of Cyt f monitored at 554 nm. In WT and overexpressor lines, the half-life of the fast-phase was about 100 ls, accounting for 75% of the absorption decay. The slow-phase (25%) had a half-life of about 1 ms. In pete1 and pete2, the amplitude of the slow-phase was increased by between 25 and 45%, and between 85 and 95%, respectively. Standard deviations were below 5% for the WT, pete2, and overexpressor lines. The standard deviation of the amplitude of the slow phase was larger in the pete1 mutant; its relative amplitude varied between 25 and 45%.
reversed in the PETE1 and PETE2 overexpressors. Interestingly, the 35S::PETE2 and, to a lesser extent, the 35S::PETE1 plants showed an increase in size, as indicated by measurements of leaf area (Figure 3A and 3B) and rosette dry-weights (data not shown); this effect became particularly evident after the first 3 weeks of growth. Measurements of photosynthetic elec- tron flow were also carried out on the overexpressor lines. The UII parameter at 80 lmol m-2 s-1 of actinic light was identical among the different genotypes (WT: 0.76 6 0.01; 35S::PETE1: 0.76 6 0.01; 35S::PETE2: 0.77 6 0.02). Identical rates of linear electron transport were also observed (Table 1). Additionally, as mentioned above, both 35S::PETE1 and 35S::PETE2 overex- pressors showed a WT-like behavior with respect to P700
+ re- duction and Cyt f oxidation rates (Figure 5), indicating that the decreased rate of P700
+ reduction and Cyt f oxidation stems from the reduced plastocyanin content, namely diminished fraction of PSI with pre-bound plastocyanin.
Taking these analyses together, the data imply that the two plastocyanin isoforms are functionally equivalent, as predict- able from the high sequence homology.
Plastocyanin and Cyt c6A have Distinct Roles in the Thylakoid Lumen
The limited change in photosynthetic performance seen in pete2 plants suggests that plastocyanin is normally present in large excess relative to the requirements for efficient elec-
we considered the possibility that the excess plastocyanin accepts electrons from Cyt c6A. Because the physical interaction of the two proteins is a prerequisite for electron transfer from Cyt c6A to plastocyanin, we used yeast two-hybrid experiments to test whether Cyt c6A and plastocyanin can interact physically in vivo. When Cyt c6A fused to the GAL4 activation domain (Cyt c6A
AD) was co-expressed with the GAL4 DNA-binding domain fused to either PETE1 or PETE2 (PETE1BD, PETE2BD), yeast cells did not grow on selective medium lacking either histidine or adenine, indicating that Cyt c6A does not interact with either of the two plastocyanin isoforms (Supplemental Figure 2A). Furthermore, no interaction between PETE1 and PETE2 (PETE2BD + PETE1AD) could be observed. Interestingly, yeast cells grew very robustly on selective medium when Cyt c6A
AD was co-expressed with the GAL4 DNA-binding domain (BD) fused to a second Cyt c6A molecule (Cyt c6A
BD), suggesting that Cyt c6A is able to form homodimers. The interaction per- sisted even when a mutated form of Cyt c6A, in which the two conserved cysteines were replaced by two serines (Cyt c6Am), was fused to the GAL4 DNA-binding domain (Cyt c6AmBD), im- plying that formation of Cyt c6A homodimers is not dependent on the formation of disulphide bridges. Whether a ternary complex made up of Cyt c6A homodimers and either plastocy- anin type could form was also tested using a yeast ternary-trap assay (Egea-Cortines et al., 1999) (Supplemental Figure 2B). To this end, the Cyt c6A
AD fusion protein was co-expressed with TFT
tron transfer under optimal growth conditions. Therefore, in a Cyt c6A carrying a nuclear localization signal (Cyt c6A ), to- light of the proposal of Schlarb-Ridley et al. (2006) that plas- tocyanin and Cyt c6A might cooperate in the thylakoid lumen,
gether with either PETE1BD or PETE2BD. In all cases, yeast cells were unable to grow on selective medium, suggesting the
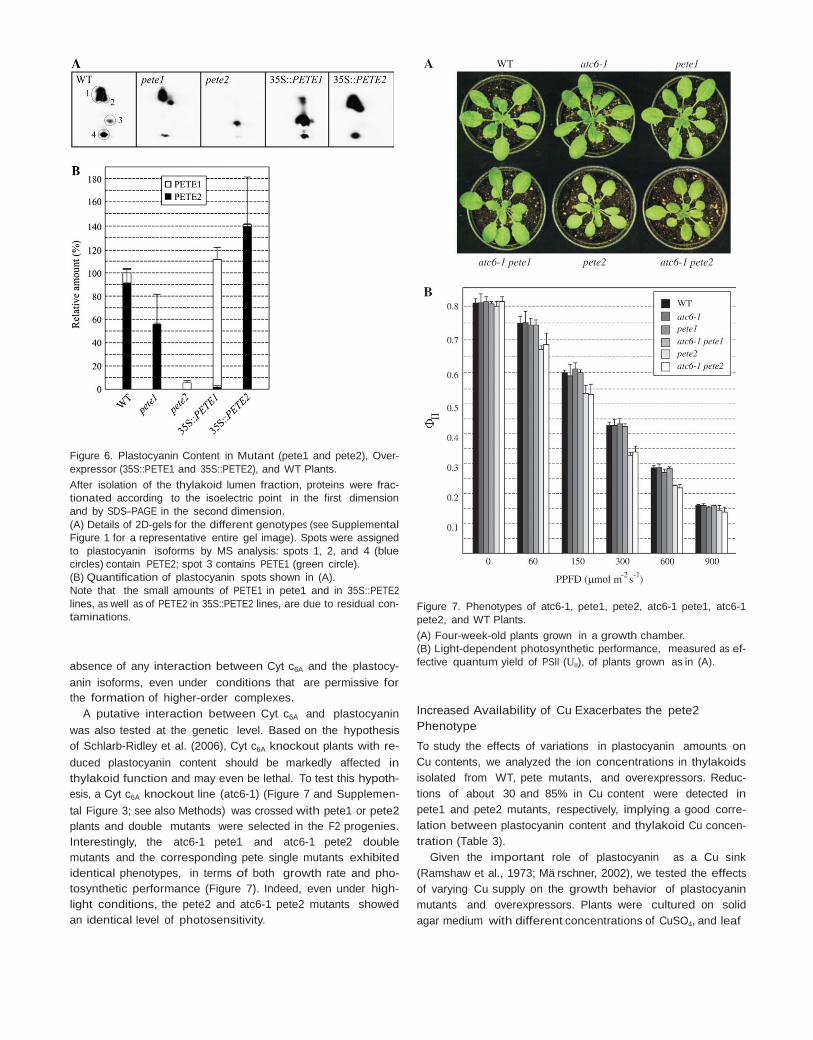
Figure 6. Plastocyanin Content in Mutant (pete1 and pete2), Over- expressor (35S::PETE1 and 35S::PETE2), and WT Plants. After isolation of the thylakoid lumen fraction, proteins were frac- tionated according to the isoelectric point in the first dimension and by SDS–PAGE in the second dimension. (A) Details of 2D-gels for the different genotypes (see Supplemental Figure 1 for a representative entire gel image). Spots were assigned to plastocyanin isoforms by MS analysis: spots 1, 2, and 4 (blue circles) contain PETE2; spot 3 contains PETE1 (green circle). (B) Quantification of plastocyanin spots shown in (A). Note that the small amounts of PETE1 in pete1 and in 35S::PETE2 lines, as well as of PETE2 in 35S::PETE2 lines, are due to residual con- taminations.
absence of any interaction between Cyt c6A and the plastocy- anin isoforms, even under conditions that are permissive for the formation of higher-order complexes.
A putative interaction between Cyt c6A and plastocyanin was also tested at the genetic level. Based on the hypothesis of Schlarb-Ridley et al. (2006), Cyt c6A knockout plants with re- duced plastocyanin content should be markedly affected in thylakoid function and may even be lethal. To test this hypoth- esis, a Cyt c6A knockout line (atc6-1) (Figure 7 and Supplemen- tal Figure 3; see also Methods) was crossed with pete1 or pete2 plants and double mutants were selected in the F2 progenies. Interestingly, the atc6-1 pete1 and atc6-1 pete2 double mutants and the corresponding pete single mutants exhibited identical phenotypes, in terms of both growth rate and pho- tosynthetic performance (Figure 7). Indeed, even under high- light conditions, the pete2 and atc6-1 pete2 mutants showed an identical level of photosensitivity.
Figure 7. Phenotypes of atc6-1, pete1, pete2, atc6-1 pete1, atc6-1 pete2, and WT Plants. (A) Four-week-old plants grown in a growth chamber. (B) Light-dependent photosynthetic performance, measured as ef- fective quantum yield of PSII (UII), of plants grown as in (A). Increased Availability of Cu Exacerbates the pete2 Phenotype
To study the effects of variations in plastocyanin amounts on Cu contents, we analyzed the ion concentrations in thylakoids isolated from WT, pete mutants, and overexpressors. Reduc- tions of about 30 and 85% in Cu content were detected in pete1 and pete2 mutants, respectively, implying a good corre- lation between plastocyanin content and thylakoid Cu concen- tration (Table 3).
Given the important role of plastocyanin as a Cu sink (Ramshaw et al., 1973; Ma rschner, 2002), we tested the effects of varying Cu supply on the growth behavior of plastocyanin mutants and overexpressors. Plants were cultured on solid agar medium with different concentrations of CuSO4, and leaf

Table 3. Cu Contents in Thylakoids of WT, Mutants (pete1 and pete2), and Overexpressors (35S::PETE1 and 35S::PETE2).
has been put forward on the basis of the increased photosen- sitivity observed in mutants lacking the PSI-F subunit, which is
WT pete1 pete2
35S::
PETE1
35S::
PETE2
involved in the docking of plastocyanin in C. reinhardtii (Hippler et al., 2000) and A. thaliana (Haldrup et al., 2000). In- terestingly, pete2 plants that also lack pre-bound plastocyanin
Thylakoids 17.48 6 1.4 12.41 6 1.27 2.33 6 0.51 21.48 6 1.84 20.53 6 1.74 showed a similar photosensitivity, implying that the large Values indicate amounts of Cu expressed as mg g-1 Mg. The data are averages (6 SD) of three independent measurements.
areas of 2-week-old seedlings were measured as an indicator of growth (Supplemental Figure 4). At 0.025, 0.1, and 10 lM CuSO4, no major differences in size were observed between the genotypes tested. However, at 25 lM CuSO4, pete2 plants showed a marked reduction in growth (Supplemental Figure 4). Concomitantly, an evident decrease in photosyn- thetic performance was also observed in pete2, indicating that the reduced plastocyanin pool size decreases the threshold level for Cu toxicity.
DISCUSSION
Variations in plastocyanin levels have been repeatedly reported to coincide with variations of photosynthetic elec- tron transport activity (Krueger et al., 1984; Burkey, 1993, 1994; Burkey et al., 1996; Scho ttler et al., 2004), prompting the conclusion that the plastocyanin pool size is limiting for thylakoid electron transport. On the contrary, our analysis shows that the plastocyanin content can be significantly de- creased without pronounced changes in the overall photosyn- thetic activity, suggesting that—at least in Arabidopsis WT plants under optimal growth conditions—plastocyanin is pres- ent in large excess. An up to 10-fold decrease in the plastocy- anin content is apparently of little consequence for overall photosynthetic activity and pete1 plants with 60–80% of WT plastocyanin levels are hardly changed in growth rate and photosynthesis efficiency. This indicates that the plastocy- anin-to-PSI ratio of 2–3 observed in spinach (Graan and Ort, 1984; Haehnel et al., 1989) or green algae (Delosme, 1991) is not a strict prerequisite for efficient photosynthesis, al- though it certainly promotes saturation of the PSI binding site for plastocyanin and, therefore, rapid reduction of P700
+. Sim- ilarly, Synechocystis mutants without cytochrome c6 (Cyt c6) and with heavily down-regulated plastocyanin expression grow photoautotrophically and maintain rapid steady-state photosynthetic electron transport rates (Zhang et al., 1994). Taken together, it appears likely that limited amounts of plas- tocyanin, in plants grown under optimal conditions, are still capable of an efficient electron transport.
This prompts the question of why there is so much plasto- cyanin in the thylakoid lumen of Arabidopsis. One possible explanation is that a significant excess of plastocyanin relative to PSI ensures saturation of the plastocyanin docking site, keeping the lifetime of P700
+ short by promoting its fast reduc- tion when plastocyanin is pre-bound to PSI. Such a requirement
amount of plastocyanin might have an essential role in pro- tecting higher plants from photoxidative damages. The alter- native explanation—that plastocyanin interacts physically with Cyt c6A to function as a redox buffer in the thylakoid lumen (Schlarb-Ridley et al., 2006)—finds no support from our yeast analyses, although the existence of a transient weak interaction that escapes detection by the yeast two-hybrid assay, cannot be excluded. However, one tenet of the hypoth- esis of Schlarb-Ridley et al. (2006) needs to be revised: in con- trast to previous reports (Gupta et al., 2002), in our hands, the lack of Cyt c6A expression (in the atc6-1 mutant) in combination with reduced plastocyanin expression does not lead to a synthetic phenotype, thus making a functional interaction of the two luminal proteins unlikely.
The involvement of plastocyanin in Cu homeostasis has been also suggested before, because this soluble electron carrier chelates around 50% of Cu in photosynthetic cells (Ramshaw et al., 1973). Although a marked reduction in Cu content could be detected in thylakoid membranes isolated from pete1 and pete2 leaves, similarly to the decrease in thylakoid Cu reported for the paa1 and paa2 mutants (Shikanai et al., 2003; Abdel-Ghany et al., 2005), it is unlikely that plastocyanin acts as a metallothionein mediating Cu tolerance in flowering plants (Zhou and Goldsbrough, 1995). Accordingly, the plasto- cyanin overexpressor lines did not exhibit increased resistance to Cu stress, and presumably the reduced plastocyanin content rendered the pete plants more susceptible to oxidative stress when grown under high-Cu conditions. Alternatively, excess levels of plastocyanin might become necessary under certain stress conditions affecting the mobility of plastocyanin. For in- stance, in Chlamydomonas under hyper-osmotic shock, the re- duced luminal space hinders the movement of docking to PSI of plastocyanin (Cruz et al., 2001). Although land plants might be rarely exposed to such extreme stress conditions, the high levels of plastocyanin might represent a pre-adaptation to such conditions, ensuring an optimal lateral diffusion under chilling temperatures or drought stress.
In contrast to algae and cyanobacteria, Arabidopsis, to- gether with many other flowering plants and the moss Phys- comitrella, expresses more than one isoform of plastocyanin. In poplar, the amino acid substitutions that distinguish the two plastocyanin isoforms are associated with differences in elec- trostatic properties and influence protein stability (Shosheva et al., 2004, 2005); yet, the characterization of the consequen- ces on the function of plastocyanin, namely the transfer of electrons between PSI and Cyt f, is still lacking. In our analysis, a direct correlation between photosynthetic performance and the amount of plastocyanin available was found in A. thaliana, regardless of the isoform analyzed. This suggests that, in vivo,

the two plastocyanin isoforms have redundant function. It is also reminiscent of previous studies of the D (Ihnatowicz et al., 2004) and E (Ihnatowicz et al., 2007) subunits of PSI: each of these is encoded by two functional nuclear genes, and, in each case, the two isoforms have identical functions. However, the presence of two functional plastocyanin-encoding genes raises the question of why these genes are duplicated in the nuclear genomes of several flowering plants. One possible explanation is that PETE gene duplications have been posi- tively selected in different land plant species independently, because these organisms—in contrast to algae and cyanobac- teria (Merchant et al., 2006)— lack Cyt c6 as an alternative elec- tron transporter and are more subject to fluctuating metal ion concentrations than other organisms, due to their sessile nature. This might have made it necessary to regulate the expression of plastocyanin in a more flexible manner, with the aim to guarantee an efficient electron transport rate espe- cially under extreme stress conditions. That is in agreement with the highly variable abundance of plastocyanin observed under the different environmental conditions (Burkey, 1993; Scho ttler et al., 2004).
One unexpected finding was that overexpression of either PETE1 or PETE2 results in an increase in size and in dry weight of leaves, implying an enhanced capacity for biomass produc- tion. However, the improved growth rate of 35S::PETE1 and 35S::PETE2 lines could not be ascribed to an increase in photo- synthetic capacity; accumulation of photosynthetic proteins and chlorophyll fluorescence parameters were similar to WT. Chida et al. (2007) have recently reported a similar enhance- ment of plant growth upon overexpression of an algal Cyt c6 in A. thaliana. This overexpressor, however, had a higher ca- pacity for CO2 fixation and improved photosynthetic electron flow. In both the study by Chida et al. (2007) and our analysis, a clear explanation for the increase in biomass production remains elusive, particularly in light of the large excess of plas- tocyanin already present in WT Arabidopsis thylakoids.
METHODS
Plant Lines, Propagation, and Growth Measurements
The pete1 and pete2 mutants were identified among a collec- tion of A. thaliana (ecotype Col-0) lines that had been muta- genized by random insertion of the En1 transposon from maize (Weigel et al., 2003). Stable null alleles were obtained as previously described (Weigel et al., 2003). The atc6-1 mu- tant, corresponding to the line Salk_011266 (ecotype Col-0), was identified by screening the insertion flanking database SIGnAL (http://signal.salk.edu/cgi-bin/tdnaexpress). Details of T-DNA insertion and the primers used for segregation analysis are given in Supplemental Figure 3. The atc6-1 pete1 and atc6- 1 pete2 double mutants were generated by crossing the cor- responding single mutants and identifying homozygous F2 plants by PCR. The overexpressing lines 35S::PETE1 and 35S::PETE2 were generated by ligating the PETE1 and PETE2
cDNAs, respectively, into the plant expression vector pJAN33, placing them under the control of the Cauliflower Mosaic Virus 35S promoter. Flowers from pete1/pete1 PETE2/pete2 plants were transformed according to Clough and Bent (1998) and seeds were collected after 3 weeks. Forty-five and 51 independent transgenic plants for 35S::PETE1 and 35S::PETE2, respectively, were selected on the basis of their kanamycin resistance, and pete1 pete2 double mutants carry- ing the corresponding transgene were identified by PCR. Over- expression of the transgenes was confirmed by Northern analysis and RT–PCR, and plants were phenotypically analyzed by measuring growth and chlorophyll fluorescence as described (Leister et al., 1999; Pesaresi et al., 2001).
All genotypes were grown on Minitray soil (Gebr. Patzer, Sinntal-Jossa, Germany) in a growth chamber (day period of 11 h at 20°C, PPFD = 80 lmol m-2 s-1; night period of 13 h at 15°C). Osmocote Plus fertilizer (15% N, 11% P2O5, 13% K2O, and 2% MgO; Scotts Deutschland, Nordhorn, Germany) was used according to the manufacturer’s instructions. For growth on agar medium, seeds were surface-sterilized and sown on agar plates containing MS medium including 1% sucrose (Sigma-Aldrich, St Louis, MO). The medium was sup- plemented with different concentrations of CuSO4
(0.025 lM; 0.1 lM; 10 lM; 25 lM) or with the chelator cupri- zone (Sigma #C9012) as indicated. To induce high-light stress, 3-week-old plants, grown on soil as above, were exposed to a light flux of 800 lmol m-2 s-1 (during the daily 11-h pho- toperiod) for 1 week. All the analyses, unless stated elsewhere, were performed on light-adapted plants at the eight-leaf rosette stage. Analysis of Nucleic Acids and their Sequences
Arabidopsis DNA was isolated as described by Liu et al. (1995). Total RNA was extracted from fresh tissue using the RNeasy plant system (Qiagen, Hilden, Germany). For QRT–PCR of PETE1 and PETE2, first-strand cDNA was synthesized using the SuperScript preamplification system (Invitrogen, Karlsruhe, Germany), and a 33P-labeled PETE gene-specific sense primer was used with unlabeled antisense primer (PETE-sense: 5#- MATCCCWTCTTTCACCGGCCT-3’; PETE-antisense: (5#-CACRAT- CTTCTCTCCTTTAGC-3’) to amplify cDNA by PCR for 25 cycles. In the same reaction, a 33P-labeled ACTIN1 gene-specific sense primer was used with unlabeled antisense primer to check for equal loading (Actin1-sense: 5#-TTCACCACCACAGCAGAGC-3’; Actin1-antisense: 5#-ACCTCAGGACAACGGAATCG-3’). The PCR products were then separated on a 4.5% (w/v) polyacrylamide gel. Signals were quantified using the Storm 860 PhosphorIm- ager (Molecular Dynamics) and the program Image Quant for Macintosh (version 1.2; Molecular Dynamics).
Sequence data were analyzed with the Winsconsin Package Version 10.0 from the Genetic Computer Group, Madison, Win- sconsin (GCG; Devereux et al., 1984) and amino acid sequences were aligned using CLUSTALW (www.ebi.ac.uk/clustalw; Thompson et al., 1994).

Protein Gel-Blot Analyses and Two-Dimensional PAGE
For immunoblot analyses, leaves were harvested in the middle of the light period and thylakoids were prepared as described by Bassi et al. (1985). Thylakoid proteins obtained from iden- tical amounts (fresh weights) of WT, mutant, and overexpres- sor leaves were fractionated by electrophoresis on a SDS–PAGE gradient gel (10–16% acrylamide) as described by Scha gger and von Jagow (1987) and transferred to Immobilon-P mem- branes (Millipore). Replicate filters were incubated with anti- bodies specific for the antenna complex of PSI (Lhca1-3), PSI-C, PSI-E, PSI-G, PSI-K, Cyt b6, Cyt f, the antenna complex of PSII (Lhcb1-2, Lhcb5), PSII-D1, and the ATPase a + b subunits. Sig- nals were detected using the Enhanced Chemiluminescence Western Blotting Kit (Amersham Biosciences, Sunnyvale, CA). Densitometric analyses of immunoblot signals were per- formed using lumi Analyst 3.0 (Boehringer Mannheim).
For plastocyanin quantification, the thylakoid lumen frac- tion was isolated essentially as in Kieselbach et al. (1998). Pro- teins were concentrated using Microsep™ Centrifugal Devices 3K (PALL Life Sciences), and protein quantification was carried out according to Bradford (1976) using bovine serum albumin as standard. Subsequently, lumen proteins (150 lg) were pre- cipitated with ice-cold 100% acetone, solubilized and labeled according to GE healthcare instruction manual for DIGE (CyDye DIGE Fluors minimal dyes for Ettan DIGE) with the exception that the end concentration in the solubilization mixture was 7 M urea, 2 M thiourea, 5 mM Tris, 0.2% SDS and 4% CHAPS. Samples were separated by isoelectric focusing (IEF) in the pH range between 3.0 and 5.6 on 24-cm strips (GE healthcare). An Ettan IPGphor II was used for strip rehydration (12 h), and the separation was completed at a constant voltage of 8000 V for ;90 000 Vh. Each strip was then equilibrated for 15 min with gentle rolling in 25 ml of equilibration solution (50 mM Tris-Cl, pH 8.8, 6 M urea, 30% glycerol, 2% SDS) with 2% DTT and for 15 min in equilibration solution containing 4.5% iodoaceta- mide instead of the DTT. Fractionation in the second dimen- sion was performed on denaturing SDS–PAGE gradient gels (12–20% acrylamide), cast in an EttanDaltsix caster using low fluorescence glass plates. Gels were run according to the EttanDaltsix user’s manual (Ettan Daltsix Electrophoresis System, second-dimension gel electrophoresis 80–6492–49/ Rev. B0/07–03, Amersham Biosciences) at 14 mA and 20°C.
Protein Detection and Image Analysis
The gels were scanned with a Typhoon™ 9410 (Amersham Bio- sciences) Variable Mode Imager at 100 lm resolution with PMTs set in the 490–550 V range. Image edges were cropped using ImageQuant™ V5.2 (Amersham Bioscience) and the images were analyzed with DeCyder™ V5.0 software (Amer- sham Bioscience). The batch processor was run with an esti- mated spot number of 1200. Detailed descriptions of the DeCyder™ are given by Alban et al. (2003) and in the Ettan DIGE User’s Manual (18–1164–40 Amersham Biosciences). After scanning, the gels were fixed with 40% ethanol and 10% ace- tic acid, and stained with a filtered and boiled solution of
0.025% R-250 Coomassie Blue in 10% acetic acid for 15 min. The gels were then destained with 10% acetic acid. N-terminal Sequencing
Amino-terminal microsequencing was carried out with a Procise sequencer (Applied Biosystems). Proteins from 1D and 2D PAGE were transferred to a polyvinylidene difluoride (PVDF) membrane and sequenced essentially as described (Matsudaira, 1987). MALDI–TOF Analysis
MALDI–TOF analysis of proteins digested in-gel was carried out with the Vouager-DE™ STR Bio Spectrometry™ Workstation from PerSpective Biosystem. In-gel digestions were performed using a combination of sequencing-grade modified chymo- trypsin (Promega) and trypsin, and then analyzed as described by Shevchenko et al. (1996). Database searches were performed with the MS BioTools software (Bruker) using the Mascott search engine (www.matrixscience.com). Proteins that could not be identified from fingerprint spectra were con- firmed by a post-source decay analysis of single peptides. Spectroscopic Analyses
In-vivo chlorophyll a fluorescence of single leaves was mea- sured using the PAM 101/103 fluorometer (Walz, Effeltrich, Germany). Pulses (800 ms) of white light (6000 lmol m-2 s-1) were used to determine the maximum fluorescence (FM). A 15-min illumination with actinic light (80 lmol m-2 s-1) served to drive electron transport between PSII and PSI before measur- ing UII, ETR (Genty et al., 1989) and qP. For UII light-curves, plants were adapted for 15 min to each of the light intensities, ranging from 60 to 900 lmol m-2 s-1.
Spectrophotometric measurements were made on a flash spectrophotometer (JTS 10, Biologic, France) as described pre- viously (Joliot and Joliot, 2005). Transient changes in P700
oxidation were determined using an 810-nm broadband LED source (30 nm). RG780 filters were used to protect the photodiodes from actinic light. When continuous light was used, the actinic FRL was provided by a far-red LED (k max = 720 nm) filtered through three Wratten filters 55 that block wave- lengths below 700 nm. Green light was provided by an inbuilt array of LEDs (kmax = 530 nm). The fast P700
+ reduction kinetics (see Figure 5) were measured with the same set-up using a dye laser to provide the actinic flash.
Changes in Cyt f absorption were measured with a set-up described in Beal et al. (1999). Actinic flashes were provided by a dye laser at 690 nm, while detecting flashes were pro- vided by an optical parametric oscillator (OPO) pumped by a Nd:Yag laser. The Cyt f redox changes were obtained as the difference between the absorption at 554 nm and a baseline drawn between 545 and 573 nm.
The plastocyanin-to-PSI ratio was assessed by measuring the absorption changes at 810 and 870 nm induced by a far-red illumination (720 nm), to fully oxidized both P700 and the elec- tron donors, including plastocyanin. The absorption changes

700
at 810 nm were corrected for the plastocyanin contribution to assess the absorption changes resulting specifically from P700 ox- idation, by computing the difference (DI/I810nm – 0.8 DI/I870nm). Conversely, the absorption changes at 870 nm were corrected
+
for comparative two-dimensional gel analysis: two-dimensional difference gel electrophoresis incorporating a pooled internal standard. Proteomics 3, 36–44.
Bassi, R., dal Belin Peruffo, A., Barbato, R., and Ghisi, R. (1985). Dif- for the contribution of P700 to assess the absorption changes ferences in chlorophyll-protein complexes and composition of associated with the oxidation of plastocyanin, by computing the difference (DI/I870nm – 0.25 DI/I870nm).
Yeast Two-Hybrid and Ternary-Trap Assays
YPAD, SD, and appropriate dropout media have been de- scribed previously (Sherman, 1991). The yeast two-hybrid and the ternary-trap assays were performed using the yeast strain AH109 supplied by Clontech (Palo Alto, CA) (James et al., 1996). The pGBTKT7 vector (Clontech), carrying the GAL4 DNA-binding domain, was used to express the bait proteins, whereas the pGADT7 vector (Harper et al., 1993), car- rying the GAL4 activation domain, was used to express the prey proteins. For the ternary-trap test, the vector pTFT1 (Egea- Cortines et al., 1999) was employed. Two-hybrid protein inter- actions were evaluated by growing the yeast colonies at 28°C on media lacking either histidine or adenine and supple- mented with different amounts of 3-amino-1,2,4-triazole (3-AT). Ternary-trap assays were evaluated on media contain- ing 3-AT but lacking histidine.
Cu and Mg Quantification
Thylakoids obtained from soil-grown WT, mutants, and over- expressors were oven-dried for 2 d at 60°C. Afterwards, the material was subjected to mineralization for 2 d in 65% nitric acid at 100°C. After mineralization, Cu and Mg contents were quantified by means of ICP–MS analysis (EPA 200.8).
SUPPLEMENTARY DATA
Supplementary Data are available at Molecular Plant Online.
FUNDING
This work was supported by the Deutsche Forschungsgemeinschaft (grants LE 1265/10 and SFB-TR1 TP B7 to D.L.) and the Swedish Research Council (grant FORMAS to W.S.P. and I.G.).
ACKNOWLEDGMENTS
We thank Paul Hardy for critical comments on the manuscript. No conflict of interest declared.
REFERENCES
Abdel-Ghany, S.E., Muller-Moule, P., Niyogi, K.K., Pilon, M., and Shikanai, T. (2005). Two P-type ATPases are required for copper delivery in Arabidopsis thaliana chloroplasts. Plant Cell 17, 1233–1251.
Alban, A., David, S.O., Bjorkesten, L., Andersson, C., Sloge, E., Lewis, S., and Currie, I. (2003). A novel experimental design
polypeptides between thylakoids from bundle sheaths and mesophyll cells in maize. Eur. J. Biochem. 146, 589–595.
Beal, D., Rappaport, F., and Joliot, P. (1999). A new high-sensitivity 10-ns time-resolution spectrophotometric technique adapted to in vivo analysis of the photosynthetic apparatus. Review of Sci- entific Instruments 70, 202–207.
Blanc, G., Hokamp, K., and Wolfe, K.H. (2003). A recent polyploidy superimposed on older large-scale duplications in the Arabidop- sis genome. Genome Res. 13, 137–144.
Bradford, M.M. (1976). A rapid and sensitive method for the quan- titation of microgram quantities of protein utilizing the princi- ple of protein-dye binding. Anal. Biochem. 72, 248–254.
Briggs, L.M., Pecoraro, V.L., and McIntosh, L. (1990). Copper- induced expression, cloning, and regulatory studies of the plas- tocyanin gene from the cyanobacterium Synechocystis sp. PCC 6803. Plant Mol. Biol. 15, 633–642.
Buchanan, B.B., and Luan, S. (2005). Redox regulation in the chlo- roplast thylakoid lumen: a new frontier in photosynthesis research. J. Exp. Bot. 56, 1439–1447.
Burkey, K. (1993). Effect of growth irradiance on plastocyanin levels in barley. Photosynth. Res. 36, 103–110.
Burkey, K.O. (1994). Genetic variation of photosynthetic electron transport in barley: identification of plastocyanin as a potential limiting factor. Plant Science 98.
Burkey, K.O., Gizlice, Z., and Carter, T.E. (1996). Genetic variation in soybean photosynthetic electron transport capacity is related to plastocyanin concentration in the chloroplast. Photosynth. Res. 49, 141–149.
Chida, H., et al. (2007). Expression of the algal cytochrome c6 gene in Arabidopsis enhances photosynthesis and growth. Plant Cell Physiol. 48, 948–957.
Clough, S.J., and Bent, A.F. (1998). Floral dip: a simplified method for Agrobacterium-mediated transformation of Arabidopsis thaliana. Plant J 16, 735–743.
Cruz, J.A., Salbilla, B.A., Kanazawa, A., and Kramer, D.M. (2001). Inhibition of plastocyanin to P + electron transfer in Chlamydo- monas reinhardtii by hyperosmotic stress. Plant Physiol. 127, 1167–1179.
Delosme, R. (1991). Electron transfer from cytochrome f to photo- system I in green algae. Photosynth. Res. 29, 45–54.
Devereux, J., Haeberli, P., and Smithies, O. (1984). A comprehensive set of sequence analysis programs for the VAX. Nucleic Acids Res. 12, 387–395.
Dimitrov, M.I., Donchev, A.A., and Egorov, T.A. (1990). Microheter- ogeneity of parsley plastocyanin. FEBS Lett. 265, 141–145.
Dimitrov, M.I., Donchev, A.A., and Egorov, T.A. (1993). Twin plasto- cyanin dimorphism in tobacco. Biochim Biophys. Acta 1203, 184–190.
Egea-Cortines, M., Saedler, H., and Sommer, H. (1999). Ternary com- plex formation between the MADS-box proteins SQUAMOSA,

DEFICIENS and GLOBOSA is involved in the control of floral ar- chitecture in Antirrhinum majus. EMBO J 18, 5370–5379.
Farah, J., Rappaport, F., Choquet, Y., Joliot, P., and Rochaix, J.D. (1995). Isolation of a psaF-deficient mutant of Chlamydomonas reinhardtii: efficient interaction of plastocyanin with the photo- system I reaction center is mediated by the PsaF subunit. EMBO J 14, 4976–4984.
Finazzi, G., Sommer, F., and Hippler, M. (2005). Release of oxidized plastocyanin from photosystem I limits electron transfer be- tween photosystem I and cytochrome b6f complex in vivo. Proc. Natl Acad. Sci. U S A 102, 7031–7036.
Genty, B., Briantais, J.M., and Baker, N.R. (1989). The relationship between the quantum yield of photosynthetic electron trans- port and quenching of chlorophyll fluorescence. Biochim. Bio- phys. Acta 990, 87–92.
Gorman, D.S., and Levine, R.P. (1965). Cytochrome f and plastocy- anin: their sequence in the photosynthetic electron transport chain of Chlamydomonas reinhardi. Proc. Natl Acad. Sci. U S A 54, 1665–1669.
Graan, T., and Ort, D.R. (1984). Quantitation of the rapid electron donors to P700, the functional plastoquinone pool, and the ratio of the photosystems in spinach chloroplasts. J. Biol. Chem. 259, 14003–14010.
Gupta, R., He, Z., and Luan, S. (2002). Functional relationship of cytochrome c6 and plastocyanin in Arabidopsis. Nature 417, 567–571.
Haehnel, W., Ratajczak, R., and Robenek, H. (1989). Lateral distri- bution and diffusion of plastocyanin in chloroplast thylakoids. J. Cell Biol. 108, 1397–1405.
Haehnel, W., Jansen, T., Gause, K., Klo sgen, R.B., Stahl, B., Michl, D., Huvermann, B., Karas, M., and Herrmann, R.G. (1994). Electron transfer from plastocyanin to photosystem I. EMBO J 13, 1028–1038.
Haldrup, A., Simpson, D.J., and Scheller, H.V. (2000). Down- regulation of the PSI-F subunit of photosystem I (PSI) in Arabidopsis thaliana: the PSI-F subunit is essential for photoau- totrophic growth and contributes to antenna function. J. Biol. Chem. 275, 31211–31218.
Harper, J.W., Adami, G.R., Wie, N., Keyomarsi, K., and Elledge, S.J. (1993). The p21 Cdk-interacting protein Cip1 is a potent inhibitor of G1 cyclin-dependent kinases. Cell 75, 805–816.
Hippler, M., Biehler, K., Krieger-Liszkay, A., van Dillewjin, J., and Rochaix, J.D. (2000). Limitation in electron transfer in photosys- tem I donor side mutants of Chlamydomonas reinhardtii: lethal photo-oxidative damage in high light is overcome in a suppressor strain deficient in the assembly of the light harvesting complex. J. Biol. Chem. 275, 5852–5859.
Ihnatowicz, A., Pesaresi, P., and Leister, D. (2007). The E subunit of photosystem I is not essential for linear electron flow and pho- toautotrophic growth in Arabidopsis thaliana. Planta 226, 889–895.
Ihnatowicz, A., Pesaresi, P., Varotto, C., Richly, E., Schneider, A., Jahns, P., Salamini, F., and Leister, D. (2004). Mutants for photo- system I subunit D of Arabidopsis thaliana: effects on photosyn- thesis, photosystem I stability and expression of nuclear genes for chloroplast functions. Plant J 37, 839–852.
James, P., Halladay, J., and Craig, E.A. (1996). Genomic libraries and a host strain designed for highly efficient two-hybrid selection in yeast. Genetics 144, 1425–1436.
Joliot, P., and Joliot, A. (2002). Cyclic electron transfer in plant leaf. Proc. Natl Acad. Sci. U S A 99, 10209–10214.
Joliot, P., and Joliot, A. (2005). Quantification of cyclic and linear flows in plants. Proc. Natl Acad. Sci. U S A 102, 4913–4918.
Katoh, S. (1960). A new copper protein from Chlorella ellisoidea. Nature 186, 533–534.
Kieselbach, T., Hagman, A., Andersson, B., and Schroder, W.P. (1998). The thylakoid lumen of chloroplasts. Isolation and char- acterization. J. Biol. Chem. 273, 6710–6716.
Kieselbach, T., Bystedt, M., Hynds, P., Robinson, C., and Schroder, W.P. (2000). A peroxidase homologue and novel plas- tocyanin located by proteomics to the Arabidopsis chloroplast thylakoid lumen. FEBS Lett. 480, 271–276.
Krueger, R.W., Randall, D.D., and Miles, D. (1984). Photosynthesis in tall fescue: V. Analysis of high PSI activity in a decaploid geno- type. Plant Physiol. 76, 903–909.
Leister, D., Varotto, C., Pesaresi, P., Niwergall, A., and Salamini, F. (1999). Large-scale evaluation of plant growth in Arabidopsis thaliana by non-invasive image analysis. Plant Physiol. Biochem. 37, 671–678.
Liu, Y.G., Mitsukawa, N., Oosumi, T., and Whittier, R.F. (1995). Effi- cient isolation and mapping of Arabidopsis thaliana T-DNA insert junctions by thermal asymmetric interlaced PCR. Plant J 8, 457–463.
Marcaida, M.J., Schlarb-Ridley, B.G., Worrall, J.A., Wastl, J., Evans, T.J., Bendall, D.S., Luisi, B.F., and Howe, C.J. (2006). Struc- ture of cytochrome c6A, a novel dithio-cytochrome of Arabidop- sis thaliana, and its reactivity with plastocyanin: implications for function. J. Mol. Biol. 360, 968–977.
Ma rschner, H. (2002). Mineral Nutrition in Higher Plants (London: Academic Press) .
Matsudaira, P. (1987). Sequence from picomole quantities of pro- teins electroblotted onto polyvinylidene difluoride membranes. J. Biol. Chem. 262, 10035–10038.
Merchant, S., and Bogorad, L. (1987). Metal ion regulated gene ex- pression: use of a plastocyanin-less mutant of Chlamydomonas reinhardtii to study the Cu(II)-dependent expression of cyto- chrome c-552. EMBO J 6, 2531–2535.
Merchant, S.S., Allen, M.D., Kropat, J., Moseley, J.L., Long, J.C., Tottey, S., and Terauchi, A.M. (2006). Between a rock and a hard place: trace element nutrition in Chlamydomonas. Biochim. Bio- phys. Acta 1763, 578–594.
Olesen, K., Ejdeback, M., Crnogorac, M.M., Kostic, N.M., and Hansson, O. (1999). Electron transfer to photosystem 1 from spinach plastocyanin mutated in the small acidic patch: ionic strength dependence of kinetics and comparison of mechanistic models. Biochemistry 38, 16695–16705.
Pesaresi, P., Varotto, C., Meurer, J., Jahns, P., Salamini, F., and Leister, D. (2001). Knock-out of the plastid ribosomal protein L11 in Arabidopsis: effects on mRNA translation and photosyn- thesis. Plant J 27, 179–189.
Puig, S., Andres-Colas, N., Garcia-Molina, A., and Penarrubia, L. (2007). Copper and iron homeostasis in Arabidopsis: responses to metal deficiencies, interactions and biotechnological applica- tions. Plant Cell Environ. 30, 271–290.

Ramshaw, J.A., Brown, R.H., Scawen, M.D., and Boulter, D. (1973).
Higher plant plastocyanin. Biochim. Biophys. Acta 303, 269–273. Redinbo, M.R., Yeates, T.O., and Merchant, S. (1994). Plastocyanin:
structural and functional analysis. J. Bioenerg. Biomembr. 26, 49–66.
Rensing, S.A., et al. (2008). The Physcomitrella genome reveals evo- lutionary insights into the conquest of land by plants. Science 319, 64–69.
Scha gger, H., and von Jagow, G. (1987). Tricine-sodium dodecyl sul- fate-polyacrylamide gel electrophoresis for the separation of proteins in the range from 1 to 100 kDa. Anal. Biochem. 166, 368–379.
Schlarb-Ridley, B.G., Nimmo, R.H., Purton, S., Howe, C.J., and Bendall, D.S. (2006). Cytochrome c6A is a funnel for thiol oxida- tion in the thylakoid lumen. FEBS Lett. 580, 2166–2169.
Scho ttler, M.A., Kirchhoff, H., and Weis, E. (2004). The role of plas- tocyanin in the adjustment of the photosynthetic electron trans- port to the carbon metabolism in tobacco. Plant Physiol. 136, 4265–4274.
Seigneurin-Berny, D., et al. (2006). HMA1, a new Cu-ATPase of the chloroplast envelope, is essential for growth under adverse light conditions. J. Biol. Chem. 281, 2882–2892.
Shevchenko, A., Wilm, M., Vorm, O., Jensen, O.N., Podtelejnikov, A.V., Neubauer, G., Mortensen, P., and Mann, M. (1996). A strategy for identifying gel-separated pro- teins in sequence databases by MS alone. Biochem. Soc. Trans. 24, 893–896.
Sherman, F. (1991). Getting started with yeast. Methods Enzymol. 194, 3–21.
Shikanai, T., Muller-Moule, P., Munekage, Y., Niyogi, K.K., and Pilon, M. (2003). PAA1, a P-type ATPase of Arabidopsis, functions in copper transport in chloroplasts. Plant Cell 15, 1333–1346.
Shosheva, A., Donchev, A., Dimitrov, M., Zlatanov, I., Toromanov, G., Getov, V., and Alexov, E. (2004). Experimental and numerical study of the poplar plastocyanin isoforms using Tyr as a probe for electrostatic similarity and dissimilarity. Bio- chim. Biophys. Acta 1698, 67–75.
Shosheva, A., Donchev, A., Dimitrov, M., Kostov, G., Toromanov, G., Getov, V., and Alexov, E. (2005). Comparative study of the stabil- ity of poplar plastocyanin isoforms. Biochim. Biophys. Acta 1748, 116–127.
Taneva, S.G., Donchev, A.A., Dimitrov, M.I., and Muga, A. (2000). Redox- and pH-dependent association of plastocyanin with lipid bilayers: effect on protein conformation and thermal stability. Biochim. Biophys. Acta 1463, 429–438.
Thompson, J.D., Higgins, D.G., and Gibson, T.J. (1994). CLUSTAL W: improving the sensitivity of progressive multiple sequence align- ment through sequence weighting, position-specific gap penal- ties and weight matrix choice. Nucleic Acids Res. 22, 4673–4680.
Wastl, J., Bendall, D.S., and Howe, C.J. (2002). Higher plants contain a modified cytochrome c6. Trends Plant Sci. 7, 244–245.
Weigel, M., Varotto, C., Pesaresi, P., Finazzi, G., Rappaport, F., Salamini, F., and Leister, D. (2003). Plastocyanin is indispensable for photosynthetic electron flow in Arabidopsis thaliana. J. Biol. Chem. 278, 31286–31289.
Yu, J., et al. (2005). The Genomes of Oryza sativa: a history of dupli- cations. PLoS Biol. 3, e38.
Zhang, L., Pakrasi, H.B., and Whitmarsh, J. (1994). Photoautotro- phic growth of the cyanobacterium Synechocystis sp. PCC 6803 in the absence of cytochrome c553 and plastocyanin. J. Biol. Chem. 269, 5036–5042.
Zhou, J., and Goldsbrough, P.B. (1995). Structure, organization and expression of the metallothionein gene family in Arabidopsis. Mol. Gen. Genet. 248, 318–328.