mussel (seashell) as concrete2.pdf
TRANSCRIPT

Project Number: AS5-CLAM
WASTE SHELL CEMENT COMPOSITES
A Major Qualifying Project Report
Submitted to the Faculty of
WORCESTER POLYTECHNIC INSTITUTE
In partial fulfillment of the requirements for the
Degree of Bachelor of Science
by
Anibal Ramirez
Steve D. Barker
Timothy J. Love
Edward J. Milazzo
Lawrence P. McGillicuddy
Assistant Professor Aaron Sakulich, Advisor
Assistant Professor Nima Rahbar, Co-Advisor
Assistant Professor Walter Towner, Co-Advisor
This report represents the work of one or more WPI undergraduate students submitted to the faculty as evidence of completion of a degree requirement.
WPI routinely publishes these reports on its web site without editorial or peer review. Worcester Polytechnic Institute
100 Institute Road, Worcester, Ma 01609-2280
1 | P a g e
Abstract Seashells waste is a growing economic and environmental hazard. The purpose of this
project was to use seashells in concrete and determine how the concrete would perform
compared to a standard mix. The testing consisted of eight mix designs that contained either
conch or oyster shells. The shells were used as a substitute for 10% or 25% sand, and 5% cement
powder pending the mix design. Four of the mixes used shells that were vinegar treated to
determine if that affected the strength of the concrete. These mixes were all compared to the
control and each other through a series of tests. The tests conducted were the 3-point bend test,
compressive test, split tensile test, and shrinkage test.
2 | P a g e

Executive Summary Introduction
Every year, the seafood industry produces over 100 million pounds (45.3 million kg) of waste from shellfish and crustaceans. Much of the waste that is generated from the industry is simply sent to landfills, and ways to recycle these materials are becoming more sought after. Finding a way to incorporate seashells into concrete would reduce the shellfish industry’s environmental impact and could reduce concrete manufacturing costs or improve concrete properties.
Background
Concrete is the most widely used construction material in the world with an estimated consumption of 33 billion tonnes (36.4 billion short tons) per year. The basic design of concrete has remained the same since its inception: water, aggregates, and cement. While the basic ingredients remain the same, the materials that have comprised both cement and aggregates have been numerous.
Coastal communities and those nearby could greatly reduce the distance they have to transport aggregate materials, reducing costs and their environmental impact. In New Delhi, India, for example, the price of a bag of sand is high due to a burgeoning population in a country that is seeing a burst in economic development and public/private construction projects.
Seashells are currently taking up a large volume in landfills. Using the shells in concrete provides a cheaper alternative to increase the strength of concrete by providing a substance for the cement paste to bond to and provide an environmentally sustainable method to dispose of the shell waste.
Methodology
The first step in creating the concrete for testing was to determine the appropriate concrete mix proportions, which depended on the ability of the project team to crush the shells into a powder. The conch shells arrived to the laboratory uncrushed and intact. The Oyster shells arrived pre-crushed in sizes around 1 cubic cm (0.061 cubic inches).
The project team then manually crushed the shells until they were a useable size. A ball mill was going to be used, but a large enough ball mill was not available. Manual crushing techniques were used to crush the shells to the desired size. The shells were put on a 2” thick steel plate, and crushed using an 8” x 8” cast steel tamping tool, as well as a sledgehammer. The shells were then sieved into the following sizes #8, #16, #30, #50, #100. The bottom catch plate then caught the remnants, which turned to powder. The first mix proportion only included water, sand, and cement at the water/cement ratio of 0.35. It was concluded that this mix was too dry, so the control mix was redone using a 0.4 ratio. The sand used in the control mixture was broken up by sieve sizes. 30% of the required sand mass was #8 sized sieve; 25% was #16 sized sieve; 20% was #30; 15% was #50; and 10% was #100.
After a large number of shells were crushed and sieved, the mix proportions that included shells began. Four mixes were conducted for each type of shell. The mixes included a certain percentage of shells substituted for the fine aggregate. Each shell had two mix proportions that used the shells as a substitute for 10% of the fine aggregate. On one of the two mixes, the shells were soaked in vinegar for 15 minutes in order to increase shell roughness and bonding capability. Each shell also had one mix proportion that used the shells as a substitute for 25% of
3 | P a g e

the fine aggregate. This mixture used shells that were vinegar treated. The 6 mixes included only shells that were smaller than the #8 sieve, but larger than the #100 sieve. The final mix for each shell used any of the shells that made it past the #100 sieve. This substance was a powder and was used as a substitute for 5% of the cement.
The next step in creating the concrete samples was to combine the materials in the mixer. Each concrete sample required 700 cubic inches (11,471 cubic cm) of total mix to pour in the molds. The cement, water, shells, and sand were massed into appropriate proportions. The base mix used a combination by volume of 10% water, 28.57% cement, and 61.43% sand. The cement, sand, and shells were placed into the mixer first. Water was then added into the mixer and turned on for 5 minutes. Following the complete duration of mixing, the concrete was then poured from the mixer into a large bucket capable of holding the entire mixture.
Next, each of the molds were filled with the concrete mixture. The project required making ten 2” (5.1 cm) cubes, ten 3” (7.6 cm) diameter cylinders with a height of 6” (15.2 cm), and eight 1” x 1” x 12” (2.54 cm x 2.54 cm x 30.5 cm) rectangles for each batch. Each mold required rodding when they were ½ full and completely full. After the concrete was rodded for the second time, the sides of the mold were tapped to eliminate air bubbles in the sample. The excess concrete on the top of the mold was then scraped off. Repetition of these last two steps occurred until the top surface was smooth. The samples were then placed under plastic for the night before being stored in the curing room until they were used for each test. Each batch was tested at 3, 7, and 14 days after mixing. Once the concrete samples were poured and cured, testing was able to begin. Five different tests were completed: the three-point bend, compression, split tensile, shrinkage, and X-ray diffraction. These six tests were chosen as they provide the most relevant and important properties of each concrete sample and the required equipment is readily available in the lab at Worcester Polytechnic Institute.
The three-point bend test was conducted in order to calculate the modulus of elasticity for each concrete sample. During this test, one of the rectangular samples (1” x 1” x 12”) had a vertical force applied downward on the center of the beam. Both ends were pinned from below. The machine slowly applied pressure from above until the sample broke completely. The compressive test was conducted in order to determine the compressive strength of the samples. A cube sample was taken and placed in the compression machine. Cube samples were used in order to have a flat and even surface on both the bottom and top of the sample, to assure a uniform test. The compression machine applied a steadily increasing force throughout the entire sample until the sample failed. In order to test the tensile strength of the concrete samples, cylindrical samples were used in the split tensile test. The sample was put on its side with place a piece of wood on top and underneath it. The sample was placed into the compression machine to test for tensile strength. Since the cylinder was split down the middle, it separated in a tensile manner instead of a compressive one. The wood provided a flat even surface on both sides of the cylinder to ensure even pressure along the sample. The shrinkage of the concrete samples was tested using a rectangular mold that has screws in the mold to mark where the concrete started for each batch. Each day the amount of movement that could be seen by the new length of the mold was observed and measured. The data found was then graphed in order to display the overall shrinkage of the concrete. Results/Discussion
4 | P a g e

During the seven-week testing phase of this project, six concrete property assessments were performed. These included compressive testing, split tensile testing, flexural testing, shrinkage testing, x-ray diffraction, and microscopy. The data collected through these methods is outlined below in this section.
The samples created for compression testing were 2” x 2” x 2” (5.08 cm x 5.08 cm x 5.08 cm). All nine mixtures underwent compressive testing on 3, 7, and 14 day curing times. The compressive strength values are based on the peak load over the area of the tested cube (4 in2). At least three cubes were tested at each curing time.
The split tensile samples consisted of cylinders with diameters of 3” (7.62 cm) and heights of 6” (15.24 cm). Only the first seven mixtures were tested for tensile strength. The testing obtained the load required to crack the concrete. This critical load, for most samples, was around a deformation of 0.1 in (0.25 cm). In typical concrete split tensile tests the samples achieve strength of about 300 to 700 psi. The data showed that Mix 2 and Mix 4 where the best and outperformed the control, while Mix 7 was the opposite of this and would not be a good replacement for the control.
A three-point bend test was conducted on the first seven mix proportions as well to determine flexural stress as well as flexural strain. All test samples performed better than the control, meaning that any one of our mix proportions can be used as a reasonable substitute for the control mix in terms of stress.
Three 1” x 1” x 12” samples were created and had their length measured over the course of a fourteen day period. The majority of test samples experienced greater shrinkage than the control sample of regular mortar. The exception to being experiencing greater shrinkage then the control is Mix 2. The mixture containing untreated conch shell aggregate experienced 0.24 mm less shrinkage than the control. Mix 6 was the mixture containing conch powder and it experienced about the same level of shrinkage as the control. The three oyster mixes had greater shrinkage compared to the other mixes. The oyster powder mix (Mix 7) had the greatest overall shrinkage, losing 0.041 in (1.05 mm) more than the untreated conch (Mix 2).
Conclusion
The purpose of this project was to determine the feasibility of replacing either sand or cement powder with seashells. Adding seashells lowered the compressive strength up to 20% after 14 days of curing time. The majority of samples (7 of 8) had lower compressive strengths than the base test after curing for 14 days. Tensile strengths of the samples were much closer to that of the base test. Over half of the samples tested had higher tensile strengths than the base mixture after 14 days of curing. However, the flexural strength increased when adding seashells to the mixture. Overall, the conch shells tested better than oyster shells in compression and tension. Furthermore, the conch shell samples had less shrinkage than the base or oyster mixes. The mixtures replacing 10% of sand with shells performed better than the ones replacing 25% of the sand. It was also found that vinegar treating the shells did not have a noticeable effect on the strength of concrete. There are two mixtures that would be recommended for usage in creating an airport runway. These are Mix 4, which replaced 10% of the sand with acid treated conch shells, and Mix 8, which replaced 5% of the cement powder with conch powder. For economic analysis, Mix 8 was chosen because replacing cement powder would reduce the cost of concrete more than replacing the fine aggregate would.
5 | P a g e
Following testing, this new mix proportion needed to be analyzed for implementation of an airport runway. AC150/5370-10 code requires a compressive strength of 4000 psi at 28 day curing time for the surface on an airport runway. Analyzing Mix 8, which had a compressive strength of 4799 psi after 14 days, the 28 day compressive strength can be estimated as 4799/0.9 = 5332psi. The mixture was analyzed to support the loading of 15-ton airplanes. The runway was also analyzed to ensure the concrete would not rupture from shear due to the immediate loading of an airplane. The concrete passes the requirements and a 12 in (305 mm) thick slab on a compact gravel base would provide enough strength to support the required loading.
The serviceability of each mixture was considered from the start of the project. The testing was performed to determine what mixtures would hold the required loading. The chosen Mix 8 only replaced 5% of the cement powder with conch powder. The samples that used conch shells had less shrinkage than the oyster samples. It was decided that the durability of this sample would not change from the base concrete mixture because of the testing results and the low percentage of shell replacement
6 | P a g e

Authorship All members contributed to the completion of this MQP. The below table shows the main contributors for each section. Section Author Abstract Steve Capstone Design Larry Introduction Anibal Background Eddy and Tim Methodology Steve and Anibal Results/Discussion Larry, Steve, Anibal, Eddy, and
Tim Managerial Analysis Anibal Conclusion Larry The below signatures indicates the acceptance of above.
_____________________________________________
_____________________________________________
_____________________________________________
_____________________________________________
_____________________________________________
7 | P a g e
Larry McGillicuddy
Steve Barker
Ed Milazzo
Tim Love
Anibal Ramirez

Capstone Design Statement This Major Qualifying Project addressed determining a more cost effective and efficient
concrete mix proportion for airport runways while reducing the environmental impact of
producing cement powder and discarding of seashell waste. Eight mix proportions were created
replacing percentages of fine aggregate and cement powder with either conch or oyster shells.
Each mix proportion was tested under compression and tension at 3, 7, and 14 day curing times.
Flexural strength was determined via 3-point bend testing after a 14 day curing duration. The
shrinkage of each mix proportion was also determined for two weeks following mixing. After
completion of the testing, the best mix proportion was selected and the following criteria were
analyzed to satisfy the Capstone Design requirement.
Economics Today, the world makes approximately 6,600 million tons of concrete per year. Of that
6,600 million tons, 2,800 million tons of Portland cement is manufactured each year. This report
provides a detailed economic analysis of the implications of introducing seashells into concrete
would have on the longevity of landfills and the benefits that would be realized by local seaside
communities. Additionally, an axiomatic decomposition of the process of utilizing seashell waste
in these local communities and the design of the concrete itself is included.
Sustainability The lifespan and sustainability of each mix proportion was accounted for in this report.
The chosen, most successful, mix proportion was compared to the base mixture for longevity
analysis. Airport runways require constant, daily usage and the concrete mix proportion chosen
would satisfy these requirements.
8 | P a g e

Constructability The ability to construct each mix proportion and the final airport runway was considered
throughout the duration of the project. The Boston-Logan airport runway was selected for
analysis with the advantage of geographical location. The close proximity to the ocean and
availability of seashells provides an opportunity to produce the required concrete. This report
includes an analysis of how to produce each test sample for all desired mix proportions. The
equipment, materials, mixing procedures, and testing processes are listed and described in this
review.
Ethics This project follows the code of ethics for all civil engineers. The design of this project
was to reduce the environmental impact of seashell waste and reduce the amount of cement
powder required in a concrete mixture. Reducing the amount of cement used will result in a
reduction of CO2 emitted into the atmosphere.
Health and Safety Safety is the most important aspect to account for when designing an airport runway. The
strengths of the selected concrete satisfy the requirements of AC150/5370-10. Calculations were
performed, and are located in this report, that ensure the safety of the airport runway based on
the selected mix proportion.
9 | P a g e

Capstone Licensure Statement Licensure is important in all professions for a variety of different reasons. The main
reason for licensing is to ensure an acceptable standard for completed work. Civil Engineers
have two very important licenses that they can obtain through their career. These are the
Fundamentals of Engineering License, commonly referred to as the FE, and the Professional
Engineers License, or a PE License.
Obtaining licensure is solely upon the individual. In order to obtain a FE license, one first
must graduate from an Accreditation Board for Engineering and Technology (ABET) accredited
school. After this step, an individual must take the FE examination. This exam tests the
individual on the various aspects of engineering. Upon passing this exam the engineer becomes
an FE licensed engineer.
To obtain a PE license in civil engineering, the engineer must first obtain the FE license.
Once obtained, the individual has to work under a certified PE’s for a set amount of years
depending on the state in which the license is being obtained. PE licensing is awarded for
specific states and many states require 4 years of work under certified PE’s. After completing the
proper required time underneath a PE, the engineer is able to apply to take the PE exam. Passing
the PE exam awards the individual a PE license. Some of the benefits of a PE license includes,
but is not limited to, being able to stamp and seal design drawings and bid on government
packages.
This project relates to the importance of licensure because a stamp would be required to
for the design. The calculations required for the design must be followed by a standard that could
be met from a certified FE licensed engineer. Obtaining a PE license opens many opportunities
for the individual. Overall, obtaining a license would make it possible to complete the design we
have in a real life application.
10 | P a g e

Acknowledgments We would like to thank everyone involved in this M QP. Without the guidance of the
professors, WPI staff, and graduate students this project would not have been as successful. We
would especially like to thank our advisors Professor Sakulich, Professor Rahbar, and Professor
Towner who helped us answer any questions and guided us in the right direction throughout the
project.
We would also like to thank Russ Lang for all the help in the Machine Shop Lab in
Kaven hall. The project would not have been possible without his assistance acquiring the
mixing materials.
Lastly we would like to thank Nasar Sharifi, Hajar Jafferji, and the faculty within the
Civil and Environmental Department who gave us assistance when needed throughout our entire
process.
11 | P a g e
Table of Contents Abstract ........................................................................................................................................... 2 Executive Summary ........................................................................................................................ 3 Authorship....................................................................................................................................... 7 Capstone Design Statement ............................................................................................................ 8
Economics ................................................................................................................................... 8 Sustainability............................................................................................................................... 8 Constructability ........................................................................................................................... 9 Ethics........................................................................................................................................... 9 Health and Safety ........................................................................................................................ 9
Capstone Licensure Statement ...................................................................................................... 10 Acknowledgments......................................................................................................................... 11 Table of Contents .......................................................................................................................... 12 Table of Figures ............................................................................................................................ 14 Table of Tables ............................................................................................................................. 15 1.0 Introduction ............................................................................................................................. 16 2.0 Background ............................................................................................................................. 18
2.1 Concrete in Construction .................................................................................................... 18 2.2 Concrete Mix Proportion Components ............................................................................... 20 2.3 Shells as a Concrete Component......................................................................................... 22 2.4 Scientific Testing ................................................................................................................ 25 2.5 Pricing ................................................................................................................................. 29
3.0 Methodology ........................................................................................................................... 31 3.1 Mix Proportion .................................................................................................................... 31 3.2 Mixing ................................................................................................................................. 33 3.3 Testing................................................................................................................................. 35 3.4 Three-Point Bend Test ........................................................................................................ 35 3.5 Compressive Test ................................................................................................................ 36 3.6 Split Tensile Test ................................................................................................................ 36 3.7 Shrinkage Test .................................................................................................................... 36 3.8 X-Ray Diffraction ............................................................................................................... 36
4.0 Results/Discussion .................................................................................................................. 38 4.1 Compressive Testing ........................................................................................................... 38 4.2 Split Tensile Testing ........................................................................................................... 40
12 | P a g e
4.3 Three Point-Bend Data: ...................................................................................................... 42 4.4 Shrinkage: ........................................................................................................................... 44
5.0 Managerial Analysis ............................................................................................................... 49 5.1 Introduction ......................................................................................................................... 49 5.2 State-of-the-Art ................................................................................................................... 50 5.3 Approach ............................................................................................................................. 53 5.4 Methods............................................................................................................................... 55
5.4.1 Design Decomposition of Concrete with Seashell Aggregate ..................................... 55 5.4.2 Development of the Financial Analysis ....................................................................... 56
5.5 Results ................................................................................................................................. 59 5.5.1 Design Decomposition ................................................................................................. 59 5.5.2 Design Matrix .............................................................................................................. 60 5.5.3 Interactions between Functional Requirements and Design Parameters ..................... 61 5.5.4 Financial Analysis ........................................................................................................ 62
5.6 Discussion ........................................................................................................................... 65 5.6.1 Axiomatic Design ........................................................................................................ 65 5.6.2 Financial Analysis ........................................................................................................ 66
5.7 Conclusion .......................................................................................................................... 67 6.0 Conclusions ............................................................................................................................. 69 Bibliography ................................................................................................................................. 71 Appendix ....................................................................................................................................... 74
Appendix A- Average strength (psi) for each mix sample on the three curing days ................ 74 Appendix B- Average tensile strength (psi) for each mix sample on three curing days .......... 74 Appendix C- Three-point bend averages .................................................................................. 75 Appendix D- Average shrinkage results throughout 2 weeks .................................................. 75 Appendix E- Calculations for design ........................................................................................ 76
13 | P a g e

Table of Figures Figure 1 (Hou, Zhou, and Zheng, 2003) ....................................................................................... 25 Figure 2 Material Property Characterization of Ultra-High Performance Concrete n.d.) ............ 26 Figure 3 (Machine Shop Split Cylinder, n.d.) ............................................................................... 27 Figure 4 (Three Point Flexural Test, n.d.) .................................................................................... 28 Figure 5 Shells being tamped to correct size and undergoing acid treatment .............................. 32 Figure 6 Materials being added to mixer ...................................................................................... 34 Figure 7 Rodding of cube samples................................................................................................ 35 Figure 8 Conch compressive test comparison graph .................................................................... 39 Figure 9 Oyster compressive test comparison graph .................................................................... 40 Figure 10 Tensile strength comparison graph ............................................................................... 41 Figure 11 Flexural stress of Mix 1-Mix 7 ..................................................................................... 42 Figure 12 Flexural strain of Mix 1 – Mix 7 .................................................................................. 43 Figure 13 Shrinkage over 2 week period ...................................................................................... 45 Figure 14 Control vs Mix 2 and 3 ................................................................................................. 47 Figure 15 Control vs Mix 4 and 5 ................................................................................................. 48 Figure 16 Control vs Mix 8 and 9 ................................................................................................. 48 Figure 17 Full hierarchy of the design decomposition ................................................................. 59 Figure 18 The Design Matrix ........................................................................................................ 60 Figure 19 Interactions within the Design Matrix .......................................................................... 61 Figure 20 Net Present Value Comparison .................................................................................... 64
14 | P a g e

Table of Tables Table 1 Differences in mix proportions ........................................................................................ 33 Table 2 Labeling system for each mix .......................................................................................... 38 Table 3 General Data and Cost ..................................................................................................... 62 Table 4 Waste Stream ................................................................................................................... 63 Table 5 Net Present Value and Inflation ....................................................................................... 64
15 | P a g e
1.0 Introduction
Every year the seafood industry produces over 100 million pounds (45.3 million kg) of
waste that is strictly from shellfish and crustaceans (Skaggs, n.d.). Much of the waste that is
generated from the industry is simply sent to landfills. With landfill space diminishing quickly,
ways to recycle materials are becoming more sought for. Many of the seashells like oysters and
conch shells are particularly interesting for recycling within the concrete and construction
industries. The chemical makeup of these shells demonstrates strength properties that will help
bind and strengthen concrete when added as aggregate. This chemical makeup is specifically
focused on the calcium carbonate (CaCO3), which makes up 95% of the shell (Yoon, 2002). If
the shell strength could be put to use instead of waste, then it would greatly diminish the seafood
industries impact on the environment, while simultaneously stimulating the construction
industry.
Due to the physical and chemical properties of conch and oyster shells, they may be a
suitable substitute for aggregates. The crushed shells would be beneficial to the waste industry
along with the construction industry. When the shells get crushed they can be substituted for all
different types of aggregates depending on the size of the specimen. Oyster shells are a viable
option because they contain a large amount of calcium carbonate (Kakisawa, H., & Sumitomo,
T., 2012). This can help improve the strength in the concrete. Also the calcium carbonate can
help improve resistance against heat and chemicals. The conch shells may increase strength in
the concrete due to the uniquely weaved pattern they contain. These two shells can benefit the
construction industry and the environment if it is successful.
The benefits to the construction industry and the environment could be groundbreaking.
The concrete production industry is estimated to be at $30 billion a year (About Concrete, 2013).
16 | P a g e
If the shells can save even a small amount of current materials, it would have a huge effect on the
industry. Once industry leaders find an alternative like this, it would not be difficult to market it
to them. The cost savings and positive environmental impact would sell the product itself. The
removal of discarded seashells from the waste stream entering landfills could provide significant
savings in the long run. The substitution of shells for aggregate in concrete mix proportions the
potential to lower costs and make the concrete industry more environmentally sustainable.
17 | P a g e

2.0 Background
Concrete is the most widely used construction material in the world. The Ancient
Egyptians and Romans are the earliest known users of concrete. The Roman Parthenon was built
in 432 BC and was found to contain concrete-like mixtures. The concrete-like mixtures were also
found in various mile long aqueducts (Crow, 2008). The basic design of concrete has remained
the same since its inception: water, aggregates, and cement. While the basic ingredients remain
the same, the materials that have comprised both cement and aggregates have been numerous.
Aggregate in particular is an area that is constantly being evaluated for better alternatives. The
construction industry is particularly susceptible to economic factors such as inflation and
stagnant growth that directly affect gross domestic product, making it vitally important to
maintain a robust business model that is able to weather economic downturns (Which Industries
are Sensitive to Business Cycles, n.d.).
2.1 Concrete in Construction With concrete being so ubiquitous in construction, finding ways to either improve its
properties or maintain them while managing to lower production costs would be extremely
beneficial and lucrative. Stone aggregate can be costly to acquire in locations that are far away
from adequate aggregate sources. Coastal communities and those nearby could greatly reduce the
distance they have to transport aggregate materials, reducing costs and their environmental
impact. In New Delhi, India, the price of a bag of sand is high due to a burgeoning population in
a country that is seeing a burst in economic development and public/private construction projects
(Which Industries are Sensitive to Business Cycles. n.d.).
Construction projects around the globe today rely heavily on the use of concrete. The
worldwide estimated consumption of concrete is 33 billion tonnes (36.4 billion short tons) per
18 | P a g e
year. This concrete is used for projects of all sizes, ranging from constructing dams to pedestrian
walkways. The basic components of concrete include water, cement paste, sand, rocks, and
various admixtures. The combination of these materials provides strong crystalline structures of
calcium-silicate-hydrate. The most common type of concrete used in construction is called
moderate-strength concrete with a compressive strength between 3000-6000 psi (20-40MPa).
Even though concrete is not the strongest or toughest material available, the human population
heavily relies on its production (Mehta and Monteiro, 2014).
The benefits of concrete compensate for its lower strength compared to these metals.
Concrete is used so abundantly in construction projects because of its relatively low cost, easy
supply of raw materials, long-term resistance to water erosion, and fire resistance. Because of the
limited water erosion, concrete is ideal for building dams and structures exposed to constant rain.
Another reason for the frequency of concrete usage is its moldable property. Concrete can be cast
into countless shapes and sizes depending on the design and mold. Newly made concrete is of a
liquid form where the shape and size can be altered. The most important factor why concrete is
used instead of other materials is cost. Concrete can cost as little as $60/yd3 ($78/m3), depending
on material and transportation costs. The materials required to make concrete are abundant
almost everywhere on earth. Portland cement is mostly composed of limestone powder mixed
with clay and burned in a kiln, which is cheap and readily available. Lastly, one of the most
important characteristics of concrete is that it is fire-resistant. Safety is crucial in building and
designing habitable structures and concrete provides a sturdy, fire-resistant material for
construction (Mehta and Monteiro, 2014).
One of the major flaws of concrete is its weakness in tension. Concrete is very strong
proportionally in compression, but weak in tension. An average compressive strength of
19 | P a g e

concrete, at 28 days of curing, is between 3000 and 6000 psi (20-40MPa) depending on the mix
proportion. The tensile strength for similarly batched concrete would lie between 300 and 700
psi (2.0-4.8MPa). Concrete is about ten times stronger in compression than it is in tension
(Concrete Properties, n.d.). In order to prevent tensile failure, steel bars can be inserted into the
mold of concrete to carry the tensile stresses. With this design, the concrete is not limited to its
tensile shortcoming. This design is called reinforced concrete.
2.2 Concrete Mix Proportion Components Each concrete mix proportion is created for specific, desirable properties. Mixing various
amounts of portland cement, water, sand, stones, and admixtures produces different samples with
altered characteristics. The two main reasons for testing mix proportions are cost and strength.
Even a 10-cent savings per ton of concrete on a 6 million cubic meter (7.8 million cubic yard)
job would save roughly 1 million dollars (Mehta and Monteiro, 2014). Each mix proportion is
calculated to meet a set of specifications relating to cost, strength, and the environment. Standard
mix proportions incorporate roughly 40% coarse aggregate, 30% fine aggregate, 15% water 10%
cement, and 5% admixtures. Concrete is tested to determine workability, strength, plastic air
content, permeability, and other characteristics (Concrete Properties and Mix Design, n.d.).
One of the easiest components of a concrete mix proportion to alter is the water to cement
ratio. The water-cement ratio is the relation between mass of water to mass of cement in a
concrete mix (Water-Cement Ratio, n.d.). The water-cement ratio is inversely proportional to the
strength of concrete. The smaller the ratio, the closer the cement particles are to each other, and a
stronger mixture. However, lowering the water-cement ratio strengthens the concrete until the
mixture becomes un-workable (Bentz and Aitcin, 2008).
20 | P a g e

Aggregates provide a cheaper substitution to cement paste in the concrete mix proportion.
The most common forms of aggregate are sand and stones. Replacing cement paste with sand
and stones provides added strength to the concrete while reducing the cost. Aggregates are
broken up into two different categories; coarse and fine aggregates. Coarse aggregates are
generally stones that range in diameters of 3/8” (0.95cm) to 1 ½” (3.81cm). Fine aggregates are
much smaller in diameter with the majority of particles passing through the 3/8” (0.95cm) sieve.
The stone and sand provide a surface for the cement past to adhere to, strengthening the overall
mixture (Concrete Materials, n.d.)
The remaining percentage of concrete is made up of admixtures. Admixtures are other
materials than cement paste, water, and aggregate added to the mixture to reduce costs or meet a
set of specifications. The majority of admixtures are supplied in liquid form and are added to the
mixture pre-casting. Admixtures are broken up into five main categories based upon their
intended function. These categories are: water-reducing, set retarding, accelerating,
superplasticizers, and corrosion-inhibiting admixtures. All of these admixtures are used to reduce
costs or improve the quality of the concrete for the job required (Concrete Materials, n.d.).
There have been a number of substances used to supplement concrete, the most
widespread being fly ash. Fly ash is the waste product created by burning coal. The consumption
of coal has continued to increase over the years and subsequently, so has the production of coal
ash. In 1992 alone, the amount of coal ash produced was four hundred sixty million metric tons
(Metric ton = 2200 lbs or 1000 kgs), around 10 % (roughly 46 million tonnes) was produced as
fly ash and by 1996, seven million metric tons was being used in concrete (Using Fly Ash in
Concrete, 2010, May 8). Aside from generally being more economical, fly ash can also provide
21 | P a g e
certain properties to the concrete such as less bleeding, higher sulfate and corrosion resistance,
and a lower threshold of water required for mixing (Fly Ash in Concrete, n.d.).
There are other commonly-used supplements to cement in concrete, such as blast furnace
slag, silica fume, limestone dust, cement kiln dust, and volcanic ash (Tassel, E. V. n.d.). Blast
furnace slag is comprised of silica and alumina compounds that combine with calcium. The slag
provides greater malleability, resistance to alkali, silica, and sulfate corrosion, and is less
expensive than typical cement.
Silica fume is waste generated by the industrial smelting process for silicon metals. Silica
fume is a fine powder that in low concentrations will make concrete more pliable. In large
concentrations, the effect is similar to fly ash in that pliability and permeability are decreased
while compressive strength and resistance to sulfate and alkali corrosion both increase.
Limestone, Cement kiln dust, volcanic ash, and other such substances all cause reduced CO2
emissions and reduce the amount of cement needed. They are also used to supplement concrete
and can result in a stronger concrete as well as a decrease in the concrete's permeability.
2.3 Shells as a Concrete Component Seashells are currently taking up a large volume in landfills. If they are used in concrete
mixes they will have a positive environmental impact. This is beneficial for the industry
especially since many admixtures like fly ash are scrutinized for their potential negative
environmental impact (Mcgraven, S. 2013). Shellfish shells can be considered into the aggregate
category. Instead of using stones and sand as aggregates, shellfish shells have potential to
provide the added strength required for many designs. The shells are a cheaper way to increase
the strength of concrete by providing a substance for the cement past to bond to. Shellfish shells
gain their strength from a nacre layer that has a crystalline structure in the form of calcium
22 | P a g e

carbonate. Replacing sand and stone with crushed shellfish shells could provide a recyclable way
to discard shell waste.
Shellfish shells have gained interest in studies revolving around recycled concrete
aggregate. The reason why shellfish shells and other seashells are part of this study is because
they are easily obtainable from the seafood industry and they have mechanical and chemical
properties that make them attractive to the construction industry. After preliminary research, the
shells that were chosen are, oyster and conch shells. Other shells that could have been used were
various types of mussel shells or clam shells. These were selected off of their physical properties
as well as their availability.
Oysters have high calcium carbonate content and also contain rare impurities that
improve strength as well. X-ray diffraction results shown in the “Yoon” study, show that the
shell is composed of 96% Calcium Carbonate (CaCO3). (Yoon, 2002) Calcium Carbonate is a
widely used filler in a number of applications as a polymer. Adding CaCO3 to polymer resins,
such as polyester coating materials, will act as a fire retardant and enhance product performance
against chemical and heat corrosion. Calcium Carbonate is also cost effective because it is so
readily available (Fillite Extendosphere, n.d.).
Oyster shells have been used throughout history to help aid in construction. Quicklime is
obtained from oyster shells when the CaCO3 in the shell is heated at an excess of 2000°F or
about 1100°C and converted to calcium oxide (CaO), otherwise known as lime. This lime is then
used in mortar mixtures and is called tabby. Tabby used in construction has been found
commonly in Muslim territories such as Cordoba and Seville in the 15th century for military
structures. Perhaps the most common tabby constructed buildings are 11th century British
23 | P a g e
Castles. For example the Wareham Castle, in Dorset, England was found in ruins, but was
excavated in the 1950s, revealing that tabby was used for much of the mortaring. (Yoon, 2002)
Current uses for oyster shells in commercial industries are limited. The state of Florida
has passed an act that 50% of all commercially harvested shells must be given to the state
government for use in reef reconstruction. Other common uses involve using crushed shells
(various types not only oyster shells) as driveway pavement material.
For construction purposes, oysters are a viable option because they are easy to acquire
and contain high amounts of CaCO3 in the shell’s nacre. Nacre, which is commonly called “the
mother of pearl”, is combined of platelets of CaCO3 within layers of an organic polymer matrix.
The combination of the platelets and organic matrix provides the strength of the shell (Kakisawa,
H., & Sumitomo, T. 2012). The shells are readily available, easily cleaned by a combination of
scrubbing and bleach, and can be crushed to our size requirements on site.
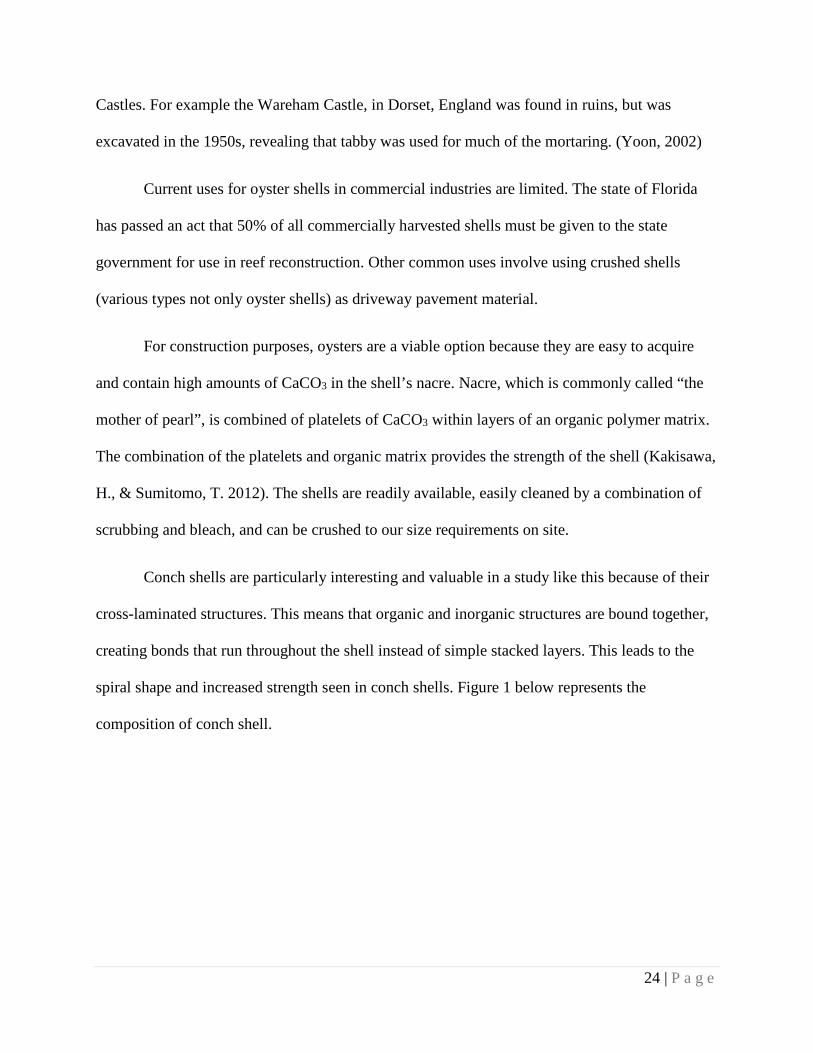
Conch shells are particularly interesting and valuable in a study like this because of their
cross-laminated structures. This means that organic and inorganic structures are bound together,
creating bonds that run throughout the shell instead of simple stacked layers. This leads to the
spiral shape and increased strength seen in conch shells. Figure 1 below represents the
composition of conch shell.
24 | P a g e
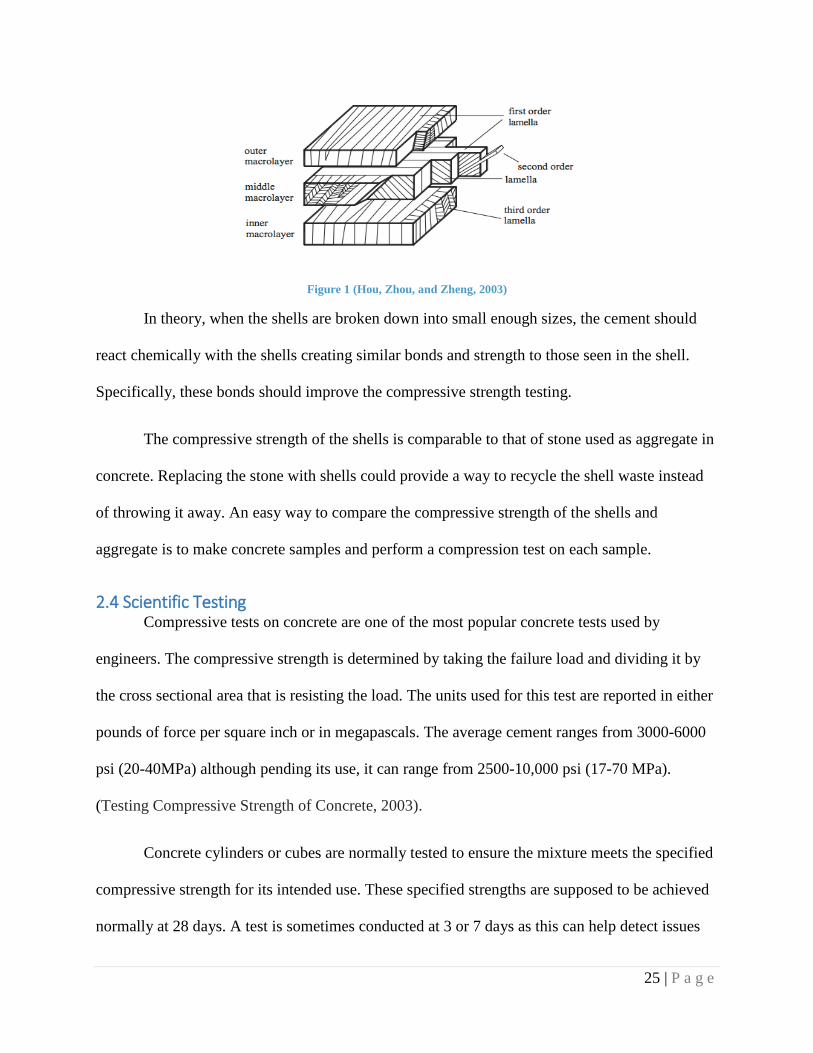
Figure 1 (Hou, Zhou, and Zheng, 2003)
In theory, when the shells are broken down into small enough sizes, the cement should
react chemically with the shells creating similar bonds and strength to those seen in the shell.
Specifically, these bonds should improve the compressive strength testing.
The compressive strength of the shells is comparable to that of stone used as aggregate in
concrete. Replacing the stone with shells could provide a way to recycle the shell waste instead
of throwing it away. An easy way to compare the compressive strength of the shells and
aggregate is to make concrete samples and perform a compression test on each sample.
2.4 Scientific Testing Compressive tests on concrete are one of the most popular concrete tests used by
engineers. The compressive strength is determined by taking the failure load and dividing it by
the cross sectional area that is resisting the load. The units used for this test are reported in either
pounds of force per square inch or in megapascals. The average cement ranges from 3000-6000
psi (20-40MPa) although pending its use, it can range from 2500-10,000 psi (17-70 MPa).
(Testing Compressive Strength of Concrete, 2003).
Concrete cylinders or cubes are normally tested to ensure the mixture meets the specified
compressive strength for its intended use. These specified strengths are supposed to be achieved
normally at 28 days. A test is sometimes conducted at 3 or 7 days as this can help detect issues
25 | P a g e
that may be due to testing procedures. These tests occur because structural engineers need to
design components of buildings, bridges, dams etc. to be strong enough to support everything
safely. Figure 2 below shows a standard cylinder and cube loaded in the compressive testing
machine.
Figure 2 Material Property Characterization of Ultra-High Performance Concrete n.d.)
The split tensile test is performed on a concrete cylinder to determine the specimen’s
tensile strength in an indirect way. Determining the tensile strength of concrete is very important
because concrete is susceptible to tensile cracking due to various loads being applied. This test
involves a concrete cylinder placed on its side, the depth of the cylinder is exposed to a
horizontal uniform tensile stress. Figure 3 shown below represents the split tensile test. The
tensile stress can be calculated by ft= (2P)/(πDL) (Tensile Test on Concrete, n.d.).
26 | P a g e

Figure 3 (Machine Shop Split Cylinder, n.d.)
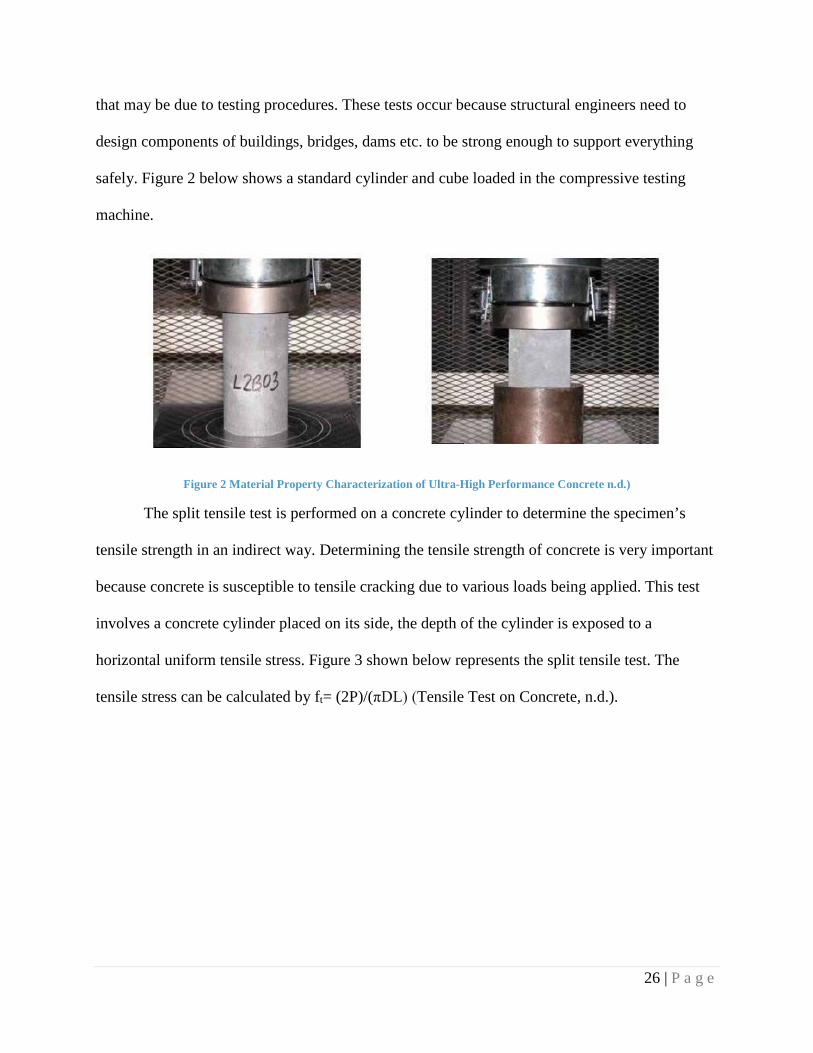
The three-point bend test determines the flexural strength of the concrete. Determining
the flexural strength is one way to determine the concretes tensile strength and is represented by
the modulus of rupture. This test is also expressed in either psi or MPa. The flexural strength of a
specimen is usually between 10-20% of the compressive strength. Flexural strength is often used
for the testing of pavements. It is not as popular as a compressive test because it is more difficult
to properly collect the specimen and test it due to the size of a beam compared to a cylinder.
When testing compressive strength of concrete, a flexural test is also done with the same batch of
concrete in order to get a correlation between the two for field control. The modulus of rupture
can be calculated as fbt= (PL)/(bd2) (Flexural Strength Concrete, 2000). Figure 4 below shows a
material bending inside the three point testing machine.
27 | P a g e
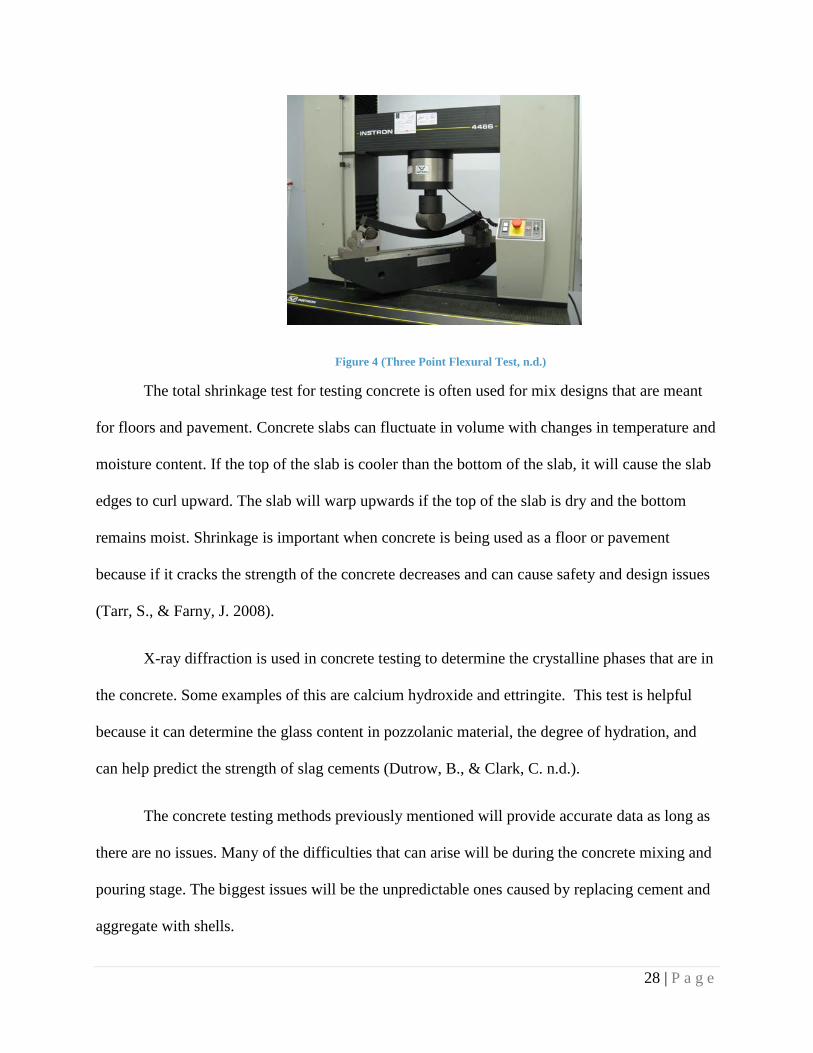
Figure 4 (Three Point Flexural Test, n.d.)
The total shrinkage test for testing concrete is often used for mix designs that are meant
for floors and pavement. Concrete slabs can fluctuate in volume with changes in temperature and
moisture content. If the top of the slab is cooler than the bottom of the slab, it will cause the slab
edges to curl upward. The slab will warp upwards if the top of the slab is dry and the bottom
remains moist. Shrinkage is important when concrete is being used as a floor or pavement
because if it cracks the strength of the concrete decreases and can cause safety and design issues
(Tarr, S., & Farny, J. 2008).
X-ray diffraction is used in concrete testing to determine the crystalline phases that are in
the concrete. Some examples of this are calcium hydroxide and ettringite. This test is helpful
because it can determine the glass content in pozzolanic material, the degree of hydration, and
can help predict the strength of slag cements (Dutrow, B., & Clark, C. n.d.).
The concrete testing methods previously mentioned will provide accurate data as long as
there are no issues. Many of the difficulties that can arise will be during the concrete mixing and
pouring stage. The biggest issues will be the unpredictable ones caused by replacing cement and
aggregate with shells.
28 | P a g e
2.5 Pricing The startup cost of manufacturing the concrete could prove to be a major problem for the
implementation of shells into concrete. The first cost that is present is material costs, if the shells
are not being obtained from either landfills or restaurants. Shells come in a large range of sizes
and strengths. Two of the stronger, more readily available shells that were used for the
experiments are oyster and conch shells. The average retail price for 10 pounds (4.53 kg) of pre-
crushed and cleaned oysters is $12.95 (Crushed), and for 10 pounds (4.53kg) of uncrushed conch
shells the price is $5.85 (Hawk-wing, n.d.).
Another associated cost with the shells would be the use of bleach to clean and sanitize
shells, as well as the purchase of an acid used to roughen the shells. Without proper cleaning, and
the use of an acid, the shells will not be appropriate for use in concrete. The acid is essential in
roughing the shells for cement and water to create a tighter bond. The bleach and acid costs are
relative to the overall sample size, but can be diluted down.
The next major cost of manufacturing would be the use of a ball mill. The cost of a
typical ball mill required for crushing shells ranges from $1500-$2400 (Ceramic, 2014). The use
of the ball mill is essential in generating a uniform shell particle size to be used in the concrete.
Generally, ball mills are currently used today in the production of cement, so the replacement of
material going into the ball mill should not cause much of an overall increase or change to the
usage cost. These are the major costs that may potentially cause a problem within the cement.
Finding a way to recycle oyster and conch shells can limit shell waste while providing a
way to reduce the cost of concrete and increase the longevity of landfills. The easiest way to
figure out if the shells are an acceptable replacement for cement or sand is through various
concrete testing procedures. Through this experimental process, the project team will analyze the
29 | P a g e

compressive and tensile stresses of standard concrete and concrete with shells. The project will
also include determining the shrinkage of the concrete mixtures, the flexural strengths, and the
chemical composition. Through these tests, the team will evaluate whether or not the
replacement of aggregate or cement with shells is acceptable and feasible.
30 | P a g e
3.0 Methodology 3.1 Mix Proportion
The first step in creating the concrete for testing was to determine the appropriate
concrete mixture proportion. The project’s mix proportion depended on the ability of the project
team to crush the shells into a powder. The conch shells arrived to the laboratory uncrushed and
intact. The Oyster shells arrived pre-crushed in sizes around 1 cubic cm (0.061 cubic inches).
The project team then manually crushed the shells until they were a useable size as seen
in Figure 5. A ball mill was originally going to be used, but a large enough ball mill was not
available. Manual crushing techniques were used to crush the shells to the desired size. The
shells were put on a 2” thick steel plate, and crushed using an 8” x 8” cast steel tamping tool, as
well as a sledgehammer. The shells were then sieved into the following sizes #8, #16, #30, #50,
#100. The bottom catch plate then caught the remnants, which turned to powder. The first mix
proportion only included water, sand, and cement at the water/cement ratio of 0.35. It was
concluded that this mix was too dry, therefore the control mix was redone using a 0.4 water to
cement ratio. The sand used in the control mixture was broken up by sieve sizes. 30% of the
required sand mass was #8 sized sieve; 25% was #16 sized sieve; 20% was #30; 15% was #50;
and 10% was #100.
31 | P a g e

Figure 5 Shells being tamped to correct size and undergoing acid treatment
After roughly 430 cubic inches (7047 cubic centimeters) of shells were crushed and
sieved, the mix proportions that included shells began. Four mixes were conducted for each type
of shell. The mixes included a certain percentage of shells substituted for the fine aggregate.
Each shell had two mix proportions that used the shells as a substitute for 10% of the fine
aggregate. On one of the two mixes, the shells were soaked in vinegar for 15 minutes in order to
increase shell roughness and bonding capability seen above in Figure 5. Each shell also had one
mix proportion that used the shells as a substitute for 25% of the fine aggregate. This mixture
used shells that were vinegar treated. The 6 mixes above included only shells that were smaller
than the #8 sieve, but larger than the #100 sieve. The final mix for each shell used any of the
shells that made it past the #100 sieve. This substance was a powder and was used as a substitute
for 5% of the cement. Reference Table 1 on the next page for the differences in mix proportions.
32 | P a g e

Table 1 Differences in mix proportions
Type of Shell % Used Material Shell Substituted For Vinegar Treated Control Mix N/A N/A No
Oyster 10% Fine Aggregate (SAND) No Conch 10% Fine Aggregate (SAND) No Oyster 10% Fine Aggregate (SAND) Yes Conch 10% Fine Aggregate (SAND) Yes Oyster 25% Fine Aggregate (SAND) Yes Conch 25% Fine Aggregate (SAND) Yes Oyster 5% Cement No Conch 5% Cement No
3.2 Mixing After the mix proportions had been determined, the required materials were obtained. The
oyster and conch shells were ordered online. The vinegar was obtained from a local grocery
store. The WPI Civil Engineering Department and the lab technicians provided the sand and
cement. Additionally, the mixing equipment was made accessible during the scheduled mixing
dates. The cylindrical, rectangular, and cubic molds were also available for use during the
scheduled mixing times.
The next step in creating the concrete samples was to combine the materials in the mixer.
Each concrete sample required 700 cubic inches (11471 cubic cm) of total mix to pour in the
molds. The cement, water, shells, and sand were massed into appropriate proportions. The base
mix used a combination by volume of 10% water, 28.57% cement, and 61.43% sand. The
cement, sand, and shells were placed into the mixer first. Water was then added into the mixer
and turned on for 5 minutes as seen in Figure 6 below. Following the complete duration of
mixing, the concrete was then poured from the mixer into a large bucket capable of holding the
entire mixture. A slump test was done for each mixture to ensure the concrete was workable.
33 | P a g e
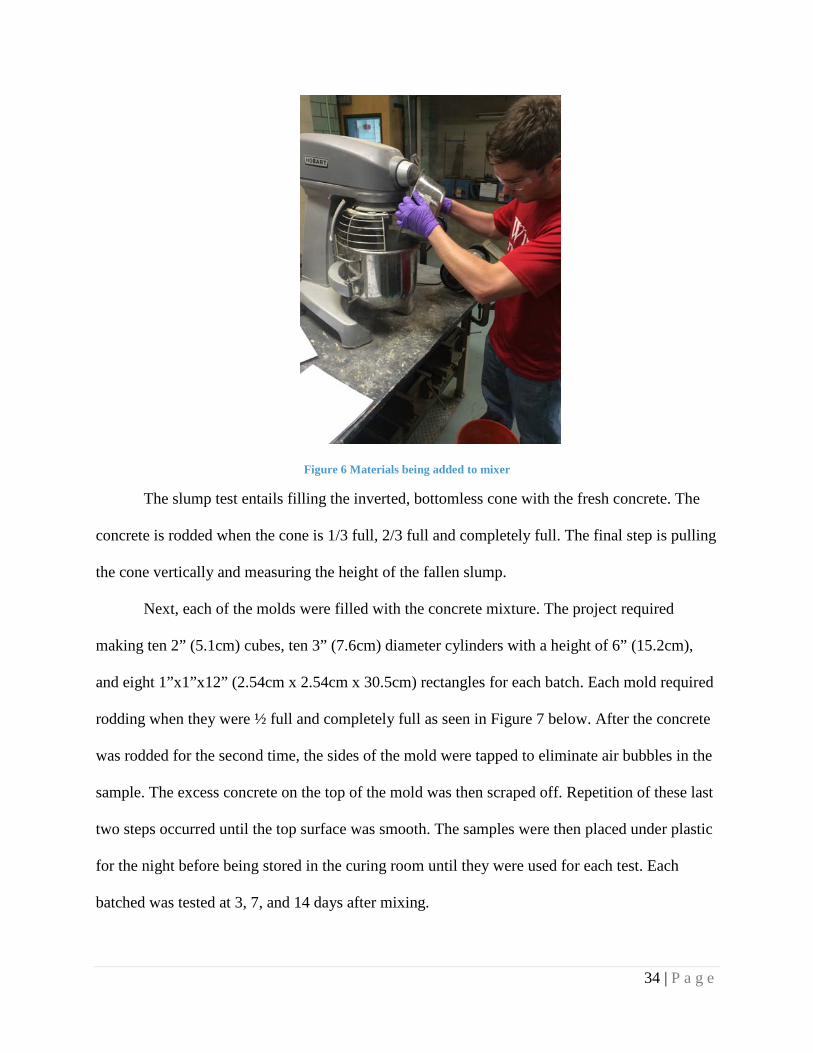
Figure 6 Materials being added to mixer
The slump test entails filling the inverted, bottomless cone with the fresh concrete. The
concrete is rodded when the cone is 1/3 full, 2/3 full and completely full. The final step is pulling
the cone vertically and measuring the height of the fallen slump.
Next, each of the molds were filled with the concrete mixture. The project required
making ten 2” (5.1cm) cubes, ten 3” (7.6cm) diameter cylinders with a height of 6” (15.2cm),
and eight 1”x1”x12” (2.54cm x 2.54cm x 30.5cm) rectangles for each batch. Each mold required
rodding when they were ½ full and completely full as seen in Figure 7 below. After the concrete
was rodded for the second time, the sides of the mold were tapped to eliminate air bubbles in the
sample. The excess concrete on the top of the mold was then scraped off. Repetition of these last
two steps occurred until the top surface was smooth. The samples were then placed under plastic
for the night before being stored in the curing room until they were used for each test. Each
batched was tested at 3, 7, and 14 days after mixing.
34 | P a g e
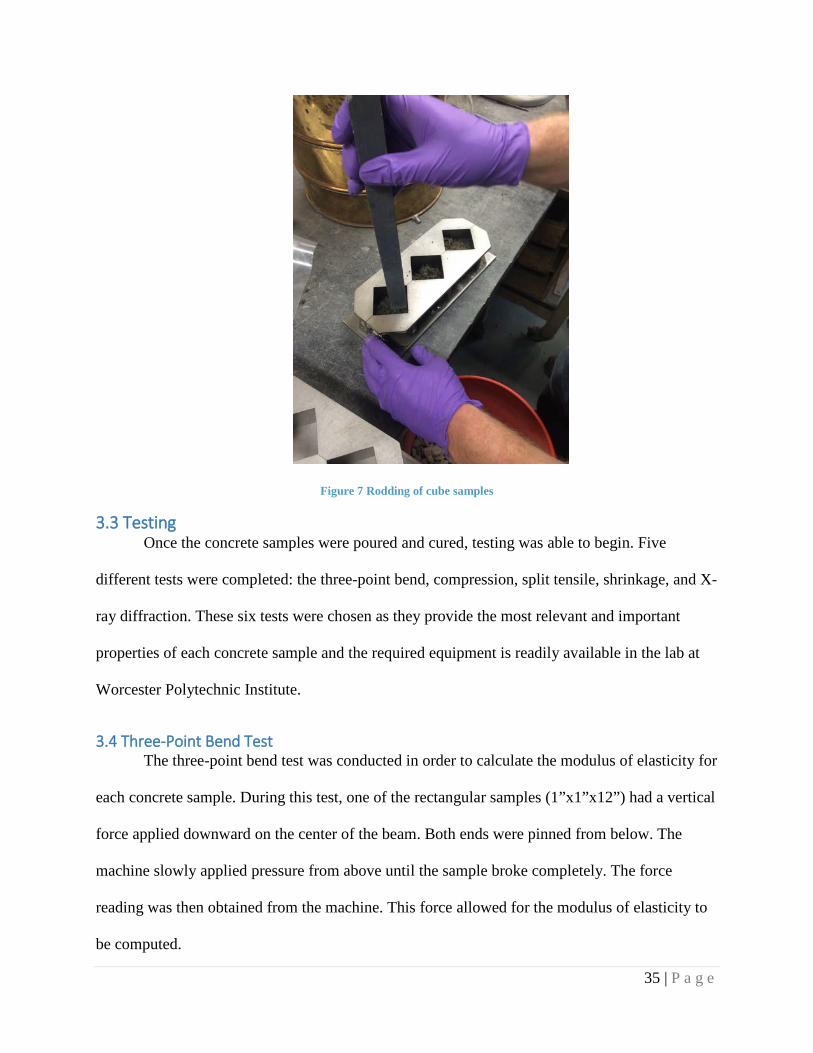
Figure 7 Rodding of cube samples
3.3 Testing Once the concrete samples were poured and cured, testing was able to begin. Five
different tests were completed: the three-point bend, compression, split tensile, shrinkage, and X-
ray diffraction. These six tests were chosen as they provide the most relevant and important
properties of each concrete sample and the required equipment is readily available in the lab at
Worcester Polytechnic Institute.
3.4 Three-Point Bend Test The three-point bend test was conducted in order to calculate the modulus of elasticity for
each concrete sample. During this test, one of the rectangular samples (1”x1”x12”) had a vertical
force applied downward on the center of the beam. Both ends were pinned from below. The
machine slowly applied pressure from above until the sample broke completely. The force
reading was then obtained from the machine. This force allowed for the modulus of elasticity to
be computed.
35 | P a g e
3.5 Compressive Test The compressive test was conducted in order to determine the compressive strength of
the samples. A cube sample was taken and placed in the compression machine. Cube samples
were used in order to have a flat and even surface on both the bottom and top of the sample, to
assure a uniform test. During this test, observations were be made, comparing the test samples to
the control samples. The compression machine applied a steadily increasing force throughout the
entire sample until the sample failed. Once the sample failed, a compressive strength value (fc)
value was shown that was used in various basic calculations for concrete structures.
3.6 Split Tensile Test In order to test the tensile strength of the concrete samples, cylindrical samples were used
in the split tensile test. The sample was put on its side with place a piece of wood on top and
underneath it. The sample was placed into the compression machine to test for tensile strength.
Since the cylinder was split down the middle, it separated in a tensile manner instead of a
compressive one. The wood provided a flat even surface on both sides of the cylinder to ensure
even pressure along the sample. Once the sample failed, the ft was calculated, which can be used
in many equations for concrete structures.
3.7 Shrinkage Test The shrinkage of the concrete samples was tested using a rectangular mold that has
screws in the mold to mark where the concrete started for each batch. Each day the amount of
movement that could be seen by the new length of the mold was observed and measured. The
data found was then graphed in order to display the overall shrinkage of the concrete.
3.8 X-Ray Diffraction A small piece from one of the already crushed samples was taken from each sample in
order to run an x-ray diffraction test. The test was done by taking the small piece of sample and
36 | P a g e

grinding it into a fine powder using a mortar and pestle. This powder was then loaded onto a
slide and placed into an x-ray diffraction test machine. The data from the test displayed the
chemical composition of the concrete. Once the various readings for the samples were displayed
by the x-ray machine on the computer they were saved and recorded. The results were matched
with their corresponding chemical compound based on the individual peaks displayed on the
graph and further analyzed from there.
37 | P a g e

4.0 Results/Discussion During the seven-week testing phase of this project, six concrete property assessments
were performed. These included compressive testing, split tensile testing, flexural testing,
shrinkage testing, x-ray diffraction, and microscopy. The data collected through these methods is
outlined below in this section. Table 2 below shows the labeling system used throughout the data
collection.
Table 2 Labeling system for each mix
Name Description
Mix 1: Base Mortar sample included cement, sand, and water
Mix 2: 10% Conch Replaced 10% of sand with crushed conch shells
Mix 3: 10% Oyster Replaced 10% of sand with crushed oyster shells
Mix 4: 10% V Conch Replaced 10% of sand with acid (vinegar) treated conch shells
Mix 5: 10% V Oyster Replaced 10% of sand with acid (vinegar) treated oyster shells
Mix 6: 25% V Conch Replaced 25% of sand with acid (vinegar) treated conch shells
Mix 7: 25% V Oyster Replaced 25% of sand with acid (vinegar) treated oyster shells
Mix 8: 5% Powder Conch Replaced 5% of the cement powder with conch shell powder (passed through #100 sieve)
Mix 9: 5% Powder Oyster Replaced 5% of the cement powder with oyster shell powder (passed through #100 sieve)
4.1 Compressive Testing The samples created for compression testing were 2”x2”x2” (5.08cm x 5.08cm x
5.08cm). All nine mixtures underwent compressive testing on 3, 7, and 14 day curing times. The
compressive strength values are based on the peak load over the area of the tested cube (4 in2).
At least three cubes were tested at each curing time. Appendix A represents the average strength
(psi) for each mix sample on the three curing days. Below in Figure 8 the compressive strengths
of all the conch shell and base mixtures (1, 2, 4, 6, and 8). The error bars at the top of each data
38 | P a g e
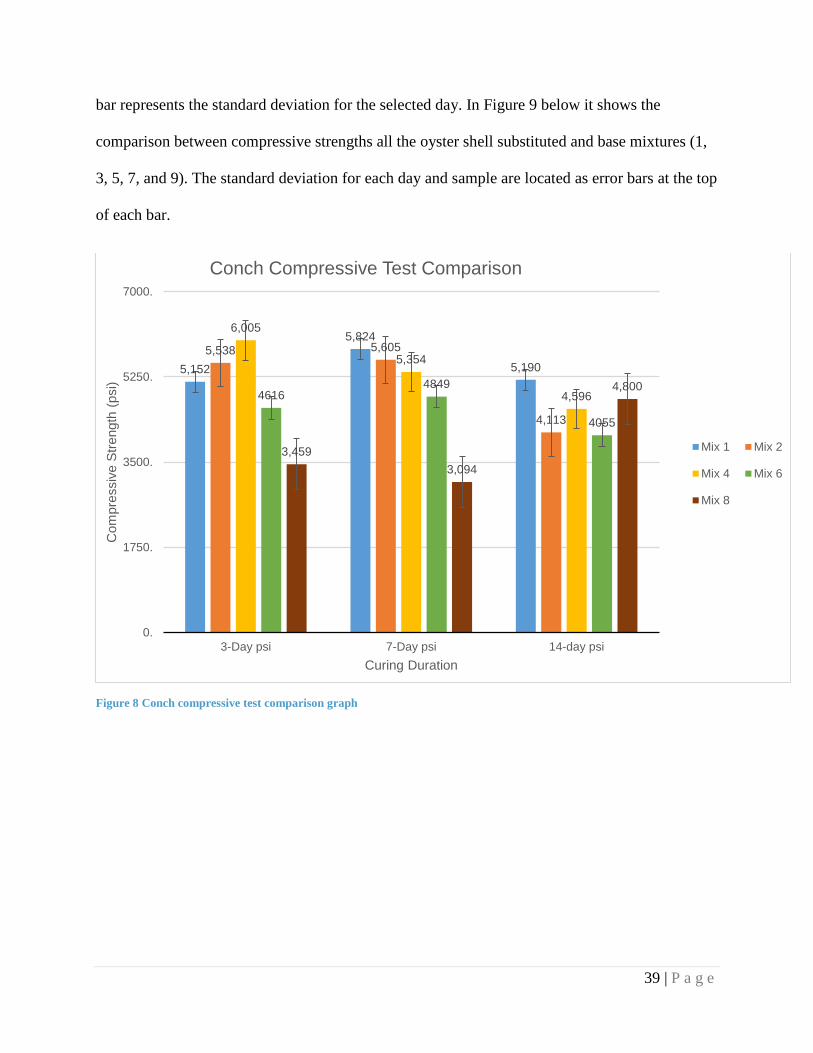
bar represents the standard deviation for the selected day. In Figure 9 below it shows the
comparison between compressive strengths all the oyster shell substituted and base mixtures (1,
3, 5, 7, and 9). The standard deviation for each day and sample are located as error bars at the top
of each bar.
Figure 8 Conch compressive test comparison graph
5,152
5,824
5,1905,538 5,605
4,113
6,005
5,354
4,59646164849
4055
3,4593,094
4,800
0.
1750.
3500.
5250.
7000.
3-Day psi 7-Day psi 14-day psi
Com
pres
sive
Stre
ngth
(psi
)
Curing Duration
Conch Compressive Test Comparison
Mix 1 Mix 2
Mix 4 Mix 6
Mix 8
39 | P a g e

Figure 9 Oyster compressive test comparison graph
4.2 Split Tensile Testing The split tensile samples consisted of cylinders with diameters of 3” (7.62cm) and heights
of 6” (15.24cm). Only the first seven mixtures were tested for tensile strength. The testing
obtained the load required to crack the concrete. This critical load, for most samples, was around
a deformation of 0.1in (0.25cm). The following equation was utilized to estimate the tensile
strength of each sample.
𝑆𝑆𝑆𝑆𝑆𝑆𝑆𝑆𝑆𝑆𝑆𝑆𝑆𝑆ℎ =2 ∗ 𝑃𝑃𝑃𝑃𝑆𝑆𝜋𝜋 ∗ ℎ ∗ 𝑑𝑑
Where:
Pcr= critical load (psi)
h= sample height (in)
d= sample diameter (in)
5,152
5,824
5,1905,236 5,124
4,5714,564 4,426 4,3474,107
4,569
5,565
3,680
3,199
4,639
0.
1750.
3500.
5250.
7000.
3-Day psi 7-Day psi 14-day psi
Com
pres
sive
Stre
ngth
(psi
)
Curing Duration
Oyster Compressive Test Comparison
Mix 1 Mix 3
Mix 5 Mix 7
Mix 9
40 | P a g e
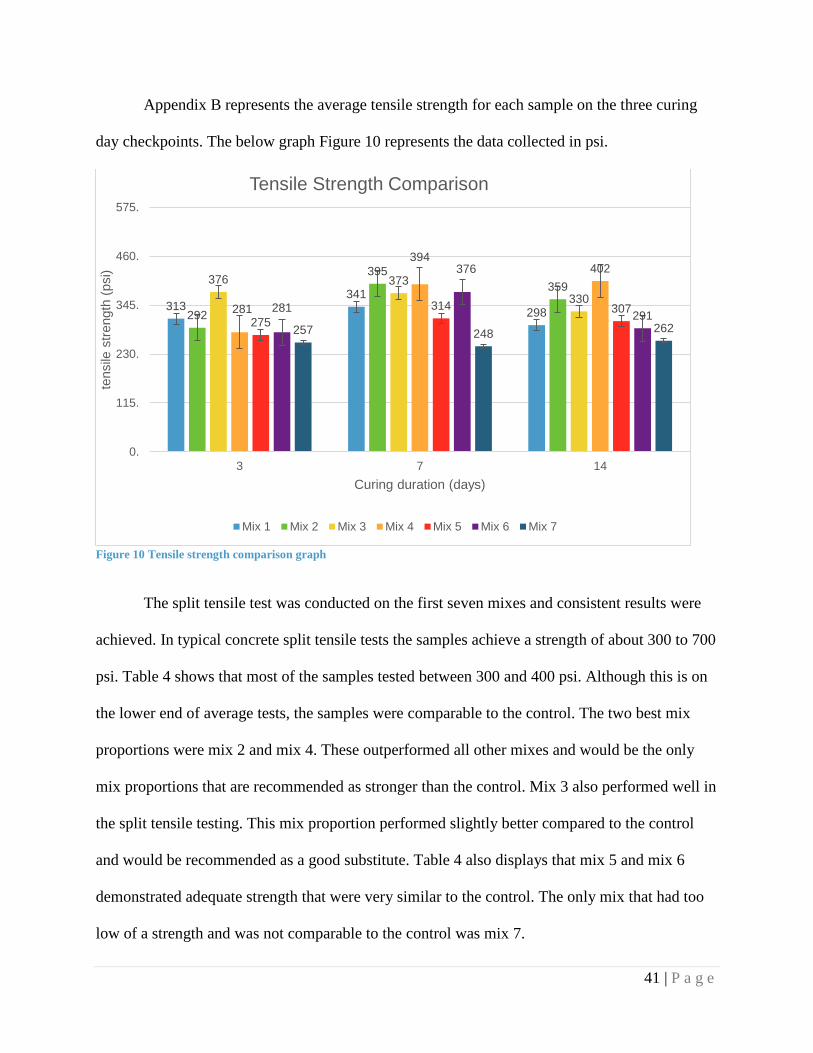
Appendix B represents the average tensile strength for each sample on the three curing
day checkpoints. The below graph Figure 10 represents the data collected in psi.
Figure 10 Tensile strength comparison graph
The split tensile test was conducted on the first seven mixes and consistent results were
achieved. In typical concrete split tensile tests the samples achieve a strength of about 300 to 700
psi. Table 4 shows that most of the samples tested between 300 and 400 psi. Although this is on
the lower end of average tests, the samples were comparable to the control. The two best mix
proportions were mix 2 and mix 4. These outperformed all other mixes and would be the only
mix proportions that are recommended as stronger than the control. Mix 3 also performed well in
the split tensile testing. This mix proportion performed slightly better compared to the control
and would be recommended as a good substitute. Table 4 also displays that mix 5 and mix 6
demonstrated adequate strength that were very similar to the control. The only mix that had too
low of a strength and was not comparable to the control was mix 7.
313341
298292
395359376 373
330281
394402
275314 307281
376
291257 248 262
0.
115.
230.
345.
460.
575.
3 7 14
tens
ile s
treng
th (p
si)
Curing duration (days)
Tensile Strength Comparison
Mix 1 Mix 2 Mix 3 Mix 4 Mix 5 Mix 6 Mix 7
41 | P a g e

The data above clearly displays that the vinegar had no significant effect on the samples,
which goes against our hypothesis. As predicted the conch shell was superior in testing
compared to the oyster shell most likely due to its superior mechanical properties. The data also
displayed that the replacement of 10% fine aggregate was more robust than the replacement of
25% fine aggregate.
4.3 Three Point-Bend Data
Figure 11 Flexural stress of Mix 1-Mix 7
The graph above in Figure 11 shows the flexural stress of the mix proportions calculated
of a three-point bend test using the formula 3FL/2bd2. The totals can be seen below in Appendix
C. It shows that the flexural stress of seashell enhanced concrete is actually stronger than that of
the control. Standard stress is between 400-700 psi (ASTM) while the control was around 892
0.
350.
700.
1050.
1400.
Flex
ura
l S
tres
s (P
SI)
Sample Number
3 Point Bend Flexural Stress
42 | P a g e

psi. The various seashell mixes all held an average over 1,000 psi. The data shows that all of the
mixes can be used in replacement of a flexural demanding concrete. Overall flexural strength is
able to increase by adding oysters or conch shells to the mix.
Figure 12 Flexural strain of Mix 1 – Mix 7
Figure 12 above shows the Flexural Strain of 3 samples from each mix. The data shows that
there is no conclusive result that can come from the shells being added to the mixture since the
values are scattered greatly throughout. The averages can be seen in Appendix C. The large error
bars show the large range of test results from the samples.
0.
0.0023
0.0045
0.0068
0.009
0.0113
Axis
Titl
e
Axis Title
3 Point Bend Flexural Strain
43 | P a g e

4.4 Shrinkage There are numerous forms of shrinkage that can impact the mechanical and physical
characteristics of concrete. Common forms of shrinkage are chemical, autogenous, and drying
shrinkage. Chemical shrinkage creates pores in the concrete without causing deformation.
Autogenous shrinkage occurs when the concrete pores become partially full due to self-
desiccation. This results in the surface tension of water pulling on the walls of the pores and
eventually causing shrinkage along with potential cracking. Which is a common concern in
concrete that has a low water to cement ratio. Unlike autogenous shrinkage, where the water
remains in the concrete, drying shrinkage is the result of water evaporating out of the concrete
product as the concrete sets.
In addition to the compressive, split tensile, and three point bend samples, three
1”X1”X12” samples were created and had their length measured over the course of a fourteen
day period. The overall shrinkage of the samples was being tested during this time as opposed to
testing for each of the various forms of potential shrinkage.
44 | P a g e

Figure 13 Shrinkage over 2 week period
As can be seen in Figure 13, the majority of test samples experienced greater shrinkage
than the control sample of regular mortar. The values can be seen below in the table in Appendix
D. The exception to being experiencing greater shrinkage then the control is mix 2. The mixture
containing untreated conch shell aggregate experienced 0.24mm less shrinkage than the control.
Mix 6 was the mixture containing conch powder and it experienced about the same level of
shrinkage as the control.
The untreated oyster aggregate mix, the vinegar treated conch aggregate mix, the vinegar
treated oyster aggregate mix, and the oyster powder mix, all experienced greater shrinkage than
the control. The three oyster mixes had greater shrinkage compared to the other mixes. The
oyster powder mix (Mix 7) had the greatest overall shrinkage, losing 1.05 mm more than the
untreated conch (Mix 2).
303.5
303.7
303.9
304.1
304.3
304.5
304.7
304.9
0 3 7 14
Leng
th (m
m)
Days
Shrinkage
Mix 1
Mix 2
Mix 3
Mix 4
Mix 5
Mix 6
Mix 7
45 | P a g e
Ultimately, each of the conch shell samples experienced less shrinkage than every one of
the oyster shell samples. While more testing is required, there are a few possibilities as to what
may have caused these results.
While crushing the shells, it was noted that the oyster shells were significantly easier to
break than the harder and more structurally sound conch shells. The oyster shell’s layers were
more apparent than the conch shells, but the conch layers appeared to have a stronger
connection. Once crushed, the oyster shells had more abrasive, powered edges while the conch
shells were smooth with sharp edges.
The generally smoother surface of the crushed conch shells may have allowed for less
absorption of water in the mixture, allowing for a lesser effect on the mixture’s water to cement
ratio. The crushed oyster shells could have had the opposite effect and lowered the mixture’s
water to cement ratio by a small degree.
The surface of the oyster shells may have allowed for the calcium carbonate to react
easier with the mixture, decreasing the overall aggregate size and allowing more of the volume to
be composed of cement paste. This resulted in greater potential for shrinkage, as opposed to the
conch shells that may have been less reactive due to smoother edges.
Ultimately, none of the mortar samples experienced more than about 0.3% shrinkage
relative to their original length. This is a manageable amount, especially with simple external
curing techniques to keep concrete from drying, reducing both autogenous shrinkage and drying
shrinkage.
46 | P a g e
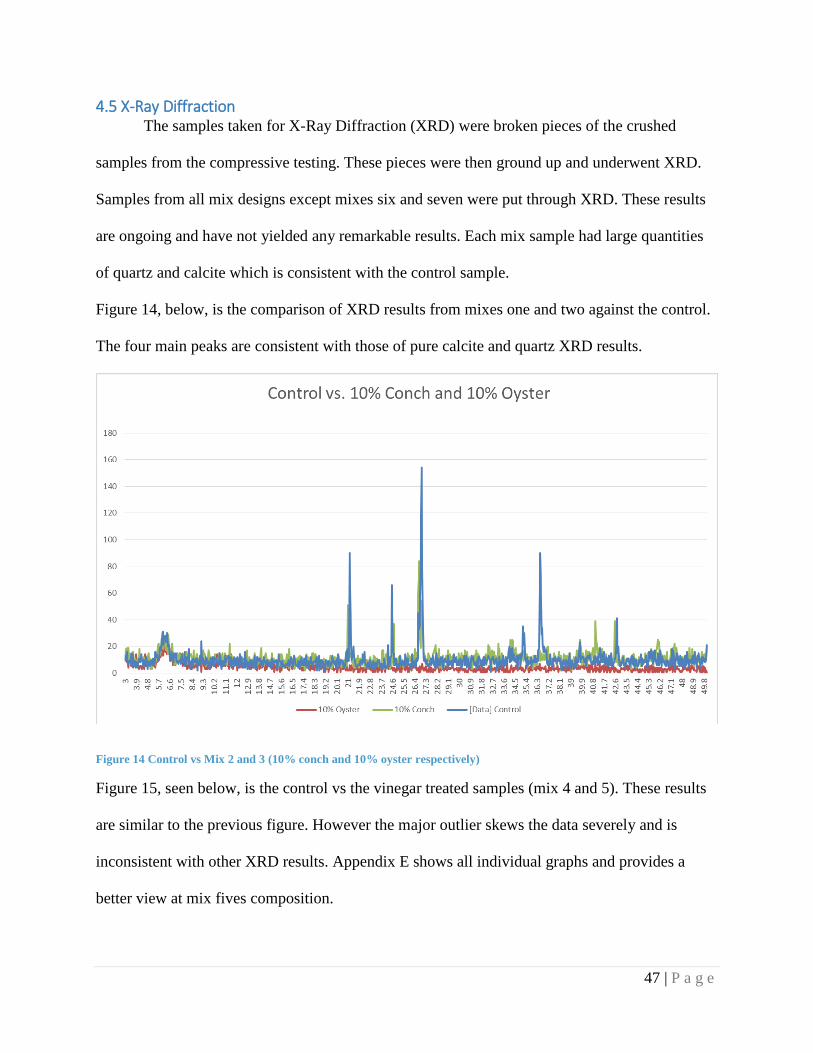
4.5 X-Ray Diffraction The samples taken for X-Ray Diffraction (XRD) were broken pieces of the crushed
samples from the compressive testing. These pieces were then ground up and underwent XRD.
Samples from all mix designs except mixes six and seven were put through XRD. These results
are ongoing and have not yielded any remarkable results. Each mix sample had large quantities
of quartz and calcite which is consistent with the control sample.
Figure 14, below, is the comparison of XRD results from mixes one and two against the control.
The four main peaks are consistent with those of pure calcite and quartz XRD results.
Figure 14 Control vs Mix 2 and 3 (10% conch and 10% oyster respectively)
Figure 15, seen below, is the control vs the vinegar treated samples (mix 4 and 5). These results
are similar to the previous figure. However the major outlier skews the data severely and is
inconsistent with other XRD results. Appendix E shows all individual graphs and provides a
better view at mix fives composition.
47 | P a g e
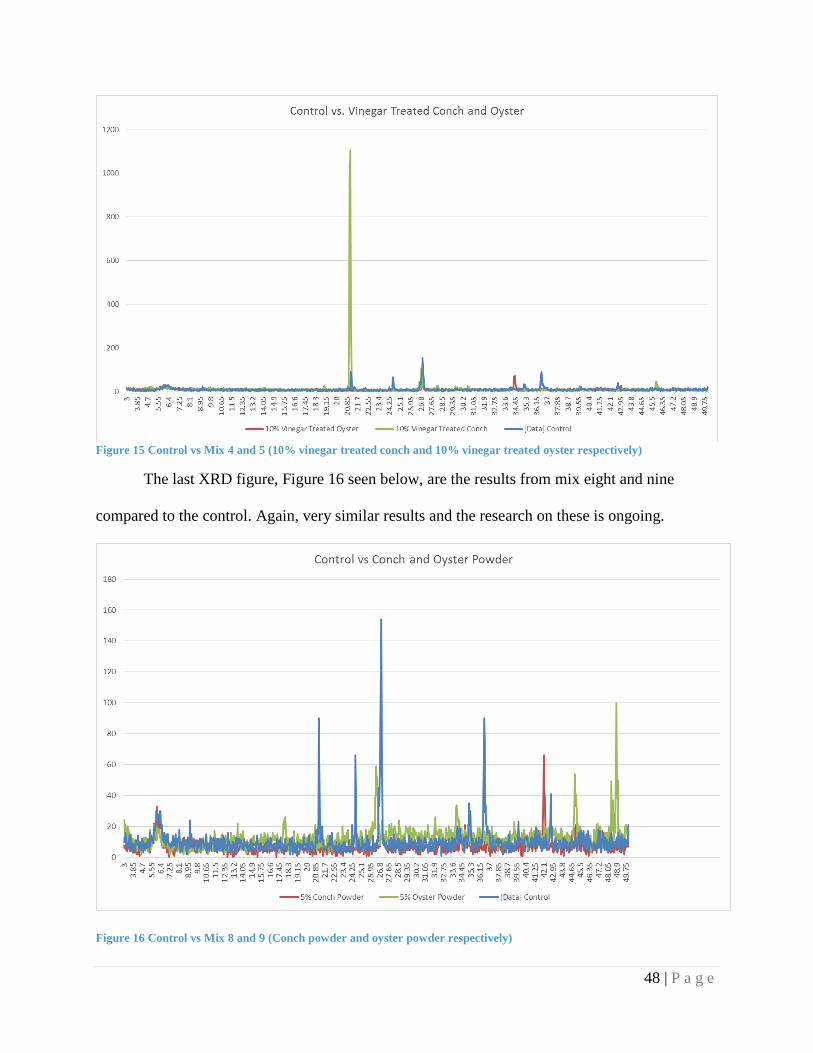
Figure 15 Control vs Mix 4 and 5 (10% vinegar treated conch and 10% vinegar treated oyster respectively)
The last XRD figure, Figure 16 seen below, are the results from mix eight and nine
compared to the control. Again, very similar results and the research on these is ongoing.
Figure 16 Control vs Mix 8 and 9 (Conch powder and oyster powder respectively)
48 | P a g e

5.0 Managerial Analysis
5.1 Introduction
This chapter will examine the economic benefit to local communities derived from the
use of seashell waste in concrete. Once the concept of using concrete supplemented with
seashells as a both means of reducing the load on the waste stream of landfills and creating les
expensive concrete is established, it should be easy for businesses to adopt it.
No special equipment is required to utilize seashells for use as an aggregate or
supplementary cementious material, seashells can be ground with the same machinery as
ordinary stone. If any business decides to use the diluted acid treatment for the aggregate that
was also tested, the seashells are easily soaked and then rinsed with ordinary water. Additionally,
any operation of a profitable scale will entail working with the managers of local landfills and
restaurants to collect seashells before they are disposed of in landfills, allowing for minimal costs
even with cleaning.
For these reasons, examining the cost of the seashell aggregate would provide little
additional information beyond confirming the economic benefit to companies using seashell
waste. Instead, the analysis focuses on the benefits provided to the local community and why it is
in their best interests to cooperate with and incentivize businesses seeking to utilize seashell
waste, which will prolong the usable lifespan of landfills, many of which are publically owned.
Along with the financial analysis, Suh’s axiomatic design method was used to analyze the
process of removing the seashells from the waste stream by disposing of them in the seashell
concrete and then using said concrete in local seaside projects.
49 | P a g e
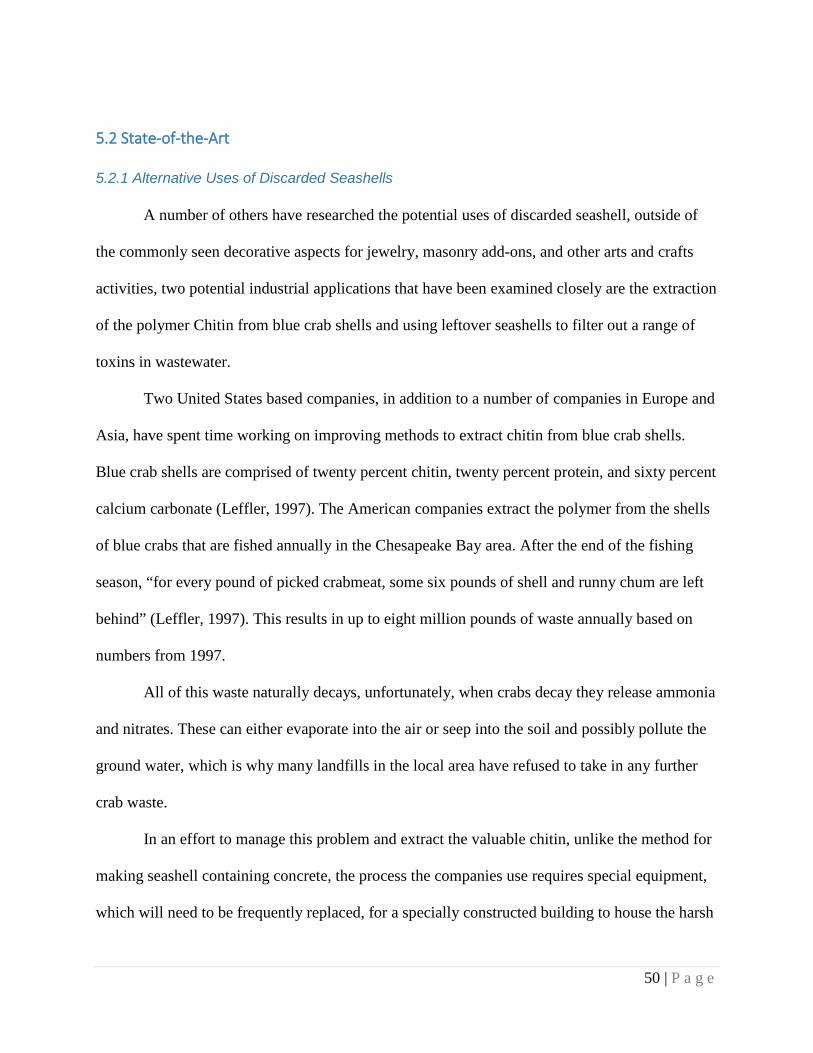
5.2 State-of-the-Art 5.2.1 Alternative Uses of Discarded Seashells
A number of others have researched the potential uses of discarded seashell, outside of
the commonly seen decorative aspects for jewelry, masonry add-ons, and other arts and crafts
activities, two potential industrial applications that have been examined closely are the extraction
of the polymer Chitin from blue crab shells and using leftover seashells to filter out a range of
toxins in wastewater.
Two United States based companies, in addition to a number of companies in Europe and
Asia, have spent time working on improving methods to extract chitin from blue crab shells.
Blue crab shells are comprised of twenty percent chitin, twenty percent protein, and sixty percent
calcium carbonate (Leffler, 1997). The American companies extract the polymer from the shells
of blue crabs that are fished annually in the Chesapeake Bay area. After the end of the fishing
season, “for every pound of picked crabmeat, some six pounds of shell and runny chum are left
behind” (Leffler, 1997). This results in up to eight million pounds of waste annually based on
numbers from 1997.
All of this waste naturally decays, unfortunately, when crabs decay they release ammonia
and nitrates. These can either evaporate into the air or seep into the soil and possibly pollute the
ground water, which is why many landfills in the local area have refused to take in any further
crab waste.
In an effort to manage this problem and extract the valuable chitin, unlike the method for
making seashell containing concrete, the process the companies use requires special equipment,
which will need to be frequently replaced, for a specially constructed building to house the harsh
50 | P a g e

acid and base treatments required to separate the chitin from the crab shells. The procedure
required drastically raises costs for any attempt at a full scale operating plant, in addition to
possessing the potential for extreme environmental damage if not carefully monitored and
controlled.
The chitin itself is a naturally occurring polymer that the companies modify to produce
the highly versatile product known as chitosan, which is used in a wide array of products, “from
medical sutures and seed coatings to dietary supplements and coagulants for waste treatment”
(Leffler, 1997).
Along with harvesting blue crab shells for chitin, another use for discarded seashells that
has been researched is to convert the seashell waste into a natural wastewater filter system. The
traditional design for wastewater treatment systems has been to divide the process into three
distinct processes. First, any solids and oils are removed. Next, the water is filtered and then the
biological waste from food waste, soaps and detergents, and human excrement is degraded.
Then, a tertiary treatment is applied to further clean and improve the quality of the water before
it is released, further removing substances such as hormones, fertilizers, and pharmaceuticals.
This process is called ‘polishing.’ (Edie News, 2013)
The researchers at Bath University’s department of Chemical Engineering examined
waste mussel shells and were able to extract hydroxyapatite, a material commonly found in teeth
and bones. Hydroxyapatite can be used to replace titanium dioxide which is used in
photocatalysis, one of the more effective tertiary methods. Hydroxyapatite is significantly
cheaper than titanium dioxide and just as effective. In addition, the calcium within the seashells
can be used to produce the substance calcium oxide, more commonly known as lime, which
51 | P a g e

possesses a plethora of uses, such as cleaning blast furnaces, cleaning smoke stacks and
landscaping.
5.2.2 Axiomatic Design Overview
Axiomatic design was developed by Massachusetts Institute of Technology professor, Dr.
Nam Suh (Suh, 1990). The methodology divides design activity into four domains, the customer
domain, the functional domain, the physical domain, and the design domain. The customer
domain is comprised of the customer’s requirements. The functional domain contains the
functional requirements of the design, the needs of the customer are addressed. The physical
domain contains the design parameters of the system, which address how to implement the
functional requirements. The process domain contains the process variables (Axiomatic Design
Solutions, Inc., n.d.).
Axiomatic design consists of two axioms, first, the independence axiom and second, the
information axiom (Axiomatic Design Solutions, Inc., n.d.). In a proper axiomatic design, the
independence of the functional requirements of the design must be preserved, each functional
requirement should have a corresponding design parameter that ideally would affect only that
functional requirement, to avoid coupling.
Additionally, the information content of the design should be minimized, the design
should be kept as simple as possible with any unnecessary information removed. Each of the
lower functional requirements should be able to be combined to complete their parent functional
requirement.
5.2.3 Axiomatic Design Manufacturing Principles and Civil Engineering Applications
52 | P a g e

It has been suggested that there are two top level functional requirements (FRs) for the
decomposition of any manufacturing process or system. One FR is to maximize the value-added
to the product. A second FR is to minimize costs in the production process. It has been proposed
that these requirements can be the foundation of manufacturing science itself (Brown, 2011b).
While there is no literature that contains a designed concrete manufacturing process
directly based upon the two aforementioned functional requirements, there was a group of South
Korean researchers that recently sought to apply axiomatic design principles to the development
of porous concrete (Tran, Tawie, & Lee, 2009). The civil engineers created a framework that can
be applied to porous concrete in order to demonstrate the robustness of Suh’s axiomatic design
method when applied to civil engineering laboratory research.
5.3 Approach The approach used to solve the problem of removing discarded seashells from the waste
stream to reduce the burden on landfills makes use of Suh’s axiomatic design method, followed
by a financial analysis of the potential cost savings to local seaside communities.
The axiomatic design decomposition shows two top level functional requirements. The
first is that the seashells be used locally, near the source of production, in order to reduce waste.
The second is that the recovered seashells be used to replace either cement or aggregate,
depending on the mix proportion, without compromising the characteristics of the regular
concrete product.
The lower level functional requirements of both of the decomposition’s top level
functional requirements incorporate elements of the proposed functional requirements for
manufacturing systems.
53 | P a g e

The lower level requirements of the second top level requirement, to replace the
aggregate or cement with seashells without compromising the characteristics of the concrete,
emphasize the importance of maintaining, or in some instances adding value by improving, the
desired characteristics of the product while minimizing the costs of manufacturing the seashell
containing concrete.
Additionally, the lower level children of FR1, to use the seashell waste locally, seek to
minimize the cost of the system using the seashell concrete product in the local areas that will
benefit most by not having to ship aggregates or use expensive portland cement.
The financial analysis examined the benefits that would be provided to local communities
by preventing seashell waste from entering landfills. Less waste entering the landfill results in
longer lasting landfills, improving their value as an investment and pushing back the time until
the next landfill must be constructed.
For the purpose of the financial analysis, a single landfill was examined in relation to its
capacity, total annual waste stream, estimated annual waste stream attributable to seashells, the
average annual inflation over the lifespan of the landfill.
54 | P a g e

5.4 Methods
5.4.1 Design Decomposition of Concrete with Seashell Aggregate
The top level functional requirement (FR0) is a statement of the problem to be solved,
which is the reduction of the amount of sea shells entering the waste stream in order to reduce
the load on coastal landfills. In order to accomplish this task, the aggregate or cement, depending
upon the mix proportion, needs to have a portion replaced with sea shells. To successfully
combine seashell waste into the concrete a number of factors must be addressed.
Most important for the viability of the product, the engineering and other characteristics
of the “shell-concrete” product must not be compromised. In addition of to the physical
characteristics, the durability, shrinkage, and economic feasibility must closely match the
original concrete product (FR1).
Due to the fact that the shell waste will be significantly cheaper to use than Portland
cement or sand, improving the economic feasibility (FR1.4) of the concrete is simply a matter of
replacing the cement (FR1.4.1) and non-shell fine aggregates (FR1.4.2) with the crushed sea
shells.
An important factor in the longevity of concrete is managing shrinkage, which can result
in severe cracking if left unchecked (FR1.3). Fortunately, preventing cracking is as simple as
preventing water loss (FR1.3.1). Aside from shrinkage, the durability of the concrete must be
preserved (FR1.2), the addition of the shells cannot result in decreased resistance to common
possible reactions from sulfates (FR1.2.1) and alkali-silica corrosion (FR1.2.2).
55 | P a g e

The most essential of qualities of the concrete to be preserved are the physical properties
such as workability, strength, and appearance (FR1.1). While these are distinct qualities, they
are not independent of one another and are ultimately affected by the mix proportion. The right
proportions of aggregate (FR1.1.1), both fine (FR1.1.1.1) and coarse (FR1.1.1.2), for the desired
concrete characteristics must be used. The mix proportion must also take into account the right
proportion of cement paste (FR1.1.2) and further, the proportioning of water (FR1.1.2.1) and
cement (FR1.1.2.2), to use for the desired physical characteristics of the concrete product. To
properly control the physical qualities of the concrete, the ingredients must also be properly
mixed (FR1.1.3). This includes mixing the concrete ingredients for the right amount of time
(FR1.1.3.1) at the right speed (FR1.1.3.2).
In order to maximize the utility of this concrete solution, any use of the shells should be
geographically local to the area in which they were disposed (FR2). Once the shells have been
diverted from nearby landfills (FR2.1), the shell containing concrete should be used in local
fishing communities or nearby areas (FR2.2). The only interaction present in the design matrix
occurs at the highest level of the decomposition due to the necessity for producing
uncompromised concrete in order to reduce the waste of communities where the shells are
disposed, if the concrete being produced is of low quality, consumers will have no interest in
using it and waste will remain unutilized.
5.4.2 Development of the Financial Analysis
A financial analysis of the benefits to local communities that were to enact a program
diverting sea shells from landfills for use in concrete was conducted. Specifically, the financial
56 | P a g e
benefits that would result from the decreased load on the waste stream of a typical landfill, with a
lifespan of twenty years, was examined.
Due to the lack of complete sets of financial, dimensional, and waste stream composition
data available from landfills and the absence of the cumulative data from a single landfill. It was
necessary to collect data from different sources to create an approximation for each field.
In terms of the waste stream composition, the percentage of waste composed of shells
comes from landfills in Orange County, North Carolina and only counts oyster shells, meaning
the number is conservative, though the only figure publically available (Orange County Solid
Waste Management Department, 2015).
The landfill usability lifespan, total construction cost, and disposal site size come from
the closed North Wake County landfill, also located in North Carolina. (Freudenrich, n.d.)
The capping (closing) costs for closed landfills come from Maryland (Solid Waste
Compliance Division), the average cost was assumed, though the capping cost is not included in
the calculations themselves due to the fact that the amount of sea shell waste in the landfill does
not affect the capping costs.
Monthly operating costs and revenues have not been included in the calculation as the
only landfill that was found to have released full financial records is the Gloucester County
landfill in New Jersey, which is run as a nonprofit and has maintained a balanced budget (New
Jersey Department of Community Affairs, 2014).
57 | P a g e
The "lined capacity" refers to the capacity of the lined (70 acre) landfill in the North
Wake County landfill, there are technically three on the site, one 70 acres, one 6 acres, and
another 33 acres, for a total of 109 acres used for landfills (Wake County Solid Waste
Management Division). The lined landfill is the area the shell waste would have to be disposed
in due to environmental concerns that can arise in from the decomposition of some shells, such
as those of blue crabs (Leffler, 1997) (Freudenrich, n.d.).
A net present value analysis, FV = PV (1+r)n (I. Fischer 1907, 1930, 1974),was
completed based on the premise that the longer the landfill lasts, the more money the community
has saved by not having to construct another landfill until the end of the current landfill’s
operation. The inflation rate between the years 1993 and 2013 were averaged to determine an
appropriate inflation rate (Phillips, 2014) over the life of the landfill.
58 | P a g e
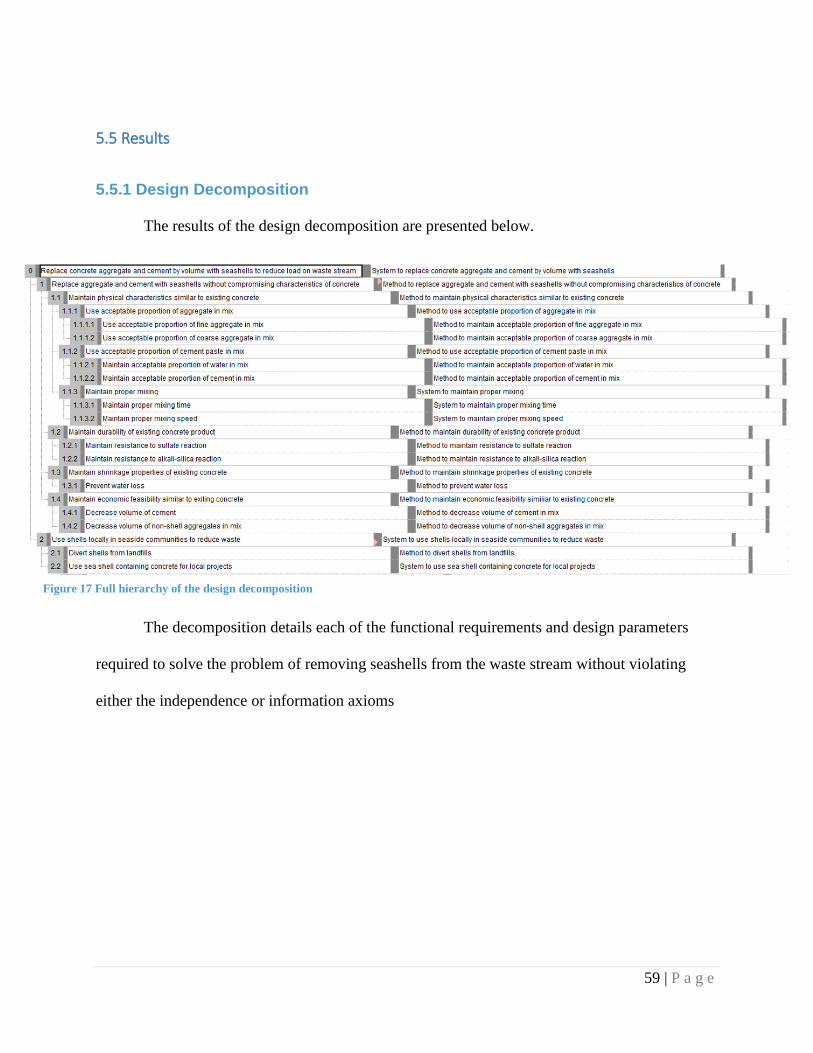
Figure 17 Full hierarchy of the design decomposition
5.5 Results
5.5.1 Design Decomposition The results of the design decomposition are presented below.
The decomposition details each of the functional requirements and design parameters
required to solve the problem of removing seashells from the waste stream without violating
either the independence or information axioms
59 | P a g e

5.5.2 Design Matrix The design matrix is presented below, each of the functional requirements and design
parameters can be viewed in figure 14.
Figure 18 The Design Matrix
60 | P a g e

Figure 19 Interactions within the Design Matrix
5.5.3 Interactions between Functional Requirements and Design Parameters
As can be seen in figure 16, the design matrix does contain an interaction
between the second functional requirement relating to using seashells
locally in seaside communities to reduce waste and the first design
parameter, system to replace either the aggregate or cement with seashells without
compromising the characteristics of the concrete product.
The interaction is due to the inherent necessity that the seashell containing
concrete product retain its desirable characteristics otherwise any attempt to use
the seashells locally will ultimately fail and the local communities will be left
with more waste than they started.
61 | P a g e
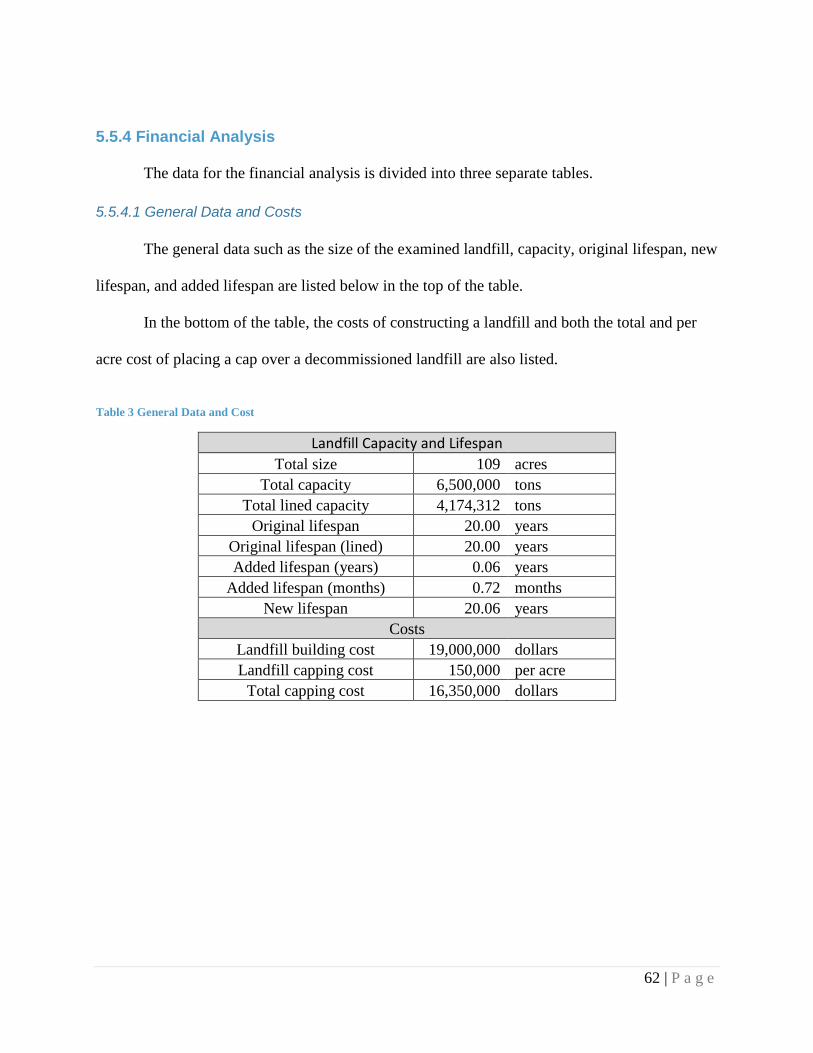
5.5.4 Financial Analysis
The data for the financial analysis is divided into three separate tables.
5.5.4.1 General Data and Costs The general data such as the size of the examined landfill, capacity, original lifespan, new
lifespan, and added lifespan are listed below in the top of the table.
In the bottom of the table, the costs of constructing a landfill and both the total and per
acre cost of placing a cap over a decommissioned landfill are also listed.
Table 3 General Data and Cost
Landfill Capacity and Lifespan Total size 109 acres
Total capacity 6,500,000 tons Total lined capacity 4,174,312 tons
Original lifespan 20.00 years Original lifespan (lined) 20.00 years Added lifespan (years) 0.06 years
Added lifespan (months) 0.72 months New lifespan 20.06 years
Costs Landfill building cost 19,000,000 dollars Landfill capping cost 150,000 per acre
Total capping cost 16,350,000 dollars
62 | P a g e

5.5.4.2 Waste Stream Data
The data for both the total and annual waste streams are listed below for both the total
waste stream and the individual seashell stream itself.
Table 4 Waste Stream
Yearly Waste Stream % of total tons Shells 0.30% 626 Total lined 64.22% 208,716 Total 100.00% 325,000
Total Waste Stream % of total tons Shells 0.30% 12,523 Total lined 64.22% 4,174,312 Total 100.00% 6,500,000
The lined capacity refers to the specific landfill of the site that would accept seashell
waste. The bottom of the landfill is lined to prevent contamination of the underlying earth and
groundwater.
63 | P a g e

5.5.4.3 Net Present Value and Interest Rate Data
The annual inflation rates between 1993 and 2013 are included and averaged down
below. Additionally, the net present value analysis results for both the original landfill and the
landfill after the seashells are diverted for use in the concrete are listed along with the total value
added below. The same net present value information is also showing in the graph below on the
hand side.
Net Present Value Original $31,296,110 New $31,343,142 Added value $47,032
Inflation Year Rate 1993 0.025 1994 0.028 1995 0.027 1996 0.03 1997 0.016 1998 0.017 1999 0.027 2000 0.037 2001 0.011 2002 0.026 2003 0.019 2004 0.03 2005 0.04 2006 0.021 2007 0.043 2008 0.03 2009 0.0263 2010 0.0163 2011 0.0293 2012 0.0159 2013 0.0158
Average 0.03
Table 5 Net Present Value and Inflation
31,000,000
31,050,000
31,100,000
31,150,000
31,200,000
31,250,000
31,300,000
31,350,000
31,400,000
Net Present Value
Value Added through Increased Landfill Longevity
Original New
Figure 20 Net Present Value Comparison
Table 5 Net Present Value and Inflation
64 | P a g e
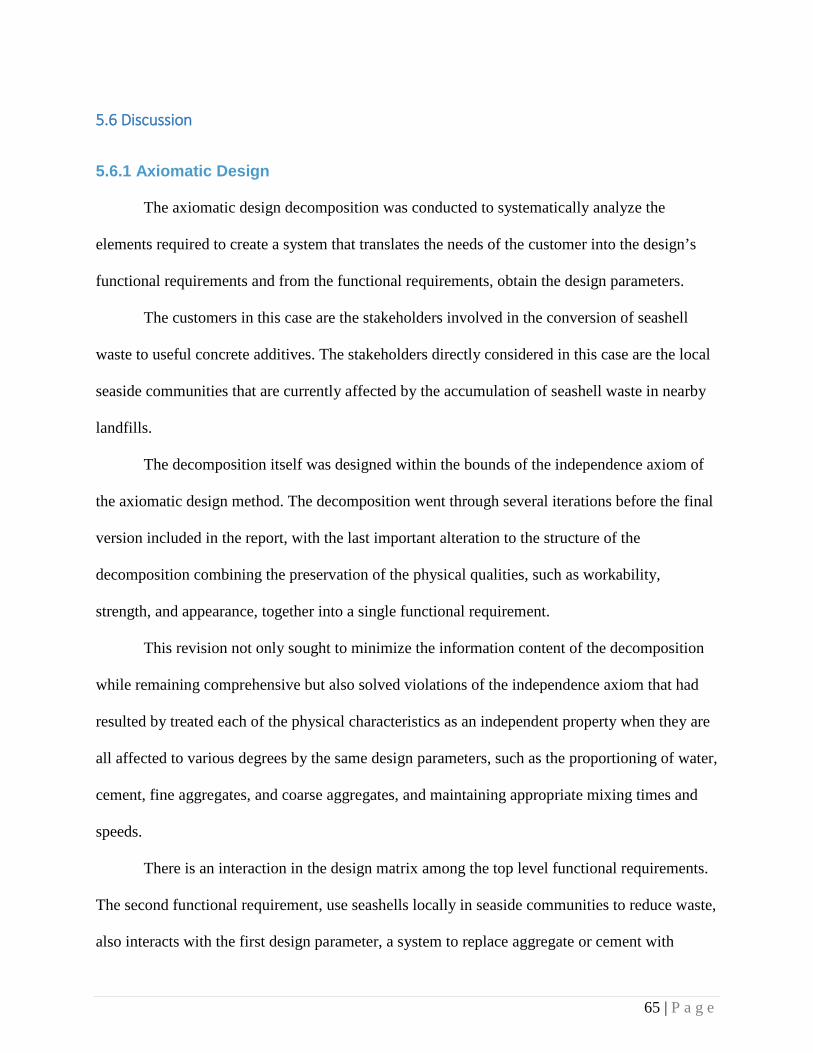
5.6 Discussion
5.6.1 Axiomatic Design The axiomatic design decomposition was conducted to systematically analyze the
elements required to create a system that translates the needs of the customer into the design’s
functional requirements and from the functional requirements, obtain the design parameters.
The customers in this case are the stakeholders involved in the conversion of seashell
waste to useful concrete additives. The stakeholders directly considered in this case are the local
seaside communities that are currently affected by the accumulation of seashell waste in nearby
landfills.
The decomposition itself was designed within the bounds of the independence axiom of
the axiomatic design method. The decomposition went through several iterations before the final
version included in the report, with the last important alteration to the structure of the
decomposition combining the preservation of the physical qualities, such as workability,
strength, and appearance, together into a single functional requirement.
This revision not only sought to minimize the information content of the decomposition
while remaining comprehensive but also solved violations of the independence axiom that had
resulted by treated each of the physical characteristics as an independent property when they are
all affected to various degrees by the same design parameters, such as the proportioning of water,
cement, fine aggregates, and coarse aggregates, and maintaining appropriate mixing times and
speeds.
There is an interaction in the design matrix among the top level functional requirements.
The second functional requirement, use seashells locally in seaside communities to reduce waste,
also interacts with the first design parameter, a system to replace aggregate or cement with
65 | P a g e
seashells without compromising the characteristics of the concrete. The interactions occurs due
to the inseparable effect that the desirability of concrete will have on its effectiveness as a
vehicle in which to dispose of seashell waste. If the concrete possesses poor characteristics, such
as compromised load bearing capacity or an extreme lack of workability, then no customer will
be interested to use it in the slightest.
Ultimately, the axiomatic design process greatly reduces unnecessary iterations as well as
missed requirements, a key element once the design is in use.
5.6.2 Financial Analysis The financial analysis was conducted to determine the economic utility gained from the
removal of seashells from the waste stream entering landfills. Originally, determining the cost
savings from replacing fine aggregates, such as sand, or portland cement was considered. After
careful consideration, the focus of the financial analysis was changed due to the redundancy of
determining whether savings would be realized from removing portions of the expensive
portland cement or high quality sand, either of which can have numerous ingredients and prices
dependent upon geographic location, when the seashell waste is being considered for use in part
because it is cheaper. Once economies of scale are taken in account, should the seashell
containing concrete become produced industrially, the question becomes virtually irrelevant.
Instead, the benefits to local communities operating landfills and private landfill
administrators were examined to determine whether it would be worth their assistance in
acquiring the seashells.
There is a lack of information in regards to the quantitative landfill data required to
complete a financial analysis, resulting in the data used for the studied landfill being derived
from multiple landfills and composited together for the calculations. Income and expenses were
66 | P a g e
not taken into account as the only complete financial records available came from a municipal
landfill operated as a nonprofit with a balanced budget.
The composite landfill had a lifespan of twenty years and using a conservative value of
0.3 percent of the annual waste stream for discarded seashells entering the landfill (only clam
shells were counted in the source study). Assuming that nearly all of the seashells, with
negligible exceptions, the landfill has nearly a full month added to its lifespan – resulting in
$47,032 (table 5) of value being added to the landfill by the end of its lifespan.
5.7 Conclusion The purpose of this analysis was to examine the financial aspects of the seashell
containing concrete product in terms of the economic benefit provided to local seaside
communities and to conduct a review of the process of utilizing seashells in concrete to reduce
pressure on the waste stream using professor Suh’s axiomatic design method.
Additionally, the design decomposition served to emphasize the important aspects of the
mix proportioning process, while preserving FR0, by forcing each one of the customer’s
requirements to be examined independently and then be paired with a matching system design
parameter in the most efficient manner possible. This was achieved by simplifying the
information content of the process while maintaining the independence of the functional
requirements – upholding the independence axiom of the axiomatic design method.
From the results of the financial analysis, it is clear that it would be highly beneficial for
landfill operators, both public and private, to work closely with any companies seeking to utilize
the landfill’s seashell waste. One way this could be accomplished is by implementing new rules
and regulations that seashell waste in the future be separated from waste entering the landfill for
burial, excluding further seashells from being buried, as many landfills have done already, and
67 | P a g e
then, for landfill operators concerned with losing the net benefits that the exclusion of seashell
waste is giving them, offering the separate seashells to the interested concrete businesses at a just
high enough price to nullify the minimal expenses that may be incurred. Overall, the seashell
containing concrete accomplishes the goal of reducing the load on the waste stream while
successfully remaining an economically viable avenue for disposing of that waste.
68 | P a g e

6.0 Conclusions The purpose of this project was to determine the feasibility of replacing either sand or
cement powder with sea shells. Adding seashells lowered the compressive strength up to 20%
after 14 days of curing time. The majority of samples (7 of 8) had lower compressive strengths
than the base test after curing for 14 days. Tensile strengths of the samples were much closer to
that of the base test. Over half of the samples tested had higher tensile strengths than the base
mixture after 14 days of curing. However, the flexural strength increased when adding seashells
to the mixture. Overall, the conch shells tested better than oyster shells in compression and
tension. Furthermore, the conch shell samples had less shrinkage than the base or oyster mixes.
The mixtures replacing 10% of sand with shells performed better than the ones replacing 25% of
the sand. It was also found that vinegar treating the shells did not have a noticeable effect on the
strength of concrete.
There are two mixtures that would be recommended for usage in creating an airport
runway. These are Mix 4, which replaced 10% of the sand with acid treated conch shells, and
Mix 8, which replaced 5% of the cement powder with conch powder. For economic analysis,
Mix 8 was chosen because replacing cement powder would reduce the cost of concrete more
than replacing the fine aggregate would.
Following testing, this new mix proportion needed to be analyzed for implementation of
an airport runway. AC150/5370-10 code requires a compressive strength of 4000psi at 28 day
curing time for the surface on an airport runway. Analyzing Mix 8, which had a compressive
strength of 4799psi after 14 days, the 28 day compressive strength can be estimated as
4799/0.9=5332psi. The mixture was analyzed to support the loading of 30,000 pound airplanes.
69 | P a g e

The runway was also analyzed to ensure the concrete would not rupture from shear due to the
immediate loading of an airplane. The concrete passes the requirements and these calculations
can be seen in Appendix F. A 12 in thick slab on a compact gravel base would provide enough
strength to support the required loading.
The serviceability of each mixture was considered from the start of the project. The
testing was performed to determine what mixtures would hold the required loading. The chosen
Mix 8 only replaced 5% of the cement powder with conch powder. The samples that used conch
shells had less shrinkage than the oyster samples. It was decided that the durability of this sample
would not change from the base concrete mixture because of the testing results and the low
percentage of shell replacement.
70 | P a g e

Bibliography
1. About Concrete - Industry Links. (2013). About Concrete - Industry Links. Retrieved October 12, 2014, from http://www.nrmca.org/concrete/data.asp
2. Axiomatic Design Solutions, Inc. (n.d.). Axiomatic Design Technology. Axiomatic Design Solutions. retrieved March 3, 2015, from www.axiomaticdesign.com/technology/axiomatic.asp
3. Ball Mills. n.d.. Constrained model predictive control in ball mill grinding process. Retrieved October 9, 2014, from
4. http://www.sciencedirect.com/science/article/pii/S0032591007005566 5. Bentz, D., & Aitcin, P. (2008). The Hidden Meaning of Water-Cement Ratio. Concrete
International. Retrieved September 30, 204, from http://ciks.cbt.nist.gov/~bentz/ci3005bentzreadonly.pdf
6. Brown, C. (2011). Axiomatic Design for Understanding Manufacturing Engineering as a Science. Interdisciplinary Design: Proceedings of the 21st CIRP Design Conference. Pages 173-175. Daejeon
7. Ceramic Batch Ball Mill Classifying Plant - Buy Ball Mill,Ceramic Batch Ball Mill,Ceramic Batch Ball Mill Plant Product on Alibaba.com. n.d.. www.alibaba.com. Retrieved October 9, 2014, from http://www.alibaba.com/product-detail/1830x3500-ceramic-batch-ball-mill-classifying_1995034056.html?s=p
8. Chou-Fu Liang & Hung-Yu Wang. (2008). Feasibility of Pulverized Oyster Shell as a Cementing Material. Retrieved October 1, 2014. http://www.hindawi.com/journals/amse/2013/809247/
9. Concrete Materials. n.d.. Retrieved September 29, 2014, from http://www.cement.org/cement-concrete-basics/concrete-materials
10. Concrete Properties and Mix Design. n.d.. Retrieved September 30, 2014, from http://www.astecinc.com/images/concrete/presentations/ACPA MIX DESIGN PRESENTATION.pdf
11. Concrete Properties. n.d.. Retrieved September 30, 2014, from http://www.engineeringtoolbox.com/concrete-properties-d_1223.html
12. Corrosion Test. n.d.. Shyam Steel . Retrieved October 2, 2014, from http://www.shyamsteel.com/assets/images
13. Crow, J. (2008, March 1). The Concrete Conundrum. Retrieved September 30, 2014. 14. Crushed Oyster Shell." Crushed Oyster Shell. N.p., n.d. Web. 29 Sept. 2014.
<http://www.mycosupply.com/cgibin/shopper.cgi?preadd=action&key=cosh01>. 15. Dutrow, B., & Clark, C. n.d.. X-ray Powder Diffraction (XRD). X-ray Powder
Diffraction (XRD). Retrieved October 9, 2014, from http://serc.carleton.edu/research_education/geochemsheets/techniques/XRD.html
16. D.F. Hou, G.S. Zhoua, M. Zheng. (2003). Conch shell structure and its effect on mechanical behavior. Retrieved September 23, 2014.
17. Edie News (2013, October 2). Seashells from food waste used to produce drinking water. Edie.net. retrieved March 7, 2015, from http://www.edie.net/news/4/Seashells-from-food-waste-used-to-produce-drinking-water/
18. Flexural Strength Concrete. (2000). Retrieved October 10, 2014, from http://www.nrmca.org/aboutconcrete/cips/16p.pdf
71 | P a g e

19. Fly Ash in Concrete. n.d.. Retrieved October 10, 2014, from http://www.ashgroveresources.com/showcase4.html
20. Fillite Extendosphere - Polymer Additives. (n.d.). Fillers. Retrieved October 15, 2014, from http://www.plasticmaterials.net/fillers/fillers.html
21. Fischer, Irving. The Theory of Interest. Clifton: Augustus M. Kelly, 1907, 1930, 1974. 22. Freudenrich, C. (n.d.). How Landfills Work. HowStuffWorks. Retrieved Febraury 6, 2015,
from http://science.howstuffworks.com/environmental/green-science/landfill4.htm 23. Gil-Lim Yoon, Byung-Tak Kim, Baeck-Oon Kim, Sang-Hun Han, Chemical–mechanical
characteristics of crushed oyster-shell, Waste Management, Volume 23, Issue 9, 2003, Pages 825-834, ISSN 0956-053X, http://dx.doi.org/10.1016/S0956-053X(02)00159-9.
24. Hawk-wing Conch Shells. Wholesale Hawkwing Conch Shells for Shellcraft. N.p., n.d. Web. 29 Sept. 2014. <http://www.atlanticcoralenterprise.com/productcart/pc/viewPrd.asp?idproduct=817&idcategory=380#details>.
25. Kakisawa, H., & Sumitomo, T. (2012). The toughening mechanism of nacre and structural materials inspired by nacre. SCIENCE AND TECHNOLOGY OFADVANCEDMATERIALS. Retrieved October 14, 2014, from stacks.iop.org/STAM/12/064710
26. Machine Shop Split Cylinder. n.d.. Aerospace Illinois Edu. Retrieved October 14, 2014, from http://aerospace.illinois.edu/sites/default/files/images/machine-shop/split-cylinder.jpg
27. Material Property Characterization of Ultra-High Performance Concrete. n.d.. Chapter 3. Retrieved October 9, 2014, from http://www.fhwa.dot.gov/publications/research/infrastructure/structures/06103/chapt3.cfm
28. Mcgraven, S. (2013, November 22). The Future of Fly Ash Use in Concrete. National Precast Concrete Association The Future of Fly Ash Use in Concrete Comments. Retrieved October 10, 2014, from http://precast.org/2013/11/the-future-of-fly-ash-use-concrete/
29. Mehta, P., & Monteiro, P. (2014). Concrete: Microstructure, Properties and Materials (4th ed.). Access Engineering.
30. Merrill, L. (1997, March-April). Treasure from Trash. Marine notes. retrieved February 5, 2015, from http://www.mdsg.umd.edu/sites/default/files/files/MN15_2.PDF
31. New Jersey Department of Community Affairs (2014). Gloucester County Improvement (Solid Waste) Budget. Retrieved March 1, 2015, from http://www.gcianj.com/wp-content/uploads/2013/08/2014-Solid-Waste-Budget.pdf
32. Orange County Solid Waste Management Department (2015). Collection Statistics. retrieved Februrary 2, 2015, from http://www.co.orange.nc.us/recycling/stats.asp
33. Phillips, J. (2014, November 4). US Inflation Rate Forecast. FORECASTCHART.com. Retrieved November 4, 2015, from http://www.forecast-chart.com/forecast-inflation-rate.html
34. Skaggs, M. (n.d.). AgraTech Converts Seafood Shell Waste into Biotech Products.Louisiana Seafood News. Retrieved October 15, 2014, from http://www.louisianaseafoodnews.com/2013/04/10/agratech-converts-seafood-shell-waste-into-biotech-products/
72 | P a g e
35. Solid Waste Compliance Division (n.d.). Estimated Costs of Landfill Closure. Maryland Department of the Environment. Retrieved March 1, 2015, from http://www.mde.state.md.us/assets/document/factsheets/landfill_cl.pdf
36. Suh, N. (1990). The Principles of Design. Oxford University Press. New York 37. Tarr, S., & Farny, J. (2008). Concrete Cracks: A Shrinking Problem?. Concrete
Shrinkage. Retrieved October 8, 2014, from http://www.cement.org/for-concrete-books-learning/concrete-technology/focus-on-floors/concrete-shrinkage
38. Tassel, E. V. n.d.. Alternate Cementitious Materials. Alternate Cementitious Materials. Retrieved October 10, 2014, from http://www.engr.psu.edu/ce/courses/ce584/concrete/library/materials/Altmaterials/Altmaterialsmain.htm
39. Tensile Test on Concrete. n.d.. Tensile Test on Concrete. Retrieved October 10, 2014, from http://www.buildingresearch.com.np/services/mt/mt2.php
40. Testing Compressive Strength of Concrete. (2003, January 1). Retrieved October 7, 2014, from http://www.nrmca.org/aboutconcrete/cips/35p.pdf
41. Three Point Flexural Test. n.d.. Wikimedia. Retrieved October 4, 2014, from http://upload.wikimedia.org/wikipedia/commons/d/d9/Three_point_flexural_test.jpg
42. Tran, X H; Tawie, R; Lee, H K (2009). A systematic approach for the development of porous concrete based on axiomatic design theory. Computers and Concrete. Pages 491-503
43. Using Fly Ash in Concrete. (2010, May 8). National Precast Concrete Association Using Fly Ash in Concrete Comments. Retrieved October 10, 2014, from http://precast.org/2010/05/using-fly-ash-in-concrete/
44. Wake County Solid Waste Management Division (n.d.) Frequently Asked Questions - North Wake Landfill. Retrieved March 2, 2015, from http://www.wakegov.com/recycling/division/Documents/nwlf/Final_FAQ_North%20Wake%20Landfill.pdf
45. Water-Cement Ratio. n.d.. Retrieved September 29, 2014, from http://www.merriam-webster.com/dictionary/water-cement ratio
46. Welsh, J. (2011, February 1). Seashells Get Their Strength from Interlocking 'Bricks'. LiveScience. Retrieved October 9, 2014, from http://www.livescience.com/11696-seashells-strength-interlocking-bricks.html
47. Which Industries are Sensitive to Business Cycles. n.d.. BLS. Retrieved October 6, 2014, from http://www.bls.gov/mlr/1997/02/art2full.pdf
73 | P a g e
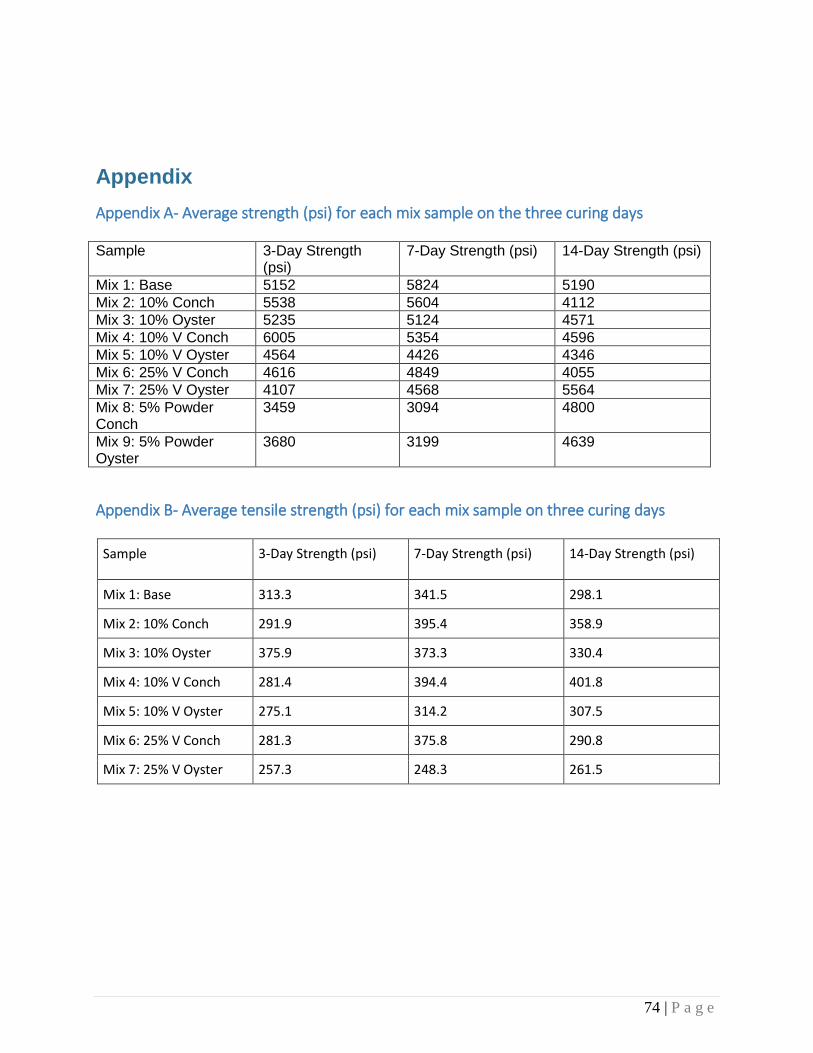
Appendix Appendix A- Average strength (psi) for each mix sample on the three curing days Sample 3-Day Strength
(psi) 7-Day Strength (psi) 14-Day Strength (psi)
Mix 1: Base 5152 5824 5190 Mix 2: 10% Conch 5538 5604 4112 Mix 3: 10% Oyster 5235 5124 4571 Mix 4: 10% V Conch 6005 5354 4596 Mix 5: 10% V Oyster 4564 4426 4346 Mix 6: 25% V Conch 4616 4849 4055 Mix 7: 25% V Oyster 4107 4568 5564 Mix 8: 5% Powder Conch
3459 3094 4800
Mix 9: 5% Powder Oyster
3680 3199 4639
Appendix B- Average tensile strength (psi) for each mix sample on three curing days
Sample 3-Day Strength (psi) 7-Day Strength (psi) 14-Day Strength (psi)
Mix 1: Base 313.3 341.5 298.1
Mix 2: 10% Conch 291.9 395.4 358.9
Mix 3: 10% Oyster 375.9 373.3 330.4
Mix 4: 10% V Conch 281.4 394.4 401.8
Mix 5: 10% V Oyster 275.1 314.2 307.5
Mix 6: 25% V Conch 281.3 375.8 290.8
Mix 7: 25% V Oyster 257.3 248.3 261.5
74 | P a g e

Appendix C- Three-point bend averages
Sample Flexural Stress Average
Flexural Strain Average
Mix 1 892.0330 0.0021 Mix 2 1161.8043 0.0079 Mix 3 1095.1010 0.0028 Mix 4 1268.5703 0.0054 Mix 5 1165.0417 0.0042 Mix 6 1113.6824 0.0020 Mix 7 1208.2106 0.0055
Appendix D- Average shrinkage results throughout 2 weeks
Day Mix 1 Mix 2 Mix 3 Mix 4 Mix 5 Mix 6 Mix 7
0 304.800 304.800 304.800 304.800 304.800 304.800 304.800
3 304.615 304.698 304.070 304.236 304.010 304.471 303.789
7 304.444 304.672 303.856 304.141 303.906 304.422 303.644
14 304.382 304.622 303.932 304.083 303.895 304.373 303.572
75 | P a g e

Appendix E-Individual XRD graphs
76 | P a g e

77 | P a g e
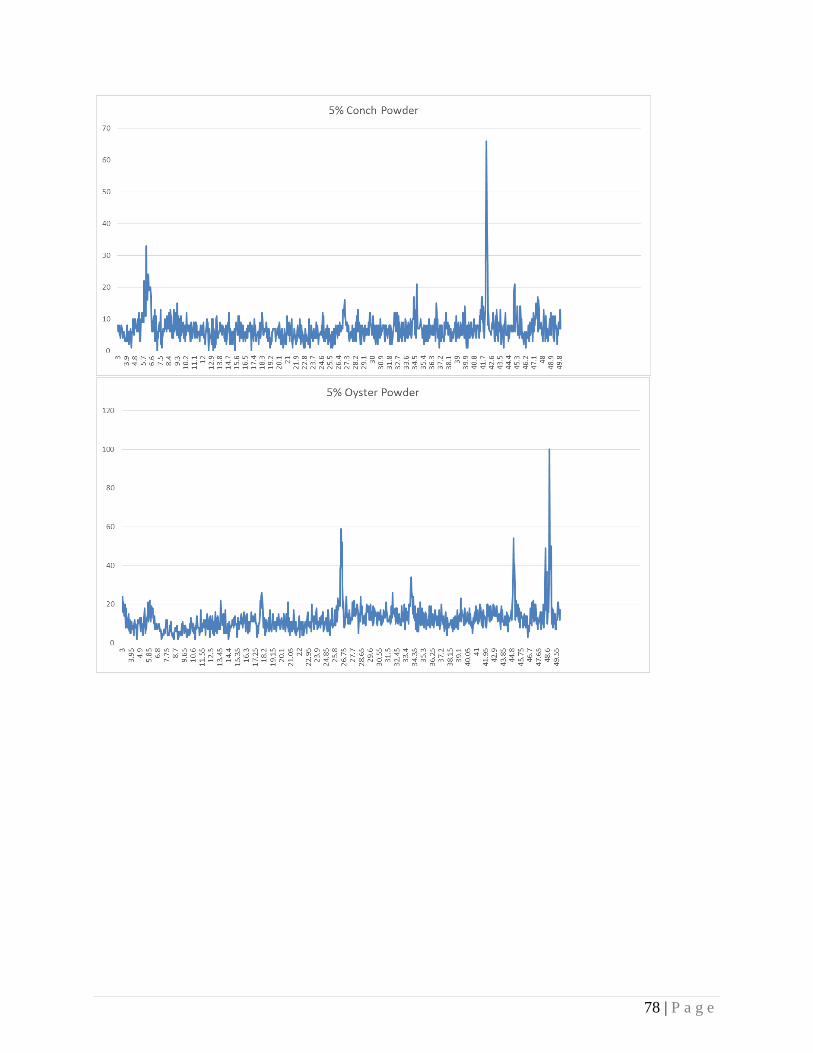
78 | P a g e

Appendix F- Calculations for design
79 | P a g e
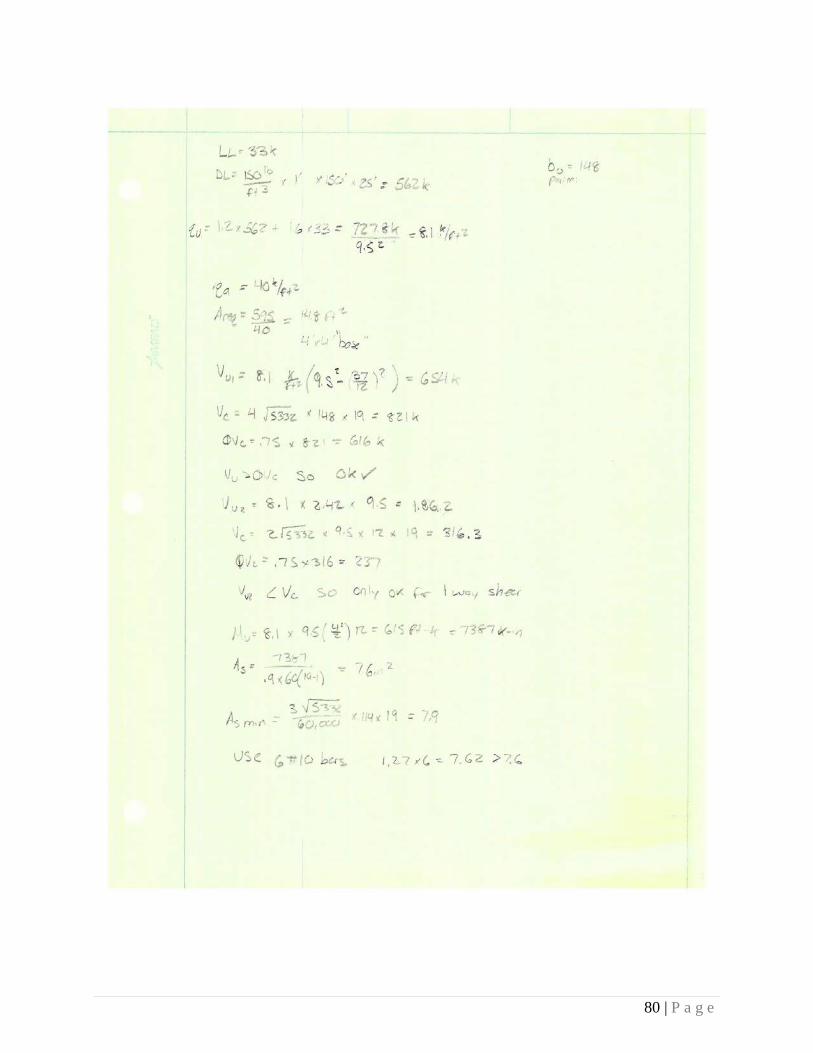
80 | P a g e

81 | P a g e