musical training as a potential tool for improving speech ...eprints.nottingham.ac.uk/35842/1/kat...
TRANSCRIPT

Musical training as a potential toolfor improving speech perception in
background noise
Kathryn Yates
Thesis submitted to the University of Nottinghamfor the degree of Doctor of Philosophy
December 2016


Abstract
Understanding speech in background noise is a complex and challengingtask that causes difficulty for many people, including young childrenand older adults. Musicians, on the other hand, appear to have anenhanced ability to perceive speech in noise. This has prompted suggestionsthat musical training could help people who struggle to communicate incomplex auditory environments. The experiments presented in this thesiswere designed to investigate if and how musical training could be used asan intervention for improving speech perception in noise.
The aim of Experiment 1 was to identify specific musical skills whichcould be targeted for training. Musical beat perception was found to bestrongly correlated with speech perception in noise. It was hypothesisedthat musical beat perception might enhance speech perception in noise byfacilitating temporal orienting of attention to important parts of the signal.
Experiments 2, 3 and 4 investigated this hypothesis using a rhythmicpriming paradigm. Musical rhythm sequences were used to prime temporalexpectations, with performance for on-beat targets predicted to be betterthan that for temporally displaced targets. Rhythmic priming benefits wereobserved for detection of pure-tone targets in noise and for identificationof words in noise. For more complex rhythms, the priming effect wascorrelated with musical beat perception.
Experiment 5 used the metric structure within a sentence context to primetemporal expectations for a target word. There was a significant benefit ofrhythmic priming for both children and adults, but the effect was smallerfor children.
In Experiment 6, a musical beat training programme was devised andevaluated for a group of older adults. After four weeks of training, asmall improvement in speech reception thresholds was observed. It wasconcluded that beat perception is a useful skill to target in a musicalintervention for speech perception in noise.
iii


Copyright Permissions
• Data from Chapter 3 were presented in:
Yates, K.M., Amitay, S., Moore, D.R., Shub, D.E. and Barry, J.G. (2012).What links musical training and speech-in-noise perception? Posterpresentation at BSA, Nottingham
• Data from Chapter 4 were presented in:
Yates, K.M., Amitay, S., Moore, D.R., Shub, D.E. and Barry, J.G. (2013).Exploring beat processing as a link between musical training andspeech-in-noise perception. Poster presentation at CHSCOM, Linkoping,Sweden
• Data from Chapter 4 and Chapter 5 were presented in:
Yates, K.M., Amitay, S., Moore, D.R., Shub, D.E. and Barry, J.G. (2013).Exploring beat processing as a link between musical training andspeech-in-noise perception. Oral presentation at BSA, Keele
Yates, K.M., Amitay, S., Moore, D.R., Shub, D.E. and Barry, J.G. (2013).Exploring beat processing as a link between musical training andspeech-in-noise perception. Poster presentation at RPPW, Birmingham
• Data from Chapter 6 was presented in:
Yates, K.M., Amitay, S., Shub, D.E. and Barry, J.G. (2014). Musicaltraining for improving speech-in-noise perception. Poster presentationat Neurosciences and Music V, Dijon, France
v


Table of Contents
List of Figures xi
List of Tables xiii
1 Introduction 11.1 Musical training and speech perception . . . . . . . . . . . . . 1
1.1.1 Musicians as expert listeners . . . . . . . . . . . . . . . 11.1.2 Evidence from musical training studies . . . . . . . . 21.1.3 Proposed mechanisms of transfer from music to speech 31.1.4 Musical training for speech perception in noise . . . 6
1.2 A brief introduction to auditory scene analysis . . . . . . . . 71.2.1 Setting the complex auditory scene . . . . . . . . . . 71.2.2 Auditory scene analysis . . . . . . . . . . . . . . . . 8
1.3 Selectively attending to target speech . . . . . . . . . . . . . 91.3.1 Endogenous and exogenous cues . . . . . . . . . . . 91.3.2 Attending to location . . . . . . . . . . . . . . . . . . . 111.3.3 Attending to voice characteristics . . . . . . . . . . . 131.3.4 Selective attention is limited by sensory processing . 14
1.4 Reconstructing a degraded or incomplete speech signal . . . 151.4.1 The role of linguistic knowledge . . . . . . . . . . . 161.4.2 Listening to speech in modulated noise . . . . . . . . 17
1.5 The importance of temporal information in speech . . . . . 181.5.1 Orienting attention in time . . . . . . . . . . . . . . 191.5.2 Rhythmic priming during speech listening . . . . . . 22
1.6 A lifespan perspective on speech perception in noise . . . . 231.6.1 Development during childhood . . . . . . . . . . . . 241.6.2 Decline during older adulthood . . . . . . . . . . . . 25
1.7 Musician advantage for speech perception in noise . . . . . 271.7.1 Evidence from group comparison studies . . . . . . . 271.7.2 Evidence from a longitudinal training study . . . . . 32
1.8 Designing a musical training programme . . . . . . . . . . . 33
vii

1.8.1 Pitch and melody . . . . . . . . . . . . . . . . . . . . 351.8.2 Rhythm and beat . . . . . . . . . . . . . . . . . . . . 35
1.9 Research questions and outline of thesis . . . . . . . . . . . 36
2 General methods 392.1 Quantifying musical experience . . . . . . . . . . . . . . . . 39
2.1.1 Measuring musical training . . . . . . . . . . . . . . 392.2 Assessing musical skills . . . . . . . . . . . . . . . . . . . . . . 41
2.2.1 Melody and rhythm . . . . . . . . . . . . . . . . . . . 412.2.2 Musical beat perception . . . . . . . . . . . . . . . . 42
2.3 Testing speech-in-noise perception . . . . . . . . . . . . . . 432.3.1 Choosing a sentence test . . . . . . . . . . . . . . . . 452.3.2 Selecting noise maskers . . . . . . . . . . . . . . . . 47
2.4 Psychophysics . . . . . . . . . . . . . . . . . . . . . . . . . . 492.4.1 Adaptive staircases . . . . . . . . . . . . . . . . . . . 502.4.2 Method of constant stimuli . . . . . . . . . . . . . . . 512.4.3 Threshold estimates from fitted functions . . . . . . . 512.4.4 Quantifying rhythmic priming effects . . . . . . . . . 53
3 Investigating musical skills for speech perception in noise 553.1 Introduction . . . . . . . . . . . . . . . . . . . . . . . . . . . 553.2 Experiment 1 . . . . . . . . . . . . . . . . . . . . . . . . . . 56
3.2.1 Aims . . . . . . . . . . . . . . . . . . . . . . . . . . . 563.2.2 Methods . . . . . . . . . . . . . . . . . . . . . . . . . 593.2.3 Results . . . . . . . . . . . . . . . . . . . . . . . . . . 64
3.3 Discussion . . . . . . . . . . . . . . . . . . . . . . . . . . . . 703.3.1 Evaluation of noise maskers . . . . . . . . . . . . . . 703.3.2 Musical experience and speech-in-noise perception . . 713.3.3 Musical beat perception and speech-in-noise perception 71
4 Rhythmic priming of anticipatory attention to targets in noise 754.1 Introduction . . . . . . . . . . . . . . . . . . . . . . . . . . . 754.2 Experiment 2: Priming with a simple beat . . . . . . . . . . 76
4.2.1 Aims . . . . . . . . . . . . . . . . . . . . . . . . . . . 764.2.2 Task design . . . . . . . . . . . . . . . . . . . . . . . 764.2.3 Methods . . . . . . . . . . . . . . . . . . . . . . . . . . 814.2.4 Results . . . . . . . . . . . . . . . . . . . . . . . . . . 854.2.5 Discussion . . . . . . . . . . . . . . . . . . . . . . . . 90
4.3 Experiment 3: Priming with musical rhythms . . . . . . . . 924.3.1 Aims . . . . . . . . . . . . . . . . . . . . . . . . . . . 924.3.2 Task design . . . . . . . . . . . . . . . . . . . . . . . 934.3.3 Methods . . . . . . . . . . . . . . . . . . . . . . . . . 954.3.4 Results . . . . . . . . . . . . . . . . . . . . . . . . . . 1004.3.5 Discussion . . . . . . . . . . . . . . . . . . . . . . . . 106
4.4 Experiment 4: Priming with speech sounds . . . . . . . . . . 1094.4.1 Aims . . . . . . . . . . . . . . . . . . . . . . . . . . . 1094.4.2 Task design . . . . . . . . . . . . . . . . . . . . . . . 109
viii

4.4.3 Methods . . . . . . . . . . . . . . . . . . . . . . . . . 1104.4.4 Results . . . . . . . . . . . . . . . . . . . . . . . . . . . 1114.4.5 Discussion . . . . . . . . . . . . . . . . . . . . . . . . 113
4.5 Summary . . . . . . . . . . . . . . . . . . . . . . . . . . . . 114
5 Rhythmic priming of attention during speech listening 1155.1 Introduction . . . . . . . . . . . . . . . . . . . . . . . . . . . 1155.2 Experiment 5 . . . . . . . . . . . . . . . . . . . . . . . . . . 116
5.2.1 Aims . . . . . . . . . . . . . . . . . . . . . . . . . . . 1165.2.2 Task design . . . . . . . . . . . . . . . . . . . . . . . 1175.2.3 Methods . . . . . . . . . . . . . . . . . . . . . . . . . 1185.2.4 Results . . . . . . . . . . . . . . . . . . . . . . . . . . 122
5.3 Discussion . . . . . . . . . . . . . . . . . . . . . . . . . . . . 124
6 Training musical beat perception 1276.1 Introduction . . . . . . . . . . . . . . . . . . . . . . . . . . . 127
6.1.1 Training musical beat perception . . . . . . . . . . . 1286.2 Experiment 6 . . . . . . . . . . . . . . . . . . . . . . . . . . 130
6.2.1 Aims . . . . . . . . . . . . . . . . . . . . . . . . . . . 1306.2.2 Methods . . . . . . . . . . . . . . . . . . . . . . . . . . 1316.2.3 Results . . . . . . . . . . . . . . . . . . . . . . . . . . 135
6.3 Discussion . . . . . . . . . . . . . . . . . . . . . . . . . . . . 148
7 General discussion 1517.1 Question 1: Are specific musical skills associated with speech
perception in noise? . . . . . . . . . . . . . . . . . . . . . . . 1517.1.1 Why might musical beat training transfer to speech
perception? . . . . . . . . . . . . . . . . . . . . . . . 1527.1.2 Consideration of other musical skills . . . . . . . . . 1547.1.3 Interpreting differences in speech reception thresholds 1557.1.4 Beat perception in specific populations . . . . . . . . 156
7.2 Question 2: How might beat perception contribute to speechperception in noise? . . . . . . . . . . . . . . . . . . . . . . 1587.2.1 Musical beat perception and rhythmic priming . . . . 1587.2.2 Converging evidence from neuroscience . . . . . . . 1597.2.3 What is a meaningful difference in threshold? . . . . . 1617.2.4 Adaptations of the rhythmic priming paradigm . . . 162
7.3 Question 3: Can short-term beat training improve speechperception in noise? . . . . . . . . . . . . . . . . . . . . . . 1647.3.1 Considerations for future training studies . . . . . . 164
7.4 Conclusion . . . . . . . . . . . . . . . . . . . . . . . . . . . 167
References 169
ix


List of Figures
1.1 Example configuration for a selective attention experiment . 121.2 Data from speech perception studies . . . . . . . . . . . . . 141.3 Dynamic attending theory . . . . . . . . . . . . . . . . . . . 201.4 Musician advantage for speech perception in noise . . . . . 291.5 Lifespan development of speech perception in noise . . . . . 331.6 Research questions . . . . . . . . . . . . . . . . . . . . . . . 36
2.1 The Goldsmiths’ Musical Sophistication Index . . . . . . . . 402.2 The Matrix Sentence Test . . . . . . . . . . . . . . . . . . . 462.3 Waveforms of the three noise maskers . . . . . . . . . . . . 492.4 The psychometric function . . . . . . . . . . . . . . . . . . . 502.5 Fitting psychometric functions . . . . . . . . . . . . . . . . . 522.6 The quadratic coefficient as a measure of rhythmic priming 53
3.1 Mean speech reception thresholds with the three noise maskers 633.2 Scatter matrix of the relationships among predictor variables 653.3 Scatter matrix of relationships between predictor variables
and speech perception in noise measures . . . . . . . . . . . 673.4 Scatter plots of beat perception and speech-in-noise measures 693.5 Beat processing as a link between musical training and
speech perception in noise . . . . . . . . . . . . . . . . . . . 73
4.1 Waveforms of target words . . . . . . . . . . . . . . . . . . . 774.2 Word list used in Experiment 2 . . . . . . . . . . . . . . . . 824.3 Schematic diagram of a trial in the speech discrimination task 824.4 Schematic diagram of a trial in the tone detection task . . . 834.5 Schematic diagram showing the target positions with jittered
intervals . . . . . . . . . . . . . . . . . . . . . . . . . . . . . 834.6 Mean thresholds for the speech task in Experiment 2 . . . . 864.7 Results of the tone detection task . . . . . . . . . . . . . . . 884.8 Results of the tone detection task for all 6 target positions . 894.9 Rhythmic priming sequences . . . . . . . . . . . . . . . . . 97
xi

4.10 Word list used in Experiment 3 . . . . . . . . . . . . . . . . 974.11 Schematic of a trial in Experiment 3 . . . . . . . . . . . . . 984.12 Subjective beat ratings of the priming sequences . . . . . . . . 1014.13 Results of the speech discrimination task . . . . . . . . . . . 1024.14 Comparison of speech results from Experiments 2 and 3 . . 1024.15 Results of the tone-detection task from Experiment 3 . . . . 1044.16 Comparison of tone task results from Experiments 2 and 3 . 1054.17 Musical beat ability associates with rhythmic priming effect 1064.18 Results of the speech discrimination task from Experiment 4 1124.19 Results from six individual participants . . . . . . . . . . . . 113
5.1 Schematic diagram of the stimuli and task . . . . . . . . . . 1195.2 Screenshot of the task instructions . . . . . . . . . . . . . . . 1215.3 Results from Experiment 5 . . . . . . . . . . . . . . . . . . . 1235.4 Development of threshold and priming effect with age . . . 124
6.1 Audiometric data for participants in Experiment 6 . . . . . . . 1316.2 Training study protocol . . . . . . . . . . . . . . . . . . . . . 1326.3 Baseline SRTs for young adults and older adults . . . . . . . 1366.4 Scatter plots of hearing ability and SRTs . . . . . . . . . . . 1376.5 Changes in SRTs during control period . . . . . . . . . . . . 1376.6 Scatter plots of beat perception and masking release . . . . 1396.7 Changes in SRTs during training period . . . . . . . . . . . . 1406.8 Scatter plots of outcomes and trained skills . . . . . . . . . . 1416.9 Scatter plots of improvements and baseline scores . . . . . . 1436.10 Changes in SRTs during the retention period . . . . . . . . . 1456.11 SRT in steady noise at the four time points . . . . . . . . . . 1456.12 SRT in modulated noise at the four time points . . . . . . . 1466.13 Confidence intervals for SRT in steady noise . . . . . . . . . 1476.14 Confidence intervals for SRT in modulated noise . . . . . . 147
xii

List of Tables
1.1 Summary of musical training studies . . . . . . . . . . . . . 41.2 Summary of endogenous and exogenous cueing methods . . 10
3.1 Test battery used in Experiment 1 . . . . . . . . . . . . . . . 593.2 Sensitivity and reliability of the matrix test with different
maskers . . . . . . . . . . . . . . . . . . . . . . . . . . . . . 633.3 Correlations between predictor variables . . . . . . . . . . . 653.4 Correlations between predictors and speech thresholds . . . 673.5 Partial correlations between predictors and speech thresholds 68
4.1 Speech perception results from Experiment 2 . . . . . . . . 854.2 Performance for individual target words in Experiment 2 . . 874.3 Tone detection results from Experiment 2 . . . . . . . . . . 884.4 Summary of priming effects in Experiment 2 . . . . . . . . . 904.5 Comparison of priming effects for speech perception in
Experiments 2 and 3 . . . . . . . . . . . . . . . . . . . . . . 1034.6 Summary of priming effects for the tone-detection task . . . 1044.7 Comparison of priming effects for tone detection in
Experiments 2 and 3 . . . . . . . . . . . . . . . . . . . . . . 1054.8 Correlations between beat perception and priming effects . 106
5.1 Participant data for the three age groups . . . . . . . . . . . 1185.2 Mean thresholds for each age group . . . . . . . . . . . . . 1235.3 Summary of priming effects in Experiment 5 . . . . . . . . . 123
6.1 Test battery for baseline assessment . . . . . . . . . . . . . . 1326.2 Test battery for subsequent assessments . . . . . . . . . . . 1336.3 Baseline SRTs for young adults and older adults . . . . . . . 1366.4 Correlation coefficients for hearing ability and SRTs . . . . . 1376.5 Changes in variables during control period . . . . . . . . . . 1386.6 Regression model for masking release . . . . . . . . . . . . 1396.7 Changes in variables during training period . . . . . . . . . 140
xiii

6.8 Correlations between outcomes and trained skills . . . . . . . 1416.9 Correlations between training-related changes . . . . . . . . 1436.10 Regression model for threshold improvement . . . . . . . . 1436.11 Changes in variables during retention period . . . . . . . . . 144
xiv

CHAPTER1Introduction
Understanding speech amid background noise is a challenging task thatcauses difficulty for many people, especially young children and older adults.Musicians, on the other hand, may have an enhanced ability to perceivespeech in noise. This chapter examines the skills needed for successfulspeech perception in noise, and outlines the approach taken in this thesis toinvestigate the potential of musical training as an intervention to help peoplewho struggle to communicate in complex auditory environments.
1.1 Musical training and speech perception1.1.1 Musicians as expert listenersLearning to play a musical instrument is a complex, multisensory
experience which engages multiple neural networks (Moreno and
Bidelman, 2014). Musicians spend considerable amounts of time honing
their skills and learning to appreciate acoustical features in music. This
intense focus on auditory perception means that musicians can be excellent
candidates for research into how the expert listening brain processes
sounds. Musical training also provides an ideal model for neural plasticity –
i.e., changes in the brain due to experience – and structural and functional
differences have been observed in musicians compared to non-musicians
(for reviews see, e.g., Moreno and Bidelman, 2014; Pantev and Herholz,
2011).
1

2 CHAPTER 1: INTRODUCTION
There is a large and growing body of literature based on this premise,
comparing highly trained musicians with non-musicians. Behavioural
advantages of musicianship have been reported for a variety of auditory
perceptual skills, including: spectral resolution (Micheyl et al., 2006;
Strait et al., 2010), temporal resolution (Rammsayer and Altenmuller,
2006; Strait et al., 2010), pitch processing (Magne et al., 2006; Schon
et al., 2004), rhythm perception (Rammsayer and Altenmuller, 2006), and
concurrent sound segregation (Zendel and Alain, 2009).
The particular promise of musical training as a possible intervention stems
from the fact that musician advantages are not limited to musical tasks. For
example, musicians demonstrate enhanced pitch processing ability in both
musical and speech contexts (Magne et al., 2006; Schon et al., 2004), and
also outperform non-musicians on cognitive tasks such as verbal working
memory (Chan et al., 1998; Ho et al., 2003; Jakobson et al., 2008).
At this point it is important to note that, while group comparisons have
provided a wealth of avenues for further research, these studies cannot
conclusively reveal if musical training caused the observed enhancements.
It could be argued that people with superior auditory processing abilities
are more likely to take up and persevere with musical training, and that the
groups are therefore self-selecting. Other pre-existing differences between
the groups could also confound the results, such as socio-economic status –
musical training is an expensive hobby – or personality traits – to reach a
high level, self-motivation would be a key factor (see Corrigall et al., 2013).
To address this issue of causality, the next section considers studies
which used an intervention paradigm to compare pre- and post-training
performance in order to directly evaluate the impact of musical training.
1.1.2 Evidence frommusical training studiesThere is evidence of neural plasticity as a direct result of musical
interventions. In one study, a group of young children received fifteen
months of keyboard training while a control group – who were matched
in terms of age, gender and socio-economic status – received no training
(Hyde et al., 2009). Prior to the training, there were no group differences
in brain or behavioural measures. Fifteen months later, the trained group
showed structural plasticity in auditory and motor areas of the brain which
correlated with improvements in behavioural measures of auditory and

MUSICAL TRAININGAND SPEECHPERCEPTION 3
motor musical skills (Hyde et al., 2009). Comparing the trained children
to an untrained control group allowed the authors to conclude that the
changes were above and beyond what would be expected from normal
development.
In another study, functional plasticity was observed after only two weeks
of piano training (Lappe et al., 2008). Non-musician participants were
randomly assigned to one of two training conditions: an auditory-motor
condition which involved learning to play melodies on the piano; or
an auditory-only condition which involved listening to the melodies and
making judgements about them. The auditory-motor training resulted
in greater improvements in both behavioural and neurophysiological
measures of melody discrimination compared to the auditory-only training
(Lappe et al., 2008). A subsequent study found a similar pattern of
results for rhythm training (Lappe et al., 2011). These results suggest
that the multimodal (i.e., sensorimotor) nature of music-making is an
important component in the success of musical training for improving
auditory perception.
Table 6.7 contains a brief summary of eight further studies which evaluated
the impact of musical training on a variety of behavioural outcome
measures. As shown in Table 6.7, significant improvements have been
reported for a number of perceptual, cognitive and linguistic skills.
1.1.3 Proposedmechanisms of transfer frommusic to speech1.1.3.1 Common processingMusic and speech are two complex forms of auditory signals which
share some fundamental psychoacoustic properties. Both are created
by combining basic elements according to a set of rules. Both convey
important information via temporal rhythms and patterns of pitch changes
over time. Both are subject to normalisation, i.e., words and melodies can
be recognised regardless of the speaker or instrument.
It is reasonable to hypothesise that time spent training the auditory system
to appreciate these features in music could lead to enhanced processing of
the same features in speech (Besson et al., 2011; Patel, 2014; Shahin, 2011).
For example, pitch processing is important for both music and speech, and
transfer of musical training to speech perception has been observed for this
skill (Moreno et al., 2009).

4 CHAPTER 1: INTRODUCTION
Table 1.1: Summary of musical training studiesStudy details Musical training programmeChildren aged 6–15 (n=50); 1 year oftraining improved verbal (not visual)memory; control group discontinuedtraining (Ho et al., 2003)
Established school orchestra programme;included instrumental lessons
Dyslexic children, mean age 8.8 (n=9); 15weeks’ training improved rapid auditoryprocessing, phonological ability, spelling;15-week control period (Overy, 2003)
Bespoke teacher-led training based onestablishedmethods; specific focus onrhythm and timing; 20-minute lesson, 3days a week for 15weeks
Children aged 8 (n=32); pseudo-randomassignment; 24weeks’ training improvedpitch discrimination inmusic and language,reading skills; compared to paintingtraining (Moreno et al., 2009)
Teacher-led programme based onestablishedmethods; included rhythm,melody, harmony, timbre and form;75-minute lesson, twice a week for 24weeks
Children aged 4–6 (n=48); pseudo-randomassignment; 4 weeks’ training improvedverbal intelligence, executive function;compared to visual arts training (Morenoet al., 2011)
Bespoke computerized programme led byteacher in classroom; primarily listeningactivities; included rhythm, pitch, melody,voice; two 1-hour lessons daily, 5 days aweek for 4 weeks
Children aged 5–6 (n=41); randomassignment; 20weeks’ training improvedphonological awareness; compared tosports training (Dege and Schwarzer, 2011)
Bespoke programme based on establishedmethods; included joint singing, drumming,dancing, rhythm, meter, pitch; 10-minutelesson, 5 days a week for 20weeks
Children aged 8 (n=24); pseudo-randomassigment; 1 year of training improvedspeech segmentation; compared topainting training (Francois et al., 2013)
Teacher-ledmusic lessons based onestablishedmethods
Older adults aged 60–85 (n=31); randomassignment; 6months’ training improvedexecutive function, workingmemory;untrained control (Bugos et al., 2007)
Individual piano instruction; 30-minutelesson plus 3 hours practice each week for6months
Older adults aged 61–84 (n=29);assignment tomusic group based onmotivation and availability; 4 months’training improved executive function,general mood; control group did otherleisure activities (Seinfeld et al., 2013)
Teacher-led group piano lessons; bespokefor older adults; 90-minute lesson pluspractice (45minutes on 5 days) each weekfor 4months

MUSICAL TRAININGAND SPEECHPERCEPTION 5
This concept of shared processing is a key feature in proposed transfer
mechanisms (e.g, Besson et al., 2011; Patel, 2014), but it does not explain
why musical training would improve processing beyond the level obtained
through experience with speech perception.
1.1.3.2 Working memory as a mediating factorWorking memory has several related components (Baddeley, 2003), two of
which are particularly relevant for the current research. The first involves
the temporary storage and processing of information, i.e., it is not simply
a storage system but also allows information to be manipulated in some
way. For example, in the backwards digit span working memory task,
participants must repeat back heard digits but in the reverse order, which
requires the numbers to be held in memory while being reordered.
The second role of working memory is one of cognitive control, being
responsible for executive functions such as allocating attention. The
important point to note, here, is that working memory has a limited
capacity. This means that performance on a cognitively demanding primary
task will be impaired by the introduction of a concurrent memory task
(Baddeley, 2003). Conversely, a primary task which is not cognitively taxing
will be unaffected by the increased memory demands of a concurrent task.
As mentioned above, musicians have greater auditory working memory
capacity compared to non-musicians (Chan et al., 1998; Ho et al., 2003;
Jakobson et al., 2008) and musical training can lead to enhancements in
working memory and executive function (Bugos et al., 2007; Ho et al.,
2003; Moreno et al., 2011).
Kraus et al. (2012) suggested that auditory working memory is the key
to transfer of learning from music to other domains. They proposed a
model in which cognitive enhancement precedes and subsequently leads to
fine-tuning of auditory processing. Consequently, the general improvement
in auditory perception would apply to both music and speech (Kraus et al.,
2012).
1.1.3.3 The OPERA hypothesisPatel (2011) set out to explain not just how but also why musical training
might enhance speech perception. His OPERA hypothesis proposed that

6 CHAPTER 1: INTRODUCTION
transfer of learning from music to speech will occur for a given acoustic
feature when five conditions are met:
Overlap – the neural networks for processing the acoustic feature in
music and in speech must overlap
Precision – the level of precision of the acoustic feature required
for successful musicianship must be greater than that needed for
everyday speech perception
Emotion – musical training that activates the neural network must
result in a positive emotional experience
Repetition – musical training that activates the neural network must
be repeated regularly
Attention – musical training that activates the neural network must
involve focused attention on the acoustic feature
The overlap criterion implies shared processing as discussed above.
However, with the precision criterion, the OPERA hypothesis goes one step
further in attempting to explain why musical training might benefit speech
perception. The final three criteria are based on factors which are known
to encourage plasticity and which could certainly be assumed to apply to
musical training (Patel, 2014). Music-making is an enjoyable activity, and
it is likely that training exercises focusing attention on various aspects of
music will be practised repeatedly until performance levels are reached.
Patel (2014) subsequently extended his OPERA hypothesis to include
cognitive processes as well as acoustic features with the same five criteria.
This allows for the possibility of auditory working memory as a transfer
process, as suggested by Kraus et al. (2012).
1.1.4 Musical training for speech perception in noiseHaving discussed the benefits of musical training and possible mechanisms
by which learning could transfer to speech perception, the focus of this
introduction now turns to the specific task of interest: speech perception in
background noise.
Understanding speech in background noise is a complex task that causes
particular difficulty for young children, older adults, and those with
language disorders or hearing impairments (Pichora-Fuller et al., 1995;

ABRIEF INTRODUCTIONTOAUDITORY SCENEANALYSIS 7
Stuart, 2008; Ziegler et al., 2009). Communication is an important part of
everyday life and it often takes place in less than ideal surroundings. Poor
speech perception in noise can have negative consequences for education
and social interactions (see Section 1.6). There are therefore many people
who could potentially benefit from a training programme to improve speech
perception in noise.
Outcomes of training are dependent on how well trainees comply with
the programme (Chisolm et al., 2013). Compliance, in turn, depends
on the participant’s perceived benefit and enjoyment of the training
(Tye-Murray et al., 2012). Feedback after one speech-based auditory
training programme included a number of comments about the tedious
and repetitive nature of some of the exercises (Tye-Murray et al., 2012),
and Sweetow and Sabes (2010) reported that compliance was less than
30% for patients who were recommended a home-based auditory training
programme.
Musical training could offer an enjoyable alternative – at least for people
who have an interest in music – which could encourage compliance.
In order to design a suitable musical training programme, it is first
necessary to understand which skills are important for speech perception
in background noise. The next sections will consider the sensory cues
and cognitive processes which contribute to successful speech perception
in background noise.
1.2 A brief introduction to auditory scene analysis1.2.1 Setting the complex auditory sceneImagine you are sitting in a crowded restaurant listening to your friend tell
an anecdote. The couple at a nearby table are having a heated argument,
and in the far corner a large group are celebrating a birthday. Jazz music
is coming out of the speaker on the wall behind you; a clattering of plates
and pans can be heard from the kitchen; and through the open window you
can hear traffic noise from the busy street outside.
In a complex acoustic environment such as this, the information arriving at
your ears at any given moment is a combination of sound waves from all
the different sources. However, while your ears hear only a single mixture,
you perceive the sounds as coming from separate sources spread around

8 CHAPTER 1: INTRODUCTION
the room. You can identify these separate sources and choose to listen to
your friend’s voice while ignoring the background noise.
This is a remarkable feat, and an important one given that much of our
everyday communication occurs in less than ideal surroundings. In order
to attend to a target signal, it is necessary to separate out sounds coming
from different sources.
It is up to the brain to decode the combined information arriving at the ears
in order to create an accurate perception of the auditory environment, via
a process known as auditory scene analysis (Bregman, 1990).
1.2.2 Auditory scene analysisIn order to make sense of the auditory environment, the brain must
partition simultaneous acoustic information into separate auditory objects.
These auditory objects must also be grouped sequentially into streams from
each sound source as the signals unfold over time (Bregman, 1990).
Bregman (1993) outlined how environmental regularities can be utilised to
separate a waveform into auditory objects from different sources:
Temporal – sounds from a single source have synchronised onsets and
offsets, whereas sounds from two different sources are unlikely to
start and stop at the same time. If two sounds in the mixture are
asynchronous or overlap in time, these will be attributed to different
sources.
Spectral – many environmental sources (including voices and
musical instruments) produce harmonic sounds, meaning that
their component frequencies are multiples of a single fundamental
frequency. If the mixture contains subsets of frequency components
which are multiples of two different fundamentals, these subsets are
likely to be attributed to different sources.
Spatial – simultaneous sounds from a single source originate at the
same location. If sounds are spatially separated, then they are likely
to be perceived as coming from different sources.
Each of these cues can be unreliable in certain situations. For example,
sounds from different sources might occasionally be synchronised in
time; harmonic frequencies will not help to group noisy (inharmonic)

SELECTIVELY ATTENDING TOTARGET SPEECH 9
sounds; spatial information is not as useful in reverberant rooms. In
combination, however, there is sufficient redundancy that variations in the
reliability of individual cues do not necessarily affect perception in realistic
environments (Bregman, 1993).
Rules of environmental regularity also apply to the sequential grouping
of objects into streams, although the emphasis here is on how properties
change over time (Bregman, 1993):
Temporal – sounds, or sequences of sounds, from a single source tend
to either remain constant or change gradually. A sudden change in
frequency, intensity or location will be interpreted as the onset of a
new acoustic event from a different source.
Spectral – a change in acoustic properties affects all components of
an auditory object in the same way. Frequency components with
differing patterns of change will be assigned to different auditory
streams.
In summary, successful auditory scene analysis relies on the auditory
system’s ability to differentiate spectral and temporal properties of sounds
in order to segregate and group auditory objects.
This passive, bottom-up (i.e., stimulus-driven) processing is not the whole
story, however. A listener will often want to focus on a particular auditory
stream, while ignoring irrelevant sounds, and this requires active, top-down
attentional control.
1.3 Selectively attending to target speechSelective attention is the process by which a subject focuses on a
specific target object or characteristic and ignores task-irrelevant distractor
stimuli. This section introduces some basic concepts connected to selective
attention, before discussing some cues that can help to focus attention on a
target speech signal.
1.3.1 Endogenous and exogenous cuesAttention can be oriented using either salient cues which automatically
capture attention (exogenous) or symbolic cues which rely on the
participant voluntarily orienting attention in response to instructions
(endogenous).

10 CHAPTER 1: INTRODUCTION
Posner (1980) developed a visual cueing paradigm to orient covert spatial
attention. The term ‘covert’ refers to the fact that participants maintain
central fixation while attention is cued to the left or right in their peripheral
vision. Overt spatial attention, by comparison, involves eye movements
towards the attended location.
In this paradigm, a target stimulus is preceded by a cue, which is either
a centrally presented arrow (endogenous) or an abrupt-onset stimulus
presented in one of the possible target locations (exogenous). Performance
on the task (measured by reaction times or accuracy of perceptual
judgements) is compared for trials in which the cue correctly predicts target
location (valid) and for trials in which the cue is misleading (invalid) or
uninformative (neutral).
This method has been used to demonstrate that both endogenous and
exogenous orienting of attention result in enhanced performance, but
there are some important differences between the two types of cue (see
Table 1.2). For example, since endogenous attention must be deliberately
oriented by the participant in response to a symbolic cue, these cues must
be valid in the majority of trials or the participant will realise that the cues
are not helpful for the task and may stop using them altogether (Wright
and Ward, 2008). Conversely, exogenous cues are so salient that orienting
persists even when the participant is instructed to ignore them.
Table 1.2: Summary of themain properties of endogenous and exogenous orienting of visualcovert spatial attention (Egeth and Yantis, 1997; Posner, 1980;Wright andWard, 2008)Type of orienting Cue properties Participant task Time courseEndogenous(voluntary, active,goal-directed,top-down)
Symbolic cuespresented atfixation; majority oftrials must havevalid cues
Participant mustintentionally orientattention; reducedbenefit observed indual-task designs
Builds to peak300ms after cue;can bemaintainedfor longer periods
Exogenous(automatic, passive,stimulus-driven,bottom-up)
Salient cue into-be-attendedlocation; difficult toignore and need notbe predictive
No need forcompliance; benefitnot affected byconcurrent workingmemory demands
Peaks 100ms aftercue; dissipatesquickly unlessendogenousattention engaged
Another important distinction between endogenous and exogenous
orienting is the differential reliance on working memory resources.
SELECTIVELY ATTENDING TOTARGET SPEECH 11
Since endogenous cues require deliberate orienting of attention by the
participant, this process depends on working memory and is therefore
impaired by a concurrent working memory task. Conversely, exogenous
orienting happens automatically without the need of cognitive control, and
is therefore impervious to concurrent memory demands (Wright and Ward,
2008).
1.3.2 Attending to locationEarly investigations into selective attention used a dichotic listening
paradigm, in which different spoken messages were presented to each ear
simultaneously. Listeners were asked to shadow the message presented to
one ear – i.e., to repeat it back quickly and accurately – while ignoring
the message presented to the other ear (Cherry, 1953). Participants were
able to fully focus attention on the target ear, to the extent that they could
not recall any of the unattended message and even failed to notice if it
switched language part way through (Cherry, 1953). Changes in spectral
features of the ignored message were observed, however, with listeners able
to identify when the unattended voice was switched from male to female,
or was replaced by a pure-tone signal (Cherry, 1953).
A subsequent study reported that listeners often remembered noticing their
own name in the unattended message (Moray, 1959); a phenomenon
which has been dubbed the ‘cocktail party effect’. This is an example of
an exogenous cue, which captures attention despite the listener’s focus
being endogenously oriented to the target message. It has been shown
that listeners with high working memory capacity are less likely to notice
their name being presented in the unattended ear (Conway et al., 2001),
demonstrating the link between working memory capacity and attentional
control, or more specifically the ability to ignore distracting stimuli.
The dichotic listening studies demonstrated that selective attention can
successfully be focused on one ear while ignoring the other. However, in
everyday situations, it is unlikely that a target message will be heard in only
one ear with all the background noise in the other ear. It is more likely that
both ears will receive a mixture of target and noise.
More recently, investigators have manipulated the spatial configurations of
target and masker speech in order to examine listeners’ ability to selectively
attend to a single location.

12 CHAPTER 1: INTRODUCTION
The Coordinate Response Measure (CRM; Bolia et al., 2000) has often been
employed for such a purpose. It is a speech corpus in which all sentences
take the same form, e.g. ‘Ready, Baron, go to red five now’. Participants
listen out for a specific call-sign (e.g., ‘Baron’) in order to identify the target
sentence, and then report the colour and number heard. There are 32
possible colour–number combinations (4 colours; 8 numbers). One or more
masking sentences – with different call-signs, colours and numbers – are
played concurrently with the target.
When the target sentence and a masker sentence are spoken by the same
person and are presented from the same location, this task is extremely
difficult. Brungart (2001) reported that performance in this condition was
around chance level, and that the majority of incorrect answers were in fact
the colour or number which appeared in the masker sentence. This suggests
that listeners were able to segregate the concurrent sounds to correctly form
individual words, but they were unable to attribute the words to the correct
stream in the absence of further cues to aid attentional focus.
Spatial separation of the target and masker provides a perceptual benefit
compared to the condition in which they are colocated. This is referred
to as spatial release from masking. Figure 1.1 shows an example set-up
for this type of experiment. Multiple sound sources are placed equidistant
from the participant, along their audiovisual horizon, so that a speaker at
0◦ azimuth would be directly in front of the participant’s head.
Figure 1.1: Example configuration for a selective attention experiment using the CoordinateResponseMeasure

SELECTIVELY ATTENDING TOTARGET SPEECH 13
For a CRM task with two male speakers, a separation of just 10◦ (i.e.,
sources at ±5◦ azimuth) was enough to boost performance to about 90%
correct (Brungart and Simpson, 2007, Figure 4).
Allen et al. (2008) measured spatial release from masking using two
masking sentences which were presented either colocated with the target
(at 0◦ azimuth) or ±30◦ azimuth. Performance was measured in terms
of the speech reception threshold (SRT), i.e., the signal-to-noise ratio for
which performance equals 50%. There was significant spatial release
from masking, with a 12 dB improvement in threshold for the separated
compared to the colocated condition.
A third condition was also investigated, in which the maskers were initially
separated from the target but subsequently moved to be colocated. In this
condition, spatial cues were available during identification of the target
sentence (i.e., when the call sign was heard) but not during presentation
of the two key words. Performance for this condition was significantly
better than for the fully colocated condition, with a 3.6 dB improvement in
threshold. The authors suggested that the initial spatial separation afforded
allocation of attention to other characteristics of the target voice, which
enhanced ongoing streaming even after colocation of the maskers (Allen
et al., 2008).
1.3.3 Attending to voice characteristicsWhen the target and masker sentences are spoken by different people
(but still colocated), characteristics of the target voice can be used to aid
attention and enhance streaming. Figure 1.2 shows data from two studies
which demonstrate this phenomenon. In each case, the data shown are
from the condition in which target and masker sentences were presented
at the same intensity level (i.e., at a signal-to-noise ratio (SNR) of 0 dB),
meaning that level differences could not be used as an attentional cue
(Brungart, 2001).
Brungart (2001) compared conditions in which the masker was spoken by
the same person as the target, or a different person of the same gender, or
someone of the opposite gender. Comparing the scores for these conditions
(black triangles on Figure 1.2) demonstrates that greater differences in
voice characteristics (e.g., fundamental frequency) correspond to improved
performance on the task.

14 CHAPTER 1: INTRODUCTION
Figure 1.2: Performance on the CRM task under different target and masker conditions.Plotted using data from Figure 1 of Brungart (2001) and Figure 2 of Johnsrude et al. (2013)
Johnsrude et al. (2013) investigated the hypothesis that people would
be better at distinguishing a voice that they had had a lot of experience
listening to. Each participant’s spouse was used for either the target or
the masker sentence (or neither), while other sentences were spoken by
unfamiliar voices of the same gender. The data (white squares on Figure
1.2) show a significant benefit for listening to a familiar voice, and also for
ignoring a familiar voice, compared with unfamiliar voices.
Together these results show that differences between the target and masker
voices, including acoustic characteristics and prior familiarity, can be
exploited in order to selectively attend to a target voice and improve
perception.
1.3.4 Selective attention is limited by sensory processingIt is important to note that selective attention can only be employed when
the sound sources are perceptually separable (e.g., Brungart and Simpson,
2007; Cherry, 1953). If sensory processing is insufficient for successful
auditory streaming, then the listener will be unable to focus attention on a
single source. This was evident in an early experiment by Cherry (1953).
RECONSTRUCTINGADEGRADEDOR INCOMPLETE SPEECH SIGNAL 15
Two recordings of the same speaker were mixed and presented concurrently
to the subject. The listener found it extremely difficult to separate the
messages, and required many repetitions of the stimuli in order to identify
phrases from one of the messages (Cherry, 1953).
Similarly, in the CRM study mentioned above, when target and masker
sentences were colocated and spoken by the same voice, listeners
performed at chance level and often reported the colour or number from the
masker sentence (Brungart and Simpson, 2007). This signifies successful
formation of auditory objects, but a breakdown in the sequential streaming
of the two sources, which prevents attention being focused on the target
sentence.
These are extreme examples, of course, as a single person cannot
simultaneously speak two different messages. However, it highlights the
primary importance of sensory processing for understanding speech in
background noise, and goes some way to explaining why some people –
e.g., those with hearing loss – struggle with speech perception in complex
auditory environments. This will be discussed in more detail in Section 1.6
below.
In summary, as with the segregation and sequential organisation of sounds
via auditory scene analysis, there are multiple cues that can be used to
selectively attend to a target stream. Successful stream selection therefore
relies on the listener’s ability to differentiate the target voice on the basis
of these cues, and to focus attention accordingly. Furthermore, the ability
to selectively attend to a target and ignore distracting noises is associated
with working memory capacity.
Even with a range of available cues, it will not always be possible to
parse out a perfect signal from background noise, and some parts may
be completely masked. However, in the case of speech, understanding is
often robust even when the signal is degraded, and cognitive strategies can
compensate for gaps in the signal, as described in the next section.
1.4 Reconstructing a degraded or incomplete speech signalWhen listening to speech in quiet conditions, there is considerable
redundant information in the signal. For example, speech recognition can
be achieved using primarily temporal cues when spectral information is

16 CHAPTER 1: INTRODUCTION
severely degraded (Shannon et al., 1995). This inherent redundancy means
that speech perception can withstand considerable signal degradations such
as those caused by interfering background noise.
Even with such a robust signal, there may still be parts of the speech which
are completely masked by noise. Fortunately, there are other characteristics
of speech which can be exploited to reconstruct the signal.
Speech sounds are often influenced by preceding or subsequent sounds,
via coarticulation. If part of the speech is not heard due to noise, then
coarticulatory cues from neighbouring sounds might help to fill in the
gap. In fact, conversational speech can be understood even when periodic
silences replace parts of the signal, as long as the frequency of these
deletions is greater than 10 Hz (i.e., with silences of no more than 50 ms;
Miller and Licklider, 1950).
1.4.1 The role of linguistic knowledgeEven when coarticulatory information is not available, listeners can still
perceive a complete speech signal when part of a word has been completely
replaced by noise (Warren et al., 1970). This phenomenon is known as
phonemic restoration and it relies on linguistic knowledge. For example,
when the replaced phoneme was the first ‘s’ in the word ‘legislatures’, no
other phoneme would produce a meaningful word. In this case, participants
heard the complete word and perceived the noise to occur at another point
in time (Warren et al., 1970).
When there is ambiguity in the missing phoneme, i.e., when several
alternatives are possible, perception is influenced by the sentence context
(Warren et al., 1970). This demonstrates another source of redundancy
in speech which results from linguistic constraints. The rules of language
dictate syntactic structure which in turn allows predictions to be made
about upcoming word types (e.g., verb or noun). Semantic context also
provides information about which words are most likely to occur in order
for the sentence to have meaning.
Semantic information was manipulated in the development of the Speech
in Noise test (SPIN; Kalikow et al., 1977) which includes both low-context
and high-context sentences for each target keyword. Identification of
the final word is significantly easier when semantic context is provided
(high-context) than when no such clues to the meaning of the target word

RECONSTRUCTINGADEGRADEDOR INCOMPLETE SPEECH SIGNAL 17
are available (low-context), demonstrating the importance of semantic
context when listening to speech in challenging conditions.
Linguistic cues can be used to make predictions about upcoming words
and can also be used to fill in parts of the signal that were unable to
be separated from the background noise. This process relies on auditory
working memory, since the degraded signal must be stored and replayed
while contextual constraints are applied.
Zekveld et al. (2007) developed a visual analogue for this process of
linguistic closure, wherein written text is partially obscured by black bars.
The amount of masked text is varied adaptively to find the point at which
performance equals 50%, called the text reception threshold (TRT). When
the same sentence stimuli are used for both visual and auditory tests, the
shared variance of the text reception threshold (TRT) and speech reception
threshold (SRT) can be interpreted as the contribution of domain-general
linguistic and cognitive abilities. Zekveld et al. (2007) reported a shared
variance between the tests of about 30%, even after controlling for age.
1.4.2 Listening to speech inmodulated noiseFor a background noise that remains at a constant level, the masking of
speech sounds will be relatively uniform over time. In everyday listening,
it is more common to experience background noise which fluctuates in
intensity. The resultant fluctuations in signal-to-noise ratio allow for
additional information to be gleaned from the ‘dips’ in the noise, i.e.,
those times when the noise level drops and the speech can be heard more
clearly (e.g., Gnansia et al., 2008; Gustafsson and Arlinger, 1994; Miller
and Licklider, 1950).
The benefit for speech perception in amplitude-modulated noise compared
with steady noise is known as modulation masking release, and it varies
with the depth (Gustafsson and Arlinger, 1994; Gnansia et al., 2008) and
frequency (Fullgrabe et al., 2014; Gustafsson and Arlinger, 1994; Miller
and Licklider, 1950; Rhebergen et al., 2006) of the modulation. Masking
release increases with increasing depth of modulation (Gustafsson and
Arlinger, 1994; Gnansia et al., 2008), and this holds even when the
steady and modulated noises are equated in terms of overall intensity
(root-mean-square level). The increased benefit gained from deeper dips

18 CHAPTER 1: INTRODUCTION
in noise (i.e., higher SNRs for glimpsing) offsets any disadvantage from
greater peaks in noise where speech may be completely masked.
Maximal masking release has been observed for modulation frequencies
between 8 and 20 Hz (Fullgrabe et al., 2014; Gustafsson and Arlinger,
1994; Miller and Licklider, 1950; Rhebergen et al., 2006). At lower
frequencies, extended periods of high intensity noise mean that larger
portions of speech (e.g., whole words) will be completely masked. This
impedes reconstruction of the signal, despite facilitating speech perception
in the corresponding extended periods of low intensity noise.
Conversely, at higher frequencies, the opportunities for dip listening will be
shorter and good temporal resolution will be required to gain the maximum
information from these periods (Dubno et al., 2002). Once a partial signal
has been gleaned from the dips, linguistic cues and working memory can
be used to restore missing parts of the speech as discussed above.
1.5 The importance of temporal information in speechA speech signal unfolds over time and its temporal structure is important
for comprehension. When temporal information is degraded, there is a
corresponding reduction in speech intelligibility (Drullman et al., 1994a,b).
Conversely when temporal cues are preserved, speech can be intelligible
even when very little spectral information is available (Shannon et al.,
1995).
Syllable rate is also important for perception, and time-compressed signals
lead to reduced intelligibility Ghitza and Greenberg (2009). By increasing
the syllable rate three-fold, the intelligibility of the speech was greatly
reduced. Silent intervals of either equal or varied lengths were then
inserted into the compressed signals. Intelligibility was highest when
the original syllable rate was restored by inserting equal-length silences,
thereby recreating the rhythmic information from the original speech signal
(Ghitza and Greenberg, 2009).
Together these results suggest that rhythmic information contained in
the temporal envelope is useful for understanding speech. Given the
importance of rhythmic information for speech intelligibility, a number of
authors have proposed a role for prediction in models that could apply
to the perception of speech in challenging listening environments (Elhilali

THE IMPORTANCEOF TEMPORAL INFORMATION IN SPEECH 19
et al., 2009; Schroeder et al., 2008; Zion Golumbic et al., 2012). If
target onsets can be predicted, then listeners can orient attention to those
time-points in order to enhance processing.
1.5.1 Orienting attention in timeAs described in Section 1.3, cueing methods for endogenous and exogenous
orienting of attention have been clearly defined and explored in visual
spatial attention. However, the focus here is on orienting temporal
attention during an ongoing auditory signal. Just as spatial attention refers
to the orienting of attention to a point in space, temporal attention refers to
the orienting of attention to a point in time. The next sections will consider
how the concepts of endogenous and exogenous attention apply to auditory
temporal attention.
1.5.1.1 Endogenous orienting of attention to points in timeAuditory attention can be oriented cross-modally using visual cues. In
one study, lights above loud speakers were used to indicate when and/or
where a target signal would appear (Best et al., 2007b). When a light
cue indicated either the spatial location or the time interval, identification
accuracy was improved in comparison to a no cue condition. When
a combined cue provided both the target location and time interval,
performance was further enhanced, suggesting an additive effect of spatial
and temporal orienting of attention.
Another technique to orient temporal attention is to train participants to
expect the target at a certain point in time. If an auditory cue precedes the
target by a fixed interval on the majority of trials, then listeners will come
to expect the target after this time interval. Task performance for targets
at the expected time can then be compared to that for infrequent early
or late targets. This method has been used to demonstrate that temporal
attention enhances detection of pure-tone targets in both forward-masking
(target preceded by narrowband noise; Wright and Fitzgerald, 2004) and
simultaneous-masking (target presented in broadband noise; Werner et al.,
2009) paradigms.
These cueing methods are comparable to the endogenous cueing paradigm
described above for orienting visual spatial attention. They use symbolic
or learnt cues to instruct participants when to attend, and the majority of
trials have valid cues. Any benefit for validly cued targets is reliant on

20 CHAPTER 1: INTRODUCTION
deliberate control of attention by the participant, and as a consequence the
effect is diminished by a concurrent working memory task (Capizzi and
Correa, 2012). In other words, the concept and methods of endogenous
cueing apply equally well to both spatial and temporal attention.
1.5.1.2 Exogenous orienting of attention via rhythmic primingIn spatial attention, an exogenous cue is a stimulus which precedes the
target in the to-be-attended location and is salient enough to automatically
capture attention. It has been suggested that an abrupt-onset stimulus also
draws attention to its temporal locus, via ‘reactive attending’ (Jones et al.,
2002). However, for the purposes of the current thesis, it is more relevant
to consider orienting temporal attention to future events, via ‘anticipatory
attention’ (Jones et al., 2002).
Auditory anticipatory attention can be oriented via rhythmic regularities
in a priming sequence. According to dynamic attending theory (Jones
and Boltz, 1989; Large and Jones, 1999), attention will automatically
entrain to an external rhythmic stimulus so that peaks in attention coincide
with predicted onsets in the ongoing rhythm. Stimuli which match these
expectations will therefore benefit from enhanced processing compared to
those which do not align with expected onsets (see Figure 1.3).
Figure 1.3: Illustration of dynamic attending theory: an external rhythmic stimulus drivesanticipatory attention in order to orient temporal attention to predicted future onsets (Joneset al., 2002)
There is a growing body of evidence in support of dynamic attending theory.
Jones et al. (2002) were the first to demonstrate that rhythmic priming

THE IMPORTANCEOF TEMPORAL INFORMATION IN SPEECH 21
can enhance auditory processing for non-temporal tasks. Participants
were required to compare the pitch of a standard and a comparison
tone which were separated by an isochronous (equally spaced in time)
sequence of tones. When the comparison tone occurred on the next beat
of the sequence, performance on the pitch task was better than when the
comparison tone occurred between beats. The performance profile was
quadratic in shape, centred around the on-beat position, consistant with a
peak in anticipatory attention in line with the beat of the sequence (Figure
1.3). To test the assumption that entrainment persists beyond the end of
the external stimulus, the experiment was repeated with targets presented
on or around the next but one beat of the sequence. As predicted, a
similar performance profile was obtained: quadratic in shape with peak
performance for on-beat targets. Finally, when an irregular (i.e., no
isochronous beat) priming sequence was used, the expectancy profile was
flatter, without the characteristic quadratic trend associated with peaks in
anticipatory attention Jones et al. (2002).
Rhythmic priming effects have also been shown to enhance perception of
speech targets in quiet. A musical rhythm sequence was used to prime
expectations in a phoneme detection task, and reaction times were shorter
for on-beat compared to late targets (Cason and Schon, 2012).
The beneficial effects of rhythmic priming do not rely on deliberate
orienting by participants; in fact, they persist even when participants are
instructed to ignore the priming stimuli (Bolger et al., 2013; de la Rosa
et al., 2012; Jones et al., 2002). The process is also unaffected by a
concurrent working memory task (de la Rosa et al., 2012), suggesting that
rhythmic priming does not place high demands on cognitive control. In
these respects, rhythmic priming is comparable with the classic exogenous
cueing paradigm (see Table 1.2).
One way in which the paradigms diverge is in the apparent temporal
specificity of exogenous predictive orienting in the auditory domain. In
one study, Rimmele and Sussman (2011) compared the effects of implicit
temporal and spatial orienting in audition. The stimuli consisted of a
moving sequence of 12 tones, followed by a burst of white noise and then a
final tone. The final tone was either a target (complex tone) or a non-target
(pure tone) and participants were required to respond as quickly as possible
only to target stimuli. Temporal regularity in the tone sequence resulted in

22 CHAPTER 1: INTRODUCTION
faster and more accurate responses, while spatial predictability provided no
behavioural benefit for the go/no-go task (Rimmele and Sussman, 2011).
1.5.2 Rhythmic priming during speech listeningIn an early study, Meltzer et al. (1976) manipulated the timing of phoneme
targets in a sentence context such that they could occur early, on-time or
late with respect to the target’s original position in the unaltered sentence.
When targets were temporally displaced, listeners were slower to react
than when the target coincided with the on-time position (Meltzer et al.,
1976). This suggests that listeners do form temporal predictions to orient
attention during speech listening. There is also some evidence that listeners
orient temporal attention to word onsets when listening to narrative speech
(Astheimer and Sanders, 2009).
While speech does not necessarily contain a strictly isochronous beat, it
does make use of acoustic emphasis, and the pattern of stressed and
unstressed syllables – referred to as meter – creates a sense of rhythm. In
fact, listeners perceive regularity even when the speech signal does not
contain strict isochrony (Schmidt-Kassow and Kotz, 2009). Listeners can
also tap along to the pattern of stressed syllables, just as they would tap
along to the beat in music (Lidji et al., 2011).
It has been suggested that listeners use this rhythmic metric structure to
orient attention towards stressed syllables, and that attention ‘bounces’
from one stressed syllable to the next (the attentional bounce hypothesis;
Pitt and Samuel, 1990).
To investigate this hypothesis, Pitt and Samuel (1990) used a
phoneme-detection task and compared performance for neutral-stress
targets in syllables which were predicted to be stressed with those in
syllables which were predicted to be unstressed. When the targets
were embedded in a sentence context, fewer errors were observed for
predicted-stress targets, but there was no significant difference in reaction
times. In a second experiment, lists of disyllabic words – with matching
stress patterns (either weak–strong or strong–weak) – were used to create
a stronger sense of alternating stress. Reaction times were significantly
shorter for targets occurring in predicted-stress syllables (Pitt and Samuel,
1990).

A LIFESPANPERSPECTIVEON SPEECHPERCEPTION INNOISE 23
A similar paradigm, with phoneme targets embedded in lists of disyllabic
words, was used by Quene et al. (2005). An additional manipulation
was applied so that the temporal intervals between stressed syllables were
either identical (isochronous rhythm) or jittered. Reaction times to a
phoneme target were significantly shorter for the isochronous compared
to the jittered condition, suggesting that increased rhythmic regularity can
improve speech perception (Quene et al., 2005).
Together these results support the idea that temporal attention is oriented
towards stressed syllables. The benefit of anticipatory attention depends
on the strength of the rhythmic information available in the speech context,
and this can be enhanced via the use of predictable stress patterns and
temporal regularity.
1.6 A lifespan perspective on speech perception in noiseUnderstanding speech in background noise is a complex process which
relies on a variety of perceptual, cognitive and linguistic skills, as discussed
above and summarised here:
Spectral resolution – to separate concurrent sounds in terms of
fundamental frequency or mistuned harmonics
Temporal resolution – to separate auditory objects with asynchronous
onsets/offsets; to take advantage of dip listening in modulated noise
Selective attention – to aid streaming by focusing on properties of the
target speech, such as voice characteristics or spatial location
Working memory – to aid attentional control and inhibition of
distractors; to store and replay the degraded speech signal while
linguistic constraints are applied
Linguistic knowledge and experience – to restore missing parts of the
signal using coarticulatory cues, phonemic restoration, or syntactic or
semantic context
The capacity to use all of these skills develops with age and experience,
and there is great individual variation in speech perception in noise. The
perceptual and cognitive skills develop at different rates during childhood
and are also subject to age-related decline in older adulthood. Young
children and older adults are therefore believed to be at a disadvantage

24 CHAPTER 1: INTRODUCTION
when it comes to speech perception in noise (e.g., Pichora-Fuller et al.,
1995; Stuart, 2008).
1.6.1 Development during childhoodFor speech in quiet conditions, children reach adult levels of perception
at around 8 years of age (Stuart, 2005, 2008). For speech in background
noise, development depends on the masker (Nishi et al., 2010; Bonino et al.,
2013) and in some conditions perception does not reach adult levels until
about 14 years of age (Hall et al., 2012; Johnson, 2000; Stuart, 2008).
This is not surprising given the variety of perceptual, cognitive and
linguistic skills that are required for successful speech perception in noise,
all of which develop at different rates:
Spectral resolution – reaches adult levels of performance by age 6
years (Hartley et al., 2000); younger children (5–7 years) require
more spectral information than older children (10–12 years) for
comprehension of degraded speech (Eisenberg et al., 2000)
Temporal resolution – is still developing at age 11 years (Hartley et al.,
2000; Stuart, 2005); modulation masking release is reduced in young
children (4–6 years) compared to adults (Hall et al., 2012), but does
not appear to improve with age for children aged 6–15 years (Stuart,
2008)
Working memory – older children (10–12 years) have better auditory
working memory than younger children (5–7 years) (Eisenberg et al.,
2000)
Spatial release from masking – young children (4–7 years) do benefit
from spatial separation of target and masker, and the amount of
masking release is similar to that experienced by adults (Litovsky,
2005)
Linguistic knowledge and experience – young children (5 years) do
benefit from linguistic context when age-appropriate language is used
(Fallon et al., 2002)
In summary, children can benefit from spatial release from masking,
modulation masking release, and linguistic context, but their perception

A LIFESPANPERSPECTIVEON SPEECHPERCEPTION INNOISE 25
of speech in noise is hindered by still developing sensory and cognitive
systems.
1.6.1.1 Consequences of noisy classroomsFor children, much of their everyday communication takes place in a
classroom environment. Understanding what the teacher is saying is crucial
to the purpose of a classroom. Neuman et al. (2010) measured speech
reception thresholds for sentences in background noise conditions which
are typical of school classrooms. Speech thresholds improved as a function
of age for normal-hearing children aged 6–12. Younger children (aged 6–8)
performed worse than older children (aged 10–12) who in turn performed
worse than adults (Neuman et al., 2010).
In a study of 8-year-old children, learning in a noisy classroom was
associated with poor performance on tests of phonological processing, as
well as higher annoyance levels and less favourable relationships with
teachers and peers (Klatte et al., 2010). These results suggest that
the ability to understand speech in background noise has an impact
on academic achievement, social relationships, and the child’s overall
experience at school. For children with learning or language impairments,
who often struggle to understand speech in noise (e.g., Ziegler et al., 2009),
the detrimental effects of a noisy classroom may be considerable.
1.6.2 Decline during older adulthoodA recent large-scale population study reported subjective and objective
hearing measures for adults aged 40–69 across the United Kingdom (Moore
et al., 2014). Subjective reports of hearing difficulties increased linearly
with age. Speech perception in noise declined exponentially with age,
with a steeper rate of change after age 50. Performance on cognitive
tests (including working memory and processing speed) also declined
with increasing age, and these scores were related to speech perception
thresholds (Moore et al., 2014).
These results are in line with previous reports that older adults struggle
with speech perception in noise due to a combination of hearing loss and
cognitive decline (e.g., Humes, 1996; Pichora-Fuller et al., 1995; Schneider
et al., 2002).

26 CHAPTER 1: INTRODUCTION
People with hearing loss demonstrate impaired performance on tests of
temporal resolution (George et al., 2007), speech perception in steady and
modulated noise (George et al., 2007; Hall et al., 2012) and modulation
masking release (Hall et al., 2012). For hearing-impaired listeners,
audibility is the most important factor for speech perception in noise,
although cognition does also play a part (Akeroyd, 2008; George et al.,
2007).
Even those older adults with clinically normal hearing perform worse than
younger hearing-matched controls on tests of speech perception in noise,
which has been attributed to cognitive decline (Fullgrabe et al., 2014).
In fact, for normal-hearing listeners, conclusions about speech perception
in noise abilities appear to depend mainly on cognitive factors (Fullgrabe
et al., 2014; George et al., 2007).
Older adults do, however, benefit as much as younger adults in terms
of both modulation masking release and spatial release from masking
(Fullgrabe et al., 2014). They also benefit from a lifetime’s experience of
listening to speech. While perception of an unfamiliar voice amid masking
speech declines with increasing age, no age-related decline is observed
when the target speaker is the listener’s spouse (Johnsrude et al., 2013).
Pichora-Fuller et al. (1995) compared the performance of young
normal-hearing adults, older normal-hearing adults, and older
hearing-impaired adults using high and low context sentences in noise.
In terms of overall performance, the younger adults did better than
the older normal-hearing adults, who in turn did better that the older
hearing-impaired adults. The interesting finding was that both groups of
older adults achieved greater benefit from semantic context than did the
younger adults (Pichora-Fuller et al., 1995).
The findings from Pichora-Fuller et al. (1995) suggest that older adults may
rely on their linguistic experience to to fill in the extra gaps in a speech
signal which result from perceptual impairments. Dependence on this
compensatory mechanism appears to come at a price in terms of cognitive
effort, as demonstrated by a concurrent working memory task combined
with a speech perception in noise test (Pichora-Fuller and Souza, 2003). At
challenging signal-to-noise ratios, Pichora-Fuller and Souza (2003) found
that older adults could recall fewer words, suggesting that working memory
resources were allocated to the processing of the degraded signal. This

MUSICIANADVANTAGE FOR SPEECHPERCEPTION INNOISE 27
explanation is supported by the authors’ clinical experience with older
adults. Even those with normal hearing report that listening to speech
in everyday situations requires a lot of effort and is therefore very tiring
(Pichora-Fuller et al., 1995). For older adults with hearing loss, this
problem will be compounded, as even in quiet a verbal memory task is
impacted by the extra effort required to process auditory stimuli (McCoy
et al., 2005).
In summary, age-related decline in auditory perception and cognitive ability
leads to poorer speech perception in noise by older adults. A lifetime of
linguistic experience can partially compensate for a degraded speech signal,
but this requires additional cognitive effort. Everyday communication may
become frustrating and tiring as a result, and this could lead to avoidance
of social events and a decline in well-being (Schneider et al., 2002).
1.7 Musician advantage for speech perception in noiseYoung children and older adults are two groups who could potentially
benefit from a training programme to improve speech perception in noise.
At the other end of the scale, musicians may have an advantage for speech
perception in noise, the evidence for which is discussed in this section.
1.7.1 Evidence from group comparison studiesGiven the evidence that musicians have enhanced perceptual and cognitive
abilities related to auditory scene analysis (see Section 1.1.1), it follows
that they should have an advantage when it comes to speech perception in
noise.
The first direct evidence for a link between musical training and speech
perception in noise was reported by Parbery-Clark et al. (2009). Young
adult participants (aged 19–31) completed two sentence-in-noise tests:
HINT (Nilsson et al., 1994) – which uses simple sentences in a steady
speech-spectrum noise – and QuickSIN (Killion et al., 2004) – which uses
more complex sentences in a babble masker.
Musicians outperformed non-musicians on both speech tests,
demonstrating a significant musician advantage for speech perception
in noise (Parbery-Clark et al., 2009). Performance on QuickSIN was
correlated with years of musical training, suggesting a possible dose
response. There was no difference between the groups for the easier

28 CHAPTER 1: INTRODUCTION
HINT condition in which the target sentence and masker were spatially
separated. A similar musician advantage for QuickSIN and HINT was also
found for older adults (45–65 years with normal hearing; Parbery-Clark
et al., 2011).
These studies both reported statistically significant group differences, but
the observed musician benefit for speech reception thresholds was small
(<1 dB). Results from subsequent studies cast doubt on the reproducibility
of a musician enhancement for speech perception in noise.
Zendel and Alain (2012) reported that older musicians showed less
age-related decline for speech perception in noise (QuickSIN). However,
no group difference is apparent for the younger adults in their Figure 4
(Zendel and Alain, 2012).
Ruggles et al. (2014) reported no group difference for musicians versus
non-musicians on QuickSIN or HINT, despite using similar criteria for
defining their groups as did Parbery-Clark et al. (2009). Similarly, no
musician advantage was observed for perception of HINT-like sentences in
a range of maskers: competing speech (different gender talker), rotated
speech (unintelligible), speech-modulated noise, steady noise (Boebinger
et al., 2015). Boebinger et al. (2015) reported that more than two hundred
participants would be needed to find a significant group difference if the
observed effect size was accurate.
A recent study aimed to elucidate the nature of any musician advantage for
speech perception in noise (Swaminathan et al., 2015). By manipulating
masker intelligibility and spatial separation, four test conditions were
created which varied in difficulty and cognitive demands. The use of
intelligible speech maskers and spatially separated sound sources was
intended to be more ecologically valid than clinical tests such as HINT and
QuickSIN.
In this study, target and masker sentences always took the form: [name]
[verb] [number] [adjective] [object], with 8 possible options for each word.
The target sentence was identified by use of the name ‘Jane’ (e.g., ‘Jane took
two new toys’), while the two masker sentences used different names.
The target and masker sentences were spoken by different female voices,
which were randomly selected on each trial. The target always originated
from straight ahead, while the masker sentences were either colocated with

MUSICIANADVANTAGE FOR SPEECHPERCEPTION INNOISE 29
the target or separated by ±15◦ azimuth. The masker sentences were
either presented forward (intelligible) or were reversed on a word-to-word
basis (to make them unintelligible while maintaining speech-like amplitude
modulation). See Figure 1.4 for a summary of the conditions and main
findings from Swaminathan et al. (2015).
In the most difficult condition, where the maskers were intelligible and
colocated with the target, performance was universally poor, with no
group difference between musicians and non-musicians. Conversely, in
the easiest condition (unintelligible maskers spatially separated from the
target) all listeners performed well, again with no group difference. This is
comparable to the spatially separated HINT condition for which no group
difference was reported by Parbery-Clark et al. (2009). The other two
conditions provided more interesting results.
Figure 1.4: Experimental conditions and results from Swaminathan et al. (2015)
When unintelligible maskers were colocated with the target, a significant
musician advantage was observed (Swaminathan et al., 2015). This
condition is comparable to QuickSIN which also uses a colocated modulated
masker, but the threshold difference was greater than that previously
reported by Parbery-Clark et al. (2009). It could be that the two
reversed-speech maskers provided more frequent and deeper dips in which
to glimpse the target, compared to the multi-talker babble used in QuickSIN.
Success in this condition would therefore rely on both perceptual and

30 CHAPTER 1: INTRODUCTION
cognitive skills to extract the target from the maskers and fill in the
gaps in the signal, as discussed in Section 1.4.2. The thresholds in this
condition showed greater individual variability compared to the easier
spatially separated unintelligible masker condition.
When intelligible maskers were spatially separated from the target,
musicians had an even greater enhancement in threshold and demonstrated
significantly more spatial release from masking (Swaminathan et al., 2015).
The authors considered this to be the most ecologically valid condition,
similar to having a conversation while other people are talking nearby,
and also cognitively demanding. As discussed in Section 1.3.2, spatial
separation allows the listener to take advantage of voice characteristics in
order to selectively attend to a target sentence (Allen et al., 2008). In this
condition, masking sentences were intelligible, confusible with the target,
and also spoken by female voices, making it crucial to take advantage of
the spatial separation to succeed. This reliance on cognitive as well as
perceptual abilities resulted in a large group difference and a wide range of
individual variation among the non-musicians.
The findings of Swaminathan et al. (2015) add support to the idea of
a musician enhancement for speech perception in noise, and suggest
important considerations for future work in this field. Speech perception
tasks should be sufficiently difficult (though not impossible) to place high
demands on both perceptual and cognitive abilities in order to maximise
individual variability and provide the best chance of observing group
differences. The greatest difference was observed for spatially separated
intelligible maskers, although the colocated unintelligible (modulated)
masker condition also resulted in a significant musician advantage
(Swaminathan et al., 2015). These two conditions are therefore good
candidates for use in further research in this field.
1.7.1.1 Limitations of defining comparison groupsAll of the studies discussed in the previous section involved comparisons
between a group of musicians and a group of non-musicians. This approach
has provided valuable insights into the brains and behaviours of musicians
as expert listeners, as discussed in Section 1.1.1, but it is not without its
shortcomings. The most obvious limitation is that it is not possible to infer
causation from a cross-sectional design, as discussed above. However, there
are also pitfalls associated with defining the comparison groups.

MUSICIANADVANTAGE FOR SPEECHPERCEPTION INNOISE 31
Defining ‘musicians’In each of the studies discussed above, participants were included in a
musician group only if they met a number of strict criteria. For example,
Parbery-Clark et al. (2009) defined musicians as those who started formal
music training before age 7, had played for at least 10 years, and had
continued to practise at least 3 times per week in the 3 years leading up
to the study.
Although similar criteria were used to define the groups in each study, it is
not clear which of these criteria might be sufficient for the question at hand.
If all of these criteria are in fact necessary to observe a musician advantage
for speech perception in noise, then it is unlikely that a short-term musical
training programme – particularly one for older children or adults – would
have the desired impact.
Despite the seemingly stringent criteria for musicians, there is one
factor that has rarely been considered: the instruments they play. A
comparison of percussionists, string players and non-musicians produced
an interesting pattern of results for auditory tasks (Rauscher and
Hinton, 2003). Percussionists outperformed non-musicians on duration
discrimination, while string players outperformed non-musicians on
frequency discrimination (Rauscher and Hinton, 2003). These results are
perhaps not surprising given the nature of the two instrument groups:
percussionists require precise timing perception while string players require
precise pitch perception to tune their instruments.
The type of instrument also has an impact on the musician advantage
for speech perception in noise. Drummers achieved significantly better
thresholds for QuickSIN compared to non-musicians, with vocalists in
between these groups (although not significantly different from either)
(Slater and Kraus, 2015). Findings such as these confirm that caution
should be exercised before assuming that results from group comparison
studies will generalise to all musicians.
Defining ‘non-musicians’Non-musicians are often quite simply defined as having little or no formal
musical training. For example, Parbery-Clark et al. (2009) selected
non-musicians who failed to meet their musician criteria and had not had
any musical training in the 7 years prior to the study.

32 CHAPTER 1: INTRODUCTION
The focus on formal instrument training doesn’t take into consideration
other musical experience which could contribute towards the development
of musical ability. Self-taught instrumentalists, choral singers, or DJs, for
example, could be counted as non-musicians as they might not have had
formal training.
Another potential problem with group comparisons is that the musician
advantage for speech perception in noise might be mediated by musical
aptitude or ability rather than involvement in training. If this were the
case, then the results could be confounded by ‘musical non-musicians’,
i.e., people who have an aptitude for music but who have never pursued
formal musical training. There would then be considerable overlap between
the two groups, and this could explain some of the contradictory findings
discussed above (e.g., Ruggles et al., 2014, Figure 3).
1.7.2 Evidence from a longitudinal training studySlater et al. (2015) recently reported promising results from a longitudinal
study looking at the impact of musical training on speech perception in
noise. Participants (mean age 8.2 ± 0.7) were recruited from the waiting
list of an established community music programme, which provides free
access to musical training for children in low-income areas. After an initial
assessment, the children were randomly assigned to two groups: one group
started training immediately, while the other started after one year and
therefore acted as a control group during the first year. A significant
improvement in HINT threshold (2.1 dB) was observed after 2 years of
musical training (Slater et al., 2015), and the final HINT threshold was
correlated with the number of hours of instrument training.
No significant improvements in speech threshold were found for either
group after their first year of training, although some individuals did show
significant improvement after just one year (Slater et al., 2015). The
authors discussed these findings in terms of the length of time needed
for far transfer of skills from music to speech (Slater et al., 2015). It is
worth noting, however, that the design of the music programme involved a
comprehensive musicianship course of up to a year before children started
instrumental lessons. It is therefore possible that transfer occurred more
quickly than assumed, but after an initial delay.

DESIGNINGAMUSICAL TRAINING PROGRAMME 33
The latter is a more encouraging explanation when considering a short-term
intervention for improving speech perception in noise, and several studies
have reported near and far transfer effects after relatively short musical
training programmes (see Table 6.7).
Figure 1.5 summarises speech perception in noise across the lifespan:
perception develops and later declines with age, while musician advantages
have been observed for each age group.
Figure 1.5: Development of speech perception in noise across the lifespan and throughmusical training
1.8 Designing amusical training programmeThe studies in Table 6.7 provide some useful insight into different
approaches to designing a musical training programme.
Most of the studies included instrumental lessons, either as the major focus
of training or as a smaller part of classroom lessons, although Moreno et al.
(2011) had some success using primarily listening activities. The training

34 CHAPTER 1: INTRODUCTION
was generally quite time-intensive, involving lessons or practice on several
days of the week. Although this is typical of musical training, it may not
be practical as an intervention if it must be sustained over a long period.
These studies are persuasive as an argument for including music education
in schools or in residential homes for older adults, but it is not clear if such
programmes would work for short-term rehabilitation.
One noticeable commonality among the training studies is that all but
one attempted to recreate a comprehensive musical programme based on
established methods, which encompassed a range of key skill areas such
as rhythm, pitch, melody, timbre and sometimes musical theory. Such
multifaceted training is time consuming, and likely contains elements
which do not directly contribute to the outcome measure of interest.
The one exception was the study with dyslexic children which focused on
rhythm and timing skills (Overy, 2003). It had previously been shown that
dyslexic children have deficits in timing tasks (e.g., Goswami et al., 2002),
so it was logical to target the training accordingly.
An ideal training programme would retain the varied, engaging, motivating
nature of music-making, while minimising redundancy associated with
irrelevant skills. The approach taken in the current research is to first
identify specific musical skills which contribute to speech perception in
noise, so that an efficient, targeted training programme can be devised.
With the OPERA hypothesis in mind, a targeted musical training
programme for speech perception in noise should focus on processes which
are common to both music and speech. Auditory working memory is
certainly one such process. However, if working memory does mediate the
musician enhancement for speech perception in noise (Kraus et al., 2012),
then this could be a consequence of the complex, cognitively demanding
nature of musical training rather than a benefit afforded specifically by
music.
Instead, the approach taken in this research is to focus on key aspects of
music perception and consider how each of these might be useful for speech
perception in noise.

DESIGNINGAMUSICAL TRAINING PROGRAMME 35
1.8.1 Pitch andmelodyAs summarised in Section 1.6, spectral resolution and selective attention
to frequency over time can both aid speech perception in background noise.
Furthermore, frequency discrimination is enhanced in musicians and is also
associated with speech perception thresholds in babble noise (Parbery-Clark
et al., 2009).
In musical terms, frequency relates to pitch, and changes in pitch over time
create melodies. Pitch contours are also an important aspect of speech, and
artificially manipulated contours result in impaired perception of speech
in background noise (Miller et al., 2010). Musicians have enhanced
perception of pitch contours in both music and speech (Schon et al., 2004),
suggesting that melody perception could be a potential candidate skill for
targeted training.
1.8.2 Rhythm and beatMusic consists of temporal patterns – rhythms – based around an
isochronous (equally spaced in time) beat. The rhythmic structure of
speech consists of patterns of alternating stressed and unstressed syllables
– meter. While speech meter does not necessarily contain strict isochrony,
listeners can perceive and entrain to regularity in speech (Lidji et al., 2011;
Schmidt-Kassow and Kotz, 2009) as they do with music.
There is also evidence that instrumental music reflects the spoken prosodic
rhythms of the language of the composer (Patel and Daniele, 2000),
suggesting a link between rhythm in speech and in music.
Disruptions in temporal information result in impaired speech perception
(Drullman et al., 1994a,b; Ghitza and Greenberg, 2009), confirming the
importance of rhythm in speech. Musicians have enhanced rhythm
discrimination and this is also associated with speech perception in noise
(Slater and Kraus, 2015).
There is also evidence for impaired rhythm and beat processing in groups
of children who often have difficulties with speech perception in noise.
For example, children with specific language impairments had difficulty
tapping along to a beat (Corriveau and Goswami, 2009), children with
auditory processing disorder were impaired in a rhythm task (Olakunbi

36 CHAPTER 1: INTRODUCTION
et al., 2010), and dyslexic children had deficits in beat perception
(Muneaux et al., 2004).
Together, these findings suggest that rhythm and beat perception – along
with melody – should be considered as candidate skills for a musical
training programme for speech perception in noise.
1.9 Research questions and outline of thesisThe ultimate goal of this research is to design and evaluate a
short-term musical training programme for improving speech perception
in background noise.
As discussed above, an efficient training programme will target
specific musical skills which might contribute to speech perception in
noise. This approach should reduce the redundancy associated with
a comprehensive musical programme while maintaining the enjoyable
nature of music-making which promotes it as a promising alternative to
speech-based auditory training.
Figure 3.5 illustrates the general approach taken in this thesis. The aim
is to elucidate how musical training might lead to enhancements in speech
perception in noise, in order to inform the design of the training programme
to be evaluated.
Figure 1.6: Flowchart illustrating the research questions investigated in this thesis
This approach is divided into three research questions, which will be
investigated in turn:
Question 1: Are there specific musical skills which are associated with
speech perception in noise?
Question 2: How might these skills contribute to speech perception in
noise?

RESEARCHQUESTIONSANDOUTLINEOF THESIS 37
Question 3: Can short-term training in these musical skills improve
speech perception in noise?
Before embarking on an investigation of musical skills and speech
perception in noise, it is crucial to select appropriate measures for each
skill to be tested. Chapter 2 will outline the general methods and tests to
be used in this research, and discuss the reasons for choosing these.
Chapter 3 will focus on identifying specific musical skills which could
be targeted for training. The aim is to find measurable skills which
are correlated both with amount of musical experience and with speech
perception in noise. The sample will be drawn from the general population,
thereby avoiding the pitfalls associated with defining ‘musician’ and
‘non-musician’ groups, as discussed in Section 1.7.1.1.
Possible mechanisms for how the identified musical skills aid speech
perception in noise will be investigated in Chapters 4 and 5. The
developmental aspect of such mechanisms will also be considered in a study
comparing young children and adults.
Chapter 6 will discuss the design of a musical training programme based
on findings from the previous chapters. The impact of the musical training
programme on speech perception in noise will be evaluated for a group of
older adults.
Finally, Chapter 7 will summarise and discuss the main findings of this
thesis, consider limitations of the studies, and suggest directions for future
research.


CHAPTER2General methods
The first goal of the current research is to identify musical skills which mightunderlie the reported link between musical training and speech perception innoise. To do this, it is first necessary to identify suitable tests for assessingspeech-in-noise perception, musical experience, and musical skills. Thischapter describes the requirements for each of these measures and thereasons for choosing the tests to be used in this thesis. Psychophysicalmethods of presenting stimuli and estimating perceptual thresholds are alsointroduced as these are used in Chapters 4 and 5.
2.1 Quantifyingmusical experienceIn order to investigate the association between musical training and
speech-in-noise perception in the general population, it is necessary to have
an appropriate quantifiable measure of musical experience.
2.1.1 Measuringmusical trainingIn studies which compare musicians and non-musicians, the musician
group are usually defined by criteria such as duration of formal training,
age at onset of training, and amount of time spent practising their
instrument (e.g., Parbery-Clark et al., 2009; Zendel and Alain, 2012).
These variables are often then used as proxy measures for musical training
when investigating a possible dose response on some other variable (e.g.,
Parbery-Clark et al., 2009).
39

40 CHAPTER 2: GENERALMETHODS
Non-musicians are usually those who do not meet the musician criteria and
report having no (or little) formal training. This leaves open the possibility
of having ‘musical non-musicians’, i.e., people who have aptitude or skill
in music but have never pursued formal musical training (as discussed in
Section 1.7.1.1). There are many types of musical experience that would
not be counted as formal training but nevertheless are likely to improve
musical skills.
Since one of the aims of this research is to investigate musical skills in
the general population, it would be useful to have a measure of musical
experience which is not limited to formal training, and would therefore
provide informative (non-zero) scores for musical non-musicians.
One such measure, which has been designed specifically to quantify facets
of musical sophistication in the general population, is the Goldsmiths’
Musical Sophistication Index (Mullensiefen et al., 2011). The index
contains several subtests, one of which focuses on musical training, as
described below.
2.1.1.1 Goldsmiths’ Musical Sophistication IndexThe training subscale of the Goldsmiths’ Musical Sophistication Index
(Mullensiefen et al., 2011) consists of 9 items, encompassing questions on
both formal instrument training and informal musical experience. Figure
2.1 shows the training subscale in the form that it was presented to
participants in the current research.
Figure 2.1: The nine questions of the training subscale of the Goldsmiths’ MusicalSophistication Index (Mullensiefen et al., 2011); each item is scored from 1 to 7 (the firstthree items are scored on a reversed scale as they are negative statements)

ASSESSINGMUSICAL SKILLS 41
2.2 Assessingmusical skillsAs outlined in Section 1.9, the first aim of this thesis is to investigate
whether specific musical skills are related to speech perception in
background noise within a sample of people with a range of musical
experience. The three aspects of musicality that were identified as potential
predictors are melody, rhythm and beat perception (see Section 1.8).
Tests for each of these three skills are required, which are:
independent – separate scores are needed for the three musical skills
suitable for use with the general population – tests must not require any
prior musical knowledge to understand the instructions or perform
the tasks
auditory perception tasks – tests must not include musical production
tasks which would require expertise, nor tasks which are reliant on
auditory-motor synchronisation as this could confound results
sensitive to individual differences – a wide range of scores is needed in
order to investigate relationships with other variables.
2.2.1 Melody and rhythmThere are several commonly used test batteries for musical skills, many
of which have been developed for specific populations. For example,
the Montreal Battery of Evaluation of Amusia (MBEA; Peretz and Hyde,
2003) uses a same/different paradigm to assess five separate melodic and
rhythmic skills. However, as these tests were designed for use with people
who have impaired musical abilities, there would be a ceiling effect with
trained musicians. Conversely, an imitation test, which requires some level
of musical performance to reproduce a heard rhythm or melody, might have
a floor effect when used with non-musicians.
A popular measure of musical aptitude is Gordon’s Advanced Measures
of Musical Audiation (AMMA; GIA Publications, Inc., Chicago, IL, USA).
This test assesses memory for melodic and rhythmic patterns using a
same/different paradigm. Participants hear two musical phrases and must
judge whether the second is the same as the first or differs in either rhythm
or melody. One issue with this test is that the rhythm violations occur within
a melodic context. The two scores are not entirely independent, as they are

42 CHAPTER 2: GENERALMETHODS
susceptible to attention effects, e.g., a preference for attending to melody
over rhythm or vice versa. For this reason, the AMMA is not well-suited for
the intended purpose.
2.2.1.1 Musical Ear TestThe Musical Ear Test (Wallentin et al., 2010) also presents pairs of musical
phrases and asks the listener to judge whether they are the same or
different, and it also contains subtests for melody and rhythm. The melodic
phrases are made up of tones of sampled piano sounds and the rhythmic
phrases use beats played on a wood block. This means that, unlike in the
AMMA where the rhythm deviations occur in melodic phrases, the rhythm
subtest of the Musical Ear Test assesses rhythm independently of melodic
context.
Each subtest of the Musical Ear Test consists of 52 trials: 26 ‘same’ trials
and 26 ‘different’ trials. The different trials contain one pitch or rhythm
change, and the difficulty of detecting the deviations is varied by inclusion
of features that alter the complexity of the phrases. The Musical Ear
Test has been shown to correlate with amount of practice in a group
of musicians, and can also successfully distinguish groups of professional
musicians, amateurs, and non-musicians (Wallentin et al., 2010).
Another advantage of the Musical Ear Test is that the rhythm subtest
has been reported to correlate with speech perception in noise within a
combined group of percussionists, vocalists and non-musicians (Slater and
Kraus, 2015). The Musical Ear Test will therefore be used to assess melody
and rhythm skills.
2.2.2 Musical beat perceptionStudies of beat skills often focus on the ability to tap along to a regular
beat (e.g., Slater et al., 2013; Tierney and Kraus, 2013b). While this is an
important skill in playing music, it relies on auditory-motor synchronisation
and would therefore be influenced by an impairment in motor skills. It
is also common for the tapping task to be synchronised to a metronome
rather than to actual music (e.g., Slater et al., 2013; Tierney and Kraus,
2013b). A different approach is needed to assess musical beat perception
independently of motor skills.

TESTING SPEECH-IN-NOISE PERCEPTION 43
2.2.2.1 Beat Alignment TestThe Beat Alignment Test (Iversen and Patel, 2008) contains a
perception-only subtest which does not rely on motor skills – in fact,
participants are instructed not to tap or move along to the music. The
test uses 12 musical excerpts (mean length 15.9 seconds ± 3.1 s) from
three different genres (4 each of jazz, rock, and pop orchestral). A regular
sequence of beeps (1 kHz pure tones, 100 ms duration) starts after about 5
seconds of music, and participants are required to judge whether the beeps
are on or off the beat of the music.
The off-beat beeps are adjusted either in tempo (10% too fast or too slow)
or in phase (30% ahead of or after the beat). The saliency of the beat,
and therefore the difficulty of the task, varies considerably among the 12
excerpts, making the test suitable for examining individual differences in
beat perception.
2.3 Testing speech-in-noise perceptionThe choice of a speech-in-noise test is not trivial. There are several factors
that affect a test’s suitability for a given purpose, such as the complexity
of the sentence material, the acoustic properties of the noise masker,
and the test procedure. It is therefore critical to consider the research
questions and the target population when specifying the requirements for
a speech-in-noise test.
As discussed in Chapter 1, the ultimate goal of this research is to
evaluate a musical training programme in terms of potential benefit for
speech perception in noise. In order to compare pre- and post-training
performance, the speech-in-noise test will need to be performed multiple
times by each participant. The first requirement of the speech-in-noise test
is therefore that it should be repeatable, without participants being able to
memorise the sentence material.
The test must also be sensitive to potentially small improvements due to
training, and must be reliable so that any improvement can be attributed to
training and not to test-retest differences. Sufficient sensitivity to individual
differences is also crucial for the first aim of the research which is to
examine associations between musical skills and speech-in-noise perception
in the general population. If there is little variation in speech reception
thresholds, then it will be difficult to identify any significant associations.

44 CHAPTER 2: GENERALMETHODS
In order to investigate if musical skills are associated with different masker
conditions, it will be necessary to compare steady and modulated maskers
using the same sentence material. This will also allow for the modulation
masking release to be calculated, and this could provide another potential
variable of interest (see Section 1.4.2).
With multiple conditions to test, the time needed for each measure should
be minimised. The most efficient way to obtain a threshold is to use an
adaptive procedure, wherein the signal-to-noise ratio is altered on each
trial based on the previous answer. If a correct answer is given, the next
trial will be harder, and vice versa, until the procedure closes in on the
threshold estimate.
Two variables which are not of interest in the current research are spatial
separation and linguistic context. With the possible exception of musicians
within an orchestra, musical training does not involve particular focus on
using spatial cues. Similarly, there is no reason to expect that musical
training would help with the accumulation of the linguistic knowledge
which is necessary for using contextual cues. The first aim of the thesis
is to identify musical skills which might explain individual variance in
speech perception in noise. Since spatial separation and/or linguistic
context would introduce variance which is not expected to be linked to
musical abilities, this would be an unnecessary confound. For this reason,
targets and maskers will always be colocated and sentence material will not
contain semantic cues.
In summary, the ideal speech-in-noise test would be:
Repeatable – sentences should not be semantically predictable nor
easily learned through repetition of the test
Flexible – able to be used with different noise maskers for comparison
of conditions
Efficient – an adaptive procedure with multiple scoring opportunities
per sentence will minimise testing time
Sensitive – capable of identifying small differences between
individuals and between pre- and post-training performance
Reliable – able to provide stable measures of an individual’s
performance with minimal test-retest differences

TESTING SPEECH-IN-NOISE PERCEPTION 45
2.3.1 Choosing a sentence testMany commonly used speech-in-noise tests (including HINT, QuickSIN and
SPIN, which were discussed in Chapter 1) are designed as open sentence
tests. This means that, as far as the listener is concerned, there are no
restrictions on which words could occur. However, since each sentence is
unique, the number of sentence lists in the corpus is limited. Repeated
exposure to these lists might allow listeners to learn the sentence material,
and the test would therefore become easier over time.
Closed sentence tests, on the other hand, employ a limited number of
possible words for each target position, but these words can be combined to
form a large number of possible sentences. This means that memorisation
of the exact sentences is not possible, though some improvement is
observed during an initial familiarisation phase. Sentences have the same
syntactic structure and do make sense, but there is no semantic context
to aid prediction of target words. Listeners can, however, make educated
guesses about partially heard words since they are choosing from a finite
list of options.
One example of a closed sentence test is the Coordinate Response Measure
(CRM), which was introduced in Chapter 1. In this test, there are two target
words in each sentence (a colour and a number), with a choice of four
colours and eight numbers, giving a total of 32 possible combinations. An
answer is usually deemed to be correct if both targets are identified (Allen
et al., 2008; Brungart, 2001; Brungart and Simpson, 2007). Performance
is often measured in terms of percent correct (Brungart, 2001; Johnsrude
et al., 2013) although speech reception thresholds can also be estimated
(Allen et al., 2008).
The CRM meets the criterion of repeatability, and its simple stimuli would
be particularly suitable for use with children. However, the small number
of possible target words (e.g., only four colours) would make it relatively
easy for listeners to guess based on partial information, especially as the
target words (red, white, blue, green) do not share common phonemes.
There is another closed sentence test which offers a greater number of
possible target words, five scoring opportunities for each sentence, and a
quick procedure for estimating the speech reception threshold: the Matrix
Sentence Test.
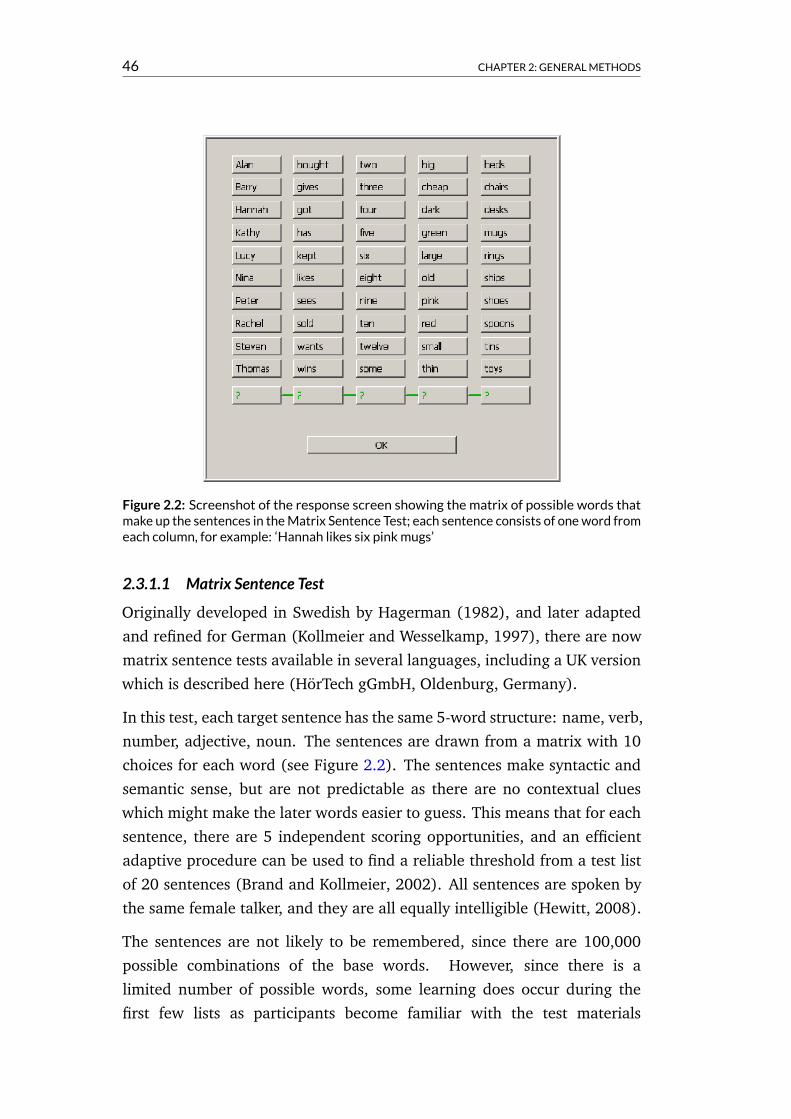
46 CHAPTER 2: GENERALMETHODS
Figure 2.2: Screenshot of the response screen showing the matrix of possible words thatmake up the sentences in theMatrix Sentence Test; each sentence consists of oneword fromeach column, for example: ‘Hannah likes six pinkmugs’
2.3.1.1 Matrix Sentence TestOriginally developed in Swedish by Hagerman (1982), and later adapted
and refined for German (Kollmeier and Wesselkamp, 1997), there are now
matrix sentence tests available in several languages, including a UK version
which is described here (HorTech gGmbH, Oldenburg, Germany).
In this test, each target sentence has the same 5-word structure: name, verb,
number, adjective, noun. The sentences are drawn from a matrix with 10
choices for each word (see Figure 2.2). The sentences make syntactic and
semantic sense, but are not predictable as there are no contextual clues
which might make the later words easier to guess. This means that for each
sentence, there are 5 independent scoring opportunities, and an efficient
adaptive procedure can be used to find a reliable threshold from a test list
of 20 sentences (Brand and Kollmeier, 2002). All sentences are spoken by
the same female talker, and they are all equally intelligible (Hewitt, 2008).
The sentences are not likely to be remembered, since there are 100,000
possible combinations of the base words. However, since there is a
limited number of possible words, some learning does occur during the
first few lists as participants become familiar with the test materials

TESTING SPEECH-IN-NOISE PERCEPTION 47
(Hagerman, 1982; Wagener and Brand, 2005). Performance stabilises more
quickly when participants are shown the matrix of possible words after
each sentence presentation as opposed to recalling sentences without this
information (Hewitt, 2008). After the initial familiarisation process, the test
can be used repeatedly with the same subjects without any further learning
effects (Wagener and Brand, 2005).
Another point in favour of the matrix test is that a similar sentence corpus
was used by Swaminathan et al. (2015) in their study of musicians and
non-musicians. A musician advantage was observed for perception of this
kind of sentence material when it was colocated with a reversed speech
(unintelligible, amplitude-modulated) masker.
Jansen et al. (2012) compared the French version of the matrix test to an
everyday sentence test (similar to HINT) and a digit triplets test (usually
used to screen for hearing loss). They found that all three tests correlated
with each other, and that the matrix test was better able to distinguish
between individuals than the other two tests.
The Matrix Sentence Test appears to be a good choice to meet the criteria of
repeatability and sensitivity, although sensitivity also depends on the type
of noise maskers used, as discussed in the next section.
2.3.2 Selecting noisemaskersThe choice of masker can have substantial effects on the properties of a
speech-in-noise test. For example, amplitude-modulated maskers provide
better differentiation between listeners (George et al., 2007; Wagener and
Brand, 2005) but may also make the test less reliable (Wagener and
Brand, 2005). The masker supplied with the matrix test is a steady
speech-spectrum noise, matching the long-term spectrum of the sentence
material (Hewitt, 2008). It is also possible to introduce additional noise
signals into the software in order to compare performance in different
conditions.
Wagener and Brand (2005) examined the influence of different noise
maskers using the German matrix test with normal-hearing and
hearing-impaired listeners. They compared the steady noise with two
fluctuating noises: icra5 and icra7 (Dreschler et al., 2001). The ICRA
maskers are artificial noise signals which were designed to mimic some
of the spectral and temporal properties of different types of speech, but

48 CHAPTER 2: GENERALMETHODS
with no actual speech content (Dreschler et al., 2001). The icra5 masker
simulates the modulations in speech with a single male talker; icra7
represents a babble noise of six people speaking concurrently.
Overall, Wagener and Brand (2005) recommended using fluctuating,
speech-shaped noise if the goal is to differentiate between subjects.
However they noted that the highly fluctuating icra5 noise has long gaps
(up to 2 seconds, which is a long time in the context of a 5-word sentence)
which reduced the test-retest reliability. This loss of reliability can be
reduced, while retaining the improved sensitivity, by using an adapted
version of icra5 in which the maximum gap length is 250 ms (Wagener,
2003).
An alternative approach, which affords greater control over the fluctuations
in noise level, is to modulate the amplitude of a steady noise by applying a
regular function, such as a sine wave (Gnansia et al., 2008). Manipulation
of the modulation parameters (frequency and depth) has a direct effect
on the amount of masking release observed (Gnansia et al., 2008). This
technique has successfully been used in investigations of ‘dip listening’ (see
Section 1.4.2).
2.3.2.1 Creation of modulated noise maskersIn order to compare the sensitivity and reliability of the matrix
test with different noise conditions, two additional maskers were
created. Each modulated masker was made by applying a sinusoidal
amplitude-modulation to the standard speech-spectrum noise:
m(t) = [1 + dsin(2πft)]n(t) (2.1)
where n(t) is the steady noise masker; d is the modulation depth (0.6 or
0.8); and f is the modulation frequency (8 Hz). The two modulation
depths (60% and 80%) were chosen to give moderate and high amounts
of masking release respectively (Gnansia et al., 2008). All noise signals
were subsequently matched in overall intensity (root-mean-square level).
Waveforms for all three noise maskers are shown in Figure 2.3.

PSYCHOPHYSICS 49
Figure 2.3: Example waveforms of the three noise maskers to be used with thematrix sentence test: steady noise (0% modulation depth) and two sinusoidallyamplitude-modulated noises (modulation frequency = 8 Hz; modulation depths of 60%and 80%)
2.4 PsychophysicsPsychophysical methods attempt to quantify the relationships between
external stimuli and perception. By systematically varying the stimulus in
some way, and recording performance on a perceptual task, a psychometric
function can be plotted. Figure 2.4 shows an example psychometric
function for a speech perception in noise task. Here the stimulus is varied
by way of the signal-to-noise ratio (SNR) and performance is measured in
terms of the percentage of words correctly identified for a given SNR. Above
a certain SNR, the task becomes very easy and all words can be identified.
Similarly, below a certain SNR, the task is so difficult that performance will
be at chance level. The area of interest is the slope in between these two
extremes, and particularly the speech reception threshold, i.e., the SNR for
which performance is equal to 50% correct.

50 CHAPTER 2: GENERALMETHODS
Figure 2.4: An example psychometric function for a speech perception in noise task
In order to estimate the perceptual threshold, the psychometric function
must be plotted as accurately as possible. Data points at ceiling or floor do
not provide much information about the shape of the psychometric function.
Data need to be sampled at various points (i.e., performance measured for
various SNRs) along the slope of the function in order for a curve to be
fitted.
2.4.1 Adaptive staircasesAn efficient way to sample the psychometric function is via an adaptive
procedure such as a staircase (Levitt, 1971). An adaptive staircase does just
what its name suggests: starting from a relatively easy SNR, the signal level
is then stepped up or down depending on the response given. A correct
response is followed by a more difficult trial, while an incorrect response
is followed by an easier trial. Different staircases target different threshold
levels. For example, a 3-down 1-up staircase, in which 3 correct responses
are required before the level is made harder but a single incorrect response
would make it easier, targets the 79% threshold (Levitt, 1971).
Using an adaptive staircase procedure means that within a few trials the
observed performance will be around threshold level, and the remaining
trials will provide information about the slope of the psychometric function.
This is an efficient method for estimating the threshold, but it does have

PSYCHOPHYSICS 51
some disadvantages. For example, presenting the majority of targets close
to threshold level can be frustrating for the participant if the staircase is
targeting a fairly difficult threshold (e.g., 50%).
Another problem with adaptive staircases is their sensitivity to differences
in perceptibility between targets. In an established sentence-in-noise test,
such as the Matrix Sentence Test described above, a considerable amount of
care is put into ensuring that every sentence in a list is matched in terms of
perceptibility. If this were not the case, then the occurrence of an unusually
easy target at a difficult SNR, or an unusually difficult target at an easy
SNR, could result in an undue reversal of direction during the staircase
which would affect the threshold estimate.
2.4.2 Method of constant stimuliThe method of constant stimuli is another procedure for sampling the
psychometric function. A number of SNRs are chosen in advance and
stimuli are presented several times at each level, within a randomised block
of trials. Ideally, the SNRs are chosen so that at most one level is close
to ceiling performance and at most one level is close to floor performance,
guaranteeing that the majority of data will provide useful information about
the slope of the psychometric function.
One disadvantage of the method of constant stimuli is that each threshold
estimate requires a large number of trials. In such a time-consuming
method, it is important to ensure that useful data is collected efficiently.
If the chosen SNRs do not cover a range of performance, with sufficient
data around the threshold, then time is wasted on collecting uninformative
data (i.e., large numbers of trials at ceiling or floor performance).
2.4.3 Threshold estimates from fitted functionsOnce the data have been collected, a psychometric function is plotted.
Figure 2.5 shows two examples: one for a tone-detection task and one
for a speech-in-noise task. The latter was already discussed above, and the
differences to note for the tone-detection task are visible on the vertical axis:
performance is measured in terms of the percentage of ‘yes’ responses; the
lower limit of performance is set as the participant’s false alarm rate, i.e.,
the proportion of no-signal trials for which the participant reported hearing
a target tone.

52 CHAPTER 2: GENERALMETHODS
Figure 2.5: Using the method of constant stimuli to estimate thresholds: when fittingpsychometric functions, the lower limit of the function is defined to be the false alarm ratefor a tone-detection task (left) and chance-level performance in a speech-perception task(right)
In order to estimate the threshold, a psychometric function must be fitted
to the data. For the data in Chapters 4 and 5, functions were fitted using
the Palamedes toolbox for Matlab (Kingdom and Prins, 2009). There are
several possible forms of psychometric function, but in most cases a logistic
curve provided a good fit for the data (see Equation 2.2). Curves were fitted
for each condition for each participant in order to obtain estimates for the
threshold (α) and slope parameter (β).
f(x;α, β) =1
1 + exp(−β(x− α))(2.2)
For each condition, the fitted slope parameter, β, was converted to give
a meaningful value for the slope of the function. This was calculated as
(f(α+1)−f(α))×100, and indicates the percentage change in performance
per dB change in SNR at threshold (α).
This is a useful metric for comparing conditions, but it should be noted
that this figure only applies to signal-to-noise ratios in the region of the
speech reception threshold (i.e., the SNR which results in 50% correct
performance). As shown in Figure 2.4, this is the steepest part of the
psychometric function. Further away from the threshold – i.e., at very
challenging or very easy signal-to-noise ratios where the slope is shallower –
the same change in SNR would equate to little change in task performance.
It is therefore difficult to interpret the results in terms of real world benefit,
since this will vary for different listening environments.

PSYCHOPHYSICS 53
2.4.4 Quantifying rhythmic priming effectsFor the rhythmic priming experiments in Chapter 4, a quantifiable measure
was needed for the magnitude of the rhythmic priming effect. As discussed
in Section 1.5.1.2, dynamic attending theory suggests that a regular rhythm
leads to enhanced processing for on-beat targets compared to temporally
displaced targets. Specifically, the oscillatory nature of such anticipatory
attention (see Figure 1.3) results in a quadratic performance profile centred
around the on-beat target position (Jones et al., 2002).
Therefore, for the rhythmic priming experiments, quadratic curves were
fitted to the data (see Equation 2.3).
f(x) = ax2 + bx+ c (2.3)
The strength of the rhythmic priming effect was defined to be the coefficient
(a) of x2 in the fitted function. The greater this coefficient, the steeper the
curve, and the greater the priming effect (see Figure 2.6).
Figure2.6: Illustration of the quadratic coefficient as ameasure of priming effect: the greaterthe value of a, the greater the benefit for on-beat targets compared to temporally displacedtargets


CHAPTER3Investigatingmusical skills for speechperception in noise
This chapter presents results of a correlational study which investigatedthe relationships between musical experience, musical skills, and speechperception in noise for a sample of participants with a range of musicalbackgrounds. The main aim of this study was to identify specific musicalskills which could be targeted in a musical intervention for improving speechperception in background noise.
3.1 IntroductionThe ultimate goal of this thesis is to design and evaluate a
short-term musical training programme for improving speech perception
in background noise. As discussed in Section 1.9, the first step towards this
goal is to identify specific musical skills which could be targeted for training.
In addition, a reliable outcome measure for speech-in-noise perception
is required which will be sensitive to training-related improvements.
Experiment 1 was designed to address these aims.
55

56 CHAPTER 3: INVESTIGATINGMUSICAL SKILLS FOR SPEECHPERCEPTION INNOISE
3.2 Experiment 13.2.1 AimsThe aims of Experiment 1 were threefold, and each is discussed in turn
below.
3.2.1.1 Assess suitability of matrix sentence test with different noise maskersAn ideal speech-in-noise test will be both sensitive and reliable, and these
qualities can be assessed in terms of inter- and intra-subject variability:
Inter-subject variability – this is a measure of the sensitivity of the test
and should be maximised. Greater variation between subjects means
that the test is more sensitive to individual differences. This also
facilitates correlational analyses as relationships may not be apparent
if there is a very narrow range of observed values.
Intra-subject variability – this is a measure of the reliability of the test
and should be minimised. If repeated scores from a single participant
do not agree with each other, then the test is not reliable.
According to Wagener and Brand (2005), the inter-subject variability
should be at least twice the intra-subject variability in order for the test
to significantly discriminate between participants.
Amplitude-modulations in a masking noise allow listeners to benefit from
temporary increases in signal-to-noise ratio (SNR) and this usually results
in an improved speech reception threshold (SRT) (Wagener and Brand,
2005). Listeners vary in their ability to take advantage of these dips in
noise level, so a greater range of SRTs is commonly observed for modulated
maskers compared to steady noise maskers (George et al., 2007; Wagener
and Brand, 2005). Use of a modulated masker therefore improves a test’s
ability to differentiate between subjects, but this increased sensitivity comes
at a cost in terms of test-retest reliability (Wagener and Brand, 2005).
In order to identify suitable measures for speech-in-noise perception for
use in future studies, three maskers were included in the current study:
one steady noise and two modulated noises. The same sentence material
was used with each masker, which allowed for direct comparisons of the
sensitivity and reliability of the test in each condition. The intention behind
including two modulated maskers was to choose the one which provided

EXPERIMENT 1 57
the best ratio of inter- to intra-subject variability, i.e., the best ability to
reliably discriminate between subjects.
Although modulated noise maskers were predicted to provide better
differentiation between individuals, the steady masker was also included in
order to calculate the modulation masking release (i.e., the improvement
for modulated versus steady noise). If a skill is associated with masking
release, then it is likely to contribute to dip listening. As discussed in
Section 1.4.2, such skills might include working memory and temporal
resolution. On the other hand, if a skill is associated with speech perception
in steady noise, then it likely contributes to the separation of the target
speech from the background noise, via either auditory scene analysis (see
Section 1.2.2) or orienting of attention (see Section 1.3).
3.2.1.2 Investigate the link between musical experience and speechperception in noise
The evidence for a link between musical training and speech-in-noise
perception has so far come from studies comparing highly trained musicians
with non-musicians (Parbery-Clark et al., 2009; Swaminathan et al., 2015;
Zendel and Alain, 2012). Given the intended short-term nature of a
musical intervention, it would not be sufficient to identify associations in a
population of highly trained musicians who have spent years honing their
skills. If a relationship exists only for lifelong musicians, then it is unlikely
that short-term musical training would be beneficial for improving speech
perception in noise. This study did not use any musical criteria to recruit
participants, in the hope that associations between musical experience,
musical skills and speech-in-noise perception could be examined for a
general population sample with a range of musical backgrounds.
3.2.1.3 Examine associations betweenmusical skills and speech perception innoise
In order to inform the design of a targeted training programme, this
study aimed to find specific musical skills which are correlated with both
musical experience (indicating that they might be improved by training)
and speech-in-noise perception.
In Section 1.8, three musical skills were identified as potential candidates
for training: melody, rhythm, and beat perception. Tests for each of these
skills were introduced in Chapter 2. When examining relationships between

58 CHAPTER 3: INVESTIGATINGMUSICAL SKILLS FOR SPEECHPERCEPTION INNOISE
these measures and speech reception thresholds, it is necessary to consider
the nature of each test and whether other factors might mediate any
observed association. In particular, it is important to control for variables
which might influence scores on the musical tests despite not being directly
related to the musical skill of interest. Partial correlations will therefore be
carried out to examine the associations between musical skills and speech
perception in noise while controlling for the variables discussed below.
For the melody and rhythm tests, performance is certainly reliant
on working memory as the phrases need to be stored while making
same/different judgements. Working memory has been shown to be
enhanced in musicians (e.g., Chan et al., 1998; Jakobson et al., 2008),
associated with speech-in-noise perception (Akeroyd, 2008), and has
been suggested to mediate the musician enhancement for speech-in-noise
perception (Parbery-Clark et al., 2009). Therefore, to assess any specific
contribution of melody or rhythm skills to speech reception thresholds,
working memory needs to be measured so that it can be controlled for in
the analysis.
The design of the beat perception test involves pure-tone ‘beeps’
superimposed over music. If a listener has very poor frequency
discrimination, they may not be able to separate the beeps from the music
and this would impair performance on the task. In this case, their score
might not be an accurate reflection of beat perception per se. Frequency
discrimination is enhanced in musicians and is associated with speech
perception in some masking noises (Parbery-Clark et al., 2009). The
test also requires the perception of musical beat to be held in memory
while making a judgement about the superimposed beeps. It is therefore
important to control for frequency discrimination and working memory
when examining associations with beat perception.
There are other psychoacoustic factors which would influence performance
on the musical skill tests, but these are not considered confounding
variables as they are an integral part of the skill being measured. For
example, frequency discrimination is likely associated with performance
on the melody test since poor frequency discrimination would impair the
ability to judge changes in the melodic sequences. Similarly, temporal
resolution is likely associated with the ability to judge whether or not a

EXPERIMENT 1 59
beep occurred on the beat, but this is an essential part of beat perception
and so was not included as a possible confound in this study.
3.2.2 Methods3.2.2.1 ParticipantsTwenty-four native English speakers (10 male; age range 19–40, mean age
25.9, standard deviation 6.1 years) were recruited via posters from the
University of Nottingham student population and the general public, and
they received an inconvenience allowance for taking part. All participants
had normal hearing, defined as pure-tone audiometric thresholds of
≤20 dB HL across octave frequencies from 250 Hz to 8 kHz. Participants
were also screened for normal non-verbal IQ using the Matrix Reasoning
subset from the Wechsler Abbreviated Scale of Intelligence (Wechsler,
1999).
3.2.2.2 ProcedureTesting took place in a sound-attenuating booth, and auditory stimuli were
presented diotically through Sennheiser HD-25 headphones. The order of
the test battery is shown in Table 3.1. The same order was used for all
participants, with the exception of the order of the three noise masker
conditions which was counterbalanced across participants. The protocol
was designed to aid attention by varying the tasks, e.g., by alternating
between speech and music tasks, and participants were permitted to take
breaks when needed. Details of the individual test procedures are given
below.
Table 3.1: The test battery used for Experiment 1Task Approximate duration (minutes)
1 Auditory workingmemory 52 Frequency discrimination 53 Speech in noise: Masker 1 204 Musical skill: Melody 105 Speech in noise: Masker 2 20
Break 156 Musical skill: Rhythm 107 Speech in noise: Masker 3 208 Musical skill: Beat perception 15
Total = 120

60 CHAPTER 3: INVESTIGATINGMUSICAL SKILLS FOR SPEECHPERCEPTION INNOISE
Auditory workingmemoryThe digit span from the Wechsler Adult Intelligence Scale (Wechsler, 2008)
was used as a measure of auditory working memory. Both forward and
backward subtests were administered to give an overall total. For the
forward subtest, the experimenter read aloud strings of digits (at a rate of
one digit per second), starting with 2 digits and working up to a maximum
of 9, with two trials for each string length. Participants were required to
repeat all of the digits in the correct order to score a point for that trial. The
test was stopped if a participant failed on both trials at a given sequence
length. The procedure was then repeated for the backward test in which
participants had to repeat the digits in reverse order (up to a maximum
length of 8 digits).
Pure-tone frequency discriminationFrequency discrimination thresholds were obtained using a three-interval
three-alternative forced-choice procedure, with stimuli created and
presented using Matlab v2008a (The MathWorks, Natick, MA). Each trial
consisted of three tones of 100 ms duration (including 15 ms cosine on/off
ramps) with an interstimulus interval of 300 ms. Two of the tones were
identical (standard frequency, f = 1 kHz) while the target tone had a
frequency of f + ∆f where ∆f was determined adaptively as a percentage
of f . The order of the three tones was randomised on each trial, and the
participants were instructed to press the button that corresponded to the
tone that was different from the other two. There was no time limit for
the response, and visual feedback was given after each trial. An adaptive
staircase procedure was used to target the 79.4% correct threshold. The
starting value of ∆f was 50%, and this was divided by 2 after each correct
response until the first reversal, after which a 3-down 1-up staircase was
implemented with a factor of√
2. Participants completed five practice trials
followed by two tracks (of 50 trials each); the two thresholds were averaged
to obtain the final score.
Speech-in-noise perceptionThe UK Matrix Sentence Test (HorTech gGmbH, Oldenburg, Germany) was
used to determine the speech reception threshold (SRT; the signal-to-noise
ratio (SNR) that equated to 50% intelligibility). In this test, sentences
take the form name–verb–numeral–adjective–noun and are formed from
a closed matrix with 10 possible choices for each word (see Section 2.3.1.1
and Figure 2.2).

EXPERIMENT 1 61
Three maskers were used: an unmodulated speech-spectrum noise
(supplied with the test; also referred to as steady or 0% modulation
depth noise) and two sinusoidally amplitude-modulated versions of the
original noise (modulation frequency of 8 Hz for both; modulation depths
of 60% and 80%). The modulation parameters were chosen as they had
previously been shown to give moderate and high amounts of masking
release respectively (Gnansia et al., 2008). See Section 2.3.2.1 and Figure
2.3 for further details of the stimuli. All noise signals were matched in
overall intensity (root-mean-square level).
Each test list consisted of 20 sentences. On each trial, the noise signal
started from a random point at a level of 65 dB. The starting SNR was
10 dB, i.e., the speech started at a level of 75 dB, and was adaptively varied
to target the SRT (50% correct). After each sentence, the matrix of possible
words appeared on screen and participants used a touch screen or mouse
to select the words they had heard. There was no time limit for responses
and no feedback was given.
For each masker, participants completed a block of four test lists: one
practice run which was not included in the analysis, and three further lists
which were used to obtain an average SRT. The order of these three blocks
was counterbalanced across participants.
Musical experienceThe training subscale of the Goldsmiths’ Musical Sophistication Index
(Mullensiefen et al., 2011) was used as a measure of musical experience.
The subscale consists of 9 questions which encompass both formal
instrument training and informal musical experience (see Figure 2.1).
Musical skills: Melody and rhythmThe Musical Ear Test (Wallentin et al., 2010) was used to measure memory
and rhythm skills in separate subtests. The melodic phrases are made up
of 3–8 tones of sampled piano sounds while the rhythmic phrases consist
of 4–11 unpitched sounds from a wood block. Each subtest has 52 trials:
26 ‘same’ trials and 26 ‘different’ trials. The ‘different’ trials contain one
deviation, in pitch or rhythm for the subtests respectively. Participants
listened to the instructions and two example pairs (one same, one different)
at the beginning of each subtest, and then recorded their responses on an
answer sheet. The order of trials was randomised, and no feedback was
given during the test.

62 CHAPTER 3: INVESTIGATINGMUSICAL SKILLS FOR SPEECHPERCEPTION INNOISE
Musical skills: Beat perceptionThe auditory-only subsection of the Beat Alignment Test (Iversen and Patel,
2008) was used to measure musical beat perception. The test uses 12
musical excerpts (mean length 15.9 ± 3.1 seconds) from three different
genres (4 each of jazz, rock, and pop orchestral). A train of beeps (1 kHz
pure tones, 100 ms duration) starts after about 5 seconds of music, and
is either on or off the beat. The off-beat beeps are adjusted either in
tempo (10% too fast or too slow) or in phase (30% ahead of or behind
the beat). The test comprises 36 trials: 12 on the beat and 6 each of the
four off-beat conditions. For each excerpt, one on-beat, one tempo-adjusted
and one phase-adjusted trial is included. Before the test, participants heard
a demonstration of the beeps on their own, two on-beat examples (the same
excerpt with beeps at two different tempi), and two off-beat examples (one
tempo-adjusted, one phase-adjusted). Participants were instructed not to
move or tap along to the music, but just to listen and record on an answer
sheet whether the beeps were on or off the beat.
3.2.2.3 AnalysisComparison of noisemaskersThe means and standard deviations for the speech reception thresholds
(SRTs) with the three different maskers are shown in Figure 3.1.
As expected, performance improved with increased modulation depth,
reflecting the benefit of dip listening.
One participant was identified as having thresholds more than 2 standard
deviations from the group mean. Exclusion of this participant had very little
effect on the analysis comparing the masking conditions, however, and so
all data were included in this analysis.
An ideal masker would provide maximal inter-individual variation,
allowing for differentiation between subjects, while minimising
intra-individual variation across multiple lists, ensuring test-retest
reliability. According to Wagener and Brand (2005), the ratio of these
two measures should have a value of at least 2 in order for the test
to significantly discriminate between participants. Another measure of
reliability is the intraclass correlation. This is a measure of consistency
which can be applied when more than two measurements are taken, as
was the case here. These statistics are given in Table 3.2.

EXPERIMENT 1 63
Figure 3.1:Means (and standard deviations) of the speech reception thresholds for the threedifferent masking conditions
Table 3.2: Sensitivity and reliability statistics for the matrix sentence test with the threedifferent noise maskers; 0% modulation depth refers to the steady noise masker (nomodulation applied)Maskermodulation depth 0% 60% 80%Mean threshold (dB SNR) –10.51 –12.76 –15.55Inter-subject standard deviation (dB) .82 .81 1.27Intra-subject standard deviation (dB)a .27 .44 .50Inter s.d. / intra s.db 3.01 1.87 2.52Intraclass correlationc .90 .76 .85
a Derived from the one-way ANOVA (subject as factor): root mean square error term divided by√3b This should be at least 2 in order to reliably discriminate between subjects (Wagener and Brand, 2005)c Two-waymixedmodel consistencymeasure based on averaging three lists
Comparing the two modulated noises, it is clear that the 80% depth masker
offered the better differentiation (higher inter-subject standard deviation)
and also the better reliability (lower intra-subject standard deviation and
higher intraclass correlation). The 60% modulation depth masker provided
no improvement in differentiability compared to the steady masker, while
also showing reduced reliability. Data from the 60% depth masker was
therefore excluded from further analysis.
From this point, the two maskers used in the analysis will be referred to
as ‘steady’ and ‘modulated’ (80% modulation depth), and the difference
between these two thresholds will be called the ‘masking release’
(modulated SRT minus steady SRT). The intraclass correlations (see Table
64 CHAPTER 3: INVESTIGATINGMUSICAL SKILLS FOR SPEECHPERCEPTION INNOISE
3.2) for both of these maskers were very high, demonstrating that these
measures are very reliable when an average of three thresholds is used.
Checking for bivariate outliersAs mentioned above, one participant was identified as a possible outlier in
terms of speech reception thresholds. To investigate this potential outlier,
preliminary regression analyses were run. Based on previous findings
(Parbery-Clark et al., 2009), the variables of musical experience, frequency
discrimination and working memory were all expected to be associated
with speech perception in modulated noise. For each of these variables, a
separate regression analysis was run (with a single predictor and modulated
SRT as the dependent variable). In all three cases, the potential outlier had
a studentized residual greater than 2, suggesting that this participant was
a bivariate outlier in the analyses as well as an outlier in speech-in-noise
perception. Given the small sample size and the undue influence of this
single case, it was decided to exclude this participant from further analysis.
Correlation analysisThe normality assumption was checked for all variables using a
combination of histograms, probability plots and Kolmogorov-Smirnov
tests. The only variable which was not normally distributed was frequency
discrimination, which was highly skewed. A reciprocal transformation was
applied to the frequency discrimination data (i.e., new score = 1/original
score) which resulted in normalised data.
Pearson correlations were performed to investigate the relationships among
all the variables. Given the exploratory nature of the study, the data were
not corrected for multiple comparisons, although correlations which would
persist even with stringent (Bonferroni) corrections were identified. Finally,
partial correlation coefficients were calculated to examine the relationships
between musical skills and speech reception thresholds when controlling
for frequency discrimination and working memory.
3.2.3 Results3.2.3.1 Relationships among predictor variablesFigure 3.3 shows the relationships among the predictor variables;
corresponding correlation coefficients are given in Table 3.3. All
correlations are in the expected direction (i.e., better performance on one
task relates to better performance on the other).

EXPERIMENT 1 65
Figure 3.2: Scatter matrix showing the relationships between predictor variables
Table 3.3: Pearson correlation coefficients for the relationships between predictor variablesPredictor variables 1 2 3 4 5 6
1 Musical experience – .33 .66*** .44* .39* .54**2 Workingmemory – .38* .50** .54** .40*3 Frequency discrimination – .52** .21 .40*4 Melody – .64*** .325 Rhythm – .44*6 Beat perception –*p<.05, **p<.01, ***p<.00147 (Bonferroni corrected alpha level for 34 comparisons); all one-tailed
Musical experience was strongly correlated with frequency discrimination
which is consistent with previous findings that musicians have enhanced
frequency discrimination (e.g., Micheyl et al., 2006; Parbery-Clark et al.,
2009). There was no significant correlation between musical experience
and working memory, which was unexpected given the reported musician
advantage for auditory working memory (Chan et al., 1998; Parbery-Clark
et al., 2009). However, this might have been influenced by the choice

66 CHAPTER 3: INVESTIGATINGMUSICAL SKILLS FOR SPEECHPERCEPTION INNOISE
of memory test. The digit span is a fairly simple measure of working
memory with a limited range of scores. This may have reduced the observed
correlation in comparison to a more complex combined measure such as
that used by Parbery-Clark et al. (2009) which would have given a wider
range of individual variation.
All three musical skills improved with increased musical experience, as
would be expected if these skills are improved through training, although
the moderate correlations would not reach significane if corrected for
multiple comparisons.
The melody and rhythm subtests were strongly related to each other and
also to working memory as expected. The shared variance is likely due
to the nature of the same/different task which is dependent on working
memory. The skill-specific variance is evident in the fact that melody – but
not rhythm – was related to frequency discrimination as expected.
3.2.3.2 Predictors of speech reception thresholdsThe speech reception thresholds for steady and modulated noises were
strongly correlated (r=.86, p<.001). This demonstrates the benefit of
using the same sentence material with different maskers when investigating
modulation masking release. For example, Parbery-Clark et al. (2009)
found that HINT and QuickSIN were not related and had different patterns
of associations with other variables, but as these tests differ in both
complexity of sentences and maskers, it is not clear which is the most
important factor.
Figure 3.3 shows the relationships between the six potential predictor
variables and the three speech perception in noise measures. The
corresponding correlation coefficients are given in Table 3.4. All trends
are in the expected direction (i.e., better (higher) scores for predictor
variables associated with better (lower) speech reception thresholds and
greater (more negative) masking release).
Musical experience was moderately correlated with SRTs in steady and
modulated noise (although these correlations would not be significant if
corrected for multiple comparisons). This supports the notion that a link
between musical training and speech-in-noise perception might exist in the
general population, rather than being restricted to lifelong musicians.

EXPERIMENT 1 67
Figure 3.3: Scatter matrix showing the relationships between predictor variables and thethreemeasures of speech perception in noise: SRT in steady noise, SRT inmodulated noise,masking release (benefit for modulated versus steady noise)
Table 3.4: Pearson correlation coefficients for the relationships between predictor variablesand the three speech-in-noise perceptionmeasures: steady, modulated, andmasking releasePredictor variables Steady Modulated ReleaseMusical experience –.36* –.40* –.29Workingmemory –.33 –.33 –.21Frequency discrimination –.34 –.41* –.33Melody –.18 –.22 –.18Rhythm –.46* –.37* –.13Beat perception –.62*** –.69*** –.50***p<.05, **p<.01, ***p<.00147 (Bonferroni corrected alpha level for 34 comparisons); all one-tailed
Musical beat perception was strongly correlated with SRTs in steady and
modulated noise, and these correlations would still be significant with a
stringent correction for multiple comparisons (Bonferroni). Beat perception

68 CHAPTER 3: INVESTIGATINGMUSICAL SKILLS FOR SPEECHPERCEPTION INNOISE
was also strongly correlated with modulation masking release. The rhythm
test was also moderately correlated with speech reception thresholds in
steady and modulated noise. Together these results suggest that a training
programme focusing on temporal aspects of music (i.e., beat and rhythm)
could be a good candidate for improving speech-in-noise perception.
However, as discussed in Section 3.2.1.3, it is important to control for
possible confounds due to test design before attributing the shared variance
to a specific musical skill. Partial correlations were therefore carried out to
control for working memory and frequency discrimination as planned.
Partial correlationsTable 3.5 gives the partial correlations between rhythm and beat perception
and speech-in-noise measures while controlling for possible confounding
variables.
Table 3.5: Partial correlation coefficients for the relationships between predictor variablesand the three speech-in-noise measures, controlling for working memory (WM) andfrequency discrimination (FD)Partial correlations Steady Modulated ReleaseRhythm –.36 –.23 –.02(controlling forWM)Beat perception –.54** –.61** –.42*(controlling forWM&FD)*p<.05, **p<.01 (all one-tailed)
When controlling for working memory, the association between rhythm and
speech-in-noise perception is considerably reduced, just failing to reach
significance for the SRT in steady noise (p=.05). This suggests that rhythm
perception – as measured by the Musical Ear Test – is not related to speech
perception in noise, and the original correlation was simply due to working
memory. However, the design of the same/different task means that the
skill being tested is actually memory for rhythm. Perhaps an alternative
task which tests rhythm perception without such working memory demands
might reveal a relationship with speech perception in noise. This will be
discussed further in Chapter 7.
Beat perception is strongly correlated with SRTs in steady and modulated
noise, and moderately with masking release, even when controlling for
working memory and frequency discrimination. Figure 3.4 shows the

EXPERIMENT 1 69
scatter plots for beat perception against the three speech-in-noise measures
both before (left) and after (right) controlling for these two factors.
Figure 3.4: Scatter plots showing the relationships betweenmusical beat perception and thethreemeasures of speech perception in noise; the right-hand column shows the partial plotswhen controlling for workingmemory and frequency discrimination
The fact that beat perception was associated with the amount of masking
release suggests that it is linked with the ability to listen in the dips of the

70 CHAPTER 3: INVESTIGATINGMUSICAL SKILLS FOR SPEECHPERCEPTION INNOISE
noise. It is possible that the relationship is mediated by temporal resolution,
as this would be important both for judging temporal alignment of the
beeps in the beat test and for taking advantage of dip listening (see Section
1.4.2).
If temporal resolution were the only factor underlying the association
between beat perception and speech perception in noise, then strong
correlations would have been expected only for speech in modulated
noise and masking release. The equally strong correlation between beat
perception and speech perception in steady noise – where there are no
opportunities for dip listening – suggests that there is another mechanism
linking beat perception and speech perception in noise. This will be
discussed further below.
3.3 DiscussionPrevious research has shown that highly trained musicians have an
enhanced ability to perceive speech in background noise when compared
to non-musicians (Parbery-Clark et al., 2009, 2011; Swaminathan et al.,
2015). Experiment 1 used a correlational design to explore the link
between musical experience and speech-in-noise perception in a sample
of participants with a range of musical backgrounds. The aims of the study
were threefold:
1. To identify a suitable modulated masker for use with the Matrix
Sentence Test which can reliably discriminate between individuals
2. To assess whether an association between musical experience and
speech-in-noise perception is observable in a sample of participants
with a range of musical histories
3. To identify specific musical skills which are associated with speech
perception in noise
3.3.1 Evaluation of noisemaskersThree noise maskers were used with the Matrix Sentence Test: a steady
speech-spectrum noise, and two sinusoidally amplitude-modulated versions
of the steady noise. Comparison of the sensitivity and reliability statistics
for the three conditions revealed that the masker with a modulation depth
of 60% was unsatisfactory in its ability to reliably distinguish individual

DISCUSSION 71
differences. The steady noise and the masker with a modulation depth of
80% both met the requirements for a reliable and sensitive test.
As expected, modulation of the background noise led to increased
inter-individual differences even within a normally hearing young adult
sample. As discussed in Section 1.4.2, modulation masking release depends
on good temporal resolution and places extra demands on working memory
and linguistic knowledge to reconstruct the partial signal. Since individuals
vary in all of these abilities, the sensitivity of this test will likely be
further increased in populations which already have greater variation for
speech perception in noise. For example, for people with hearing loss,
speech perception in steady noise depends mainly on their hearing acuity,
whereas speech perception in modulated noise additionally depends on
non-auditory cognitive and linguistic factors (as measured by the text
reception threshold, see Section 1.4.1; George et al., 2007).
The use of both steady and modulated maskers with the same sentence
material allows for the calculation of masking release which can be a useful
measure in its own right. Future studies should therefore include both of
these masking conditions. In each case, the test is reliable when a practice
list is discarded and an average threshold is obtained from three repeated
lists.
3.3.2 Musical experience and speech-in-noise perceptionThe current study used a sample of participants with a range of musical
experience. A musical experience score was obtained which included
measures of both formal training and informal musical experience. This
score was moderately correlated with speech reception thresholds in steady
and modulated noise. This supports the idea that musical training might
be linked with improved speech perception in noise, which has previously
been reported when highly trained musicians have been compared with
non-musicians (Parbery-Clark et al., 2009, 2011; Swaminathan et al.,
2015). This result therefore indicates that lifelong musical training is not a
requirement to observe an enhancement for speech perception in noise.
3.3.3 Musical beat perception and speech-in-noise perceptionThe main aim of this study was to identify specific musical skills which
might underlie the reported musician enhancement for speech perception

72 CHAPTER 3: INVESTIGATINGMUSICAL SKILLS FOR SPEECHPERCEPTION INNOISE
in noise and which could therefore be targeted for training.
The strongest predictor of speech-in-noise performance was musical beat
perception. This skill was strongly correlated with speech reception
thresholds in both steady and modulated noise, as well as with modulation
masking release, even when controlling for working memory and frequency
discrimination. The rhythm test also correlated with speech reception
thresholds in steady and modulated noise, although a considerable part
of this variance was explained by working memory.
The results suggest that beat perception could provide a useful link between
musical training and speech-in-noise perception, although no direction
of causation can be inferred from a correlation analysis. This issue of
causation will be addressed in Chapter 6, when a beat training programme
will be assessed for its impact on speech perception in noise. First,
though, the focus turns to the second aim of the thesis – to investigate the
mechanism by which musical beat perception might contribute to speech
perception in noise.
Entrainment to a regular beat is a fundamental musical skill and an innate
human ability that has been observed in infants (Honing, 2012). However,
individuals do vary in how and how well they perceive a beat (Grahn
and McAuley, 2009; Thompson et al., 2015), and beat perception can be
improved by musical training (Slater et al., 2013).
To achieve a high score in the beat perception test, listeners must tune in to
the beat of the music and form predictions about when the next beats will
occur. This enables comparison of the superimposed beep positions with
the predicted beats. If the beeps coincide with the expected beat positions,
then they will be judged as being on the beat.
Unlike music, speech does not necessarily contain an isochronous beat.
There is, however, regularity in the metric structure of strong and weak
syllables in speech, and listeners are able to tap along to this regularity as
they would to a beat in music (Lidji et al., 2011). It has been shown that
the metric structure of speech can facilitate predictions about when the next
strong syllable will occur (see Section 1.5.2; Pitt and Samuel, 1990). When
listening to speech in challenging environments, such predictions could be
particularly useful to focus attention at points in time when important parts
of the signal are expected. People who are adept at perceiving a musical

DISCUSSION 73
beat might also derive greater benefit from the metric structure of speech,
and this might underlie the association between beat perception and speech
reception thresholds observed in the current study (see Figure 3.5).
Figure 3.5: Flowchart of the proposedmechanism bywhichmusical beat perceptionmightaid speech-in-noise perception
It should be noted that the sentences of the matrix test all have the same
syllabic structure and are therefore rhythmically predictable. It is possible,
therefore, that the choice of speech test led to an enhanced correlation
with beat perception. However, given the strength of the relationship, this
is unlikely to be the whole story.
Chapters 4 and 5 will explore the hypothesis that musical beat perception is
linked to the use of rhythm to orient attention towards points in time when
a target signal is predicted to occur, and that this mechanism enhances
speech perception in challenging environments.

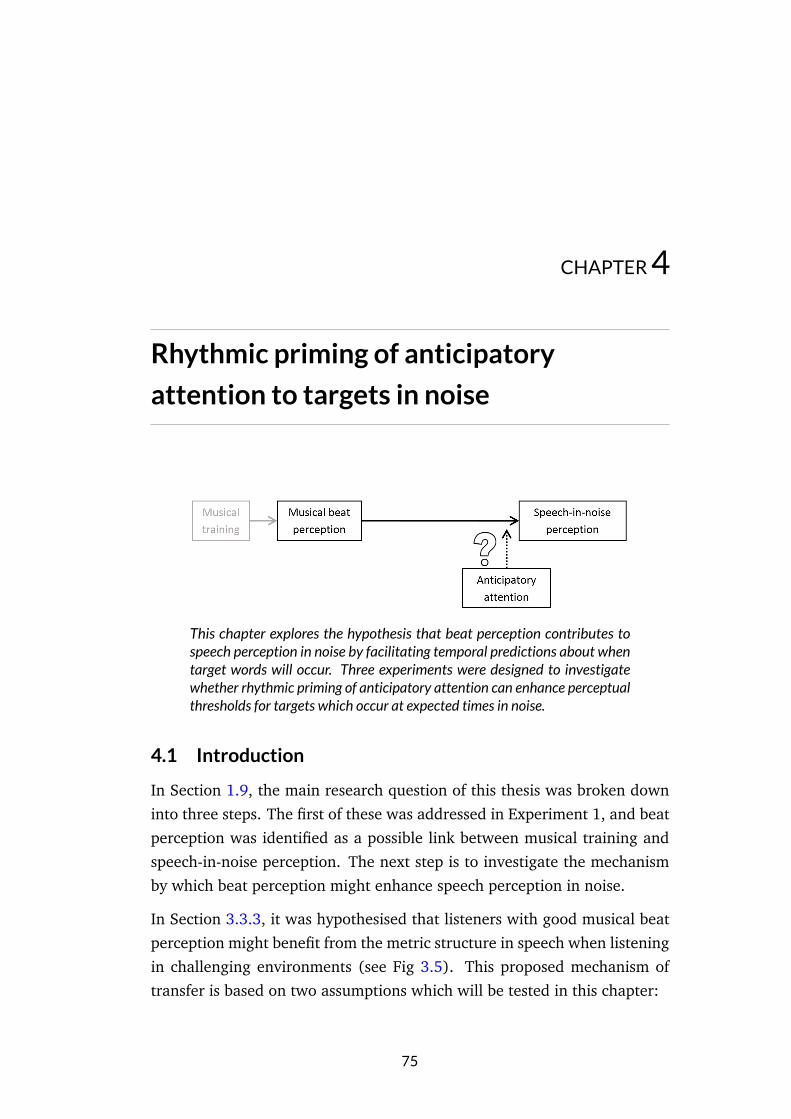
CHAPTER4Rhythmic priming of anticipatoryattention to targets in noise
This chapter explores the hypothesis that beat perception contributes tospeech perception in noise by facilitating temporal predictions about whentarget words will occur. Three experiments were designed to investigatewhether rhythmic priming of anticipatory attention can enhance perceptualthresholds for targets which occur at expected times in noise.
4.1 IntroductionIn Section 1.9, the main research question of this thesis was broken down
into three steps. The first of these was addressed in Experiment 1, and beat
perception was identified as a possible link between musical training and
speech-in-noise perception. The next step is to investigate the mechanism
by which beat perception might enhance speech perception in noise.
In Section 3.3.3, it was hypothesised that listeners with good musical beat
perception might benefit from the metric structure in speech when listening
in challenging environments (see Fig 3.5). This proposed mechanism of
transfer is based on two assumptions which will be tested in this chapter:
75

76 CHAPTER 4: RHYTHMIC PRIMINGOFANTICIPATORYATTENTION TOTARGETS INNOISE
1. Anticipatory attention driven by beat-based rhythms enhances the
perception of target sounds in background noise
2. Perceptual benefits of rhythmic priming are associated with musical
beat perception
4.2 Experiment 2: Primingwith a simple beat4.2.1 AimsThe aim of Experiment 2 was to establish a rhythmic priming paradigm
to manipulate temporal expectations in order to determine if anticipatory
attention can enhance perception of targets in noise. Specifically, two tasks
were included in order to build on prior research:
Pure-tone detection in noise – it has previously been shown that
endogenous orienting of temporal attention enhances pure-tone
detection in noise (Werner et al., 2009). The first aim of the current
experiment was to investigate if a similar benefit would be observed
from anticipatory attention driven by rhythmic priming.
Speech perception in noise – priming with a musical rhythm reduced
reaction times to an on-time speech target in quiet (Cason and Schon,
2012). The second aim of Experiment 2 was to examine the effects
of rhythmic priming on the speech reception threshold for words in
noise.
4.2.2 Task design4.2.2.1 Priming sequenceA simple isochronous sequence of tones – similar to that used by Jones
et al. (2002) – was used to orient anticipatory attention. In order to ensure
that temporal expectations were formed on a trial-by-trial basis rather than
being built up over a block of trials, the tempo of the priming sequence
was jittered. For each trial, the inter-beat interval was selected at random
from a set range (600 ms ± 5%). This range of inter-beat intervals was
chosen to exceed the just-noticeable difference in tempo for speech and
music (Quene, 2007) while avoiding large differences between trials which
might have been distracting for participants.
The aim of the experiment was to investigate priming of attention for
targets in noise. Since any additional stimulus onsets might have interfered

EXPERIMENT 2: PRIMINGWITHA SIMPLE BEAT 77
with temporal expectations, the background noise was steady and present
throughout the trial. The level of the priming sequence was chosen so that
it was clearly audible over the noise.
4.2.2.2 Speech perception taskA set of monosyllabic (consonant–vowel–consonant) words were chosen as
the possible targets to be identified in the speech task. A key consideration
in designing the speech task was deciding how to align these target words
with the beat of the priming sequence. Simply aligning the targets by
syllable onset would not have been sufficient to produce a perception of
regularity (Patel et al., 1999). Instead, it was necessary to identify the
‘perceptual centre’ or ‘p-centre’ of each target word. This is the point within
the syllable that is perceived as the moment of occurrence for that syllable.
Figure 4.1:Waveforms of speech targets

78 CHAPTER 4: RHYTHMIC PRIMINGOFANTICIPATORYATTENTION TOTARGETS INNOISE
There is no simple method for finding the p-centre, although various
acoustical correlates and models have been suggested (Patel et al., 1999).
Therefore, the p-centres for each target word were located manually as
follows:
1. An initial estimate for the p-centre was taken as the onset of the vowel,
as identified by examining the waveform of the target word
2. The target word was looped alongside a metronome, with the
estimated p-centre aligned with the onset of each click
3. The alignment was fine-tuned, and steps 2 and 3 repeated until the
target word was perceived as occurring on the beat of the metronome
4. The alignment was double-checked by a second musically trained
experimenter who listened to the priming sequence plus target in
quiet, for all target words and positions in a random order, and judged
whether the target sounded early, on-beat or late in each case
The waveforms of a selection of target words, with the p-centres aligned
(dashed line), are shown in Figure 4.1.
4.2.2.3 Tone taskA single-interval, yes/no task was used for pure-tone detection in
Experiment 2. This means that on each trial the participant simply had
to state whether or not they heard the target tone. Yes/no tasks can be
prone to bias, in that each participant may have a tendency to answer ‘yes’
more often than ‘no’, or vice versa. This kind of bias can be avoided using
a multiple-interval forced-choice task, where participants must choose the
interval in which the target appeared (Kingdom and Prins, 2010). However,
a multiple-interval paradigm was not suitable for the current experiment,
as it would have required repetition of the rhythmic sequence to prime
expectation in the second interval. This would have resulted in a long gap
between the intervals which would make it difficult for listeners to compare
their memory traces for each interval to make the decision at difficult SNRs.
Another alternative would be to use comparison intervals around the next
two beats of the sequence, since peaks in anticipatory attention should
continue to occur (Jones et al., 2002). However, the effects of anticipatory
attention on subsequent beats have not previously been investigated within
the same experiment so it is not clear if this would provide a fair

EXPERIMENT 2: PRIMINGWITHA SIMPLE BEAT 79
comparison. It would also be difficult to demarcate the two time intervals
for participants without interfering with the rhythmically driven temporal
expectations.
For these reasons, a single-interval yes/no task was chosen, despite the
possible influence of bias. Since the aim of the current experiment was to
compare performance for early, on-time, and late targets, the issue of bias
was actually not a critical one. If a participant has a biased response pattern,
there is no reason to assume that this pattern would vary between the
target conditions. Therefore, while bias would affect the absolute threshold
estimates, it should not affect any differences between thresholds. In order
to minimise effects of bias on the threshold estimates, catch trials were
included in which no target was present. The proportion of ‘yes’ responses
to these trials – the false alarm rate – was used when fitting psychometric
functions to each participant’s data.
4.2.2.4 Target positionsAn isochronous priming sequence orients anticipatory attention towards
subsequent beats in the sequence. Jones et al. (2002) found that temporal
expectations were primed not just towards the next beat in the sequence,
but that this effect also extended to the following beat as well. However,
these findings were from two separate experiments so it is not possible to
directly compare the effects of anticipatory attention in each case.
In the current experiment, the priming sequence consisted of six tones, or
beats. For the tone-detection task, on-time targets could occur in line the
seventh or eighth beat of the sequence, with early and late targets either
side of these beats. This design enabled direct comparison of the effects of
anticipatory attention for the two beats following the end of the priming
sequence.
For the speech task, there were multiple possible target words, and
these were counterbalanced across conditions to negate any differences in
intelligibility. In order to maintain a comparable and feasible block length,
only one beat condition was used in the speech task: on-time targets always
occurred in line with the seventh beat of the sequence.
In all conditions, anticipatory attention was expected to enhance thresholds
for targets occurring in line with subsequent beats of the priming sequence,
compared with those for temporally displaced targets.

80 CHAPTER 4: RHYTHMIC PRIMINGOFANTICIPATORYATTENTION TOTARGETS INNOISE
4.2.2.5 Estimating the perceptual thresholdsIn order to examine the effects of anticipatory attention, thresholds needed
to be estimated for each of the target positions. It was vital that all target
positions were combined in a single block with equal probability, in order to
prevent endogenous temporal orienting to a most frequent target position.
As discussed in Section 2.4.1, an adaptive procedure is the most efficient
way to obtain a threshold estimate. However, for the current experiment
there were arguments against the use of an adaptive staircase.
While piloting the tone-detection task, it became clear that listeners needed
a regular reminder of the target sound to assist with the task. If the majority
of targets were presented at difficult SNRs, as is the case with adaptive
staircases, listeners reported perceiving a target in the noise signal even
when it was not present.
The current experiment used monosyllabic target words, which are unlikely
to be perfectly matched in perceptibility even when matched in overall
intensity. As discussed in Section 2.4.1, an adaotive procedure would not
be suitable for use with such stimuli.
It would have been possible to solve the first of these problems for the
tone-detection task by including additional easy trials spaced throughout
the staircase, or by targeting a higher threshold level. However, the second
issue with the speech task meant that the use of an adaptive staircase was
inappropriate. It was therefore decided to use the method of constant
stimuli for both tasks.
In order to efficiently sample the psychometric functions, it was decided
that the SNR levels would be set for each participant, as follows.
An adaptive procedure was used to assess a participant’s performance on
each target task in the absence of the priming stimuli, and SNR levels
were set according to this initial estimate. Participants completed a practice
block, after which the SNR levels were reassessed. If the data showed that
two or more of the levels resulted in ceiling performance, and participants
reported that the majority of trials were easy, the SNRs were decreased.
Conversely, if the data showed that two or more SNRs resulted in floor
performance (equal to guess rate or false alarm rate), and the participant
reported finding the task very difficult, then SNRs were increased. When
adjustments were necessary, the experimenter used the practice data to

EXPERIMENT 2: PRIMINGWITHA SIMPLE BEAT 81
choose SNRs which would give a good threshold estimate by covering the
full range of performance.
4.2.3 Methods4.2.3.1 ParticipantsParticipants were recruited via posters placed around the Queen’s Medical
Centre and University of Nottingham campus, and were naıve to the
purpose of the study. Fourteen native English speakers (4 male), aged
between 19 and 36 (mean age 26, standard deviation 6.1 years), with
normal hearing (≤20 dB HL across the standard audiometric frequencies
from 250 Hz to 8 kHz) took part in this study. Participants gave their
informed consent prior to starting the study and received an inconvenience
allowance.
4.2.3.2 StimuliOn each trial, the priming sequence was followed by a target sound, with
a background noise present throughout the trial (ending after a random
interval following the target offset). The priming sequence was clearly and
comfortably audible over the background noise (5 dB SNR for speech task;
0 dB SNR for tone task).
Priming sequenceThe priming sequence consisted of 6 pure tones (440 Hz frequency, 60 ms
duration including 10 ms cosine on/off ramps) presented isochronously. As
discussed in Section 4.2.2.1, the tempo of the sequence was selected at
random for each trial, with the inter-beat interval ranging from 570 to
630 ms. This range of intervals was chosen so that differences in tempo
were noticeable – to prevent expectations being built up across the block –
while also ensuring that the resultant range of possible target positions in
the different conditions were far from overlapping (see Figure 4.5).
Speech targetsThe target stimuli were monosyllabic words recorded by a male native
English speaker. There were 12 target words, each taking the form
consonant–[i]–consonant. The targets were chosen so that at least one
of the consonant sounds was confusable with another word in the list (see
Figure 4.2). Participants responded by choosing the word they had heard
from the list of 12 possible targets presented on a touch screen monitor.

82 CHAPTER 4: RHYTHMIC PRIMINGOFANTICIPATORYATTENTION TOTARGETS INNOISE
Figure 4.2: The target words used in Experiment 2
Tone targetThe target tone was a 1 kHz pure-tone of 80 ms duration (including 10 ms
cosine on/off ramps). Participants responding by pressing a button which
corresponded with their answer: ‘yes’ when they heard the target; ‘no’ when
they did not.
Background noiseFor the speech task, the background was a speech-spectrum noise matching
the long-term spectrum of the target stimuli, and was presented at 60 dBA.
For the tone task, a background of white noise was present (at 60 dB SPL)
throughout each trial.
4.2.3.3 Target positionsFor the speech-perception task, target words occurred in three positions
relative to the seventh beat of the priming sequence: early, on-beat or late.
Early and late targets were temporally displaced by one-third of the trial
inter-beat interval. The three target positions were equally likely to occur.
Figure 4.3 shows a schematic of a trial with an on-beat target.
Figure 4.3: Schematic diagram of a trial in the speech discrimination task in Experiment 2
For the tone-detection task, on-time targets occurred in line with the
seventh or eighth beat of the sequence, with early and late targets either

EXPERIMENT 2: PRIMINGWITHA SIMPLE BEAT 83
side of these beats. In the early and late conditions, targets were displaced
by one-quarter of the trial inter-beat interval. Figure 4.4 shows a schematic
of a trial showing the six possible target positions.
Figure 4.4: Schematic diagram of a trial in the tone detection task in Experiment 2
Figure 4.5: Effect on target positions of jittering the inter-beat interval
4.2.3.4 Method of constant stimuliThe method of constant stimuli was used, with a constant noise level and
five possible SNRs for the target sound.
For the speech task, each participant completed 4 blocks of 180 trials (12
target words × 5 SNRs × 3 target positions). The order of trials was
randomised within each block, and the target words were balanced across
all target positions and SNRs to average out any differences in perceptibility.
For the tone task, each participant completed 4 blocks of 216 trials (5 SNRs
× 6 target positions × 6 repetitions, plus 36 trials with no target present).

84 CHAPTER 4: RHYTHMIC PRIMINGOFANTICIPATORYATTENTION TOTARGETS INNOISE
The order of trials was randomised within each block. No-signal trials were
included to assess the rate of false alarms for each participant.
Setting levels for each participantThe SNR levels for each participant were determined using an adaptive
procedure.
For the speech task, a 3-down 1-up staircase was used to estimate the 79%
threshold (Levitt, 1971) for identifying the target words in noise (without
the priming sequence). The average of two such thresholds (rounded to the
nearest dB) was used as the second highest SNR for the speech task, with a
difference of 3 dB between the other SNRs. For example, if a participant’s
average threshold from two adaptive staircases was –14 dB SNR, then the
SNRs used in the experiment would have been –11, –14, –17, –20 and –23.
For the tone task, a 3-down 1-up staircase was used to estimate the 79%
threshold for detecting the target in a 3-alternative forced choice task
(without the priming sequence). Feedback was given during the adaptive
procedure, to help familiarise participants with the target sound. The
average of two thresholds (rounded to the nearest dB) was used as the
second highest SNR for the experiment, with a difference of 2 dB between
the other SNRs.
For each task, participants completed a practice block, after which the
data were assessed by the experimenter. If necessary, the SNR levels were
adjusted to ensure that the full range of performance would be observed
during the experimental blocks.
4.2.3.5 ProcedureTesting took place in a sound-proof booth over two sessions. All auditory
stimuli were presented diotically using Sennheiser HD-25 headphones,
using Matlab v2008a (The MathWorks, Natick, MA).
In the first session, participants completed the speech discrimination task,
including two adaptive tracks to determine SNR levels (as described above),
a practice block of 30 trials, and all four blocks of the speech task, with
breaks in between blocks as required.
In the second session, participants completed the tone detection task,
including hearing three samples of the target in noise, two adaptive tracks

EXPERIMENT 2: PRIMINGWITHA SIMPLE BEAT 85
(as described above), a practice block of 36 trials, and all four blocks of the
tone detection task, with breaks when needed.
All tasks were self-paced in that the response triggered the start of the next
trial, and participants were not required to respond within a set time limit.
Participants were instructed that the tone sequences were designed to
prepare them for the next trial and were not part of the task. At the end of
the second session, participants were debriefed regarding these instructions,
and asked whether they paid attention to the priming sequences or simply
ignored them.
4.2.3.6 AnalysisPsychometric functions were fitted to the data as described in Section 2.4.3.
The effects of rhythmic priming on the threshold of the psychometric
functions were analysed using repeated-measures ANOVAs. For the speech
task, the only factor entered into the analysis was target position (with 3
levels: early, on-beat, late). For the tone task, there were two within-subject
factors: beat (i.e. whether the target was closest to the beat immediately
following the priming sequence (Beat 1) or the one after that (Beat 2))
and target position (with 3 levels: early, on-beat, late). The performance
profile across target positions was predicted to be quadratic in shape,
centred around the on-beat target position (Jones et al., 2002). Polynomial
contrasts were used to test this prediction and quadratic curves were fitted
to the data (see Equation 2.3).
4.2.4 Results4.2.4.1 Effect of rhythmic priming on speech perception in noiseThe mean thresholds and slopes for the three target positions are given in
Table 4.1.
Table 4.1: Themean thresholds and slopes for the speech perception task in Experiment 2Target position Mean threshold Mean slope
(dB SNR) (% per dB SNR)Early (–0.2 s from beat) –15.3 12.8On-beat (0 s from beat) –15.9 11.5Late (+0.2 s from beat) –15.5 11.4

86 CHAPTER 4: RHYTHMIC PRIMINGOFANTICIPATORYATTENTION TOTARGETS INNOISE
The repeated-measures ANOVA showed a significant main effect of target
position on speech reception threshold (F(2,26) = 10.0, p = .001, partial
η2 = .44). There was a significant quadratic trend over target positions
(F(1,13) = 38.2, p < .001, partial η2 = .75). Figure 4.6 shows the mean
thresholds for the three target positions, with the fitted quadratic curve.
Planned comparisons (Bonferroni corrected) showed that the threshold for
on-beat targets was significantly lower than that for both early (p = .001)
and late targets (p = .026) as predicted. This means that rhythmic priming
did enhance speech perception in noise.
Figure 4.6: The speech task results from Experiment 2, showing mean thresholds andstandard error bars for the three target positions
Perception performance for individual target wordsTable 4.2 shows the percent correct performance at each SNR (all target
positions combined) for each target word. There were clear differences
in perceptibility between the targets, justifying the use of the method of
constant stimuli over an adaptive procedure. Some words were correctly
identified more often than expected even at the hardest SNRs (e.g., ship,
whizz) while others were difficult to distinguish even at the easiest SNRs
(e.g., fib, witch).

EXPERIMENT 2: PRIMINGWITHA SIMPLE BEAT 87
It is likely that certain sounds were easier to pick out of the noise. For
example, ship was the only word with ‘sh’ at the start, and participants
found this easy to distinguish. Similarly, whizz had the unique ‘zz’ which
made it relatively easy to identify. At the other end of the scale, fib and
witch also had unique sounds (‘b’ and ‘tch’ respectively) but these were
apparently better masked by the background noise, and there were multiple
other targets beginning with ‘f’ or ‘w’ which made a correct guess less likely.
Removal of these four target words would leave eight words with more
similar perceptibility.
One participant remarked that they found hearing the word ‘kill’ quite
distracting, so this will also be removed for Experiment 3, along with ‘kiss’
as this word would then have no confusible sounds. This leaves six target
words for use in Experiment 3: dip, fill, fish, hip, will, wish.
Table 4.2: Perception performance for the individual target words used in Experiment 2Target word Percent correct identification for each SNR SNRs combined
Hardest Easiestdip 5 11 41 82 99 48fib 13 18 18 19 28 19fill 21 50 74 94 96 67fish 8 19 63 89 96 55hip 12 17 43 71 89 46kill 15 36 77 96 100 65kiss 22 57 89 96 99 73ship 39 68 89 99 99 79whizz 33 70 96 98 99 79will 17 44 82 92 99 67wish 8 27 61 79 82 51witch 3 5 18 46 78 30Words combined 16 35 63 80 89 57Standard deviation 11 22 27 24 21 19
4.2.4.2 Effect of rhythmic priming on pure-tone detection in noiseThe mean thresholds and slopes for the three target positions (with data
from Beat 1 and Beat 2 combined) are given in Table 4.3.

88 CHAPTER 4: RHYTHMIC PRIMINGOFANTICIPATORYATTENTION TOTARGETS INNOISE
Table 4.3: Themean thresholds and slopes for the tone detection task in Experiment 2Target position Mean threshold Mean slope
(dB SNR) (% per dB SNR)Early (–0.15 from beat) –19.7 17.9On-beat (0 s from beat) –20.2 17.1Late (+0.15 s from beat) –19.7 17.1
The repeated-measures ANOVA showed a significant main effect of target
position (F(2,26) = 10.1, p = .001, partial η2 = .44). There was a
significant quadratic trend over target positions (F(1,13) = 24.5, p < .001,
partial η2 = .65) as expected. Figure 4.7 shows the mean thresholds for the
early, on-beat and late target positions. Planned comparisons showed that
the threshold for on-beat targets was significantly lower than that for both
early (p = .003) and late targets (p = .004) as predicted. This means that
rhythmic priming did enhance tone detection in noise.
Figure 4.7: The tone detection task results from Experiment 2, showing mean thresholdsand standard error bars for the three target positions
The main effect of beat (i.e. which beat the target was closest to) was
not significant, but the beat by target position interaction was significant
(F(2,26) = 7.01, p = .004, partial η2 = .35). Separate univariate analyses

EXPERIMENT 2: PRIMINGWITHA SIMPLE BEAT 89
for Beat 1 and Beat 2 both showed a significant main effect of target
position (Beat 1: F(2,26) = 9.39, p = .001, partial η2 = .42; Beat 2:
F(2,26) = 7.19, p = .003, partial η2 = .36) and a significant quadratic trend
(Beat 1: F(1,13) = 20.9, p = .001, partial η2 = .62; Beat 2: F(1,13) = 6.61,
p = .023, partial η2 = .34). Figure 4.8 shows the mean thresholds for all
six target positions.
For Beat 1, the on-beat threshold was significantly lower than the early
threshold (p < .001), but there was no significant difference between the
on-time and late target positions (p = .307). For Beat 2, the on-beat
threshold was significantly lower than the late threshold (p = .019) but not
significantly different from the early threshold (p = 1.0). These different
patterns support the decision not to use a two-alternative forced-choice task
with comparison intervals based around the two subsequent beats.
Figure 4.8: The tone detection results from Experiment 2, showing mean thresholds andstandard error bars for the six target positions

90 CHAPTER 4: RHYTHMIC PRIMINGOFANTICIPATORYATTENTION TOTARGETS INNOISE
4.2.4.3 Comparison of rhythmic priming effects in the two tasksTable 4.4 contains summary statistics for the rhythmic priming effects
observed in the speech and tone tasks. Comparison of the coefficients of x2
in the fitted quadratic functions suggests that the effect of rhythmic priming
was greater for pure-tone detection than for speech perception.
Table 4.4: Table showing summary statistics for the speech and tone tasks in Experiment 2.Note that the target positions differed in the two tasks, so the two benefit statistics are notdirectly comparableSummary statistic Speech task Tone taskPriming effecta 11.5 22.1Mean slopeb (% per dB SNR) 11.9 17.4Mean threshold benefitc (dB SNR) 0.46 0.50Equivalent performance benefitd (% correct) 5.5 8.6
a The coefficient of x2 in the fitted quadraticb Averaged over all three target positionscMean of thresholds for displaced targets minus threshold for on-beat targetsdMean benefit multiplied bymean slope
Another measure of priming benefit is the difference between thresholds for
on-beat and displaced targets. For both tasks the improvement in threshold
for on-beat targets was around 0.5 dB, although it should be noted that the
early and late targets were displaced by different intervals in the two tasks,
so these values are not directly comparable. This benefit can be converted
to an improvement in performance by multiplying the threshold benefit by
the mean slope of the threshold. The benefit for on-beat (compared to
early and late) words is equivalent to a 5.5% increase in discrimination
performance. The benefit for on-beat (compared to early and late) tones is
equivalent to an 8.6% improvement in detection performance.
4.2.5 DiscussionIn this experiment, a rhythmic priming paradigm was used to test
the hypothesis that stimulus-driven anticipatory attention can enhance
perception of targets in noise.
For this study, there was quite a wide age range within the relatively small
sample of participants, which is not ideal. However, within the young
adult age range being tested, neither thresholds nor rhythmic priming were
expected to change with age. This was in fact the case, with no significant

EXPERIMENT 2: PRIMINGWITHA SIMPLE BEAT 91
correlations observed for age and threshold or for age and priming effect
for either task (all p-values > .1).
Rhythmic priming has previously been shown to reduce response times to
a speech target presented in quiet (Cason and Schon, 2012). In the current
experiment, the effects of rhythmic priming were investigated for speech
targets in noise, and for perceptual thresholds rather than reaction times.
The results indicate that rhythmic priming can lead to enhanced speech
reception thresholds for targets occurring on the beat.
Previous research has also shown that deliberate orienting of attention to a
point in time can enhance detection of a pure-tone target in noise when this
target occurs in line with the temporal expectation (Werner et al., 2009).
The results of the current experiment demonstrate that pure-tone detection
in noise can also be enhanced by automatic orienting of temporal attention
via a rhythmic sequence. Detection performance was superior for targets
which occurred on future beats of the priming rhythm.
Different patterns of results were observed for targets which occurred
around the first and second beats following the priming sequence. This
is in contrast to a previous report (Jones et al., 2002) that performance
profiles were similar for targets occurring around the next two beats of
a priming rhythm . In that study, the two beat conditions were tested
separately, whereas in the current study all target positions were combined
within the same blocks. The results of this experiment therefore indicate
that, although anticipatory attention does persist beyond the end of the
priming sequence, the pattern of effects may not be consistent. In future
experiments, targets will be located around a single beat, to avoid any
confounds arising from the different patterns of results observed here.
As with prior rhythmic priming studies (de la Rosa et al., 2012; Jones
et al., 2002), listeners were instructed that the priming sequence was not
part of the task and they did not need to attend to the tones. However,
during debrief, several participants reported that they had tapped along
with or counted the priming tones. It is possible, therefore, that the
observed attentional effect could have had an endogenous component,
despite that fact that the on-beat targets occurred in only one third of the
trials and were therefore not predictive (usually a condition of endogenous
orienting). As no control condition was included in the current study, it

92 CHAPTER 4: RHYTHMIC PRIMINGOFANTICIPATORYATTENTION TOTARGETS INNOISE
cannot be concluded definitively that the observed effects were entirely due
to automatic orienting of attention by the isochronous priming sequence.
The paradigm used in this experiment was successful in manipulating
temporal expectations. However, there are several possible refinements to
the tasks that will be discussed in the design of Experiment 3.
4.3 Experiment 3: Primingwithmusical rhythms4.3.1 AimsExperiment 2 confirmed that stimulus-driven anticipatory attention can
enhance perception of both speech and tone targets in noise. However, a
simple isochronous priming sequence is not representative of the complex
metrical rhythms found in music or speech.
Rhythmic priming is an automatic process, somewhat comparable to the
exogenous cueing discussed in Section 1.3. For an exogenous cue to
successfully capture attention, it must be sufficiently salient. In rhythmic
priming, the cue could be considered to be the beat of the priming sequence,
so salience here could refer to the strength of the beat percept that arises
as a result of the rhythmic sequence.
An isochronous sequence would result in a strong beat percept, whereas for
more complex musical rhythms the beat might not be so obvious. For more
complex rhythms, the strength of the priming cue could depend on the
listener’s ability to perceive the beat. It would then follow that the rhythmic
priming effect from such rhythms should be correlated with musical beat
perception.
In Experiment 3, different rhythmic sequences were used in order to
compare the effects of priming with:
• simple rhythms with a strong, salient beat percept (no musical ability
needed to perceive the beat)
• more complex rhythms with a less salient beat percept (musical ability
needed to perceive the beat)
• non-beat rhythms with no isochronous pulse (control condition)

EXPERIMENT 3: PRIMINGWITHMUSICAL RHYTHMS 93
4.3.2 Task design4.3.2.1 Speech stimuliThe twelve target words used in Experiment 2 resulted in a wide range of
performance (see Table 4.2). To remove confounds due to variations in
perceptibility, a subset of six of these words was used in Experiment 3 (see
Section 4.2.4.1). These words were identified as having a similar level of
perceptibility, while still containing confusable consonant sounds: dip, fill,
fish, hip, will, wish.
4.3.2.2 Target positionsIn Experiment 2, there were three target positions around each on-beat
position. While the data are consistent with enhanced performance at the
on-beat position, with just three points it is not possible to determine if
the performance profile is in fact quadratic, as would be expected by the
oscillatory explanation of dynamic attending theory (see Figure 1.3).
In order to examine the shape of the performance profile in more detail, five
target positions were used in Experiment 3. As before, a quadratic shape
was expected, centred with peak performance at the on-beat position (as
reported by Jones et al. (2002)).
4.3.2.3 Priming rhythmsThe priming seqences used in Experiment 3 were based on those
investigated by Grahn and Rowe (2009). The rhythmic sequences were
arranged in common time (i.e., 4 beats to each bar) and different methods
were used to emphasise the first beat in each bar (the ‘downbeat’) in order
to create the perception of a regular pulse. The interval between downbeats
will be referred to as the inter-beat interval.
The first type of rhythm, referred to as ‘volume beat’, consisted of an
isochronous sequence of tones in which every fourth tone was presented at
a higher intensity. This is a highly salient way to emphasise the downbeat,
and no musical expertise is needed to perceive the beat.
The ‘duration beat’ condition exploited the fact that changes in note lengths
can be used to create emphasis during a musical sequence (Grahn and Brett,
2007). Sequences of identical tones were created such that the inter-onset
intervals were equal to one-quarter, one-half, three-quarters, or one times
the inter-beat interval. The intervals were arranged in a metrical structure

94 CHAPTER 4: RHYTHMIC PRIMINGOFANTICIPATORYATTENTION TOTARGETS INNOISE
so that each group of intervals added up to one inter-beat interval. This
resulted in sequences in which an emphasised tone would be perceived on
every downbeat, despite the fact that all tones were acoustically identical.
This is a less salient way to create a perception of musical beat compared
to the volume beat condition.
It is useful to consider these different rhythm types in the context of the beat
alignment test. The test uses music from different genres and the salience of
the beat varies between excerpts. For example, in the rock excerpts, drums
or other percussion instruments are used to produce a loud sound on each
downbeat – this is similar to the volume beat condition. Conversely, in
the orchestral excerpts, there is no percussion and instead the beat percept
arises from the metrical structure and relative durations of notes – similar
to the duration beat condition. To perform well on the beat alignment test,
the listener must be able to perceive the beat in both types of music.
Two other priming conditions were also included in this experiment: an
isochronous sequence, in order to compare results to those obtained in
Experiment 2; and a non-beat sequence, which was designed to act as a
control condition.
It was predicted that each of the three beat conditions would result in a
quadratic performance profile (with the greatest enhancement for on-beat
targets), while the non-beat condition would result in a flatter performance
profile. It was also predicted that musical beat ability (as measured by the
beat alignment test) would correlate with the priming benefit observed for
the less salient duration beat condition.
4.3.2.4 Refining the method of constant stimuliIn Experiment 2, an adaptive procedure was used to determine the SNR
levels for each participant. Of the 14 participants, a majority (9 in the
speech task; 8 in the tone task) were eventually tested using the same set
of SNRs, with only small variations for other listeners. Examination of the
performance data from Experiment 2 confirmed that a single set of SNRs
would have adequately covered the range of observed thresholds. The SNRs
were therefore fixed in Experiment 3.
Given the number of conditions to be tested in this experiment, the number
of trials per condition needed to be minimised. A bootstrapping procedure
was applied to the data from Experiment 2, as follows. The collected

EXPERIMENT 3: PRIMINGWITHMUSICAL RHYTHMS 95
data were sampled at random to create a possible set of observations for
a given number of repetitions, and this sampling was repeated 1000 times
to obtain a mean set of results. Psychometric functions were fitted to the
resampled data, and the effect of target position on threshold was analysed
with a repeated-measures ANOVA. This process was repeated for different
numbers of repetitions in order to determine how many repetitions were
required in order to observe a significant effect of rhythmic priming.
For the speech task, it had already been decided to use a set of six
target words in the current experiment. To balance these words across
all conditions, the number of repetitions needed to be a multiple of six.
Bootstrapping with six repetitions was not sufficient to observe a significant
effect of target position (p> .4). Twelve repetitions, however, was sufficient
to observe the quadratic priming effect for both speech and tone tasks
(p = .001). Therefore, in Experiment 3, twelve repetitions were included
for each target position and SNR combination.
4.3.3 Methods4.3.3.1 ParticipantsThe sample size to be used for this experiment was decided using an a
priori power analysis conducted in G*Power 3 (Faul et al., 2007). Inputs
were the effect size from Experiment 2 (partial η2 was equal to 0.44 for
both tasks), an alpha level of 0.05 and a desired power level of 0.8, for a
repeated measures ANOVA with one group and five measures. The output
suggested a sample size of 17 people. However, as the counterbalancing
of conditions required a multiple of 8 participants, the power level based
on 16 participants was calculated. The resulting value was 0.79 which was
deemed to be sufficient.
Participants were recruited via posters placed around the Queen’s Medical
Centre and University of Nottingham campus. Sixteen native English
speakers (6 male), aged between 18 and 24 (mean age 21, standard
deviation 1.5 years) completed this experiment. They were naıve to the
purpose of the study and had not previously taken part in Experiment 2.
Participants were screened for normal hearing using pure tone audiometry
(≤20 dB HL across standard audiometric frequencies from 250 Hz to 8 kHz).
Participants gave their informed consent prior to starting the study and
received an inconvenience allowance for their time.

96 CHAPTER 4: RHYTHMIC PRIMINGOFANTICIPATORYATTENTION TOTARGETS INNOISE
4.3.3.2 StimuliPriming sequencesFour priming conditions were used: isochronous, volume beat, duration
beat, and non-beat. All of the tones in all of the priming sequences were
pure-tones of 440 Hz frequency and 60 ms duration (including 10 ms cosine
on/off ramps). The inter-beat interval was jittered randomly within a range
(570–630 ms), as in Experiment 2.
The isochronous sequence consisted of seven tones, with each inter-onset
interval equal to the inter-beat interval.
The volume beat sequence consisted of an isochronous sequence of tones,
with each inter-onset interval equal to one-quarter of the inter-beat interval.
The first, and thereafter every fourth, tone was presented at a higher
volume (65 dB) than the remaining tones (55 dB). The loud tones defined
the beat, and therefore the onset interval between loud tones was equal to
the inter-beat interval.
In the duration beat condition, the shortest inter-onset interval was the
same as that in the volume beat condition (one-quarter of the inter-beat
interval). The remaining intervals were integer multiples of this duration,
and intervals were arranged into groups that added up to the inter-beat
interval. For example, the duration beat sequence in Figure 4.9 could be
written as 2+1+1, 2+2, 3+1, 3+1, 1+3, 2+2. The relative durations of
the intervals created the perception of beat, and a tone occurred on every
downbeat in the sequence.
The non-beat sequences were created by altering a sequence of identical
tones in which all inter-onset intervals were initially equal to one-quarter of
the inter-beat interval. One third of the inter-onset intervals were reduced
by 30% and one third were increased by 30%. These intervals were then
arranged in a random order on each trial in order to create a sequence
which had no regular beat.
Examples of these four types of sequence are shown in Figure 4.9. The
vertical lines in the figure represent the beat structure, and tone onsets
which are aligned with these vertical lines are on the beat. All of the
priming sequences started with a tone on the first beat and ended with
a final tone occurring on the seventh beat. The three beat conditions also
had tones on beats two through six, whereas the non-beat condition did not.

EXPERIMENT 3: PRIMINGWITHMUSICAL RHYTHMS 97
The target stimulus occurred on or around the eighth beat, as described
below.
Figure 4.9: Example priming sequences from the four rhythmic conditions, with dotted linesshowing the position of beats 1 to 7
Speech targetsThe six target words used in Experiment 3 are shown in Figure 4.10. This
subset of words were chosen from those used in Experiment 2 as they
produced similar levels of perceptibility, and each contains at least one
confusable consonant sound.
Figure 4.10: Theword list used in Experiment 3
Tone targetThe tone target was the same as in Experiment 2 (1 kHz pure-tone, 80 ms
including 10 ms cosine on/off ramps).
Background noiseThe background noise was the same as in Experiment 2 (speech task:
speech-spectrum noise at 60dBA; tone task: white noise at 60 dB SPL).
4.3.3.3 Target positionsFor both tasks, targets occurred in five positions with equal probability.
On-beat targets were aligned with the eighth beat of the priming sequence,
while early and late targets were temporally displaced by either one-sixth
or one-third of the trial inter-beat interval (see Fig 4.11).

98 CHAPTER 4: RHYTHMIC PRIMINGOFANTICIPATORYATTENTION TOTARGETS INNOISE
Figure 4.11: Schematic of the task used in Experiment 3, showing the five target positions inrelation to a shortened isochronous sequence
Due to a programming error, the targets in the duration beat condition were
presented slightly later than intended. The delay was equal to one-quarter
of the trial inter-beat interval minus 60 ms. So, for an interval of 600 ms,
the targets occurred 90 ms later than intended – meaning that ‘on-beat’
targets were actually presented just 10 ms before the late target position,
etc. This did not impair the analysis of priming effects as thresholds were
fitted for each position, and the actual displacements were used for fitting
quadratic curves to the data. All results figures display the actual target
positions which were presented.
4.3.3.4 Method of constant stimuliThe method of constant stimuli was used, with a constant noise level and
five possible SNRs for the target sound.
For the speech task, each participant completed 2 blocks for each of the 4
priming conditions. Each block consisted of 150 trials (6 target words × 5
SNRs × 5 target positions). The five SNRs were fixed for all participants:
–12, –14, –16, –18, –20 dB SNR. The order of trials was randomised within
each block, and the target words were balanced across all target positions
and SNRs.
For the tone task, each participant completed 2 blocks for each of the 4
priming conditions. Each block consisted of 180 trials (5 SNRs × 5 target
positions × 6 repetitions, plus 30 trials with no target present). The five
SNRs were fixed for all participants: –16, –18, –20, –22, –24 dB SNR. The
order of trials was randomised within each block. No-signal trials were
included to assess the rate of false alarms for each participant.

EXPERIMENT 3: PRIMINGWITHMUSICAL RHYTHMS 99
4.3.3.5 Subjective beat ratings of priming sequencesThe aim of this experiment was to compare rhythmic priming using
sequences of varying beat salience. To determine if the manipulations
were successful, a subjective rating exercise was completed at the end of
the final session, separate from the priming task. Listeners heard eight
tone sequences (two for each rhythm type) in a randomised order, and
judged each on a scale from 1 (no regular pulse) to 10 (obvious beat).
The two ratings for each rhythm type were averaged to give a score which
represented how easy it was to hear the beat.
4.3.3.6 Musical beat perceptionParticipants’ ability to perceive a musical beat was assessed using the
auditory-only section of the Beat Alignment Test (Iversen and Patel, 2008).
Details were the same as in Experiment 1 (see Section 3.2.2, page 62).
4.3.3.7 ProcedureTesting took place in a sound-proof booth over four sessions. All auditory
stimuli were presented diotically using Sennheiser HD-25 headphones,
using Matlab v2008a (The MathWorks, Natick, MA).
In each session, participants completed both blocks of the speech task for
one priming condition, and both blocks of the tone task for a different
priming condition. The order of priming conditions for each task was
counterbalanced across participants.
Prior to starting each task, participants completed five practice trials with
audible targets in order to familiarise themselves with the task, the target
sound, and the sequence type. An additional practice block (25 or 30 trials
for speech or tone tasks respectively) was included only in the first session.
All tasks were self-paced in that the response triggered the start of the next
trial, and participants were not required to respond within a set time limit.
As in Experiment 2, participants were instructed that the tone sequences
were designed to prepare them for the next trial and were not part of
the task. At the end of the final session, participants completed the
subjective beat ratings and beat alignment test, and were debriefed about
their behaviour during the priming task.

100 CHAPTER 4: RHYTHMIC PRIMINGOFANTICIPATORYATTENTION TOTARGETS INNOISE
4.3.3.8 AnalysisPsychometric functions were fitted to the data as described in Section 2.4.3.
For one participant, there was cause for concern regarding the
concentration level during the non-beat condition of the tone task.
Inspection of the raw data confirmed the listener had lost focus during
this block, resulting in a low detection rate even at the highest SNRs. The
data from this participant for this condition were therefore excluded from
analysis.
The effects of rhythmic priming on the threshold of the psychometric
functions were analysed using repeated-measures ANOVAs. Due to the
exclusion of one participant in the non-beat condition, and the error
in presented target positions for the duration beat condition, separate
analyses were run for the four priming conditions. The single factor of
target position (5 levels) was entered into the analysis for both tasks.
Polynomial contrasts were used to examine the performance profiles, and
quadratic curves were fitted to the data (see Equation 2.3).
Finally, Pearson correlations were used to analyse the relationship between
musical beat perception and the priming effect in each beat condition.
4.3.4 Results4.3.4.1 Subjective beat ratingsThe scores show that the different rhythmic accents had the desired effect
(see Figure 4.12). The isochronous and volume beat conditions scored
very highly, confirming that the beats in these sequences were easy to
hear. The duration beat condition scored lower, with more variability,
meaning that people differed in how easy they found it to hear the beat
in these sequences. This suggests that the beat was indeed less salient in
the duration beat condition.
Beat salience cannot, however, explain the variability observed for the
non-beat condition, since there was no isochronous beat to be perceived.
While the non-beat rhythms were rated the lowest of the four, as expected,
two participants judged these sequences as having a clear beat. It is possible
that this reflects a misunderstanding of the instructions or the description
of a regular pulse. It could also be that these listeners failed to perceptually
distinguish between the isochrony in the beat rhythms and the lack of it

EXPERIMENT 3: PRIMINGWITHMUSICAL RHYTHMS 101
in the non-beat rhythms, and they genuinely perceived what they thought
was a regular pulse in the non-beat rhythms.
The subjective rating scores were not normally distributed, so
non-parametric analyses were used. The Friedman test was significant
(χ2(3) = 44.2, p<.001). Post hoc analysis using Wilcoxon signed-rank tests
with Bonferroni corrections confirmed that all pairwise comparisons were
significant (Isochronous vs Volume beat: Z = -2.23, p = .026; Isochronous
vs Duration beat: Z = -3.52, p<.001; Isochronous vs No beat: Z = -3.52,
p<.001; Volume beat vs Duration beat: Z = -3.53, p<.001; Volume beat vs
No beat: Z = -3.52, p<.001; Duration beat vs No beat: Z = -2.83, p = .005).
Figure 4.12: Boxplots of the subjective beat ratings for the four priming rhythms.Participants rated each sequence on a scale from 1 (no discernible beat) to 10 (easy tohear beat).
4.3.4.2 Effect of rhythmic priming on speech perception in noiseThe mean thresholds for the four priming conditions and five target
positions are shown in Figure 4.13. Repeated-measures ANOVAs revealed
no significant effects of target position on threshold for any of the
four conditions (Isochronous: F(4,60) = .10, p = .98; Volume beat:
F(4,60) = .29, p = .88; Duration beat: F(4,60) = 1.20, p = .32; No beat:
F(4,60) = 2.32, p = .07).
This means that the rhythmic priming had no effect on the perception
of speech targets in Experiment 3. Figure 4.14 shows the results of the
isochronous priming condition in Experiments 2 and 3 for comparison.
Summary statistics for these two tasks are given in Table 4.5.

102 CHAPTER 4: RHYTHMIC PRIMINGOFANTICIPATORYATTENTION TOTARGETS INNOISE
Figure 4.13: The speech task results from Experiment 3, showing mean thresholds andstandard error bars for the five target positions; quadratic curves have been fitted to thedata for clarity although no significant relationships were observed
Figure4.14: The speech task results for the isochronous priming condition fromExperiments2 and 3, showingmean thresholds and standard error bars for each target position

EXPERIMENT 3: PRIMINGWITHMUSICAL RHYTHMS 103
Table 4.5: Table showing summary statistics for the isochronous condition of the speechdiscrimination tasks in Experiments 2 and 3Summary statistic Experiment 2 Experiment 3Mean priming effecta 11.5 2.7 (n.s.)Standard deviation 7.0 20.2Mean slopeb (% per dB SNR) 11.9 14.7Mean threshold benefitc (dB SNR) 0.46 0.12 (n.s.)Equivalent performance benefitd (% correct) 5.5 1.7
a The coefficient of x2 in the fitted quadraticb Averaged over all target positionscMean of thresholds for displaced targets minus threshold for on-beat targetsdMean benefit multiplied bymean slope
Despite the similarities between the tasks used in the two experiments, the
results appear to be quite different: the Experiment 2 results show a clear
quadratic trend, with significant benefit for on-beat targets; the Experiment
3 results show a much flatter profile with no significant effects of target
position. Possible reasons for these different patterns will be discussed
below.
4.3.4.3 Effect of rhythmic priming on tone detection in noiseThe mean thresholds for the four priming conditions and five target
positions are shown in Figure 4.15. Repeated-measures ANOVAs revealed a
significant effect of target position on threshold in each of the four priming
conditions (Isochronous: F(4,60) = 7.67, p < .001, partial η2 = .34,
with Greenhouse-Geisser correction applied; Volume beat: F(4,60) = 5.52,
p = .001, partial η2 = .27; Duration beat: F(4,60) = 16.5, p < .001, partial
η2 = .52; Non-beat: F(4,56) = 2.96, p = .027, partial η2 = .18).
For all four conditions, the performance profile was significantly quadratic
in shape (Isochronous: F(1,15) = 38.0, p < .001, partial η2 = .72;
Volume beat: F(1,15) = 10.8, p = .005, partial η2 = .42; Duration beat:
F(1,15) = 27.7, p < .001, partial η2 = .65; Non-beat: F(1,14) = 9.37,
p = .008, partial η2 = .40). The non-beat condition appears to have resulted
in a shallower curve, as predicted, although the priming effect (see Table
4.6) is not significantly different from the other conditions (all pairwise
comparisons with p > .3).

104 CHAPTER 4: RHYTHMIC PRIMINGOFANTICIPATORYATTENTION TOTARGETS INNOISE
Figure 4.15: The tone-detection task results from Experiment 3, showingmean detectionthresholdswith standard error bars for thefive target positions in the four priming conditions
Table 4.6: Table showing summary statistics for the tone-detection task in Experiment 3Summary statistic Isochronous Volume
beatDurationbeat
No beat
Priming effecta 22.5 17.4 22.9 14.5Mean slopeb (% per dB SNR) 17.9 17.8 18.5 18.1Mean threshold benefitc (dB SNR) 0.86 0.70 0.84 0.59Equivalent benefitd (% correct) 15.5 12.5 15.6 10.7
a The coefficient of x2 in the fitted quadraticb Averaged over all target positionscMean of thresholds for very displaced targets minus threshold for on-beat targetsdMean benefit multiplied bymean slope
The results from the isochronous priming condition for Experiments 2 and
3 are shown in Figure 4.16 and summarised in Table 4.7. Unlike for the
speech task, the priming effects observed for the tone-detection task in the
two experiments were very similar.

EXPERIMENT 3: PRIMINGWITHMUSICAL RHYTHMS 105
Figure 4.16: The tone-detection task results for the isochronous priming condition fromExperiments 2 and 3, showing mean thresholds and standard error bars for each targetposition
Table 4.7: Table showing summary statistics for the isochronous condition of thetone-detection tasks in Experiment 2 and 3Summary statistic Experiment 2 Experiment 3Priming effecta 22.1 22.5Mean slopeb (% per dB SNR) 17.4 17.9Mean threshold benefitc (dB SNR) 0.50 0.50Equivalent performance benefitd (% correct) 8.6 9.0
a The coefficient of x2 in the fitted quadraticb Averaged over all target positionscMean of thresholds for displaced targets minus threshold for on-beat targets; comparable thresholds (± 0.15 s)estimated from quadratic graph for Experiment 3dMean benefit multiplied bymean slope
4.3.4.4 Musical beat abilityTable 4.8 shows the Pearson correlation coefficients for the relationships
between beat perception score and priming effect for the three beat
conditions. As predicted, when the priming sequence had a less salient beat
(duration beat condition), the priming effect was correlated with musical
beat perception (r = .48, p = .030 (one-tailed); see Fig 4.17).

106 CHAPTER 4: RHYTHMIC PRIMINGOFANTICIPATORYATTENTION TOTARGETS INNOISE
The cocor program (Diedenhofen and Musch, 2015) was used to run
comparative analyses of the correlations for the most salient beat condition
(isochronous) and the least salient beat condition (duration beat). The
correlation coefficient between these two priming effects was 0.21 (p=.22).
As hypothesised, this difference was significant, with beat perception more
strongly associated with the priming effect in the less salient duration beat
condition (example analyses from cocor: Hotelling’s t = 1.89, df = 13,
p = .04; Williams’ t = 1.87, df = 13, p = .04; Dunn and Clark’s z = 1.76,
p = .04).
Table 4.8: Pearson correlation coefficients between beat perception and rhythmic primingeffectsCorrelations Isochronous Volume Beat Duration BeatBeat perception –.08 .11 .48**p<.05 (one-tailed)
Figure 4.17: Scatter plot showing the association betweenmusical beat ability (as measuredby the Beat Alignment Test) and the priming effect in the three beat conditions
4.3.5 DiscussionThe aim of Experient 3 was to compare anticipatory attention driven by
different types of musical rhythms. It was hypothesised that musical
beat perception would influence the size of effect observed for a priming
sequence with a less salient beat.
4.3.5.1 Speech discrimination taskThere was no significant effect of rhythmic priming on the perception of
speech targets in noise. This was the case even in the isochronous condition
which was comparable to that used in Experiment 2 (for which an effect
was observed).

EXPERIMENT 3: PRIMINGWITHMUSICAL RHYTHMS 107
There were a number of changes from Experiment 2 to Experiment 3 which
could have had an effect on the results:
• Six target words instead of 12
• Five target positions instead of three
• Four priming conditions instead of one
• Fewer repetitions for each condition at each SNR
• A different sample of participants
With five target positions in Experiment 3, it may be that any enhancement
was diluted by the overlap of speech stimuli with other target positions.
This would not have been an issue in the tone task since the target tones
are considerably shorter than the target words. This possibility will be taken
into account in the design of Experiment 4.
Experiment 3 was conducted over four separate sessions and each
participant completed a total of 16 blocks of priming tasks, compared to
two sessions of four blocks in Experiment 2. Most participants completed
the study without problems, but a few complained about boredom at
having to repeat the task this many times. Perhaps understandably then,
during debrief participants reported quite different behaviours from those
in Experiment 2.
Most participants reported that they were simply ignoring the tone
sequences and just listening out for a speech sound (this possiblity will
be investigated in Experiment 4). A few participants claimed that they
were focusing specifically on the background noise to tune out the tone
sequences. Although rhythmic priming is an automatic process that does
not require deliberate attention (Jones et al., 2002), there may be a
difference between passively listening to the sequence and actively ignoring
it.
This behaviour is in stark contrast to that reported by participants in
Experiment 2, some of whom counted or tapped along to the priming
tones, despite being told that these sequences were not part of the task. As
discussed in Section 4.2.5, this behaviour may have enhanced the priming
effect by adding an endogenous component on top of that predicted from
automatic processing of the priming rhythm. This was not the case in
Experiment 3. The rhythmic cues were informative in only one-fifth of

108 CHAPTER 4: RHYTHMIC PRIMINGOFANTICIPATORYATTENTION TOTARGETS INNOISE
trials – compared to one-third of trials in the previous experiment – which
might have further discouraged endogenous orienting of attention.
It is therefore possible that the priming effect observed for the speech task
in Experiment 2 was due in part to endogenous orienting to the priming
rhythms, rather than purely automatic, stimulus-driven, anticipatory
attention as hypothesised. Alternatively, it may simply be that the
participants in Experiment 2 were more likely to be influenced by a
rhythmic prime than those recruited for Experiment 3, although the
findings for the tone-detection task, below, suggest that that was not the
case.
Another issue is that the bootstrapping procedure – to determine the
required number of repetitions – and the power analysis – to determine
the required sample size – were based on the results of Experiment 2. With
multiple differences between the two experiments, any of which could have
influenced results as discussed, it may be that these numbers were not in
fact sufficient to observe a significant effect of rhythmic priming for speech
targets.
4.3.5.2 Tone detection taskPriming with musical rhythms had a significant effect on detection
thresholds for pure tones in white noise. Detection was enhanced for
targets occurring on or close to the next beat of the priming sequence, and
the performance profiles were quadratic in shape as predicted.
When the beat of the rhythmic priming sequence was less salient (duration
beat condition), and therefore required some musical expertise to perceive,
the size of the priming effect was associated with musical beat perception
ability. Moreover, this correlation was significantly greater than that for
beat ability and priming by isochronous sequences. This result supports
the hypothesis that listeners with good beat perception can benefit from
underlying, complex rhythms (such as those found in music and speech)
which orient anticipatory attention towards points in time when important
parts of the signal are likely to occur.
The non-beat condition was intended to be a control which would not
induce rhythmic priming. However, the performance profile in this
condition was also quadratic, albeit slightly – if not significantly – flatter
than for the beat conditions. Irregular sequences have been reported to

EXPERIMENT 4: PRIMINGWITH SPEECH SOUNDS 109
cue temporal attention (de la Rosa et al., 2012), and some participants did
report hearing regularity even in the non-beat sequences. This suggests that
these sequences may not have been an effective control for examining the
effects of rhythmic priming. An alternative control sequence will be tested
in Experiment 4.
4.4 Experiment 4: Primingwith speech sounds4.4.1 AimsAfter the speech task of Experiment 3, participants reported ignoring the
priming tones and instead listening out for a speech sound. This strategy
was possible because the tones and targets were acoustically distinct, and
so selective attention could be oriented to the frequency characteristics of
the target voice. This may have overshadowed any orienting of temporal
attention. To test this possibility, Experiment 4 used a similar paradigm
but replaced the tones of the priming sequence with a syllable sound in the
same voice as the target words.
4.4.2 Task designThe speech discrimination task from Experiment 3 was used here, with just
two rhythm conditions: duration beat and non-beat. The duration beat
condition was chosen as this was associated with musical beat ability in
Experiment 3, and the non-beat condition was designed as a control.
The duration beat sequences were adapted by substituting each of the
tones with a speech sound of the same duration. These sequences were
therefore rhythmically identical to those used in Experiment 3, but the
priming sounds and target words were acoustically similar (spoken by the
same talker). The intention was to discourage participants from completely
ignoring the priming sequences.
The non-beat sequences consisted of just two speech sounds, timed to
match the first and last beats of the duration beat sequence, with a long
gap in between. These sequences therefore offered participants the same
preparation time as the duration beat condition, but with no possibility that
a regular beat could be perceived.

110 CHAPTER 4: RHYTHMIC PRIMINGOFANTICIPATORYATTENTION TOTARGETS INNOISE
In order to reduce the overlap of target positions due to the length of the
speech targets, the target positions used here were further apart than those
used in Experiment 3.
4.4.3 Methods4.4.3.1 ParticipantsParticipants were recruited via posters placed around the Queen’s Medical
Centre and University of Nottingham campus. Fourteen native English
speakers (5 male), aged between 18 and 23 (mean age 19.4, standard
deviation 1.7 years) completed this experiment. They were naıve to the
purpose of the study and had not previously taken part in Experiment
2 nor 3. Participants were screened for normal hearing using pure tone
audiometry (≤20 dB HL across standard audiometric frequencies from
250 Hz to 8 kHz). Participants gave their informed consent prior to starting
the study and received an inconvenience allowance for their time.
4.4.3.2 StimuliThe speech task, target words and background noise were identical to those
used in Experiment 3. Instead of a pure tone, the sound used to create the
priming sequences was a 60 ms excerpt (including 10 ms cosine on/off
ramps) of the syllable “ba”, extracted from the same corpus as the target
words (i.e., recorded by the same speaker).
Two priming conditions were used: duration beat and non-beat. The
duration beat rhythms were identical to those used in Experiment 3; the
non-beat sequences consisted of the first and final (7th) beats only. The
inter-beat interval was jittered randomly within a range (570–630 ms), as
in the previous experiments.
4.4.3.3 Target positionsTargets occurred in five positions with equal probability. On-beat targets
were aligned with the eighth beat of the priming sequence, while early and
late targets were temporally displaced by either one-quarter or one-half of
the trial inter-beat interval.
4.4.3.4 Method of constant stimuliThe method of constant stimuli was used, with a constant noise level and
five possible SNRs for the target sound. Each participant completed 2 blocks

EXPERIMENT 4: PRIMINGWITH SPEECH SOUNDS 111
for each of the 2 priming conditions. Each block consisted of 150 trials (6
target words × 5 SNRs × 5 target positions). The five SNRs were fixed for
all participants: –12, –14, –16, –18, –20 dB SNR. The order of trials was
randomised within each block, and the target words were balanced across
all target positions and SNRs.
4.4.3.5 ProcedureTesting took place in a sound-proof booth in a single session. All auditory
stimuli were presented diotically using Sennheiser HD-25 headphones,
using Matlab v2008a (The MathWorks, Natick, MA).
Participants completed both blocks of the speech task for one priming
condition, and then both blocks for the other priming condition. The order
of priming conditions was counterbalanced across participants.
Prior to starting the first condition, participants completed five trials with
audible targets, then a practice block of 25 trials, in order to familiarise
themselves with the task, the target sound, and the sequence type. For
the second condition, participants just completed five practice trials to
demonstrate the priming sequence.
All tasks were self-paced in that the response triggered the start of the next
trial, and participants were not required to respond within a set time limit.
As in the previous experiments, participants were instructed that the tone
sequences were designed to prepare them for the next trial and were not
part of the task.
4.4.3.6 AnalysisPsychometric functions were fitted to the data as in the previous
experiments (see Section 2.4.3). The effects of rhythmic priming
on the threshold of the psychometric functions were analysed using
repeated-measures ANOVAs.
4.4.4 ResultsThe mean thresholds for the two priming conditions and five target
positions are shown in Figure 4.18. Repeated-measures ANOVAs revealed
no significant effects of target position on threshold for either condition
(Duration beat: F(4,52) = 1.45, p = .25, with Greenhouse-Geisser

112 CHAPTER 4: RHYTHMIC PRIMINGOFANTICIPATORYATTENTION TOTARGETS INNOISE
correction applied; Non-beat: F(4,52) = 1.49, p = .25, with
Greenhouse-Geisser correction applied).
Figure 4.18: The speech task results from Experiment 4, showing mean thresholds andstandard error bars for the five target positions; quadratic curves have been fitted for clarityalthough no significant effects were observed
Examination of each participant’s results suggested that there may
be individual differences in performance profiles. Figure 4.19 shows
individual results from six representative participants. A few participants
demonstrated the predicted pattern of results, while others showed a range
of different profiles. A greater sample size would be needed to examine
these different patterns and possible reasons for them. However, these
results demonstrate that individual differences should be taken into account
where possible, especially when the priming rhythm (duration beat) was
expected to produce a range of performance (linked to musical beat ability).

EXPERIMENT 4: PRIMINGWITH SPEECH SOUNDS 113
Figure 4.19: The speech task results from Experiment 4 for six participants
4.4.5 DiscussionIn Experiment 3, no significant effect of rhythmic priming was observed for
the speech discrimination task. It was proposed that any potential benefit
of temporal expectations may have been overshadowed by the participants’
reported selective attention to speech sounds.
Experiment 4 was designed to test this possibility by using speech sounds
within the priming rhythms. There was no significant benefit for on-beat
targets, meaning that rhythmic priming did not enhance speech perception
even when the priming and target sounds were acoustically similar.
Individual differences may have influenced the results – particularly as the
duration beat condition was deliberately chosen as it was predicted to be
associated with musical beat ability. However, the idea that participants
were ignoring the tone sequences in Experiment 3 does not seem to
sufficiently explain the findings.

114 CHAPTER 4: RHYTHMIC PRIMINGOFANTICIPATORYATTENTION TOTARGETS INNOISE
It is possible that rhythmic priming does not automatically enhance speech
perception, and that the benefit observed in Experiment 2 was purely
due to endogenous orienting of temporal attention. It is worth noting,
however, that there is evidence of rhythmic priming reducing reaction
times in phoneme detection tasks (Cason and Schon, 2012; Meltzer et al.,
1976; Quene et al., 2005). It may be that entraining to speech meter can
make speech processing more efficient, and in a continuous speech-in-noise
situation this would be beneficial. Such an enhancement would not have
been observed in the studies presented in this chapter as reaction times
were not collected and the stimuli were too short to see a benefit over time.
It is also likely that if rhythmic priming is used during speech perception,
then it would be driven by speech meter in a continuous manner (see
Section 1.5.2). Using a musical rhythm to prime a single monosyllabic
target would not be the best way of observing such a mechanism. The next
chapter will therefore investigate the effects of anticipatory attention on the
perception of target words within a sentence context.
4.5 SummaryThe aims of this chapter were to investigate whether priming with a regular
rhythm can enhance perception of targets in noise, and whether observed
benefits would be associated with musical beat ability.
Anticipatory attention driven by rhythmic priming sequences had a small
but significant benefit for the detection of a pure-tone target in white noise.
When the target occurred on or close to the next beat of the priming
sequence, detection thresholds were lower than for targets which occurred
far from this expected time-point.
When the beat of the rhythmic priming sequence was less salient and
therefore required some musical ability to perceive, the size of the
attentional benefit was associated with musical beat perception ability.
These results support the hypothesis that listeners with good beat
perception benefit from underlying rhythm which generates predictions
about when important parts of the signal will occur, and therefore benefit
from anticipatory attention. It remains to be seen whether predictions
based on speech meter can enhance speech perception in noise, and this
will be the focus of the next chapter.

CHAPTER5Rhythmic priming of attention duringspeech listening
When listening to speech in background noise, spatial location and voicecharacteristics can be used to orient attention to a target speaker. In otherwords, knowingwhere andwho the speaker is can enhance perception ofspeech in noise. This chapter explores the hypothesis that listeners alsobenefit from speech meter to orient temporal attention to the expectedoccurrence of a target, i.e.,when it will occur. Consideration is also given tothe development of rhythmic priming as a mechanism for enhancing speechperception in noise during childhood.
5.1 IntroductionThe experiments in Chapter 4 demonstrated that:
1. rhythmic priming can enhance perception of targets in noise
2. the magnitude of effect is associated with musical beat perception
when the priming rhythm contains an implicit rather than salient beat.
Experiment 5 was designed to investigate whether anticipatory attention
driven by speech meter can also enhance perceptual thresholds for speech
115

116 CHAPTER 5: RHYTHMIC PRIMINGOFATTENTIONDURING SPEECH LISTENING
in background noise. If this is the case, then temporally displaced targets
should not be perceived as well as those which occur at their natural point
in a sentence context.
An additional aim of Experiment 5 was to investigate whether children and
adults achieve similar benefits from rhythmic priming for speech in noise.
In Section 1.6.1, the development of speech perception in noise during
childhood was discussed in terms of the underlying skills and the various
cues that can aid perception. In summary, although children’s perception
of speech in noise is hindered by still developing sensory and cognitive
systems, they are able to take advantage of various cues. Children
benefit from spatial release from masking, modulation masking release, and
linguistic context. It remains to be seen whether they will also benefit from
rhythmic priming.
Musical beat perception has been observed in infants (Honing, 2012), so
rhythmic priming benefits might be observed for young children. On the
other hand, beat perception also develops with experience (Thompson
et al., 2015; Slater et al., 2013), so rhythmic priming benefits might
increase with age. In the latter case, it could be hypothesised that musical
beat training might speed development of speech perception in noise during
childhood by enhancing the benefit of priming attention via speech meter.
5.2 Experiment 55.2.1 AimsIt has been shown that listeners orient temporal attention to stressed
syllables and that this improves reaction times to phoneme targets when
listening to speech in quiet (Pitt and Samuel, 1990; Quene et al., 2005).
Experiment 5 was designed to investigate whether anticipatory attention
driven by speech meter can also enhance perceptual thresholds for speech
in background noise.
The second aim of Experiment 5 was to compare performance of children
and adults in order to explore the developmental trajectory of rhythmic
priming as a mechanism to aid speech listening in adverse conditions.

EXPERIMENT 5 117
5.2.2 Task design5.2.2.1 Speech stimuliAs discussed above, the beneficial effects of temporal orienting depend on
the predictions that can be made from the priming context. The greatest
effects have been observed when the preceding speech contains a clear
alternating stress pattern and temporal regularity (Pitt and Samuel, 1990;
Quene et al., 2005).
The aim of this chapter was to investigate rhythmic priming in a sentence
context, so the word lists used in previous studies would not have been
suitable. The Coordinate Response Measure (Bolia et al., 2000) was
identified as a good candidate for this study as the simple stimuli are
suitable for use with children (with numbers as the target words). In
addition, the carrier phrase (‘Ready Baron, go to red...’) is inherently
rhythmic and can be easily manipulated to increase the temporal regularity
of stressed syllables. The procedure for recording the stimuli in order to
enhance the rhythmic cues will be described below.
5.2.2.2 Estimating the perceptual thresholdsThe children were recruited as part of the annual Summer Scientist event at
the University of Nottingham, and the time available for testing each child
was limited. As discussed in Section 2.4.1, an adaptive procedure would
provide a relatively quick threshold estimate but this may not be reliable for
a speech task with targets that are not identical in terms of perceptibility.
Therefore, the method of constant stimuli was used again here, but with
four possible SNRs instead of five, in order to reduce the number of trials
needed. Suitable levels for each age group were identified during piloting.
The time constraints also influenced the choice to use just two target
positions: on-time and late (early targets would have overlapped with the
carrier phrase). It was predicted that thresholds for on-time targets would
be better than those for late targets.
5.2.2.3 Age-specific predictionsIn previous studies, group comparisons have revealed interesting results,
with 8 years appearing to a be a critical age in development (e.g, Bonino
et al., 2013; Nishi et al., 2010; Stuart, 2005, 2008). For example, Stuart
(2005, 2008) reported that speech perception in quiet reached adult levels

118 CHAPTER 5: RHYTHMIC PRIMINGOFATTENTIONDURING SPEECH LISTENING
by age 8, while speech perception in noise matured beyond age 11 years.
Other studies have reported that 8–10 year-old children perform similarly
to adults for some masker conditions, but for other maskers they perform
worse than adults but still better than 6–7 year-old children (Bonino et al.,
2013; Nishi et al., 2010). It was therefore decided to compare three age
groups: younger children (6–7 years), older children (8–11 years), and
adults (18–40 years).
It was predicted that speech thresholds would improve with age. Further,
it was predicted that all groups would benefit from rhythmic priming and
that the magnitude of the priming effect would increase with age.
5.2.3 Methods5.2.3.1 ParticipantsAdult participants were recruited via posters from the University of
Nottingham student population and the general public, and they received
an inconvenience allowance for taking part. All adult participants
were native English speakers with normal hearing, defined as pure-tone
audiometric thresholds of ≤20 dB HL across octave frequencies from
250 Hz to 8 kHz.
Children were recruited as part of an annual event run by the Department
of Psychology at the University of Nottingham. Children completed short
studies in return for tokens which could be spent on games and other
treats. The children’s hearing was not objectively assessed during this event,
but no hearing problems were reported by their parents on a background
questionnaire.
Children were split into two age groups: 6–7 and 8–11 years. Further
details for the three age groups are given in Table 5.1.
Table 5.1: Participant data for the three age groups in Experiment 5Age group n Mean age (s.d.)6 to 7 years 26 (13male) 6.98 (.50)8 to 11 years 41 (26male) 9.71 (.98)Adults (18–40) 20 (3male) 20.9 (5.1)

EXPERIMENT 5 119
5.2.3.2 StimuliThe speech stimuli were based on those used in the Coordinate Response
Measure (Bolia et al., 2000). Sentences of the form ‘Ready Baron, go to
red one now’ were recorded by a female speaker for target numbers one
through nine, excluding seven (as it is the only disyllabic number in the
range). The talker was instructed to speak the final three words as separate
units in order to avoid coarticulatory information either side of the target
number. The speaker listened to a metronome during recording to ensure
a consistent tempo (120 beats per minute) and to emphasise the regular
rhythm of the sentences. The word ‘now’ was spoken on beat 7, in order to
constrain the length and intonation of the target number (see Figure 5.1),
but this word was subsequently removed so that the target number was the
final word.
The recordings were equalised for root mean square level and then cut
to separate out the target number and remove the word ‘now’. Multiple
tokens were recorded for each target, but variability in the quality of the
recordings meant that for two targets there was only one usable token. It
was therefore decided to choose the single best recording for each target
number. The criteria for selecting tokens included clarity of speech, lack
of coarticulation and lack of other noise. Similarly, a single recording
of the carrier phrase (‘Ready Baron, go to red’) was chosen to act as the
prime. The selected recording was clearly spoken with the correct rhythmic
structure and a salient ‘beat’ of stressed syllables, in order to provide strong
cues for driving temporal attention.
On each trial, the prime was followed by one of the target numbers, which
occurred either at its original position (aligned with beat 6) or after a pause
of 350 ms (see Figure 5.1). The length of pause was chosen so as to create
a noticeable gap (no overlap of target positions) but also occur well before
the next beat in the sequence (which may also be attended).
Figure 5.1: Schematic diagram of the stimuli and task used in Experiment 5

120 CHAPTER 5: RHYTHMIC PRIMINGOFATTENTIONDURING SPEECH LISTENING
The noise masker was a steady speech-spectrum noise (ICRA, track 1;
Dreschler et al., 2001) and was present throughout each trial. As in
Chapter 4, a steady noise was used so that it did not contain any temporal
information that could distract from the task. The noise level was constant
at 60 dBA with the priming phrase presented at 0 dB SNR so that it was
clearly audible on every trial. The SNR of the targets was varied to obtain
a threshold estimate as described below.
5.2.3.3 ProcedureAll auditory stimuli were presented diotically through Sennheiser HD-25
headphones, using Matlab v2008a (The MathWorks, Natick, MA).
Participants used a touch screen monitor to indicate which number they
had heard from the eight options.
For the adult group, testing took place in a sound-proof booth. This facility
was not available for the child groups, but the level of background noise
incorporated into the task was sufficient to mask any external noise and
allow the children to focus on the task.
The method of constant stimuli was used with a constant noise level
(60 dBA) and four possible SNRs for the target. The levels for each group
were determined during piloting: for the children, targets were presented
at 0, –5, –10 and –15 dB SNR; for the adults, targets were presented at –5,
–10, –15 and –20 dB SNR.
At the start of the session, participants completed 5 familiarisation trials at
the highest SNR, followed by a practice block of 15 trials (5 trials at each of
the three remaining SNRs). All targets were on-beat during these practice
trials, and the data were not included in the analysis.
Participants then completed a single experimental block of 128 trials (8
target words × 4 SNRs × 2 target positions × 2 repetitions). The order of
trials was randomised and the target words were balanced across all target
positions and SNRs to average out any differences in perceptibility.
All tasks were self-paced in that the response triggered the start of the next
trial, and participants were not required to respond within a set time limit.
The task took about 15 minutes to complete, and the children were offered
a short break twice during the block.

EXPERIMENT 5 121
The task was presented to the children as a spy game, in which they needed
to decode secret messages. The instruction screen is shown in Figure 5.2.
Figure 5.2: Screenshot of the participant instructions for Experiment 5
5.2.3.4 AnalysisPsychometric functions were fitted to the data using the Palamedes toolbox
for Matlab (Kingdom and Prins, 2009).
Logistic curves were initially fitted to the data as in Chapter 4. However,
visual inspection of the graphs revealed some asymmetry in the data
which meant that the logistic function was not a good fit in this case. A
much better fit was obtained using Gumbel curves, with the minimum and
maximum values of the function defined to be the guess rate (0.125) and
an assumed lapse rate of 0.01, respectively. Gumbel curves were therefore
fitted to the data and estimates obtained for the speech reception threshold
and a measure of the slope of the function for each of the two target position
for each participant (see Equation 5.1).
f(x;α, β) = 1− exp(−10β(x−α)) (5.1)
The data for each age group were then inspected for outliers. Two children
from the 8–11 year-old group were excluded from further analysis as their

122 CHAPTER 5: RHYTHMIC PRIMINGOFATTENTIONDURING SPEECH LISTENING
thresholds were more than three standard deviations away from the group
mean. One of these children performed far worse than their peers, possibly
due to an underlying hearing problem or a lack of concentration during
the task. The other performed far better than the rest of their age group.
This child was the oldest in the group and this level of performance may
have been a true measure of ability. However, as the estimated threshold
fell outside the range of SNRs measured for the children, the threshold
estimate may not have been accurate for this participant.
The effect of rhythmic priming on the speech threshold was analysed using
a repeated-measures ANOVA with age group and target position entered as
factors.
5.2.4 ResultsThe mean thresholds for the three age groups and two target positions
are given in Table 5.2 and shown in Figure 5.3. As expected, thresholds
improved with age, and the ANOVA revealed that the main effect of
age group was significant (F(2,82) = 14.4, p < .001; η2 = .26).
Bonferroni-corrected pairwise comparisons were all significant (younger vs
older children p = .005; younger children vs adults p < .001; older children
vs adults p = .020).
As predicted, thresholds for on-time targets were better than those for late
targets. The main effect of target position was significant (F(1,82) = 81.1,
p < .001; η2 = .50).
There was also a significant interaction effect on threshold (F(2,82) = 3.94,
p = .023; η2 = .09). Inspection of Figure 5.3 revealed that the two
child groups showed similar amounts of benefit from priming while the
adult group showed a greater priming effect. This suggested that the
interaction was driven by differences between the older children and adults.
A follow-up ANOVA with just these two age groups was conducted to test
this observation. A significant interaction of age group and target position
did indeed occur between the older children and adults (F(1,57) = 7.84,
p = .007; η2 = .12). Improvement in threshold was greater for on-beat
targets than for late targets, suggesting further development of rhythmic
priming mechanisms beyond 11 years of age.

EXPERIMENT 5 123
Table 5.2: Means (and standard deviations) for the threshold parameter, α (dB SNR; seeEquation 5.1)
Age group On-time targets Late targets6 to 7 years –13.03 (1.74) –11.73 (1.75)8 to 11 years –14.27 (1.46) –12.98 (1.67)Adults –16.03 (1.72) –13.54 (2.24)
Figure 5.3:Means (and standard error bars) for the threshold parameter for each age groupand each target position
Table 5.3 shows the summary statistics for the three age groups. The benefit
of rhythmic priming was greater for adults than children, while the two
child groups produced similar results.
Table 5.3: Table showing summary statistics for Experiment 5Summary statistic 6 to 7
years8 to 11years
Adults
Mean slopea (% per dB SNR) 7.10 7.24 5.79Mean threshold benefitb (dB SNR) 1.31 1.29 2.50Equivalent performance benefitc (% correct) 8.24 9.60 15.06
a Averaged over both target positionsb Difference between on-beat and late thresholdscMean benefit multiplied bymean slope
To investigate whether the choice of age groups influenced the findings,
Pearson correlations were used to examine the relationships between

124 CHAPTER 5: RHYTHMIC PRIMINGOFATTENTIONDURING SPEECH LISTENING
age and threshold and between age and priming benefit for all of the
children combined (see Figure 5.4). While thresholds improved with
age as expected (r=–.40, p=.001), there was no correlation between age
and priming effect (r=–.08, p=.54). These results are in line with the
group comparisons, and suggest that while children as young as 6 years
old do benefit from rhythmic priming during speech listening, further
development of this mechanism occurs beyond 11 years of age.
Figure 5.4: Scatter graphs of the relationships between age and threshold and between ageand priming effect
5.3 DiscussionThe aims of this experiment were to investigate whether temporal attention
driven by speech meter enhances perception of speech in noise, and to
explore how this mechanism develops during childhood.
There was a significant effect of target position, with all age groups
achieving better thresholds for on-time targets than for late targets. This
suggests that the rhythmic information contained in the carrier phrase was
sufficient to orient temporal attention to the expected target position.
Although all age groups exhibited a priming effect, the benefit was greatest
for the adult group. Within the child groups, the priming benefit did not
increase with age, suggesting that – at least for the simple stimuli used
here – development of the rhythmic priming mechanism occurs outside of
the measured age range (6–11 years).

DISCUSSION 125
The results of the current study may not generalise to everyday speech
listening situations. The stimuli used here were manipulated to increase
the chances of observing rhythmic priming effects. A deliberate choice was
made to sacrifice ecological validity for this preliminary exploration of the
hypothesis.
Another consideration is that the carrier phrase used to orient attention
was identical on each trial. There is evidence that prior knowledge of the
rhythmic structure of a sentence can aid perception of a final target word.
When listeners hear a musical prime prior to a sentence with matching
rhythm, they are quicker to respond to a target phoneme (Cason et al.,
2015). Even reading a written carrier phrase (minus the final target word)
prior to hearing a sentence in noise enhances perception of the target word
(Freyman et al., 2004). In the current study, the prime was identical each
time, so the listeners knew both the rhythmic and semantic context of the
carrier phrase. It is therefore possible that temporal expectations were
built up over the course of the block rather than for each individual trial.
If this was the case, then the results would still support the hypothesis
that orienting temporal attention enhances speech perception in noise, but
further research would be needed to test if on-line temporal predictions are
formed when listening to novel speech.
Further studies are also needed to explore rhythmic priming driven by more
complex and more natural speech stimuli. For example, a follow-up study
could use multiple carrier phrases with different rhythmic structures, and
remove the manipulation to ensure isochrony. The use of a more complex
rhythm – in which a regular ‘beat’ is difficult to perceive – might also help
to highlight developmental differences that were not observable with the
simple isochrony used in the current study.


CHAPTER6Trainingmusical beat perception
Results from the preceding chapters suggest that targeting musical beatperception – particularly its role in orienting temporal attention – couldprovide an effective intervention for speech perception in noise. Thesefindings are used in the current chapter to guide the selection of a suitabletraining method. The effectiveness of the training programme is evaluatedfor older adults, as this group are often reported to have difficultiesunderstanding speech in background noise.
6.1 IntroductionThe ultimate goal of the current research is to evaluate a musical training
programme for improving speech perception in background noise. The
studies presented in the previous chapters explored the link between
musical ability and speech perception in noise, in order to inform the design
of an efficient, targeted training programme.
In Chapter 3, musical beat perception was identified as a key skill to target
for training. Beat perception is linked to the ability to form predictions
about the timing of future events. It was hypothesised that good beat
perceivers benefit from rhythmic priming which orients temporal attention
127

128 CHAPTER 6: TRAININGMUSICAL BEAT PERCEPTION
to important parts of an auditory signal. The experiments in Chapters 4
and 5 provided evidence in support of this hypothesis.
These findings will be considered below in the discussion of a suitable
training programme to target beat perception skills. However, suitability
also depends on the population to be trained. To assess whether musical
training could help those who struggle with speech perception in adverse
conditions, it was decided to target a population who are often reported to
struggle with this task – older adults (see Section 1.6.2).
6.1.1 Trainingmusical beat perceptionBeat perception is a fundamental human ability that has been observed in
infants (Honing, 2012), but it can also be improved via musical training
(Slater et al., 2013). For example, when listening to complex rhythms
– such as the duration beat sequences used in Experiment 4 – musicians
are more likely than nonmusicians to perceive the beat (Grahn and Rowe,
2009).
A key feature of beat perception is how it relates to movement. When
listening to music, people often spontaneously move along to the beat,
and regular auditory rhythms activate motor areas of the brain even in
the absence of movement (Grahn and Brett, 2007).
This cross-modal relationship works in both directions: movement also
influences auditory perception of the beat. When listening to ambiguous
rhythms, movement can influence which of two possible beat structures
is perceived (Phillips-Silver and Trainor, 2005, 2007). Tapping along to
the beat of a priming sequence also improves the accuracy of judgements
about whether subsequent events occur on the beat (Manning and Schutz,
2013), suggesting that moving to the beat aids the orienting of anticipatory
attention.
Movement also aids the process of searching for a beat in a rhythm
sequence with no salient accents, and this is especially true for
non-musicians (Su and Poppel, 2012). When asked to perform this task just
by listening, trained musicians were able to internally generate a beat, but
non-musicians found it difficult to establish a stable beat. When movement
was encouraged during the beat-finding phase, the two groups achieved
similar levels of performance (Su and Poppel, 2012).

INTRODUCTION 129
It appears to be the case that audio-motor synchronisation plays an
important part in musical training for beat perception, and after sufficient
training beat perception can be achieved without overt movement. This
is supported by the finding that musicians display greater connectivity
between auditory and motor areas of the brain during a beat-finding task
(Grahn and Rowe, 2009). It has also been shown that audio-motor musical
training leads to more robust changes in the auditory cortex compared to
auditory-only training (Lappe et al., 2008, 2011).
Together these findings emphasise the importance of using multimodal
training when targeting beat perception. Synchronising movements to
music will therefore play a key role in the training programme to be used
in this study.
The training programme must also be suitable for use with older adults, and
must achieve the levels of engagement and enjoyment that make musical
training an attractive prospect for therapeutic interventions (as discussed
in Chapter 1). With this goal in mind, established methods of musical
training were explored to see if a suitable candidate could be found. While
all approaches to teaching music include some element of beat training, one
method stood out due to its focus on experiencing rhythm and beat through
movement – Dalcroze Eurythmics.
6.1.1.1 Dalcroze EurhythmicsDeveloped by Emile Jaques-Dalcroze in the early 1900s, Dalcroze
Eurhythmics is a long established method of teaching musical concepts
through movement. This approach is practised worldwide, has been shown
to improve rhythmic abilities in children (Zachopoulou et al., 2003), and is
suitable for use with older adults (Trombetti et al., 2011).
Dalcroze lessons comprise a variety of individual, pair and group tasks.
Typical activities include: walking in time to improvised piano music and
responding to changes in tempo; clapping to one subdivision of the beat
while walking in time with another; throwing, bouncing or rolling balls in
time with the beat (Frego et al., 2004; Seitz, 2005). Many of the activities
are also cognitively demanding, requiring multitasking to continue the
ongoing movement while sustaining auditory attention in order to react
quickly to changes in the music or verbal instructions to switch between
two alternative movements (Kressig et al., 2005; Trombetti et al., 2011).

130 CHAPTER 6: TRAININGMUSICAL BEAT PERCEPTION
The cognitive aspect of the Dalcroze approach has been exploited to
investigate potential benefits for older adults. Declines in dual-task ability
in older adulthood can lead to an increased risk of falling, as it becomes
difficult to perform a concurrent task while walking (Kressig et al., 2005;
Trombetti et al., 2011). Older adults with a long history of practising
Dalcroze Eurythmics show less stride variability under dual-task conditions
than their peers (Kressig et al., 2005). Six months of weekly Dalcroze
classes led to improvements in gait variability under dual-task conditions
for a group of older adults compared to a control group, and the benefit
was still evident six months after training finished (Trombetti et al., 2011).
A secondary analysis of this study reported that the training group also
showed decreased anxiety and improved cognitive function compared to
the control group (Hars et al., 2013).
In summary, Dalcroze Eurythmics offers an established approach to
teaching musical skills that has been used successfully with older adults.
The approach places a great emphasis on audio-motor synchronisation
which was identified above as a key requirement for training beat
perception. The wide variety of possible activities and the social aspect
of including pair and group work should also satisfy the requirement for an
enjoyable musical training programme.
Having identified Dalcroze Eurythmics as a potential training technique
for this study, the next step was to consult a qualified Dalcroze teacher
– who has experience working with older adults – to aid with the design
and delivery of the training programme. She confirmed that Dalcroze
techniques were indeed appropriate for the intended purpose of the
training, and that activities could be adapted to specifically target beat
perception skills.
6.2 Experiment 66.2.1 AimsThe aim of Experiment 6 was to evaluate the impact of short-term musical
beat training on speech perception in noise for a group of older adults.

EXPERIMENT 6 131
6.2.2 Methods6.2.2.1 ParticipantsNine native English speakers (2 male; age range 51–75, mean age 67.0,
standard deviation 10.1 years) completed the study. They were recruited
via posters and word of mouth from the general public and they received
an inconvenience allowance for taking part.
Two further participants were initially recruited but had to withdraw due
to personal reasons prior to the start of the training programme. All nine
participants who began the training programme went on to complete the
study.
The Montreal Cognitive Assessment (MoCA; Nasreddine et al., 2005) was
used to screen for mild cognitive impairment. All participants scored at
least 26 out of 30, indicating normal cognitive function (Nasreddine et al.,
2005).
It was a requirement that participants should not use hearing aids, but other
than this no selection was made on the basis of hearing ability. Audiometric
data for all participants are shown in Figure 6.1. Normal hearing is usually
considered to be anything up to 20 dB hearing loss. The figure shows that
this group of participants had good hearing, despite their age, with some
mild hearing loss evident for a few participants in addition to the high
frequency (8 kHz) loss that is very common in this age group.
Figure 6.1: Audiometric data for all participants; the bold line indicates themean

132 CHAPTER 6: TRAININGMUSICAL BEAT PERCEPTION
6.2.2.2 ProtocolThe study protocol included a control period prior to training so that
participants would act as their own controls. The protocol is shown in
Figure 6.2. Participants were tested four times: a comprehensive baseline
assessment was completed at T0, and a shorter battery was completed on
three subsequent occasions (T1, T2 and T3).
Figure 6.2: Training study protocol used in Experiment 6
6.2.2.3 Testing proceduresAll testing took place in a sound-attenuated booth, and auditory stimuli
were presented diotically through Sennheiser HD-25 headphones. The
order of the initial baseline test battery is shown in Table 6.1 and the
shorter battery used in subsequent testing is given in Table 6.2. Details
of the individual test procedures are given below.
Table 6.1: Test battery for baseline assessmentTask Approximate duration (minutes)
1 Questionnaires 102 Audiometry 103 Cognitive assessment (MoCA) 104 Speech in noise: Practice 105 Speech in noise: Steadymasker 156 IQ:WASI vocabulary subtest 10
Break 157 Speech in noise: Modulatedmasker 158 IQ:WASI matrix reasoning subtest 109 Beat perception 15
Total = 120

EXPERIMENT 6 133
Table 6.2: Test battery for subsequent assessmentsTask Approximate duration (minutes)
1 Speech in noise: Steadymasker 152 Beat perception 153 Speech in noise: Modulatedmasker 15
Total = 45
QuestionnairesParticipants completed a background questionnaire which elicited
information about their current levels of physical and musical activity, as
well as any difficulties they experience with their hearing, e.g. listening to
speech in noisy environments. Participants were asked to keep a diary of
any musical activity throughout the study, and were instructed to continue
with their normal routines throughout the control and retention periods.
The training subscale of the Goldsmiths’ Musical Sophistication Index
(Mullensiefen et al., 2011) was used as a measure of musical experience.
The subscale consists of 9 questions which encompass both formal
instrument training and informal musical experience (see Figure 2.1).
Cognitive testsAs mentioned above, the Montreal Cognitive Assessment (Nasreddine et al.,
2005) was used to screen for mild cognitive impairment.
In addition, the vocabulary and matrix reasoning subtests of the Weschler
Abbreviated Intelligence Scale (WASI; Wechsler, 1999) were used to obtain
a measure of IQ.
Speech-in-noise perceptionThe UK Matrix Sentence Test (HorTech gGmbH, Oldenburg, Germany) was
used to determine the speech reception threshold (SRT; the signal-to-noise
ratio (SNR) that equated to 50% intelligibility). See Section 2.3.1.1 and
Figure 2.2 for details of the stimuli and Section 3.2.2.2 for the procedure.
Two maskers were used: an unmodulated speech-spectrum noise (supplied
with the test) and a sinusoidally amplitude-modulated version of the
original noise (modulation frequency of 8 Hz; modulation depth of 80%).
The noise signals were matched in overall intensity (root-mean-square
level). Both of these maskers were found to have good sensitivity and
reliability with the matrix test (see Section 3.2.2.3) which make them
suitable for studying training effects.

134 CHAPTER 6: TRAININGMUSICAL BEAT PERCEPTION
At the start of the baseline testing session, participants completed a practice
list with each masker to familiarise them with the stimuli and procedure
and to allow for the substantial learning that usually takes place on first
attempting the test (see Section 2.3.1.1). The results from these practice
lists were not included in the analysis.
For each masker, participants completed a block of three test lists, which
were used to obtain an average threshold.
Musical beat perceptionThe auditory-only subsection of the Beat Alignment Test (Iversen and Patel,
2008) was used to measure musical beat perception. See Section 3.2.2.2 for
details of the stimuli and procedure. In addition to being asked to make a
beat judgement for each excerpt, listeners were asked to rate how confident
they were about their answer on a scale from 0 (guess) to 2 (certain). This
was a feature of the original test (Iversen and Patel, 2008) and is included
here as a second measure of beat ability since the sensitivity of the Beat
Alignment Test to training effects is unknown. In addition, some of the
young adults in Experiment 1 scored maximum marks on the test. If the
same were to happen here, then there would certainly be no room for
measurable training effects.
6.2.2.4 Training programmeThe training programme ran for four weeks. Each week the whole group
of participants attended a 2-hour workshop, led by a highly experienced
Dalcroze teacher. The workshops took place in a large hall equipped
with a piano. Activities focused on moving to the beat while the teacher
improvised music on the piano. Participants were required to listen
carefully and change their movements in response to changes in tempo
or structure of the music or to predefined verbal instructions. Individual,
pair and group tasks were included, and props such as balls were used for
some exercises. For example, in one activity, participants had to bounce a
ball in time with the music, but when the rhythmic pattern changed from
a waltz to a march they had to switch to throwing the ball in time with the
new beat, and vice versa.
Each workshop was recorded, and videos were provided to the participants
so that they could practise a selection of the activities at home during the
following week. Participants were asked to consolidate their learning by

EXPERIMENT 6 135
practising the homework activities (approximately 30 minutes) on three
different days during the week. The videos were also used on the rare
occasions when a participant had to miss a class through illness. In
that case, the participant was asked to work through the whole of the
class at home on their own, and then to practise the activities as normal.
Participants were provided with a tennis ball for use during the homework
activities.
One disadvantage of the training programme is that it was not possible
to obtain objective measures for each participant’s improvement on the
trained tasks. The teacher’s subjective assessment was that the group
definitely improved throughout the four weeks. In place of a quantifiable
measure of improvement on the trained tasks, the beat perception scores
were used as proxy measures.
6.2.2.5 AnalysisA general note is required about the analysis used in this study. With only 9
participants, the analysis was underpowered. No corrections have been
applied for multiple comparisons, and caution should be applied when
interpreting the results. Limitations of the study and the analysis will be
discussed below.
6.2.3 Results6.2.3.1 Baseline assessment: time T0The mean speech perception thresholds are shown in Figure 6.3 and in
Table 6.3. The data from the young adults from Experiment 1 have been
included for comparison. The figure shows that the older adults needed
more favourable SNRs to achieve the same level of performance as the
young adults. The older adults did benefit from modulation masking
release, but to a lesser extent than the young adults who participated in
Experiment 1. All group comparisons were significant (see Table 6.3).

136 CHAPTER 6: TRAININGMUSICAL BEAT PERCEPTION
Figure 6.3: Means (and standard errors) for the baseline speech perception in noisemeasures, with the Experiment 1 data from young adults included for comparison
Table 6.3: Means (and standard deviations) for the baseline speech perception in noisemeasures, with the Experiment 1 data from young adults included for comparison
Older adults Young adults Independentt-test
SRT in steady noise (dB SNR) –9.8 (.71) –10.6 (.73) t(30) = 2.9,p = .007
SRT inmodulated noise (dB SNR) –13.8 (1.4) –15.7 (1.2) t(30) = 3.8,p = .001
Masking release (dB SNR) –4.0 (1.0) –5.1 (.70) t(30) = 3.3,p = .003
Examination of scatter plots revealed that hearing ability (defined as the
better-ear pure-tone average hearing loss) was correlated with the speech
perception measures (see Figure 6.4). The Pearson correlation coefficients
are given in Table 6.4. No other factors appeared to be associated with
speech perception in noise at baseline. This is keeping with previous
research that suggests that hearing ability is the primary predictor of speech
perception in noise (Akeroyd, 2008).

EXPERIMENT 6 137
Figure 6.4: Scatter plots showing the relationships between hearing ability (measured in dBhearing loss (HL)) and speech reception thresholds (SRT) at baseline assessment; greaterhearing loss was associated with worse speech thresholds and less masking release
Table 6.4: Pearson correlation coefficients for the relationships between hearing ability andspeech perception in noisemeasures at baseline assessment
Steady Modulated ReleasePTA better ear .52 .82** .79***p<.05, **p<.01 (all one-tailed)
6.2.3.2 Control period: T0 to T1The period following baseline assessment and prior to training was
intended to act as a control period. No changes in SRTs were expected
to occur during this time. The data in Figure 6.5 and Table 6.5 indicate
that this was not entirely the case. While the SRT in steady noise
remained stable, the SRT in modulated noise improved and there was a
corresponding increase in masking release.
Figure 6.5: Means (and standard errors) for the changes in speech reception thresholds(SRT) during the control period (from baseline at time T0 to time T1)

138 CHAPTER 6: TRAININGMUSICAL BEAT PERCEPTION
Table 6.5: Changes in themeans (and standard deviations) of the key variables during thecontrol period: from time T0 to time T1
T0 T1 Pairedt-test
SRT in steady noise (dB SNR) –9.8 (.71) –9.8 (.94) t(8) = –.09,p = .93
SRT inmodulated noise (dB SNR) –13.8 (1.4) –14.6 (1.2) t(8) = –3.6,p = .007
Masking release (dB SNR) –4.0 (1.0) –4.8 (.91) t(8) = –3.6,p = .007
Beat perception (out of 36) 30.0 (5.0) 30.6 (4.2) t(8) = .43,p = .68
Beat confidence (scale 0 to 2) 1.46 (.44) 1.37 (.39) t(8) = –.91,p = .39
The improvement for speech in modulated noise was unexpected given the
previous finding that this test had good test-retest reliability on repeated
measures (see Section 3.2.2.3). Previous investigations of the matrix test
suggest that, although learning does initially occur as participants become
familiar with the stimuli, with the procedure used here the threshold
should stabilise after a couple of practice lists (Hewitt, 2008). Participants
completed four lists in the baseline session, so further learning was not
expected to occur. The findings with the matrix test were not verified
across multiple sessions, but another study using sentences in noise showed
that there were no learning effects across five sessions for either steady or
modulated noise (Stuart and Butler, 2014).
These findings do not preclude the possibility that the particular
participants in this study did improve from one session to the next. Perhaps
the gap between sessions gave them time to consider strategies for the test.
However, there is another possible explanation which is worth considering.
In designing the test battery, it was desirable to alternate between different
types of task in order to stave off boredom and tiredness during the long
baseline assessment. For the subsequent testing sessions, a similar approach
was employed but, with only three tasks to do, this meant completing the
beat perception test directly before the speech test in modulated noise,
whereas previously it had been done at the end.
It is possible that focusing on musical beat perception for 15 minutes
prior to completing the speech task could have improved performance

EXPERIMENT 6 139
on the task, via temporarily strengthened temporal orienting. This idea
is supported by examination of Figure 6.6. At the baseline assessment
(T0), there was no discernible relationship between beat perception and
masking release. However, at time T1, when the modulated noise condition
had a proposed boost related to beat perception, the amount of masking
release (which is the difference between the ‘boosted’ modulated SRT and
the ‘unboosted’ steady SRT) was strongly correlated with beat perception
(r = –.85, p = .002). In fact, beat perception and hearing ability together
explained 95% of the variance in masking release (see Table 6.6).
Figure 6.6: Scatter plots of beat perception andmasking release at time T0 and time T1
Table 6.6: Linear regressionmodel for masking releaseOutcomemeasure andmodel Predictors β pMasking release Hearing ability .52 .001R2 = .95, F(2,6) = 76.1, p< .001 Beat perception –.68 <.001
The finding that prior exposure and attention to a beat perception task
could enhance subsequent speech perception in noise is a valuable result
in its own right and will be discussed further in Chapter 7. However, for
the purposes of the current study, it means that the baseline measure of
SRT in modulated noise (and masking release) cannot reliably be used
in comparison with subsequent measures, and there is therefore no true
control period for these outcomes.

140 CHAPTER 6: TRAININGMUSICAL BEAT PERCEPTION
6.2.3.3 Training period: T1 to T2Changes in the key variables over the training period are displayed in Figure
6.7 and Table 6.7. The most promising result is the SRT in modulated
noise which was significantly improved at the post-test (T2) compared
to the pre-test (T1): t(8) = 1.97, p = .043, effect size r = .57. The
mean improvement was 0.53 dB, which is equivalent to an increase in
intelligibility of about 6% (based on the reference slope data for the matrix
sentence test (Hewitt, 2008)).
Figure 6.7:Means (and standard errors) for the changes in speech perception thresholdsduring the training period (from pre-test at time T1 to post-test at time T2)
Table 6.7: Changes in themeans (and standard deviations) of the key variables during thetraining period: from time T1 to time T2; all p-values are one-tailed since all variables wereexpected to improve during training
T1 T2 Pairedt-test
SRT in steady noise (dB SNR) –9.8 (.94) –9.9 (.86) t(8) = –.83,p = .22
SRT inmodulated noise (dB SNR) –14.6 (1.2) –15.2 (1.7) t(8) = –2.0,p = .043
Masking release (dB SNR) –4.8 (.91) –5.2 (1.1) t(8) = –1.4,p = .11
Beat perception (out of 36) 30.6 (4.2) 31.2 (4.4) t(8) = 1.2,p = .14
Beat confidence (scale 0 to 2) 1.37 (.39) 1.48 (.42) t(8) = .95,p = .19
As discussed in Section 6.2.2.4, there were no objective measurements for
improvement on the trained tasks. The beat measures (total score and
confidence rating) were used as proxy measures, as the intention of the

EXPERIMENT 6 141
training was to improve beat perception. Neither of the beat scores showed
significant improvement over the training period, although both show a
small trend in the expected direction.
To investigate how changes in the speech measures might be linked to
training, relationships between the outcome measures (SRTs in steady and
modulated noise) and the skills targeted during training (beat perception
and beat confidence) were explored (see Figure 6.8 and Table 6.8). The
pattern of results for masking release was very similar to that for SRT in
modulated noise, so masking release has not been included here.
Figure 6.8: Scatter plots showing the relationships between outcomemeasures (SRTs) andtrained skills (beat score and confidence rating)
Table 6.8: Pearson correlation coefficients for the relationships between outcomemeasuresand trained skills
Change in steady SRT Change inmodulated SRTChange in beat score –.66* .05Change in beat confidence –.65* –.65**p<.05, **p<.01; all one-tailed
Changes in outcome measures appear to be linked to changes in trained
skills. An issue with relying on improvements in the beat perception score

142 CHAPTER 6: TRAININGMUSICAL BEAT PERCEPTION
is that some participants scored highly at the baseline assessment and
consequently did not have much room for improvement. This variable is
therefore subject to ceiling effects and is not normally distributed. As a
precaution, Spearman correlations were also checked and the pattern of
results was identical.
The beat confidence rating was included for exactly this reason – as an
alternative measure of whether training was enhancing some measure of
beat perception. The fact that improvements in this measure are associated
with improvements in SRTs is encouraging.
Finally, associations between changes in SRTs and baseline performance
were investigated (see Figure 6.9 and Table 6.9). The baseline (T0)
measures were used instead of the pre-test (T1) measures to avoid the
confound of correlating (T2 – T1) with T1. For speech in modulated noise,
improvements in SRT were correlated with baseline performance for speech
in steady noise and for the beat perception test.
The worse the baseline measure of beat perception, the greater the
improvement for speech perception in modulated noise. If the improvement
in SRT is indeed mediated by training-related improvements in beat
perception (as suggested by the increase in beat confidence), then this
finding fits with the perceptual learning literature. It is commonly reported
that the magnitude of training improvement is inversely proportional to
the baseline performance, i.e., the worse the initial performance, the more
room for improvement and the faster the learning (e.g., Astle et al., 2013;
Fahle and Henke-Fahle, 1996). On this premise, poor initial beat perception
could have led to greater training improvement for beat perception, which
may then have transferred to speech perception in modulated noise as
hypothesised.
Conversely, the better the baseline measure of SRT in steady noise, the
greater the improvement for SRT in modulated noise. This appears to
disagree with findings from perceptual learning, although the two speech
tasks do not measure exactly the same skills. Speech perception in steady
noise is mainly a task of perceptually separating the speech from the
background, whereas listening in modulated noise additionally engages
other factors such as working memory to listen in the dips (see Section
1.4.2). The skills required for speech perception in steady noise could
be considered as a subset of the skills needed for speech perception in

EXPERIMENT 6 143
modulated noise. Perhaps, then, a certain level of performance in steady
noise is required in order for training benefits to be observed for the more
complex modulated noise condition.
Baseline SRT in steady noise and training improvement in beat confidence
account for 88% of the improvement for SRT in modulated noise (see Table
6.10).
Figure 6.9: Scatter plots showing the relationship between changes in thresholds during thetraining period and baseline performance
Table 6.9: Pearson correlation coefficients for the relationships between training-relatedchanges
Change in steady SRT Change inmodulated SRTBaseline steady SRT –.17 .79**Baselinemodulated SRT –.49 .33Baseline beat score .01 .66**p<.05, **p<.01; all one-tailed
Table 6.10: Regressionmodel for the improvement in speech perception in modulated noiseOutcomemeasure andmodel Predictors β pChange inmodulated SRT Baseline steady SRT .71 .001R2=.88, F(2,6)=30.6, p = .001 Change in beat confidence –.54 .005

144 CHAPTER 6: TRAININGMUSICAL BEAT PERCEPTION
6.2.3.4 Retention period: T2 to T3Changes during the post-training retention period are given in Figure 6.10
and Table 6.11. Although the changes are not statistically significant, there
are some interesting patterns. Masking release and SRT in modulated noise
(which had shown improvement during training) show a declining trend,
as do the beat measures (although training improvements in these were
small and non-significant). This is what might be expected if the training
programme was insufficient to cause lasting changes, i.e., improvements
have not been retained. Although this could be interpreted as a negative
result, since retention is an important part of any training, it also suggests
that the improvements in these outcomes were in fact due to training. If
that is the case, then perhaps a longer training programme could lead to
lasting improvements.
On the other hand, SRT in steady noise continued on a trend towards
improvement, possible indicative of delayed transfer of training to this skill.
Although this improvement did not reach significance, when the overall
change (from time T1 to T3) in SRT for steady noise is considered, the
result is a significant improvement (t(8) = 2.0, p = .043). The mean
improvement was 0.37 dB SNR, which is equivalent to a performance
benefit of about 4%.
Table 6.11: Changes in themeans (and standard deviations) of the key variables during theretention period: from time T2 to time T3
T2 T3 Pairedt-test
SRT in steady noise (dB SNR) –9.9 (.86) –10.2 (.75) t(8) = –1.8,p = .11
SRT inmodulated noise (dB SNR) –15.2 (1.7) –14.9 (1.5) t(8) = 1.5,p = .18
Masking release (dB SNR) –5.2 (1.1) –4.7 (1.0) t(8) = 2.3,p = .051
Beat perception (out of 36) 31.2 (4.4) 30.1 (4.1) t(8) = –1.0,p = .35
Beat confidence (scale 0 to 2) 1.48 (.42) 1.39 (.40) t(8) = –2.2,p = .063

EXPERIMENT 6 145
Figure 6.10:Means (and standard errors) of the changes in speech perception thresholdsduring the retention period (from T2 to T3)
6.2.3.5 Summary: T0 to T3The speech perception in noise data for this study are summarised in
Figures 6.11 and 6.12.
Figure6.11:Means (and standard errors) formeasures of the SRT in steadynoise throughoutthe study; training was administered between T1 and T2
For speech in steady noise, there was no change during the control period
(T0 to T1) as expected. During and after the training programme, there was
a trend towards improving SRT in steady noise. The greatest improvement
for SRT in steady noise was between T1 and T3. This improvement was
significant and was equal to 0.37 dB SNR. Comparison of the change in

146 CHAPTER 6: TRAININGMUSICAL BEAT PERCEPTION
SRT for steady noise over this time period compared to the control period
did not reach significance (t(8) = 1.0, p = .16).
Figure 6.12: Means (and standard errors) for measures of the SRT in modulated noisethroughout the study; training was administered between T1 and T2
For speech in modulated noise, there was significant improvement during
what was intended to be the control period. As discussed above, this may
have been due to the different testing order used at each time point rather
than a true reflection of change in performance. There was a significant
improvement in SRT for modulated noise during the training period (equal
to 0.53 dB SNR), but performance declined during the retention period.
Due to the issue with the control period and the general lack of power in this
study, a final analysis was performed to examine individual improvements
based on a confidence interval approach. Using the pre-test data from
time T1, the intra-individual standard deviation for the two SRTs was
derived from the one-way ANOVA (with subject as the factor): root mean
square error divided by√
3 (as an average of three values was used). The
intra-individual standard deviations were 0.33 and 0.49 for SRT in steady
and modulated noise respectively. These values were used to create 95%
confidence intervals (±1.96×s.d.) around each participant’s pre-test SRTs
at time T1. These confidence intervals are displayed in Figures 6.13 and
6.14. In each figure, the solid line represents identical scores at both time
points, and the dotted lines are the confidence intervals: a data point lying

EXPERIMENT 6 147
below the bottom dotted line indicates significant improvement for that
participant.
Figure 6.13: Scatter plot of individual SRTs in steady noisemeasured pre-training (time T1)and at the follow-up test (time T3); the solid line represents identical scores, while the dottedlines represent confidence intervals; points below the bottom dotted line indicate significantimprovement
Figure 6.14: Scatter plot of individual SRTs inmodulate noisemeasured pre-training (timeT1) and post-training (time T2); the solid line represents identical scores, while the dottedlines represent confidence intervals; points below the bottom dotted line indicate significantimprovement

148 CHAPTER 6: TRAININGMUSICAL BEAT PERCEPTION
Based on the confidence interval approach, four participants displayed
significant improvement for speech perception in steady noise (from T1 to
T3) and three participants displayed significant improvement for speech
perception in modulated noise (from T1 to T2). The current data is
insufficient to explain why these particular individuals might have been
predisposed to benefit from the training, or if others would benefit given
more time. However, for some individuals it is possible to offer an
explanation. For example, one participant who showed no benefits of
training had in fact been a dancer throughout her life, and had therefore
no doubt had copious prior experience moving to the beat of music.
6.3 DiscussionExperiment 6 aimed to evaluate a musical beat training programme
in terms of its impact on speech perception in noise for older adults.
Overall, the results are promising, but caution should be exercised when
interpreting these results as the study had considerable limitations. The
small sample size, lack of an active control, and lack of measurable
outcomes of the trained activities should all be taken into account. Further
studies will be needed to confirm the findings reported here.
The Dalcroze workshops were successful in creating an engaging musical
atmosphere, and all participants who started the training went on to
complete the study. Feedback from the participants confirmed that they
enjoyed the workshops, and particularly liked the social aspect of coming
together once a week to share the experience. The homework activities
were not so successful, perhaps because it was not possible to recreate
the enjoyable social atmosphere at home. Participants did their best to
complete the activities, and record these on their diary sheets, but feedback
suggested that they did not enjoy this part of the training as much. The
homework activities were included in an attempt to make the training quite
intensive over a short period. Future studies should consider using either
more frequent workshops or a longer training period or both, to explore the
timeframe of any improvements.
In terms of speech perception in noise, there were modest significant
improvements in threshold for modulated noise immediately after training
and for steady noise after a prolonged period. However, the lack of an
active control (or indeed any reliable control for the modulated noise

DISCUSSION 149
condition) means that caution should be exercised when interpreting these
results. Further research is needed to investigate the timecourse of any
improvements and to see if a longer training programme will lead to lasting
benefits, and whether the size of improvement would be meaningful to a
patient (McShefferty et al., 2016).
Dalcroze methods place demands on auditory, motor and cognitive systems.
The aim of this study was to target beat perception to see if this would
transfer to speech in noise perception. However, it is also possible that any
observed benefits were due to cognitive improvements brought about by the
multitask practice included in the training. The fact that improvements in
speech thresholds were associated with improvements in beat confidence
suggests that beat perception does play a part. Future studies should
incorporate additional measures of cognitive function and beat perception.
These should be sensitive to training improvements with no ceiling effect
in order to elucidate the likely nature of transfer.
Further work is also needed to explore the effect of individual differences
on potential benefits of training. It is not necessarily the case that one
training regimen will work for every individual. Some factors to consider
include: musical experience, dance experience, personality and personal
preference (i.e., do they like music?).
An accidental discovery in this study also indicates further new avenues
for research. Results from the control period suggest that performing the
beat perception test prior to the speech test (in modulated noise) may have
primed the mechnism by which attention is oriented in line with temporal
predictions and therefore improved the speech reception threshold. This
possibility will be discussed in more detail in Chapter 7.


CHAPTER7General discussion
The ultimate goal of the research presented in this thesis was to investigatewhether short-term musical training could improve speech perception inbackground noise. This goal was broken down into three separate researchquestions which were investigated in turn. This chapter presents a summaryand discussion of the main findings and limitations of the current research,and proposes possible directions for future research.
7.1 Question 1: Are specific musical skills associated withspeech perception in noise?
In Chapter 3, a correlational design was used to explore the relationships
between musical skills and speech perception in noise. To avoid the
confounds associated with testing highly trained musicians, this study
recruited a sample from the general population, who therefore had a range
of musical backgrounds. The analysis revealed that musical beat perception
was strongly associated with all of the speech perception measures, even
when controlling for potentially confounding factors (working memory and
frequency discrimination).
151

152 CHAPTER 7: GENERALDISCUSSION
Beat perception was therefore identified as a possible link between musical
training and speech perception in noise and became the focus of subsequent
research presented in this thesis.
7.1.1 Whymightmusical beat training transfer to speech perception?The issue of how beat perception might contribute to speech perception
in noise was the second topic of investigation in this thesis and will be
discussed below. This section considers the question of why transfer may
occur, with reference to the proposals introduced in Section 1.1.3.
7.1.1.1 Common processingIf the same skill is used in both music and speech perception, then it follows
that improving this skill in one domain should improve it in the other
(Besson et al., 2011). This begs the question: is beat perception used in
speech perception as it is in music?
While music contains an isochronous beat around which rhythms are based,
regularity in speech is created by the metric structure of stressed and
unstressed syllables. So the ‘beat’ in speech refers to the quasi-regular
pattern of stressed syllables.
Musical beat perception can be demonstrated by synchronising movements
with the beat; for example, by dancing, clapping along with a musical
performance, or – more commonly in laboratory settings – tapping a finger
(e.g., Drake et al., 2000). Lidji et al. (2011) found that listeners can entrain
finger taps to speech meter in a similar way, suggesting a shared process
between music and speech.
It has also been shown that musicians are more sensitive to speech meter
(Marie et al., 2011), which adds further support for the idea of a link
between beat processing in music and speech.
7.1.1.2 Working memory as a mediating factorKraus et al. (2012) proposed that working memory is the key factor in the
transferral of learning from music to speech.
In Experiment 1, performance on the Beat Alignment Test was linked with
digit span scores. This could be a consequence of the task design which
requires beat predictions to be held and updated in working memory ready
to be compared to the timing of superimposed beeps. In fact, partial

QUESTION 1: ARE SPECIFICMUSICAL SKILLS ASSOCIATEDWITH SPEECHPERCEPTION INNOISE? 153
correlations between beat perception and speech reception thresholds
remained strong even when controlling for working memory. These
findings suggest that working memory was not involved in mediating the
observed link between beat perception and speech perception in noise.
Listening to music often results in spontaneous movement to the beat,
suggesting that beat perception happens automatically and without
cognitive effort. The current hypothesis that beat perception provides a link
between musical training and speech perception in noise is not, therefore,
compatible with the working memory proposal put forward by Kraus et al.
(2012).
7.1.1.3 The OPERA hypothesisThe OPERA hypothesis (Patel, 2014) suggests that musical training can
enhance speech perception via any sensory or cognitive process that is
common to both domains, as long as certain conditions are met. Namely
that the brain networks for speech and music processing overlap, that music
places greater demands on the process than does speech, and that music
engages the process with emotion, repetition and attention.
Overlap – Musical beat perception is known to recruit motor areas of
the brain, including the basal ganglia (Grahn and Brett, 2007; Grahn
and Rowe, 2012). Patients with Parkinson’s disease – which affects
the basal ganglia – display deficits in beat-based musical rhythm
perception (Grahn and Brett, 2009) as well as in the processing of
speech rate (Breitenstein et al., 2001). Furthermore, patients with
lesions in the basal ganglia have impaired speech meter perception
(Kotz and Schmidt-Kassow, 2015). Together these findings suggest
that the basal ganglia could be part of an overlapping network for beat
processing in music and speech, thereby satisfying the first criterion.
Precision – Regular meter is useful for speech perception, but beat
perception is crucial for successful musical performance. An audience
is unlikely to appreciate musicians who cannot play in time with
each other. Synchronisation of playing in time with music must be
preceded by precise perception of the beat. It is logical therefore that
musical training would demand a higher precision of beat processing
than is required for everyday speech perception.

154 CHAPTER 7: GENERALDISCUSSION
Emotion – Moving to a beat is a key part of enjoyable social activities
such as music-making and dancing. It is easy to imagine that
practising synchronising with music, particularly if it also involves
entraining movements with other people, could elicit the positive
emotion necessary for this criterion to be fulfilled.
Repetition – Musical beat training will inevitably involve repeated
practise of entraining to a beat.
Attention – In the previous section, it was noted that beat perception
happens spontaneously and without cognitive control. While it is not
necessary to orient attention towards the temporal structure of music
in order to perceive a beat, it is possible to focus attention on the
beat and this will be necessary in order to improve synchronisation
abilities during training.
In conclusion, with an appropriately designed programme, training in
musical beat perception could satisfy all of the criteria of the OPERA
hypothesis. This supports the idea that training in musical beat perception
could result in transfer of learning to speech perception.
7.1.2 Consideration of othermusical skillsThe aim of Experiment 1 was to identfy musical skills which are associated
with speech perception in noise. Musical beat perception appears to be one
such skill, but it is not necessarily the only one. Further work in this area
might consider other musical skills which were not tested here, or indeed
different tests for melody and rhythm perception.
The Musical Ear Test uses a same/different paradigm which is common
amongst musical aptitude tests (e.g., Gordon’s Advanced Measures of
Musical Audiation – AMMA; GIA Publications, Inc., Chicago, IL, USA). This
design is by its nature heavily dependent on working memory. Memory
for melodies and memory for rhythms are no doubt important skills for
musicianship, but in Experiment 1 the working memory confound made
it unclear whether rhythm skills are linked to speech perception in noise
or if the observed correlation was purely due to working memory. This
could be addressed by using alternative measures for melody and rhythm
perception which require a perceptual judgement of a sequence rather than
a same/different comparison. For example, categorising pitch contours, as
these are important for speech perception (Miller et al., 2010).

QUESTION 1: ARE SPECIFICMUSICAL SKILLS ASSOCIATEDWITH SPEECHPERCEPTION INNOISE? 155
There are other aspects of musical ability that were not considered for
Experiment 1, but which could potentially be linked to speech perception
in noise. For example, recognising timbres of different instruments could
be linked to recognising – and selectively attending to – different voices.
Similarly, harmony skills could be linked to auditory scene analysis, since
harmonic components can be used to separate sound sources (see Section
1.2.2).
Both of these skills could be predicted to help in separating a target voice
from competing speech. However, it is unlikely that correlations would
have been observed for the noise maskers used in Experiment 1, since this
task did not involve separation of multiple voices or harmonic sounds. A
further study would be needed to examine the relationships between timbre
and harmony skills and speech perception with speech maskers.
7.1.3 Interpreting differences in speech reception thresholdsThe Matrix Sentence Test was used to assess speech perception in steady
and modulated noise maskers. For the young adults who participated in
Experiment 1, the range of measured thresholds spanned 3.1 dB for steady
noise and 4.4 dB for modulated noise. Comparable ranges were found for
the older adults in Experiment 6, although the absolute thresholds were
significantly worse than for the young adults. Combining the data from the
two groups results in ranges of 3.2 dB and 5.9 dB for steady and modulated
maskers respectively.
The just-noticeable difference in signal-to-noise ratio for speech in steady
noise has been reported to be 3 dB (McShefferty et al., 2015). This suggests
that, for the participants tested here, the thresholds for the very best and
very worst performers should only just be distinguishable from each other.
It is important to note that none of the participants reported having any
particular difficulties understanding speech in background noise. This begs
the question: do the measured differences in thresholds actually translate
to meaningful differences in real world abilities?
It could, however, be argued that such a question is not appropriate given
the myriad differences between the two situations. In the lab, participants
were wearing headphones and were focused on the task at hand; stimuli
were carefully controlled; masking noise was consistent throughout; the
test was repetitive, allowing familiarisation with the task and stimuli; target

156 CHAPTER 7: GENERALDISCUSSION
words were drawn from a finite number of options; and attention was only
required in short bursts, i.e., the length of a sentence.
In the real world, it is much more likely that listeners will need to:
following an ongoing conversation for a prolonged period of time; try to
ignore multiple dynamic sound sources, often including competing speech;
repeatedly switch focus between different talkers and other demands on
their attention; and piece together the speech signal without the benefit of
advance information about the content or frequent opportunities to pause
and work out what was said.
Given the varied and changeable nature of everyday listening environments,
objective tests of speech perception in noise with controlled stimuli
are necessary and provide insight into auditory perception, even if the
thresholds do not directly relate to listeners’ subjective experiences in the
real world.
7.1.4 Beat perception in specific populationsThe participants in Experiment 1 had a range of musical backgrounds, but
they were all young adults with normal hearing. It would be interesting
to see if the link between beat perception and speech perception in noise
persists in other populations.
7.1.4.1 Clinical populationsTo better understand the relationship between beat perception and speech
perception in noise, it would be useful to test these skills in clinical
populations that are known to have poor speech perception in noise.
For example, children with language disorders often struggle with speech
perception in noise (e.g., Ziegler et al., 2009) and have also been reported
to have difficulty with musical beat tasks (Corriveau and Goswami, 2009;
Muneaux et al., 2004). However, as these tasks were not tested within
the same group of children, it is impossible to deduce the nature of any
association between the two skills.
This idea partially motivated the recruitment of older adults for the training
study in Chapter 6. However, despite the advanced age of some of the
participants, the levels of hearing ability among the group were actually
very good. Despite performing worse on the matrix sentence test than
the young adults in Experiment 1, the older adults reported no particular

QUESTION 1: ARE SPECIFICMUSICAL SKILLS ASSOCIATEDWITH SPEECHPERCEPTION INNOISE? 157
difficulty with speech perception in noise in their everyday lives. This was
unexpected given prior research (see Section 1.6.2).
Some of the training participants also had excellent musical beat perception
at the start of the study, which meant they were less likely to benefit from
the beat training as they had little capacity for improvement (Astle et al.,
2013; Fahle and Henke-Fahle, 1996).
An alternative approach would be to study a population who are known to
have impaired musical beat perception and assess their ability to perceive
speech in background noise. For example, Parkinson’s disease affects the
basal ganglia – an area of the brain which is involved in beat perception
(Grahn and Brett, 2009) and has also been proposed to be involved
in forming temporal predictions during speech perception (Kotz et al.,
2009). Patients with Parkinson’s disease have been shown to have difficulty
discriminating beat-based rhythms (Grahn and Brett, 2009), so it would be
interesting to see if they also have deficits for speech perception in noise.
7.1.4.2 Non-native speakers of EnglishAnother population who have difficulties with speech perception in noise
are non-native speakers of the language (e.g., Mayo et al., 1997; van
Wijngaarden et al., 2002). Given the evidence that instrumental music
reflects the spoken prosodic rhythms of the language of the composer (Patel
and Daniele, 2000), perhaps musical beat training could be used to help
non-native speakers of English.
Lidji et al. (2011) found that both English and French speakers could tap
along to the meter of English and French utterances. However, tapping
to English utterances was more regular than to French utterances because
of the stress-based rhythm in English that does not occur in French.
Furthermore, English speakers tapped more regularly than French speakers
and were more likely to pick out the underlying ‘beat’ rather than tapping
along with the syllables. Lidji et al. (2011) suggested that the English
speakers’ long-term experience with the language allowed them to entrain
to the meter of the English utterances to a level that French speakers could
not.
Perhaps non-native speakers’ non-familiarity with the rhythmic structure
of English could at least partially explain their difficulties with speech
perception in noise. Non-native speakers might therefore benefit from

158 CHAPTER 7: GENERALDISCUSSION
training in beat perception using English music or indeed a combination
of music and speech rhythm tasks, in order to become more familiar with
the stress-based metric structure of the English language.
7.2 Question 2: How might beat perception contribute tospeech perception in noise?
To do well in the beat perception test, it is necessary for the listener to
form predictions about when the next beat will occur in order to judge if
a superimposed beep arrives at the same time. This reasoning led to the
hypothesis that beat perception could enhance speech perception in noise
via orienting of attention to points in time when a target is predicted to
occur.
In Experiment 2, priming with an isochronous sequence was shown
to enhance detection of pure-tone targets in noise and perception of
monosyllabic words in noise. Thresholds for targets which occurred at
expected times (on the beat) were significantly better than for targets which
were displaced in time. More complex rhythms were used in Experiment 3,
and it was shown that when the beat of the priming sequence was less
salient, and therefore required some musical expertise to perceive, the
magnitude of the priming effect for tone detection was associated with
musical beat perception.
Returning to the initial focus of speech perception in noise, Experiment
5 used a sentence context to show that rhythmic priming can be driven
by speech meter as well as by the musical rhythms used in Chapter 4.
Thresholds for the final target word were better when the target occurred
at its natural (and therefore predicted) point in time compared to when it
was delayed.
Together, these findings support the hypothesis that beat perception may
enhance speech perception in noise via rhythmic priming driven by the
metric structure of speech.
7.2.1 Musical beat perception and rhythmic primingThe current research successfully demonstrated that rhythmic priming can
enhance the perception of targets in noise. The second assumption of the
hypothesis – that this priming effect is modulated by beat perception – was
shown for the duration beat rhythm primes in Experiment 3, but not for

QUESTION 2: HOWMIGHTBEAT PERCEPTIONCONTRIBUTE TO SPEECHPERCEPTION INNOISE? 159
priming with speech meter. One encouraging piece of evidence is that
musicians have an enhanced sensitivity to speech meter (Marie et al., 2011),
but further research is needed to test if musical beat perception does in fact
have an influence on rhythmic priming during speech listening.
The priming paradigm from Experiment 5 (‘Ready Baron, go to red...’)
could be adapted to vary the colour which precedes the target number,
using words of different lengths and/or stress patterns. To observe a
priming benefit in this case, the temporal prediction for the target location
would have to be adapted accordingly. If a few different possibilities
are mixed within a block, then temporal predictions would have to be
formed on a trial-by-trial basis. This would avoid the potential confound
in Experiment 5, whereby the rhythmic pattern of the priming phrase was
identical throughout the block.
Further research could use speech with more complex metrical structures
to see if an association would emerge between beat perception and
the priming effect. These adaptations might also reveal developmental
differences during childhood, which were not evident for the 6–11 year-olds
tested with the simple stimuli in Experiment 5.
7.2.2 Converging evidence from neuroscienceThe research presented in this thesis adopted a purely behavioural
approach. However, there is converging evidence from neuroscience that
is worth considering. This section will present a brief description of some
neuroscientific findings that support the hypothesis explored in this thesis.
7.2.2.1 Orienting of attention during music listeningAnticipatory attention effects have been reported during real music
listening, with enhanced processing for probe sounds which coincided with
the beat of the music (Bolger et al., 2013; Tierney and Kraus, 2013a). In
addition, this enhancement was correlated with the ability to tap along
to a beat (Tierney and Kraus, 2013a). This suggests a link between
synchronisation to a simple beat and perception of the beat in real music.
In both of these studies (Bolger et al., 2013; Tierney and Kraus, 2013a),
the musical excerpts (classical and pop respectively) were carefully chosen
so that the beat was easily perceivable by all participants. Perhaps if
a more complex musical piece – with a less salient beat – were used,

160 CHAPTER 7: GENERALDISCUSSION
then a correlation might be observed between rhythmic priming and beat
perception. This would support the hypothesis that good beat perceivers
have an enhanced mechanism for extracting implicit regularity in order to
benefit from anticipatory attention.
7.2.2.2 Orientation of attention during speech listeningBehavioural evidence that attention is oriented towards stressed syllables
when listening to speech was reviewed in Section 1.5.2.
There is also neuroscientific evidence that listeners employ temporal
attention when listening to narrative speech. Astheimer and Sanders
(2009) examined electrophysiological responses to attention probes which
could either coincide with word onsets or occur at random control times
during a continuous speech stream. Probes which occurred around the time
of word onsets were found to elicit larger responses – indicative of greater
allocation of attention – than probes which occurred at control times. The
authors concluded that attention is oriented to word-initial segments when
listening to narrative speech.
Together these findings support the concept of dynamic attending –
oscillatory entrainment of anticipatory attention in response to rhythmic
stimuli (Large and Jones, 1999) – and suggest that similar priming
mechanisms are used for both music and speech listening.
7.2.2.3 Neural entrainment as a mechanism of selective attentionDynamic attending theory (Large and Jones, 1999) is based upon the idea
that internal oscillations entrain to external rhythmic stimuli in order to
orient temporal attention, as described in Section 1.5.1.2. Oscillations are
phase-locked so that peaks in neuronal excitability coincide with predicted
onsets, thereby affording enhanced processing to stimuli which occur at
predicted times.
When listening to speech, it has been shown that oscillations in the
auditory cortex entrain to temporal envelope information, and that this
phase-locking is enhanced when the speech is intelligible (Peelle and
Davis, 2012). Furthermore, when there are two competing speech signals,
phase-locking to the attended speech stream is stronger than that to the
unattended stream (Horton et al., 2013). Phase-locking to the unattended
speech was in the reverse direction, so that minimum excitability coincided

QUESTION 2: HOWMIGHTBEAT PERCEPTIONCONTRIBUTE TO SPEECHPERCEPTION INNOISE? 161
with predicted onsets, suggestive of a suppression effect of entrainment on
unattended stimuli (Horton et al., 2013).
In the rhythmic priming experiments in Chapters 4 and 5 a steady noise
masker was chosen so as to minimise confounding temporal information.
However, if entrainment to temporal regularity can enhance attended
streams while also suppressing unattended streams, then perhaps a masker
with temporal regularity (such as modulated noise or competing speech)
would have resulted in greater benefits of rhythmic priming. By extension,
as beat perception is hypothesised to enhance the entrainment mechanism,
then greater modulatory effects of musical beat perception may have been
observed.
Further research in this area could utilise combined methods to put the
behavioural findings in a neuroscientific context. Power et al. (2012)
developed a rhythmic priming paradigm that could be used to study
individual differences in oscillatory entrainment. Such a paradigm could be
useful for exploring the link between musical beat perception and rhythmic
priming.
7.2.3 What is ameaningful difference in threshold?In the studies presented in this thesis, differences in threshold due to
attention or training have been reported in terms of the performance benefit
(% correct) per 1 dB improvement in signal-to-noise ratio at threshold.
For example, in Experiment 5, the benefit of priming for on-beat speech
targets for the adult group was a 2.5 dB improvement in threshold. This
was equivalent to an extra 15.1% of targets correctly identified. However,
this figure only applies to signal-to-noise ratios in the region of the speech
reception threshold (see Section 2.4.3). It is therefore difficult to interpret
the results in terms of real world benefit, since this will vary for different
listening environments.
The just-meaningful difference in signal-to-noise ratio – defined as the
minimum improvement for which a patient would seek an intervention
such as a hearing aid – was recently reported to be 6 dB (McShefferty et al.,
2016). This is far greater than the benefits reported in the current research,
but that doesn’t necessarily mean that the results are not meaningful. The
benefits reported here were for participants who did not report difficulties

162 CHAPTER 7: GENERALDISCUSSION
with speech perception in noise. Greater benefit may be observed for people
who do struggle to understand speech in complex auditory environments.
7.2.4 Adaptations of the rhythmic priming paradigmRhythmic priming paradigms have typically measured benefits in terms of
reaction times to targets in quiet (e.g., Cason and Schon, 2012; Quene
et al., 2005). Having successfully demonstrated that rhythmic priming can
also enhance perceptual thresholds for targets in noise, there are numerous
potential avenues for future research.
7.2.4.1 Audibility of priming sequencesIn the current paradigm, the priming sequences were always clearly audible
above the noise, and only the level of the target varied. This choice was
made to maximise the likelihood of observing rhythmic priming effects, but
it came with a sacrifice in terms of ecological validity. If listening to speech
in background noise, the whole speech stream will be masked to a similar
degree.
The experiments could be repeated with the priming sequences matching
the varying target level, but this would pose extra questions. How much
of the speech prime would need to be heard in order to generate rhythmic
priming? Does it need to be intelligible, or just loud enough so that cues to
lexical stress can be identified?
Perhaps electrophysiological methods could be used for this purpose with
attention probes like those used by Astheimer and Sanders (2009). The
signal-to-noise ratio of the ongoing speech could be manipulated and
attention probes used to determine for which levels rhythmic priming
effects are observed.
The use of continuous speech in a behavioural priming paradigm is another
area for future work. The short sentences and monosyllabic target words
used in the current research did not allow for the examination of the
timecourse of rhythmic priming, i.e., does entrainment strengthen over
time?
7.2.4.2 Addition of visual cuesIn all of the priming studies presented in this thesis the stimuli have
been purely auditory. In everyday speech listening situations, it is likely

QUESTION 2: HOWMIGHTBEAT PERCEPTIONCONTRIBUTE TO SPEECHPERCEPTION INNOISE? 163
that visual information will also be available. A speaker’s natural head
movements have been shown to enhance speech perception in noise
(Munhall et al., 2004). The head movements were related to the prosody of
the speech, and so it may be that the visual information provided additional
cues to strengthen temporal expectations. The inclusion of visual cues also
influences neural entrainment to speech (Power et al., 2012).
It has also been shown that hearing-impaired listeners gain a similar
amount of benefit from endogenous visual cues for when to listen compared
with normal-hearing listeners (Best et al., 2007a). Combining these two
ideas, perhaps comparing an auditory-only with an audio-visual priming
paradigm could elucidate how hearing-impaired listeners form temporal
predictions. Are they able to orient temporal attention based purely on
auditory rhythms? If they do not perform as well as normally-hearing
listeners, then perhaps the combination of auditory and visual prosodic cues
could compensate for the difference. If so, perhaps participants could be
trained to use visual cues to orient temporal attention to assist with speech
perception in noise.
7.2.4.3 Encourage endogenous attentionThe focus in the current research was on automatic orienting of temporal
attention via rhythmic priming, and so endogenous orienting of attention
was discouraged. However, it may still have played a part in some cases, as
discussed in Chapter 4.
With the simple isochronous sequence used in Experiment 2, or the simple
speech prime in Experiment 5, it would be straightforward to deliberately
orient attention to the predicted target location. Future research could
investigate whether it is possible to endogenously orient temporal attention
during speech listening in order to enhance rhythmic priming effects. If this
were possible, then this could potentially be utilised in a training paradigm
as well.
7.2.4.4 Rhythmic stimulationThe inadvertant discovery in Experiment 6 that performing a beat
perception task prior to a sentence-in-noise test might improve perception
may be worth pursuing in its own right. It has previously been shown that
children with language disorders perform better on a syntactic judgement

164 CHAPTER 7: GENERALDISCUSSION
task when they listened to music with a regular beat prior to starting the
task (Przybylski et al., 2013).
Perhaps focusing on the beat of musical excerpts prior to undertaking the
matrix sentence test had a similar preparatory effect. Further studies would
be required to see if this was indeed the case, and if the effect would extend
to other speech stimuli with less regular rhythms.
7.3 Question 3: Can short-term beat training improvespeech perception in noise?
The new-found knowledge that beat perception could enhance speech
perception in noise via temporal prediction mechanisms was used to inform
the design of a training programme. An established method of music
teaching (Dalcroze Eurythmics) was adapted to focus on developing beat
perception skills through synchronising movements to music. The impact of
this training was evaluated for a group of older adults. Small improvements
in speech perception thresholds in noise were observed after four weeks
of training, although caution should be exercised when interpreting these
results.
This study had considerable limitations – a small sample size and no active
control group, for example – and future directions for building on this
research are discussed below. For a preliminary pilot study, the results were
quite promising and suggest that audio-motor musical beat training may be
worth pursuing as a potential tool for improving speech perception in noise.
However, the results are not conclusive and further training studies will be
needed to verify if this is the case.
7.3.1 Considerations for future training studiesThe training study presented in Chapter 6 had considerable limitations,
including a small sample size, lack of an active control group, and no
way to objectively measure participants’ progress in the trained activities.
Although the goal of the research was to investigate short-term training,
four weeks may have been too short, especially given that the homework
activities were not as successful as originally conceived. All of these
things should be considered in future studies, along with some other ideas
discussed here.
QUESTION 3: CAN SHORT-TERMBEAT TRAINING IMPROVE SPEECHPERCEPTION INNOISE? 165
7.3.1.1 Target groupsFor Experiment 6, it was decided to train older adults as speech perception
in noise has been shown to decline with age (see Section 1.6.2).
An additional advantage in training this group is that the hypothesised
mechanism by which beat perception might transfer to speech – i.e.,
rhythmic priming – is an automatic process which is not dependent on
working memory. Since speech perception in older adults is adversely
affected by cognitive decline, training to enhance a mechanism that is
independent of cognitive demands could offer clear benefits if successful.
However, the older adults recruited for the training study did not display
the expected deficits. Although their speech reception thresholds were
significantly worse than for the young adults in Experiment 1, they reported
no particular difficulties with listening to speech in noisy environments.
Future training studies should consider targeting groups who definitiely
have room to improve (see Section 7.1.4). If a connection can be found
between poor beat perception and poor speech perception in noise for a
specific population, then that population would be an ideal target group for
a future training study. As the intention is to train musical beat perception
and evaluate any transfer to speech perception, it makes sense to select
participants who have the potential to benefit. This would also provide
a truer representation of whether musical training can be used to help
those who struggle with speech perception in noise, which was the original
motivation for this research.
7.3.1.2 Development of intermediate outcomemeasuresAs well as coming up with ways to directly measure improvements in
trained tasks, it may be possible to use intermediary measures. If the
trained task is synchronisation with a beat, and the final outcome measure
is speech perception in noise, then an intermediate measure could be
part way through the hypothesised transfer mechanism. This was the
intention behind using the beat perception test, but unfortunately it was not
sufficiently sensitive to training differences as several participants scored
highly at baseline. Another option could be to use a priming paradigm with
complex rhythms to see if the priming effect increases as beat perception
improves.

166 CHAPTER 7: GENERALDISCUSSION
7.3.1.3 Individual differencesAs discussed in Chapter 6, there were some participants who were less
likely to benefit from the training as they already had good beat perception,
possibly due to musical or dance experience. This highlights the importance
of an individual differences approach to training interventions.
It was suggested above that targeting a clinical population who actually do
struggle with speech perception in noise is likely to produce more training
improvements. However, it may not be that simple. Speech perception in
noise is a complex task, and it is likely that beat perception and rhythmic
priming account for just a small part of the puzzle. There may be some
individuals who have deficits in both skills and who may therefore benefit
from musical beat training. For others, speech perception in noise might be
challenging for some other reason unrelated to beat perception.
It is also important to take participants’ personal preferences into account.
An argument in favour of musical training is that it is enjoyable and likely
to encourage compliance. However, for some individuals music may not
interest them and so this would not be the case.
7.3.1.4 Creating a music–speech hybridThe goal of the current research was not to identify the best possible
training programme for speech perception in noise, but rather to test
whether musical beat training would be one possibility.
There are elements of the training which were successful. Participants
enjoyed the sessions – both the activities and the social aspect – and the
retention rate was 100%, showing that the training definitely satisfied the
emotion criterion of the OPERA hypothesis (Patel, 2014). The training was
also multimodal, which has been shown to enhance benefits and plasticity
compared to purely auditory training (Lappe et al., 2008, 2011).
Future training studies should retain these elements while considering if a
purely musical approach is the best option for improving speech perception
in noise. The potential benefits of music in terms of enjoyment and
compliance have already been discussed (see Section 1.1.4), and beat
perception does appear to be a suitable skill to target. However, this is
likely to be only a small part of the picture.

CONCLUSION 167
It may be that the ideal training programme would involve a mixture of
musical and speech-based activities. For example, adding lyrics to the music
could be useful as song lyrics are often aligned such that stressed syllables
occur on the beat of the music. Poetry, especially that with fixed rhythmic
structures such as limericks, or even rap could also be used to develop
participants ability to entrain to regularities in speech, while still retaining
the enjoyable variety that is associated with musical training.
7.4 ConclusionThe goal of this thesis was to investigate the potential of musical training
as an intervention for improving speech perception in background noise.
The key findings from the current research are that:
1. musical beat perception is associated with speech perception in noise
2. rhythmic priming enhances the perception of targets in noise
In conclusion, musical training does have some potential for use as an
intervention for speech perception in noise. Any future attempts at
designing such a programme should consider musical beat perception as
a useful skill to target.


References
Akeroyd, M. (2008). Are individual differences in speech reception related toindividual differences in cognitive ability? A survey of twenty experimentalstudies with normal and hearing-impaired adults. International Journal ofAudiology, 47, S53–S71. 26, 58, 136
Allen, K., Carlile, S., and Alais, D. (2008). Contributions of talker characteristicsand spatial location to auditory streaming. The Journal of the Acoustical Societyof America, 123(3), 1562–1570. 13, 30, 45
Astheimer, L. B. and Sanders, L. D. (2009). Listeners modulate temporally selectiveattention during natural speech processing. Biological Psychology, 80(1), 23–34.22, 160, 162
Astle, A. t., Li, R. W., Webb, B. S., Levi, D. M., and McGraw, P. V. (2013). AWeber-like law for perceptual learning. Scientific Reports, 3, 1158. 142, 157
Baddeley, A. (2003). Working memory: looking back and looking forward. Naturereviews neuroscience, 4(10), 829–839. 5
Besson, M., Chobert, J., and Marie, C. (2011). Transfer of training between musicand speech: common processing, attention, and memory. Frontiers in psychology,2. 3, 5, 152
Best, V., Marrone, N., Mason, C. R., Kidd Jr, G., and Shinn-Cunningham, B. G.(2007a). Do hearing-impaired listeners benefit from spatial and temporal cuesin a complex auditory scene. In International Symposium on Auditory andAudiological Research, Helsingor, Denmark. 163
Best, V., Ozmeral, E. J., and Shinn-Cunningham, B. G. (2007b). Visually-guidedattention enhances target identification in a complex auditory scene. Journal forthe Association for Research in Otolaryngology, 8(2), 294–304. 19
Boebinger, D., Evans, S., Rosen, S., Lima, C. F., Manly, T., and Scott, S. K. (2015).Musicians and non-musicians are equally adept at perceiving masked speech.The Journal of the Acoustical Society of America, 137(1), 378–387. 28
169

170 REFERENCES
Bolger, D., Trost, W., and Schon, D. (2013). Rhythm implicitly affects temporalorienting of attention across modalities. Acta Psychologica, 142(2), 238–244.21, 159
Bolia, R. S., Nelson, W. T., Ericson, M. A., and Simpson, B. D. (2000). A speechcorpus for multitalker communications research. The Journal of the AcousticalSociety of America, 107(2), 1065–1066. 12, 117, 119
Bonino, A. Y., Leibold, L. J., and Buss, E. (2013). Release from perceptual maskingfor children and adults: Benefit of a carrier phrase. Ear and hearing, 34(1), 3.24, 117, 118
Brand, T. and Kollmeier, B. (2002). Efficient adaptive procedures for thresholdand concurrent slope estimates for psychophysics and speech intelligibility tests.The Journal of the Acoustical Society of America, 111(6), 2801–2810. 46
Bregman, A. (1990). Auditory Scene Analysis: The perceptual organization ofsound. 8
Bregman, A. S. (1993). Auditory scene analysis: Hearing in complex environments.In McAdams, S. E. and Bigand, E., editors, Thinking in Sound, pages 10–36.London: Oxford University Press. 8, 9
Breitenstein, C., Van Lancker, D., Daum, I., and Waters, C. H. (2001). Impairedperception of vocal emotions in Parkinson’s Disease: influence of speech timeprocessing and executive function. Brain and Cognition, 45, 277–314. 153
Brungart, D. S. (2001). Informational and energetic masking effects in theperception of two simultaneous talkers. The Journal of the Acoustical Societyof America, 109(3), 1101–1109. 12, 13, 14, 45
Brungart, D. S. and Simpson, B. D. (2007). Cocktail party listening in a dynamicmultitalker environment. Perception & psychophysics, 69(1), 79–91. 13, 14, 15,45
Bugos, J. A., Perlstein, W. M., McCrae, C. S., Brophy, T. S., and Bedenbaugh, P.(2007). Individualized piano instruction enhances executive functioning andworking memory in older adults. Aging and Mental Health, 11(4), 464–471. 4,5
Capizzi, M., S. D. and Correa, A. (2012). Dissociating controlled from automaticprocessing in temporal preparation. Cognition, 123, 293–302. 20
Cason, N., Astesano, C., and Schon, D. (2015). Bridging music and speechrhythm: rhythmic priming and audio-motor training affect speech perception.Acta Psychologica, 155, 43–50. 125
Cason, N. R. and Schon, D. (2012). Rhythmic priming enhances the phonologicalprocessing of speech. Neuropsychologia, 50, 2652–2658. 21, 76, 91, 114, 162
Chan, A. S., Ho, Y.-C., and Cheung, M.-C. (1998). Music training improves verbalmemory. Nature, 396(6707), 128–128. 2, 5, 58, 65

REFERENCES 171
Cherry, E. C. (1953). Some experiments on the recognition of speech, with one andwith two ears. The Journal of the acoustical society of America, 25(5), 975–979.11, 14, 15
Chisolm, T., Saunders, G., Frederick, M., McArdle, R., Smith, S., and Wilson, R.(2013). Learning to listen again: the role of compliance in auditory training foradults with hearing loss. American Journal of Audiology, 22(2), 339–342. 7
Conway, A. R. A., Cowan, N., and Bunting, M. F. (2001). The cocktailparty phenomenon revisited: The importance of working memory capacity.Psychonomic bulletin & review, 8(2), 331–335. 11
Corrigall, K. A., Schellenberg, E. G., and Misura, N. M. (2013). Music training,cognition, and personality. Frontiers in Psychology, 4. 2
Corriveau, K. H. and Goswami, U. (2009). Rhythmic motor entrainment in childrenwith speech and language impairments: Tapping to the beat. Cortex, 45(1),119–130. 35, 156
de la Rosa, M. D., Sanabria, D., Capizzi, M., and Correa, A. (2012). Temporalpreparation driven by rhythms is resistant to working memory interference.Frontiers in Psychology, 3. 21, 91, 109
Dege, F. and Schwarzer, G. (2011). The effect of a music program on phonologicalawareness in preschoolers. Frontiers in Psychology, 2. 4
Diedenhofen, B. and Musch, J. (2015). cocor: a comprehensive solution for thestatistical comparison of correlations. PLoS ONE, 10(4), e0121945. 106
Drake, C., Jones, M., and Baruch, C. (2000). The development of rhythmicattending in auditory sequences: attunement, referent period, focal attending.Cognition, 77, 251–288. 152
Dreschler, W. A., Verschuure, H., Ludvigsen, C., and Westermann, S. (2001). ICRAnoises: Artificial noise signals with speech-like spectral and temporal propertiesfor hearing instrument assessment. International Journal of Audiology, 40(3),148–157. 47, 48, 120
Drullman, R., Festen, J. M., and Plomp, R. (1994a). Effect of reducing slowtemporal modulations on speech reception. The Journal of the Acoustical Societyof America, 95, 2670. 18, 35
Drullman, R., Festen, J. M., and Plomp, R. (1994b). Effect of temporal envelopesmearing on speech reception. The Journal of the Acoustical Society of America,95, 1053. 18, 35
Dubno, J. R., Horwitz, A. R., and Ahlstrom, J. B. (2002). Benefit of modulatedmaskers for speech recognition by younger and older adults with normal hearing.The Journal of the Acoustical Society of America, 111(6), 2897–2907. 18
Egeth, H. and Yantis, S. (1997). Visual attention: Control, representation, andtime course. Annual Review of Psychology, 48, 269–297. 10

172 REFERENCES
Eisenberg, L. S., Shannon, R. V., Martinez, A. S., Wygonski, J., and Boothroyd, A.(2000). Speech recognition with reduced spectral cues as a function of age. TheJournal of the Acoustical Society of America, 107(5), 2704–2710. 24
Elhilali, M., Ma, L., Micheyl, C., Oxenham, A. J., and Shamma, S. A. (2009).Temporal coherence in the perceptual organization and cortical representationof auditory scenes. Neuron, 61(2), 317. 18
Fahle, M. and Henke-Fahle, S. (1996). Interobserver variance in perceptualperformance and learning. Investigative Opthalmology and Visual Science, 37(5),869–877. 142, 157
Fallon, M., Trehub, S. E., and Schneider, B. A. (2002). Children’s use of semanticcues in degraded listening environments. The Journal of the Acoustical Society ofAmerica, 111(5), 2242–2249. 24
Faul, F., Erdfelder, E., Lang, A. G., and Buchner, A. (2007). G*Power 3: a flexiblestatistical power analysis program for the social, behavioral, and biomedicalsciences. Behavior Research Methods, 39(2), 175–191. 95
Francois, C., Chobert, J., Besson, M., and Schon, D. (2013). Music training for thedevelopment of speech segmentation. Cerebral Cortex, 23(9), 2038–2043. 4
Frego, R. D., Gillmeister, G., Hama, M., and Liston, R. E. (2004). The Dalcrozeapproach to music therapy. In Darrow, A., editor, Introduction to Approachesin Music Therapy, pages 15–24. Silver Springs, MD: American Music TherapyAssociation. 129
Freyman, R. L., Balakrishnan, U., and Helfer, K. S. (2004). Effect of numberof masking talkers and auditory priming on informational masking in speechrecognition. The Journal of the Acoustical Society of America, 115(5), 2246–2256.125
Fullgrabe, C., Moore, B. C., and Stone, M. A. (2014). Age-group differencesin speech identification despite matched audiometrically normal hearing:contributions from auditory temporal processing and cognition. Frontiers inaging neuroscience, 6. 17, 18, 26
George, E. L., Zekveld, A. A., Kramer, S. E., Goverts, S. T., Festen, J. M.,and Houtgast, T. (2007). Auditory and nonauditory factors affecting speechreception in noise by older listeners. Journal of the Acoustical Society of America,121(4), 2362–2375. 26, 47, 56, 71
Ghitza, O. and Greenberg, S. (2009). On the possible role of brain rhythms inspeech perception: intelligibility of time-compressed speech with periodic andaperiodic insertions of silence. Phonetica, 66(1-2), 113–126. 18, 35
Gnansia, D., Jourdes, V., and Lorenzi, C. (2008). Effect of masker modulationdepth on speech masking release. Hearing Research, 239(1), 60–68. 17, 48, 61
Goswami, U., Thomson, J., Richardson, U., Stainthorp, R., Hughes, D., Rosen, S.,and Scott, S. (2002). Amplitude envelope onsets and developmental dyslexia:a new hypothesis. Proceedings of the National Academy of Sciences, 99(16),10911–10916. 34

REFERENCES 173
Grahn, J. A. and Brett, M. (2007). Rhythm and beat perception in motor areas ofthe brain. Journal of Cognitive Neuroscience, 19(5), 893–906. 93, 128, 153
Grahn, J. A. and Brett, M. (2009). Impairment of beat-based rhythm discriminationin Parkinson’s disease. Cortex, 45, 54–61. 153, 157
Grahn, J. A. and McAuley, J. D. (2009). Neural bases of individual differences inbeat perception. NeuroImage, 47, 1894–1903. 72
Grahn, J. A. and Rowe, J. B. (2009). Feeling the beat: premotor and striatalinteractions in musicians and nonmusicians during beat perception. The Journalof Neuroscience, 29(23), 7540–7548. 93, 128, 129
Grahn, J. A. and Rowe, J. B. (2012). Finding and feeling the musical beat: striataldissociations between detection and prediction of regularity. Cerebral Cortex,bhs083. 153
Gustafsson, H. and Arlinger, S. (1994). Masking of speech by amplitude-modulatednoise. Journal of the Acoustical Society of America, 95(1), 518–529. 17, 18
Hagerman, B. (1982). Sentences for testing speech intelligibility in noise.Scandinavian Audiology, 11(2), 79–87. 46, 47
Hall, J. W., Buss, E., Grose, J. H., and Roush, P. A. (2012). Effects of ageand hearing impairment on the ability to benefit from temporal and spectralmodulation. Ear and hearing, 33(3), 340. 24, 26
Hars, M., Herrmann, F. R., Gold, G., Rizzoli, R., and Trombetti, A. (2013). Effectof music-based multitask training on cognition and mood in older adults. Ageand ageing, 43(2), 196–200. 130
Hartley, D. E., Wright, B. A., Hogan, S. C., and Moore, D. R. (2000).Age-related improvements in auditory backward and simultaneous masking in6-to 10-year-old children. Journal of Speech, Language, and Hearing Research,43(6), 1402–1415. 24
Hewitt, D. (2008). Evaluation of an English speech-in-noise audiometry test.Master’s thesis, University of Southampton, UK. 46, 47, 138, 140
Ho, Y.-C., Cheung, M.-C., and Chan, A. S. (2003). Music training improves verbalbut not visual memory: cross-sectional and longitudinal explorations in children.Neuropsychology, 17(3), 439. 2, 4, 5
Honing, H. (2012). Without it no music: beat induction as a fundamental musicaltrait. Annals of the New York Academy of Sciences, 1252(1), 85–91. 72, 116, 128
Horton, C., D’Zmura, M., and Srinivasan, R. (2013). Suppression of competingspeech through entrainment of cortical oscillations. Journal of Neurophysiology,109, 3082–3093. 160, 161
Humes, L. (1996). Speech understanding in the elderly. Journal of the AmericanAcademy of Audiology, 7, 161–167. 25

174 REFERENCES
Hyde, K. L., Lerch, J., Norton, A., Forgeard, M., Winner, E., Evans, A. C., andSchlaug, G. (2009). Musical training shapes structural brain development. TheJournal of Neuroscience, 29(10), 3019–3025. 2, 3
Iversen, J. R. and Patel, A. D. (2008). The Beat Alignment Test (BAT): Surveyingbeat processing abilities in the general population. In Proceedings of the 10thInternational Conference on Music Perception & Cognition (ICMPC10), pages465–468. 43, 62, 99, 134
Jakobson, L. S., Lewycky, S. T., Kilgour, A. R., and Stoesz, B. M. (2008). Memoryfor verbal and visual material in highly trained musicians. Music Perception,26(1), 41–55. 2, 5, 58
Jansen, S., Luts, H., Wagener, K. C., Kollmeier, B., Del Rio, M., Dauman, R., James,C., Fraysse, B., Vormes, E., Frachet, B., et al. (2012). Comparison of three typesof French speech-in-noise tests: A multi-center study. International Journal ofAudiology, 51(3), 164–173. 47
Johnson, C. (2000). Children’s phoneme identification in reverberation and noise.Journal of Speech, Language and Hearing Research, 43, 144–157. 24
Johnsrude, I. S., Mackey, A., Hakyemez, H., Alexander, E., Trang, H. P., andCarlyon, R. P. (2013). Swinging at a cocktail party voice familiarity aids speechperception in the presence of a competing voice. Psychological Science, 24(10),1995–2004. 14, 26, 45
Jones, M. R. and Boltz, M. (1989). Dynamic attending and responses to time.Psychological Review, 96(3), 459–491. 20
Jones, M. R., Moynihan, H., MacKenzie, N., and Puente, J. (2002). Temporalaspects of stimulus-driven attending in dynamic arrays. Psychological Science,13(4), 313–319. 20, 21, 53, 76, 78, 79, 85, 91, 93, 107
Kalikow, D. N., Stevens, K. N., and Elliott, L. L. (1977). Development of a testof speech intelligibility in noise using sentence materials with controlled wordpredictability. The Journal of the Acoustical Society of America, 61(5), 1337–1351.16
Killion, M. C., Niquette, P. A., Gudmundsen, G. I., Revit, L. J., and Banerjee,S. (2004). Development of a quick speech-in-noise test for measuringsignal-to-noise ratio loss in normal-hearing and hearing-impaired listeners. TheJournal of the Acoustical Society of America, 116(4), 2395–2405. 27
Kingdom, F. and Prins, N. (2009). Palamedes: Matlab routines for analyzingpsychophysical data. http://www.palamedestoolbox.org. 52, 121
Kingdom, F. and Prins, N. (2010). Psychophysics: A Practical Introduction.Academic. 78
Klatte, M., Lachmann, T., Meis, M., et al. (2010). Effects of noise and reverberationon speech perception and listening comprehension of children and adults in aclassroom-like setting. Noise and Health, 12(49), 270. 25

REFERENCES 175
Kollmeier, B. and Wesselkamp, M. (1997). Development and evaluation ofa German sentence test for objective and subjective speech intelligibilityassessment. The Journal of the Acoustical Society of America, 102, 2412. 46
Kotz, S. A. and Schmidt-Kassow, M. (2015). Basal ganglia contribution to ruleexpectancy and temporal predictability in speech. Cortex, 68, 48–60. 153
Kotz, S. A., Schwartze, M., and Schmidt-Kassow, M. (2009). Non-motor basalganglia functions: a review and proposal for a model of sensory predictability inauditory language perception. Cortex, 45, 982–990. 157
Kraus, N., Strait, D. L., and Parbery-Clark, A. (2012). Cognitive factors shape brainnetworks for auditory skills: spotlight on auditory working memory. Annals ofthe New York Academy of Sciences, 1252(1), 100–107. 5, 6, 34, 152, 153
Kressig, R. W., Allali, G., and Beauchet, O. (2005). Long-term practice ofJaques-Dalcroze Eurhythmics prevents age-related increase of gait variabilityunder a dual task. Journal of the American Geriatrics Society, 53(4), 728–729.129, 130
Lappe, C., Herholz, S. C., Trainor, L. J., and Pantev, C. (2008). Cortical plasticityinduced by short-term unimodal and multimodal musical training. The Journalof Neuroscience, 28(39), 9632–9639. 3, 129, 166
Lappe, C., Trainor, L. J., Herholz, S. C., and Pantev, C. (2011). Cortical plasticityinduced by short-term multimodal musical rhythm training. PLoS ONE, 6(6),e21493. 3, 129, 166
Large, E. W. and Jones, M. R. (1999). The dynamics of attending: How peopletrack time-varying events. Psychological Review, 106(1), 119. 20, 160
Levitt, H. (1971). Transformed up-down methods in psychoacoustics. Journal ofthe Acousical Society of America, 49, 467–477. 50, 84
Lidji, P., Palmer, C., Peretz, I., and Morningstar, M. (2011). Listeners feel thebeat: Entrainment to English and French speech rhythms. Psychonomic Bulletin& Review, 18(6), 1035–1041. 22, 35, 72, 152, 157
Litovsky, R. Y. (2005). Speech intelligibility and spatial release from maskingin young children. The Journal of the Acoustical Society of America, 117(5),3091–3099. 24
Magne, C., Schon, D., and Besson, M. (2006). Musician children detectpitch violations in both music and language better than nonmusicianchildren: behavioral and electrophysiological approaches. Journal of CognitiveNeuroscience, 18(2), 199–211. 2
Manning, F. and Schutz, M. (2013). Moving to the beat improves timingperception. Psychonomic bulletin & review, 20(6), 1133–1139. 128
Marie, C., Magne, C., and Besson, M. (2011). Musicians and the metric structureof words. Journal of Cognitive Neuroscience, 23(2), 294–305. 152, 159

176 REFERENCES
Mayo, L. H., Florentine, M., and Buus, S. (1997). Age of second-languageacquisition and perception of speech in noise. Journal of Speech, Language andHearing Research, 40. 157
McCoy, S. L., Tun, P. A., Cox, L. C., Colangelo, M., Stewart, R. A., and Wingfield, A.(2005). Hearing loss and perceptual effort: Downstream effects on older adults’memory for speech. The Quarterly Journal of Experimental Psychology Section A,58(1), 22–33. 27
McShefferty, D., Whitmer, W. M., and Akeroyd, M. A. (2015). The just-noticeabledifference in speech-to-noise ratio. Trends in Hearing, 19, 1–9. 155
McShefferty, D., Whitmer, W. M., and Akeroyd, M. A. (2016). The just-meaningfuldifference in speech-to-noise ratio. Trends in Hearing, 20, 1–11. 149, 161
Meltzer, R. H., Martin, J. G., Mills, C. B., Imhoff, D. L., and Zohar, D. (1976).Reaction time to temporally-displaced phoneme targets in continuous speech.Journal of Experimental Psychology: Human Perception and Performance, 2(2),277. 22, 114
Micheyl, C., Delhommeau, K., Perrot, X., and Oxenham, A. (2006). Influence ofmusical and psychoacoustical training on pitch discrimination. Hearing Research,219(1), 36–47. 2, 65
Miller, G. A. and Licklider, J. (1950). The intelligibility of interrupted speech. TheJournal of the Acoustical Society of America, 22(2), 167–173. 16, 17, 18
Miller, S. E., Schlauch, R. S., and Watson, P. J. (2010). The effects of fundamentalfrequency contour manipulations on speech intelligibility in background noise).The Journal of the Acoustical Society of America, 128(1), 435–443. 35, 154
Moore, D., Edmonson-Jones, M., Dawes, P., Fortnum, H., McCormack, A., et al.(2014). Relation between speech-in-noise threshold, hearing loss and cognitionfrom 40–69 years of age. PLoS ONE, 9(9), e107720. 25
Moray, N. (1959). Attention in dichotic listening: Affective cues and the influenceof instructions. Quarterly journal of experimental psychology, 11(1), 56–60. 11
Moreno, S., Bialystok, E., Barac, R., Schellenberg, E. G., Cepeda, N. J., and Chau,T. (2011). Short-term music training enhances verbal intelligence and executivefunction. Psychological Science, 22(11), 1425–1433. 4, 5, 33
Moreno, S. and Bidelman, G. M. (2014). Examining neual plasticity and cognitivebenfit through the unique lens of musical training. Hearing Research, 308, 84–97.1
Moreno, S., Marques, C., Santos, A., Santos, M., Castro, S. L., and Besson, M.(2009). Musical training influences linguistic abilities in 8-year-old children:more evidence for brain plasticity. Cerebral Cortex, 19(3), 712–723. 3, 4
Mullensiefen, D., Gingras, B., Stewart, L., and Musil, J. (2011). The GoldsmithsMusical Sophistication Index (Gold-MSI): Technical report and documentationv0.9. Technical report, London: Goldsmiths, University of London. 40, 61, 133

REFERENCES 177
Muneaux, M., Ziegler, J. C., Truc, C., Thomson, J., and Goswami, U. (2004).Deficits in beat perception and dyslexia: Evidence from French. NeuroReport,15(8), 1255–1259. 36, 156
Munhall, K. G., Jones, J. A., Callan, D. E., Kuratate, T., and Vatikiotis-Bateson,E. (2004). Visual prosody and speech intelligibility head movement improvesauditory speech perception. Psychological Science, 15(2), 133–137. 163
Nasreddine, Z. S., Phillips, N. A., Bediran, V., Charbonneau, S., Whitehead, V.,Collin, I., Cummings, J. L., and Chertkow, H. (2005). The Montreal CognitiveAssessment, MoCA: a brief screening tool for mild cognitive impairment. Journalof the American Geriatrics Society, 53(4), 695–699. 131, 133
Neuman, A. C., Wroblewski, M., Hajicek, J., and Rubinstein, A. (2010). Combinedeffects of noise and reverberation on speech recognition performance ofnormal-hearing children and adults. Ear and hearing, 31(3), 336–344. 25
Nilsson, M., Soli, S. D., and Sullivan, J. A. (1994). Development of the Hearing inNoise Test for the measurement of speech reception thresholds in quiet and innoise. The Journal of the Acoustical Society of America, 95(2), 1085–1099. 27
Nishi, K., Lewis, D. E., Hoover, B. M., Choi, S., and Stelmachowicz, P. G. (2010).Children’s recognition of American English consonants in noise. The Journal ofthe Acoustical Society of America, 127(5), 3177–3188. 24, 117, 118
Olakunbi, D., Bamiou, D.-E., Stewart, L., and Luxon, L. M. (2010). Evaluationof musical skills in children with a diagnosis of an auditory processing disorder.International Journal of Pediatric Otorhinolaryngology, 74(6), 633–636. 35
Overy, K. (2003). Dyslexia and music: from timing deficits to musical intervention.Annals of the New York Academy of Sciences, 999(1), 497–505. 4, 34
Pantev, P. and Herholz, S. C. (2011). Plasticity of the human auditory cortex relatedto musical training. Neuroscience and Biobehavioral Reviews, 35, 2140–2154. 1
Parbery-Clark, A., Skoe, E., Lam, C., and Kraus, N. (2009). Musician enhancementfor speech-in-noise. Ear and Hearing, 30(6), 653–661. 27, 28, 29, 31, 35, 39,57, 58, 64, 65, 66, 70, 71
Parbery-Clark, A., Strait, D. L., Anderson, S., Hittner, E., and Kraus, N. (2011).Musical experience and the aging auditory system: implications for cognitiveabilities and hearing speech in noise. PLoS One, 6(5), e18082. 28, 70, 71
Patel, A. (2011). Why would musical training benefit the neural encoding ofspeech? The OPERA hypothesis. Frontiers in Psychology, 2(142), 1–14. 5
Patel, A. and Daniele, J. (2000). An empirical comparison of rhythm in languageand music. Cognition, 87, B35–B45. 35, 157
Patel, A. D. (2014). Can nonlinguistic musical training change the way the brainprocesses speech? The expanded OPERA hypothesis. Hearing Research, 308,98–108. 3, 5, 6, 153, 166

178 REFERENCES
Patel, A. D., Lofqvist, A., and Naito, W. (1999). The acoustics and kinematics ofregularly timed speech: A database and method for the study of the p-centerproblem. In Proceedings of the 14th International Congress of Phonetic Sciences,volume 1, pages 405–408. 77, 78
Peelle, J. E. and Davis, M. H. (2012). Neural oscillations carry speech rhythmthrough to comprehension. Frontiers in Psychology, 3. 160
Peretz, I., C. A. and Hyde, S. (2003). Varieties of musical disorders. Annals of theNew York Academy of Sciences, 999(1), 58–75. 41
Phillips-Silver, J. and Trainor, L. J. (2005). Feeling the beat: movement influencesinfant rhythm perception. Science, 308, 1430. 128
Phillips-Silver, J. and Trainor, L. J. (2007). Hearing what the body feels: auditoryencoding of rhythmic movement. Cognition, 105, 533–546. 128
Pichora-Fuller, M. K., Schneider, B. A., and Daneman, M. (1995). How young andold adults listen to and remember speech in noise. The Journal of the AcousticalSociety of America, 97(1), 593–608. 6, 24, 25, 26, 27
Pichora-Fuller, M. K. and Souza, P. E. (2003). Effects of aging on auditoryprocessing of speech. International Journal of Audiology, 42(S2), 11–16. 26
Pitt, M. A. and Samuel, A. G. (1990). The use of rhythm in attending to speech.Journal of Experimental Psychology: Human Perception and Performance, 16(3),564. 22, 72, 116, 117
Posner, M. (1980). Orienting of attention. Quarterly Journal of ExperimentalPsychology, 32, 3–25. 9, 10
Power, A. J., Mean, N., Barnes, L., and Goswami, U. (2012). Neural entrainmentto rhythmically presented auditory, visual and audio-visual speech in children.Frontiers in Psychology, 3, 216. 161, 163
Przybylski, L., Bedoin, N., Krifi-Papoz, S., Herbillon, V., Roch, D., Leculier,L., Kotz, S. A., and Tillmann, B. (2013). Rhythmic auditory stimulationinfluences syntactic processing in children with developmental languagedisorders. Neuropsychology, 27(1), 121–131. 164
Quene, H. (2007). On the just noticeable difference for tempo in speech. Journalof Phonetics, 35(3), 353–362. 76
Quene, H., Port, R. F., et al. (2005). Effects of timing regularity and metricalexpectancy on spoken-word perception. Phonetica, 62(1), 1–13. 23, 114, 116,117, 162
Rammsayer, T. and Altenmuller, E. (2006). Temporal information processing inmusicians and nonmusicians. Music Perception, 24(1), 37. 2
Rauscher, F. and Hinton, S. (2003). Type of music training selectively influencesperceptual processing. In Proceedings of the European Society for the CognitiveSciences of Music. 31

REFERENCES 179
Rhebergen, K. S., Versfeld, N. J., and Dreschler, W. A. (2006). Extended speechintelligibility index for the prediction of the speech reception threshold influctuating noise. The Journal of the Acoustical Society of America, 120(6),3988–3997. 17, 18
Rimmele, J., J. H. and Sussman, E. (2011). Auditory target detection is affectedby implicit temporal and spatial expectations. Journal of Cognitive Neuroscience,23(5), 1136–1147. 21, 22
Ruggles, D. R., Freyman, R. L., and Oxenham, A. J. (2014). Influence of musicaltraining on understanding voiced and whispered speech in noise. PloS One, 9(1),e86980. 28, 32
Schmidt-Kassow, M. and Kotz, S. A. (2009). Attention and perceptual regularity inspeech. Neuroreport, 20(18), 1643–1647. 22, 35
Schneider, B., Daneman, M., and MK, P.-F. (2002). Listening in aging adults: fromdiscourse comprehension to psychoacoustics. Canadian Journal of ExperimentalPsychology, 56(3), 139–152. 25, 27
Schon, D., Magne, C., and Besson, M. (2004). The music of speech: music trainingfacilitates pitch processing in both music and language. Psychophysiology, 41,341–349. 2, 35
Schroeder, C. E., Lakatos, P., Kajikawa, Y., Partan, S., and Puce, A. (2008).Neuronal oscillations and visual amplification of speech. Trends in CognitiveSciences, 12(3), 106–113. 19
Seinfeld, S., Figueroa, H., Ortiz-Gil, J., and Sanchez-Vives, M. (2013). Effects ofmusic learning and piano practice on cognitive function, mood and quality oflife in older adults. Frontiers in Psychology, 4(810). 4
Seitz, J. A. (2005). Dalcroze, the body, movement and musicality. Psychology ofMusic, 33(4), 419–435. 129
Shahin, A. (2011). Neurophysiological influence of musical training on speechperception. Frontiers in Psychology, 2(126), 1–10. 3
Shannon, R. V., Zeng, F.-G., Kamath, V., Wygonski, J., and Ekelid, M. (1995).Speech recognition with primarily temporal cues. Science, 270(5234), 303–304.16, 18
Slater, J. and Kraus, N. (2015). The role of rhythm in perceiving speech in noise: acomparison of percussionists, vocalists and non-musicians. Cognitive Processing,Advanced online publication, doi:10.1007/s10339–015–0740–7. 31, 35, 42
Slater, J., Skoe, E., Strait, D. L., O’Connell, S., Thompson, E., and Kraus, N.(2015). Music training improves speech-in-noise perception: Longitudinalevidence from a community-based music program. Behavioural Brain Research,291, 244–252. 32
Slater, J., Tierney, A., and Kraus, N. (2013). At-risk elementary school childrenwith one year of classroom music instruction are better at keeping the beat.PLoS ONE, 8(10), e77250. 42, 72, 116, 128

180 REFERENCES
Strait, D. L., Kraus, N., Parbery-Clark, A., and Ashley, R. (2010). Musicalexperience shapes top-down auditory mechanisms: evidence from masking andauditory attention performance. Hearing research, 261(1), 22–29. 2
Stuart, A. (2005). Development of auditory temporal resolution in school-agechildren revealed by word recognition in continuous and interrupted noise. Earand Hearing, 26(1), 78–88. 24, 117
Stuart, A. (2008). Reception thresholds for sentences in quiet, continuous noise,and interrupted noise in school-age children. Journal of the American Academyof Audiology, 19(2), 135–146. 7, 24, 117
Stuart, A. and Butler, A. K. (2014). No learning effect observed for receptionthresholds for sentences in noise. American Journal of Audiology, 23, 227–231.138
Su, Y.-H. and Poppel, E. (2012). Body movement enhances the extractionof temporal structures in auditory sequences. Psychological research, 76(3),373–382. 128
Swaminathan, J., Mason, C., Streeter, T., Best, V., Kidd Jr, G., and Patel, A. (2015).Musical training, individual differences and the cocktail party problem. Scientificreports, 5, 11628–11628. 28, 29, 30, 47, 57, 70, 71
Sweetow, R. and Sabes, J. (2010). Auditory training and challenges associatedwith participation and compliance. Journal of the American Academy ofAudiology, 21(9), 586–593. 7
Thompson, E. C., White-Schwoch, T., Tierney, A., and Kraus, N. (2015). Beatsynchronization across the lifespan: intersection of developmental and musicalexperience. PLoS ONE, 10(6), e0128839. 72, 116
Tierney, A. and Kraus, N. (2013a). Neural responses to sounds presented on andoff the beat of ecologically valid music. Frontiers in Systems Neuroscience, 7, 14.159
Tierney, A. T. and Kraus, N. (2013b). The ability to tap to a beat relates to cognitive,linguistic, and perceptual skills. Brain and Language, 124(3), 225–231. 42
Trombetti, A., Hars, M., Herrmann, F. R., Kressig, R. W., Ferrari, S., and Rizzoli, R.(2011). Effect of music-based multitask training on gait, balance, and fall riskin elderly people: a randomized controlled trial. Archives of internal medicine,171(6), 525–533. 129, 130
Tye-Murray, N., Sommers, M., Mauze, E., Schroy, C., Barcroft, J., and Spehar, B.(2012). Using patient perceptions of relative benefit and enjoyment to assessauditory training. Journal of the American Academy of Audiology, 23, 623–634.7
van Wijngaarden, S. J., Steeneken, H. J. M., and Houtgast, T. (2002). Quantifyingthe intelligibility of speech in noise for non-native listeners. Journal of theAcoustical Society of America, 111(4), 1906–1916. 157

REFERENCES 181
Wagener, K. C. (2003). Factors influencing sentence intelligibility in noise. PhDthesis, Universitat Oldenburg. 48
Wagener, K. C. and Brand, T. (2005). Sentence intelligibility in noise for listenerswith normal hearing and hearing impairment: Influence of measurementprocedure and masking parameters. International Journal of Audiology, 44(3),144–156. 47, 48, 56, 62, 63
Wallentin, M., Nielsen, A. H., Friis-Olivarius, M., Vuust, C., and Vuust, P. (2010).The Musical Ear Test, a new reliable test for measuring musical competence.Learning and Individual Differences, 20(3), 188–196. 42, 61
Warren, R. M. et al. (1970). Perceptual restoration of missing speech sounds.Science, 167(3917), 392–393. 16
Wechsler, D. (1999). Wechsler abbreviated scale of intelligence. PsychologicalCorporation. 59, 133
Wechsler, D. (2008). Wechsler adult intelligence scale. San Antonio, TX: NCSPearson. 60
Werner, L. A., Parrish, H. K., and Holmer, N. M. (2009). Effects of temporaluncertainty and temporal expectancy on infants’ auditory sensitivity. The Journalof the Acoustical Society of America, 125, 1040. 19, 76, 91
Wright, B. A. and Fitzgerald, M. B. (2004). The time course of attention in a simpleauditory detection task. Perception & Psychophysics, 66(3), 508–516. 19
Wright, R. and Ward, L. (2008). Orienting of Attention. New York: OxfordUniversity Press, Inc. 10, 11
Zachopoulou, E., Derri, V., Chatzopoulos, D., and Ellinoudis, T. (2003).Application of Orff and Dalcroze activities in preschool children: Do they affectthe level of rhythmic ability? Physical Educator, 60(2), 50. 129
Zekveld, A. A., George, E. L., Kramer, S. E., Goverts, S. T., and Houtgast, T.(2007). The development of the text reception threshold test: a visual analogueof the speech reception threshold test. Journal of Speech, Language, and HearingResearch, 50(3), 576–584. 17
Zendel, B. R. and Alain, C. (2009). Concurrent sound segregation is enhanced inmusicians. Journal of Cognitive Neuroscience, 21(8), 1488–1498. 2
Zendel, B. R. and Alain, C. (2012). Musicians experience less age-related declinein central auditory processing. Psychology and Aging, 27(2), 410. 28, 39, 57
Ziegler, J. C., Pech-Georgel, C., George, F., and Lorenzi, C. (2009).Speech-perception-in-noise deficits in dyslexia. Developmental Science, 12(5),732–745. 7, 25, 156
Zion Golumbic, E. M., Poeppel, D., and Schroeder, C. E. (2012). Temporal contextin speech processing and attentional stream selection: a behavioral and neuralperspective. Brain and Language, 122(3), 151–161. 19