musculoskeletal disorders and associated factors in …
TRANSCRIPT

MUSCULOSKELETAL DISORDERS AND ASSOCIATED FACTORS IN
NURSES AND BANK WORKERS IN SOUTH AFRICA
Busisiwe Nyantumbu-Mkhize
A thesis submitted to the faculty of Health Sciences, University of Witwatersrand, in
fulfilment of the requirements for the degree of Doctor of Philosophy
Johannesburg, 2017

ii
DECLARATION
I, Busisiwe Nyantumbu-Mkhize declare that this thesis is my own, unaided work. It is
being submitted for the Degree of Doctor of Philosophy at the University of
Witwatersrand, Johannesburg. It has not been submitted before for any degree or
examination at any other University.
Signature of candidate
6th day of April 2017 in Johannesburg
iii
DEDICATION
Omniscient
Creator of all living things
My siblings and late parents who have always been sources of inspiration
My husband Themba and family for being pillars of strength
Nyantumbu and Mkhize families for instilling
tenacity
iv
PRESENTATIONS ARISING FROM THIS STUDY
Nyantumbu, B. Kielkowski, D. and Rees, D., 2009. Musculoskeletal disorders in
nurses and bank workers in South Africa. In: Proceedings of the 29th ICOH
International Congress on Occupational Health, Cape Town International Convention
Centre, South Africa, 22-27 March, 2009.
Nyantumbu, B. Kielkowski, D. and Rees, D., 2009. Musculoskeletal disorders in
nurses and bank workers in South Africa. National Institute for Occupational Health,
Research Day 14 May, 2009.
Nyantumbu, B. Kielkowski, D. and Rees, D., 2009. Musculoskeletal disorders in
nurses and bank workers in South Africa. University of Witwatersrand, School of
Public Health Research Day, 28 May, 2009.
Nyantumbu, B. Kielkowski, D. and Rees, D., 2010. Musculoskeletal disorders in
South African nurses. National Institute for Occupational Health, Research Day, 28
April, 2010.
Nyantumbu, B. Kielkowski, D. and Rees, D., 2010. The occurrence of musculo-
skeletal disorders in South African nurses. In: Proceedings of the 7th International
Conference on Prevention of Work-related Musculoskeletal Disorders, Premus,
Angers, France 29 August-3 September, 2010.
Nyantumbu, B. Kielkowski, D. and Rees, D., 2011. Musculoskeletal disorders in
nurses from two hospitals in South Africa: A CUPID study. Occupational and
Environmental Medicine, 68(Suppl 1), pp.A70-A70.
v
Nyantumbu, B. Kielkowski, D. and Rees, D., 2012. Musculoskeletal disorders in
nurses from two public hospitals in Gauteng. University of the Witwatersrand, School
of Public Health Academic Meeting, 18 May, 2012.
Rees D. Nyantumbu B. and Coggon D., 2016. Musculoskeletal disorders at baseline
and after a year in South African nurses. In: Proceedings of the 25th EPICOH
Epidemiology in Occupational Health Conference, Barcelona, Spain, 4-7 September,
2016.
vi
ABSTRACT
Background
Work has long been suspected of being involved in the genesis of musculoskeletal
disorders. These disorders have been found to affect a significant proportion of the
working population. Certain occupational groups across different industries are at a
particular risk of musculoskeletal disorders possibly, due to the nature of their work,
including nurses and bank workers. In South Africa, there is a paucity of information
regarding musculoskeletal disorder risk factors in these two occupational groups.
Additionally, no follow-up studies have been conducted to examine incident (new
onset) and persistent pain and socio-cultural factors potentially associated with
musculoskeletal pain. The research reported in this thesis was conducted in public
hospital nurses and call centre bank workers.
Objectives
To determine the 12-month prevalences and body site localisation of reported
musculoskeletal disorders in South African public hospital nurses and bank
workers.
To characterise the features and consequences of prevalent musculoskeletal
disorders in South African public hospital nurses and bank workers.
To identify the risk factors associated with prevalent musculoskeletal
disorders in South African public hospital nurses and bank workers.
To determine incident and persistent musculoskeletal disorders in South
African public hospital nurses.

vii
To identify the risk factors associated with persistent musculoskeletal
disorders in South African public hospital nurses.
Methods
The study had a baseline cross-sectional component which included both nurses
and bank workers and a follow-up component ranging from 11.2-13.0 months from
baseline which covered nurses. The main data collection tools were the modified
CUPID baseline and follow-up questionnaires which were composites of
standardised and validated instruments. Since the questionnaires were written in
English, the baseline questionnaire was piloted in a suitable group of workers not
earmarked for the study, for clarity and comprehension of questions and the time it
would take to administer one questionnaire. After making the necessary changes,
the baseline questionnaire was administered through interviews to 488 South African
workers comprising 252 nurses and 236 bank workers who provided informed
consent to participate in the study. Information about demographic characteristics,
potential musculoskeletal disorder risk factors and occurrence of musculoskeletal
disorders and their associated consequences was collected. At follow-up, 189
nurses (75.3%) who had participated at baseline were successfully re-interviewed
about the occurrence of musculoskeletal disorders a month before the follow-up
period.
The collected data were cleaned and prepared for analysis. Descriptive statistics
were generated followed by the selection of explanatory variables to be included in
the multiple logistic regression. These variables were used to build partial models
with age group, sex and occupational group. Variables with p-values ≤ 0.2 were

viii
selected for the full models. The full models were run to produce final models which
contained variables with p-values < 0.05.
Results
Prevalence and characteristics of musculoskeletal disorders in South
African workers, public hospital nurses, and bank workers
The estimated 12-month prevalences (95% CI) of musculoskeletal disorders
reported by the South African workers, public hospital nurses, and bank workers
were high at 80.5% (77.0%-84.0%), 84.1% (79.5%-88.6%) and 76.7% (71.3%-
82.1%), respectively. The most prevalent pain was in the low back (56.9%, 58.2%
and 55.5%) and the least prevalent in the elbows (14.3%, 13.2% and 15 7%). More
than half (58.6%, 64.9% and 51.4%) of the workers who reported pain in different
body sites consulted healthcare providers for pain. Conservative estimates of sick
leave days taken by each worker in the past 12 months due to musculoskeletal
disorder pain were 2.2, 2.4 and 1.9 days for all workers, nurses and bank workers,
respectively.
Risk factors for musculoskeletal disorders in South African workers,
public hospital nurses and bank workers
Somatising tendency
In South African workers, somatising tendency was associated with the reporting of
pain in all body sites considered in the study. The associations with pain in “any”
body site ORs (95% CI) 2.23 (1.15-4.31); 3.52 (1.84-6.72) and low back 1.81 (1.07-
3.03); 2.72 (1.69-4.40), demonstrated increasing trends when the effect of one and
two distressing somatic symptoms was compared to no symptoms, respectively. In
public hospital nurses, it was associated with pain in four body sites which included
“any” body site 6.58 (1.76-24.47) and knees 2.80 (1.33-5.86) and in bank workers, in

ix
six body sites which included “any” body site 3.17 (1.40-7.19) and low back 2.56
(1.22-5.36) when the effect of two or more distressing somatic symptoms was
compared to no symptoms.
Sex
“Women” in South African workers and bank workers was associated with pain in the
upper limbs constituted by shoulders 1.83 (1.04-3.37); 1.90 (1.01-3.59) and wrists or
hands 2.28 (1.09-4.74); 2.53 (1.11-5.75) compared to men, respectively.
Age group
In South African workers, age groups (40-49 and ≥50 years) demonstrated
increasing trends with pain in the shoulders 2.23 (1.27-3.90); 2.40 (1.21-4.79) and
knees 2.18 (1.16-4.09); 2.50 (1.16-5.38), respectively. In public hospital nurses, age
group (40-49 years) was associated with pain in the shoulders 4.70 (1.15-19.10) and
age group (≥50 years) with pain in “any” body site 2.67 (1.09-6.54). In bank workers,
an increasing trend with age groups (40-49 and ≥50 years) was demonstrated with
pain in the knees 2.91 (1.19-7.10) and 4.04 (1.32-12.38), respectively. The effect of
each age group was compared to <30 years age group.
Occupational group
Occupational group (bank workers) was associated with pain in the neck 1.66 (1.04-
2.67) but no positive association was found with pain in “any” body site 0.51 (0.27-
0.96) compared to nurses.

x
Incident and persistent musculoskeletal disorders in public hospital
nurses
Incident “any” musculoskeletal disorders (95% CI) were estimated at 47.6% (36.5%-
58.6%) with incident low back pain affecting the largest percentage of nurses
(32.8%) and incident elbow pain (8.5%) the lowest. Persistent “any” musculoskeletal
disorders (95% CI) were estimated at 83.7% (76.2%-91.1%) with persistent knee
pain affecting most nurses (71.4%) and persistent elbow pain the least number of
nurses (36.4%).
Risk factor for persistent musculoskeletal disorders in public hospital
nurses
Somatising tendency was associated with persistent pain in “any" body site 7.32
(1.34-39.88) when the effect of two or more distressing somatic symptoms was
compared to no symptoms.
Ethnicity
Ethnic group was associated with wrists or hands and low back. In all workers,
Nguni and “other” ethnic groups were associated with wrists or hands 1.85 (1.08-
3.18); 2.02 (1.09-3.72) and in bank workers 3.75 (1.41-9.97); 2.87 (1.13-7.28),
respectively. In nurses, the “other” ethnic group was associated with wrists or hands
2.81 (1.07-7.39). In all workers, “other” ethnic group was associated with low back
1.86 (1.07-3.34) and in bank workers 2.43 (1.16-5.08). The effect of ethnic groups
was compared to the Sotho group.
Conclusions
The study found a high burden of musculoskeletal disorders in the two groups of
workers studied with pain in the low back being the most prevalent. The large
xi
proportions of workers, who consulted healthcare providers and took time off from
work due to musculoskeletal disorders, indicate the negative impact that these
disorders may have on the affected workers and their places of work. The main risk
factors emerging from this research belong to the individual dimension of musculo-
skeletal disorder risk factors. This may signal their importance in the development
and persistence of these disorders. Furthermore, they may need to be considered in
any effort to address musculoskeletal disorders in the groups of workers studied.
This study failed to provide convincing evidence of association between ethnicity and
musculoskeletal disorders in the groups studied.
xii
ACKNOWLEDGEMENTS
My sincere gratitude goes to the individuals and organizations that contributed in
different ways to the realization of the study which has been captured in this thesis:
Professor David Rees, Head of Occupational Medicine and Epidemiology
Division, NIOH, Supervisor of this thesis; for bringing in light in the midst of
darkness.
Dr Danuta Kielkowski, former Head of Occupational Epidemiology and
Surveillance Section, NIOH, Supervisor of this thesis; for constant
encouragement; may her soul have eternal peace.
Professor David Coggon, Professor of Occupational and Environmental
Medicine, Medical Research Council, Lifecourse Epidemiology Unit,
University of Southampton, United Kingdom; for providing guidance in the
initial data analysis planning stage of the study.
Ms Georgia Ntani, Medical Statistician, Medical Research Council, Lifecourse
Epidemiology Unit, University of Southampton United Kingdom; for assistance
in the generation of new variables for the study data set.
Professor Jonathan Levin, Head of Statistics Section, Medical Research
Council, Uganda; for providing statistical assistance in specialised statistical
techniques.
xiii
Professor Brendan Girdler-Brown, Extra Ordinary Professor, School of Health
Systems and Public Health, University of Pretoria; for providing specialised
statistical assistance.
Professor Freddy Sitas; Director of Cancer Research, Division of Cancer
Council, University of New South Wales; for reviewing and giving advice on
multiple logistic regression tables on MSDs.
The staff members in the Epidemiology and Surveillance Section at NIOH; for
general statistical assistance.
The management of the two hospitals and bank; for granting permission to
conduct the study and the respective staff members who assisted in the co
ordination of the interviews.
The nurses and bank workers; for giving their consent to participate in the
study.
The Colt Foundation in the United Kingdom; for providing funding for data
collection in the study.
The National Institute for Occupational Health, Occupational Medicine
Section; for providing man-hours and resources for the execution of the study.

xiv
NOMENCLATURE AND ABBREVIATIONS
“Any” pain Reports of pain in the selected body sites in the study
that is, low back, neck, shoulders, elbows, wrists or
hands and knees
CC Call Centre
Call Centre A work environment in which the main business is
conducted via a telephone whilst simultaneously using
display screen equipment
CCC Credit Card Collection
Computer-telephone Tasks in which computers and telephones are
interactive tasks used simultaneously with the objective of developing
standardised and continuous actions of marketing or to
manage communication with clients, public or
government agencies
CTI Computer-telephone interaction
CUPID Cultural and Psychological influences on Disability
Ethnicity Social or cultural heritage that a particular group shares
in terms of customs, language, values, religion, social ties
and habits passed down from one generation to the next
HLC Home Loan Collection

xv
Incident pain Reporting no pain at baseline and reporting pain at
follow-up interview in one or a combination of the
following body sites: low back, neck, shoulders, elbows,
wrists or hands, knees or upper limbs
Job dissatisfaction Negative emotional reactions and attitudes individuals
have towards their job
MSDs Musculoskeletal disorders
Multi-site pain Pain occurring at three or more sites
Musculoskeletal disorders Pain occurring in one or combination of the following
body sites: low back, neck, shoulders, elbows,
wrists/hands, knees or upper limbs lasting for more than
a day either in the past 12 months or past month
Nguni group Consists of Xhosa and Zulu ethnic groups
NIOH National Institute for Occupational Health
“Other” group Consists of Afrikaner, Coloured, Indian, Tsonga and
Venda ethnic groups
Persistent pain Reporting pain at baseline and at follow-up interviews
occurring at the following body sites: low back, neck,
shoulders, elbows, wrists or hands, knees or upper limbs

xvi
SA South Africa
Sotho group Consists of Pedi, Sotho and Tswana ethnic groups
South African workers Combination and analyses of South African public
hospital nurses and bank workers data
Somatising tendency A general elevated awareness of somatic symptoms and
tendency to attribute such symptoms to physical illness
Upper limbs One or a combination of the following body sites:
shoulders, elbows and wrists/hands
Workstyle The way in which the worker performs his or her work
tasks in reaction to increased work demands which may
contribute to the aetiology, exacerbation and/or
maintenance of musculoskeletal disorders.
1
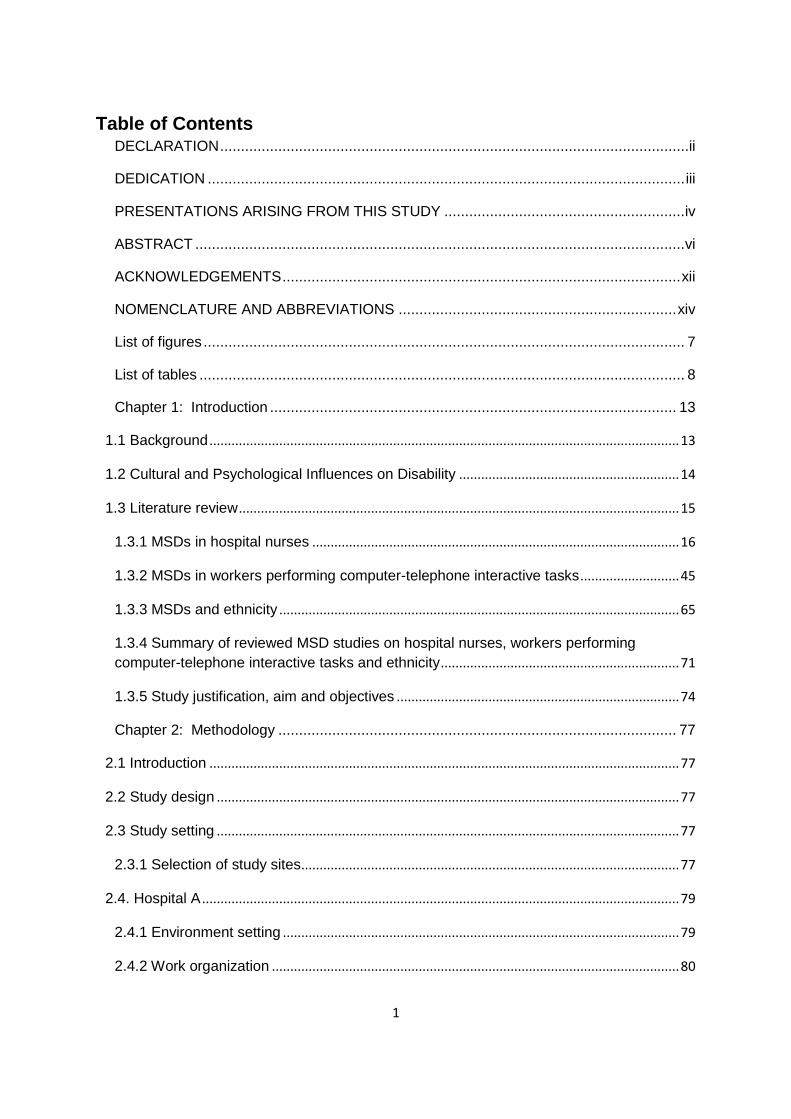
Table of Contents DECLARATION .................................................................................................................ii
DEDICATION ................................................................................................................... iii
PRESENTATIONS ARISING FROM THIS STUDY .......................................................... iv
ABSTRACT ...................................................................................................................... vi
ACKNOWLEDGEMENTS ................................................................................................ xii
NOMENCLATURE AND ABBREVIATIONS ................................................................... xiv
List of figures .................................................................................................................... 7
List of tables ..................................................................................................................... 8
Chapter 1: Introduction .................................................................................................. 13
1.1 Background ................................................................................................................................ 13
1.2 Cultural and Psychological Influences on Disability ............................................................ 14
1.3 Literature review ........................................................................................................................ 15
1.3.1 MSDs in hospital nurses .................................................................................................... 16
1.3.2 MSDs in workers performing computer-telephone interactive tasks ........................... 45
1.3.3 MSDs and ethnicity ............................................................................................................. 65
1.3.4 Summary of reviewed MSD studies on hospital nurses, workers performing
computer-telephone interactive tasks and ethnicity ................................................................. 71
1.3.5 Study justification, aim and objectives ............................................................................. 74
Chapter 2: Methodology ................................................................................................ 77
2.1 Introduction ................................................................................................................................ 77
2.2 Study design .............................................................................................................................. 77
2.3 Study setting .............................................................................................................................. 77
2.3.1 Selection of study sites ....................................................................................................... 77
2.4. Hospital A .................................................................................................................................. 79
2.4.1 Environment setting ............................................................................................................ 79
2.4.2 Work organization ............................................................................................................... 80
2
2.5 Hospital B ................................................................................................................................... 80
2.5.1 Environment setting ............................................................................................................ 80
2.5.2 Work organization ............................................................................................................... 81
2.6 The bank ..................................................................................................................................... 81
2.6.1 Environment setting ............................................................................................................ 81
2.6.2 Work organization ............................................................................................................... 82
2.7 Study population........................................................................................................................ 83
2.7.1 Hospitals A and B ................................................................................................................ 83
2.7.2 The bank ............................................................................................................................... 83
2.8 Sample size estimation ............................................................................................................ 84
2.9 Selection of study participants ................................................................................................ 84
2.9.1 Hospitals A and B ................................................................................................................ 84
2.9.2 The bank ............................................................................................................................... 85
2.10 Preparation for study implementation .................................................................................. 85
2.10.1 Hospital A ........................................................................................................................... 85
2.10.2 Hospital B ........................................................................................................................... 86
2.10.3 The bank ............................................................................................................................ 86
2.11 Data collection tools ............................................................................................................... 86
2.11.1 Questionnaires .................................................................................................................. 86
2.12 Pilot study ................................................................................................................................. 90
2.13 Interviewer training ................................................................................................................. 90
2.14 Overview of data collection ................................................................................................... 91
2.14.1 Data collection at baseline ............................................................................................... 91
2.14.3 Weight and height measurements.................................................................................. 92
2.15 Quality assurance ................................................................................................................... 93
2.16 Data management .................................................................................................................. 93
2.17 Data analysis ........................................................................................................................... 94
3
2.17.1 Descriptive statistics ......................................................................................................... 95
2.17.2 Statistical testing ............................................................................................................... 95
2.17.3 Multiple regression analysis ............................................................................................ 95
2.18 Ethical considerations ............................................................................................................ 98
Chapter 3: Cross-sectional study of the South African public hospital nurses and bank
workers ......................................................................................................................... 100
3.1 Introduction .............................................................................................................................. 100
3.2 Description of the South African workers ............................................................................ 100
3.2.1 Individual physical and psychosocial characteristics ................................................... 100
3.2.2 Individual psychological characteristics ......................................................................... 102
3.2.3 Physical workplace activities ........................................................................................... 103
3.2.4 Psychosocial aspects of work ......................................................................................... 105
3.3 Occurrence of MSDs in the South African workers in the past 12 months .................... 106
3.3.1 Prevalence of MSDs in the past 12 months .................................................................. 106
3.3.2 Features associated with MSDs ..................................................................................... 107
3.4 Risk factors associated with MSDs ...................................................................................... 110
3.4.1 Multiple regression analysis of MSD pain in the past 12 months with possible risk
factors in the South African workers ........................................................................................ 111
Chapter 4: Cross-sectional and follow-up studies of the South African public hospital
nurses .......................................................................................................................... 148
Part 1: Cross-sectional study of the South African public hospital nurses .................... 148
4.1 Introduction .............................................................................................................................. 148
4.2 Description of the South African public hospital nurses .................................................... 148
4.2.1 Individual physical and psychosocial characteristics ................................................... 149
4.2.2 Individual psychological characteristics ......................................................................... 150
4.2.3 Physical workplace activities ........................................................................................... 152
4.2.4 Psychosocial aspects of work ......................................................................................... 153
4.3 Occurrence of MSDs in the South African public hospital nurses ................................... 154
4
4.3.1 Prevalence of MSDs in the past 12 months .................................................................. 154
4.3.2 Features associated with MSDs ..................................................................................... 155
4.4 Risk factors associated with MSDs in the South African public hospital nurses ........... 158
4.4.1 Multiple regression analysis of MSD pain in the past 12 months with possible risk
factors in the South African public hospital nurses ................................................................ 158
Part 2: Follow-up study of the South African public hospital nurses ............................. 179
4.5 Introduction .............................................................................................................................. 179
4.6 Participation and response rates according to baseline MSD risk factors in the South
African public hospital nurses ...................................................................................................... 179
4.6.1 MSD risk factors ................................................................................................................ 179
4.7 Participation and response rates according to 1-month MSD prevalence at baseline in
the South African public hospital nurses .................................................................................... 180
4.8 Occurrence of MSDs at follow-up interview in the South African public hospital nurses
.......................................................................................................................................................... 182
4.8.1 Incident and persistent MSD pain in the South African public hospital nurses at
follow-up interview....................................................................................................................... 183
4.8.2 Incident MSD pain in the South African public hospital nurses ................................. 183
4.8.3 Persistent MSD pain in the South African public hospital nurses .............................. 184
4.9 Risk factors associated with MSDs at follow-up interview in the South African public
hospital nurses ............................................................................................................................... 185
4.9.1 Multiple regression of incident and persistent pain with possible risk factors in the
South African public hospital nurses ........................................................................................ 185
Chapter 5: Cross-sectional study of the South African bank workers ............................ 188
5.1 Introduction .............................................................................................................................. 188
5.2 Description of the South African bank workers .................................................................. 188
5.2.1 Individual physical and psychosocial characteristics ................................................... 188
5.2.2 Individual psychological characteristics ......................................................................... 189
5.2.3 Physical workplace activities ........................................................................................... 191
5.2.4 Psychosocial aspects of work ......................................................................................... 193
5.3 Occurrence of MSDs in the South African bank workers.................................................. 194
5
5.3.1 Prevalence of MSDs in the past 12 months .................................................................. 194
5.3.2 Features associated with MSD pain ............................................................................... 194
5.4 Risk factors associated with MSDs in the past 12 months in the South African bank
workers ............................................................................................................................................ 198
5.4.1 Multiple regression of MSD pain with possible risk factors in the South African bank
workers ......................................................................................................................................... 198
Chapter 6: Discussion .................................................................................................. 221
6.1 Introduction .............................................................................................................................. 221
6.2 Prevalences and body site localisation of MSDs ............................................................... 223
6.2.1 South African workers ...................................................................................................... 223
6.2.2 Public hospital nurses ....................................................................................................... 224
6.2.3 Bank workers ....................................................................................................... 226
6.3 Characteristics of MSDs ...................................................................................................... 227
6.3.1 South African workers ...................................................................................................... 227
6.3.2 Public hospital nurses ....................................................................................................... 228
6.3.3 Bank workers ..................................................................................................................... 229
6.4 Risk factors for prevalent MSDs ......................................................................................... 230
6.4.1 Somatising tendency ........................................................................................................ 230
6.4.2 Past injuries ........................................................................................................................ 233
6.4.3 Sex ...................................................................................................................................... 235
6.4.4 Age group ........................................................................................................................... 238
6.4.5 Occupational group ........................................................................................................... 240
6.5 Physical and psychosocial work risk factors ....................................................................... 241
6.5.1 South African workers ...................................................................................................... 241
6.6 Follow-up study on public hospital nurses .......................................................................... 243
6.6.1 Incident MSDs ................................................................................................................... 243
6.6.2 Persistent MSDs ................................................................................................................ 244
6.6.3 Risk factors for persistent MSDs .................................................................................... 246
6
6.7 Ethnicity as a possible risk factor for MSDs in the study .................................................. 247
6.8 Strengths and limitations of the study .................................................................................. 249
6.8.1 Strengths ............................................................................................................................ 249
6.8.2 Limitations .......................................................................................................................... 250
6.9 Contribution to existing knowledge....................................................................................... 256
6.10 Conclusions ........................................................................................................................... 258
References ................................................................................................................... 260
Appendix A: Search strategy for literature on MSDs in hospital nurses and workers
involved in CTI tasks .................................................................................................... 273
Appendix B: National Academies Press permission letter ............................................ 275
Appendix C: Study information sheet ........................................................................... 276
Appendix D: Study consent form ................................................................................. 277
Appendix E: Baseline questionnaire ............................................................................ 278
Appendix F: Follow-up questionnaire ........................................................................... 289
Appendix G: University of Pretoria ethics certificate ..................................................... 293
Appendix H: University of Witwatersrand ethics certificate ........................................... 294
Appendix I: Variables tested for full model in SA workers ............................................ 295
Appendix J: Variables tested for full model in SA nurses ............................................. 297
Appendix K: Participation and response rates ............................................................. 299
Appendix L: Variables tested for full model in SA nurses ............................................. 302
Appendix M: Variables tested for full model in SA bank workers.................................. 304
7
List of figures Figure 1.1: Conceptual model of the possible involvement of MSD risk factors in the ............ genesis of MSDs ................................................................................................................. 24 Figure 1.2: Categories of MSD risk factors extracted from the literature on MSDs in hospital nurses and workers performing computer-telephone interactive tasks ................................ 72 Figure 2.1: Gauteng ethnic groups ..................................................................................... 78 Figure 3.1: 12-month prevalence of reported MSD pain by body site in the SA workers .... 107 Figure 3.2: Number of painful body sites reported by the SA workers .............................. 108 Figure 3.3: Number of days with pain reported by the SA workers .................................... 108 Figure 3.4: Number of days away from work with pain reported by the SA workers ......... 109 Figure 3.5: Consultation for pain in different body sites reported by the SA workers ........ 110 Figure 4.1:12-month prevalence of MSDs reported by the SA public hospital nurses ........ 154 Figure 4.2: Number of painful body sites reported by the SA public hospital nurses .......... 155 Figure 4.3: Number of days with site specific pain reported by the SA public hospital nurses ......................................................................................................................................... 156 Figure 4.4: Number of days away from work with pain reported by the SA public hospital nurses ............................................................................................................................... 157 Figure 4.5: Consultation for pain reported by the SA public hospital nurses......................159 Figure 4.6: Incident pain in SA public hospital nurses ...................................................... 184 Figure 4.7: Persistent pain in the SA public hospital nurses ............................................. 184 Figure 5.1: 12-month prevalence of MSDs reported by SA bank workers ......................... 194 Figure 5.2: Number of painful body sites reported by SA bank workers ........................... 195 Figure 5.3: Number of days with pain reported by SA bank workers ................................ 196 Figure 5.4: Number of days away from work reported by SA bank workers ...................... 197 Figure 5.5: Consultation for pain in different body sites reported by SA bank workers ...... 197 Figure 6.1: Dimensions of MSD risk factors identified in the South African study ............. 259

8
List of tables Table 1.1: Summary of studies on the prevalence and body site localisation of musculoskeletal pain in hospital nurses .............................................................................. 18 Table 1.2: Summary of studies on risk factors for prevalent musculoskeletal disorders in hospital nurses .................................................................................................................... 27 Table 1.3: Summary of studies on risk factors for incident and persistent pain in hospital nurses and other occupational groups ................................................................................ 39 Table 1.4: Summary of studies on the prevalence and body site localisation of musculoskeletal pain in workers performing computer-telephone interactive tasks ............. 48 Table 1.5: Risk factors for musculoskeletal disorders in workers performing computer-telephone interactive tasks .................................................................................................. 59 Table 2.1: Inclusion criteria for nurses in the study ............................................................. 83 Table 2.2: Inclusion criteria for bank workers in the study .................................................. 84 Table 2.3: Overview of the baseline questionnaire .............................................................. 87 Table 2.4 Overview of the follow-up questionnaire .............................................................. 89 Table 2.5: Explanatory variables used in the study ............................................................ 96 Table 2.6: Physically demanding work activities on an average working day with corresponding body site ...................................................................................................... 97 Table 3.1: Individual physical and psychosocial characteristics of the SA workers ........... 101 Table 3.2: Individual psychological characteristics of the SA workers .............................. 102 Table 3.3: Physically demanding activities on an average day in the jobs of the SA workers ......................................................................................................................................... 104 Table 3.4: Stressful psychosocial work conditions in the jobs of the SA workers .............. 105 Table 3.5: Multiple regression of “any” pain in the past 12 months with possible risk factors in the SA workers: Partial and full models ......................................................................... 113 Table 3.6: Multiple regression of “any” pain in the past 12 months with possible risk factors and predicted prevalences in the SA workers: Final model .............................................. 115 Table 3.7: Linear trend in the ORs of the number of distressing somatic symptoms in the final model of “any” pain in the SA workers ............................................................................... 116 Table 3.8: Multiple regression of low back pain in the past 12 months with possible risk factors in the SA workers: Partial and full models ............................................................. 118 Table 3.9: Multiple regression of low back pain in the past 12 months with possible risk factors and predicted prevalences in the SA workers: Final model ................................... 120
9
Table 3.10: Linear trend in the ORs of the number of distressing somatic symptoms in the final model of low back pain in the SA workers.................................................................. 122 Table 3.11: Multiple regression of neck pain in the past 12 months with possible risk factors in the SA workers: Partial and full models ........................................................................ 123 Table 3.12: Multiple regression of neck pain in the past 12 months with possible risk factors and predicted prevalences in the SA workers: Final model .............................................. 125 Table 3.13: Multiple regression of shoulder pain in the past 12 months with possible risk ...... factors in the SA workers: Partial and full models ............................................................. 126 Table 3.14: Multiple regression of shoulder pain in the past 12 months with possible risk ...... factors and predicted prevalences in the SA workers: Final model ................................... 128 Table 3.15: Linear trend in the ORs of age group in the final model of shoulder pain in the South African workers ....................................................................................................... 130 Table 3.16: Multiple regression of elbow pain in the past 12 months with possible risk factors in the SA workers: Partial and full models ........................................................................ 131 Table 3.17: Multiple regression of elbow pain in the past 12 months with possible risk factors and predicted prevalences in the SA workers: Final model .............................................. 133 Table 3.18: Multiple regression of wrist or hand pain in the past 12 months with possible ...... risk factors in the SA workers: Partial and full models ...................................................... 134 Table 3.19: Multiple regression of wrist or hand pain in the past 12 months with possible ...... risk factors and predicted prevalences in the SA workers: Final model ............................ 135 Table 3.20: Multiple regression of upper limb pain in the past 12 months with possible ......... risk factors in the SA workers: Partial and full models ...................................................... 136 Table 3.21: Multiple regression of upper limb pain in the past 12 months with possible risk factors and predicted prevalences in the SA workers: Final model ................................... 138 Table 3.22: Multiple regression of knee pain in the past 12 months with possible risk factors in the SA workers: Partial and full models ........................................................................ 140 Table 3.23: Multiple regression of knee pain in the past 12 months with possible risk factors and predicted prevalences in the SA workers: Final model .............................................. 142 Table 3.24: The linear trend in the ORs of age group in the final model of knee pain in the SA workers ....................................................................................................................... 143 Table 3.25: Statistically significant risk factors from final models of MSD pain in the past 12 months in South African workers ....................................................................................... 146 Table 4.1: Individual physical and psychosocial characteristics of the SA public hospital ....... nurses ............................................................................................................................... 149 Table 4.2: Individual psychological characteristics of the SA public hospital nurses ......... 151 Table 4.3: Physically demanding work activities of the SA public hospital nurses on an .........
10
average day ...................................................................................................................... 152 Table 4.4: Stressful psychosocial work conditions of SA public hospital nurses ............... 153 Figure 4.5: Consultation for pain reported by the SA public hospital nurses ..................... 158 Table 4.5: Multiple regression of “any” pain in the past 12 months with possible risk factors in SA public hospital nurses: Partial and full models ......................................................... 159 Table 4.6: Multiple regression of “any” pain in the past 12 months with possible risk factors and predicted prevalences in the SA public hospital nurses: Final model .......................... 161 Table 4.7: Multiple regression of low back pain in the past 12 months with possible risk ........ factors in SA public hospital nurses: Partial and full models .............................................. 162 Table 4.8: Multiple regression of low back pain in the past 12 months with possible risk
factors and predicted prevalences in the SA public hospital nurses: Final model............... 164
Table 4.9: Multiple regression of neck pain in the past 12 months with possible risk factors in SA public hospital nurses: Partial and full models ......................................................... 165 Table 4.10: Multiple regression of neck pain in the past 12 months with possible risk factors and predicted prevalences in the SA public hospital nurses: Final model .......................... 166 Table 4.11: Multiple regression of shoulder pain in the past 12 months with possible risk factors in SA public hospital nurses: Partial and full models .............................................. 167 Table 4.12: Multiple regression of shoulder pain in the past 12 months with possible risk factors and predicted prevalences in SA public hospital nurses: Final model .................... 168 Table 4.13: Multiple regression of wrist or hand pain in the past 12 months with possible risk factors in SA public hospital nurses: Partial and full models .............................................. 169 Table 4.14: Multiple regression of wrist or hand pain in the past 12 months with possible risk factors and predicted prevalences in SA public hospital nurses: Final model ................... 170 Table 4.15: Multiple regression of upper limb pain in the past 12 months with possible risk factors in SA public hospital nurses: Partial and full model ................................................ 171 Table 4.16: Multiple regression of upper limb pain in the past 12 months with possible risk factors and predicted prevalences in SA public hospital nurses: Final model .................... 173 Table 4.17: Multiple regression of knee pain in the past 12 months with possible risk factors in SA public hospital nurses: Partial and full models ......................................................... 174 Table 4.18: Multiple regression of knee pain in the past 12 months with possible risk factors and predicted prevalences in SA public hospital nurses: Final model ................................ 175 Table 4.19: Statistically significant risk factors from final models of MSD pain in the past 12 months in SA public hospital nurses .................................................................................. 177 Table 4.20: Participation and response rates according to individual physical and psycho-social characteristics of SA public hospital nurses at baseline .......................................... 180
11
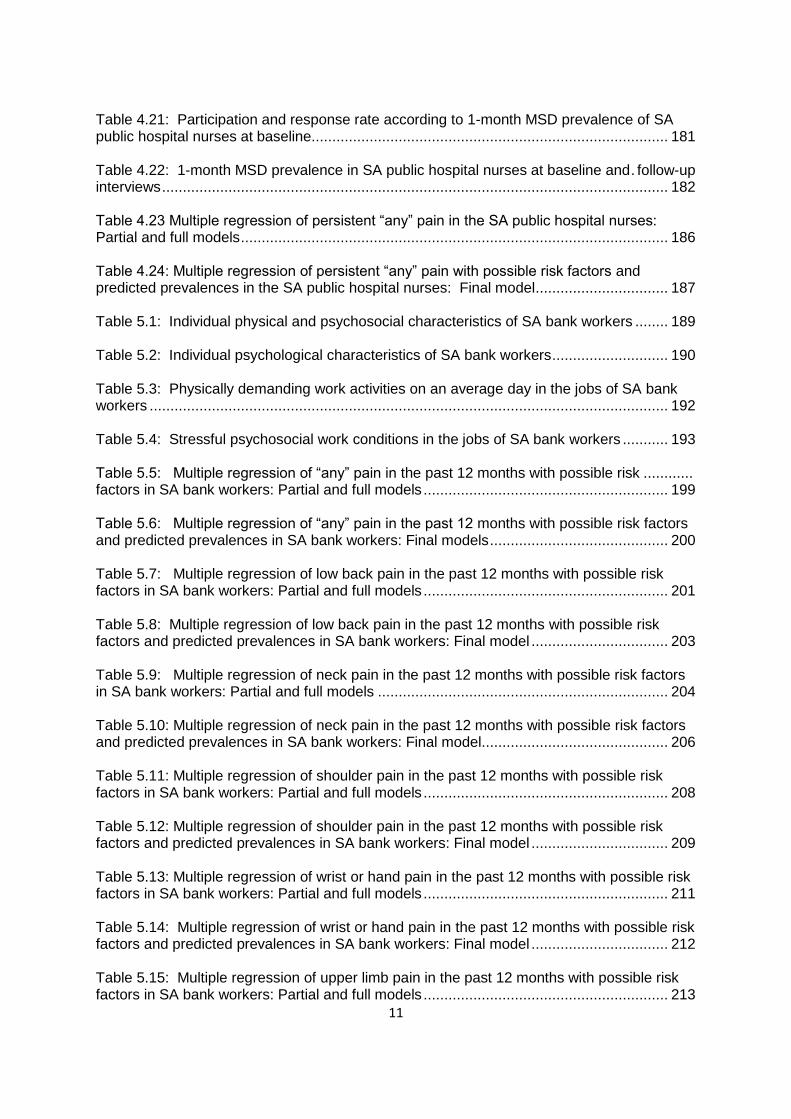
Table 4.21: Participation and response rate according to 1-month MSD prevalence of SA public hospital nurses at baseline...................................................................................... 181 Table 4.22: 1-month MSD prevalence in SA public hospital nurses at baseline and . follow-up interviews .......................................................................................................................... 182 Table 4.23 Multiple regression of persistent “any” pain in the SA public hospital nurses: Partial and full models ....................................................................................................... 186 Table 4.24: Multiple regression of persistent “any” pain with possible risk factors and predicted prevalences in the SA public hospital nurses: Final model ................................ 187 Table 5.1: Individual physical and psychosocial characteristics of SA bank workers ........ 189 Table 5.2: Individual psychological characteristics of SA bank workers ............................ 190 Table 5.3: Physically demanding work activities on an average day in the jobs of SA bank workers ............................................................................................................................. 192 Table 5.4: Stressful psychosocial work conditions in the jobs of SA bank workers ........... 193 Table 5.5: Multiple regression of “any” pain in the past 12 months with possible risk ............ factors in SA bank workers: Partial and full models ........................................................... 199 Table 5.6: Multiple regression of “any” pain in the past 12 months with possible risk factors and predicted prevalences in SA bank workers: Final models ........................................... 200 Table 5.7: Multiple regression of low back pain in the past 12 months with possible risk factors in SA bank workers: Partial and full models ........................................................... 201 Table 5.8: Multiple regression of low back pain in the past 12 months with possible risk factors and predicted prevalences in SA bank workers: Final model ................................. 203 Table 5.9: Multiple regression of neck pain in the past 12 months with possible risk factors in SA bank workers: Partial and full models ...................................................................... 204 Table 5.10: Multiple regression of neck pain in the past 12 months with possible risk factors and predicted prevalences in SA bank workers: Final model............................................. 206 Table 5.11: Multiple regression of shoulder pain in the past 12 months with possible risk factors in SA bank workers: Partial and full models ........................................................... 208 Table 5.12: Multiple regression of shoulder pain in the past 12 months with possible risk factors and predicted prevalences in SA bank workers: Final model ................................. 209 Table 5.13: Multiple regression of wrist or hand pain in the past 12 months with possible risk factors in SA bank workers: Partial and full models ........................................................... 211 Table 5.14: Multiple regression of wrist or hand pain in the past 12 months with possible risk factors and predicted prevalences in SA bank workers: Final model ................................. 212 Table 5.15: Multiple regression of upper limb pain in the past 12 months with possible risk factors in SA bank workers: Partial and full models ........................................................... 213
12
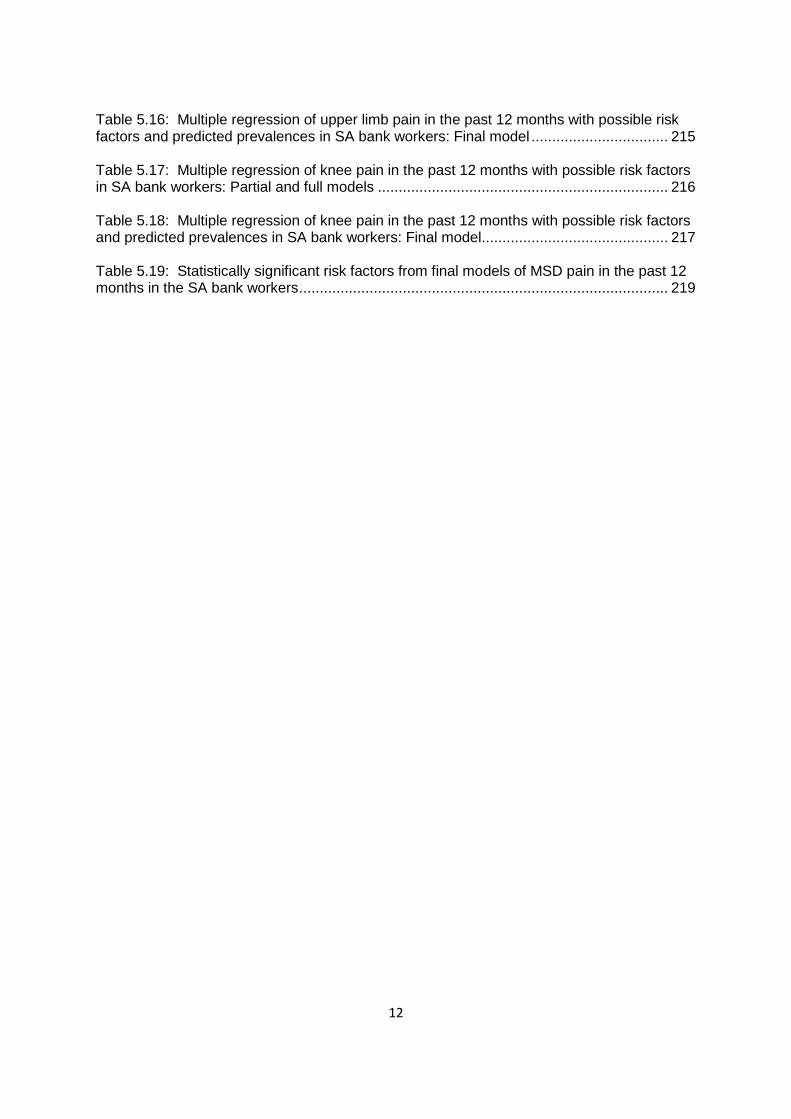
Table 5.16: Multiple regression of upper limb pain in the past 12 months with possible risk factors and predicted prevalences in SA bank workers: Final model ................................. 215 Table 5.17: Multiple regression of knee pain in the past 12 months with possible risk factors in SA bank workers: Partial and full models ...................................................................... 216 Table 5.18: Multiple regression of knee pain in the past 12 months with possible risk factors and predicted prevalences in SA bank workers: Final model............................................. 217 Table 5.19: Statistically significant risk factors from final models of MSD pain in the past 12 months in the SA bank workers ......................................................................................... 219
13
Chapter 1: Introduction
1.1 Background
Musculoskeletal disorders (MSDs) entail a wide array of inflammatory and
degenerative conditions affecting the muscles, tendons, joints, nerves and blood
vessels (Buckle and Devereux, 2002, Punnett and Wegman, 2004). In recent years
there has been heightened awareness of, and interest in MSDs as demonstrated by
the dramatic increase of research publications in this field. This comes as a
backdrop of hundreds of millions of people around the world who are affected by
MSDs (Woolf and Pfleger, 2003). Evidence linking MSDs to risk factors at the
workplace is accumulating (Armstrong et al., 1993, Bernard, 1997, Barondess et al.,
2001, Palmer et al., 2008), thus supporting the observations that MSDs are related
to work exposures made by Bernardino Ramazzini more than 300 years ago (Franco
and Fusetti, 2004). However, it is widely recognised that the aetiology of MSDs is
multifactorial; both work and non-work risk factors, including individual factors, are
implicated in their development. As such, socio-cultural factors such as ethnicity are
suspected of playing a role in the genesis of MSDs.
MSDs are one of the most common and costly public health problems in Europe and
North America (Aptel et al., 2002, Punnett and Wegman, 2004, Larsson et al., 2007).
They constitute a major component of occupational diseases in many countries
(Armstrong et al., 1996, Kang et al., 2014). In France, about two thirds of all
occupational diseases were MSDs of the upper limbs (Aptel et al., 2002). Neck and
upper limb MSDs accounted for approximately three quarters of all MSDs seen by
rheumatologists in the United Kingdom (Sim et al., 2006). In the United States of
America, the prevalence of MSDs of the upper limbs ranges from 20-30%, while
MSDs of the neck and upper limbs are responsible for a third of the workers’
14
compensation costs in private companies, and the estimated annual cost of MSDs
ranged from 45 to 54 billion dollars (Staal et al., 2007). Furthermore, about 32% of
cases of MSDs involving days away from work were as a result of overexertion and
repetitive movements (Bernard, 1997).
MSDs have been identified in many occupational groups across different industries
(Yassi, 2000, Franco and Fusetti, 2004). Nurses and workers involved in computer-
telephone interactive tasks are among the occupational groups with high
prevalences of MSDs (Crawford et al., 2008, Harcombe et al., 2009). The disability
associated with MSDs may limit the execution of normal daily life activities and,
importantly, the performance of work. Their recurrence and persistence often lead to
lost work days (Buckle and Devereux, 2002), work disability (March et al., 2014) and,
at worst, early retirement. The observed burden of MSDs worldwide has prompted
countries to develop strategies to address MSDs (Yassi, 2000) while others have
prioritised research on MSDs to elucidate existing uncertainties (Kang et al., 2014).
In South Africa, there is a paucity of information regarding the occurrence of MSDs
and their determinants which provides opportunities to design and conduct relevant
research to elucidate the burden of MSDs and associated factors.
1.2 Cultural and Psychological Influences on Disability (CUPID) project
The National Institute for Occupational Health in South Africa together with other
agencies, was invited by the Lifecourse Epidemiology Unit in the Medical Research
Council at Southampton University in the United Kingdom, to participate in the
CUPID project. This opened a window of opportunity for the execution of the current
study. Eighteen countries, including South Africa, participated in the CUPID project.
The project was developed to compare the prevalence and explore the incidence
15
and persistence of MSDs and associated disability in workers carrying out jobs with
similar physical demands in a range of cultural settings. All the CUPID collaborating
countries submitted their cleaned data based on set criteria to the CUPID project
central coordinating office in Southampton University for collation and analysis as
pooled data. Several papers have been published based on these data (Coggon et
al., 2012). In other countries, country specific data have been used for higher
degrees. In the case of South Africa, the South African data have been used in this
thesis.
1.3 Literature review
The literature on MSDs is voluminous, thus only studies that are pertinent to this
thesis were reviewed. The review covered MSD studies including CUPID studies
focussing on: 1) MSDs in hospital nurses and relevant studies on South African
nurses; 2) MSDs in workers performing computer-telephone interactive tasks; and 3)
MSDs and ethnicity.
The articles reviewed and presented in this thesis, were searched from Google
Scholar, PubMed and Science Direct databases. A combination of search terms
indicating the outcome, exposure and target population were used. For instance, the
terms “musculoskeletal disorder/s” or “musculoskeletal symptom/s” or “incident pain”
or "persistent pain”, and “risk factor/s” or “determinant/s”, and “nurse/s” or “computer-
telephone user/s” were used. The publication period of the articles was not specified
and only articles written in the English language were utilised in the review.
Additional articles were obtained by searching the reference lists of the retrieved
articles. The strategy for the literature search is in appendix A.
16
1.3.1 MSDs in hospital nurses
Nurses are one of the occupational groups that has been found internationally to
experience relatively high prevalences of MSDs (Davis and Kotowski, 2015). The
nurses who work in hospital environments in particular have been identified as a
group at increased risk of developing MSDs (Carugno et al., 2012). A number of
literature reviews have reported high prevalences of MSDs in nurses (Long et al.,
2012, Davis and Kotowski, 2015) with the low back area affected more often than
other body areas (Lorusso et al., 2007). Various risk factors for MSDs in nurses
have been identified (Long et al., 2012, Bernal et al., 2015). Activities such as lifting
of heavy loads (Tinubu et al., 2010), lifting of patients, often in awkward and
constrained postures, (Carugno et al., 2012, Freimann et al., 2013), and sometimes
forceful movements of the upper limbs (Carugno et al., 2012) are routinely performed
in nursing. These physical factors, together with psychosocial factors such as job
stress, monotonous tasks, high perceived workload, and time pressure have been
associated with the development of MSDs in nurses (Smith et al., 2006). MSDs can
have a huge impact on the lives of nurses where they suffer chronic pain and
disability with considerable cost (Tinubu et al., 2010).
1.3.1.1 Prevalence and body site localisation of MSDs in hospital nurses
In nurses, MSDs at different body locations can be described by prevalence studies.
This knowledge can be useful in gauging the size of the problem of MSDs in nurses.
It can further be used to assess the health care needs of the nurses (Davis and
Kotowski, 2015, Beaglehole et al., 1993). In recent years, there has been an
increase in the number of prevalence studies on MSDs in nurses. However, very
few systematic literature reviews (Davis and Kotowski, 2015, Long et al., 2012) have
been conducted to integrate this information to give a holistic picture of the
17
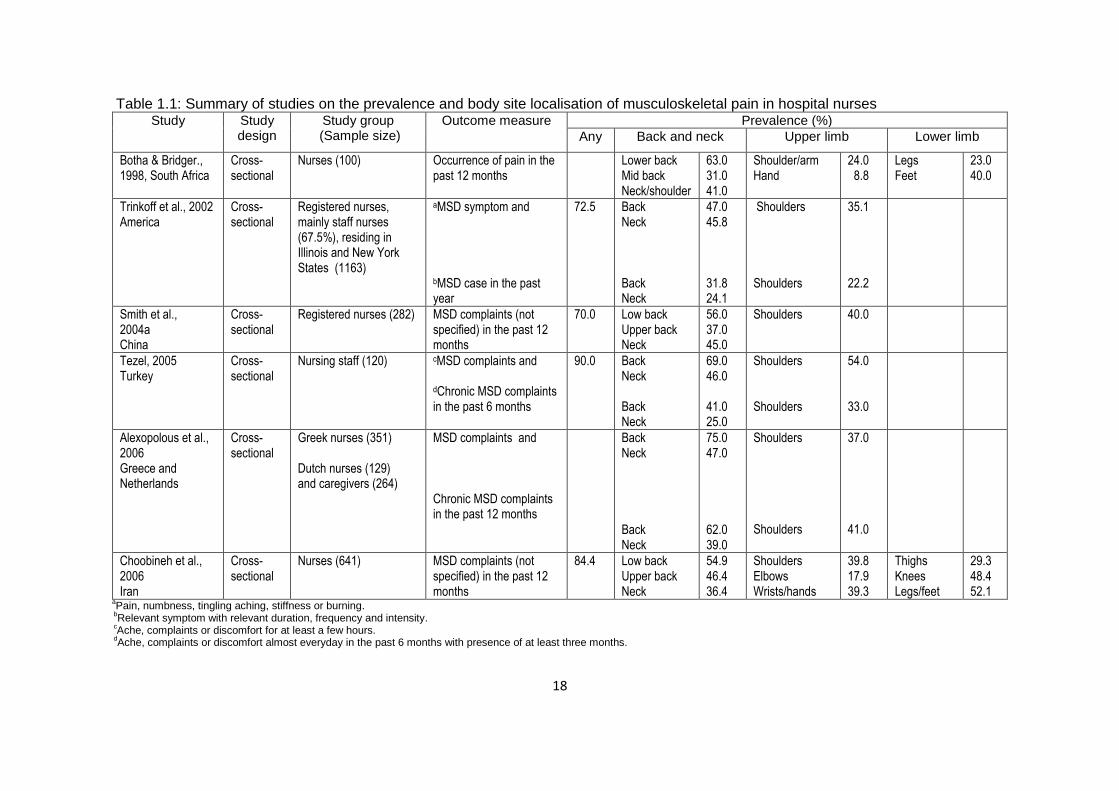
prevalence and body site localisation of MSDs in nurses to date. A literature review
of studies investigating the prevalence and body site localisation of MSDs in nurses
was thus conducted. The reviewed studies are summarised and presented in Table
1.1.
18
Table 1.1: Summary of studies on the prevalence and body site localisation of musculoskeletal pain in hospital nurses Study
Study design
Study group (Sample size)
Outcome measure Prevalence (%)
Any Back and neck Upper limb Lower limb
Botha & Bridger., 1998, South Africa
Cross-sectional
Nurses (100) Occurrence of pain in the past 12 months
Lower back Mid back Neck/shoulder
63.0 31.0 41.0
Shoulder/arm Hand
24.0 8.8
Legs Feet
23.0 40.0
Trinkoff et al., 2002 America
Cross-sectional
Registered nurses, mainly staff nurses (67.5%), residing in Illinois and New York States (1163)
aMSD symptom and
bMSD case in the past year
72.5 Back Neck Back Neck
47.0 45.8 31.8 24.1
Shoulders Shoulders
35.1 22.2
Smith et al., 2004a China
Cross-sectional
Registered nurses (282)
MSD complaints (not specified) in the past 12 months
70.0 Low back Upper back Neck
56.0 37.0 45.0
Shoulders 40.0
Tezel, 2005 Turkey
Cross-sectional
Nursing staff (120)
cMSD complaints and
dChronic MSD complaints in the past 6 months
90.0 Back Neck Back Neck
69.0 46.0 41.0 25.0
Shoulders Shoulders
54.0 33.0
Alexopolous et al., 2006 Greece and Netherlands
Cross-sectional
Greek nurses (351) Dutch nurses (129) and caregivers (264)
MSD complaints and Chronic MSD complaints in the past 12 months
Back Neck
Back Neck
75.0 47.0
62.0 39.0
Shoulders Shoulders
37.0 41.0
Choobineh et al., 2006 Iran
Cross-sectional
Nurses (641) MSD complaints (not specified) in the past 12 months
84.4 Low back Upper back Neck
54.9 46.4 36.4
Shoulders Elbows Wrists/hands
39.8 17.9 39.3
Thighs Knees Legs/feet
29.3 48.4 52.1
aPain, numbness, tingling aching, stiffness or burning.
bRelevant symptom with relevant duration, frequency and intensity.
cAche, complaints or discomfort for at least a few hours.
dAche, complaints or discomfort almost everyday in the past 6 months with presence of at least three months.
19
Table 1.1: Summary of studies on the prevalence and body site localisation of musculoskeletal pain in hospital nurses cont’d Study
Study design
Study group (Sample size)
Outcome measure Prevalence (%)
Any Back and neck Upper limb Lower limb
Smith et al., 2006 Japan
Cross-sectional
Nurses (844) MSD (not specified) in the past 12 months
85.5 Low back Upper back Neck
73.9 1.3 54.7
Shoulders 71.9
Tinubu et al., 2010 Nigeria
Cross-sectional
Nurses (118) Work-related MSD in the past 12 months
78.0 Low back Upper back Neck
44.1 16.8 28.0
Shoulders Elbows Wrists/hands
12.6 7.1 16.2
Hips/thighs Knees Ankles/feet
3.4 22.4 10.2
Carugno et al.,2012 Brazil and Italy
Cross-sectional
Brazilian nurses (193) Italian nurses (558)
MSDs (not specified) in the past month
Brazilian nurses Low back Neck Italian nurses Low back Neck
45.1 40.4 49.1 46.4
Shoulders Shoulders
41.5 33.2
Freimann et al., 2013 Estonia
Cross-sectional
Nurses (221) Pain in the past 12 months 84.0 Low back Neck
56.1 52.0
Shoulders Elbow Wrists/hands
21.3 11.3 27.1
Knees 32.6
Madiba et al., 2013 South Africa
Cross-sectional
Nurses (125) MSD pain in the past 12 months
84.0 Low back Upper back Neck
58.0 16.0 20.0
Shoulders Arms
21.0 10.0
Surawera et. al., 2013 Australia
Cross-sectional
Nurses (1111) MSD pain in the past 12 months and 1 month
Wrists/hands Wrists/hands
22.5 15.3
Attar, 2014 Saudi Arabia
Cross-sectional
Nurses (200) eWork-related MSD in the past 12 months
85.0 Low back Mid back Neck
65.7 5.0 20.0
Shoulders Elbows Wrists/hands
29.0 3.0 10.0
Hips/thighs Knees Ankles/feet
16.5 21.0 41.5
ePain, numbness, tingling, aching, stiffness and burning.
20
Table 1.1: Summary of studies on the prevalence and body site localisation of musculoskeletal pain in hospital nurses cont’d Study
Study design
Study group (Sample size)
Outcome measure Prevalence (%)
Any Back and neck Upper limb Lower limb
Munabi et al., 2014 Uganda
Cross-sectional
Nurses (755) from 5 hospitals (A-E)
fMSD in the past 12 months
80.8 Hospital A Low back Upper back Neck Hospital B Low back Upper back Neck Hospital C Low back Upper back Neck Hospital D Low Back Upper back Neck Hospital E Low back Upper back Neck
45.6 22.8 25.9 55.9 34.2 25.8 61.6 39.3 33.3 79.3 43.6 46.8 61.0 34.0 41.4
Shoulders Elbows Wrists/hands Shoulders Elbows Wrists/hands Shoulders Elbows Wrists/hands Shoulders Elbows Wrists/hands Shoulders Elbows Wrists/hands
27.9 11.5 16.5 25.3 16.1 27.7 28.5 11.0 29.7 45.9 23.5 36.8 34.0 14.1 29.5
Hips/thighs Knees Ankles/feet Hips/thighs Knees Ankles/feet Hips/thighs Knees Ankles/feet Hips/thighs Knees Ankles/feet Hips/thighs Knees Ankles/feet
15.2 21.8 25.0 21.9 37.6 38.6 33.1 34.0 30.4 45.4 54.6 44.7 21.2 32.5 44.1
fAche, pain, discomfort or numbness.
21
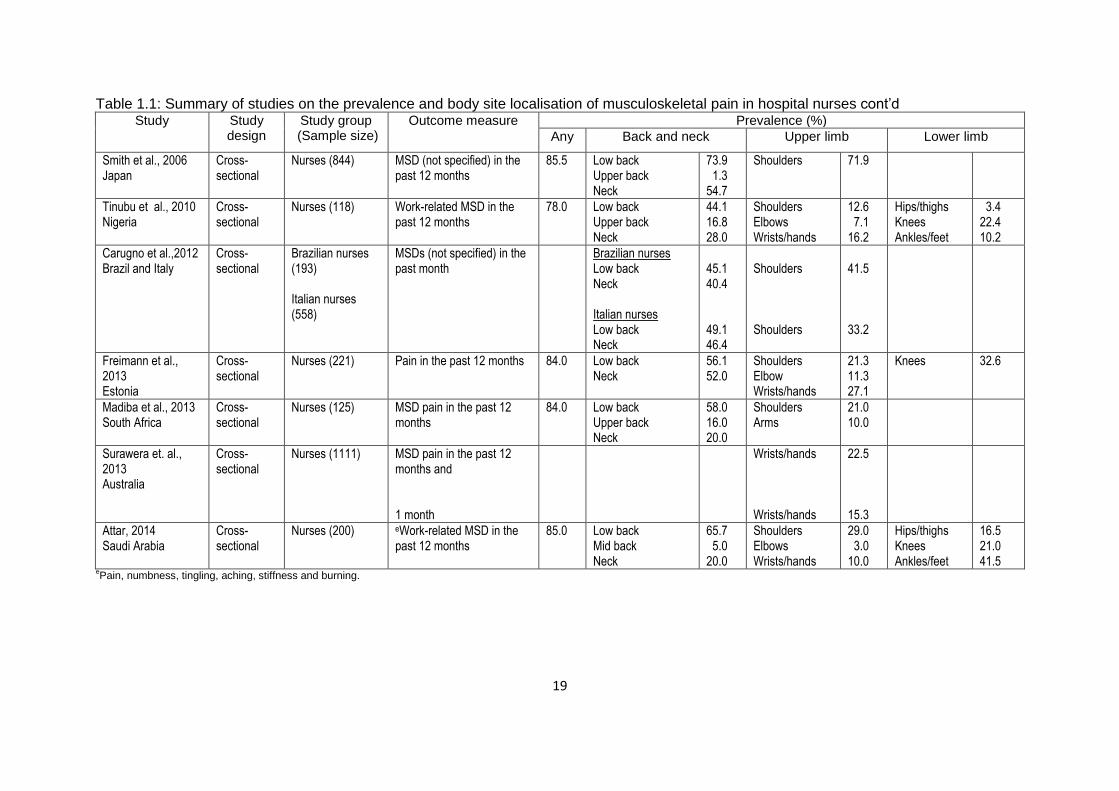
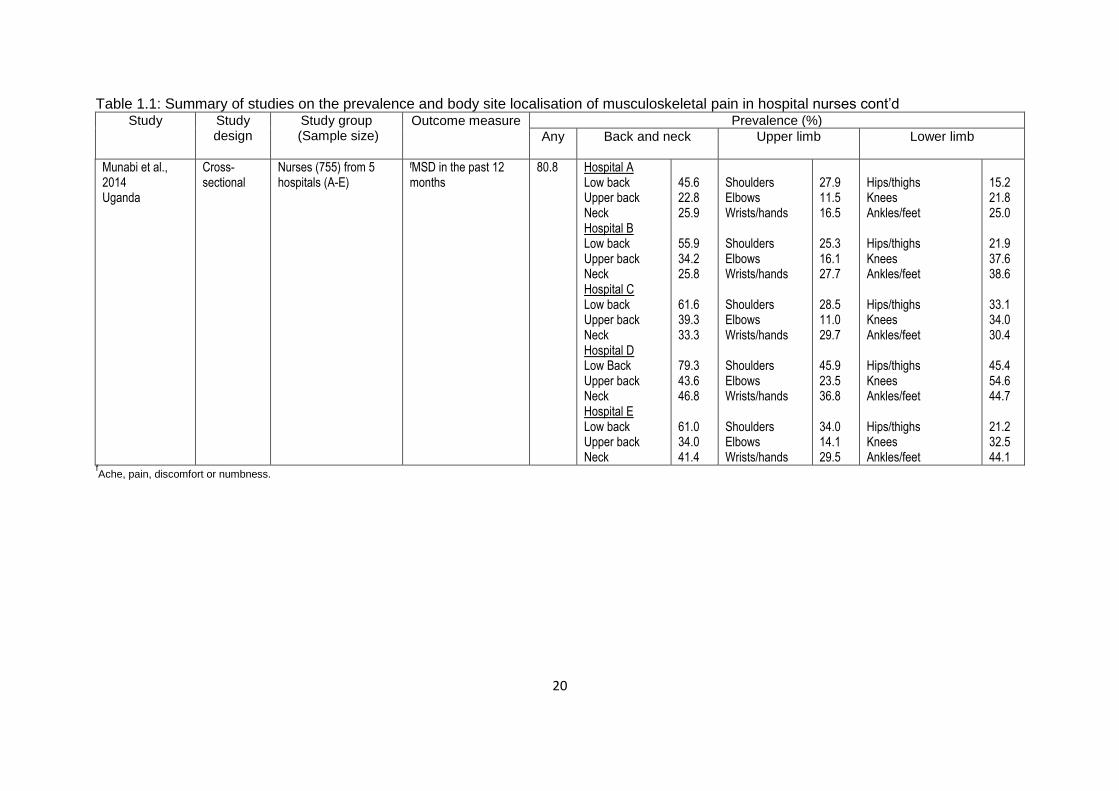
The findings of the review indicate that the 12-month prevalence of MSD symptoms
in nurses was the period prevalence most frequently used by the reviewed studies
which were all cross-sectional. The reporting of symptoms in any body location had
12-month prevalences that ranged from 70.0%-85.5% (Trinkoff et al., 2002, Smith et
al., 2004b, Choobineh et al., 2006, Smith et al., 2006, Tinubu et al., 2010, Freimann
et al., 2013, Madiba et al., 2013, Attar, 2014, Munabi et al., 2014). Most studies (8)
had investigated the back, neck and shoulders with one study including the knees.
Five studies investigated the back, upper limbs and lower limbs. The remaining
study investigated wrists or hands. Low back symptoms were the most commonly
reported MSDs by the nurses, with the prevalences ranging from 44.1%-79.3%. The
prevalences of neck symptoms were from 20.0%-52.0% and shoulder symptoms
12.6%-71.9%. Other body sites less frequently investigated showed prevalences of
3.0%-23.5% for elbows, 8.8%-39.3% for wrists or hands, 21.0%-54.6% for knees
and 10.2%-52.1% for ankles or feet.
The results of the review showed that hospital nurses report high prevalences of
MSD symptoms which occurred in different body sites. The low back was the body
site that was most frequently affected. This was followed by the shoulders, neck,
knees, ankles or feet and wrists or hands. The elbows were less frequently affected
compared to the other body sites. Variation in the prevalences presented by the
different studies was observed. This variation can be partly attributed to
heterogeneity of studies regarding MSD definitions, and this finding concurs with the
findings of other reviews (Long et al., 2012, Davis and Kotowski, 2015).

22
1.3.1.2 Features and functional consequences of MSDs in hospital
nurses
The features and functional consequences of MSDs in nurses have been reported in
a number of studies investigating the occurrence of MSDs in nurses (Trinkoff et al.,
2002, Munabi et al., 2014). They are based on pain which is the main symptom of
MSDs (Buckle and Devereux, 2002). Pain can occur in more than one body site,
giving rise to multi-site pain which is a feature of MSDs (Mehrdad et al., 2010).
Duration is a feature which is used to decide whether the pain is acute, chronic or
persistent (Vargas-Prada et al., 2013). It has been used with other features such as
frequency and intensity to determine the severity of pain (Trinkoff et al., 2002).
Depending on the severity of pain, the nurses may use different ways to try and
alleviate the pain. In the literature, it has been reported that nurses self medicate,
miss work, seek healthcare, modify work, or change jobs (Trinkoff et al., 2002). In
some instances, disability sets in and the nurses lose their work ability and become
relegated from the labour market (Menzel et al., 2004). All of these represent the
functional consequences of MSDs in the nurses.
An American study amongst registered nurses examined MSDs in the past 12
months in relation to functional consequences and found that nurses classified as
MSD cases (nurses reporting relevant symptoms, duration, frequency and intensity)
reported high prevalences of all functional consequences examined in the study
compared to nurses classified as MSD symptoms. In general, the odds of reporting
functional consequences (consulting health care providers, modifying work, use of
medication missing work and inadequate sleep) were higher in MSD cases
compared to MSD symptoms (Trinkoff et al., 2002).

23
MSDs caused close to a third of nurses to seek healthcare by visiting a physician, a
fifth to use physiotherapy services and close to a fifth to take sick leave in the past
12 months, in a study examining the relationship between perceived demands and
MSDs in Iranian nurses (Choobineh et al., 2006). In another study (Tinubu et al.,
2010) to determine the prevalence of MSDs and associated job risk factors in
Nigerian nurses, 5% of the nurses had changed their jobs, close to a third had
treated themselves or sought treatment from other health practitioners, and a third,
on average, had modified their tasks due to MSDs. A comparative study
(Alexopoulos et al., 2006) to investigate national differences between Greek and
Dutch nurses with respect to MSDs and its consequences found higher percentages
of nurses in both countries who had taken sick leave because of low back pain as
compared to other body sites. Similarly, in both countries, a high percentage (close
to half) of nurses with MSDs had sought medical care for low back pain in the past
12 months. Lastly, an Australian study (Surawera et al., 2013) to assess the risk
factors for wrist or hand pain in nurses, found that 43.0% of those who reported wrist
or hand pain had sought medical advice and more than a tenth had taken time off
from work in the past 12 months due to wrist or hand pain. These studies reinforce
the negative impact that MSDs impose on nurses’ lives.
1.3.1.3 Risk factors for MSDs in hospital nurses
Epidemiological studies have been instrumental in the identification of risk factors for
MSDs in nurses (Bernal et al., 2015, Lorusso et al., 2007, Sherehiy et al., 2004).
These risk factors can be organised into categories based on their place of origin
(Armstrong et al., 1996). The two main categories are workplace risk factors and
non-workplace usually referred to as individual risk factors. In the absence of the

24
pathophysiological mechanism for MSDs, the National Research Council and the
Institute of Medicine of the National Academy of Sciences in the United States of
America (Barondess et al., 2001) adopted a conceptual model which distinguishes
the two categories of risk factors. The model is presented with permission (Appendix
B) in Figure 1.1 and postulates the possible involvement and influence of these risk
Figure 1.1: Conceptual model of the possible involvement of MSD risk factors in the genesis of MSDs (Adapted with permission from the National Academy Press)
factors in the development of MSDs. The model is constituted by the workplace
which can be taken to be the hospital and the worker represents nurses who
possess individual characteristics. Thus, the hospital environment and nursing job
become the generators of factors which put the nurses at risk of MSDs. These
workplace risk factors can be differentiated into physical and psychosocial work risk
WORKER
Physical factors
Psychosocial factors
Biomechanical loading
Physiological responses
Internal tolerances
Mechanical strain
Fatigue
Pain, Discomfort
Impairment, Disability
Non
-work
fa
cto
rs / I
ndiv
idu
al fa
cto
rs
WORKPLACE
Internal loads
Outcomes
25
factors. Physical workplace risk factors may include various patient handling tasks
and other activities involved in nursing. Psychosocial workplace risk factors cover
work organisational factors such as job demand and control, social support, job
satisfaction, shift work et cetera.
Nurses’ individual risk factors are multidimensional with physical factors, including
household activities and fitness level; and social aspects of life outside of the
workplace, such as smoking habits and educational level; biological characteristics,
including age, sex and body mass index; and, psychological characteristics
comprising attitudes, values and coping mechanisms. All of these factors have been
associated with MSD risk (Marras et al., 2009).
The National Academy of Sciences’ conceptual model suggests that workplace
physical risk factors operate through biomechanical loading to initiate the
development of MSDs (Buckle and Devereux, 2002). The physical risk factors
generate internal forces which act on the tissues to create internal loads. The
internal loads may cause physiological responses such as a decrease in blood
supply. The physiological response, depending on internal tolerances, may lead to
mechanical strain, fatigue and MSD outcomes. On the other hand, psychosocial
factors may generate psychological stress which may induce a series of reactions,
resulting in the release of hormonal substances which can cause muscle tension.
This increases the biomechanical load imposed on the muscles and processes
similar to those initiated by physical risk factors may ensue (Aptel et al., 2002,
Wahlström, 2005). The individual factors may have a mediating role where the effect
of the workplace risk factors may depend on various factors that are characteristic of
the individual (Feuerstein et al., 2004).

26
1.3.1.3.1 Risk factors for prevalent MSDs in hospital nurses
Prevalent MSDs are those present at, or during, a specified period of time in a
defined at risk population (Hales and Bernard, 1996). The literature on MSDs in
nurses is dominated by studies examining prevalent MSDs and their associated risk
factors (Smith et al., 2004a, Alexopoulos et al., 2006, Choobineh et al., 2006, Smith
et al., 2006, Carugno et al., 2012, Freimann et al., 2013, Attar, 2014, Munabi et al.,
2014). As it is difficult for one study to consider all suspected risk factors for MSDs,
integrating the information from different studies may be a solution (da Costa and
Vieira, 2010). Recent reviews of risk factors for prevalent MSDs in nurses have
combined nurses with other healthcare professionals and selected a limited scope of
MSDs (Lorusso et al., 2007, Long et al., 2012) and risk factors (Bernal et al., 2015).
Consequently, a literature review of studies examining the relationship between
prevalent MSDs in hospital nurses and associated risk factors was conducted based
on the studies summarised and presented in Table 1.2.
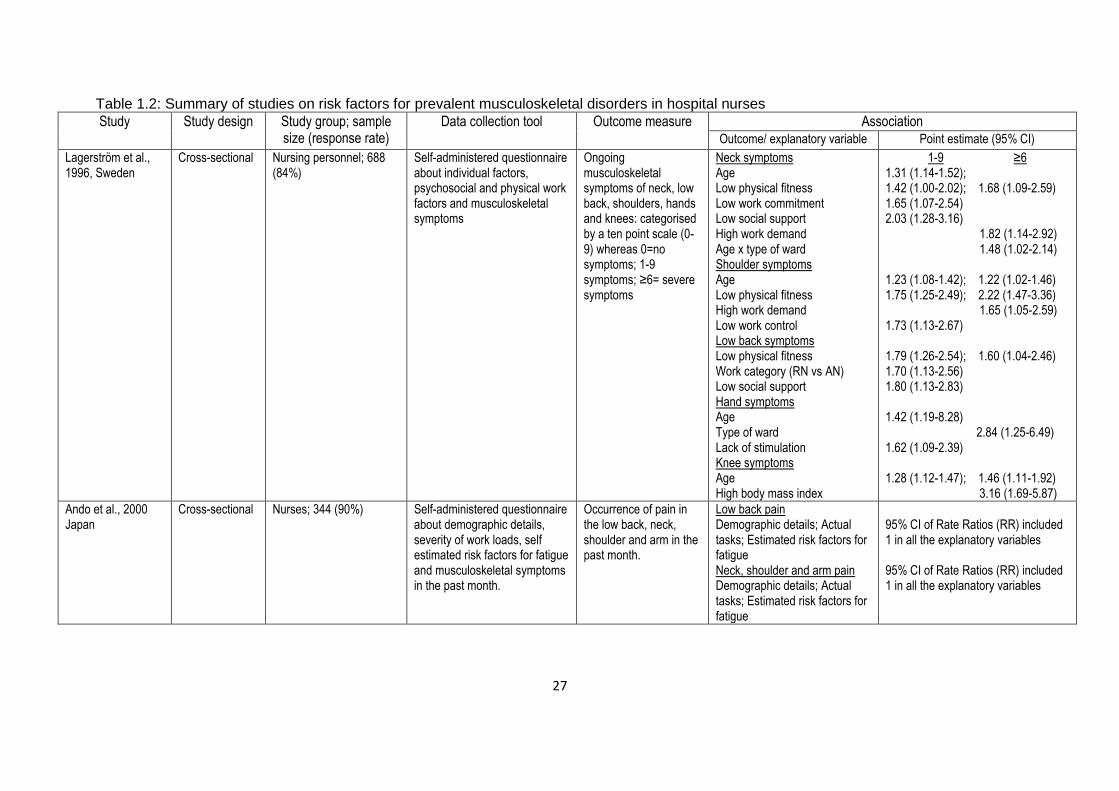
27
Table 1.2: Summary of studies on risk factors for prevalent musculoskeletal disorders in hospital nurses
Study Study design Study group; sample size (response rate)
Data collection tool Outcome measure Association Outcome/ explanatory variable Point estimate (95% CI)
Lagerström et al., 1996, Sweden
Cross-sectional Nursing personnel; 688 (84%)
Self-administered questionnaire about individual factors, psychosocial and physical work factors and musculoskeletal symptoms
Ongoing musculoskeletal symptoms of neck, low back, shoulders, hands and knees: categorised by a ten point scale (0-9) whereas 0=no symptoms; 1-9 symptoms; ≥6= severe symptoms
Neck symptoms Age Low physical fitness Low work commitment Low social support High work demand Age x type of ward Shoulder symptoms Age Low physical fitness High work demand Low work control Low back symptoms Low physical fitness Work category (RN vs AN) Low social support Hand symptoms Age Type of ward Lack of stimulation Knee symptoms Age High body mass index
1-9 ≥6 1.31 (1.14-1.52); 1.42 (1.00-2.02); 1.68 (1.09-2.59) 1.65 (1.07-2.54) 2.03 (1.28-3.16) 1.82 (1.14-2.92) 1.48 (1.02-2.14) 1.23 (1.08-1.42); 1.22 (1.02-1.46) 1.75 (1.25-2.49); 2.22 (1.47-3.36) 1.65 (1.05-2.59) 1.73 (1.13-2.67) 1.79 (1.26-2.54); 1.60 (1.04-2.46) 1.70 (1.13-2.56) 1.80 (1.13-2.83) 1.42 (1.19-8.28) 2.84 (1.25-6.49) 1.62 (1.09-2.39) 1.28 (1.12-1.47); 1.46 (1.11-1.92) 3.16 (1.69-5.87)
Ando et al., 2000 Japan
Cross-sectional Nurses; 344 (90%)
Self-administered questionnaire about demographic details, severity of work loads, self estimated risk factors for fatigue and musculoskeletal symptoms in the past month.
Occurrence of pain in the low back, neck, shoulder and arm in the past month.
Low back pain Demographic details; Actual tasks; Estimated risk factors for fatigue Neck, shoulder and arm pain Demographic details; Actual tasks; Estimated risk factors for fatigue
95% CI of Rate Ratios (RR) included 1 in all the explanatory variables 95% CI of Rate Ratios (RR) included 1 in all the explanatory variables
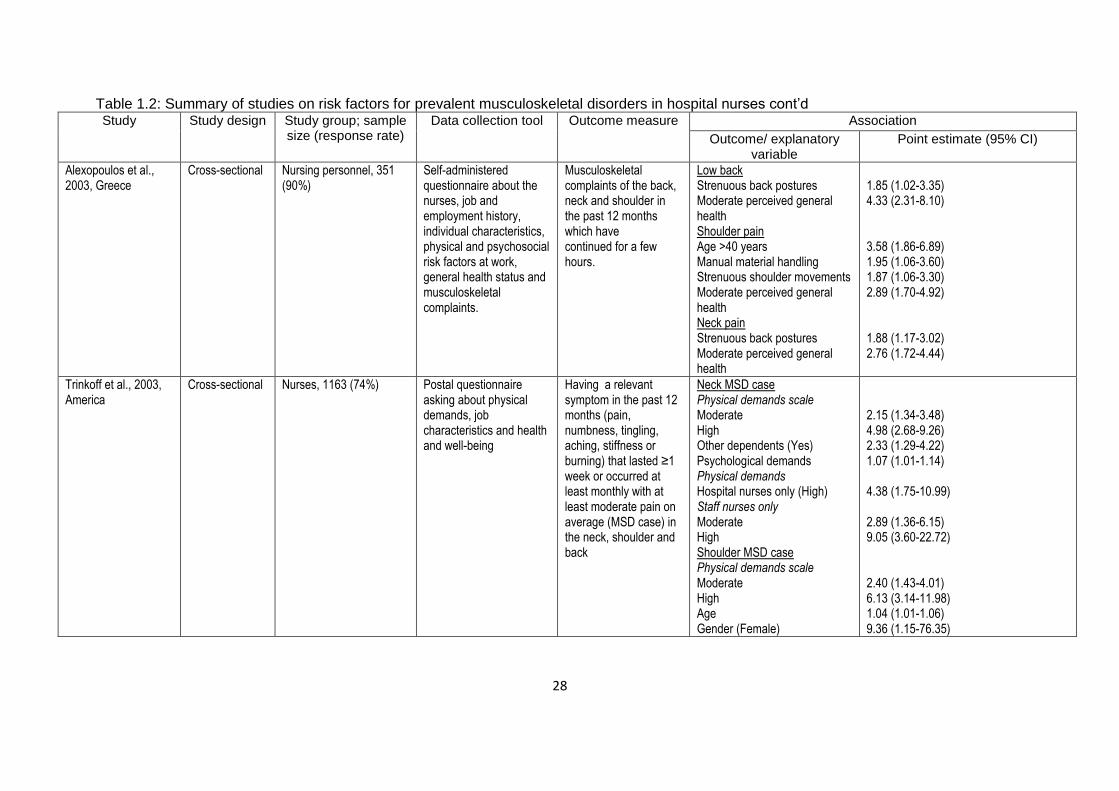
28
Table 1.2: Summary of studies on risk factors for prevalent musculoskeletal disorders in hospital nurses cont’d Study Study design Study group; sample
size (response rate) Data collection tool Outcome measure Association
Outcome/ explanatory variable
Point estimate (95% CI)
Alexopoulos et al., 2003, Greece
Cross-sectional Nursing personnel, 351 (90%)
Self-administered questionnaire about the nurses, job and employment history, individual characteristics, physical and psychosocial risk factors at work, general health status and musculoskeletal complaints.
Musculoskeletal complaints of the back, neck and shoulder in the past 12 months which have continued for a few hours.
Low back Strenuous back postures Moderate perceived general health Shoulder pain Age >40 years Manual material handling Strenuous shoulder movements Moderate perceived general health Neck pain Strenuous back postures Moderate perceived general health
1.85 (1.02-3.35) 4.33 (2.31-8.10) 3.58 (1.86-6.89) 1.95 (1.06-3.60) 1.87 (1.06-3.30) 2.89 (1.70-4.92) 1.88 (1.17-3.02) 2.76 (1.72-4.44)
Trinkoff et al., 2003, America
Cross-sectional Nurses, 1163 (74%) Postal questionnaire asking about physical demands, job characteristics and health and well-being
Having a relevant symptom in the past 12 months (pain, numbness, tingling, aching, stiffness or burning) that lasted ≥1 week or occurred at least monthly with at least moderate pain on average (MSD case) in the neck, shoulder and back
Neck MSD case Physical demands scale Moderate High Other dependents (Yes) Psychological demands Physical demands Hospital nurses only (High) Staff nurses only Moderate High Shoulder MSD case Physical demands scale Moderate High Age Gender (Female)
2.15 (1.34-3.48) 4.98 (2.68-9.26) 2.33 (1.29-4.22) 1.07 (1.01-1.14) 4.38 (1.75-10.99) 2.89 (1.36-6.15) 9.05 (3.60-22.72) 2.40 (1.43-4.01) 6.13 (3.14-11.98) 1.04 (1.01-1.06) 9.36 (1.15-76.35)

29
Table 1.2: Summary of studies on risk factors for prevalent musculoskeletal disorders in hospital nurses cont’d Study Study design Study group; sample
size (response rate) Data collection tool Outcome measure Association
Outcome/ explanatory variable Point estimate (95% CI)
Other dependents (Yes) Physical demands Hospital nurses only (High) Staff nurses only Moderate High Back MSD case Physical demands scale Moderate High Other dependents (Yes) BMI Psychological demands Physical demands Hospital nurses only (High) Staff nurses only Moderate High
2.06 (1.11-3.81) 4.99 (1.84-13.57) 3.58 (1.58-8.11) 11.99 (4.41-32.65) 2.60 (1.65-4.11) 5.30 (2.89-9.71) 2.61 (1.49-4.59) 1.06 (1.02-1.11) 1.10 (1.03-1.16) 5.46 (2.24-13.31) 3.51 (1.72-7.18) 9.39 (3.88-2271)
Smith et al., 2004b, China
Cross-sectional Nurses, 180 (84.1%) Self-administered questionnaire about demographic details, occupational factors and occurrence of musculoskeletal disorders.
MSDs of the neck, shoulders, upper back, lower back, elbows, wrists, upper legs, knees and ankles or feet in the past 12 months.
Any MSDs Alcohol (occasional) Period pain (usually) Mental pressure (excessive) Department (Gynaecology)
0.1 (0.01-0.4) 23.8 (4.3-189.1) 10.5 (2.2-67.5) 0.1 (0.01-0.7)
Smith et al., 2005, Korea
Cross-sectional Nurses, 330 (97.9%) Self-administered questionnaire about demographic details, occupational risk factors, musculoskeletal symptoms and adverse sequelae.
MSDs ( neck, shoulders, upper back, elbows, forearms, hands or wrists, lower back, upper legs, knees, lower legs, feet)
Any MSDs Manually handling patients Periodic depression Affected daily life Neck Shoulder Hand/wrists
7.2 (1.2-42.3) 3.3 (1.3-8.3) 2.2 (1.1-4.1) 2.4 (1.2-5.2) 3.8 (2.0-7.8)

30
Table 1.2: Summary of studies on risk factors for prevalent musculoskeletal disorders in hospital nurses cont’d Study Study design Study group; sample
size (response rate) Data collection tool Outcome measure Association
Outcome/ explanatory variable Point estimate (95% CI)
in the past 12 months; if nurses’ daily lives were affected and if treatment was required.
Needed medical treatment Lower back Hand/wrists
2.5 (1.2-5.6) 2.3 (1.3-4.2)
Choobineh et al., 2010, Iran
Cross-sectional Nurses, 375 (80%) Self-administered questionnaire about demographic details, perceived job demands, additional nurse specific physical demands and musculoskeletal symptoms in the past 12 months
Musculoskeletal symptoms (ache, pain and or discomfort) of the neck, shoulders, elbows, wrists or hands, upper back, lower back, hips or thighs, knees and ankles or feet in the past 12 months.
Neck Pull/push heavy objects Shift work Shoulders Lifting or lowering objects Conflicting demands Shift work Gender (Female) Elbows Lifting or lowering objects Wrists/hands Repetitive motions Waiting on work from other people or departments Gender (Female) Upper back Pull/push heavy objects Not enough time to get the job done Shift work Lower back Working while bent or twisted at the waist BMI Gender (Female) Hips/thighs Waiting on work from other people or departments
5.35 (1.50-19.12) 2.54 (1.33-5.01) 3.04 (1.65-5.59) 1.68 (1.04-2.73) 3.26 (1.59-6.67) 1.17 (1.03-2.81) 2.63 (1.06-6.53) 2.88 (1.31-6.31) 2.13 (1.30-3.48) 2.14 (1.36-3.64) 6.16 (1.31-29.02) 2.25 (1.26-4.01) 2.29 (1.09-4.85) 2.04 (1.09-5.31) 2.12 (1.16-3.88) 1.71 (1.04-2.80) 2.01 (1.15-3.49)

31
Table 1.2: Summary of studies on risk factors for prevalent musculoskeletal disorders in hospital nurses cont’d Study Study design Study group; sample
size (response rate) Data collection tool Outcome measure Association
Outcome/ explanatory variable
Point estimate (95% CI)
Not enough time to get the job done Knees Often moving/lifting very heavy loads Waiting on work from other people or departments Shift work Ankles/feet Lifting/lowering objects to/from floor Waiting on work from other people or departments Gender (Female)
1.85 (1.03-3.36) 7.24 (1.54-34.14) 2.30 (1.36-3.90) 3.38 (1.57-7.25) 4.97 (1.73-14.29) 2.14 (132-3.47) 2.03 (1.24-3.30)
Mehrdad et al., 2010, Iran
Cross-sectional Nurses, 317 (91%) Self-administered questionnaire about demographic details, work-related psychosocial factors and musculoskeletal symptoms.
Musculoskeletal symptoms in each body site ( neck, shoulder, elbow, wrists or hands, upper back, low back, hips or thighs, knees, ankles or feet); Musculoskeletal symptoms in >3 body sites; and musculoskeletal symptoms in 4 regions: 1 (neck, shoulder, upper back) 2 (elbow, wrists or hands) 3 ( low back) 4( hips or thighs, knees, ankles and feet) in the past 12 months (data for the regions are not presented in this table)
Neck cAdjusted dOrganizational Shoulders Organizational Wrists or hands Adjusted Organizational Upper back Adjusted eTask dIndividual Knees Individual
aMiddle bHigh 2.18 (1.16-4.08); 2.36 (1.01-5.57) 2.21 (1.22-3.98); 2.50 (1.21-5.19) 1.79 (1.01-3.17) 1.93 (1.02 -3.65);2.42 (1.01-5.82) 1.83 (1.01-3.31);2.34 (1.12-4.91) 2.51 (1.06-5.94) 2.86 (1.10-7.44) 1.88 (1.08-3.27) 2.27 (1.19-4.33)
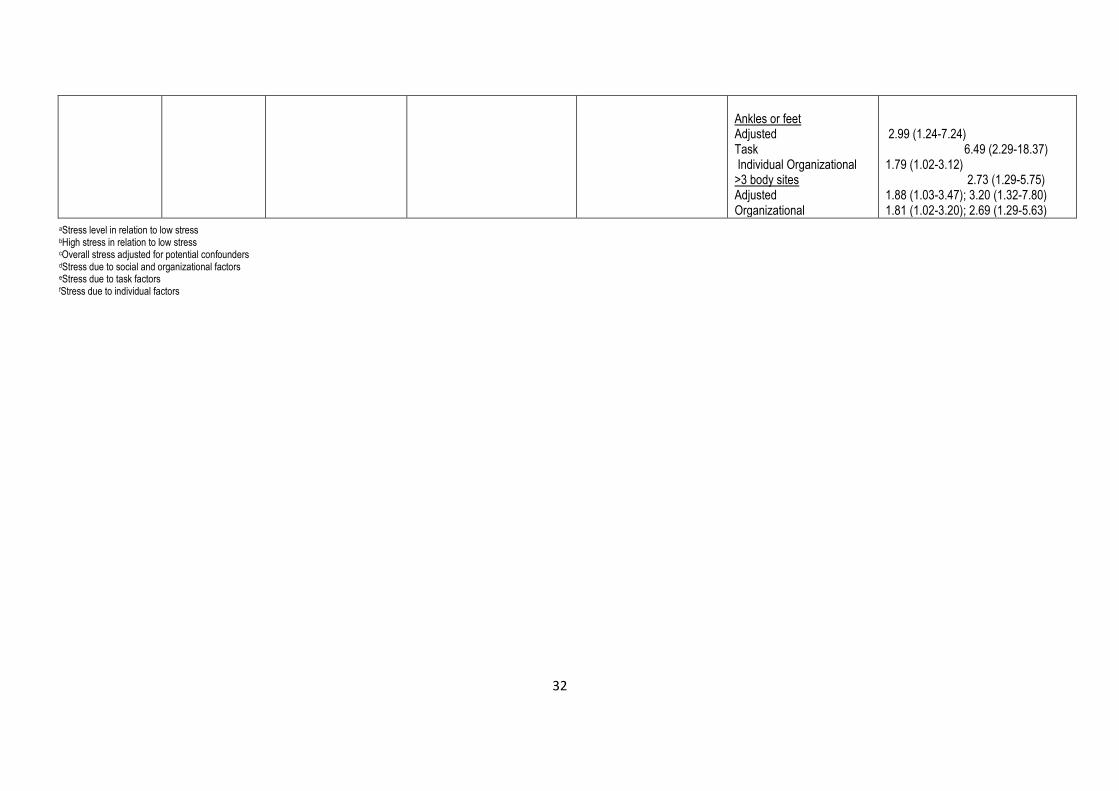
32
Ankles or feet Adjusted Task Individual Organizational >3 body sites Adjusted Organizational
2.99 (1.24-7.24) 6.49 (2.29-18.37) 1.79 (1.02-3.12) 2.73 (1.29-5.75) 1.88 (1.03-3.47); 3.20 (1.32-7.80) 1.81 (1.02-3.20); 2.69 (1.29-5.63)
aStress level in relation to low stress bHigh stress in relation to low stress cOverall stress adjusted for potential confounders dStress due to social and organizational factors eStress due to task factors fStress due to individual factors
33
All of the studies reviewed except one (Lagerström et al., 1996) used 12-month
period prevalence of MSD symptoms and validated instruments such as the Borg
Scale (Borg, 1982) and Job Content Questionnaire (Karasek et al., 1998) to
measure exposure, and the Standardised Nordic Questionnaire (SNQ) (Kuorinka et
al., 1987) to measure the outcome. Half of the studies examined MSD symptoms in
all body sites presented in the SNQ. The other half examined MSD symptoms in the
lower back, neck and shoulders, except that one also included the arm and another
the knees.
The risk factors reported to be associated with MSD symptoms in the lower back and
neck (spine), shoulders and wrists or hands (upper limb) and knees (lower limb) are
presented in sections that follow. The nomenclature used in the National Academy
of Sciences conceptual model (2001) to categorise risk factors as physical,
psychosocial and individual is used.
1.3.1.3.1.1 Physical, psychosocial and individual risk factors for
prevalent MSDs of the spine in hospital nurses
The physical risk factors associated with prevalent MSD symptoms of the low back
and neck that were identified in the reviewed studies were work category
(Lagerström et al., 1996), awkward back posture (Alexopoulos et al., 2003a,
Choobineh et al., 2010), department (Smith et al., 2004a) and manual handling
(Smith et al., 2005, Choobineh et al., 2010). Work category was associated with low
back symptoms in the study by Lagerström (1996), where auxiliary nurses were at a
higher risk of developing low back symptoms than registered nurses. It was
suggested that this could be due to auxiliary nurses performing physically more
strenuous tasks than registered nurses. In the same study, an interaction between
age and type of ward was associated with neck symptoms. The effect indicated that,

34
with increasing age, nurses working in a medical or geriatric ward were at an
increased risk of developing neck symptoms than nurses working in other wards. It
is worth noting that the studies conducted by Smith (2004a, 2005) examined the
relationship between risk factors and MSD symptoms in “any” body site.
The psychosocial risk factors related to both low back and neck MSD symptoms
were found to be low social support, high physical and psychological demands and
shift work (Lagerström et al., 1996, Trinkoff et al., 2003, Smith et al., 2004a, Smith et
al., 2005, Choobineh et al., 2010). High work demands were associated with neck
symptoms in a study by Lagerström (1996), and the study by Smith (2004b) showed
an association between excessive mental pressure and MSD symptoms at "any"
body site. However, a study by Smith (2005) did not show an association between
high mental pressure and MSD symptoms at "any" body site.
Finally, the individual risk factors found to be associated with MSD symptoms of the
low back and neck in the nurses included low physical fitness, moderate perceived
general health, high body mass index (BMI), alcohol, female gender and shift work
(Lagerström et al., 1996, Alexopoulos et al., 2003b, Trinkoff et al., 2003, Smith et al.,
2004a, Choobineh et al., 2010) In the studies of Trinkoff (2003) and Choobineh
(2006), BMI was associated with low back symptoms.
1.3.1.3.1.2 Physical, psychosocial and individual risk factors for
prevalent MSDs of the upper limb in hospital nurses
The upper limb includes the shoulders and wrists or hands. In the reviewed studies,
the risk factors identified as being associated with MSD symptoms of the shoulders
were manual handling and strenuous shoulder movements (Alexopoulos et al.,
2003a). MSD symptoms in the wrists or hands were associated with repetitive

35
movements (Choobineh et al., 2010) and type of ward (Lagerström et al., 1996).
The latter study suggested that the nurses reporting severe hand symptoms were
working in physically strenuous wards or were exposed to high force from handling
hospital equipment.
Physical demands (Trinkoff et al., 2003, Lagerström et al., 1996) and psychosocial
stress levels (Mehrdad et al., 2010) were associated with shoulder and wrist or hand
symptoms. For the shoulders, the individual risk factors were increased age
(Lagerström et al., 1996, Alexopoulos et al., 2003b, Trinkoff et al., 2003), low
physical fitness (Lagerström et al., 1996), moderate perceived general health
(Alexopoulos et al., 2003a), and gender (Trinkoff et al., 2003, Choobineh et al.,
2010). Symptoms of the hands were related to age (Lagerström et al., 1996).
1.3.1.3.1.3 Physical, psychosocial and individual risk factors for
prevalent MSDs of the lower limb in hospital nurses
In the lower limb, only the knees were considered. The physical, psychosocial and
individual risk factors that were identified were manual handling (Choobineh et al.,
2010), psychosocial stress levels (Mehrdad et al., 2010), increased age and high
BMI (Lagerström et al., 1996).
Two of the studies (Smith et al., 2005, Trinkoff et al., 2003), showed that over and
above the identification of risk factors for MSD symptoms in nurses, identification of
MSD consequences is also important. In the Trinkoff (2003) study, up to 11.0% of
nurses had changed their jobs due to MSD symptoms. The nurses in the Smith
(2005) study, had had their daily lives affected and had to take treatment for the
symptoms.
1.3.1.3.2 Risk factors for incident and persistent MSDs in hospital nurses
36
Incident and persistent MSDs in nurses are indicative of the course taken by MSDs
in their development (Maul et al., 2003). Investigations of incident and persistent
MSDs in nurses utilise cross-sectional studies with baseline and follow-up
components (Smedley et al., 1997, Maul et al., 2003). At baseline, there would be
two groups of nurses: those with no MSD symptoms and those with MSD
symptoms. At follow-up, in a proportion of nurses in the latter group the symptoms
would persist (persistent MSDs), while in another proportion of nurses the symptoms
would resolve. In the group with no symptoms, a proportion of them would develop
new symptoms (incident MSDs), while the others would remain free from symptoms.
It has been suggested that the risk factors for incident MSDs differ from those for
persistent MSDs in nurses (Sadeghian et al., 2013) which is an issue that needs to
be clarified.
The literature investigating risk factors for incident and persistent MSDs in nurses
was reviewed. A summary of the reviewed studies is presented in Table 1.3. These
studies can be categorised into those dealing with incident MSDs in nurses and
those dealing with both incident and persistent MSDs in nurses and other
occupational groups. The former studies covered up to three body sites while the
latter covered up to 10 and used combinations of body sites to get information about
multi-site pain for pain occurring at more than one site, and defined pain as disabling
for pain that made it difficult or impossible to do everyday life activities such as
dressing.
The findings of the studies on nurses show that incident MSDs were predicted by job
strain (combination of high mental demands and low decision latitude) and perceived
physical exertion (Josephson et al., 1997), past history of MSD symptoms, patient
37
handling tasks and low mood (Smedley et al., 1997, 2003), work schedule
characteristics (Trinkoff et al., 2006) and occupational stress (Bonzini et al., 2015).
In the study by Josephson et al., (1997), it was found that, although job strain and
perceived physical exertion predicted incident pain, when both were combined the
risk increased. The two studies by Smedley et al., (1997, 2003), found that incident
low back and neck or shoulder pain were predicted by past history of symptoms and
the risk increased with longer duration of symptoms and decreasing interval since
last episode. Furthermore, low mood predicted low back pain, leading to sickness
absence. The same work day factors including working more than 13 hours in a day
and working on days off, predicted incident pain in all body sites selected in the
study (Trinkoff et al., 2006). Finally, Bonzini et al., (2015) found that high incident
stress predicted low back and neck or shoulder pain in nurses with low stress at
baseline. The associations of high stress at baseline and incident pain were weak.
The findings of this study show that occupational stress is not only a predictor of
incident MSDs but is also a consequence of incident MSDs.
The risk factors predicting incident and persistent MSDs in studies that included
nurses and other occupational groups encompassed predictors of incident MSDs,
namely receiving incentives at work, job dissatisfaction, poor mental health
(Sadeghian et al., 2013), somatising tendency, and adverse beliefs about prognosis
(Vargas-Prada et al., 2013). The predictors of persistent MSDs consisted of
strenuous work activities, and adverse beliefs about work causation of MSDs
(Solidaki et al., 2012), prognosis (Vargas-Prada et al., 2013), and somatising
tendency (Solidaki et al., 2012, Vargas-Prada et al., 2013). The office workers were
at a higher risk for incident neck and shoulder pain than nurses which was attributed

38
to the use of computers by the office workers (Sadeghian et al., 2013). In this study,
there were no associations with persistent MSDs.
Few studies on incident and persistent MSDs were identified, signalling a paucity of
information about the subject in nurses. The main strength of all these studies was
the temporality between the predictors and MSDs where the predictors were
assessed before the occurrence of MSDs. Temporality is one of the criteria relevant
to the study of MSDs used to infer causality (Hales and Bernard, 1996). The small
sample sizes in the majority of studies limited statistical power which may have
resulted in the reduction of the ability of studies to detect associations in some
instances.
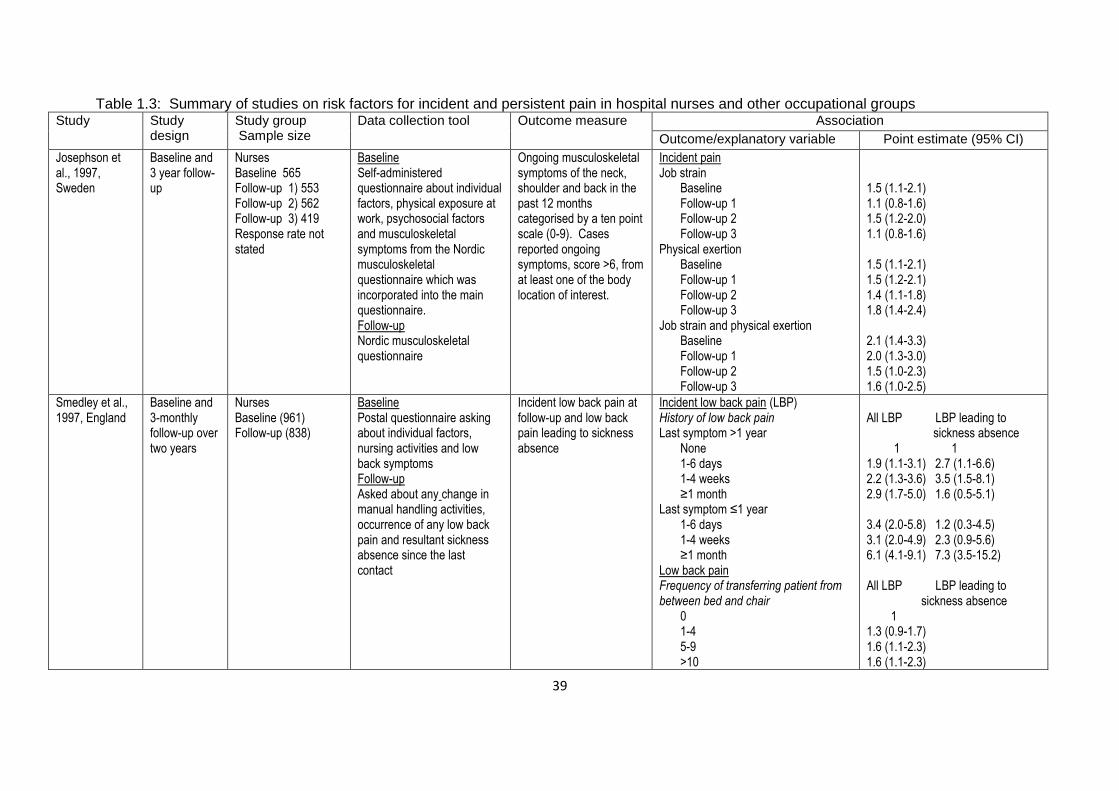
39
Table 1.3: Summary of studies on risk factors for incident and persistent pain in hospital nurses and other occupational groups Study Study
design Study group Sample size
Data collection tool Outcome measure Association
Outcome/explanatory variable Point estimate (95% CI)
Josephson et al., 1997, Sweden
Baseline and 3 year follow-up
Nurses Baseline 565 Follow-up 1) 553 Follow-up 2) 562 Follow-up 3) 419 Response rate not stated
Baseline Self-administered questionnaire about individual factors, physical exposure at work, psychosocial factors and musculoskeletal symptoms from the Nordic musculoskeletal questionnaire which was incorporated into the main questionnaire. Follow-up Nordic musculoskeletal questionnaire
Ongoing musculoskeletal symptoms of the neck, shoulder and back in the past 12 months categorised by a ten point scale (0-9). Cases reported ongoing symptoms, score >6, from at least one of the body location of interest.
Incident pain Job strain
Baseline Follow-up 1 Follow-up 2 Follow-up 3
Physical exertion Baseline Follow-up 1 Follow-up 2 Follow-up 3
Job strain and physical exertion Baseline Follow-up 1 Follow-up 2 Follow-up 3
1.5 (1.1-2.1) 1.1 (0.8-1.6) 1.5 (1.2-2.0) 1.1 (0.8-1.6) 1.5 (1.1-2.1) 1.5 (1.2-2.1) 1.4 (1.1-1.8) 1.8 (1.4-2.4) 2.1 (1.4-3.3) 2.0 (1.3-3.0) 1.5 (1.0-2.3) 1.6 (1.0-2.5)
Smedley et al., 1997, England
Baseline and 3-monthly follow-up over two years
Nurses Baseline (961) Follow-up (838)
Baseline Postal questionnaire asking about individual factors, nursing activities and low back symptoms Follow-up Asked about any change in manual handling activities, occurrence of any low back pain and resultant sickness absence since the last contact
Incident low back pain at follow-up and low back pain leading to sickness absence
Incident low back pain (LBP) History of low back pain Last symptom >1 year
None 1-6 days 1-4 weeks ≥1 month
Last symptom ≤1 year 1-6 days 1-4 weeks ≥1 month
Low back pain Frequency of transferring patient from between bed and chair
0 1-4 5-9 >10
All LBP LBP leading to sickness absence 1 1 1.9 (1.1-3.1) 2.7 (1.1-6.6) 2.2 (1.3-3.6) 3.5 (1.5-8.1) 2.9 (1.7-5.0) 1.6 (0.5-5.1) 3.4 (2.0-5.8) 1.2 (0.3-4.5) 3.1 (2.0-4.9) 2.3 (0.9-5.6) 6.1 (4.1-9.1) 7.3 (3.5-15.2) All LBP LBP leading to sickness absence 1 1.3 (0.9-1.7) 1.6 (1.1-2.3) 1.6 (1.1-2.3)
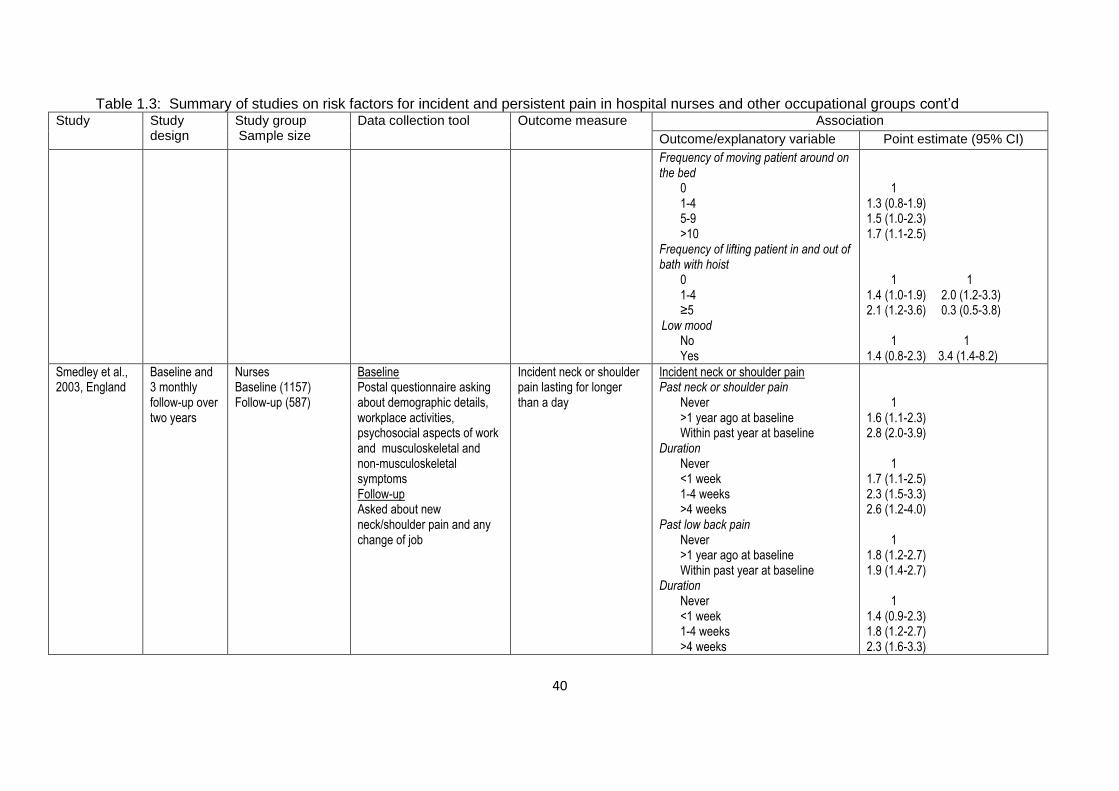
40
Table 1.3: Summary of studies on risk factors for incident and persistent pain in hospital nurses and other occupational groups cont’d Study Study
design Study group Sample size
Data collection tool Outcome measure Association
Outcome/explanatory variable Point estimate (95% CI)
Frequency of moving patient around on the bed
0 1-4 5-9 >10
Frequency of lifting patient in and out of bath with hoist
0 1-4 ≥5
Low mood No Yes
1 1.3 (0.8-1.9) 1.5 (1.0-2.3) 1.7 (1.1-2.5) 1 1 1.4 (1.0-1.9) 2.0 (1.2-3.3) 2.1 (1.2-3.6) 0.3 (0.5-3.8) 1 1 1.4 (0.8-2.3) 3.4 (1.4-8.2)
Smedley et al., 2003, England
Baseline and 3 monthly follow-up over two years
Nurses Baseline (1157) Follow-up (587)
Baseline Postal questionnaire asking about demographic details, workplace activities, psychosocial aspects of work and musculoskeletal and non-musculoskeletal symptoms Follow-up Asked about new neck/shoulder pain and any change of job
Incident neck or shoulder pain lasting for longer than a day
Incident neck or shoulder pain Past neck or shoulder pain
Never >1 year ago at baseline Within past year at baseline
Duration Never <1 week 1-4 weeks >4 weeks
Past low back pain Never >1 year ago at baseline Within past year at baseline
Duration Never <1 week 1-4 weeks >4 weeks
1 1.6 (1.1-2.3) 2.8 (2.0-3.9) 1 1.7 (1.1-2.5) 2.3 (1.5-3.3) 2.6 (1.2-4.0) 1 1.8 (1.2-2.7) 1.9 (1.4-2.7) 1 1.4 (0.9-2.3) 1.8 (1.2-2.7) 2.3 (1.6-3.3)
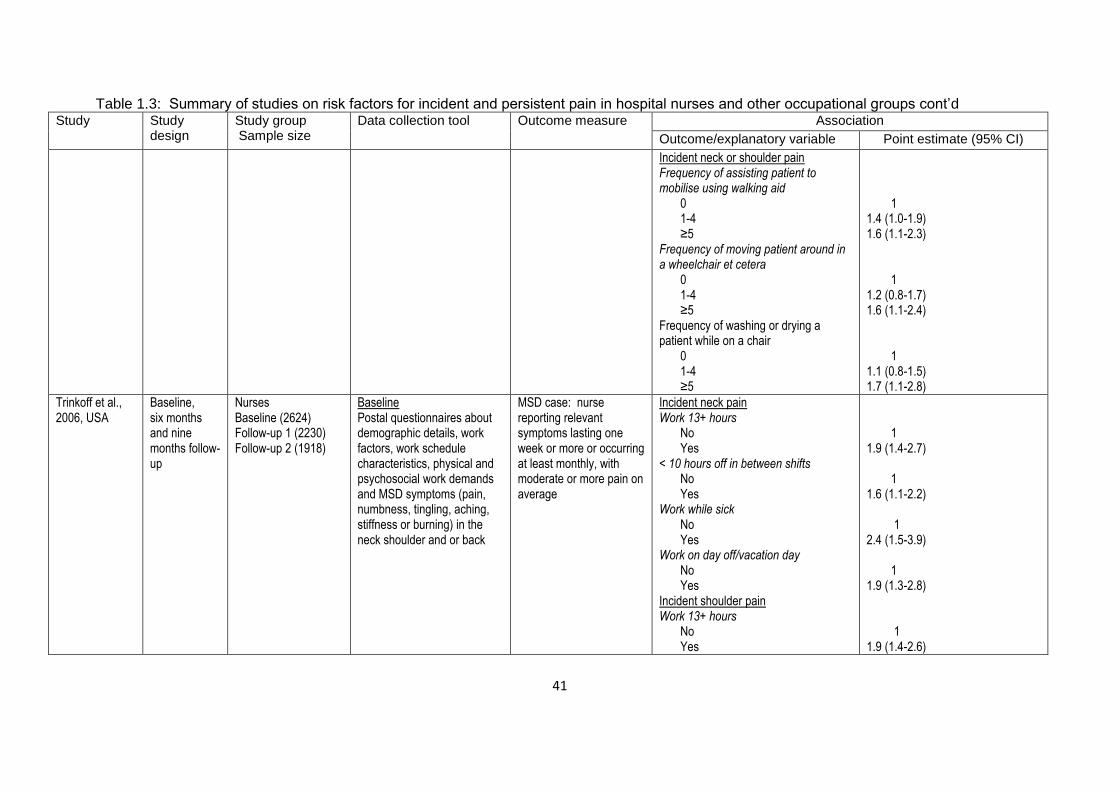
41
Table 1.3: Summary of studies on risk factors for incident and persistent pain in hospital nurses and other occupational groups cont’d Study Study
design Study group Sample size
Data collection tool Outcome measure Association
Outcome/explanatory variable Point estimate (95% CI)
Incident neck or shoulder pain Frequency of assisting patient to mobilise using walking aid
0 1-4 ≥5
Frequency of moving patient around in a wheelchair et cetera
0 1-4 ≥5
Frequency of washing or drying a patient while on a chair
0 1-4 ≥5
1 1.4 (1.0-1.9) 1.6 (1.1-2.3) 1 1.2 (0.8-1.7) 1.6 (1.1-2.4) 1 1.1 (0.8-1.5) 1.7 (1.1-2.8)
Trinkoff et al., 2006, USA
Baseline, six months and nine months follow-up
Nurses Baseline (2624) Follow-up 1 (2230) Follow-up 2 (1918)
Baseline Postal questionnaires about demographic details, work factors, work schedule characteristics, physical and psychosocial work demands and MSD symptoms (pain, numbness, tingling, aching, stiffness or burning) in the neck shoulder and or back
MSD case: nurse reporting relevant symptoms lasting one week or more or occurring at least monthly, with moderate or more pain on average
Incident neck pain Work 13+ hours
No Yes
< 10 hours off in between shifts No Yes
Work while sick No Yes
Work on day off/vacation day No Yes
Incident shoulder pain Work 13+ hours
No Yes
1 1.9 (1.4-2.7) 1 1.6 (1.1-2.2) 1 2.4 (1.5-3.9) 1 1.9 (1.3-2.8) 1 1.9 (1.4-2.6)
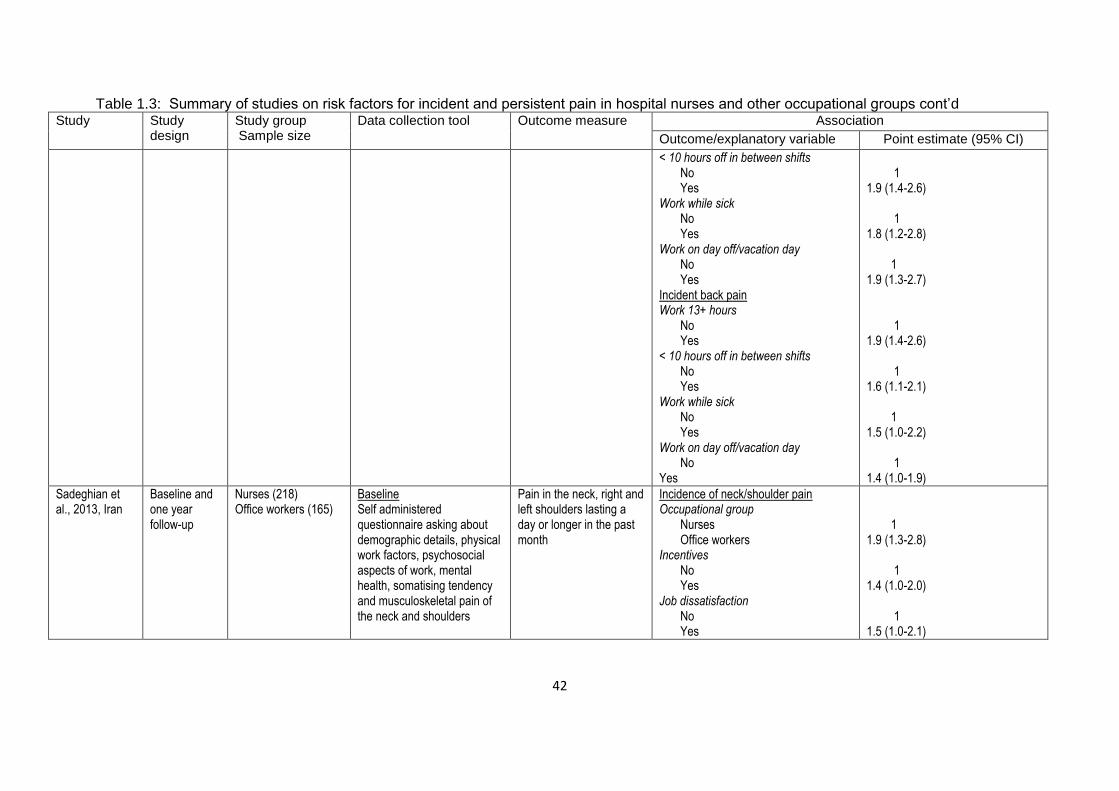
42
Table 1.3: Summary of studies on risk factors for incident and persistent pain in hospital nurses and other occupational groups cont’d Study Study
design Study group Sample size
Data collection tool Outcome measure Association
Outcome/explanatory variable Point estimate (95% CI)
< 10 hours off in between shifts No Yes
Work while sick No Yes
Work on day off/vacation day No Yes
Incident back pain Work 13+ hours
No Yes
< 10 hours off in between shifts No Yes
Work while sick No Yes
Work on day off/vacation day No
Yes
1 1.9 (1.4-2.6) 1 1.8 (1.2-2.8) 1 1.9 (1.3-2.7) 1 1.9 (1.4-2.6) 1 1.6 (1.1-2.1) 1 1.5 (1.0-2.2) 1 1.4 (1.0-1.9)
Sadeghian et al., 2013, Iran
Baseline and one year follow-up
Nurses (218) Office workers (165)
Baseline Self administered questionnaire asking about demographic details, physical work factors, psychosocial aspects of work, mental health, somatising tendency and musculoskeletal pain of the neck and shoulders
Pain in the neck, right and left shoulders lasting a day or longer in the past month
Incidence of neck/shoulder pain Occupational group
Nurses Office workers
Incentives No Yes
Job dissatisfaction No Yes
1 1.9 (1.3-2.8) 1 1.4 (1.0-2.0) 1 1.5 (1.0-2.1)
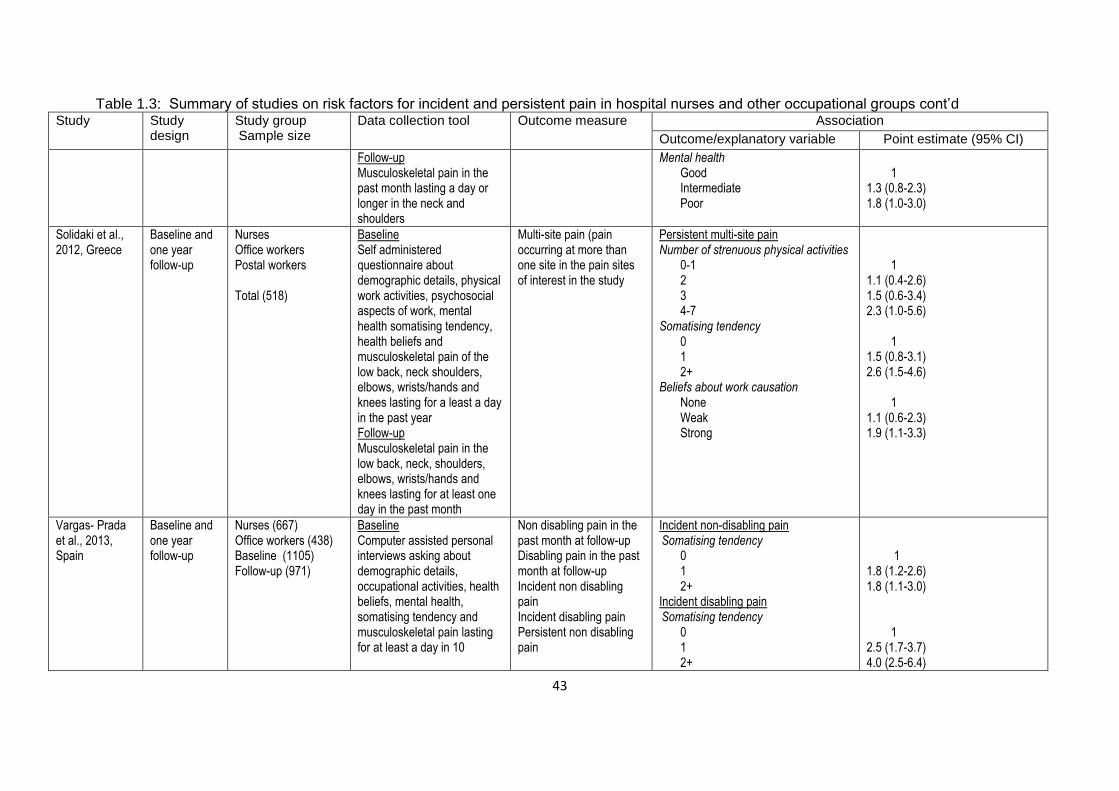
43
Table 1.3: Summary of studies on risk factors for incident and persistent pain in hospital nurses and other occupational groups cont’d Study Study
design Study group Sample size
Data collection tool Outcome measure Association
Outcome/explanatory variable Point estimate (95% CI)
Follow-up Musculoskeletal pain in the past month lasting a day or longer in the neck and shoulders
Mental health Good Intermediate Poor
1 1.3 (0.8-2.3) 1.8 (1.0-3.0)
Solidaki et al., 2012, Greece
Baseline and one year follow-up
Nurses Office workers Postal workers Total (518)
Baseline Self administered questionnaire about demographic details, physical work activities, psychosocial aspects of work, mental health somatising tendency, health beliefs and musculoskeletal pain of the low back, neck shoulders, elbows, wrists/hands and knees lasting for a least a day in the past year Follow-up Musculoskeletal pain in the low back, neck, shoulders, elbows, wrists/hands and knees lasting for at least one day in the past month
Multi-site pain (pain occurring at more than one site in the pain sites of interest in the study
Persistent multi-site pain Number of strenuous physical activities
0-1 2 3 4-7
Somatising tendency 0 1 2+
Beliefs about work causation None Weak Strong
1 1.1 (0.4-2.6) 1.5 (0.6-3.4) 2.3 (1.0-5.6) 1 1.5 (0.8-3.1) 2.6 (1.5-4.6) 1 1.1 (0.6-2.3) 1.9 (1.1-3.3)
Vargas- Prada et al., 2013, Spain
Baseline and one year follow-up
Nurses (667) Office workers (438) Baseline (1105) Follow-up (971)
Baseline Computer assisted personal interviews asking about demographic details, occupational activities, health beliefs, mental health, somatising tendency and musculoskeletal pain lasting for at least a day in 10
Non disabling pain in the past month at follow-up Disabling pain in the past month at follow-up Incident non disabling pain Incident disabling pain Persistent non disabling pain
Incident non-disabling pain Somatising tendency
0 1 2+
Incident disabling pain Somatising tendency
0 1 2+
1 1.8 (1.2-2.6) 1.8 (1.1-3.0) 1 2.5 (1.7-3.7) 4.0 (2.5-6.4)

44
Table 1.3: Summary of studies on risk factors for incident and persistent pain in hospital nurses and other occupational groups cont’d Study Study
design Study group Sample size
Data collection tool Outcome measure Association
Outcome/explanatory variable Point estimate (95% CI)
anatomical sites in the past month before baseline and whether the pain was disabling Follow-up Musculoskeletal pain lasting for at least a day in 10 anatomical sites in the past month before follow-up and whether the pain was disabling
Persistent disabling pain Persistent non-disabling pain Adverse beliefs about musculoskeletal pain
Prognosis Incident disabling pain Adverse beliefs about musculoskeletal pain
Prognosis Incident non-disabling pain Adverse beliefs about musculoskeletal pain
Prognosis Persistent disabling pain Adverse beliefs about musculoskeletal pain Prognosis
2.8 (0.9-8.7) 3.7 (1.1-12.5) 2.2 (0.9-5.2) 2.5 (1.2-5.5)
Bonzini et al., 2015, Italy
Baseline and one year follow-up
Nurses (305) Baseline Self-administered questionnaire about demographic details, work activities, stress at work (ERI) and musculoskeletal pain in the low back neck and shoulders Follow-up musculoskeletal pain in the low back neck and shoulders and ERI
Musculoskeletal pain lasting more than a day in the low back neck and shoulders in the past month and effort reward imbalance.
Baseline Follow-up All LBP ERI>1 LBP with ERI>1 ERI>1 LBP with ER≤1 ERI>1 All NSP ERI>1 NSP with ERI>1 ERI>1 NSP with ERI≤1 ERI>1 Any pain with ERI>1 LBP LBP with ERI>1 LBP No pain with ERI>1 LBP Any pain with ERI>1 NSP NSP with ERI>1 NSP No pain with ERI>1 NSP
2.1 (1.4-3.3) 0.9 (0.6-1.4) 2.7 (1.4-5.0) 2.3 (1.4-3.8) 1.1 (0.6-1.8) 2.6 (1.3-5.1) 1.2 (1.0-1.5) 1.0 (0.8-1.2) 1.2 (0.6-2.3) 1.2 (1.0-1.5) 1.1 (0.9-1.2) 0.9 (0.4-2.2)
45
1.3.2 MSDs in workers performing computer-telephone interactive tasks
Workers who perform computer-telephone interactive (CTI) tasks are at an increased
risk of developing MSDs (Taylor et al., 2003, Toomingas and Gavhed, 2008). Their
work involves using a computer while simultaneously talking over the telephone
(Halford and Cohen, 2003). The CTI tasks form the main activity in call centres and
office environments where communication for various industry groups including
telecommunications and banking has been centralised and streamlined for efficient
customer, sales and support services (Taylor et al., 2003, Croidieu et al., 2008). The
ergonomic exposures of workers performing CTI tasks are similar to those of
workers who use computers (Bergqvist et al., 1995, Sillanpää et al., 2003) but have
additional exposures from the organisation of work which are unique to these tasks
(Halford and Cohen, 2003, Toomingas et al., 2003).
The use of computers has long been associated with MSDs in workers from different
occupational groups and workplaces (Bergqvist et al., 1995). As such, it is expected
that workers who perform CTI tasks would have higher prevalences of MSDs
(Sillanpää et al., 2003) than workers who use only computers (Jensen et al., 1998).
The main risk factors that are associated with the development of MSDs in computer
work are physical and psychosocial work factors (Bernard, 1997). The main physical
factors are design and layout of the computer workstation which dictate the working
posture. For instance, poor design and layout promote awkward posture (Marcus et
al., 2002) which may lead to the development of MSDs. The psychosocial factors
include poor job control, lack of social support, job insecurity and poor lighting.

46
1.3.2.1 Prevalence and body site localisation of MSDs in workers
performing computer-telephone interactive tasks
Recent studies examining the prevalence of MSDs in workers performing computer-
telephone interactive tasks are sparse. So are systematic literature reviews.
Workers who perform CTI tasks are found in many industries. However, only one
systematic literature review of MSDs in workers in the telecommunications industry
which included workers performing CTI tasks could be found (Crawford et al., 2008).
A literature review was therefore, conducted on studies investigating the prevalence
and body site localisation of MSDs in workers performing CTI tasks. These studies
have been summarised and are presented in Table 1.5.
Five studies were reviewed and all were cross-sectional (Norman et al., 2004, Rocha
et al., 2005, Sprigg et al., 2007, Norman et al., 2008, Fouad El-Bestar et al., 2011).
Two used 12-month prevalence (Rocha et al., 2005, Fouad El-Bestar et al., 2011),
another two used 1-month (Norman et al., 2004) and in one the period of prevalence
was not stated. In all the studies, MSDs were measured by questionnaires. One
study (Fouad El-Bestar et al., 2011), used clinical examination in addition to the
questionnaire. The outcome measures were musculoskeletal symptoms and
conditions occurring in the upper extremities and back. None of the studies included
the lower limbs.
A study conducted in Sweden (Norman et al., 2004), investigated two groups of
workers, one being call centre workers as the subjects and the other computer users
as the reference group. The overall prevalence of symptoms among the call centre
workers was higher than that of the reference group with women having a higher
47
prevalence than men. The prevalence in the body sites selected for the study
followed a similar pattern with women having higher prevalences than men.
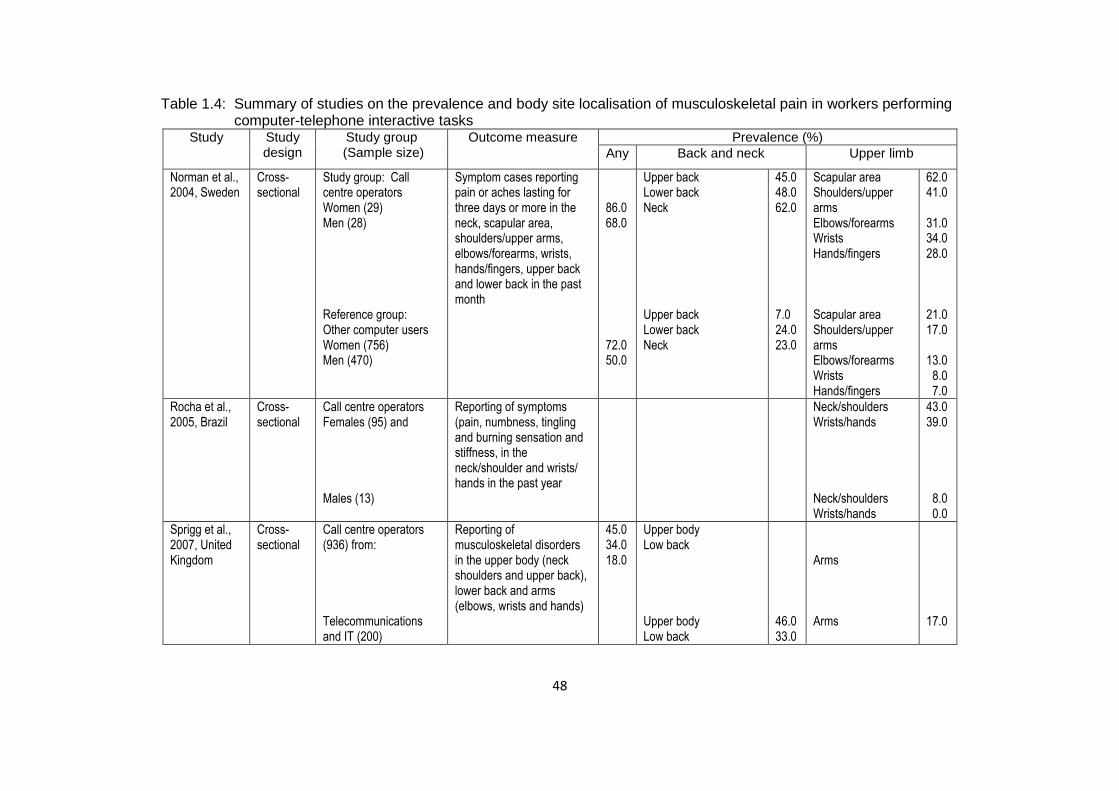
48
Table 1.4: Summary of studies on the prevalence and body site localisation of musculoskeletal pain in workers performing computer-telephone interactive tasks
Study
Study design
Study group (Sample size)
Outcome measure Prevalence (%)
Any Back and neck Upper limb
Norman et al., 2004, Sweden
Cross-sectional
Study group: Call centre operators Women (29) Men (28) Reference group: Other computer users Women (756) Men (470)
Symptom cases reporting pain or aches lasting for three days or more in the neck, scapular area, shoulders/upper arms, elbows/forearms, wrists, hands/fingers, upper back and lower back in the past month
86.0 68.0 72.0 50.0
Upper back Lower back Neck Upper back Lower back Neck
45.0 48.0 62.0 7.0 24.0 23.0
Scapular area Shoulders/upper arms Elbows/forearms Wrists Hands/fingers Scapular area Shoulders/upper arms Elbows/forearms Wrists Hands/fingers
62.0 41.0 31.0 34.0 28.0 21.0 17.0 13.0 8.0 7.0
Rocha et al., 2005, Brazil
Cross-sectional
Call centre operators Females (95) and Males (13)
Reporting of symptoms (pain, numbness, tingling and burning sensation and stiffness, in the neck/shoulder and wrists/ hands in the past year
Neck/shoulders Wrists/hands Neck/shoulders Wrists/hands
43.0 39.0 8.0 0.0
Sprigg et al., 2007, United Kingdom
Cross-sectional
Call centre operators (936) from: Telecommunications and IT (200)
Reporting of musculoskeletal disorders in the upper body (neck shoulders and upper back), lower back and arms (elbows, wrists and hands)
45.0 34.0 18.0
Upper body Low back Upper body Low back
46.0 33.0
Arms Arms
17.0

49
Table 1.4: Summary of studies on the prevalence and body site localisation of musculoskeletal pain in workers performing computer-telephone interactive tasks cont’d
Study
Study design
Study group (Sample size)
Outcome measure Prevalence (%)
Any Back and neck Upper limb
Financial services (193) Retail (150) Utilities (138) Hotels and leisure (82) Public and voluntary sector (81) Transport and travel (58) Emergency services (19) Outsourcing (15)
Upper body Low back Upper body Low back Upper body Low back Upper body Low back Upper body Low back Upper body Low back Upper body Low back Upper body Low back
8.0 27.0 43.0 37.0 45.0 33.0 59.0 41.0 53.0 28.0 48.0 48.0 53.0 37.0 27.0 47.0
Arms Arms Arms Arms Arms Arms Arms Arms
15.0 19.0 16.0 15.0 25.0 24.0 21.0 27.0
Norman et al., 2008, Sweden
Cross-sectional
Call centre (CC) operators (1183)
Reported musculoskeletal pain or aches in the neck/shoulder (neck and or shoulder/scapular area), arms/hands (shoulder joints/upper arms, elbows/lower arms, wrists and or hands and numbness in hands) in the past month
Neck/shoulders
65.0
Arms/hands Neck/shoulder only Shoulder joint/upper arm only Elbows/lower arms, wrists/hands and numbness in hands only
49.0 25.0 2.0 6.0

50
Table 1.4: Summary of studies on the prevalence and body site localisation of musculoskeletal pain in workers performing computer-telephone interactive tasks cont’d
Study
Study design
Study group (Sample size)
Outcome measure Prevalence (%)
Any Back and neck Upper limb
Internal CCs (510) External CCs (673)
Neck/shoulders Neck/shoulders
64.0 67.0
Arms/hands Neck/shoulder only Shoulder joint/upper arm only Elbows/lower arms, wrists/hands and numbness in hands only Arms/hands Neck/shoulder only Shoulder joint/upper arm only Elbows/lower arms, wrists/hands and numbness in hands only
51.0 22.0 2.0 6.0 48.0 27.0 1.0 6.0
El-Bestar et al., 2011, Egypt
Cross-sectional
Telecommunication workers Subjects: Telephone and computer users (60)
Musculoskeletal symptoms (pain, stiffness, numbness and tingling or muscle weakness that had lasted over a year. Those with symptoms and satisfied certain conditions were sent for clinical examination and investigation for musculoskeletal conditions of the neck/upper extremity
28.3 Cervical spondylosis Cervical disc space narrowing
18.3 18.3
Carpal tunnel syndrome
6.6
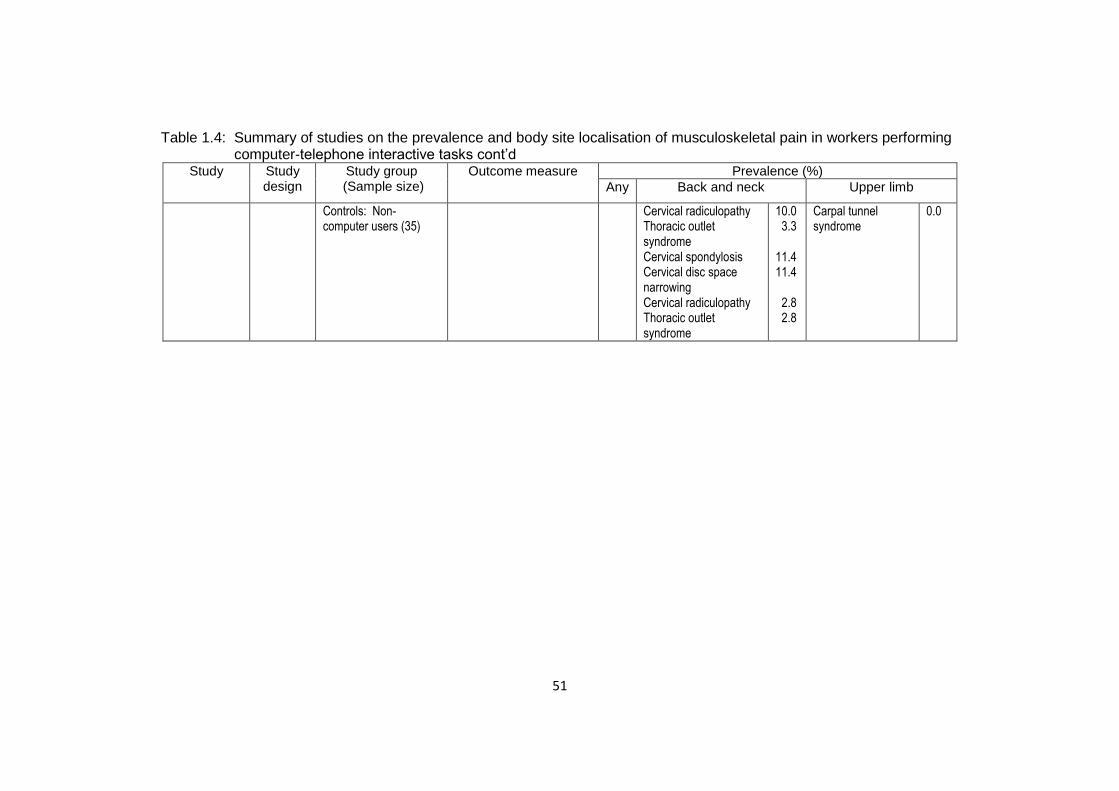
51
Table 1.4: Summary of studies on the prevalence and body site localisation of musculoskeletal pain in workers performing computer-telephone interactive tasks cont’d
Study
Study design
Study group (Sample size)
Outcome measure Prevalence (%)
Any Back and neck Upper limb
Controls: Non-computer users (35)
Cervical radiculopathy Thoracic outlet syndrome Cervical spondylosis Cervical disc space narrowing Cervical radiculopathy Thoracic outlet syndrome
10.0 3.3 11.4 11.4 2.8 2.8
Carpal tunnel syndrome
0.0
52
A similar pattern was observed in another study conducted in Brazil (Rocha et al.,
2005), where female call centre operators had higher prevalences of symptoms in
the body sites selected for the study than males.
A study examining working practices and MSDs in call centre workers from nine
industries was conducted in the United Kingdom (Sprigg et al., 2007). The
prevalence of symptoms in the body sites of interest in the study showed that the
upper body had the highest prevalence of symptoms with a range of 27.0%-59.0%
from “Outsourcing” on the lowest end and “Hotel and leisure” on the upper end. Low
back was next with “Financial services’ having the lowest prevalence (27.0%) and
“Transport and travel” having the highest (48.0%). Finally, the prevalence for the
arms ranged from 15.0%-27.0% with “Financial services” having the lowest
prevalence and “Outsourcing” the highest.
Two comparative studies, one conducted in Sweden (Norman et al., 2008) and the
other in Egypt (Fouad El-Bestar et al., 2011) are of interest. The Swedish study
compared reported MSD pain in call centre (CC) workers in internal (departments or
separate companies within larger corporations) and external (independent
companies working on contracts from other companies) CCs while the Egyptian
study compared diagnosed MSD conditions in telecommunications workers who
were doing CTI tasks (subjects) and other workers who were not using computers
(controls). In the Swedish study, the prevalences of pain in the body sites of interest
in the study were similar. On the other hand, there were differences in the
prevalences of MSD conditions of interest between the subjects and controls in the
Egyptian study. The subjects had higher prevalences than the controls.
53
The reviewed studies were heterogeneous which presented a challenge when trying
to summarise and integrate their findings (Armstrong et al., 1996). The differences
were in the measurement tools, disease frequency estimates and outcome
measures used. The cross-sectional study design, which was common in all the
studies, brought a limitation of temporality between exposure and effect which
complicates assessing causality.
1.3.2.2 Features and functional consequences of MSDs in workers
performing computer-telephone interactive tasks
In the studies of MSDs in workers performing computer-telephone interactive tasks
the features and functional consequences of MSDs have been used to indicate the
presence of MSDs and their severity. In most of these studies, pain which is the
main symptom of MSDs, was used as a feature which differentiates between
workers with MSDs and those without or those who are cases and not cases (Rocha
et al., 2005, Norman et al., 2008). In other studies, pain is used in combination with
its duration in days for the same purpose mentioned above (Ferreira and Saldiva,
2002, Toomingas et al., 2003, Norman et al., 2004). A few studies have gone a
step further to examine the functional consequences of MSDs which are a function of
pain (Ferreira and Saldiva, 2002, d'Errico et al., 2010).
A study investigating working conditions and MSDs among workers in a call centre of
a bank in Brazil (Rocha et al., 2005), used pain as one of the symptoms of neck or
shoulder and wrist or hand MSDs to distinguish between workers with MSDs of
these body sites and those without. Another study assessing the associations
between work exposures and MSDs in internal and external call centres in Sweden
54
(Norman et al., 2008), used pain to make a distinction between workers with MSDs
of the neck or shoulder and arm or hand and workers who did not have these MSDs.
Studies from the same countries (Brazil and Sweden) mentioned above used pain,
duration of pain and the number of days with pain to differentiate between workers
with MSDs and those without. Ferreira (2002) studied the predictors of MSDs in
workers involved in computer-telephone interactive tasks in a call centre of a bank in
Brazil. The workers with MSDs had to have more than seven days of pain in the
neck, shoulders, elbows, hands and wrists. In the Norman (2004) study, which
evaluated working conditions and MSDs in female and male employees in a call
centre in Sweden, the workers with MSDs of the neck, scapular area, shoulder or
upper arm, upper back, elbow or forearm, wrist, hand or finger and lower back had to
have pain for three days or more.
The severity of MSDs in workers doing CTI tasks has been reported in studies that
include functional consequences of MSDs. These include days taken away from
work, physician consultations and treatments due to MSDs. A study conducted in
France, to examine the impact of working conditions on the health of call centre
employees found that nearly half of the employees with various MSDs had consulted
a doctor and up to 80.0% of these had received medical treatment for the MSDs
(Charbotel et al., 2009). The inclusion criteria for MSDs in the d’ Errico (2010) study
was that the workers had to have consulted a physician and or taken medication for
MSDs. The study evaluated whether the risk factors for neck or shoulder and elbow
or wrist or hand MSDs were different in call centre workers in Italy. The study found
that more than half of the workers with MSDs met these criteria (d'Errico et al.,
55
2010). These studies demonstrate the impact of some features that MSDs impose
on workers doing CTI tasks.
1.3.2.3 Risk factors for MSDs in workers performing computer-telephone interactive tasks
The studies investigating the risk factors associated with MSDs in workers
performing computer-telephone interactive tasks have suggested that the risk factors
in these workers are multifactorial. This was supported by a systematic literature
review on MSDs in the United Kingdom’s telecommunications industry by Crawford
(2008), which surmised that the risk factors for MSDs in telecommunications workers
involved in CTI tasks in call centres comprise physical, psychosocial and individual
factors. These categories of risk factors are similar to those used in the National
Academy of Sciences conceptual model of possible involvement and influence of risk
factors in the development of MSDs presented in 1.3.1.3 (Barondess et al., 2001).
Using this model, the workplace can be replaced by the call centre where the CTI
tasks are carried out. The worker can be replaced by call centre workers involved in
CTI tasks. In this context, the call centre and the CTI tasks are possible sources of
physical and psychosocial risk factors while the workers doing the CTI tasks
represent the individual risk factors.
The configuration of the computer-telephone workstation may present physical risk
factors to the workers while psychosocial risk factors may emanate from the
management including electronic monitoring of CTI tasks. Individual risk factors
consist of physical activities and social aspects of life such as participation in sports
and smoking respectively; and biological characteristics comprising age and sex;
and lastly, psychological characteristics with mental health and somatising tendency
as some of the factors. The information presented in 1.3.1.3 applies here as well.
56
1.3.2.3.1 Risk factors for prevalent MSDs in workers performing computer-telephone interactive tasks
The studies investigating MSDs and associated risk factors in workers performing
computer-telephone interactive tasks have been mainly prevalence studies of
prevalent MSDs. Prevalent MSDs provide an estimate of the size of the MSD
problem in the at risk population which in this case is the workers performing CTI
tasks (Toomingas and Gavhed, 2008, Charbotel et al., 2009). Potential risk factors
have been sought in different workplaces across many industries (Ferreira et al.,
1997, Halford and Cohen, 2003). Although studies have been done in many
industries, only one systematic literature review of MSD studies in the
telecommunications industry which included workers doing CTI tasks could be found
(Crawford, 2008). This review presented a synopsis of the potential risk factors in
workers doing CTI tasks. A literature review of studies examining the risk factors
associated with prevalent MSDs in workers performing CTI tasks was therefore
conducted. The summary of the studies reviewed is presented in table 1.6.
The reviewed studies were mainly cross-sectional and used 12-month and 1-month
period prevalences of MSD symptoms. It has been said that the exposures from CTI
tasks affect the upper extremities which are constituted by the neck, shoulders,
elbows, wrists and hands. It is, therefore, not surprising that all of the reviewed
studies used the upper extremities as the outcome variable which was divided into
neck or shoulders and wrists or hands. It has been suggested that some of the risk
factors for these two locations are different (Halford and Cohen, 2003). As such, the
outcome variables are organised according to neck or shoulder, wrist or hand
following the nomenclature of the National Academy of Sciences (2001) conceptual
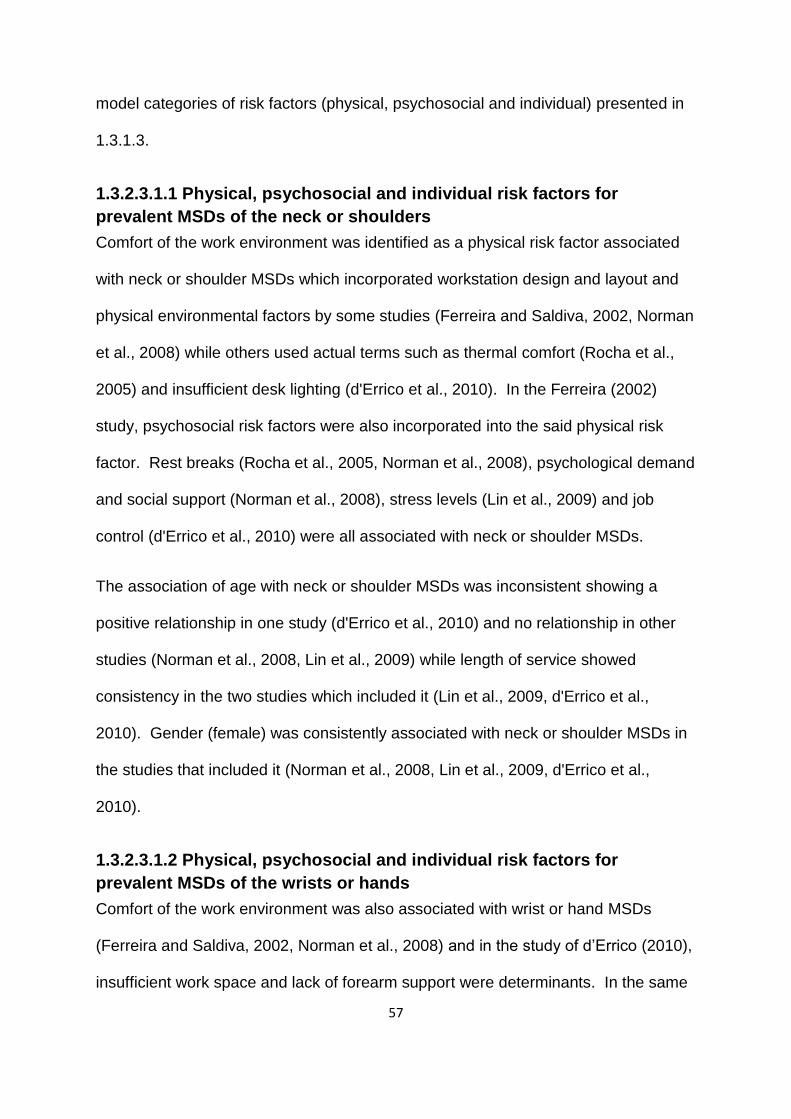
57
model categories of risk factors (physical, psychosocial and individual) presented in
1.3.1.3.
1.3.2.3.1.1 Physical, psychosocial and individual risk factors for
prevalent MSDs of the neck or shoulders
Comfort of the work environment was identified as a physical risk factor associated
with neck or shoulder MSDs which incorporated workstation design and layout and
physical environmental factors by some studies (Ferreira and Saldiva, 2002, Norman
et al., 2008) while others used actual terms such as thermal comfort (Rocha et al.,
2005) and insufficient desk lighting (d'Errico et al., 2010). In the Ferreira (2002)
study, psychosocial risk factors were also incorporated into the said physical risk
factor. Rest breaks (Rocha et al., 2005, Norman et al., 2008), psychological demand
and social support (Norman et al., 2008), stress levels (Lin et al., 2009) and job
control (d'Errico et al., 2010) were all associated with neck or shoulder MSDs.
The association of age with neck or shoulder MSDs was inconsistent showing a
positive relationship in one study (d'Errico et al., 2010) and no relationship in other
studies (Norman et al., 2008, Lin et al., 2009) while length of service showed
consistency in the two studies which included it (Lin et al., 2009, d'Errico et al.,
2010). Gender (female) was consistently associated with neck or shoulder MSDs in
the studies that included it (Norman et al., 2008, Lin et al., 2009, d'Errico et al.,
2010).
1.3.2.3.1.2 Physical, psychosocial and individual risk factors for
prevalent MSDs of the wrists or hands
Comfort of the work environment was also associated with wrist or hand MSDs
(Ferreira and Saldiva, 2002, Norman et al., 2008) and in the study of d’Errico (2010),
insufficient work space and lack of forearm support were determinants. In the same

58
way as in the neck or shoulder MSDs, psychosocial risk factors were incorporated
into the physical risk factor (Ferreira and Saldiva, 2002). Iso-strain, which is the
combination of job demand, control and social support (Norman et al., 2008) and job
security (d'Errico et al., 2010), were associated with wrist or hand MSDs. The
individual risk factor associated with wrist or hand MSDs was age (Norman et al.,
2008, Lin et al., 2009). It is important to note that in the Lin (2009) study, MSDs
were not differentiated into neck or shoulder and wrists or hands but were referred to
as musculoskeletal discomfort.
The heterogeneity of studies was noted in so far as measurement methods, outcome
measures and risk factors are concerned. This makes it difficult to summarise the
findings and to compare and contrast the studies as has been pointed out by others
(Hagberg et al., 2012, Armstrong et al., 1996). The preponderance of cross-
sectional studies with sparse systematic literature reviews limits their ability to
establish a causal relationship between the risk factors and MSDs (da Costa and
Vieira, 2010).

59
Table 1.5: Risk factors for musculoskeletal disorders in workers performing computer-telephone interactive tasks
Study Study design Study group; sample size (response rate)
Data collection tool Outcome measure Association Outcome/ explanatory variable Point estimate (95% CI)
Ferreira and Saldiva, 2002, Brazil
Retrospective twice weekly follow-ups from October 1995-January 1996
Call centre operators in a bank (62) Active telemarketing centre (24) Telephone call centre (38)
Interviews of managers, supervisors and operators to identify features of the operations; observations and measurements of workstations and physical environment; self administered questionnaire about demographic details, musculoskeletal symptoms, exercises during rest, ergonomics of workstation, work equipment, information network, work organisation and social environment.
Reports of musculoskeletal symptoms (pain, prickling, stiffness et cetera) in the neck and or shoulder, hand and or wrist lasting over seven consecutive days an time in the current job
Incident neck or shoulder Active telemarketing Incident hand or wrist Active telemarketing
- -
Rocha et al., 2005, Brazil
Cross-sectional Operators at a telephone call centre Females (95) Males (13)
An ergonomic work analysis tool of the activities performed in the call centre and questionnaire (not specified) to collect demographic details, psychosocial and physical risk factors and presence of musculoskeletal symptoms in the past year
Reporting of symptoms (pain, numbness, tingling and burning sensation and stiffness, in the neck/shoulder and wrists/ hands in the past year
Neck/shoulder Daily rest breaks for recovery Three/more One /Two Thermal comfort Good/regular Bad Wrist/hands Calls answered daily ≤140 >140
1 3.17 (1.11-8.97) 1 3.06 (1.09-8.62) 1 3.36 (1.16-9.71)
Norman et al., 2008, Sweden
Cross-sectional Call centre (CC) operators (1183) Response rate (77.0%) Internal CC (510) External CC (673)
A self administered questionnaire about demographic details, characteristics of work, physical and psychosocial exposures and musculoskeletal symptoms in the past month
Reported musculoskeletal pain or aches in the neck/shoulder (neck and or shoulder/scapular area), arms/hands (shoulder joints/upper arms, elbows/lower
Neck/shoulder Gender Men Women Age (continuous) Complexity of work High Medium Low
Internal CC External CC 1 2.26 (1.35-3.76) 2.23 (1.42-3.48) 1.01 (0.99-1.03) 0.99 (0.98-1.01) 1 1.02 (0.57-1.82) 2.41 (1.08-5.40)

60
Table 1.5: Risk factors for musculoskeletal disorders in workers performing computer-telephone interactive tasks cont’d
Study Study design Study group; sample size (response rate)
Data collection tool Outcome measure Association Outcome/ explanatory variable Point estimate (95% CI)
arms, wrists and or hands and numbness in hands) in the past month
Total time of customer calls/day ≤240 minutes >240-≤330 minutes >330-≤420 minutes >420 minutes Average duration of calls ≤120 seconds >120-≤180 seconds >190-≤300 seconds >300 seconds Continuous computer work without a break > 10 minutes ≤90 minutes >90-≤120 minutes >120-≤150 minutes >150 minutes Comfort of work environment High (≤300 (>30-≤36) (>36-≤43) Low (>43) Psychological demands Low(≤98) (>98-≤113) (>113-≤127) High(>127)
Internal CC External CC 1 1 3.47 (1.50-8.03) 0.65 (0.35-1.23) 1.76 (0.92-3.34) 1.16 (0.66-2.03) 0.98 (0.45-2.13) 1.21 (0.68-2.16) 1 1 1.84 (0.91-3.72) 0.33 (0.19-0.58) 2.00 (1.00-3.98) 0.82 (0.45-1.47) 1.84 (0.85-3.99) 0.79 (0.41-1.51) 1 1.00 (1.14-4.74) 2.33 (1.14-4.74) 0.31 (0.71-2.40) 1 1 0.72 (0.39-1.32) 0.25 (0.72-2.16) 1.33 (0.69-2.56) 1.88 (1.05-3.38) 6.63 (2.46-17.90) 3.07 (1.67-5.64) 1 1 1.52 (0.78-2.97) 0.88 (0.52-1.56) 2.10 (1.06-4.17) 1.56 (0.86-2.82) 1.38 (0.70-2.69) 0.88 (0.50-1.57)
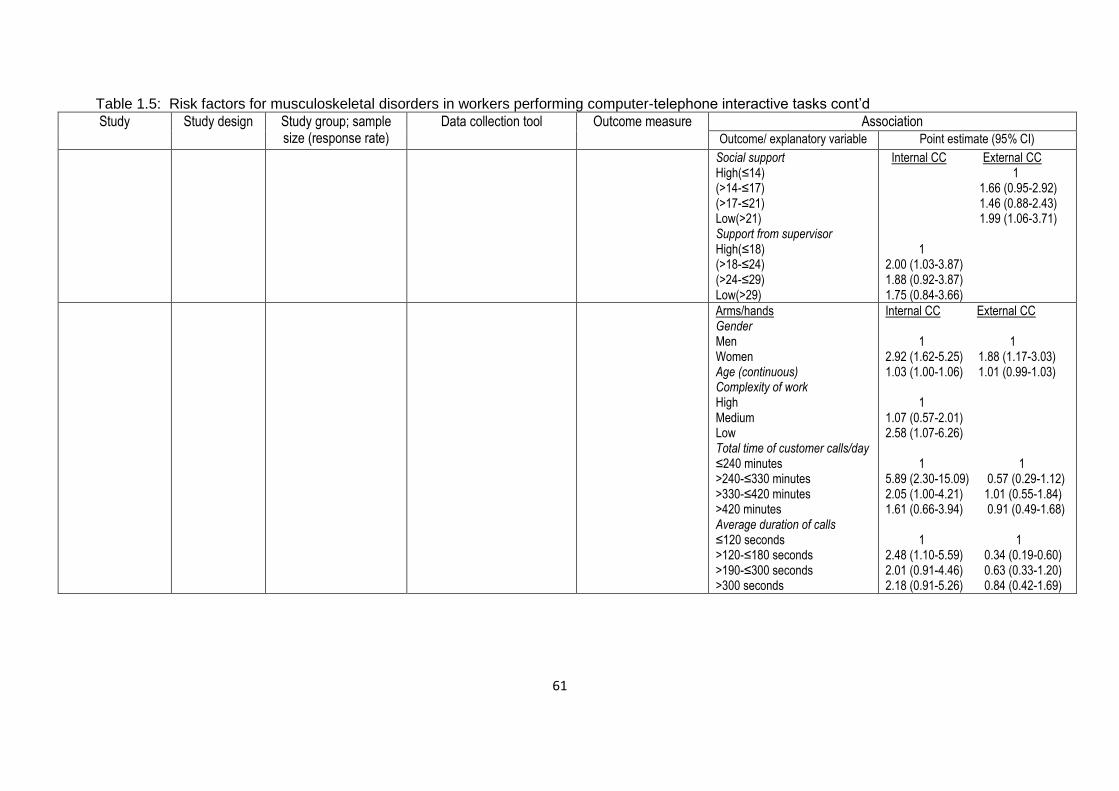
61
Table 1.5: Risk factors for musculoskeletal disorders in workers performing computer-telephone interactive tasks cont’d
Study Study design Study group; sample size (response rate)
Data collection tool Outcome measure Association Outcome/ explanatory variable Point estimate (95% CI)
Social support High(≤14) (>14-≤17) (>17-≤21) Low(>21) Support from supervisor High(≤18) (>18-≤24) (>24-≤29) Low(>29)
Internal CC External CC 1 1.66 (0.95-2.92) 1.46 (0.88-2.43) 1.99 (1.06-3.71) 1 2.00 (1.03-3.87) 1.88 (0.92-3.87) 1.75 (0.84-3.66)
Arms/hands Gender Men Women Age (continuous) Complexity of work High Medium Low Total time of customer calls/day ≤240 minutes >240-≤330 minutes >330-≤420 minutes >420 minutes Average duration of calls ≤120 seconds >120-≤180 seconds >190-≤300 seconds >300 seconds
Internal CC External CC 1 1 2.92 (1.62-5.25) 1.88 (1.17-3.03) 1.03 (1.00-1.06) 1.01 (0.99-1.03) 1 1.07 (0.57-2.01) 2.58 (1.07-6.26) 1 1 5.89 (2.30-15.09) 0.57 (0.29-1.12) 2.05 (1.00-4.21) 1.01 (0.55-1.84) 1.61 (0.66-3.94) 0.91 (0.49-1.68) 1 1 2.48 (1.10-5.59) 0.34 (0.19-0.60) 2.01 (0.91-4.46) 0.63 (0.33-1.20) 2.18 (0.91-5.26) 0.84 (0.42-1.69)
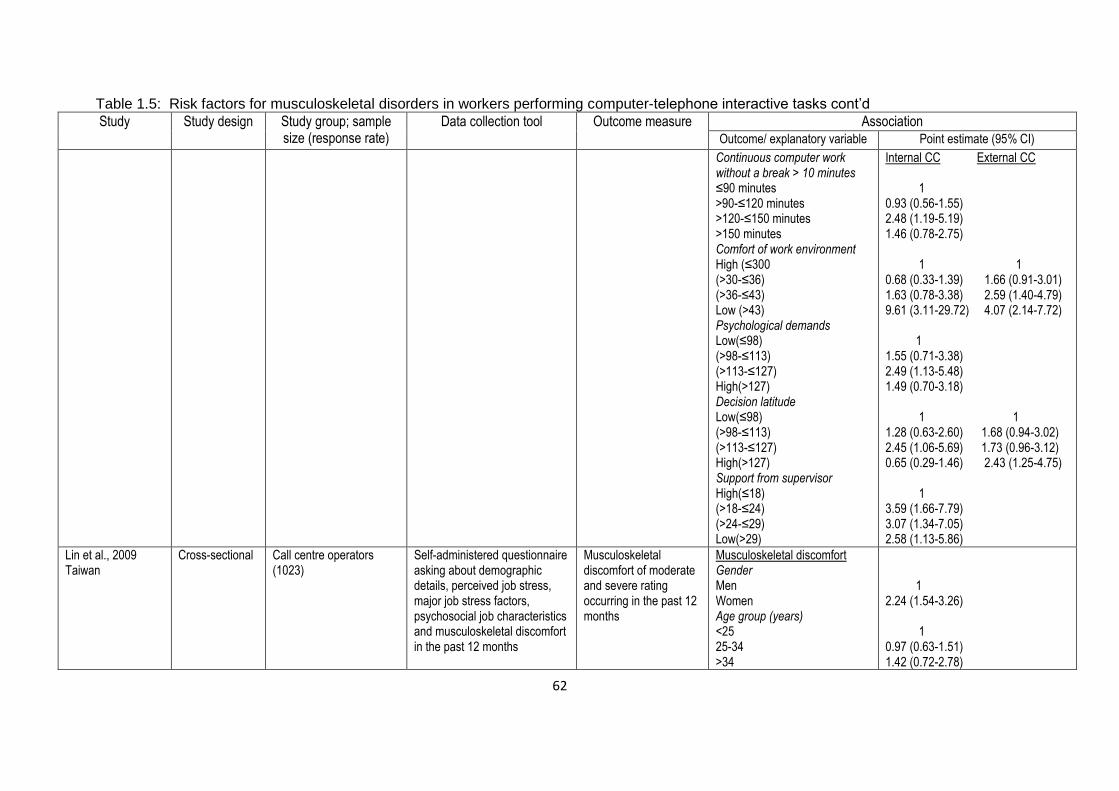
62
Table 1.5: Risk factors for musculoskeletal disorders in workers performing computer-telephone interactive tasks cont’d
Study Study design Study group; sample size (response rate)
Data collection tool Outcome measure Association Outcome/ explanatory variable Point estimate (95% CI)
Continuous computer work without a break > 10 minutes ≤90 minutes >90-≤120 minutes >120-≤150 minutes >150 minutes Comfort of work environment High (≤300 (>30-≤36) (>36-≤43) Low (>43) Psychological demands Low(≤98) (>98-≤113) (>113-≤127) High(>127) Decision latitude Low(≤98) (>98-≤113) (>113-≤127) High(>127) Support from supervisor High(≤18) (>18-≤24) (>24-≤29) Low(>29)
Internal CC External CC 1 0.93 (0.56-1.55) 2.48 (1.19-5.19) 1.46 (0.78-2.75) 1 1 0.68 (0.33-1.39) 1.66 (0.91-3.01) 1.63 (0.78-3.38) 2.59 (1.40-4.79) 9.61 (3.11-29.72) 4.07 (2.14-7.72) 1 1.55 (0.71-3.38) 2.49 (1.13-5.48) 1.49 (0.70-3.18) 1 1 1.28 (0.63-2.60) 1.68 (0.94-3.02) 2.45 (1.06-5.69) 1.73 (0.96-3.12) 0.65 (0.29-1.46) 2.43 (1.25-4.75) 1 3.59 (1.66-7.79) 3.07 (1.34-7.05) 2.58 (1.13-5.86)
Lin et al., 2009 Taiwan
Cross-sectional Call centre operators (1023)
Self-administered questionnaire asking about demographic details, perceived job stress, major job stress factors, psychosocial job characteristics and musculoskeletal discomfort in the past 12 months
Musculoskeletal discomfort of moderate and severe rating occurring in the past 12 months
Musculoskeletal discomfort Gender Men Women Age group (years) <25 25-34 >34
1 2.24 (1.54-3.26) 1 0.97 (0.63-1.51) 1.42 (0.72-2.78)
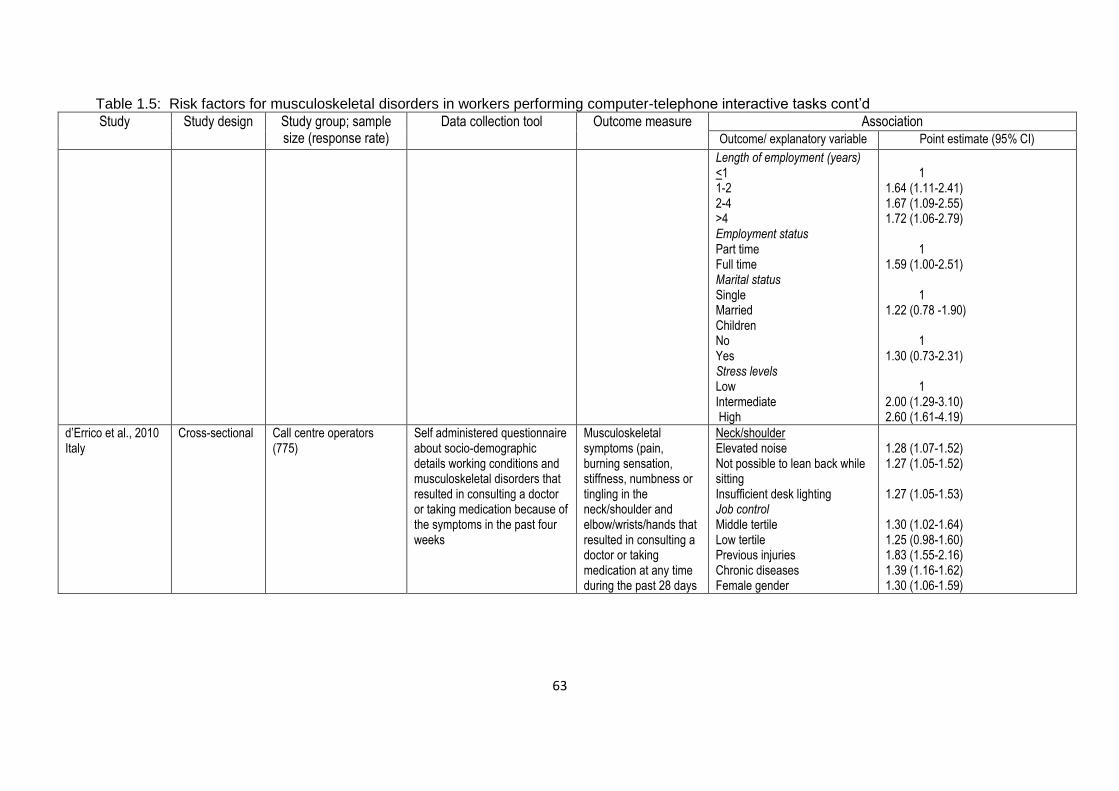
63
Table 1.5: Risk factors for musculoskeletal disorders in workers performing computer-telephone interactive tasks cont’d
Study Study design Study group; sample size (response rate)
Data collection tool Outcome measure Association Outcome/ explanatory variable Point estimate (95% CI)
Length of employment (years) <1 1-2 2-4 >4 Employment status Part time Full time Marital status Single Married Children No Yes Stress levels Low Intermediate High
1 1.64 (1.11-2.41) 1.67 (1.09-2.55) 1.72 (1.06-2.79) 1 1.59 (1.00-2.51) 1 1.22 (0.78 -1.90) 1 1.30 (0.73-2.31) 1 2.00 (1.29-3.10) 2.60 (1.61-4.19)
d’Errico et al., 2010 Italy
Cross-sectional Call centre operators (775)
Self administered questionnaire about socio-demographic details working conditions and musculoskeletal disorders that resulted in consulting a doctor or taking medication because of the symptoms in the past four weeks
Musculoskeletal symptoms (pain, burning sensation, stiffness, numbness or tingling in the neck/shoulder and elbow/wrists/hands that resulted in consulting a doctor or taking medication at any time during the past 28 days
Neck/shoulder Elevated noise Not possible to lean back while sitting Insufficient desk lighting Job control Middle tertile Low tertile Previous injuries Chronic diseases Female gender
1.28 (1.07-1.52) 1.27 (1.05-1.52) 1.27 (1.05-1.53) 1.30 (1.02-1.64) 1.25 (0.98-1.60) 1.83 (1.55-2.16) 1.39 (1.16-1.62) 1.30 (1.06-1.59)
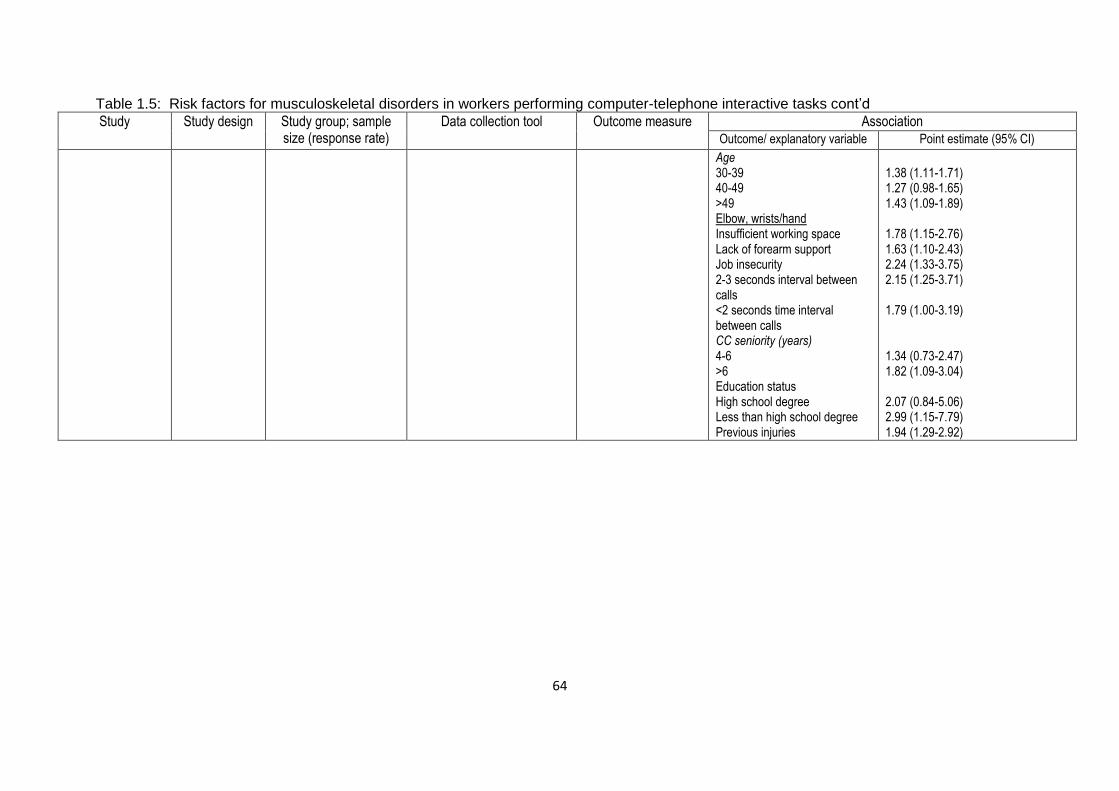
64
Table 1.5: Risk factors for musculoskeletal disorders in workers performing computer-telephone interactive tasks cont’d
Study Study design Study group; sample size (response rate)
Data collection tool Outcome measure Association Outcome/ explanatory variable Point estimate (95% CI)
Age 30-39 40-49 >49 Elbow, wrists/hand Insufficient working space Lack of forearm support Job insecurity 2-3 seconds interval between calls <2 seconds time interval between calls CC seniority (years) 4-6 >6 Education status High school degree Less than high school degree Previous injuries
1.38 (1.11-1.71) 1.27 (0.98-1.65) 1.43 (1.09-1.89) 1.78 (1.15-2.76) 1.63 (1.10-2.43) 2.24 (1.33-3.75) 2.15 (1.25-3.71) 1.79 (1.00-3.19) 1.34 (0.73-2.47) 1.82 (1.09-3.04) 2.07 (0.84-5.06) 2.99 (1.15-7.79) 1.94 (1.29-2.92)

65
1.3.3 MSDs and ethnicity
The multifactorial nature of MSDs brings in a host of risk factors that belong to the
individual dimension under psychosocial risk factors. The term “psychosocial” in
occupational health is used to describe a number of factors considered to be non-
physical, including culture and societal factors (Bernard, 1997, Feuerstein et al.,
2004). Psychosocial factors used to be considered as confounders in the past, but
now are treated as independent risk factors for MSDs (Feuerstein et al., 2004). In
recent years, the number of epidemiological studies that includes psychosocial
factors has increased (Faucett, 2005). This interest in psychosocial factors in MSD
studies has been generated by the observed variation in subjective responses to
physical exertion and muscle loading, and variation in severity of MSD symptoms
(Feuerstein et al., 2004). These factors present opportunities for intervention.
one psychosocial factor, ethnicity, refers to the social or cultural heritage that a
particular group shares in terms of customs, language, values, religion, social ties
and habits passed down from one generation to the next (Dalton et al., 2001). The
relationship between ethnicity and pain intensity has long been recognised. It has
been suggested that psychological and cognitive variables are heavily influenced by
socio-cultural learning and experiences which have an impact on the physiological
processes involved in human pain perception and response (Melzack & Wall,
1967,1970). A literature review on South Asian migrants in the United Kingdom
reported that the migrants experienced more musculoskeletal pain than indigenous
UK Whites (Njobvu et al., 1999). It was not clear whether this was due to real
differences between the groups or just perceptions about pain.

66
A school of thought proposing that the genesis of MSDs is as a result of a
psychologically mediated response to an external trigger such as workplace
exposure that is conditioned by individual characteristics and cultural circumstances
is emerging (Coggon, 2005). This theory was born from observations made in
different countries, where in one a major epidemic of repetitive strain injuries that
was not paralleled in other countries occurred in the 1980s (Gun, 1990). In another
country, from 1953 to 1992, there was a seven fold increase in rates of incapacity for
work due to MSDs of the back at the time when physical work demands were
decreasing. These observations show geographical variations and time trends
which cannot be accounted for by workplace activities (Coggon, 2005). It is believed
that if the theory is tested and proven correct, it will have practical implications for the
prevention and management of MSDs.
A prospective follow-up study was conducted for up to three years in the United
States on 632 newly employed computer users to examine the relationship between
musculoskeletal symptoms and MSDs and associated risk factors (Gerr et al., 2002).
Questionnaires were completed about demographic details, personal history and
upper limb musculoskeletal symptoms (defined by criteria on symptoms, severity and
consequences) at study entry. Upper limb musculoskeletal symptoms were divided
into neck or shoulder and hand or arm musculoskeletal symptoms. Computer users
who did not report musculoskeletal symptoms at study entry filled in daily diaries
about work practices and new musculoskeletal symptoms. Those who developed
new musculoskeletal symptoms were examined for specific diagnosis of MSD.
The study group was young, predominantly female and had tertiary education. Most
of them were working as secretaries and had more than two years experience using
67
computers. Less than half were designated as non-Whites. Female gender and
previous history of upper limb pain predicted upper limb musculoskeletal symptoms
and MSDs. Age and ethnicity (non-White) predicted neck or shoulder
musculoskeletal symptoms and MSDs while period of past computer use predicted
hand or arm musculoskeletal symptoms and MSDs. The study used a prospective
design which satisfied the temporality criterion of exposure before the effect. The
exclusion of other domains of MSD risk factors during multivariate analysis may have
biased the results.
A study to investigate cross-cultural differences between 393 Dutch nursing
personnel and 351 Greek nurses compared risk factors for MSDs, MSD occurrence
and related consequences in the two groups (Alexopoulos et al., 2006). The same
self-administered questionnaire was used in both groups of nurses to collect
information on individual, physical and psychosocial risk factors; occurrence of
MSDs in the past 12 months; related sickness absence and medical care seeking.
As expected, female nurses were predominant in both groups. The majority of
Greek nurses had higher education levels and longer service than Dutch nurses. A
higher proportion of Greek nurses compared to Dutch nurses were exposed to
physical risk factors known to affect the low back and neck. It was thus not
surprising that Greek nurses had a higher prevalence of low back and neck MSDs
than Dutch nurses. Sickness absence due to MSDs was similar in both groups.
Although similar proportions of nurses in both groups sought medical care, the Greek
nurses consulted medical specialists while Dutch nurses consulted general
practitioners. Awkward back postures and moderate perceived general health were
found to be associated with low back MSDs in both groups.
68
The Dutch and Greek nurses reported high prevalences of MSDs with low back
having the highest prevalence. Physical load was more important than psychosocial
load as it was found to be associated with low back MSD in both groups. The results
of this study suggest that cross-cultural differences between Dutch and Greek
nurses may have not played a role in the reporting of MSDs and their risk factors.
Medical care seeking reflects the differences between the Dutch and Greek health
care systems.
A study examining MSDs, the influence of acculturation and psychosocial aspects of
work on MSDs was conducted among 156 migrant women workers comprising 62
Thai, 28 Vietnamese and 66 Filipino living in Korea (Lee et al., 2011). Information on
socio-demographic details, acculturation strategy, psychosocial aspects of work and
MSDs was collected using a structured questionnaire. There were no significant
differences in the socio-demographic details of the women except for age and daily
working hours. The Vietnamese women were younger than the Filipino women who
had fewer daily working hours than Thai women.
The overall prevalence of any MSD was higher in Vietnamese and lower in Filipino
women. As a group, the women preferred the separation strategy of acculturation
with no significant differences in the total mean scores of acculturative stress in the
subgroups. The subscales that showed differences were perceived discrimination,
homesickness and perceived hate. Vietnamese were less likely to feel
discrimination than Thai, but felt more homesick than Thai and Filipino women, and
were less likely to perceive hate. Regarding psychosocial aspects of work, there
were significant differences among the subgroups. Of note were the higher demand,
lower control, higher interpersonal conflict and higher job insecurity among

69
Vietnamese women than the other groups. As expected, the Vietnamese women
were at a high risk of developing MSDs. The separation strategy of acculturation
was found to be associated with MSDs in all the women. No association was found
with psychosocial aspects of work.
The findings of this study should be interpreted with the limitations in mind, which
included sample size, sampling strategy, low reliability of internal consistency for
psychosocial aspects of work domain, the fact that physical factors were not
considered, and the cross-sectional study design.
A cross-sectional study on psychosocial and cultural influences on MSDs was
conducted in 193 Brazilian and 558 Italian hospital nurses to compare the
prevalence of MSDs and their association with physical and psychosocial risk factors
(Carugno et al., 2012). Information on demographic details, individual, physical and
psychosocial risk factors and occurrence of MSDs with related disability and
sickness absence was obtained through self-administered questionnaires which
were specifically designed for the CUPID project.
As expected, the majority of nurses were female with similar distribution of sex in the
two groups. The Brazilian nurses were older, with a longer duration of service and a
higher percentage of full time hours worked per week compared to the Italian nurses
who had a higher proportion of lifting heavy loads and working with hands above
shoulder height. A higher proportion of Brazilian nurses was satisfied with their jobs
and had poor mental health compared to Italian nurses. Lastly, both groups reported
similar percentages of two or more distressing somatic symptoms (somatising
tendency).
70
MSD prevalences in the past month were similar for low back and neck while, for the
shoulders, it was higher in Brazilian than Italian nurses. In both groups, lifting of
heavy loads was not associated with MSD of the low back. Neck and shoulder
MSDs were associated with working with hands above shoulder height in both
groups. Somatising tendency in both Italian and Brazilian nurses was associated
with all the MSDs of interest in the study including disabling and multi-site pain and
sickness absence. There were no marked differences in the MSD prevalences and
psychosocial risk factors identified in the two groups of nurses despite possible
differences in cultural and social backgrounds.
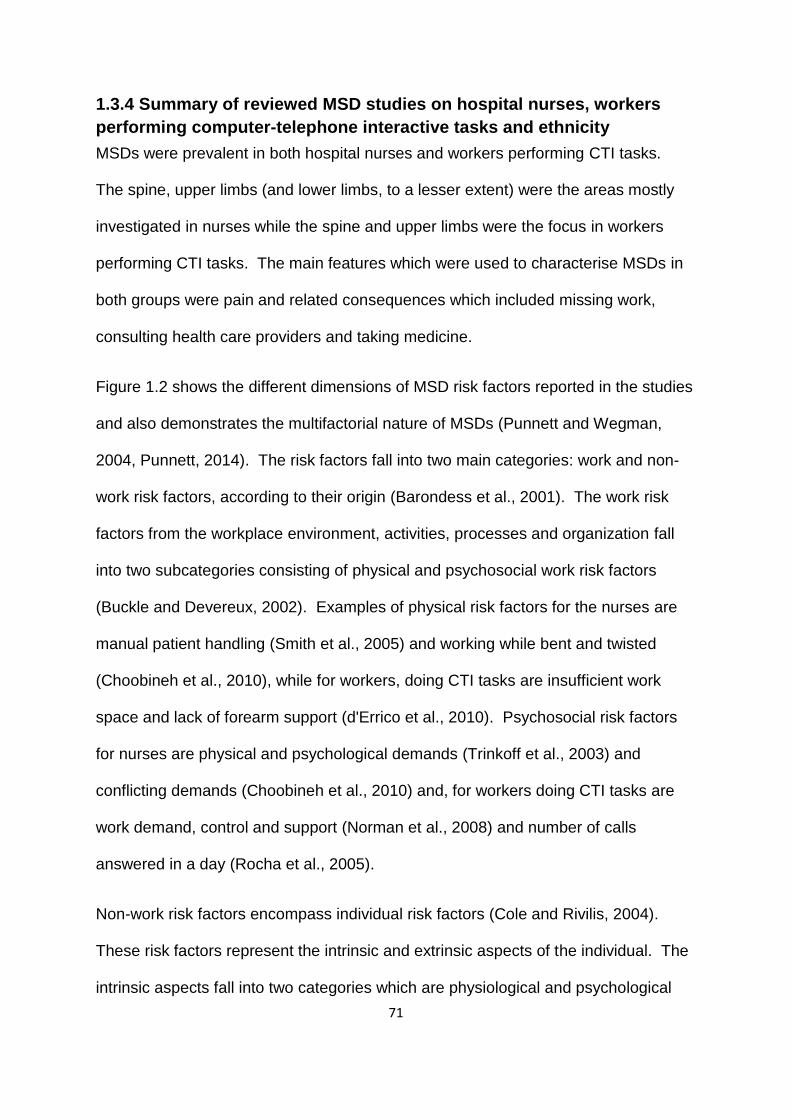
71
1.3.4 Summary of reviewed MSD studies on hospital nurses, workers
performing computer-telephone interactive tasks and ethnicity
MSDs were prevalent in both hospital nurses and workers performing CTI tasks.
The spine, upper limbs (and lower limbs, to a lesser extent) were the areas mostly
investigated in nurses while the spine and upper limbs were the focus in workers
performing CTI tasks. The main features which were used to characterise MSDs in
both groups were pain and related consequences which included missing work,
consulting health care providers and taking medicine.
Figure 1.2 shows the different dimensions of MSD risk factors reported in the studies
and also demonstrates the multifactorial nature of MSDs (Punnett and Wegman,
2004, Punnett, 2014). The risk factors fall into two main categories: work and non-
work risk factors, according to their origin (Barondess et al., 2001). The work risk
factors from the workplace environment, activities, processes and organization fall
into two subcategories consisting of physical and psychosocial work risk factors
(Buckle and Devereux, 2002). Examples of physical risk factors for the nurses are
manual patient handling (Smith et al., 2005) and working while bent and twisted
(Choobineh et al., 2010), while for workers, doing CTI tasks are insufficient work
space and lack of forearm support (d'Errico et al., 2010). Psychosocial risk factors
for nurses are physical and psychological demands (Trinkoff et al., 2003) and
conflicting demands (Choobineh et al., 2010) and, for workers doing CTI tasks are
work demand, control and support (Norman et al., 2008) and number of calls
answered in a day (Rocha et al., 2005).
Non-work risk factors encompass individual risk factors (Cole and Rivilis, 2004).
These risk factors represent the intrinsic and extrinsic aspects of the individual. The
intrinsic aspects fall into two categories which are physiological and psychological
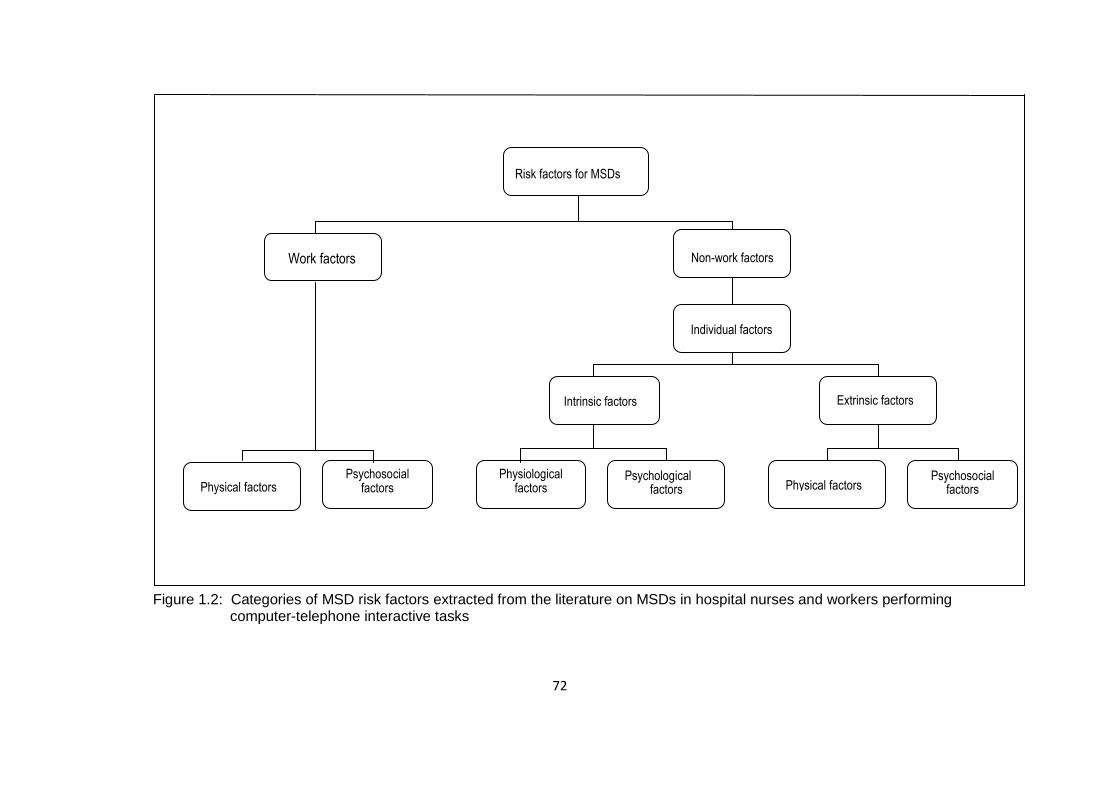
72
Figure 1.2: Categories of MSD risk factors extracted from the literature on MSDs in hospital nurses and workers performing computer-telephone interactive tasks
Risk factors for MSDs
Work factors Non-work factors
Individual factors
Intrinsic factors Extrinsic factors
Psychological factors Physical factors
Psychosocial factors
Physiological factors
Psychosocial factors Physical factors

73
risk factors, while the extrinsic aspects comprise physical and psychosocial risk
factors. The intrinsic risk factors for nurses are age, sex, BMI (Trinkoff et al., 2003)
and perceived general health (Alexopoulos et al., 2003) and for workers doing CTI
tasks, they are age, sex (Norman et al., 2008), and stress levels (Lin et al., 2009).
Extrinsic risk factors for nurses are having other dependents (Trinkoff et al., 2003)
and alcohol consumption (Smith et al., 2004a). For workers doing CTI tasks, these
are having children (Lin et al., 2009) and education status (d'Errico et al., 2010).
The reviewed studies suggest that MSDs are predicted by ethnicity and also indicate
that ethnicity may play a role in the development of MSDs through acculturation.
Another view is that ethnicity has no influence in the relationship between MSDs and
their risk factors. Therefore, it can be concluded that the current information is
inconsistent and that better designed studies are required to clarify the issue.
74
1.3.5 Study justification, aim and objectives
MSDs are one of the main causes of morbidity in the working population. Their
impact is pervasive and permeates through society. Work has long been suspected
of being involved in the development of MSDs. Bernardino Ramazzini gave
descriptions of working postures which he thought led to the development of MSDs
in the workers of his time. Later, epidemiological investigations provided credible
evidence about physical work exposures as risk factors for MSDs. More recently,
psychosocial aspects of work have been recognised as independent risk factors for
MSDs. Interest in other factors of individual characteristics in the socio-cultural
realm is growing. This includes factors such as ethnicity which has been associated
with health outcomes in the past. Identification of risk factors that can be modified
should be the goal in the prevention of MSDs.
1.3.5.1 Justification for the study
Hospital and call centre environments have been identified internationally as
generators of risks for MSDs. This puts nurses and call centre workers at high risk
of developing MSDs. Specifically, the source of risks has been traced to the work
environment design and organisational factors which are thought to interact to
produce MSDs.
Nurses are an indispensable resource in all countries of the world. They form pillars
of healthcare systems. Their own health needs to be nurtured in order for the
countries’ healthcare systems to be able to deliver quality healthcare to their people.
However, nursing has become a scarce skill for a number of reasons including
MSDs. Nurses leave nursing or change their jobs due to MSDs as well as other
75
reasons. The prevention of MSDs can be used as one of several retention strategies
for nurses.
Call centre companies experience high turnover of workers involved in CTI tasks
partly because of working conditions that are high risk for MSDs. Conditions such as
high job demand, low control and social support, electronic monitoring of calls and
poor design of the workstations occur frequently in call centre companies. These
companies end up experiencing high costs to recruit and train new staff.
Identfication of modifiable MSD risk factors should be a priority.
A number of potential MSD risk factors have been identified in studies on nurses and
bank workers. However, very few studies have included socio-cultural factors which
are now suspected of playing a role in the development of MSDs. In SA, MSD risk
factors in nurses have remained largely unidentified and MSDs in bank workers have
not been studied. There is need to test the hypotheses in the two groups of
workers: the burden of MSDs is high; MSDs have a negative impact on workers and
their places of work; prevalent MSD risk factors cover all domains of MSD risk
factors; ethnicity influences the development of MSDs; and prevalent and persistent
MSD risk factors in nurses are similar. South Africa, with its multicultural population
provides a suitable target population to test these hypotheses.
1.3.5.2 Aim of the study
The main aim of the study was to assess the exposure- effect relationship between
MSDs in the low back, neck, shoulders, elbows, hands or wrists, upper limbs and
knees, and associated multi-dimensional risk factors comprising physical and
psychosocial work factors and individual factors in the public hospital nurses and
76
bank workers. The nurses were working in high risk wards and the bank workers in
call centres.
1.3.5.3 Objectives of the study
i) To determine the 12-month prevalences and body site localisation of MSDs in
South African public hospital nurses and bank workers.
ii) To characterise the features and consequences of prevalent MSDs in South
African public hospital nurses and bank workers.
iii) To identify the risk factors associated with prevalent MSDs in South African public
hospital nurses and bank workers.
v) To determine incident and persistent MSDs in South African public hospital
nurses.
vi) To identify risk factors associated with persistent MSDs in South African public
hospital nurses.
77
Chapter 2: Methodology
2.1 Introduction
In this chapter, details of the methods used in the study are presented. They cover
three periods, namely pre data collection, data collection and post data collection.
Pre data collection incorporates study design, setting, population and sampling. Data
collection includes data collection tools, interviewer training and quality assurance.
Finally, post data collection deals with data management and analysis.
2.2 Study design
The study used cross-sectional and follow-up designs. The cross-sectional study
was conducted in two South African occupational groups: 1) public hospital nurses;
and 2) bank workers. The follow-up was successful in public hospital nurses, who
were re-evaluated on average ± SD 12.2 ± 0.2 months after baseline; range 11.2-
13.0 months. The follow-up was unsuccessfull in bank workers.
2.3 Study setting
The study was conducted in two public hospitals and a commercial bank as the plan
was to recruit nurses and bank workers, respectively. Public hospital nurses
experience high levels of MSDs yet the associated risk factors are largely unknown.
MSDs in bank workers specifically, those who perform call centre work have not
been studied in South Africa.
2.3.1 Selection of study sites
The selection of the two public hospitals and the commercial bank was strategic as
they were located in Gauteng Province which has the largest population (12.3
million) in South Africa (Census, 2011). The population consists of all the different
ethnic groups of South Africa which are pertinent to our study. The Black African
group, which is mainly constituted by Sotho and Nguni ethnic groups, forms more
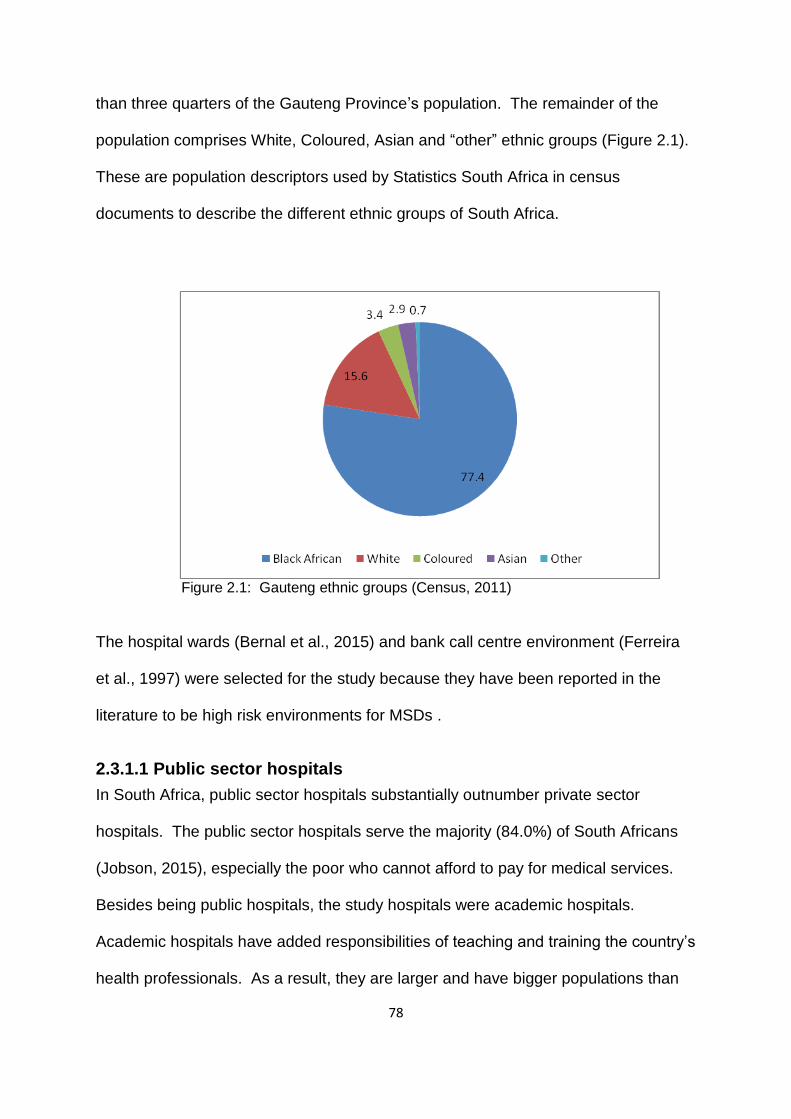
78
than three quarters of the Gauteng Province’s population. The remainder of the
population comprises White, Coloured, Asian and “other” ethnic groups (Figure 2.1).
These are population descriptors used by Statistics South Africa in census
documents to describe the different ethnic groups of South Africa.
Figure 2.1: Gauteng ethnic groups (Census, 2011)
The hospital wards (Bernal et al., 2015) and bank call centre environment (Ferreira
et al., 1997) were selected for the study because they have been reported in the
literature to be high risk environments for MSDs .
2.3.1.1 Public sector hospitals
In South Africa, public sector hospitals substantially outnumber private sector
hospitals. The public sector hospitals serve the majority (84.0%) of South Africans
(Jobson, 2015), especially the poor who cannot afford to pay for medical services.
Besides being public hospitals, the study hospitals were academic hospitals.
Academic hospitals have added responsibilities of teaching and training the country’s
health professionals. As a result, they are larger and have bigger populations than
79
the non-academic public hospitals. At the time of the study, there were 10 academic
hospitals in South Africa, with four situated in the Gauteng Province (City Press,
2013). Two were located in Johannesburg and the other two in Pretoria. Due to
resource constraints, it was decided that two hospitals would be studied. Hospital A
and Hospital B, located in Johannesburg and Pretoria respectively, were selected to
ensure that at least the main ethnic groups of South Africa are included in the study.
2.3.1.2 The banking industry
The banking industry in South Africa is well developed and effectively regulated
(Matoti, 2014). However, it is dominated by four large banks which employ 133 210
workers which is 85.0% of the industry’s staff composition of 156 718 employees.
Sixty one percent (81 258) are based in the Gauteng Province (Matoti, 2014). Due
to resource constraints, it was decided that one bank would be studied. Three of the
four large banks were invited to participate in the study. The bank that satisfied all
the requirements of the study was selected.
2.4. Hospital A
The hospital was accredited with over 1000 beds and provided general hospital
services categorised as secondary, tertiary and highly specialised services. The staff
complement was approximately 4000 healthcare workers of whom about 2000 were
nurses.
2.4.1 Environment setting
The hospital building had nine storeys. The wards selected for the study fell under
Casualty, Gynaecology and Obstetrics, Intensive Care Unit, Medical, Orthopaedic,
Surgical and Theatre. There were 341 nurses working in these wards. The beds in
the wards were not height adjustable which meant that they could not be adjusted to
80
the working height of the nurses. Lifting aids were not available. Patient handling
tasks involved turning the patient on the bed; moving the patient from the bed to the
chair and back to the bed; moving the patient from the bed to the stretcher or
wheelchair and back to the bed. Other nursing tasks included making up beds,
bathing patients, putting up drips, giving injections, drawing blood and giving
medication.
2.4.2 Work organization
The nurses worked 12-hour day and night shifts. Day shift started at 06h00 and
ended at 18h00, and night shift started at 18h00 and ended at 06h00. The shift
schedules were organised in such a way that nurses worked 40 hours per week.
Tea breaks in the morning and afternoon were 15 minutes each and lunch breaks
were 30 minutes. The hospital did not have an occupational health service for
healthcare workers and the nurses were not trained on ergonomics or good patient
handling techniques.
2.5 Hospital B
Hospital B was a tertiary hospital that operated on a referral basis. The hospital
provided specialised and highly specialised services including emergency
specialised medical care. The hospital had over 800 beds and employed
approximately 1600 nurses (Sr Montana, personal communication, 2016).
2.5.1 Environment setting
The hospital was a 10 storey building. The wards, lifting aids, patient handling tasks,
nursing tasks and work organization were similar to those presented in 2.4.1. At the
time of the study, there were 392 nurses working in the study wards. However, some
wards in Hospital B were supplied with electric beds which were height adjustable.
81
Surprisingly, some of the nurses were not making use of this feature of the beds. It
was observed that in some instances, the side of the bed with the height adjustment
foot pedal was placed against the wall which made it inaccessible. Thus, the use of
beds was not different from that in Hospital A which had non-adjustable beds.
2.5.2 Work organization
The working time arrangement and breaks were similar to those in Hospital A.
Hospital B had an occupational health service for its healthcare workers. Similar to
Hospital A, the nurses were not educated and trained on ergonomics. However, a
physiotherapist regularly trained the nurses once a month on good patient handling
techniques which were reinforced by posters.
2.6 The bank
The study bank was situated in the Johannesburg central business district. It is
purported to be the oldest bank in South Africa and had branches in a number of
African countries (Net Industries, 2016). It provided banking services to over seven
million customers across South Africa.
2.6.1 Environment setting
The bank had workers who were working in Home Loan Collection (HLC) and Credit
Card Collection (CCC). These areas were referred to as Call Centres and the
workers were using computers and telephones. In HLC, there were 150 workers
while in CCC there were 140 workers. During one of the study preparatory meetings
with the managers of these areas, a walkthrough of HLC and CCC was carried out
by the principal investigator using the Health and Safety Executive Display Screen
Equipment Guidance on Regulations. The office environment was open plan type
with four-way computer workstations.
82
The workstations comprised chairs, computer and telephonic equipment and L-
shaped wooden desks which were circumscribed by dividing boards. The chair
back rests and arm rests were not height adjustable. The seat pans had rounded
front edges and contoured surfaces which were big enough to accommodate the
buttocks of the workers. Both the back rests and seat pans could not be adjusted
independently. The controls for adjusting the height of the chair and the angle of the
back rest simultaneously with the seat pan were positioned on the right hand side of
the chair under the seat pan. The material covering the chairs was permeable and
the base had five stars with casters. The computer equipment was of the Philips
desk top type, model 1705 and the landline telephones were connected to hand sets
and Plantronics headphones. It was observed that the staff did not have space for
their personal belongings and most of them used cushions to support their backs.
The windows were fitted with white vertical blinds, the floors were carpeted, and air
conditioning was installed.
2.6.2 Work organization
HLC dealt with customers who were in arrears with their mortgage bonds while CCC
dealt with customers who had exceeded their credit limits and those in arrears with
their credit card payments. Both HLC and CCC were using a target system where
workers had a target of 120 calls per day. The working hours for the HLC were from
08:00-16:30 from Monday to Friday and the workers were expected to work two
Saturdays in a month from 08:00-12:00. In the CCC, the workers worked from
07:30-15:55 from Monday to Friday and did not work on Saturdays. For both HLC
and CCC there were two 15-minute tea breaks in the morning and afternoon. The
lunch break times differed - in the HLC it was one hour and 15 minutes and only one
hour in the CCC. The minimum entry educational level required to work in these
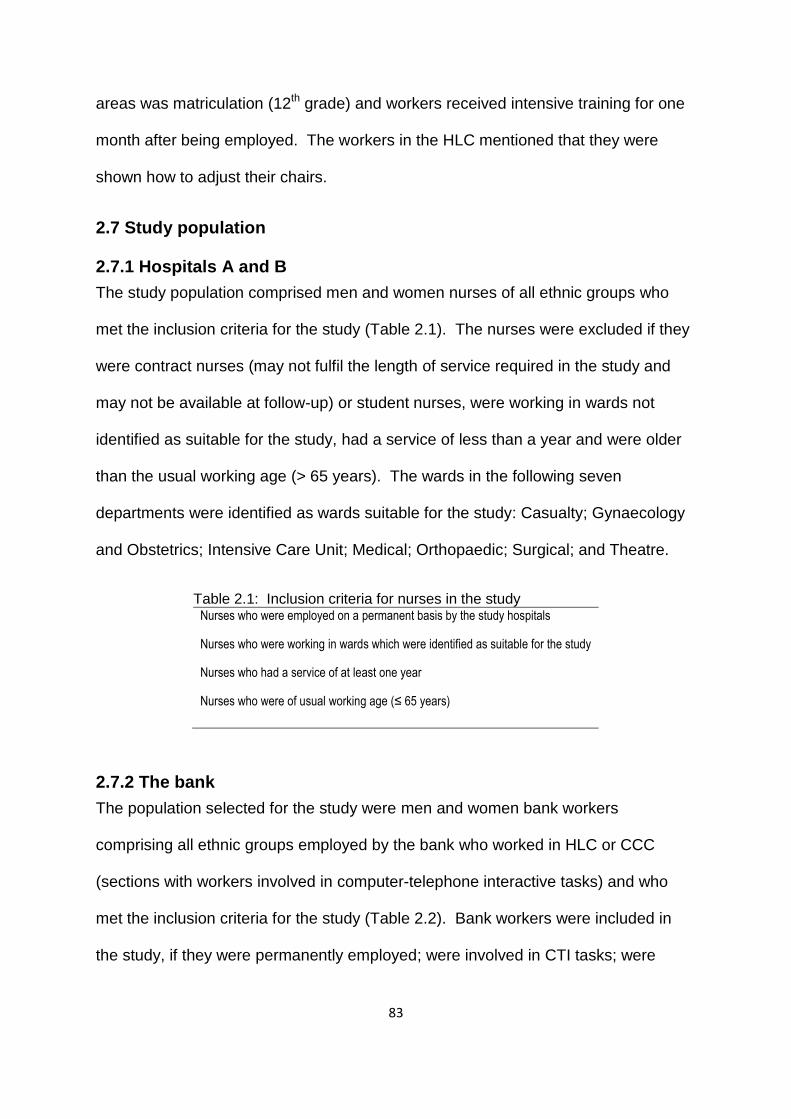
83
areas was matriculation (12th grade) and workers received intensive training for one
month after being employed. The workers in the HLC mentioned that they were
shown how to adjust their chairs.
2.7 Study population
2.7.1 Hospitals A and B
The study population comprised men and women nurses of all ethnic groups who
met the inclusion criteria for the study (Table 2.1). The nurses were excluded if they
were contract nurses (may not fulfil the length of service required in the study and
may not be available at follow-up) or student nurses, were working in wards not
identified as suitable for the study, had a service of less than a year and were older
than the usual working age (> 65 years). The wards in the following seven
departments were identified as wards suitable for the study: Casualty; Gynaecology
and Obstetrics; Intensive Care Unit; Medical; Orthopaedic; Surgical; and Theatre.
Table 2.1: Inclusion criteria for nurses in the study Nurses who were employed on a permanent basis by the study hospitals
Nurses who were working in wards which were identified as suitable for the study
Nurses who had a service of at least one year
Nurses who were of usual working age (≤ 65 years)
2.7.2 The bank
The population selected for the study were men and women bank workers
comprising all ethnic groups employed by the bank who worked in HLC or CCC
(sections with workers involved in computer-telephone interactive tasks) and who
met the inclusion criteria for the study (Table 2.2). Bank workers were included in
the study, if they were permanently employed; were involved in CTI tasks; were
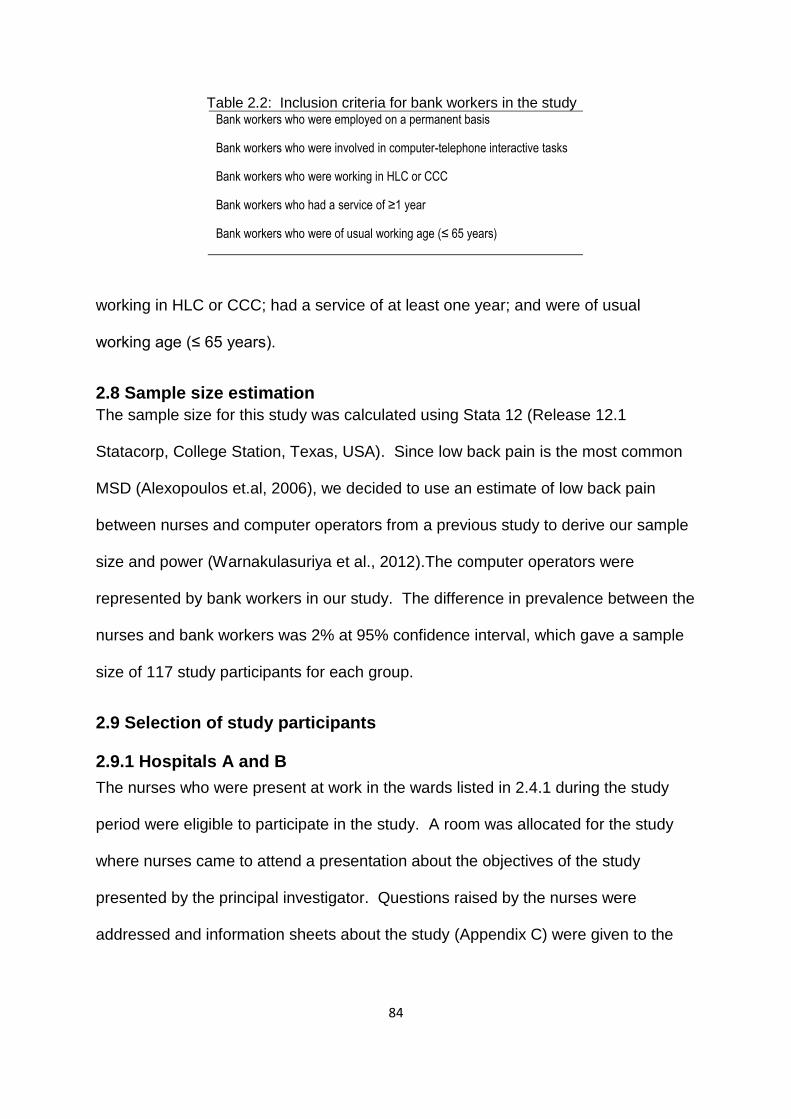
84
Table 2.2: Inclusion criteria for bank workers in the study Bank workers who were employed on a permanent basis
Bank workers who were involved in computer-telephone interactive tasks
Bank workers who were working in HLC or CCC
Bank workers who had a service of ≥1 year
Bank workers who were of usual working age (≤ 65 years)
working in HLC or CCC; had a service of at least one year; and were of usual
working age (≤ 65 years).
2.8 Sample size estimation
The sample size for this study was calculated using Stata 12 (Release 12.1
Statacorp, College Station, Texas, USA). Since low back pain is the most common
MSD (Alexopoulos et.al, 2006), we decided to use an estimate of low back pain
between nurses and computer operators from a previous study to derive our sample
size and power (Warnakulasuriya et al., 2012).The computer operators were
represented by bank workers in our study. The difference in prevalence between the
nurses and bank workers was 2% at 95% confidence interval, which gave a sample
size of 117 study participants for each group.
2.9 Selection of study participants
2.9.1 Hospitals A and B
The nurses who were present at work in the wards listed in 2.4.1 during the study
period were eligible to participate in the study. A room was allocated for the study
where nurses came to attend a presentation about the objectives of the study
presented by the principal investigator. Questions raised by the nurses were
addressed and information sheets about the study (Appendix C) were given to the

85
nurses. Nurses were then invited to participate in the study by signing consent forms
(Appendix D) which included the baseline and follow-up components of the study.
2.9.2 The bank
The bank workers who were present at work in HLC and CCC during the study
period were eligible to participate in the study. The managers of these areas
provided a list of workers working under them. During the study period, the
managers released a group of about 10 workers at a time to attend the presentation
sessions about the study. A room was allocated for the study where recruitment of
participants took place. The principal investigator explained the objectives of the
study to the workers and addressed questions that workers raised. Information
sheets (Appendix C) with a brief description of the study were given to the workers.
After the presentation, the workers were invited to participate in the study by signing
consent forms (Appendix D).
2.10 Preparation for study implementation
2.10.1 Hospital A
After receiving permission for the study from the hospital executive director,
meetings were held with key personnel at the hospital to publicize and garner
support for the study in preparation for its implementation. One such meeting was
held with the deputy director for nursing who endorsed the study and provided a list
of wards which had been identified as suitable for the study with names and contact
numbers of nursing managers in charge of those wards. Another meeting was held
with the nursing managers to explain the study objectives and provide information
about the study so that they could inform the nurses in their wards.
86
2.10.2 Hospital B
The hospital executive director gave permission for the study which paved the way
for its implementation. After the principal investigator had presented the study
protocol to the deputy director for nursing, arrangements were made with the training
department to support and co-ordinate the data collection phase of the study. A
presentation about the study was made to the staff in the training department and
information was provided which they sent to the nursing managers of the wards
which were identified as suitable for the study.
2.10.3 The bank
After the bank Executive Director had accepted the invitation to the study, the Core
Banking Solutions manager became the liaison for the study. The heads of Credit
Risk and Human Resources were invited to a meeting where the principal
investigator presented the study objectives and answered questions they raised.
The contact details of the operational managers of the suitable areas for the study
were provided so that arrangements for the study can be made directly with them.
Before the fieldwork commenced, the operational managers were briefed about the
study and they suggested the flow of workers to the interviews which would have
minimal disruption to the work in the call centres. Information sheets about the study
were provided so that they could give them to the workers.
2.11 Data collection tools
2.11.1 Questionnaires
The main data collection tools for the study were two questionnaires: a baseline
questionnaire (Appendix E); and a follow-up questionnaire for nurses (Appendix F)
which was administered approximately 12 months later. The baseline questionnaire
had five sections while the follow-up questionnaire had four sections. The

87
questionnaires were based on the CUPID questionnaires but four questions pertinent
to the South African population were added to the baseline questionnaire. Other
tools included an analogue portable foot scale and a stature meter for weight and
height measurements, respectively.
2.11.1.1 Baseline questionnaire
Four of the five sections of the baseline questionnaire covered work and non-work
MSD risk factors, and one section dealt with MSDs themselves, that is the health
effects of exposure to these factors. The questions asked about the occurrence of
pain in the past 12 months and past month in six body sites. These were low back,
neck, shoulders, elbows, wrists or hands, and knees. The overview of the baseline
questionnaire is shown in Table 2.3. The work risk factors are contained in section 2
which deals with “Your current work”. This section, included questions about current
job, length of service, number of working hours per week and whether any of the
specified physically demanding activities and psychosocial aspects of work occurred
in the job on an average day. The questions on physically demanding work activities
Table 2.3: Overview of the baseline questionnaire Section Risk factors for MSDs
MSDs Work factors Non-work factors
1. About yourself - √ -
2. Your current work √ - -
3. Aches and pain - - √
4. Your views on the causes and prevention of pain
- √ -
5. Your health more generally - √ -
√=Applicable; (-)=Not applicable.
asked about the use of a keyboard for more than four hours, repeated wrist or finger
movement for more than four hours, repeated elbow bending for more than one
88
hour, working with hands above shoulder height for more than one hour, lifting loads
of more than or equal to 25 kg by hand, and kneeling or squatting for more than one
hour. These questions were asked to solicit exposure to ergonomic risk factors in
the current job. These risk factors are widely accepted and have been used in other
studies (Maclaire, 2001). The questions relating to psychosocial aspects of work
were about incentives, job demands, job control, social support at work, job
satisfaction and security of employment.
The other sections of the baseline questionnaire contained non-work factors which
were in sections 1, 4 and 5. These sections dealt with non-work factors representing
individual factors which can be further differentiated into intrinsic and extrinsic
factors. The intrinsic factors included age, body mass index, sex, handedness,
mental health status, and somatising tendency. The mental health questions were
taken from the relevant subsection of the Short Form (SF)-36 Questionnaire (Ware,
2000) while the questions on somatising tendency were taken from the Brief
Symptom Inventory (Derogatis and Melisaratos, 1983). Extrinsic factors included
ethnicity, educational level, smoking status and adverse belief about low back and
arm pain. The questions about adverse belief were modified from the Fear
Avoidance Beliefs Questionnaire (Waddell et al., 1993).
The questions on the outcome of interest (musculoskeletal pain and associated
features) were contained in section 3 “Aches and pain” of the baseline questionnaire
and included pain in six anatomical sites, namely low back, neck, shoulders, elbows,
wrists or hands, and knees. The questions about musculoskeletal pain and
associated features were adapted from the Standardised Nordic Questionnaire

89
(Kuorinka,1987). The pain sites were shown on diagrams delineating the location of
pain.
2.11.1.2 Follow-up questionnaire for the South African public hospital
nurses
The follow-up questionnaire for nurses had three sections as shown in Table 2.4.
Section 1 “About yourself" provided information that made it possible to link the
follow-up questionnaire with the baseline questionnaire. Section 2 “Your current
work” collected information about any change of job between baseline and follow-up
period with reasons. The questions in sections 3 were similar to those in the
baseline questionnaire which asked about pain in the low back, neck, shoulders,
elbows, wrists or hands and knees in the past month.
Table 2.4 Overview of the follow-up questionnaire Follow-up questionnaire
Section Risk factors for MSDs MSDs Work factors Non-work factors
1. About yourself - √ -
2. Your current work √ - -
3. Aches and pain - - √
√=Applicable; (-)=Not applicable.
2.11.1.3 Supplementary questions
Four questions were added to the baseline questionnaire after careful consideration
of questions and concerns raised during presentations of the study protocol by the
principal investigator at different forums to raise awareness about the study. These
questions were: 1) Have the study participants been in a frightening situation? 2)
Have the study participants been in financial difficulties? 3) Have the study
participants had an injury in the past; and 4) do workers suffering from
musculoskeletal pain deserve compensation?

90
The first two questions were modified from Life Events and Difficulties Schedule
(Brown and Harris, 1989) and had been included in the recent thesis on South
African mineworkers by Dias (2014). Past injuries have been linked with the
development of MSDs (Forde, 2005) and compensation has been associated with
adverse health outcomes in workers with MSDs (Rasmussen et. al, 2001).
2.12 Pilot study
The baseline and follow-up questionnaires were written and piloted in the English
language which is the second language of the majority of workers in South Africa,
including the study participants. The baseline questionnaire was piloted at the
National Institute for Occupational Health (NIOH) and at another department
(Indexing) in the study bank which was not involved in this study where workers were
using computers. The NIOH, being a healthcare institution, was selected for the pilot
using its workers as surrogates for the hospital nurses. The pilot was conducted
through interviewer administered questionnaires. The purpose of the pilot was to
assess if the questions were comprehensible to the pilot subjects and to determine
the length of time it would take to administer one questionnaire. The pilot subjects
found it difficult to understand the question about climbing 30 flights of stairs or more.
As a result, the question was omitted from the baseline questionnaire. The
interviews took an average of 30 minutes with a range of 20-45 minutes.
2.13 Interviewer training
One person was trained by the principal investigator in the administration of
questionnaires. She was a medical scientist who was working with the principal
investigator in the Ergonomics Unit in the Occupational Medicine Section at NIOH.
The principal investigator was experienced in the administration of questionnaires

91
through participation in many projects carried out by the Occupational Medicine
Section of the NIOH.
The training took one day and entailed giving background information about the
study, going through the questionnaire and getting the trainee to practice by
administering the questionnaires to selected staff members in the Occupational
Medicine Section. The background information about the study was going to be
used by the trainee to explain the study to potential study participants. The trainee
was encouraged to ask questions if she did not understand nor needed clarity on
something. She was given time to go through the questionnaire on her own to
ensure good understanding of the questions before the practical exercise of
administering it. At the end of the practical exercise, the principal investigator held a
session with the subject who was interviewed, and the medical scientist, to get
comments about the interview, and areas that needed strengthening were
addressed.
2.14 Overview of data collection
Data were collected by interviewer administered questionnaires in nurses and
interviewer assisted in bank workers.
2.14.1 Data collection at baseline
2.14.1.1 Hospitals A and B
Data collection occurred in January and November 2008 in Hospital A, and Hospital
B, respectively. A total of 282 nurses, 141 nurses in each hospital, was invited to
participate. Of these, 252 nurses (130 in Hospital A and 122 in Hospital B) took part
in the study: a response rate of 89.4%. The interviews were conducted in rooms
allocated for the study in the different wards. In each ward, one nurse was

92
interviewed at a time. At the end of the interview, weight and height measurements
were taken. The principal investigator alternated with the medical scientist in
conducting interviews and taking weight and height measurements.
2.14.1.2 The Bank
At the Bank, interviewer assisted data collection was done in February 2009 in a
room allocated for the study. The bank workers were free to ask questions if they
wanted clarity on any question in the questionnaire. After the interviews,
measurements of weights and heights were taken. A total of 236 workers working in
the HLC or CCC participated. Fifty four workers did not take part (49 did not come to
the study debriefing sessions and five were not at work during the study period).
The response rate for the study was 82.8%.
2.14.2 Data collection at follow-up
Nurses were telephoned and reminded about the follow-up a month before the due
date. In Hospital A, the follow-up interviews happened in January 2009, while in
Hospital B they happened in November 2009. In a similar manner as at baseline,
the interviews were conducted in designated rooms in the wards. One hundred and
eighty nine nurses were successfully re-interviewed after the follow-up period, a
75.3% response rate.
2.14.3 Weight and height measurements
The weight was measured using Soenhle certified classic X1 scale. It was placed on
a flat surface on the ground with the kilogram window easy to read. The scale was
zeroed before the participants put both their barefeet on the designated area on the
scale. The weight was then read from the window of the scale.
93
For height measurement, the Panamedic stature meter which was two meters long
was used. The meter was placed on the floor and the tape was pulled out until zero
was on the red line on the window of the meter. The top part of the tape was secured
on the wall. When taking measurements, the participants were asked to stand with
the back facing the wall and the head positioned straight. The tape was pulled down
vertically to the top of the participant’s head and the measurement was taken from
the red line.
2.15 Quality assurance
In order to ensure that reliable data were collected, standardised and validated
questionnaires were used. The questionnaires were piloted to ensure that the
questions were well understood by the study participants. The interviewers were
trained (medical scientist) and experienced (principal investigator) in the
administration of the study questionnaires. At the end of the day during the data
collection period at the hospitals, the principal investigator checked the completed
questionnaires for consistency and completeness. Anomalies that were detected
were discussed with the medical scientist and addressed as soon as possible by
contacting the study participants. At the Bank, the completed questionnaires were
checked for missing data during weight and height measurements. These
measurements were taken using the manufacturers’ instructions.
2.16 Data management
One nurse who did not meet the inclusion criteria was excluded resulting in a final
study sample of 251 nurses. The final study sample of bank workers was 236 as all
of them met the study inclusion criteria. The questionnaires were coded and entered
twice into the Epidata 3.1 software (Lauritsen et al., 2000) by two independent data
capturers producing two datasets. The two datasets were cleaned by correcting
94
errors. The data were imported into Stata 12 (Release 12.1 Stata Corporation,
College Station, Texas, USA) in preparation for analysis. Numerical and categorical
data were plotted on histograms and bar graphs, respectively. The graphs were
checked for unusual and suspicious values against the original observations in the
questionnaires which were corrected accordingly.
Variables body mass index (BMI), age and sick leave days due to “any” pain in the
past 12 months, were categorised. BMI was calculated by dividing weight (W) in
kilograms by height squared (H2) in metres (W (kg))/ (H2 (m)) and then categorised
into three ordinal groups: normal (15-25); overweight (26-30); and obese (31-69)
whereas, age was categorised into four groups namely <30; 30-39; 40-49; and ≥50
years. Similarly with sick leave days, the number of workers in each category (1-5; 6-
30 and > 30 days) was multiplied by 2.5; 8 and 32 days, respectively. Eight and 32
days were chosen arbitrarily to give a conservative estimate.
The prevalence of pain in each body site was obtained by dividing the sum of the
positive responses for each body site (numerator) with the total number of workers
who answered the questions (denominator) and then multiplying the resultant
fraction by 100 to get a percentage. “Any” body site prevalence was obtained by
dividing the sum of workers who reported “any” pain (numerator) by the total number
of workers who answered the questions (denominator) and then multiplying the
resultant fraction by 100 to get a percentage.
2.17 Data analysis
The cross-sectional data of public hospital nurses and bank workers were combined
and named South African workers in order to increase the power of the study. Data
analysis of SA workers, public hospital nurses and bank workers were performed.

95
2.17.1 Descriptive statistics
Data were summarized using descriptive statistics. Quantitative data were
summarized using means, standard deviations, medians and ranges. For qualitative
variables, data were summarized using frequencies, percentages and 95%
confidence intervals. The summaries are presented for individual characteristics of
the study participants, possible physically demanding work activities, psychosocial
aspects of work and associated MSD pain.
2.17.2 Statistical testing
Association between two dependent categorical variables was tested using
McNemar test and its associated p-value in the follow-up study of the public hospital
nurses. A p-value ≤ 0.05 was considered statistically significant.
2.17.3 Multiple regression analysis
Binary logistic regression was used in the multiple regression analysis to identify
possible risk factors associated with MSDs. The associations with MSDs were
estimated with odds ratios (ORs) and their 95% confidence intervals (CIs). The
number of explanatory variables to be entered in the full model was guided by the
“rule” of having at least 10 events per explanatory variable (Peduzzi et al., 1996). All
the variables selected for the study are shown in Table 2.5. The “no” categories of
yes or no explanatory variables were made the reference. These included past
injuries, all variables representing work factors and psychological factors, excluding
somatising tendency and mental health status. “Men” was made the reference for
sex. For ordinal variables, the lowest category was made the reference. For
instance, less than 30 years was made the reference for age group; normal for BMI
group; high school for educational level; never-smoked for smoking status; 0
symptom for the number of distressing somatic symptoms. “Good” was the

96
Table 2.5: Explanatory variables used in the study WORK FACTORS NON-WORK FACTORS
Physical
Repeated wrist or finger movement >4 hours*
Repeated elbow bending > 1 hour*
Working with hands above shoulder height > 1 hour*
Upper limb loada
Lifting ≥ 25 kg loads by hand**
Kneeling or squatting > 1 hour**
Physical loadb
Psychosocial
Working under time pressurec
Lack of controld
Lack of social supporte
Job insecurityf
Job dissatisfactiong
Incentivesh
Physical
Age group
Sex
Body mass index (BMI) group
Past injuries
Psychological
Financial difficultiesj
Deserve compensationj
Number of distressing somatic symptomsk
Frightening situationl
Adverse beliefs about low back and/or arm painm
Mental health statusn
Psychosocial
Occupational group
Ethnic group (ethnicity)o
Educational level
Smoking status
aReports of any two or more of the variables marked with one asterisk.
bReports of any three or more of the variables marked with one and two asterisks.
cA target amount of work or a number of articles done or finished in a day or working under pressure to complete tasks
by a fixed time. d
Choice in all of: how work is done; what is done at work; and work time table and break times –seldom or never. e
Assistance or support from colleagues or supervisors-seldom or never f
Feel that job would be insecure or very insecure if off work for three months due to serious illness. g
Very dissatisfied or dissatisfied about the job taking everything into consideration. h
Piecework or payment of a bonus if an agreed number of tasks are finished in a day. i
Being in financial difficulties- slight or big problem. j
People with musculoskeletal disorders deserve compensation. k
Number of at least moderately distressing somatic symptoms in the past seven days from a total of seven. l
Being in a frightening situation-slight or big problem. m
Belief that low back and/or arm pain is caused by work. n
Classified into three levels corresponding to approximate thirds of the observed distribution of scores in the study. o
Social or cultural heritage that a particular group shares in terms of customs, language, values, religion, social ties and habits
passed down from one generation to the next (Dalton, 2001).
reference value for mental health status. Lastly, the group with the largest number of
participants (Sotho) was made the reference for ethnic group.
The explanatory variables representing physically demanding work activities were
defined for each body site (Table 2.6) in order to minimise chance findings. Different
full models were built for each body site as the literature shows that explanatory
variables for the different body sites are different (da Costa and Vieira, 2010).
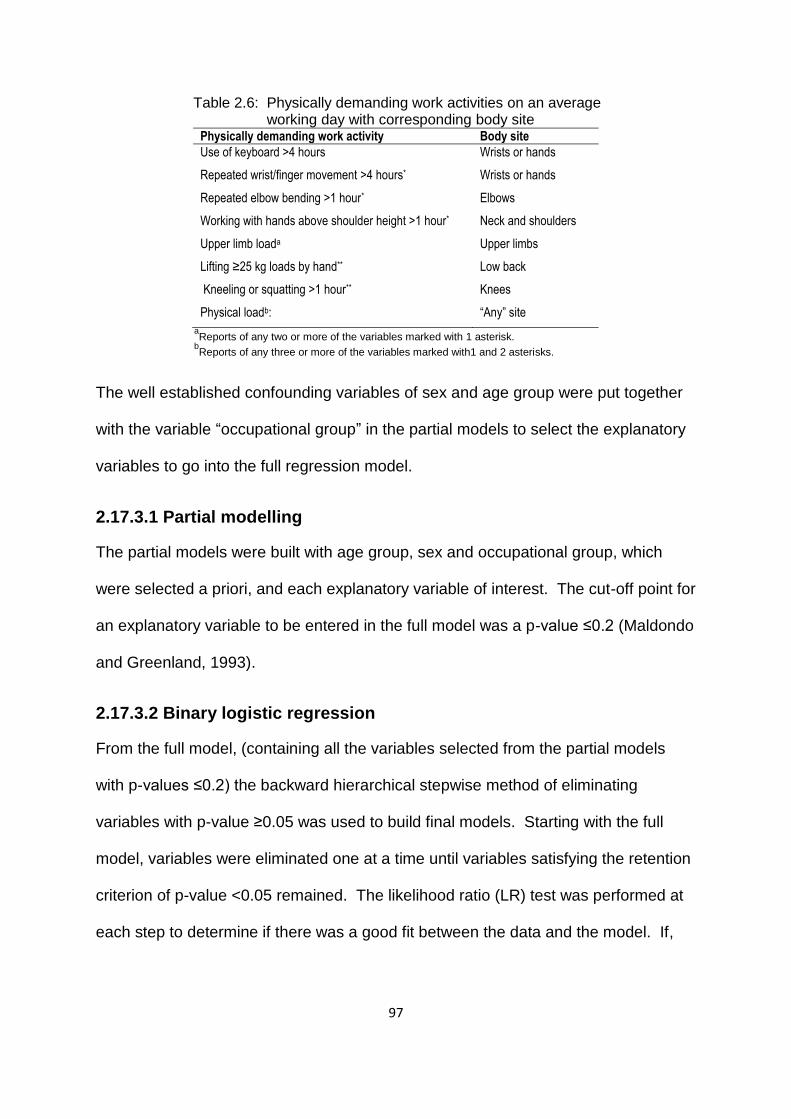
97
Table 2.6: Physically demanding work activities on an average working day with corresponding body site
Physically demanding work activity Body site
Use of keyboard >4 hours
Repeated wrist/finger movement >4 hours*
Wrists or hands
Wrists or hands
Repeated elbow bending >1 hour* Elbows
Working with hands above shoulder height >1 hour* Neck and shoulders
Upper limb loada Upper limbs
Lifting ≥25 kg loads by hand** Low back
Kneeling or squatting >1 hour** Knees
Physical loadb: “Any” site
aReports of any two or more of the variables marked with 1 asterisk.
bReports of any three or more of the variables marked with1 and 2 asterisks.
The well established confounding variables of sex and age group were put together
with the variable “occupational group” in the partial models to select the explanatory
variables to go into the full regression model.
2.17.3.1 Partial modelling
The partial models were built with age group, sex and occupational group, which
were selected a priori, and each explanatory variable of interest. The cut-off point for
an explanatory variable to be entered in the full model was a p-value ≤0.2 (Maldondo
and Greenland, 1993).
2.17.3.2 Binary logistic regression
From the full model, (containing all the variables selected from the partial models
with p-values ≤0.2) the backward hierarchical stepwise method of eliminating
variables with p-value ≥0.05 was used to build final models. Starting with the full
model, variables were eliminated one at a time until variables satisfying the retention
criterion of p-value <0.05 remained. The likelihood ratio (LR) test was performed at
each step to determine if there was a good fit between the data and the model. If,
98
during the variable elimination process, the p-value for the LR test was significant (p-
value <0.05), the variable was retained even if its p-value was ≥0.05.
Post regression testing was performed on the resultant final model containing only
significant variables. The goodness of fit tests used in this regard were the Pearson
chi2 test if the covariate patterns were less than or equal to 20. For covariate
patterns greater than 20, the Hosmer-Lemeshow (H-L) chi2 was used. The receiver
operating characteristic (ROC) curve was used to determine the area under the
curve. The goodness of fit tests and ROC curves were expected to have p-values >
0.05. and areas ≥ 70%, respectively.
Further testing was performed on the final models using Stata 11 (Release 11.1
Stata Corporation College Station, Texas, USA). Predicted probabilities with their
95% CIs from all the variables in the final models were obtained and converted to
predicted prevalences by multiplying them by 100. Another test performed was the
test for linear trend of the ORs. It was done on final models which contained
categorical explanatory variables with more than two levels, demonstrating
increasing trend in the ORs.
2.18 Ethical considerations
The study was approved by the Faculty of Health Sciences Research Ethics
Committee of the University of Pretoria (Appendix G) and the Human Research
Ethics Committee (Medical) at the University of Witwatersrand (Appendix H).
Potential study participants were briefed about the objectives of the study and how it
was going to be conducted. They were given study information sheets to keep if
they so wished. The information sheets had the name and contact details of the
principal investigator to make it possible to contact the principal investigator. It was

99
made clear that participation in the study was voluntary and that it required a signed
informed consent form. It was further clarified that their participation in the study was
not going to jeopardize their employment. They could discontinue their participation
in the study if they so wished, without giving any explanation.
The names of the participants were not written on the questionnaires but codes were
used. These codes were used to link the questionnaires with the consent forms. For
confidentiality purposes, the questionnaires and consent forms were kept separately
in a locked room to which only the principal investigator had access. When reporting
the findings of the study, group data have been and will be presented with no
mention of study participants’ names and study sites’ names.
100
Chapter 3: Cross-sectional study of the South African public
hospital nurses and bank workers
3.1 Introduction
Cross-sectional data from two occupational groups comprising 251 public hospital
nurses and 236 bank workers (N=487) referred to herein as the South African (SA)
workers, were pooled. In this chapter, the description of the SA workers regarding
their exposure to risk factors associated with MSDs, the occurrence of MSDs and
identification of possible risk factors linked to the development of MSDs are
presented. Data for each occupational group (nurses and bank workers) are
presented separately in subsequent chapters.
3.2 Description of the South African workers
Each worker provided information on exposure to MSD risk factors which included
individual characteristics and workplace conditions. Individual characteristics
included physical, psychosocial and psychological characteristics while workplace
conditions delved into physical work activities and psychosocial aspects of work.
3.2.1 Individual physical and psychosocial characteristics
The distributions of the physical and psychosocial characteristics are presented in
Table 3.1. The physical characteristics that were considered were age, sex, body
mass index (BMI) and past injuries. The mean age ± SD was 36.7 ± 10.0 years with
the youngest worker being 19 years and the oldest 65 years. A large percentage of
workers (87.7%) were less than 50 years of age. Women were over represented at
82.5%. The mean BMI ± SD was 27.6 ± 6.7 and BMI ranged from 15-69. More than
half (59.0%) of the workers had abnormal BMI and just over a quarter (26.2%) had
had injuries in the past.
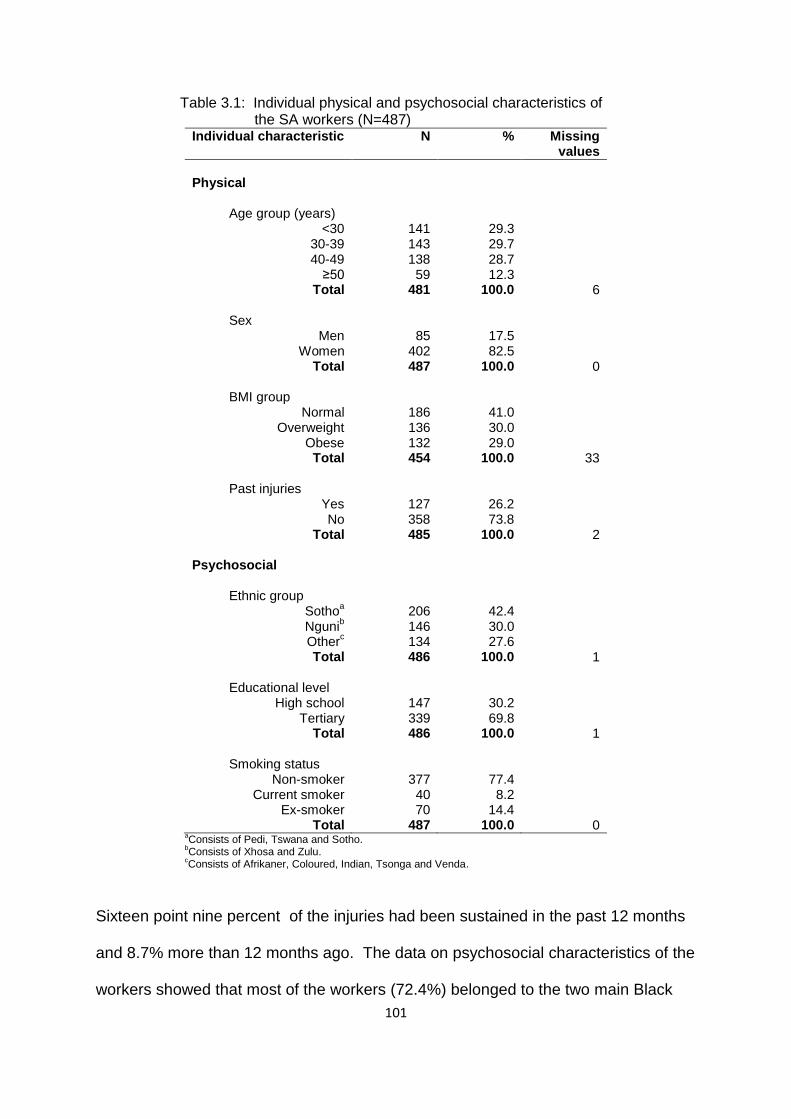
101
Table 3.1: Individual physical and psychosocial characteristics of the SA workers (N=487)
Individual characteristic N % Missing values
Physical
Age group (years)
<30 30-39 40-49
≥50 Total
141 143 138 59 481
29.3 29.7 28.7 12.3
100.0
6
Sex Men
Women Total
85 402 487
17.5 82.5
100.0
0
BMI group Normal
Overweight Obese
Total
186 136 132 454
41.0 30.0 29.0
100.0
33
Past injuries Yes No
Total
127 358 485
26.2 73.8
100.0
2 Psychosocial
Ethnic group
Sothoa
Ngunib
Otherc
Total
206 146 134 486
42.4 30.0 27.6
100.0
1
Educational level High school
Tertiary Total
147 339 486
30.2 69.8
100.0
1
Smoking status Non-smoker
Current smoker Ex-smoker
Total
377 40 70
487
77.4 8.2
14.4 100.0
0
aConsists of Pedi, Tswana and Sotho.
bConsists of Xhosa and Zulu.
cConsists of Afrikaner, Coloured, Indian, Tsonga and Venda.
Sixteen point nine percent of the injuries had been sustained in the past 12 months
and 8.7% more than 12 months ago. The data on psychosocial characteristics of the
workers showed that most of the workers (72.4%) belonged to the two main Black

102
ethnic groups of South Africa with Sotho being a larger percentage (42.4%) than
Nguni (30.0%). About 70.0% of the workers had acquired higher education and
more than three quarters (77.4%) had never smoked.
3.2.2 Individual psychological characteristics
Table 3.2 summarises the psychological characteristics of the SA workers. More
than two thirds (71.4%) had financial difficulties. The percentages of workers
Table 3.2: Individual psychological characteristics of the SA workers (N=487) Individual psychological
characteristic N % Missing values
Financial difficulties
a
Yes No
Total
345 138 483
71.4 28.6
100.0
4 Deserve compensation
b
Yes No
Total
305 169 474
64.3 35.7
100.0
13 Number of distressing somatic symptoms
c
0 1
2+ Total
176 116 195 487
36.1 23.8
40.1 100.0
0 Frightening situation
d
Yes No
Total
227 253 480
47.3 52.7
100.0
7 a
Being in financial difficulties-slight or big problem . b
People with musculoskeletal pain deserve compensation. c
Number of at least moderately distressing somatic symptoms in the past seven days from a total of seven. d
Being in a frightening situation-slight or big problem.
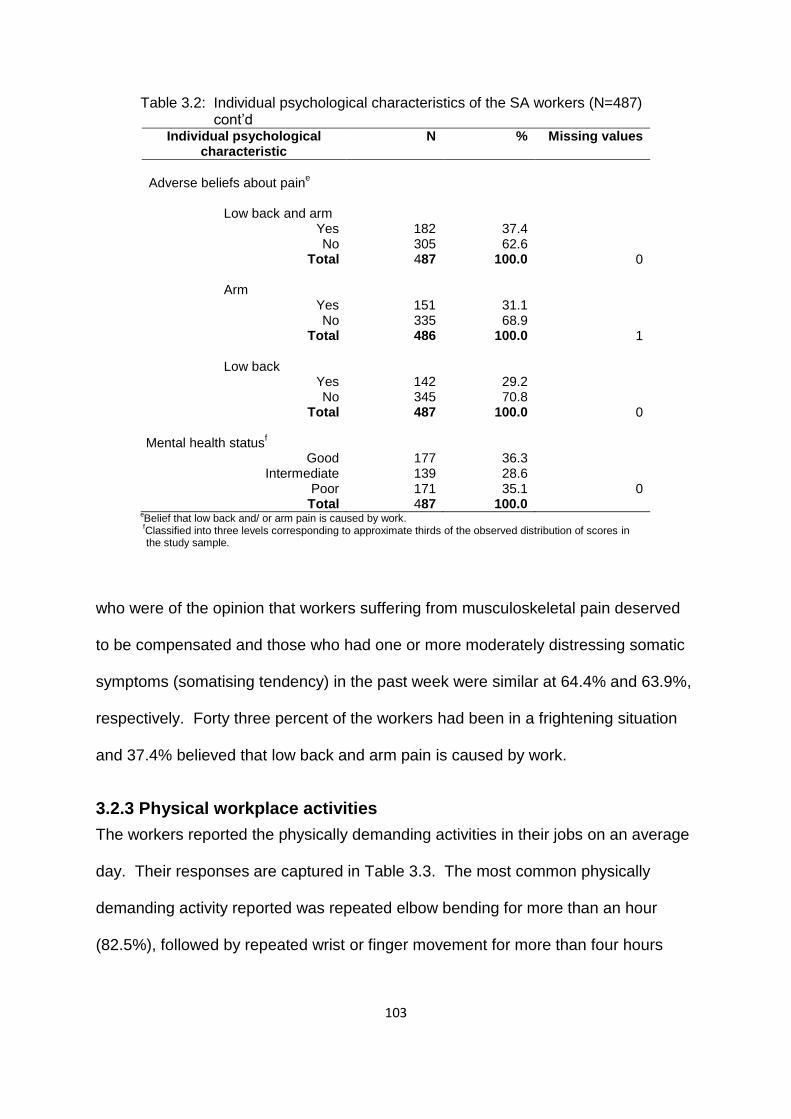
103
Table 3.2: Individual psychological characteristics of the SA workers (N=487) cont’d
Individual psychological characteristic
N % Missing values
Adverse beliefs about pain
e
Low back and arm
Yes No
Total
Arm Yes No
Total
Low back Yes No
Total
182 305 487
151 335 486
142 345 487
37.4 62.6
100.0
31.1 68.9
100.0
29.2 70.8
100.0
0
1
0 Mental health status
f
Good Intermediate
Poor Total
177 139 171
487
36.3 28.6 35.1
100.0
0
eBelief that low back and/ or arm pain is caused by work.
fClassified into three levels corresponding to approximate thirds of the observed distribution of scores in
the study sample.
who were of the opinion that workers suffering from musculoskeletal pain deserved
to be compensated and those who had one or more moderately distressing somatic
symptoms (somatising tendency) in the past week were similar at 64.4% and 63.9%,
respectively. Forty three percent of the workers had been in a frightening situation
and 37.4% believed that low back and arm pain is caused by work.
3.2.3 Physical workplace activities
The workers reported the physically demanding activities in their jobs on an average
day. Their responses are captured in Table 3.3. The most common physically
demanding activity reported was repeated elbow bending for more than an hour
(82.5%), followed by repeated wrist or finger movement for more than four hours
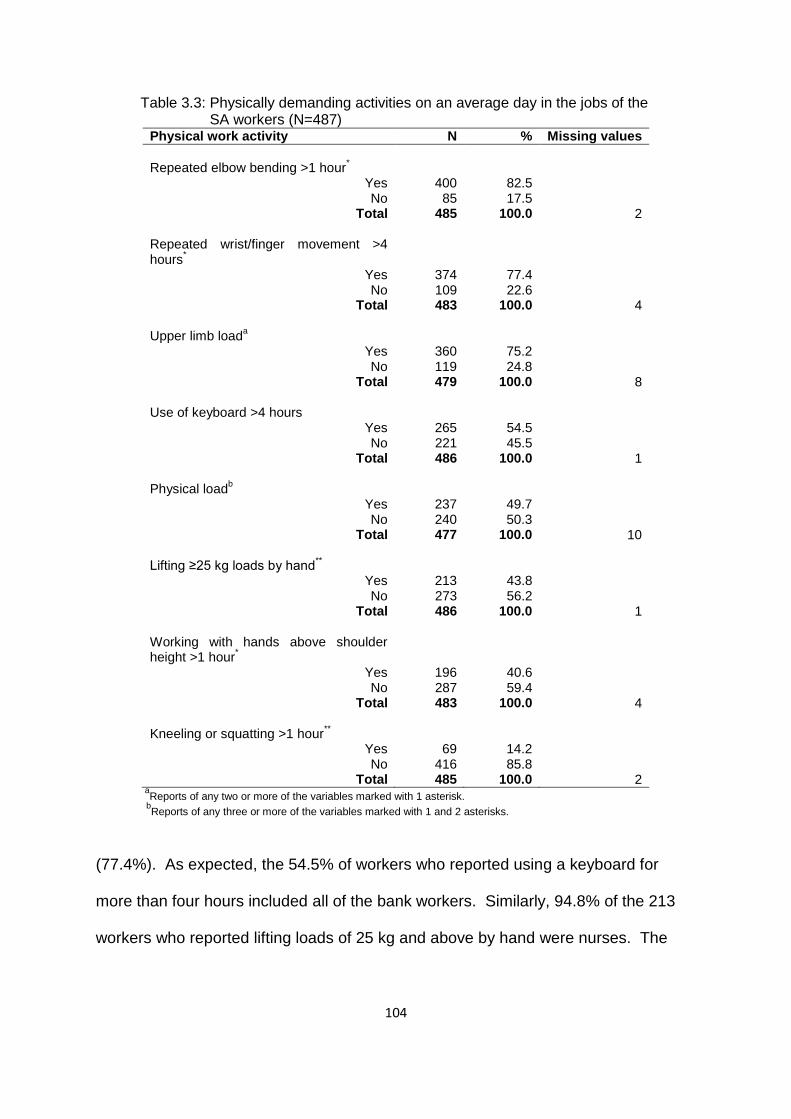
104
Table 3.3: Physically demanding activities on an average day in the jobs of the SA workers (N=487)
Physical work activity N % Missing values
Repeated elbow bending >1 hour
*
Yes No
Total
400 85
485
82.5 17.5
100.0
2 Repeated wrist/finger movement >4 hours
*
Yes No
Total
374 109 483
77.4 22.6
100.0
4 Upper limb load
a
Yes No
Total
360 119 479
75.2 24.8
100.0
8
Use of keyboard >4 hours Yes No
Total
265 221 486
54.5 45.5
100.0
1 Physical load
b
Yes No
Total
237 240 477
49.7 50.3
100.0
10 Lifting ≥25 kg loads by hand
**
Yes No
Total
213 273 486
43.8 56.2
100.0
1
Working with hands above shoulder height >1 hour
*
Yes No
Total
196 287 483
40.6 59.4
100.0
4
Kneeling or squatting >1 hour**
Yes No
Total
69 416 485
14.2 85.8
100.0
2
aReports of any two or more of the variables marked with 1 asterisk.
bReports of any three or more of the variables marked with 1 and 2 asterisks.
(77.4%). As expected, the 54.5% of workers who reported using a keyboard for
more than four hours included all of the bank workers. Similarly, 94.8% of the 213
workers who reported lifting loads of 25 kg and above by hand were nurses. The
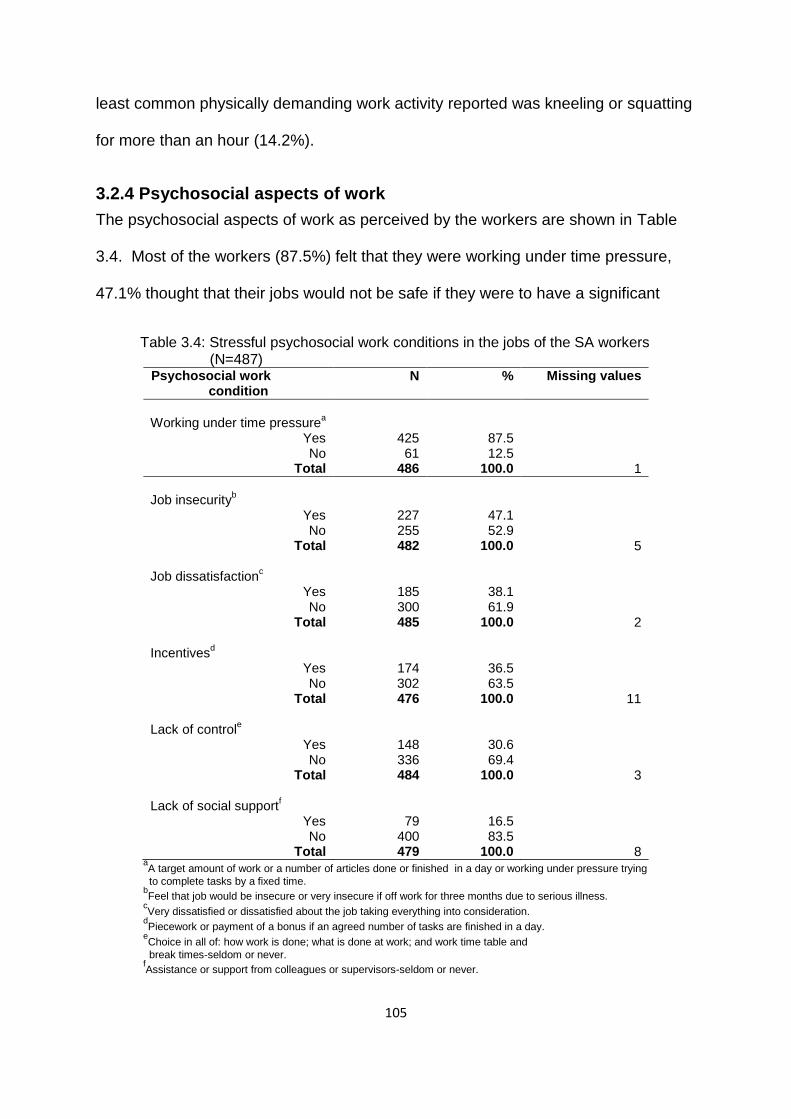
105
least common physically demanding work activity reported was kneeling or squatting
for more than an hour (14.2%).
3.2.4 Psychosocial aspects of work
The psychosocial aspects of work as perceived by the workers are shown in Table
3.4. Most of the workers (87.5%) felt that they were working under time pressure,
47.1% thought that their jobs would not be safe if they were to have a significant
Table 3.4: Stressful psychosocial work conditions in the jobs of the SA workers (N=487)
Psychosocial work condition
N % Missing values
Working under time pressure
a
Yes No
Total
425 61
486
87.5 12.5
100.0
1
Job insecurity
b
Yes No
Total
227 255 482
47.1 52.9
100.0
5 Job dissatisfaction
c
Yes No
Total
185 300 485
38.1 61.9
100.0
2 Incentives
d
Yes No
Total
174 302 476
36.5 63.5
100.0
11 Lack of control
e
Yes No
Total
148 336 484
30.6 69.4
100.0
3 Lack of social support
f
Yes No
Total
79 400 479
16.5 83.5
100.0
8
aA target amount of work or a number of articles done or finished in a day or working under pressure trying
to complete tasks by a fixed time.
bFeel that job would be insecure or very insecure if off work for three months due to serious illness.
cVery dissatisfied or dissatisfied about the job taking everything into consideration.
dPiecework or payment of a bonus if an agreed number of tasks are finished in a day.
eChoice in all of: how work is done; what is done at work; and work time table and
break times-seldom or never.
fAssistance or support from colleagues or supervisors-seldom or never.
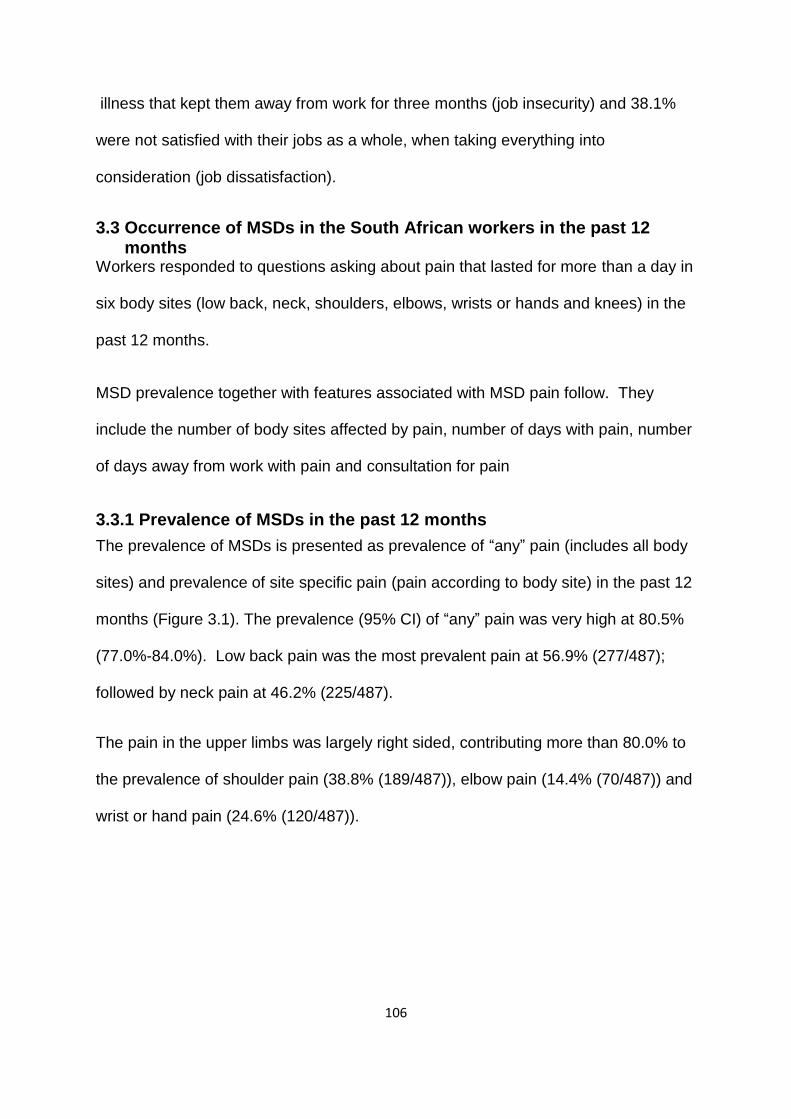
106
illness that kept them away from work for three months (job insecurity) and 38.1%
were not satisfied with their jobs as a whole, when taking everything into
consideration (job dissatisfaction).
3.3 Occurrence of MSDs in the South African workers in the past 12 months Workers responded to questions asking about pain that lasted for more than a day in
six body sites (low back, neck, shoulders, elbows, wrists or hands and knees) in the
past 12 months.
MSD prevalence together with features associated with MSD pain follow. They
include the number of body sites affected by pain, number of days with pain, number
of days away from work with pain and consultation for pain
3.3.1 Prevalence of MSDs in the past 12 months
The prevalence of MSDs is presented as prevalence of “any” pain (includes all body
sites) and prevalence of site specific pain (pain according to body site) in the past 12
months (Figure 3.1). The prevalence (95% CI) of “any” pain was very high at 80.5%
(77.0%-84.0%). Low back pain was the most prevalent pain at 56.9% (277/487);
followed by neck pain at 46.2% (225/487).
The pain in the upper limbs was largely right sided, contributing more than 80.0% to
the prevalence of shoulder pain (38.8% (189/487)), elbow pain (14.4% (70/487)) and
wrist or hand pain (24.6% (120/487)).
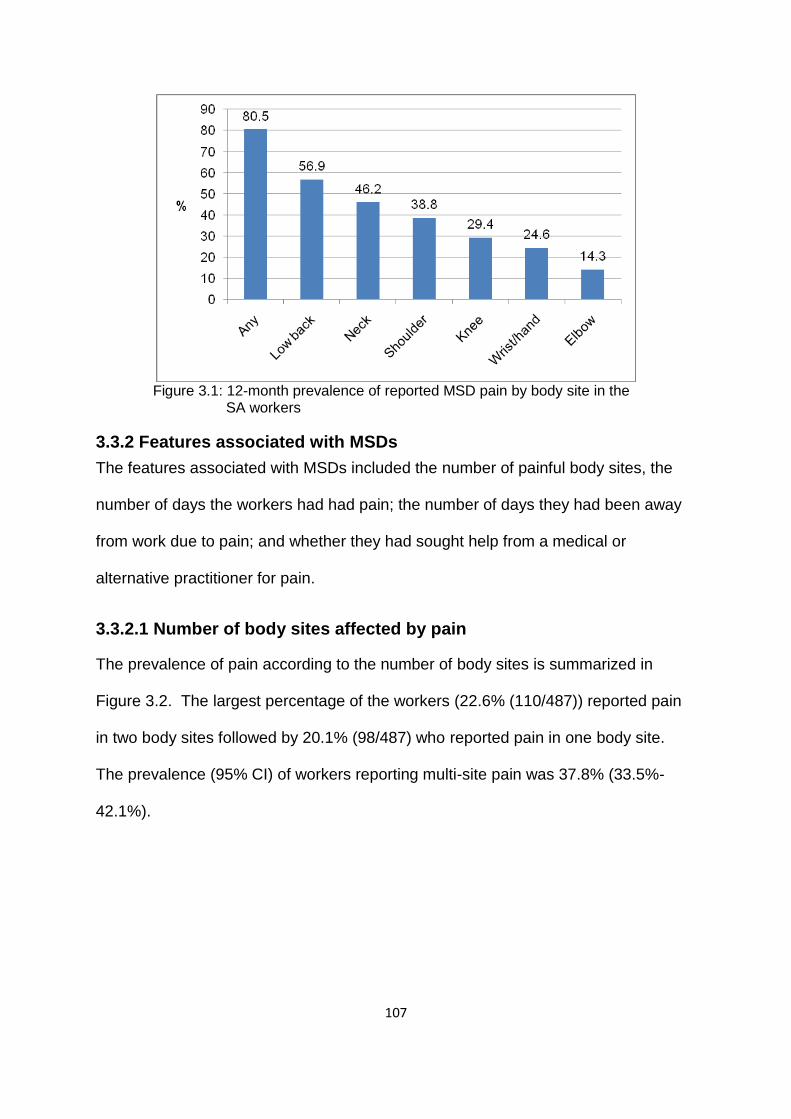
107
Figure 3.1: 12-month prevalence of reported MSD pain by body site in the SA workers
3.3.2 Features associated with MSDs
The features associated with MSDs included the number of painful body sites, the
number of days the workers had had pain; the number of days they had been away
from work due to pain; and whether they had sought help from a medical or
alternative practitioner for pain.
3.3.2.1 Number of body sites affected by pain
The prevalence of pain according to the number of body sites is summarized in
Figure 3.2. The largest percentage of the workers (22.6% (110/487)) reported pain
in two body sites followed by 20.1% (98/487) who reported pain in one body site.
The prevalence (95% CI) of workers reporting multi-site pain was 37.8% (33.5%-
42.1%).

108
Figure 3.2: Number of painful body sites reported by the SA workers
3.3.3.2 Number of days with pain
The number of days for which workers reported to have had site specific pain is
depicted in Figure 3.3. This followed a similar pattern as that of the prevalence of
pain presented in 3.3.1. The largest percentage of workers (23.2% (113/487))
reported 1-6 days for low back pain and the smallest percentage (3.3% (16/487))
reported 1-12 months for elbow pain. The percentage of workers reporting more
Figure 3.3: Number of days with pain reported by the SA workers

109
than six days of pain followed a similar pattern with the largest percentage of
workers reporting low back pain (33.7% (164/487)) and the smallest percentage
reporting elbow pain (8.0% (39/487)).
3.3.3.3 Number of days away from work with pain
The number of days away from work with site specific pain for those who took sick
leave is depicted in Figure 3.4. The figure clearly shows that 1-5 days away from
work due to site specific pain was reported more frequently by the workers as
compared to the 6-30 and more than 30 days. Workers with low back pain had the
Figure 3.4: Number of days away from work with pain reported by the SA workers
largest percentage off work for 1-5 days (21.4% (104/487)) while those with elbow
pain had the smallest (3.1% (15/487)).
A total of 38.8% (187/482) of workers had taken days away from work due to “any”
pain in the past 12 months. Of these, 27.6% (133/482) had taken 1-5 days; 8.7%
(42/482) had taken 6-30 days and 2.5% (12/482) had taken more than 30 days of
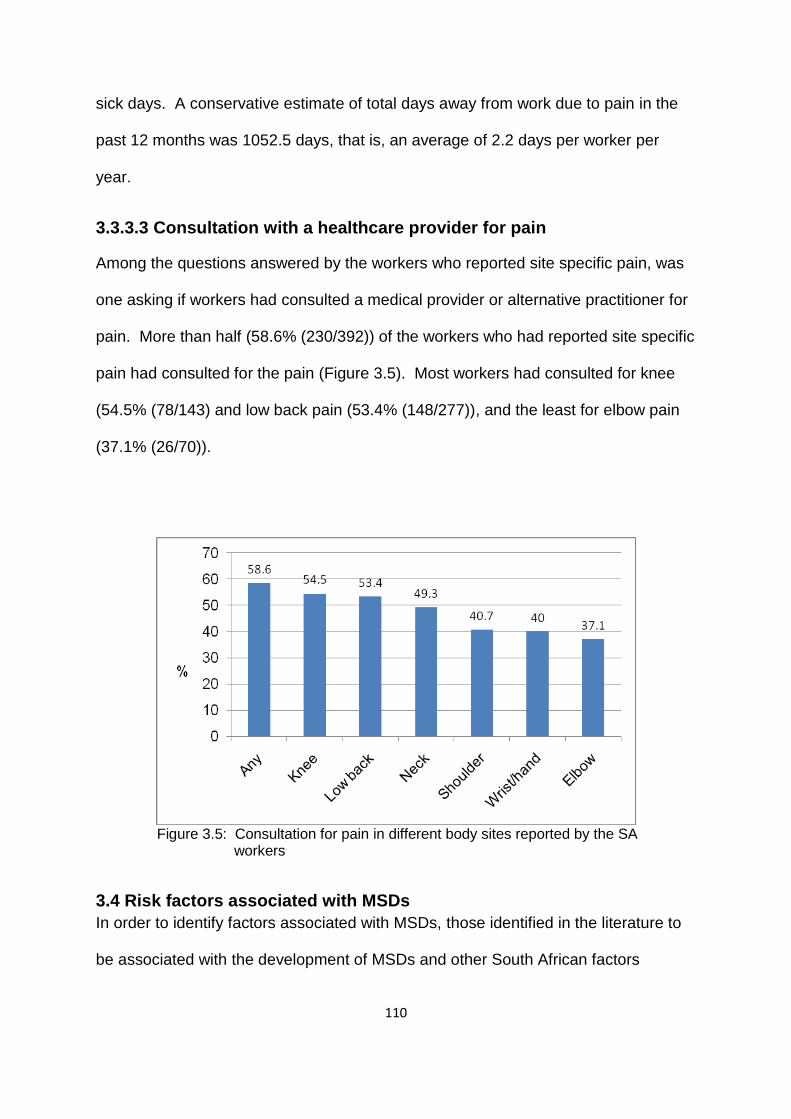
110
sick days. A conservative estimate of total days away from work due to pain in the
past 12 months was 1052.5 days, that is, an average of 2.2 days per worker per
year.
3.3.3.3 Consultation with a healthcare provider for pain
Among the questions answered by the workers who reported site specific pain, was
one asking if workers had consulted a medical provider or alternative practitioner for
pain. More than half (58.6% (230/392)) of the workers who had reported site specific
pain had consulted for the pain (Figure 3.5). Most workers had consulted for knee
(54.5% (78/143) and low back pain (53.4% (148/277)), and the least for elbow pain
(37.1% (26/70)).
Figure 3.5: Consultation for pain in different body sites reported by the SA workers
3.4 Risk factors associated with MSDs
In order to identify factors associated with MSDs, those identified in the literature to
be associated with the development of MSDs and other South African factors
111
identified as pertinent were selected. Ethnicity was included to explore its
involvement in the development of MSDs.
3.4.1 Multiple regression analysis of MSD pain in the past 12 months with possible risk factors in the South African workers Binary logistic regression was used for the partial, full and final models. The models
are presented in tables summarizing the results of multiple regression analysis of
“any”, low back, neck, shoulder, elbow, wrist or hand, upper limb and knee pain. The
tables show variables that satisfied the selection criterion for the full model (p≤0.2).
The categories ex-smoker and current smoker of the variable smoking status were
combined because of small numbers. Appendix I (table for “any” pain) shows all the
variables tested for in the full model. In the tables which follow N=the number of
subjects with the site-specific pain and n=the number of subjects with pain in each
level of the variable.
3.4.1.1 Partial and full models of “any” pain in the past 12 months in the
South African workers
The explanatory variables with the ORs indicating associations with “any” pain are
presented in the partial and full models of “any” pain in Table 3.5. Starting with the
partial models, the variables that were positively associated with “any” pain were the
following: past injuries; smoking status (ever-smoked); deserve compensation;
somatising tendency (two or more symptoms); frightening situation; adverse beliefs
about low back and arm pain; working under time pressure; job insecurity; and job
dissatisfaction. The reports of “any” pain increased with increasing age, although the
confidence intervals (95% CIs) included one.
The full model showed that there was no positive association between occupational
group (bank workers) and “any” pain. However, past injuries, smoking status (ever-

112
smoked), somatising tendency (one and two or more symptoms), frightening
situation and adverse belief about low back and arm pain were positively associated
with “any” pain. There seemed to be an increasing trend between somatising
tendency and the reporting of “any” pain by the workers. As in the partial model, the
reports of “any” pain increased with increasing age group even though the 95% CIs
included one.

113
Table 3.5: Multiple regression of “any” pain in the past 12 months with possible risk factors in the SA workers: Partial and full models
Explanatory variable
“Any” pain in past 12 months (N=392)
n (%)
Partial model Full model aOR (95% CI)
bOR (95% CI)
*Occupational group
Nurses Bank workers
211 (53.8) 181 (46.2)
1
0.70 (0.42-1.17)
1
0.28 (0.12-0.66) Age group (years)
<30 30-39 40-49
≥50
109 (28.2) 110 (28.4) 117 (30.2) 51 (13.2)
1
0.86 (0.48-1.53) 1.34 (0.70-2.58) 1.53 (0.64-3.68)
1
1.16 (0.57-2.36) 1.61 (0.71-3.61) 2.08 (0.74-5.85)
Sex
Men Women
62 (15.8) 330 (84.2)
1
1.22 (0.66-2.25)
1
1.24 (0.58-2.65) BMI group
Normal Overweight
Obese Missing
143 (36.5) 117 (29.8) 104 (26.5) 28 (7.1)
1
1.68 (0.89-3.18) 0.85 (0.47-1.55) 1.19 (0.41-3.46)
1
1.34 (0.66-2.73) 0.75 (0.37-1.49) 0.79 (0.24-2.59)
*Past injuries
No Yes
274 (70.3) 116 (29.7)
1
3.43 (1.74-6.76)
1
2.82 (1.30-6.10) Educational level
High school Tertiary
121 (30.9) 270 (69.1)
1
0.65 (0.35-1.19)
1
0.57 (0.27-1.21) *Smoking status
Never-smoked Ever-smoked
296 (75.5) 96 (24.5)
1
2.45 (1.28-4.70)
1
2.43 (1.09-5.25) Financial difficulties
No Yes
105 (27.1) 283 (72.9)
1
1.49 (0.91-2.43)
1
1.17 (0.65-2.10) *Deserve compensation
No Yes
128 (33.4) 255 (66.6)
1
1.67 (1.02-2.73)
1
1.44 (0.79-2.60) *Number of distressing somatic symptoms
0 1
≥2
122 (31.1) 95 (24.2) 175 (44.6)
1
1.48 (0.86-2.57) 2.83 (1.56-5.12)
1
2.30 (1.16-4.55) 3.23 (1.63-6.38)
*Frightening situation
No Yes
189 (48.8) 198 (51.2)
1
2.61 (1.58-4.31)
1
1.94 (1.09-3.47) aAdjusted for occupational group, age group and sex; occupational group, age group and sex were mutually adjusted.
bAdjusted for all the risk factors in the table.
*Explanatory variables associated with “any” pain in partial and/ or full models.
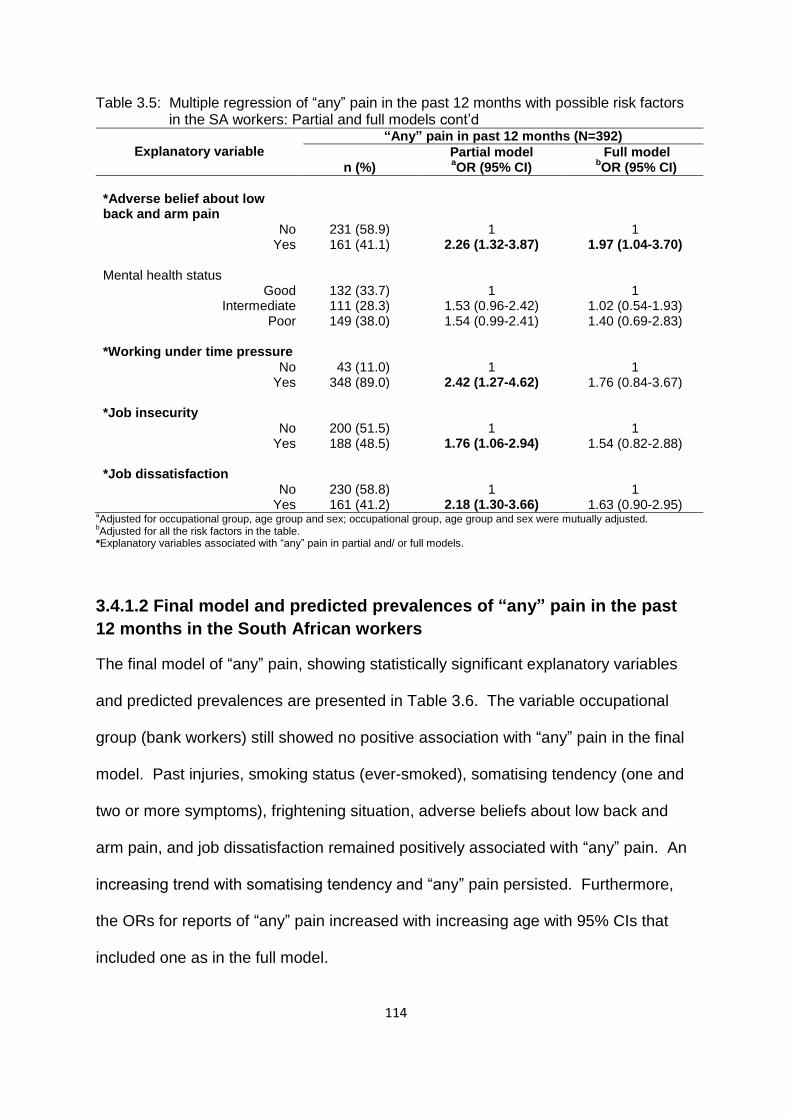
114
Table 3.5: Multiple regression of “any” pain in the past 12 months with possible risk factors in the SA workers: Partial and full models cont’d
Explanatory variable
“Any” pain in past 12 months (N=392)
n (%)
Partial model Full model aOR (95% CI)
bOR (95% CI)
*Adverse belief about low back and arm pain
No Yes
231 (58.9) 161 (41.1)
1
2.26 (1.32-3.87)
1
1.97 (1.04-3.70) Mental health status
Good Intermediate
Poor
132 (33.7) 111 (28.3) 149 (38.0)
1
1.53 (0.96-2.42) 1.54 (0.99-2.41)
1
1.02 (0.54-1.93) 1.40 (0.69-2.83)
*Working under time pressure
No Yes
43 (11.0) 348 (89.0)
1
2.42 (1.27-4.62)
1
1.76 (0.84-3.67) *Job insecurity
No Yes
200 (51.5) 188 (48.5)
1
1.76 (1.06-2.94)
1
1.54 (0.82-2.88) *Job dissatisfaction
No Yes
230 (58.8) 161 (41.2)
1
2.18 (1.30-3.66)
1
1.63 (0.90-2.95) aAdjusted for occupational group, age group and sex; occupational group, age group and sex were mutually adjusted.
bAdjusted for all the risk factors in the table.
*Explanatory variables associated with “any” pain in partial and/ or full models.
3.4.1.2 Final model and predicted prevalences of “any” pain in the past
12 months in the South African workers
The final model of “any” pain, showing statistically significant explanatory variables
and predicted prevalences are presented in Table 3.6. The variable occupational
group (bank workers) still showed no positive association with “any” pain in the final
model. Past injuries, smoking status (ever-smoked), somatising tendency (one and
two or more symptoms), frightening situation, adverse beliefs about low back and
arm pain, and job dissatisfaction remained positively associated with “any” pain. An
increasing trend with somatising tendency and “any” pain persisted. Furthermore,
the ORs for reports of “any” pain increased with increasing age with 95% CIs that
included one as in the full model.

115
Table 3.6: Multiple regression of “any” pain in the past 12 months with possible risk factors and predicted prevalences in the SA workers: Final model
Explanatory variable
“Any” pain in past 12 months (N=392)
n (%)
aFinal model Predicted prevalence
bOR (95% CI) % (95% CI)
c∆ (%)
*Occupational group
Nurses Bank workers
211 (53.8) 181 (46.2)
1
0.51 (0.27-0.96)
85.3 (80.9-89.5) 74.8 (68.7-80.9)
-10.5 Age group (years)
<30 30-39 40-49
≥50
109 (28.2) 110 (28.4) 117 (30.2) 51 (13.2)
1
1.12 (0.58-2.18) 1.71 (0.82-3.56) 2.23 (0.86-5.79)
77.7 (70.9-84.5) 77.9 (71.7-84.2) 84.2 (78.1-90.3) 86.6 (78.5-94.8)
8.9 Sex
Men Women
62 (15.8) 330 (84.2)
1
1.37 (0.67-2.83)
78.4 (69.8-87.0) 81.2 (77.5-84.9)
2.8 *Past injuries
No Yes
274 (70.3) 116 (29.7)
1
2.88 (1.36-6.10)
77.9 (73.9-81.9) 89.6 (84.1-95.2)
11.7 *Smoking status
Never-smoked Ever-smoked
296 (75.5) 96 (24.5)
1
2.80 (1.31-5.96)
78.2 (74.2-82.2) 88.8 (83.0-94.5)
10.6 *Number of distressing somatic symptoms
0 1
≥2
122 (31.1) 95 (24.2) 175 (44.6)
1
2.23 (1.15-4.31) 3.52 (1.84-6.72)
71.6 (65.2-78.0) 82.4 (75.7-89.1) 88.7 (84.1-93.2)
10.8 17.1
*Frightening situation
No Yes
189 (48.8) 198 (51.2)
1
2.11 (1.21-3.68)
76.8 (71.9-81.6) 85.6 (81.0-90.3)
8.8 *Adverse beliefs about low back and arm pain
No Yes
231 (58.9) 161 (41.1)
1
1.95 (1.08-3.52)
77.7 (73.4-82.1) 86.2 (81.1-91.4)
8.5 *Job dissatisfaction
No Yes
230 (58.8) 161 (41.2)
1
1.79 (1.01-3.18)
78.1 (73.7-82.4) 85.3 (80.2-90.4)
7.2 a
Post regression tests: Hosmer-Lemeshow chi2 p-value group (8)=0.13; group (10)=0.27; group (12); 0.55; ROC curve
=78.3%.
bAdjusted ORs of significant risk factors.
cDifference in predicted prevalences of associated level/s of explanatory variables and relevant reference groups.
*Explanatory variables associated with “any” pain in final model with their respective predicted prevalences.
The predicted prevalences of “any” pain showed that the “number of distressing
somatic symptoms” had the biggest effect with an increase of 17.1% in the
prevalence of “any” pain in the workers who reported two or more distressing
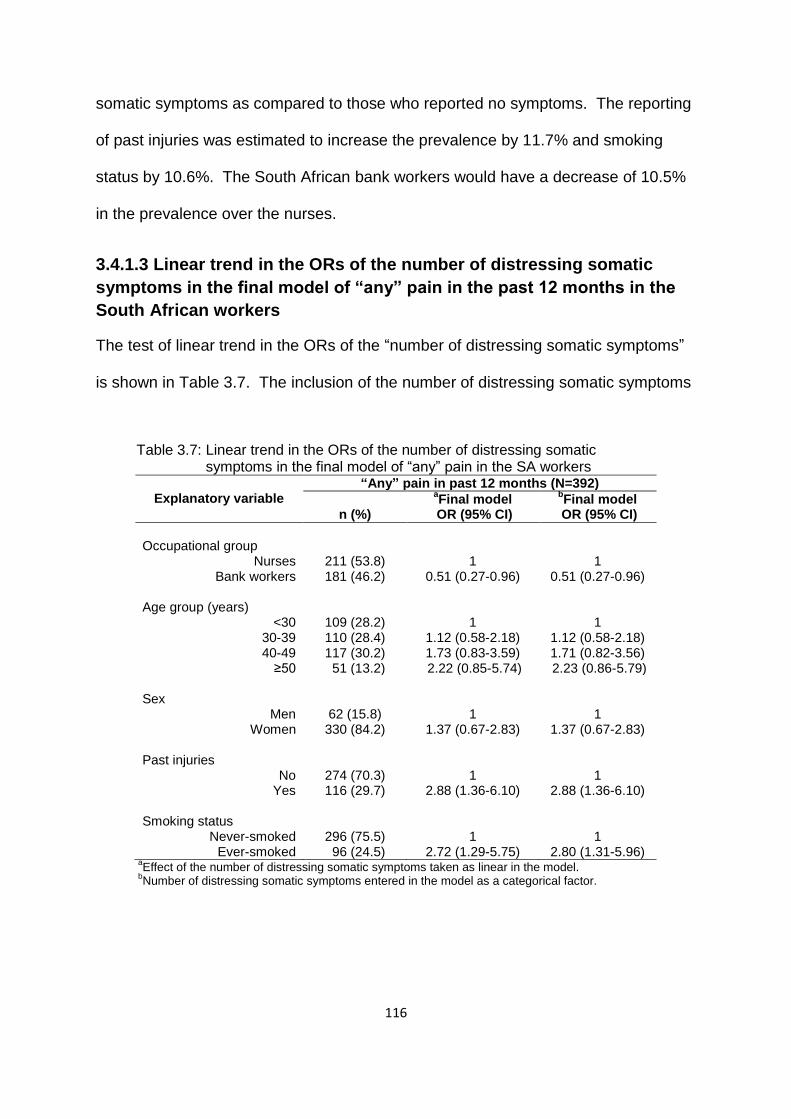
116
somatic symptoms as compared to those who reported no symptoms. The reporting
of past injuries was estimated to increase the prevalence by 11.7% and smoking
status by 10.6%. The South African bank workers would have a decrease of 10.5%
in the prevalence over the nurses.
3.4.1.3 Linear trend in the ORs of the number of distressing somatic
symptoms in the final model of “any” pain in the past 12 months in the
South African workers
The test of linear trend in the ORs of the “number of distressing somatic symptoms”
is shown in Table 3.7. The inclusion of the number of distressing somatic symptoms
Table 3.7: Linear trend in the ORs of the number of distressing somatic symptoms in the final model of “any” pain in the SA workers
Explanatory variable
“Any” pain in past 12 months (N=392)
n (%)
aFinal model
bFinal model
OR (95% CI) OR (95% CI)
Occupational group
Nurses Bank workers
211 (53.8) 181 (46.2)
1
0.51 (0.27-0.96)
1 0.51 (0.27-0.96)
Age group (years)
<30 30-39 40-49
≥50
109 (28.2) 110 (28.4) 117 (30.2) 51 (13.2)
1
1.12 (0.58-2.18) 1.73 (0.83-3.59) 2.22 (0.85-5.74)
1
1.12 (0.58-2.18) 1.71 (0.82-3.56) 2.23 (0.86-5.79)
Sex
Men Women
62 (15.8) 330 (84.2)
1
1.37 (0.67-2.83)
1
1.37 (0.67-2.83) Past injuries
No Yes
274 (70.3) 116 (29.7)
1
2.88 (1.36-6.10)
1
2.88 (1.36-6.10) Smoking status
Never-smoked Ever-smoked
296 (75.5) 96 (24.5)
1
2.72 (1.29-5.75)
1
2.80 (1.31-5.96) a
Effect of the number of distressing somatic symptoms taken as linear in the model. b
Number of distressing somatic symptoms entered in the model as a categorical factor.
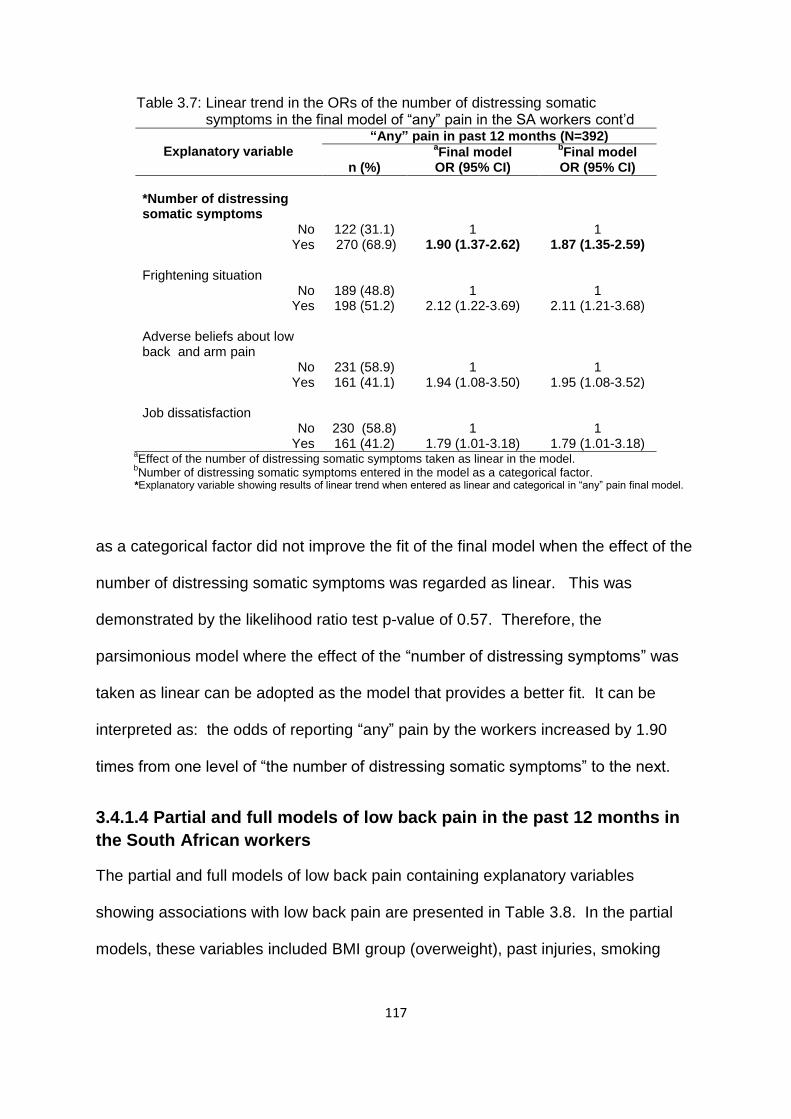
117
Table 3.7: Linear trend in the ORs of the number of distressing somatic symptoms in the final model of “any” pain in the SA workers cont’d
Explanatory variable
“Any” pain in past 12 months (N=392)
n (%)
aFinal model
bFinal model
OR (95% CI) OR (95% CI)
*Number of distressing somatic symptoms
No Yes
122 (31.1) 270 (68.9)
1
1.90 (1.37-2.62)
1
1.87 (1.35-2.59) Frightening situation
No Yes
189 (48.8) 198 (51.2)
1
2.12 (1.22-3.69)
1
2.11 (1.21-3.68) Adverse beliefs about low back and arm pain
No Yes
231 (58.9) 161 (41.1)
1
1.94 (1.08-3.50)
1
1.95 (1.08-3.52) Job dissatisfaction
No Yes
230 (58.8) 161 (41.2)
1
1.79 (1.01-3.18)
1
1.79 (1.01-3.18) a
Effect of the number of distressing somatic symptoms taken as linear in the model. b
Number of distressing somatic symptoms entered in the model as a categorical factor. *Explanatory variable showing results of linear trend when entered as linear and categorical in “any” pain final model.
as a categorical factor did not improve the fit of the final model when the effect of the
number of distressing somatic symptoms was regarded as linear. This was
demonstrated by the likelihood ratio test p-value of 0.57. Therefore, the
parsimonious model where the effect of the “number of distressing symptoms” was
taken as linear can be adopted as the model that provides a better fit. It can be
interpreted as: the odds of reporting “any” pain by the workers increased by 1.90
times from one level of “the number of distressing somatic symptoms” to the next.
3.4.1.4 Partial and full models of low back pain in the past 12 months in
the South African workers
The partial and full models of low back pain containing explanatory variables
showing associations with low back pain are presented in Table 3.8. In the partial
models, these variables included BMI group (overweight), past injuries, smoking
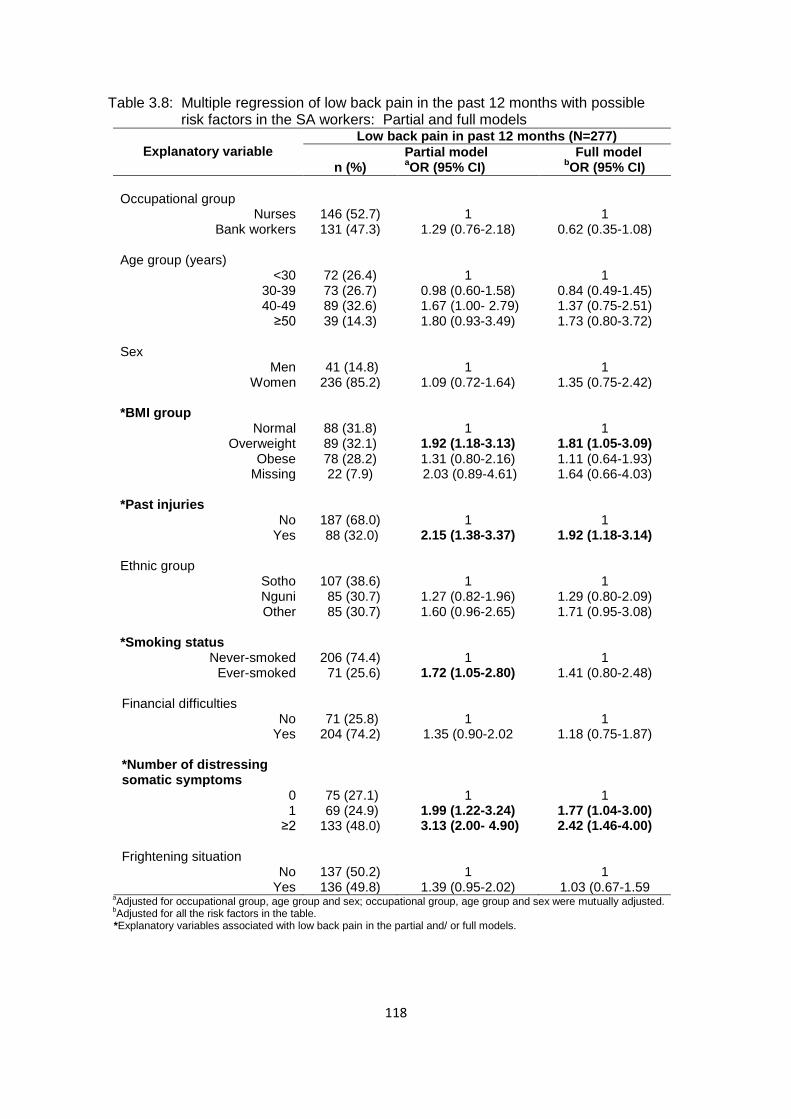
118
Table 3.8: Multiple regression of low back pain in the past 12 months with possible risk factors in the SA workers: Partial and full models
Explanatory variable
Low back pain in past 12 months (N=277)
n (%)
Partial model Full model aOR (95% CI)
bOR (95% CI)
Occupational group
Nurses Bank workers
146 (52.7) 131 (47.3)
1
1.29 (0.76-2.18)
1
0.62 (0.35-1.08) Age group (years)
<30 30-39 40-49
≥50
72 (26.4) 73 (26.7) 89 (32.6) 39 (14.3)
1
0.98 (0.60-1.58) 1.67 (1.00- 2.79) 1.80 (0.93-3.49)
1
0.84 (0.49-1.45) 1.37 (0.75-2.51) 1.73 (0.80-3.72)
Sex
Men Women
41 (14.8) 236 (85.2)
1
1.09 (0.72-1.64)
1
1.35 (0.75-2.42) *BMI group
Normal Overweight
Obese Missing
88 (31.8) 89 (32.1) 78 (28.2) 22 (7.9)
1
1.92 (1.18-3.13) 1.31 (0.80-2.16) 2.03 (0.89-4.61)
1
1.81 (1.05-3.09) 1.11 (0.64-1.93) 1.64 (0.66-4.03)
*Past injuries
No Yes
187 (68.0) 88 (32.0)
1
2.15 (1.38-3.37)
1
1.92 (1.18-3.14) Ethnic group
Sotho Nguni Other
107 (38.6) 85 (30.7) 85 (30.7)
1
1.27 (0.82-1.96) 1.60 (0.96-2.65)
1
1.29 (0.80-2.09) 1.71 (0.95-3.08)
*Smoking status
Never-smoked Ever-smoked
206 (74.4) 71 (25.6)
1
1.72 (1.05-2.80)
1
1.41 (0.80-2.48) Financial difficulties
No Yes
71 (25.8) 204 (74.2)
1
1.35 (0.90-2.02
1
1.18 (0.75-1.87) *Number of distressing somatic symptoms
0 1
≥2
75 (27.1) 69 (24.9) 133 (48.0)
1
1.99 (1.22-3.24) 3.13 (2.00- 4.90)
1
1.77 (1.04-3.00) 2.42 (1.46-4.00)
Frightening situation
No Yes
137 (50.2) 136 (49.8)
1
1.39 (0.95-2.02)
1
1.03 (0.67-1.59 a
Adjusted for occupational group, age group and sex; occupational group, age group and sex were mutually adjusted. b
Adjusted for all the risk factors in the table. *Explanatory variables associated with low back pain in the partial and/ or full models.

119
Table 3.8: Multiple regression of low back pain in the past 12 months with possible risk factors in the SA workers: Partial and full models cont’d
Explanatory variable
Low back pain in past 12 months (N=277)
n (%)
Partial model Full model aOR (95% CI)
bOR (95% CI)
Adverse beliefs about low back pain
No Yes
187 (67.5) 90 (32.5)
1
1.47 (0.97-2.22)
1
1.20 (0.75-1.93) Mental health status
Good Intermediate
Poor
90 (32.5) 84 (30.3) 103 (37.2)
1
1.53 (0.96-2.42) 1.54 (0.99-2.41)
1
1.16 (0.69-1.95) 1.06 (0.63-1.78)
*Working under time pressure
No Yes
28 (10.1) 249 (89.9)
1
1.80 (1.02-3.17)
1
1.61 (0.85-3.05
*Lack of social support
No Yes
216 (80.0) 54 (20.0)
1
1.80 (1.02-3.17)
1
1.67 (0.94-2.98) Job insecurity
No Yes
140 (50.9) 135 (49.1)
1
1.35 (0.90-2.02)
1
1.00 (0.63-1.59) *Job dissatisfaction
No Yes
157 (56.7) 120 (43.3)
1
1.74 (1.18-2.56)
1
1.48 (0.95-2.30) a
Adjusted for occupational group, age group and sex; occupational group, age group and sex were mutually adjusted. b
Adjusted for all the risk factors in the table. *Explanatory variables associated with low back pain in the partial and/ or full models.
status (ever- smoked), somatising tendency (one and two or more symptoms),
working under time pressure, lack of social support and job dissatisfaction. The ORs
indicated an increasing pattern among increasing levels of somatising tendency and
reporting of low back pain. The reporting of low back pain increased with age but the
95% CIs included one. In the full model, BMI group (overweight), past injuries and
somatising tendency (one and two or more symptoms) remained associated with low
back pain. An increasing pattern among increasing levels of somatising tendency
and age group with low back pain remained.

120
3.4.1.5 Final model and predicted prevalences of low back pain in the
past 12 months in the South African workers
Explanatory variables with statistically significant ORs illustrating association with
low back pain and predicted prevalences are portrayed in the final model (Table 3.9)
Table 3.9: Multiple regression of low back pain in the past 12 months with possible risk factors and predicted prevalences in the SA workers: Final model
Explanatory variable
Low back pain in past 12 months (N=277)
n (%)
aFinal model Predicted prevalence
bOR (95% CI) % (95% CI)
c∆ (%)
Occupational group
Nurses Bank workers
146 (52.7) 131 (47.3)
1
0.70 (0.42-1.18)
60.3 (53.8-66.8) 52.9 (45.8-60.0)
-7.4 Age group (years)
<30 30-39 40-49
≥50
72 (26.4) 73 (26.7) 89 (32.6) 39 (14.3)
1
0.84 (0.49-1.43) 1.42 (0.79-2.56) 1.68 (0.79-3.54)
54.5 (46.0-62.9) 50.9 (42.9-58.9) 62.1 (53.8-70.4) 64.5 (52.5-76.5)
10 Sex
Men Women
41 (14.8) 236 (85.2)
1
1.29 (0.72-2.28)
54.1 (43.2-64.9) 57.4 (52.7-62.1)
3.3 *BMI group
Normal Overweight
Obese Missing
88 (31.8) 89 (32.1) 78 (28.2) 22 (7.9)
1
1.84 (1.08-3.11) 1.10 (0.64-1.89) 1.62 (0.66-3.92)
50.8 (43.2-58.2) 64.4 (56.5-72.4) 55.5 (47.0-63.9) 65.6 (49.6-81.5)
8.9 *Past injuries
No Yes
187 (68.0) 88 (32.0)
1
2.04 (1.26-3.28)
53.0 (48.0-57.9) 67.9 (59.9-75.9)
8.9 *Ethnic group
Sotho Nguni Other
107 (38.6) 85 (30.7) 85 (30.7)
1
1.22 (0.76-1.96) 1.86 (1.07-3.23)
51.9 (45.2-58.6) 55.5 (47.8-63.2) 65.9 (57.7-74.3)
14 *Number of distressing somatic symptoms
0 1
≥2
75 (27.1) 69 (24.9) 133 (48.0)
1
1.81 (1.07-3.03) 2.72 (1.69-4.40)
43.9 (36.7-51.3) 57.8 (49.1-66.5) 67.8 (61.3-74.4)
13.9 23.9
*Job dissatisfaction
No Yes
157 (56.7) 120 (43.3)
1
1.61 (1.06-2.45)
52.8 (47.3-58.2) 63.2 (56.6-69.9)
10.4 a
Post regression tests :Hosmer-Lemeshow chi2 p-value group (8)=0.43; group (10)=0.94; group (12)=0.84; ROC curve=
70.2%. b
Adjusted ORs of significant risk factors. c
Difference in the predicted prevalences of associated level/s of explanatory variables and the relevant reference groups. *Explanatory variables associated with low back pain with their respective predicted prevalences in the final model.
121
The BMI group (overweight), past injuries, ethnic group (other), somatising tendency
(one and two or more symptoms) and job dissatisfaction increased the odds of
reporting low back pain by the workers. The ORs of somatising tendency increased
with the reports of low back pain as in the partial and full models. Again, as in
previous models of low back pain, the reports of low back pain increased with age
group although the 95% CIs included one.
The predicted prevalences of low back pain show the number of distressing somatic
symptoms as the variable that will have the largest increase (23.9% higher
compared to no symptoms) in the prevalence of low back pain in SA workers who
report two or more distressing somatic symptoms. Ethnic group (other) would have
a 14.0% increase over the Sotho group and job dissatisfaction is estimated to
increase low back pain by 10.4%.
3.4.1.5.1 Linear trend in the ORs of the number of distressing somatic
symptoms in the final model of low back pain in the past 12 months in
the South African workers
The test for linear trend in the ORs of the “number of distressing somatic symptoms”
is shown in Table 3.10. The inclusion of the number of distressing somatic
symptoms as a binary categorical factor did not improve the fit of the final model
when the effect of the number of distressing somatic symptoms was taken as linear.
This is demonstrated by the likelihood ratio test p-value of 0.69. Therefore, the
parsimonious model where the “number of distressing symptoms” was taken as
linear, can be adopted as the model that provides a better fit. It can be summarised
as: the odds of reporting low back pain by the workers increased by 1.65 times from
one level of the “number of distressing somatic symptoms” to the next.

122
Table 3.10: Linear trend in the ORs of the number of distressing somatic symptoms in the final model of low back pain in the SA workers
Explanatory variable
Low back pain in past 12 months (N=277)
n (%)
aFinal model
bFinal model
OR (95% CI) OR (95% CI)
Occupational group
Nurses Bank workers
146 (52.7) 131 (47.3)
1
0.70 (0.42-1.18)
1
0.70 (0.42-1.18) Age group (years)
<30 30-39 40-49
≥50
72 (26.4) 73 (26.7) 89 (32.6) 39 (14.3)
1
0.84 (0.49-1.43) 1.42 (0.79-2.57) 1.67 (0.79-3.52)
1
0.84 (0.49-1.43) 1.42 (0.79-2.56) 1.68 (0.79-3.54)
Sex
Men Women
41 (14.8) 236 (85.2)
1
1.29 (0.72-2.29)
1
1.29 (0.72-2.28) BMI group
Normal Overweight
Obese Missing
88 (31.8) 89 (32.1) 78 (28.2) 22 (7.9)
1
1.85 (1.09-3.13) 1.11 (0.65-1.90) 1.63 (0.67-3.94)
1
1.84 (1.08-3.11) 1.10 (0.64-1.89) 1.62 (0.66-3.92)
Past injuries
No Yes
187 (68.0) 88 (32.0)
1
2.04 (1.27-3.29)
1
2.04 (1.26-3.28) Ethnic group
Sotho Nguni Other
107 (38.6) 85 (30.7) 85 (30.7)
1
1.22 (0.76-1.96) 1.86 (1.07-3.23)
1
1.22 (0.76-1.96) 1.86 (1.07-3.23)
*Number of distressing somatic symptoms
No Yes
75 (27.1) 202 (72.9)
1
1.65 (1.29-2.09)
1
1.65 (1.30-2.09) Job dissatisfaction
No Yes
157 (56.7) 120 (43.3)
1
1.62 (1.06-2.46)
1
1.61 (1.06-2.45) a
Effect of distressing somatic symptoms taken as linear in the model. b
Number of distressing somatic symptoms entered in the model as a categorical factor. *Explanatory variable showing results of linear trend when entered as linear and categorical in the low back
pain final model.

123
3.4.1.7 Partial and full models of neck pain in the past 12 months in the
South African workers
The partial and full models of neck pain showing explanatory variables with ORs
signifying positive associations with neck pain are displayed in Table 3.11.
Occupational group (bank worker), past injuries, financial difficulties, somatising
tendency (two or more symptoms), frightening situation, mental health status (poor),
working under time pressure, lack of social support and job dissatisfaction were
positively associated with neck pain in the partial models.
Table 3.11: Multiple regression of neck pain in the past 12 months with possible risk factors in the SA workers: Partial and full models
Explanatory variable
Neck pain in past 12 months (N=225)
n (%)
Partial model Full model aOR (95% CI)
bOR (95% CI)
*Occupational group
Nurses Bank workers
100 (44.4) 125 (55.6)
1
1.94 (1.29-2.92)
1
1.20 (0.60-2.27) Age group (years)
<30 30-39 40-49
≥50
62 (28.0) 66 (29.9) 69 (31.2) 24 (10.9)
1
1.26 (0.77-2.05) 1.56 (0.93-2.61) 1.09 (0.56-2.08)
1
1.49 (0.82-2.71) 1.50 (0.77-2.90) 1.26 (0.56-2.84)
Sex
Male Female
39 (17.3) 186 (82.7)
1
1.21 (0.71-2.05)
1
1.35 (0.72-2.52) BMI group
Normal Overweight
Obese missing
82 (36.4) 75 (33.3) 54 (24.0) 14 (6.2)
1
1.58 (0.97-2.56) 0.85 (0.51-1.40) 1.21( 0.55-2.69)
1
1.46 (0.83-2.55) 0.84 (0.46-1.52) 1.08 (0.43-2.71)
*Past injuries
No Yes
146 (65.5) 77 (34.5)
1
2.12 (1.38-3.25)
1
1.91 (1.16-3.13) Educational level
High school Tertiary
83 (37.1) 141 (62.9)
1
0.72 (0.44-1.17)
1
0.65 (0.36-1.18) Smoking status
Never-smoked Ever –smoked
161 (71.6) 64 (28.4)
1
1.56 (0.97-2.51)
1
1.43 (0.81-2.51) aAdjusted for occupational group, age group and sex; occupational group, age group and sex were mutually adjusted.
bAdjusted for all the risk factors in the table.
*Explanatory variables associated with neck pain in the partial and/ or full models.

124
Table 3.11: Multiple regression of neck pain in the past 12 months with possible risk factors in the SA workers: Partial and full models cont’d
Explanatory variable
Neck pain in past 12 months (N=225)
n (%)
Partial model Full model aOR (95% CI)
bOR (95% CI)
*Financial difficulties
No Yes
48 (21.7) 173 (78.3)
1
1.77 (1.17-2.68)
1
1.88 (1.16-3.07) Deserve compensation
No Yes
73 (33.3) 146 (66.7)
1
1.47 (0.98-2.21)
1
1.46 (0.91-2.33) *Number of distressing somatic symptoms
0 1
≥2
58 (25.8) 50 (22.2) 117 (52.0)
1
1.48 (0.91-2.43) 2.81 (1.81-4.37)
1
1.56 (0.89-2.72) 2.40 (1.43-4.02)
*Frightening situation
No Yes
92 (41.8) 128 (58.2)
1
2.41 (1.65-3.53)
1
1.97 (1.27-3.04) *Mental health status
Good Intermediate
Poor
63 (28.0) 66 (29.3) 96 (42.7)
1
1.58 (1.00-2.51) 2.12 (1.35-3.32)
1
1.29 (0.76-2.20) 1.26 (0.73-2.16)
*Working under time pressure
No Yes
16 (7.1) 208 (92.9)
1
2.29 (1.23-4.25)
1
1.86 (0.91-3.80)
*Lack of social support
No Yes
176 (78.9) 47 (21.1)
1
1.72 (1.04-2.85)
1
1.79 (0.99-3.23) Job insecurity
No Yes
105 (47.1) 118 (52.9)
1
1.31 (0.88-1.96)
1
1.09 (0.68-1.74) *Job dissatisfaction
No Yes
126 (56.2) 98 (43.8)
1
1.50 (1.03-2.19)
1
1.17 (0.74-1.83) aAdjusted for occupational group, age group and sex; occupational group, age group and sex were mutually adjusted.
bAdjusted for all the risk factors in the table.
*Explanatory variables associated with neck pain in the partial and/ or full models.
In the full model, the variables that were associated with neck pain were past
injuries, financial difficulties, somatising tendency (two or more symptoms) and
frightening situation.
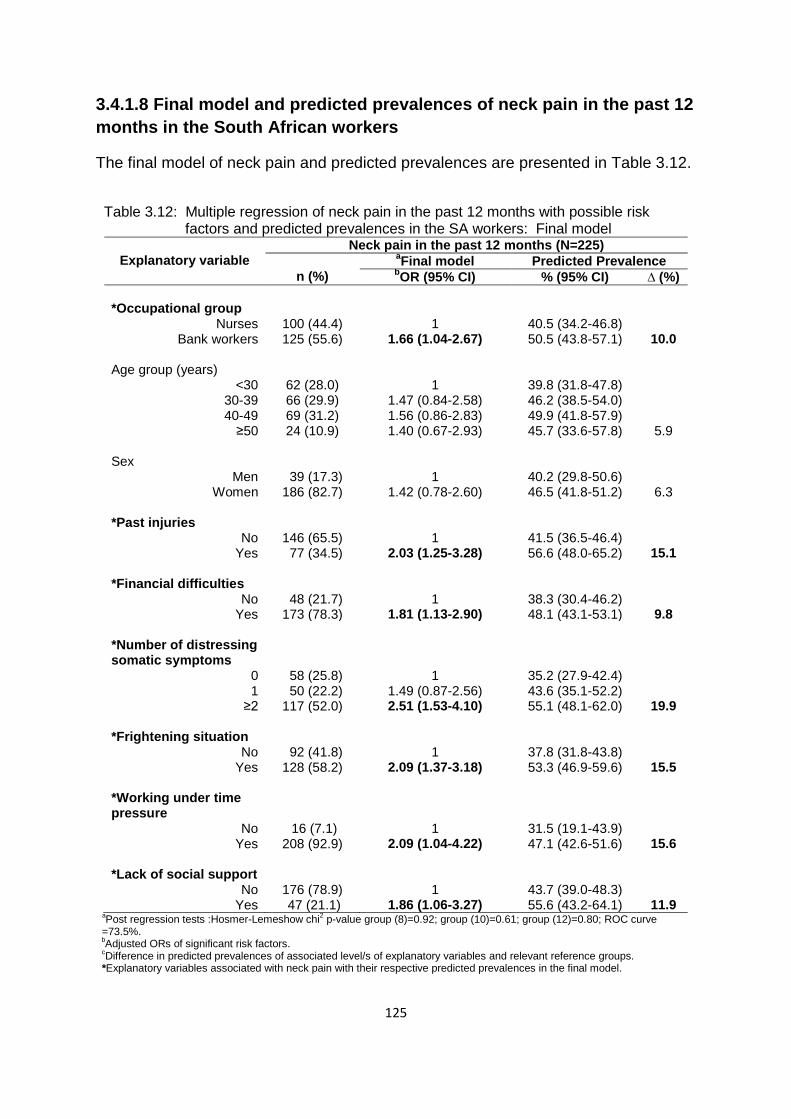
125
3.4.1.8 Final model and predicted prevalences of neck pain in the past 12
months in the South African workers
The final model of neck pain and predicted prevalences are presented in Table 3.12.
Table 3.12: Multiple regression of neck pain in the past 12 months with possible risk factors and predicted prevalences in the SA workers: Final model
Explanatory variable
Neck pain in the past 12 months (N=225)
n (%)
aFinal model Predicted Prevalence
bOR (95% CI) % (95% CI) ∆ (%)
*Occupational group
Nurses Bank workers
100 (44.4) 125 (55.6)
1
1.66 (1.04-2.67)
40.5 (34.2-46.8) 50.5 (43.8-57.1)
10.0 Age group (years)
<30 30-39 40-49
≥50
62 (28.0) 66 (29.9) 69 (31.2) 24 (10.9)
1
1.47 (0.84-2.58) 1.56 (0.86-2.83) 1.40 (0.67-2.93)
39.8 (31.8-47.8) 46.2 (38.5-54.0) 49.9 (41.8-57.9) 45.7 (33.6-57.8)
5.9 Sex
Men Women
39 (17.3) 186 (82.7)
1
1.42 (0.78-2.60)
40.2 (29.8-50.6) 46.5 (41.8-51.2)
6.3 *Past injuries
No Yes
146 (65.5) 77 (34.5)
1
2.03 (1.25-3.28)
41.5 (36.5-46.4) 56.6 (48.0-65.2)
15.1 *Financial difficulties
No Yes
48 (21.7) 173 (78.3)
1
1.81 (1.13-2.90)
38.3 (30.4-46.2) 48.1 (43.1-53.1)
9.8 *Number of distressing somatic symptoms
0 1
≥2
58 (25.8) 50 (22.2) 117 (52.0)
1
1.49 (0.87-2.56) 2.51 (1.53-4.10)
35.2 (27.9-42.4) 43.6 (35.1-52.2) 55.1 (48.1-62.0)
19.9 *Frightening situation
No Yes
92 (41.8) 128 (58.2)
1
2.09 (1.37-3.18)
37.8 (31.8-43.8) 53.3 (46.9-59.6)
15.5 *Working under time pressure
No Yes
16 (7.1) 208 (92.9)
1
2.09 (1.04-4.22)
31.5 (19.1-43.9) 47.1 (42.6-51.6)
15.6 *Lack of social support
No Yes
176 (78.9) 47 (21.1)
1
1.86 (1.06-3.27)
43.7 (39.0-48.3) 55.6 (43.2-64.1)
11.9 a
Post regression tests :Hosmer-Lemeshow chi2 p-value group (8)=0.92; group (10)=0.61; group (12)=0.80; ROC curve
=73.5%. b
Adjusted ORs of significant risk factors.
cDifference in predicted prevalences of associated level/s of explanatory variables and relevant reference groups.
*Explanatory variables associated with neck pain with their respective predicted prevalences in the final model.
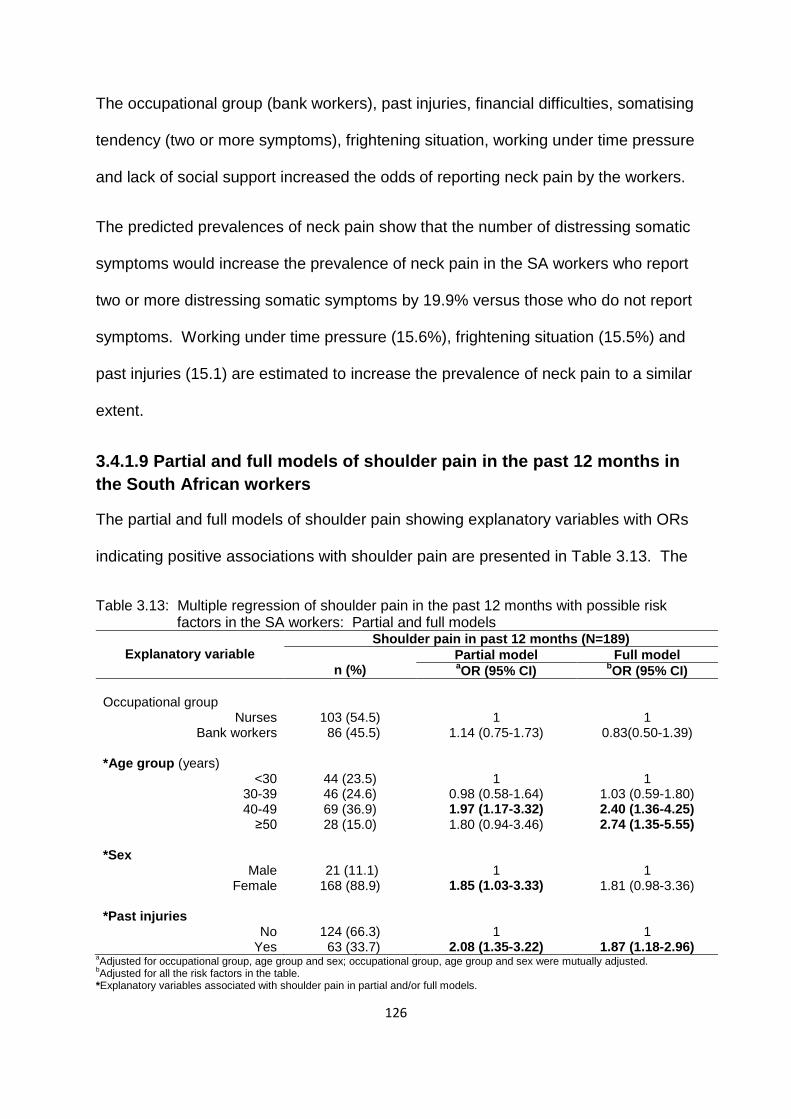
126
The occupational group (bank workers), past injuries, financial difficulties, somatising
tendency (two or more symptoms), frightening situation, working under time pressure
and lack of social support increased the odds of reporting neck pain by the workers.
The predicted prevalences of neck pain show that the number of distressing somatic
symptoms would increase the prevalence of neck pain in the SA workers who report
two or more distressing somatic symptoms by 19.9% versus those who do not report
symptoms. Working under time pressure (15.6%), frightening situation (15.5%) and
past injuries (15.1) are estimated to increase the prevalence of neck pain to a similar
extent.
3.4.1.9 Partial and full models of shoulder pain in the past 12 months in
the South African workers
The partial and full models of shoulder pain showing explanatory variables with ORs
indicating positive associations with shoulder pain are presented in Table 3.13. The
Table 3.13: Multiple regression of shoulder pain in the past 12 months with possible risk factors in the SA workers: Partial and full models
Explanatory variable
Shoulder pain in past 12 months (N=189)
n (%)
Partial model Full model aOR (95% CI)
bOR (95% CI)
Occupational group
Nurses Bank workers
103 (54.5) 86 (45.5)
1
1.14 (0.75-1.73)
1
0.83(0.50-1.39) *Age group (years)
<30 30-39 40-49
≥50
44 (23.5) 46 (24.6) 69 (36.9) 28 (15.0)
1
0.98 (0.58-1.64) 1.97 (1.17-3.32) 1.80 (0.94-3.46)
1
1.03 (0.59-1.80) 2.40 (1.36-4.25) 2.74 (1.35-5.55)
*Sex
Male Female
21 (11.1) 168 (88.9)
1
1.85 (1.03-3.33)
1
1.81 (0.98-3.36) *Past injuries
No Yes
124 (66.3) 63 (33.7)
1
2.08 (1.35-3.22)
1
1.87 (1.18-2.96) aAdjusted for occupational group, age group and sex; occupational group, age group and sex were mutually adjusted.
bAdjusted for all the risk factors in the table.
*Explanatory variables associated with shoulder pain in partial and/or full models.
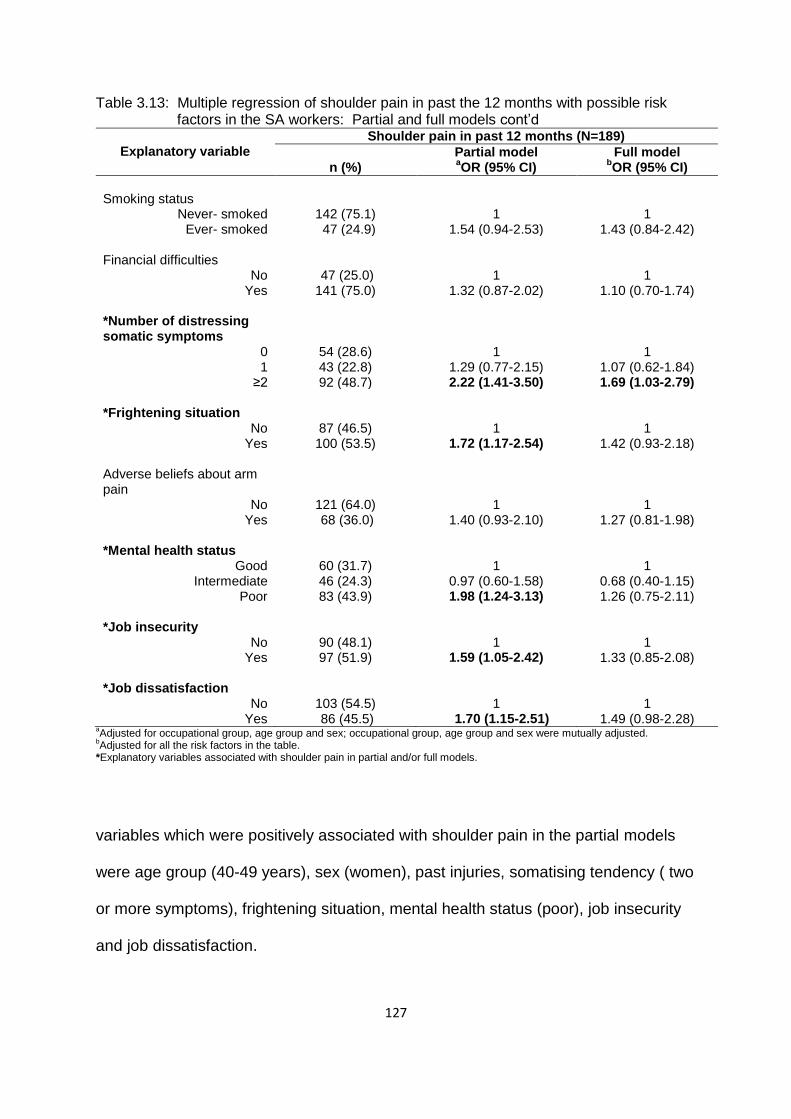
127
Table 3.13: Multiple regression of shoulder pain in past the 12 months with possible risk factors in the SA workers: Partial and full models cont’d
Explanatory variable
Shoulder pain in past 12 months (N=189)
n (%)
Partial model Full model aOR (95% CI)
bOR (95% CI)
Smoking status
Never- smoked Ever- smoked
142 (75.1) 47 (24.9)
1
1.54 (0.94-2.53)
1
1.43 (0.84-2.42) Financial difficulties
No Yes
47 (25.0) 141 (75.0)
1
1.32 (0.87-2.02)
1
1.10 (0.70-1.74) *Number of distressing somatic symptoms
0 1
≥2
54 (28.6) 43 (22.8) 92 (48.7)
1
1.29 (0.77-2.15) 2.22 (1.41-3.50)
1
1.07 (0.62-1.84) 1.69 (1.03-2.79)
*Frightening situation
No Yes
87 (46.5) 100 (53.5)
1
1.72 (1.17-2.54)
1
1.42 (0.93-2.18) Adverse beliefs about arm pain
No Yes
121 (64.0) 68 (36.0)
1
1.40 (0.93-2.10)
1
1.27 (0.81-1.98)
*Mental health status Good
Intermediate Poor
60 (31.7) 46 (24.3) 83 (43.9)
1
0.97 (0.60-1.58) 1.98 (1.24-3.13)
1
0.68 (0.40-1.15) 1.26 (0.75-2.11)
*Job insecurity
No Yes
90 (48.1) 97 (51.9)
1
1.59 (1.05-2.42)
1
1.33 (0.85-2.08) *Job dissatisfaction
No Yes
103 (54.5) 86 (45.5)
1
1.70 (1.15-2.51)
1
1.49 (0.98-2.28) aAdjusted for occupational group, age group and sex; occupational group, age group and sex were mutually adjusted.
bAdjusted for all the risk factors in the table.
*Explanatory variables associated with shoulder pain in partial and/or full models.
variables which were positively associated with shoulder pain in the partial models
were age group (40-49 years), sex (women), past injuries, somatising tendency ( two
or more symptoms), frightening situation, mental health status (poor), job insecurity
and job dissatisfaction.
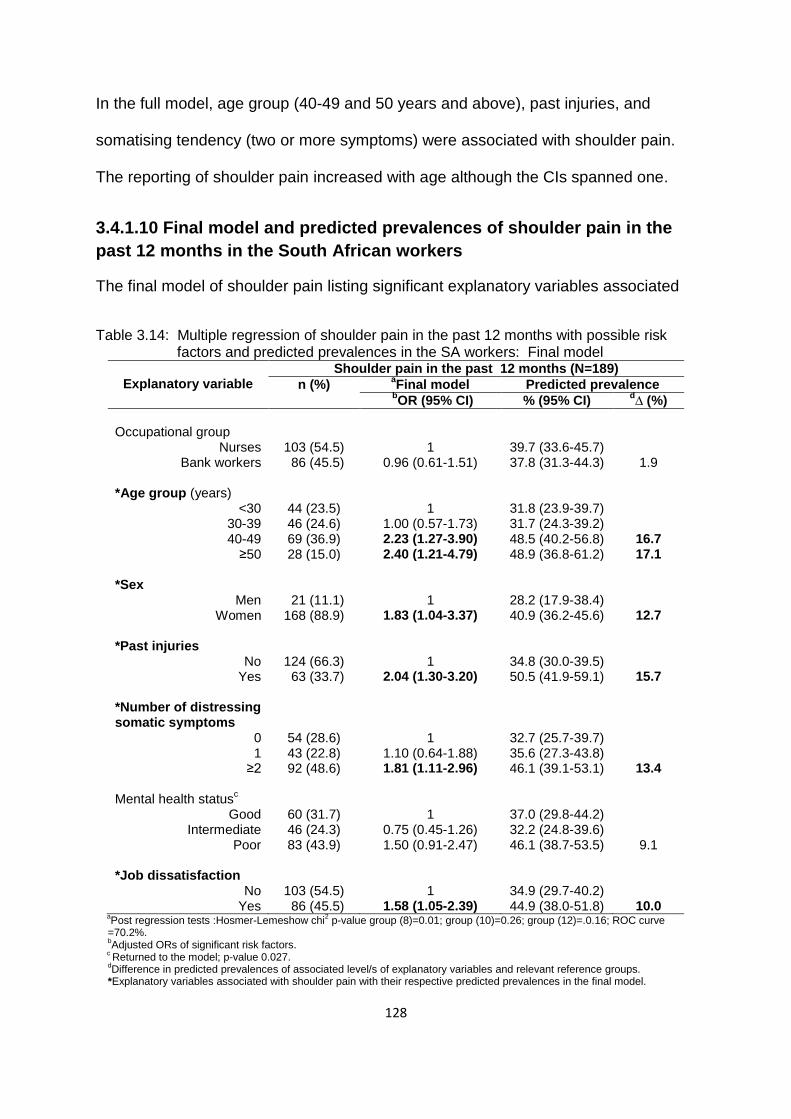
128
In the full model, age group (40-49 and 50 years and above), past injuries, and
somatising tendency (two or more symptoms) were associated with shoulder pain.
The reporting of shoulder pain increased with age although the CIs spanned one.
3.4.1.10 Final model and predicted prevalences of shoulder pain in the
past 12 months in the South African workers
The final model of shoulder pain listing significant explanatory variables associated
Table 3.14: Multiple regression of shoulder pain in the past 12 months with possible risk factors and predicted prevalences in the SA workers: Final model
Explanatory variable
Shoulder pain in the past 12 months (N=189)
n (%) aFinal model Predicted prevalence
bOR (95% CI) % (95% CI)
d∆ (%)
Occupational group
Nurses Bank workers
103 (54.5) 86 (45.5)
1
0.96 (0.61-1.51)
39.7 (33.6-45.7) 37.8 (31.3-44.3)
1.9 *Age group (years)
<30 30-39 40-49
≥50
44 (23.5) 46 (24.6) 69 (36.9) 28 (15.0)
1
1.00 (0.57-1.73) 2.23 (1.27-3.90) 2.40 (1.21-4.79)
31.8 (23.9-39.7) 31.7 (24.3-39.2) 48.5 (40.2-56.8) 48.9 (36.8-61.2)
16.7 17.1
*Sex
Men Women
21 (11.1) 168 (88.9)
1
1.83 (1.04-3.37)
28.2 (17.9-38.4) 40.9 (36.2-45.6)
12.7 *Past injuries
No Yes
124 (66.3) 63 (33.7)
1
2.04 (1.30-3.20)
34.8 (30.0-39.5) 50.5 (41.9-59.1)
15.7 *Number of distressing somatic symptoms
0 1
≥2
54 (28.6) 43 (22.8) 92 (48.6)
1
1.10 (0.64-1.88) 1.81 (1.11-2.96)
32.7 (25.7-39.7) 35.6 (27.3-43.8) 46.1 (39.1-53.1)
13.4 Mental health status
c
Good Intermediate
Poor
60 (31.7) 46 (24.3) 83 (43.9)
1
0.75 (0.45-1.26) 1.50 (0.91-2.47)
37.0 (29.8-44.2) 32.2 (24.8-39.6) 46.1 (38.7-53.5)
9.1 *Job dissatisfaction
No Yes
103 (54.5) 86 (45.5)
1
1.58 (1.05-2.39)
34.9 (29.7-40.2) 44.9 (38.0-51.8)
10.0 a
Post regression tests :Hosmer-Lemeshow chi2 p-value group (8)=0.01; group (10)=0.26; group (12)=.0.16; ROC curve
=70.2%.
bAdjusted ORs of significant risk factors.
c Returned to the model; p-value 0.027.
dDifference in predicted prevalences of associated level/s of explanatory variables and relevant reference groups.
*Explanatory variables associated with shoulder pain with their respective predicted prevalences in the final model.

129
with shoulder pain and predicted prevalences are shown in Table 3.14. Age group
(40-49 and 50 years and above), sex (women), past injuries, somatising tendency
(two or more symptoms) and job dissatisfaction were positively associated with
shoulder pain. However, the variable mental health status was included in the final
model even though it was not statistically significant because the likelihood ratio test
became significant when it was removed from the model.
In the predicted prevalences of shoulder pain, age group (50 years and above) was
the variable estimated to account for the largest increase (17.1%) in the prevalence
of shoulder pain in the SA workers, in contrast with those younger than 30 years.
The 40-49 years age group is estimated to have a similar increase (16.7%). Past
injuries would contribute an increase of 15.7% and the “number of distressing
somatic symptoms”13.4%.
3.4.1.11 Linear trend in the ORs of age group in the final model of
shoulder pain in the past 12 months in South African workers
The test for linear trend in the ORs of age group is presented in Table 3.15. The
inclusion of age group as a categorical factor did not improve the fit of the final model
when the effect of age group was taken as linear. This was demonstrated by the
likelihood ratio test p-value of 0.19. Therefore, the parsimonious model where age
group was taken as linear can be adopted as the model that provides a better fit. It
can be interpreted as: the odds of reporting shoulder pain by the workers increased
by 1.43 times from one age group to the next.

130
Table 3.15: Linear trend in the ORs of age group in the final model of shoulder pain in the South African workers
Explanatory variable
Shoulder pain in the past 12 months (N=189)
n (%) aFinal model
bFinal model
OR (95% CI) OR (95% CI)
Occupational group
Nurses Bank workers
103 (54.5) 86 (45.5)
1
0.96 (0.61-1.51)
1
0.96 (0.61-1.51) *Age group (years)
No Yes
44 (23.5) 143 (76.5)
1
1.43 (1.16-1.77)
1
1.34 (1.06-1.68) Sex
Men Women
21 (11.1) 168 (88.9)
1
1.86 (1.01-3.41)
1
1.83 (0.99-3.37) Past injuries
No Yes
124 (66.3) 63 (33.7)
1
1.98 (1.26-3.09)
1
2.04 (1.30-3.20) Number of distressing somatic symptoms
0 1
≥2
54 (28.6) 43 (22.8) 92 (48.6)
1
1.14 (0.67-1.94) 1.87 (1.15-3.05)
1
1.10 (0.64-1.88) 1.81 (1.11-2.96)
Mental health status
Good Intermediate
Poor
60 (31.7) 46 (24.3) 83 (43.9)
1
0.74 (0.44-1.24) 1.51 (0.92-2.47)
1
0.75 (0.45-1.26) 1.50 (0.91-2.47)
Job dissatisfaction
No Yes
103 (54.5) 86 (45.5)
1
1.61 (1.07-2.43)
1
1.58 (1.05-2.39) a
Effect of age group taken as linear in the model.
bAge group entered in the model as a categorical factor.
*Explanatory variable showing results of linear trend when entered as linear and categorical in the shoulder pain final model.
3.4.1.11 Partial and full models of elbow pain in the past 12 months in
the South African workers
The partial and full models of elbow pain with explanatory variables indicating
associations with elbow pain appear in Table 3.16. In the partial model, the
variables that were associated with elbow pain were sex (women), financial
difficulties, somatising tendency (two or more symptoms), frightening situation,
mental health status (poor) and repeated bending of the elbow for more than one
hour. In the full model, sex (women), somatising tendency (two or more symptoms),

131
mental health status (poor) and repeated elbow bending for more than an hour were
still associated with elbow pain.
Table 3.16: Multiple regression of elbow pain in the past 12 months with possible risk factors in the SA workers: Partial and full models
Explanatory variable
Elbow pain in past 12 months (N=70)
n (%)
Partial model Full model aOR (95% CI)
bOR (95% CI)
Occupational group
Nurses Bank workers
33 (47.1) 37 (52.9)
1
1.55 (0.89-2.70)
1
1.04 (0.49-2.19) Age group (years)
<30 30-39 40-49
≥50
22 (31.9) 15 (21.7) 22 (31.9) 10 (14.5)
1
0.60 (0.29-1.24) 0.92 (0.46-1.83) 1.03 (0.43-2.42)
1
0.50 (0.21-1.18) 0.66 (0.28-1.53) 1.13 (0.41-3.09)
*Sex
Men Women
6 (8.6) 64 (91.4)
1
3.10 (1.23-7.84)
1
2.81 (1.01-7.80) BMI group
Normal Overweight
Obese Missing
20 (28.6) 27 (38.6) 16 (22.9) 7 (10.0)
1
1.99 (1.00-3.95) 1.13 (0.53-2.43) 2.56 (0.90-7.22)
1
1.90 (0.89-4.08) 1.20 (0.51-2.83) 2.13 (0.66-6.88)
Ethnic group
Sotho Nguni Other
23 (32.9) 25 (35.7) 22 (31.4)
1
1.68 (0.90-3.12) 1.31 (0.64-2.68)
1
1.94 (0.97-3.86) 1.62 (0.73-3.58)
Past injuries
No Yes
45 (66.2) 23 (33.8)
1
1.62 (0.91-2.86)
1
1.57 (0.83-2.97) *Financial difficulties
No Yes
12 (17.1) 58 (82.9)
1
2.10 (1.08-4.08)
1
1.80 (0.88-3.68) *Number of distressing somatic symptoms
0 1
≥2
12 (17.1) 14 (20.0) 44 (62.9)
1
1.29 (0.77-2.15) 2.22 (1.41-3.50)
1
1.46 (0.62-3.45) 2.63 (1.23-5.58)
aAdjusted for occupational group, age group and sex; occupational group, age group and sex were mutually adjusted.
bAdjusted for all the risk factors in the table.
*Explanatory variables associated with elbow pain in partial and/ or full models.
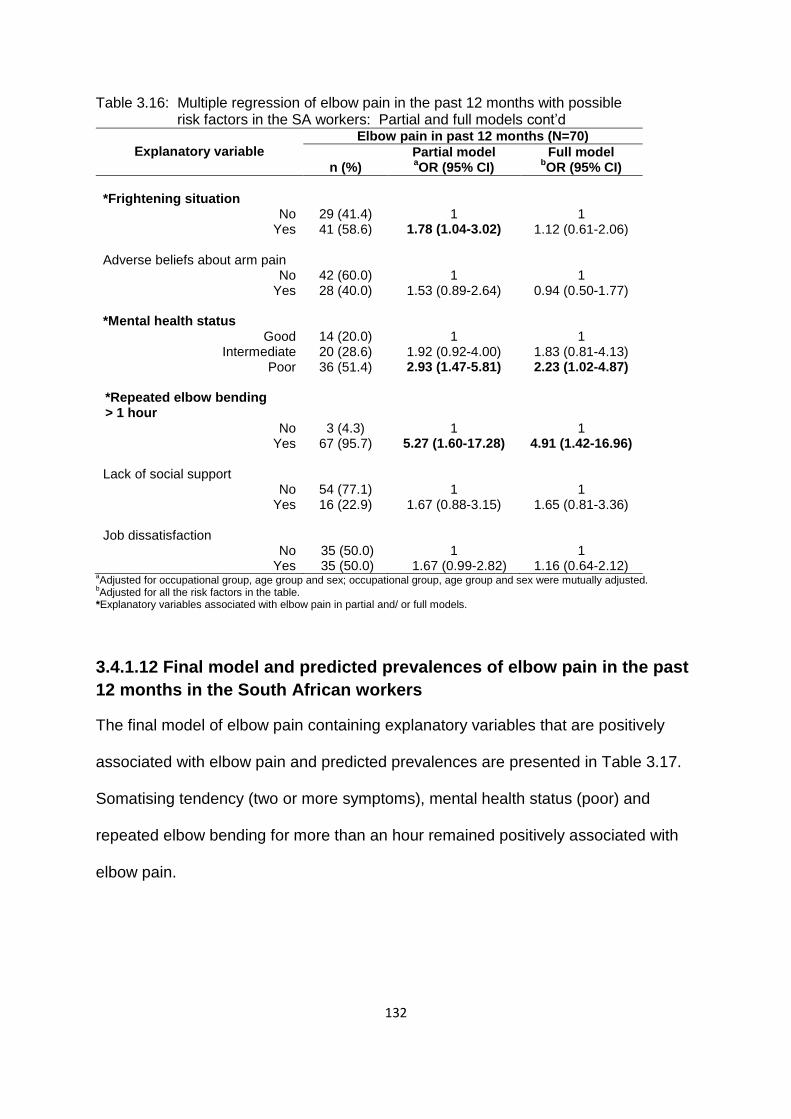
132
Table 3.16: Multiple regression of elbow pain in the past 12 months with possible risk factors in the SA workers: Partial and full models cont’d
Explanatory variable
Elbow pain in past 12 months (N=70)
n (%)
Partial model Full model aOR (95% CI)
bOR (95% CI)
*Frightening situation
No Yes
29 (41.4) 41 (58.6)
1
1.78 (1.04-3.02)
1
1.12 (0.61-2.06) Adverse beliefs about arm pain
No Yes
42 (60.0) 28 (40.0)
1
1.53 (0.89-2.64)
1
0.94 (0.50-1.77)
*Mental health status Good
Intermediate Poor
14 (20.0) 20 (28.6) 36 (51.4)
1
1.92 (0.92-4.00) 2.93 (1.47-5.81)
1
1.83 (0.81-4.13) 2.23 (1.02-4.87)
*Repeated elbow bending > 1 hour
No Yes
3 (4.3) 67 (95.7)
1
5.27 (1.60-17.28)
1
4.91 (1.42-16.96) Lack of social support
No Yes
54 (77.1) 16 (22.9)
1
1.67 (0.88-3.15)
1
1.65 (0.81-3.36) Job dissatisfaction
No Yes
35 (50.0) 35 (50.0)
1
1.67 (0.99-2.82)
1
1.16 (0.64-2.12) aAdjusted for occupational group, age group and sex; occupational group, age group and sex were mutually adjusted.
bAdjusted for all the risk factors in the table.
*Explanatory variables associated with elbow pain in partial and/ or full models.
3.4.1.12 Final model and predicted prevalences of elbow pain in the past
12 months in the South African workers
The final model of elbow pain containing explanatory variables that are positively
associated with elbow pain and predicted prevalences are presented in Table 3.17.
Somatising tendency (two or more symptoms), mental health status (poor) and
repeated elbow bending for more than an hour remained positively associated with
elbow pain.
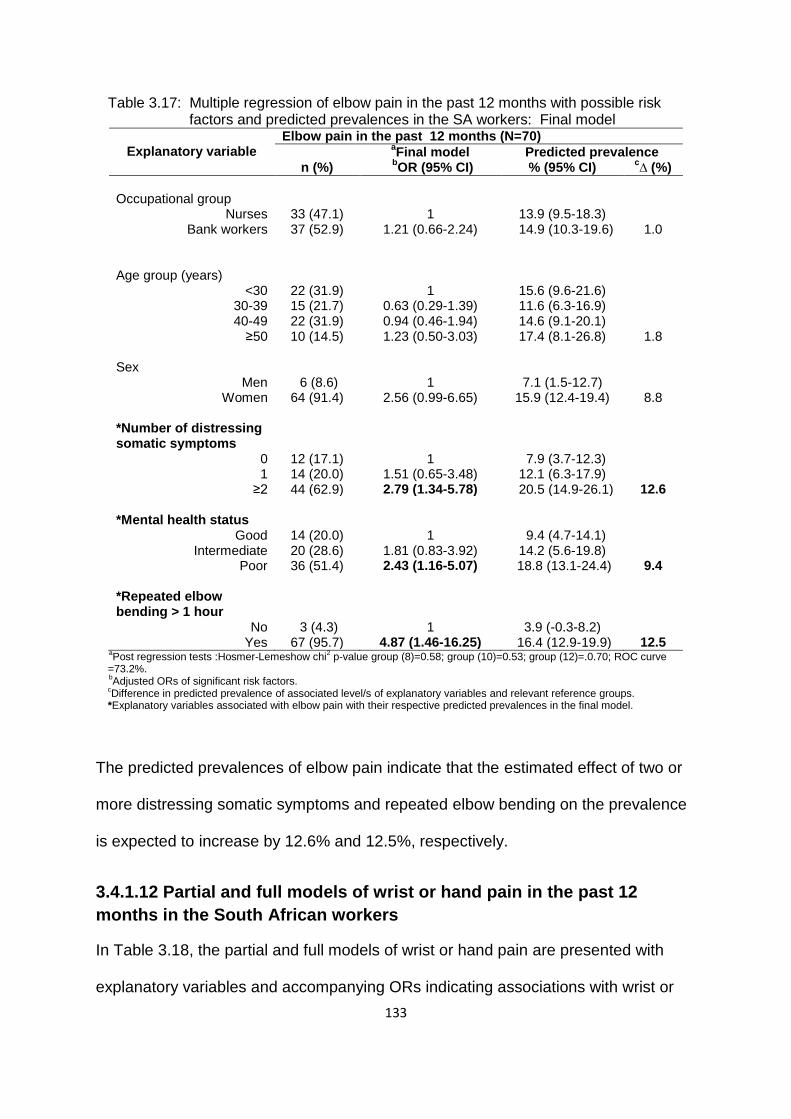
133
Table 3.17: Multiple regression of elbow pain in the past 12 months with possible risk factors and predicted prevalences in the SA workers: Final model
Explanatory variable
Elbow pain in the past 12 months (N=70)
n (%)
aFinal model Predicted prevalence
bOR (95% CI) % (95% CI)
c∆ (%)
Occupational group
Nurses Bank workers
33 (47.1) 37 (52.9)
1
1.21 (0.66-2.24)
13.9 (9.5-18.3) 14.9 (10.3-19.6)
1.0
Age group (years)
<30 30-39 40-49
≥50
22 (31.9) 15 (21.7) 22 (31.9) 10 (14.5)
1
0.63 (0.29-1.39) 0.94 (0.46-1.94) 1.23 (0.50-3.03)
15.6 (9.6-21.6) 11.6 (6.3-16.9) 14.6 (9.1-20.1) 17.4 (8.1-26.8)
1.8 Sex
Men Women
6 (8.6) 64 (91.4)
1
2.56 (0.99-6.65)
7.1 (1.5-12.7) 15.9 (12.4-19.4)
8.8 *Number of distressing somatic symptoms
0 1
≥2
12 (17.1) 14 (20.0) 44 (62.9)
1
1.51 (0.65-3.48) 2.79 (1.34-5.78)
7.9 (3.7-12.3) 12.1 (6.3-17.9)
20.5 (14.9-26.1)
12.6 *Mental health status
Good Intermediate
Poor
14 (20.0) 20 (28.6) 36 (51.4)
1
1.81 (0.83-3.92) 2.43 (1.16-5.07)
9.4 (4.7-14.1) 14.2 (5.6-19.8)
18.8 (13.1-24.4)
9.4 *Repeated elbow bending > 1 hour
No Yes
3 (4.3) 67 (95.7)
1
4.87 (1.46-16.25)
3.9 (-0.3-8.2) 16.4 (12.9-19.9)
12.5 a
Post regression tests :Hosmer-Lemeshow chi2 p-value group (8)=0.58; group (10)=0.53; group (12)=.0.70; ROC curve
=73.2%. b
Adjusted ORs of significant risk factors.
cDifference in predicted prevalence of associated level/s of explanatory variables and relevant reference groups.
*Explanatory variables associated with elbow pain with their respective predicted prevalences in the final model.
The predicted prevalences of elbow pain indicate that the estimated effect of two or
more distressing somatic symptoms and repeated elbow bending on the prevalence
is expected to increase by 12.6% and 12.5%, respectively.
3.4.1.12 Partial and full models of wrist or hand pain in the past 12
months in the South African workers
In Table 3.18, the partial and full models of wrist or hand pain are presented with
explanatory variables and accompanying ORs indicating associations with wrist or

134
Table 3.18: Multiple regression of wrist or hand pain in the past 12 months with possible risk factors in the SA workers: Partial and full models
Explanatory variable
n (%)
Wrist or hand pain in past 12 months (N=120)
Partial model Full model aOR (95% CI)
bOR (95% CI)
*Occupational group
Nurses Bank workers
56 (46.7) 64 (53.3)
1
1.61 (1.01-2.56)
1
0.96 (0.53-1.73) Age group (years)
<30 30-39 40-49
≥50
32 (27.6) 27 (23.3) 42 (36.2) 15 (12.9)
1
0.79 (0.43-1.43) 1.46 (0.82-2.60) 1.16 (0.55-2.45)
1
0.91 (0.47-1.74) 1.48 (0.75-2.90) 1.59 (0.68-3.71)
*Sex
Men Women
13 (10.8) 107 (89.2)
1
2.17 (1.09-4.30)
1
2.27 (1.07-4.81) *Ethnic group
Sotho Nguni Other
35 (29.2) 41 (34.2) 44 (36.7)
1
1.87 (1.11-3.15) 1.97 (1.09-3.54)
1
1.92 (1.11-3.33) 2.21 (1.18-4.13)
*Number of distressing somatic symptoms
0 1
≥2
27 (22.5) 25 (20.8) 68 (56.7)
1
1.46 (0.79-2.71) 2.84 (1.67-4.82)
1
1.50 (0.93-2.41) 2.95 (1.66-5.26)
*Frightening situation
No Yes
54 (45.4) 65 (54.6)
1
1.56 (1.01-2.41)
1
1.50 (0.93-2.41) Mental health status
Good Intermediate
Poor
37 (30.8) 30 (25.0) 53 (44.2)
1
1.04 (0.60-1.81) 1.54 (0.92-2.59)
1
0.78 (0.42-1.45) 1.16 (0.66-2.07)
Lack of social support
No Yes
95 (79.8) 24 (20.2)
1
1.43 (0.82-2.48)
1
1.33 (0.73-2.36) Job dissatisfaction
No Yes
66 (55.5) 53 (44.5)
1
1.43 (0.92-2.21)
1
1.30 (0.81-2.08) a
Adjusted for occupational group, age group and sex; occupational group, age group and sex were mutually adjusted. b
Adjusted for all the risk factors in the table. *Explanatory variables associated with wrist or hand pain in partial and/ or full models.
hand pain. In the partial models, variables that were associated with wrist or hand
pain were occupational group (bank workers), sex (women), ethnic group (Nguni and
other), somatising tendency (two or more symptoms) and frightening situation.

135
In the full model, sex (women), ethnic group (Nguni and other) and somatising
tendency (two or more symptoms) were variables associated with wrist or hand pain.
An increasing pattern was observed between age group and reports of wrist or hand
pain although the 95% CIs included one.
3.4.1.13 Final model and predicted prevalences of wrist or hand pain in
the past 12 months in the South African workers
The final model of wrist or hand pain and predicted prevalences are shown in Table
3.19. It portrays the explanatory variables with ORs demonstrating positive
Table 3.19: Multiple regression of wrist or hand pain in the past 12 months with possible risk factors and predicted prevalences in the SA workers: Final model
Explanatory variable
Wrist/hand pain in the past 12 months (N=120)
n (%)
aFinal model Predicted prevalence
bOR (95% CI) % (95% CI)
c∆ (%)
Occupational group
Nurses Bank workers
56 (46.7) 64 (53.3)
1
1.06 (0.61-1.86)
23.8 (17.9-29.6) 24.6 (18.6-30.6)
0.8 Age group (years)
<30 30-39 40-49
≥50
32 (27.6) 27 (23.3) 42 (36.2) 15 (12.9)
1
0.74 (0.39-1.39) 1.20 (0.65-2.22) 1.18 (0.54-2.57)
23.5 (16.2-30.7) 19.6 (13.1-25.9) 28.5 (21.7-35.8) 26.1 (15.1-37.0)
2.6 *Sex
Men Women
13 (10.8) 107 (89.2)
1
2.28 (1.09-4.74
15.3 (7.3-23.4) 26.1 (21.8-30.3)
10.8 *Ethnic group
Sotho Nguni Other
35 (29.2) 41 (34.2) 44 (36.7)
1
1.85 (1.08-3.18) 2.02 (1.09-3.72)
17.5 (12.2-22.7) 27.8 (20.7-34.8) 30.5 (22.0-39.1)
10.3 13.0
*Number of distressing somatic symptoms
0 1
≥2
27 (22.5) 25 (20.8) 68 (56.7)
1
1.59 (0.84-3.00) 3.07 (1.76-5.35)
15.3 (9.9-20.7) 21.2 (13.9-28.5) 33.8 (27.1-40.5)
18.5 a
Post regression tests :Hosmer-Lemeshow chi2 p-value group (8)=0.23; group (10)=0.59; group (12)=0.50; ROC curve
=68.6%. b
Adjusted ORs of significant risk factors.
cDifference in predicted prevalences of associated level/s of explanatory variables and relevant reference groups.
*Explanatory variables associated with wrist or hand pain with respective predicted prevalences in the final model.
associations with wrist or hand pain. These variables included sex (women), ethnic

136
group (Nguni and other) and somatising tendency (two or more symptoms).
The predicted prevalences of wrist or hand pain show that somatising tendency (two
or more symptoms) is estimated to contribute the largest increase (18.5%) in the
prevalence of wrist or hand pain.
3.4.1.14 Partial and full models of upper limb pain in the past 12 months
in the South African workers
The partial and full models of upper limb pain appear in Table 3.20. The models
present explanatory variables that are associated with upper limb pain.
Table 3.20: Multiple regression of upper limb pain in the past 12 months with possible risk factors in the SA workers: Partial and full models
Explanatory variable
n (%)
Upper limb pain in past 12 months (N=260)
Partial model Full model aOR (95% CI)
bOR (95% CI)
Occupational group
Nurses Bank workers
136 (52.3) 124 (47.7)
1
1.26 (0.83-1.90)
1
0.73 (0.42-1.26) Age group (years)
<30 30-39 40-49
≥50
72 (28.1) 64 (25.0) 86 (33.6) 34 (13.3)
1
0.70 (0.43-1.14) 1.33 (0.79-2.23) 1.12 (0.58-2.13)
1
0.66 (0.38-1.14) 1.36 (0.76-2.42) 1.41 (0.68-2.92)
*Sex
Men Women
30 (11.5) 230 (88.5)
1
2.49 (1.44-4.29)
1
2.39 (1.30-4.37) *Past Injuries
No Yes
177 (68.6) 81 (31.4)
1
1.97 (1.27-3.07)
1
1.73 (1.07-2.80) *Ethnic group
Sotho Nguni Other
100 (38.5) 79 (30.4) 81 (31.2)
1
1.24 (0.80-1.92) 1.58 (0.95-2.63)
1
1.19 (0.73-1.93) 1.87 (1.05-3.34)
aAdjusted for occupational group, age group and sex; occupational group, age group and sex were mutually adjusted.
bAdjusted for all the risk factors in the table.
*Explanatory variables associated with upper limb pain in partial and/ or full models.
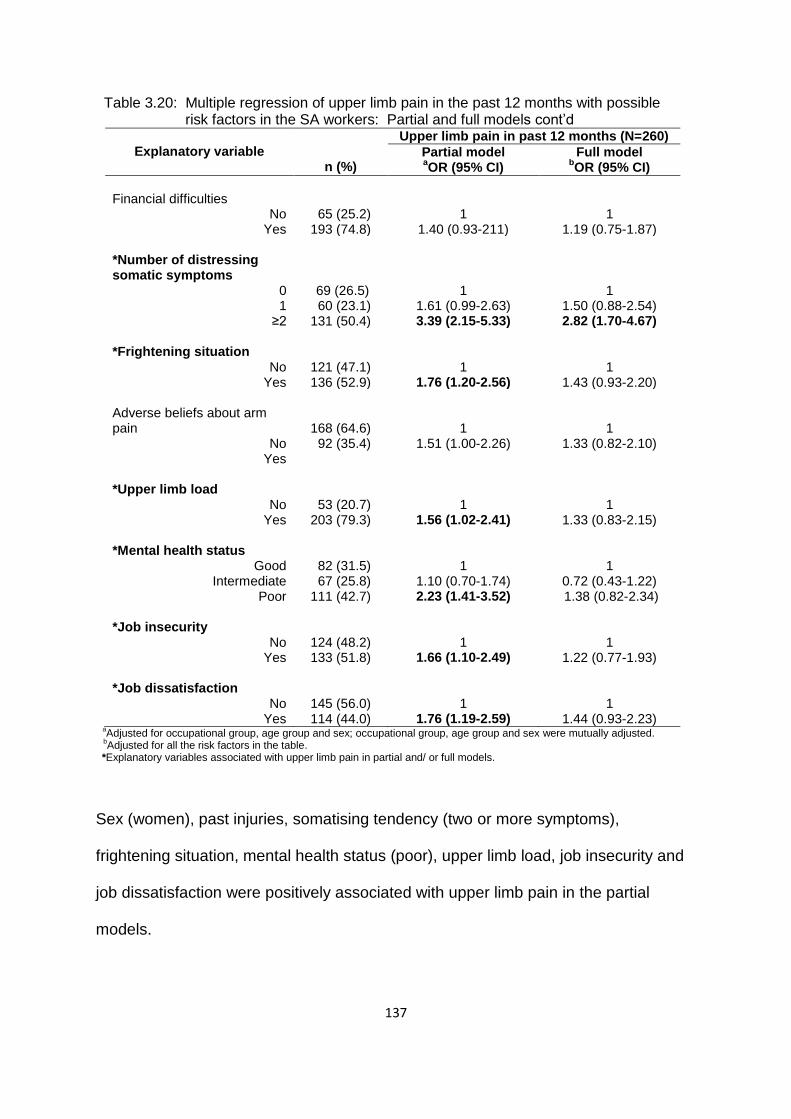
137
Table 3.20: Multiple regression of upper limb pain in the past 12 months with possible risk factors in the SA workers: Partial and full models cont’d
Explanatory variable
n (%)
Upper limb pain in past 12 months (N=260)
Partial model Full model aOR (95% CI)
bOR (95% CI)
Financial difficulties
No Yes
65 (25.2) 193 (74.8)
1
1.40 (0.93-211)
1
1.19 (0.75-1.87) *Number of distressing somatic symptoms
0 1
≥2
69 (26.5) 60 (23.1) 131 (50.4)
1
1.61 (0.99-2.63) 3.39 (2.15-5.33)
1
1.50 (0.88-2.54) 2.82 (1.70-4.67)
*Frightening situation
No Yes
121 (47.1) 136 (52.9)
1
1.76 (1.20-2.56)
1
1.43 (0.93-2.20) Adverse beliefs about arm pain
No Yes
168 (64.6) 92 (35.4)
1
1.51 (1.00-2.26)
1
1.33 (0.82-2.10)
*Upper limb load
No Yes
53 (20.7) 203 (79.3)
1
1.56 (1.02-2.41)
1
1.33 (0.83-2.15) *Mental health status
Good Intermediate
Poor
82 (31.5) 67 (25.8) 111 (42.7)
1
1.10 (0.70-1.74) 2.23 (1.41-3.52)
1
0.72 (0.43-1.22) 1.38 (0.82-2.34)
*Job insecurity
No Yes
124 (48.2) 133 (51.8)
1
1.66 (1.10-2.49)
1
1.22 (0.77-1.93) *Job dissatisfaction
No Yes
145 (56.0) 114 (44.0)
1
1.76 (1.19-2.59)
1
1.44 (0.93-2.23) a
Adjusted for occupational group, age group and sex; occupational group, age group and sex were mutually adjusted. b
Adjusted for all the risk factors in the table. *Explanatory variables associated with upper limb pain in partial and/ or full models.
Sex (women), past injuries, somatising tendency (two or more symptoms),
frightening situation, mental health status (poor), upper limb load, job insecurity and
job dissatisfaction were positively associated with upper limb pain in the partial
models.
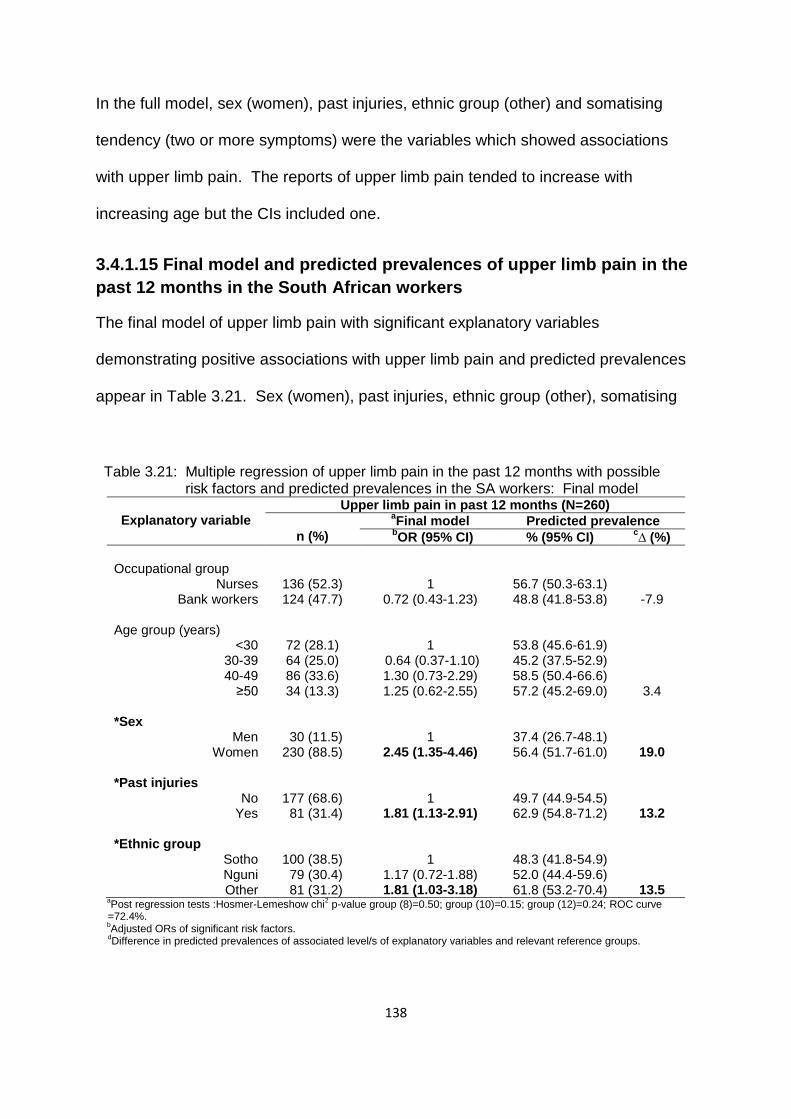
138
In the full model, sex (women), past injuries, ethnic group (other) and somatising
tendency (two or more symptoms) were the variables which showed associations
with upper limb pain. The reports of upper limb pain tended to increase with
increasing age but the CIs included one.
3.4.1.15 Final model and predicted prevalences of upper limb pain in the
past 12 months in the South African workers
The final model of upper limb pain with significant explanatory variables
demonstrating positive associations with upper limb pain and predicted prevalences
appear in Table 3.21. Sex (women), past injuries, ethnic group (other), somatising
Table 3.21: Multiple regression of upper limb pain in the past 12 months with possible risk factors and predicted prevalences in the SA workers: Final model
Explanatory variable
Upper limb pain in past 12 months (N=260)
n (%)
aFinal model Predicted prevalence
bOR (95% CI) % (95% CI)
c∆ (%)
Occupational group
Nurses Bank workers
136 (52.3) 124 (47.7)
1
0.72 (0.43-1.23)
56.7 (50.3-63.1) 48.8 (41.8-53.8)
-7.9 Age group (years)
<30 30-39 40-49
≥50
72 (28.1) 64 (25.0) 86 (33.6) 34 (13.3)
1
0.64 (0.37-1.10) 1.30 (0.73-2.29) 1.25 (0.62-2.55)
53.8 (45.6-61.9) 45.2 (37.5-52.9) 58.5 (50.4-66.6) 57.2 (45.2-69.0)
3.4 *Sex
Men Women
30 (11.5) 230 (88.5)
1
2.45 (1.35-4.46)
37.4 (26.7-48.1) 56.4 (51.7-61.0)
19.0 *Past injuries
No Yes
177 (68.6) 81 (31.4)
1
1.81 (1.13-2.91)
49.7 (44.9-54.5) 62.9 (54.8-71.2)
13.2 *Ethnic group
Sotho Nguni Other
100 (38.5) 79 (30.4) 81 (31.2)
1
1.17 (0.72-1.88) 1.81 (1.03-3.18)
48.3 (41.8-54.9) 52.0 (44.4-59.6) 61.8 (53.2-70.4)
13.5 a
Post regression tests :Hosmer-Lemeshow chi2 p-value group (8)=0.50; group (10)=0.15; group (12)=0.24; ROC curve
=72.4%. b
Adjusted ORs of significant risk factors.
dDifference in predicted prevalences of associated level/s of explanatory variables and relevant reference groups.

139
Table 3.21: Multiple regression of upper limb pain in the past 12 months with possible risk factors and predicted prevalences in the SA workers: Final model cont’d
Explanatory variable
Upper limb pain in past 12 months (N=260)
n (%)
aFinal model Predicted prevalence
bOR (95% CI) % (95% CI)
c∆ (%)
Mental health status
d
Good Intermediate
Poor
82 (31.5) 67 (25.8) 111 (42.7)
1
0.76 (0.46-1.27) 1.59 (0.96-2.63)
50.6 (43.4-57.9) 46.5 (38.8-54.3) 61.2 (53.9-68.4)
10.6 Number of distressing somatic symptoms
0 1
≥2
69 (26.5) 60 (23.1) 131 (50.4)
1
1.58 (0.94-2.67) 3.12 (1.90-5.11)
40.9 (33.7-48.2) 50.6 (41.9-59.3) 65.8 (59.1-72.5)
24.9 Job dissatisfaction
No Yes
145 (56.0) 114 (44.0)
1
1.58 (1.03-2.41)
48.9 (43.6-54.3) 59.7 (52.9-66.4)
10.8 aPost regression tests :Hosmer-Lemeshow chi
2 p-value group (8)=0.50; group (10)=0.15; group (12)=0.24; ROC curve
=72.4%. bAdjusted ORs of significant risk factors.
cDifference in predicted prevalences of associated level/s of explanatory variables and relevant reference groups.
dReturned to the model; p-value 0.031.
*Explanatory variables associated with upper limb pain with their respective predicted prevalences in the final model.
tendency ( two or more symptoms) and job dissatisfaction increased the odds of
reporting upper limb pain by the workers. The variable mental health status was
kept in the final model even though it was not statistically significant because the
likelihood ratio test became significant when it was removed from the model.
Regarding the predicted prevalences of upper limb pain, somatising tendency was
the variable that would have the largest increase (24.9%) in the prevalence of upper
limb pain in SA workers reporting two or more symptoms versus those not reporting
symptoms. Sex (women) is estimated to increase the prevalence by 19.0%. Ethnic
group (other) and past injuries had similar effects at 13.5% and 13.2%, respectively.
3.4.1.16 Partial and full models of knee pain in the past 12 months in the
South African workers
The partial and full models of knee pain are presented in Table 3.22. They contain
explanatory variables with corresponding ORs representing associations with knee
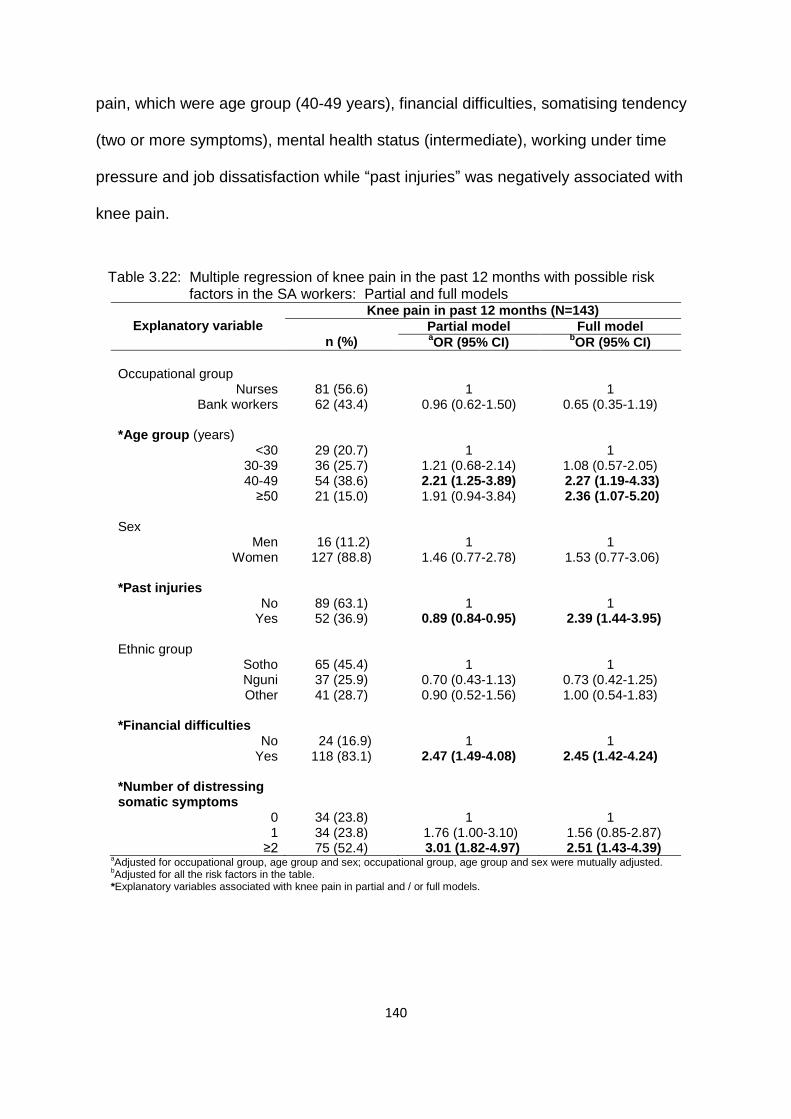
140
pain, which were age group (40-49 years), financial difficulties, somatising tendency
(two or more symptoms), mental health status (intermediate), working under time
pressure and job dissatisfaction while “past injuries” was negatively associated with
knee pain.
Table 3.22: Multiple regression of knee pain in the past 12 months with possible risk factors in the SA workers: Partial and full models
Explanatory variable
Knee pain in past 12 months (N=143)
n (%)
Partial model Full model aOR (95% CI)
bOR (95% CI)
Occupational group
Nurses Bank workers
81 (56.6) 62 (43.4)
1
0.96 (0.62-1.50)
1
0.65 (0.35-1.19) *Age group (years)
<30 30-39 40-49
≥50
29 (20.7) 36 (25.7) 54 (38.6) 21 (15.0)
1
1.21 (0.68-2.14) 2.21 (1.25-3.89) 1.91 (0.94-3.84)
1
1.08 (0.57-2.05) 2.27 (1.19-4.33) 2.36 (1.07-5.20)
Sex
Men Women
16 (11.2) 127 (88.8)
1
1.46 (0.77-2.78)
1
1.53 (0.77-3.06) *Past injuries
No Yes
89 (63.1) 52 (36.9)
1
0.89 (0.84-0.95)
1
2.39 (1.44-3.95) Ethnic group
Sotho Nguni Other
65 (45.4) 37 (25.9) 41 (28.7)
1
0.70 (0.43-1.13) 0.90 (0.52-1.56)
1
0.73 (0.42-1.25) 1.00 (0.54-1.83)
*Financial difficulties
No Yes
24 (16.9) 118 (83.1)
1
2.47 (1.49-4.08)
1
2.45 (1.42-4.24) *Number of distressing somatic symptoms
0 1
≥2
34 (23.8) 34 (23.8) 75 (52.4)
1
1.76 (1.00-3.10) 3.01 (1.82-4.97)
1
1.56 (0.85-2.87) 2.51 (1.43-4.39)
aAdjusted for occupational group, age group and sex; occupational group, age group and sex were mutually adjusted.
bAdjusted for all the risk factors in the table.
*Explanatory variables associated with knee pain in partial and / or full models.

141
Table 3.22: Multiple regression of knee pain in the past 12 months with possible risk factors in the SA workers: Partial and full models cont’d
Explanatory variable
Knee pain in past 12 months (N=143)
n (%)
Partial model Full model aOR (95% CI)
bOR (95% CI)
Frightening situation
No Yes
69 (48.6) 73 (51.4)
1
1.45 (0.96-2.19)
1
1.07 (0.67-1.71) *Mental health status
Good Intermediate
Poor
44 (30.8) 50 (34.9) 49 (34.3)
1
1.82 (1.10-3.01) 1.31(0.79-2.17)
1
1.31 (0.74-2.32) 0.77 (0.42-1.39)
Kneeling or squatting
No Yes
116 (81.1) 27 (18.9)
1
1.51 (0.83-2.73)
1
1.15 (0.58-2.25) *Working under time pressure
No Yes
8 (5.6) 135 (94.4)
1
3.64 (1.64-8.06)
1
3.88 (1.59-9.47) *Job dissatisfaction
No Yes
70 (49.0) 73 (51.0)
1
2.31 (1.52-3.50)
1
2.23 (1.41-3.53) a
Adjusted for occupational group, age group and sex; occupational group, age group and sex were mutually adjusted. b
Adjusted for all the risk factors in the table. *Explanatory variables associated with knee pain in partial and / or full models.
In the full model, age group (40-49 and 50 years and above), past injuries, financial
difficulties, somatising tendency (two or more symptoms), working under time
pressure and job dissatisfaction were variables positively associated with knee pain.
It was observed that the reports of knee pain increased with increasing age group
although the CIs included one.
3.4.1.17 Final model and predicted prevalences of knee pain in the past
12 months in the South African workers
The final model of knee pain and predicted prevalences are portrayed in Table 3.23.
It shows significant explanatory variables with positive associations with knee pain.
The variables that showed positive associations with knee pain were age group (40-
49 and 50 years and above), past injuries, financial difficulties, somatising tendency

142
(two or more symptoms), working under time pressure and job dissatisfaction. The
reports of knee pain increased with increasing age group.
Table 3.23: Multiple regression of knee pain in the past 12 months with possible risk factor and predicted prevalences in the SA workers: Final model
Explanatory variable
Knee pain in the past 12 months (N=143)
n (%)
aFinal model Predicted prevalence
bOR (95% CI) % (95% CI)
c∆ (%)
Occupational group
Nurses Bank workers
81 (56.6) 62 (43.4)
1
0.61 (0.37-1.01)
32.8 (26.9-38.7) 25.0 (19.6-30.5)
-7.8 *Age group (years)
<30 30-39 40-49
≥50
29 (20.7) 36 (25.7) 54 (38.6) 21 (15.0)
1
1.11 (0.59-2.08) 2.18 (1.16-4.09) 2.50 (1.16-5.38
22.0 (15.1-28.9) 24.2 (17.5-30.9) 36.0 (28.4-43.7) 38.9 (27.3-50.6)
14.0 16.9
Sex
Men Women
16 (11.2) 127 (88.8)
1
1.54 (0.78-3.04)
23.2 (13.7-32.7) 30.1 (25.9-34.4)
6.9 *Past injuries
No Yes
89 (63.1) 52 (36.9)
1
2.39 (1.47-3.89)
24.8 (20.6-29.0) 40.8 (32.9-48.8)
16.0 *Number of distressing somatic symptoms
0 1
≥2
34 (23.8) 34 (23.8) 75 (52.4)
1
1.56 (0.85-2.85) 2.42 (1.41-4.14)
21.0 (14.9-27.1) 28.2 (20.6-35.8) 35.8 (29.4-42.1)
14.8 *Financial difficulties
No Yes
24 (16.9) 118 (83.1)
1
2.44 (1.43-4.18)
18.4 (12.2-24.9) 33.0 (28.4-37.7)
14.6 *Working under time pressure
No Yes
8 (5.6) 135 (94.4)
1
3.93 (1.64-9.44)
12.0 (3.9-20.1) 31.4 (27.2-
35.5)
19.4
*Job dissatisfaction
No Yes
70 (49.0) 73 (51.0)
1
2.14 (1.37-3.35)
23.6 (19.0-28.2) 37.4 (30.9-43.9)
13.8 a
Post regression tests :Hosmer-Lemeshow chi2 p-value group (8)=0.47; group (10)=0.11; group (12)=0.16; ROC curve
=75.1%. b
Adjusted ORs of significant risk factors.
cDifference in predicted prevalences of associated level/s of explanatory variables and relevant reference groups.
*Explanatory variables associated with knee pain with their respective predicted prevalences in the final model.
The predicted prevalences of knee pain show that working under time pressure
would have the largest increase (19.4%) in the prevalence of knee pain in SA
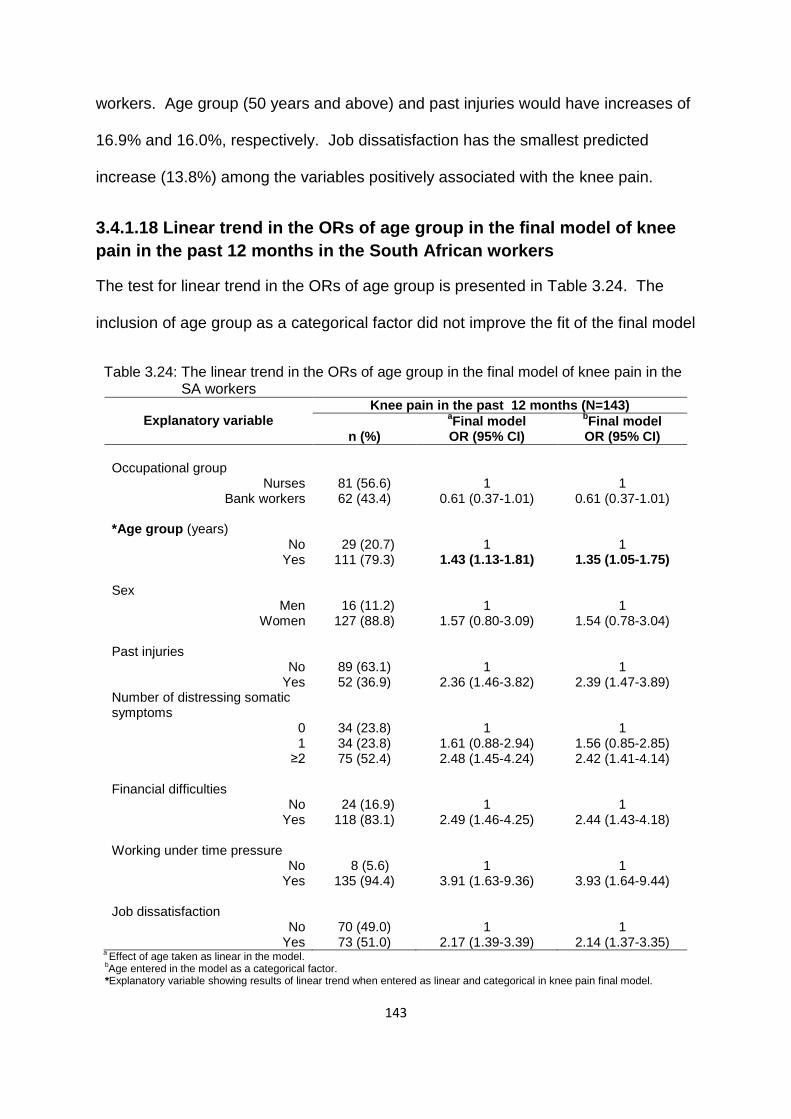
143
workers. Age group (50 years and above) and past injuries would have increases of
16.9% and 16.0%, respectively. Job dissatisfaction has the smallest predicted
increase (13.8%) among the variables positively associated with the knee pain.
3.4.1.18 Linear trend in the ORs of age group in the final model of knee
pain in the past 12 months in the South African workers
The test for linear trend in the ORs of age group is presented in Table 3.24. The
inclusion of age group as a categorical factor did not improve the fit of the final model
Table 3.24: The linear trend in the ORs of age group in the final model of knee pain in the SA workers
Explanatory variable
Knee pain in the past 12 months (N=143)
n (%)
aFinal model
bFinal model
OR (95% CI) OR (95% CI)
Occupational group
Nurses Bank workers
81 (56.6) 62 (43.4)
1
0.61 (0.37-1.01)
1
0.61 (0.37-1.01) *Age group (years)
No Yes
29 (20.7) 111 (79.3)
1
1.43 (1.13-1.81)
1
1.35 (1.05-1.75) Sex
Men Women
16 (11.2) 127 (88.8)
1
1.57 (0.80-3.09)
1
1.54 (0.78-3.04) Past injuries
No Yes
89 (63.1) 52 (36.9)
1
2.36 (1.46-3.82)
1
2.39 (1.47-3.89) Number of distressing somatic symptoms
0 1
≥2
34 (23.8) 34 (23.8) 75 (52.4)
1
1.61 (0.88-2.94) 2.48 (1.45-4.24)
1
1.56 (0.85-2.85) 2.42 (1.41-4.14)
Financial difficulties
No Yes
24 (16.9) 118 (83.1)
1
2.49 (1.46-4.25)
1
2.44 (1.43-4.18) Working under time pressure
No Yes
8 (5.6) 135 (94.4)
1
3.91 (1.63-9.36)
1
3.93 (1.64-9.44) Job dissatisfaction
No Yes
70 (49.0) 73 (51.0)
1
2.17 (1.39-3.39)
1
2.14 (1.37-3.35) a
Effect of age taken as linear in the model.
bAge entered in the model as a categorical factor.
*Explanatory variable showing results of linear trend when entered as linear and categorical in knee pain final model.

144
when the effect of age group was taken as linear. This was demonstrated by the
likelihood ratio test p-value of 0.49. Therefore, the parsimonious model where age
group was linear, can be adopted as the model that provides a better fit. It can be
summarised as: the odds of reporting knee pain by the workers increased by 1.43
times from one age group to the next.
3.4.1.19 Summary of possible risk factors associated with MSD pain in
the past 12 months in South African workers
The risk factors for MSD pain from the final models of all the pain sites used in the
multiple regression analysis are presented in Table 3.25.
Somatising tendency was the most consistent risk factor, followed by past
injuries and job dissatisfaction.
“Any” and neck pain were associated with most risk factors, followed by knee
then low back, shoulder and upper limb pain.
Shoulder and knee pain were associated with age group, and the
relationships showed increasing linear trends.
“Any”, low back and elbow pain increased with age group although the trends
were not significant.
Shoulder, wrist or hand and upper limb pain were associated with sex
(women).
Ethnic group was inconsistently associated with site specific pain.
Bank workers were generally at a lower risk of “any” MSDs than nurses but at
a higher risk of neck pain.
BMI contributed very little in explaining MSDs.
145
Surprisingly, physical workplace activities also contributed little in explaining
MSDs.
In general, the effect of most risk factors was inconsistent across the different
pain sites.

146
Table 3.25: Statistically significant risk factors from final models of MSD pain in the past 12 months in South African workers Risk factor
Pain site **Total
Any Low back Neck Shoulder Elbow Wrist/hand Upper limb Knee
*Number of distressing somatic symptoms
0 1
≥2
√ √
√ √
√
√
√
√
√
√
8
*Past injuries Yes No
√
√
√
√
-
-
√
√
6
*Job dissatisfaction Yes No
√
√
-
√
-
-
√
√
5
*Sex Men
Women
-
-
-
√
-
√
√
-
3
Ethnic group Sotho Nguni Other
-
√
-
-
-
√ √
√
-
3
*Age group (years) <30
30-39 40-49
≥50
↑
↑
-
√ √
↑
-
-
√ √
2
*Occupational group Nurses
Bank workers
-√
-
√
-
-
-
-
-
2
Financial difficulties Yes No
-
-
√
-
-
-
-
√
2
Frightening situation Yes No
√
-
√
-
-
-
-
-
2 *)=Risk factors showing consistent association with pain sites; **Number of pain sites associated with a particular risk factor; √)=Positively associated; -√=Negatively associated; -)=Not associated or not applicable; ↑ )=OR increased with age.

147
Table 3.25: Statistically significant risk factors from final models of MSD pain in the past 12 months in South African workers cont’d
Risk factor Pain site **Total
Any Low back Neck Shoulder Elbow Wrists/hands Upper limb Knee
Working under time pressure Yes No
-
-
√
-
-
-
√
2
BMI group Normal
Overweight Obese
-
√
-
-
-
-
-
-
1
Smoking status Never smoked
Ever smoked
√
-
-
-
-
-
-
-
1
Adverse beliefs about low back and arm pain
Yes No
√
-
-
-
-
-
-
-
1
Lack of social support Yes No
-
-
√
-
-
-
-
-
1
*Repeated elbow bending > 1 hour Yes No
-
-
-
-
√
-
-
-
1
Mental health status Good
Intermediate Poor
-
-
-
-
√
-
-
-
1
***Total
7
5
7
5
3
3
5
6
41 41
*)=Physically demanding work activity showing association with corresponding body site; **)=Number of pain sites associated with a particular risk factor; ***)=Number of risk factors associated with a particular pain site; √)=Positvely associated; -)=Not associated or not applicable.

148
Chapter 4: Cross-sectional and follow-up studies of the South
African public hospital nurses
This chapter focuses on one occupational group: the public hospital nurses. The
contents of the chapter are organised into: Part 1) the cross-sectional component;
and Part 2) the follow-up component.
Part 1: Cross-sectional study of the South African public hospital
nurses
4.1 Introduction
The cross-sectional component comprised 251 nurses who were working in two
public hospitals: Hospital A with 130 nurses and Hospital B with121 nurses. The
description of the nurses covering different dimensions of MSD exposures is
presented first, followed by the occurrence of MSDs and the determination of
possible risk factors associated with the development of MSDs.
4.2 Description of the South African public hospital nurses
The nurses were working in wards representing seven departments, with the largest
percentage (29.0%) working in the Surgical Department. The percentages of nurses
in Gynaecology and Obstetrics (21.0%) and Medical (20.0%) Departments were
almost equal. So, were those in Orthopaedics (11.0%) and Theatre (10.0%). The
smallest numbers were in Casualty (6.0%) and ICU (3.0%). Forty six percent of the
nurses were professional nurses, 40.0% were enrolled nurses and 14.0% were staff
nurses. Seventy point two percent of the nurses had been working in their current
position for more than five years.
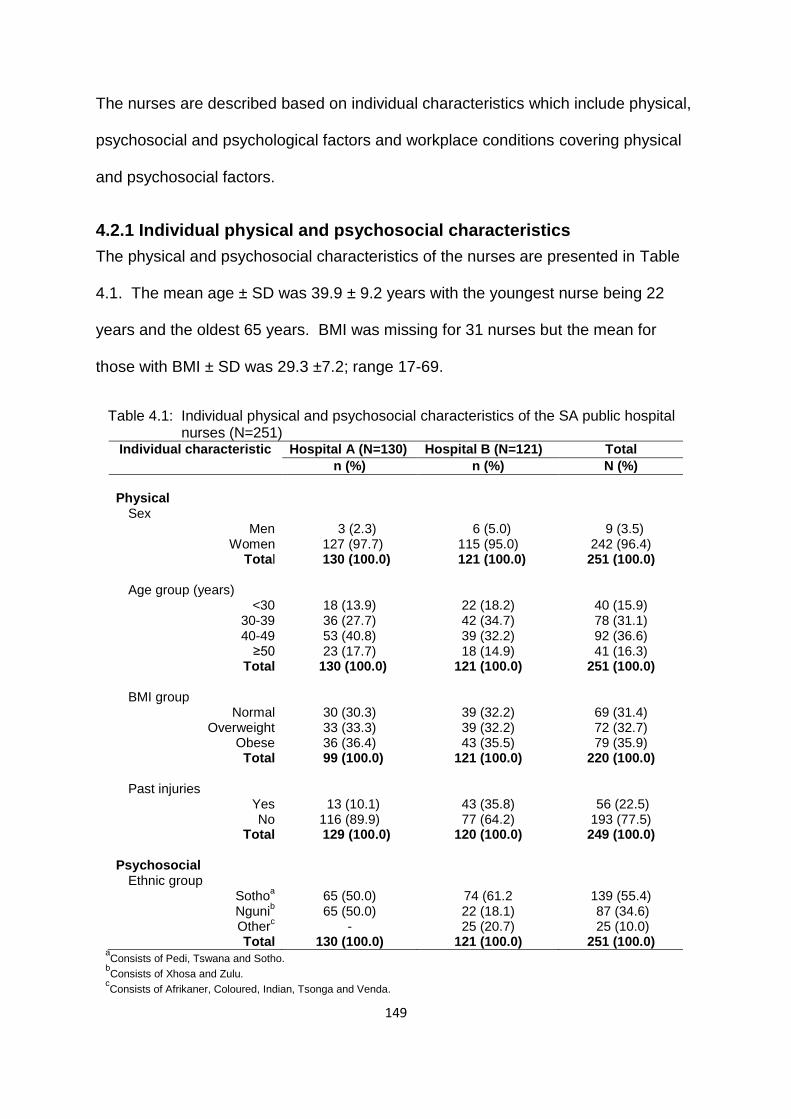
149
The nurses are described based on individual characteristics which include physical,
psychosocial and psychological factors and workplace conditions covering physical
and psychosocial factors.
4.2.1 Individual physical and psychosocial characteristics
The physical and psychosocial characteristics of the nurses are presented in Table
4.1. The mean age ± SD was 39.9 ± 9.2 years with the youngest nurse being 22
years and the oldest 65 years. BMI was missing for 31 nurses but the mean for
those with BMI ± SD was 29.3 ±7.2; range 17-69.
Table 4.1: Individual physical and psychosocial characteristics of the SA public hospital nurses (N=251)
Individual characteristic Hospital A (N=130) Hospital B (N=121) Total
n (%) n (%) N (%)
Physical
Sex Men
Women Total
3 (2.3) 127 (97.7) 130 (100.0)
6 (5.0) 115 (95.0) 121 (100.0)
9 (3.5) 242 (96.4) 251 (100.0)
Age group (years)
<30 30-39 40-49
≥50 Total
18 (13.9) 36 (27.7) 53 (40.8) 23 (17.7)
130 (100.0)
22 (18.2) 42 (34.7) 39 (32.2) 18 (14.9)
121 (100.0)
40 (15.9) 78 (31.1) 92 (36.6) 41 (16.3)
251 (100.0)
BMI group
Normal Overweight
Obese Total
30 (30.3) 33 (33.3) 36 (36.4)
99 (100.0)
39 (32.2) 39 (32.2) 43 (35.5)
121 (100.0)
69 (31.4) 72 (32.7) 79 (35.9)
220 (100.0)
Past injuries Yes No
Total
13 (10.1) 116 (89.9)
129 (100.0)
43 (35.8) 77 (64.2)
120 (100.0)
56 (22.5) 193 (77.5) 249 (100.0)
Psychosocial
Ethnic group
Sothoa
Ngunib
Otherc
Total
65 (50.0) 65 (50.0)
- 130 (100.0)
74 (61.2 22 (18.1) 25 (20.7)
121 (100.0)
139 (55.4) 87 (34.6) 25 (10.0)
251 (100.0) a
Consists of Pedi, Tswana and Sotho. b
Consists of Xhosa and Zulu. c
Consists of Afrikaner, Coloured, Indian, Tsonga and Venda.

150
Table 4.1: Individual physical and psychosocial characteristics of the SA public hospital nurses (N=251) cont’d
Individual characteristic Hospital A (N=130) Hospital B (N=121) Total
n (%) n (%) N (%)
Educational level
High school Tertiary
Total
6 (4.6) 124 (95.4) 130 (100.0)
10 (8.3) 111 (91.7) 121 (100.0
16 (6.4) 235 (93.6)
251 (100.0)
Smoking status Never-smoked
Ever-smoked Total
127 (97.7) 3 (2.3) 130 (100.0)
106 (87.6) 15 (12.4) 121 (100.0)
233 (92.8) 18 (7.2)
251 (100.0)
As expected, the majority of nurses (96.4%) were women. Most of them (68.6%)
were in the overweight and obese BMI groups; 67.7% were in the 30-39 and 40-49
years age groups. More than half (55.4%) belonged to the Sotho ethnic group.
4.2.2 Individual psychological characteristics
The psychological characteristics reported by the nurses are shown in Table 4.2. A
high percentage of nurses (72.1%) thought that workers who suffer from MSD pain
should be compensated (deserve compensation). Just over two thirds of nurses
(67.9%) had financial difficulties, more than half (56.2%) reported one or more
distressing somatic symptoms, and 47.9% had experienced a frightening situation.
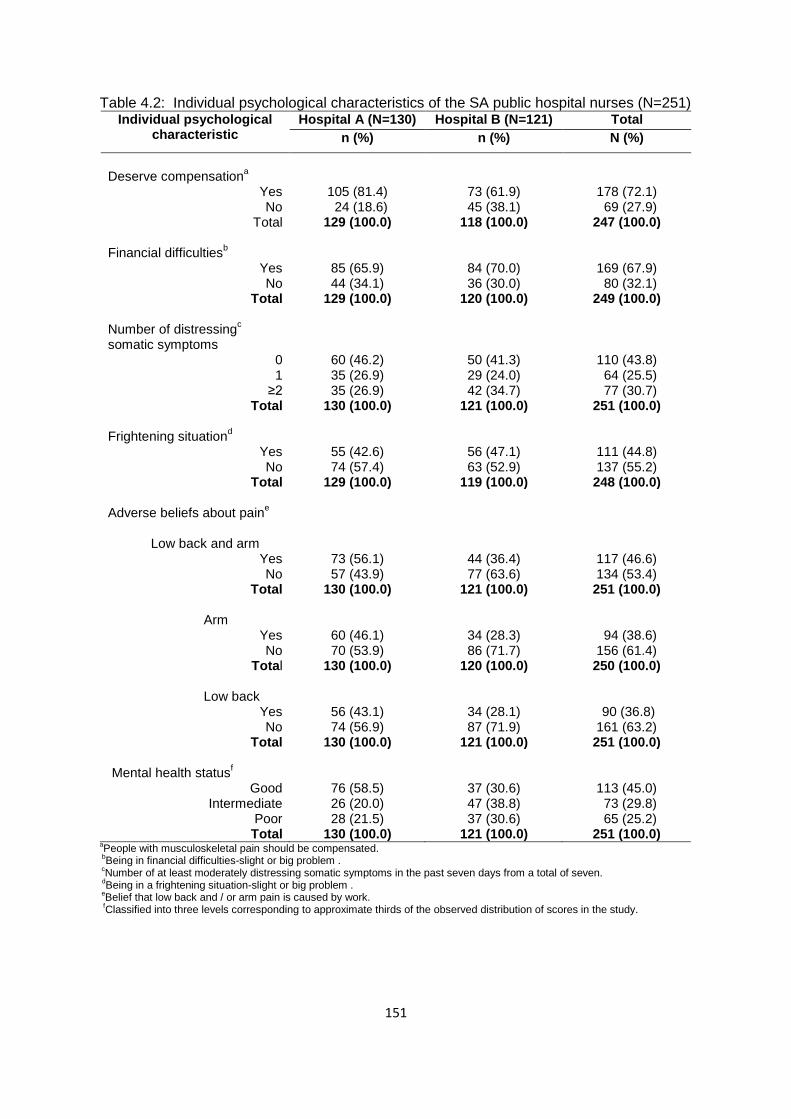
151
Table 4.2: Individual psychological characteristics of the SA public hospital nurses (N=251) Individual psychological
characteristic Hospital A (N=130) Hospital B (N=121) Total
n (%) n (%) N (%)
Deserve compensation
a
Yes No
Total
105 (81.4) 24 (18.6) 129 (100.0)
73 (61.9) 45 (38.1)
118 (100.0)
178 (72.1) 69 (27.9) 247 (100.0)
Financial difficulties
b
Yes No
Total
85 (65.9) 44 (34.1)
129 (100.0)
84 (70.0) 36 (30.0)
120 (100.0)
169 (67.9) 80 (32.1) 249 (100.0)
Number of distressing
c
somatic symptoms 0 1
≥2 Total
60 (46.2) 35 (26.9) 35 (26.9)
130 (100.0)
50 (41.3) 29 (24.0) 42 (34.7)
121 (100.0)
110 (43.8) 64 (25.5) 77 (30.7) 251 (100.0)
Frightening situation
d
Yes No
Total
55 (42.6) 74 (57.4)
129 (100.0)
56 (47.1) 63 (52.9)
119 (100.0)
111 (44.8) 137 (55.2) 248 (100.0)
Adverse beliefs about paine
Low back and arm
Yes No
Total
Arm Yes No
Total
Low back Yes
No Total
73 (56.1) 57 (43.9)
130 (100.0)
60 (46.1) 70 (53.9)
130 (100.0)
56 (43.1) 74 (56.9)
130 (100.0)
44 (36.4) 77 (63.6)
121 (100.0)
34 (28.3) 86 (71.7)
120 (100.0)
34 (28.1) 87 (71.9)
121 (100.0)
117 (46.6) 134 (53.4) 251 (100.0)
94 (38.6) 156 (61.4) 250 (100.0)
90 (36.8) 161 (63.2) 251 (100.0)
Mental health status
f
Good Intermediate
Poor Total
76 (58.5) 26 (20.0) 28 (21.5)
130 (100.0)
37 (30.6) 47 (38.8) 37 (30.6)
121 (100.0)
113 (45.0) 73 (29.8) 65 (25.2) 251 (100.0)
aPeople with musculoskeletal pain should be compensated.
bBeing in financial difficulties-slight or big problem .
cNumber of at least moderately distressing somatic symptoms in the past seven days from a total of seven.
dBeing in a frightening situation-slight or big problem .
eBelief that low back and / or arm pain is caused by work.
fClassified into three levels corresponding to approximate thirds of the observed distribution of scores in the study.

152
4.2.3 Physical workplace activities
The nurses reported physically demanding work activities in their jobs on an average
day (Table 4.3), the most common being repeated elbow bending for more than an
Table 4.3: Physically demanding work activities of the SA public hospital nurses on an average day (N=251)
Physical work activity Hospital A (N=130) Hospital B (N=121) Total
n (%) n (%) N (%)
Repeated elbow bending >1 hour
*
Yes No
Total
123 (94.6) 7 (5.4)
130 (100.0)
91 (75.2) 30 (24.8)
121 (100.0)
214 (85.3) 37 (14.7) 251(100.0)
Lifting ≥25 kg loads by hand
**
Yes No
Total
120 (92.3) 10 (7.7)
130 (100.0)
82 (67.8) 39 (32.2)
121 (100.0)
202 (80.5) 49 (19.5)
251 (100.0) Upper limb load
a
Yes No
Total
118 (90.8) 12 (9.2)
130 (100.0)
78 (65.0) 42 (35.0) 120 (100.0)
196 (78.4) 54 (21.6)
250 (100.0) Repeated wrist/hand movement >4 hours
*
Yes No
Total
113 (86.9) 17 (13.1) 130 (100.0)
78 (64.5) 43 (35.5)
121 (100.0)
191 (76.1) 60 (23.9)
251 (100.0) Physical load
b
Yes No
Total
89 (68.5) 41 (31.5)
130 (100.0)
51 (42.9) 68 (57.1)
119 (100.0)
181 (72.7) 68 (27.3) 249 (100.0)
Working with hands above shoulder height >1 hour
*
Yes No
Total
91 (70.0) 39 (30.0)
130 (100.0)
43 (35.8) 77 (64.2)
121 (100.0)
134 (53.6) 116 (46.4) 250 (100)
Kneeling or squatting >1 hour
**
Yes No
Total
26 (20.0) 104 (80.0) 130 (100.0)
40 (33.3) 80 (66.6)
120 (100.0)
66 (26.4) 184 (73.6) 250 (100.0)
Use of keyboard >4 hours
Yes No
Total
21 (16.2) 109 (83.9) 130 (100.0)
8 (6.7) 112 (93.3) 120 (100.0)
29 (11.6)) 221 (88.4) 250 (100.0)
aReports of any two or more of the variables marked with 1 asterisk.
bReports of any three or more of the variables marked with 1 and 2 asterisks.

153
hour, reported by 85.3% of nurses. This was followed by lifting loads of 25 kg and
above by hand (80.5%), and repeated wrist or finger movements for more than four
hours (76.1%). The use of a keyboard for more than four hours was the least
common physically demanding work activity reported (11.6%).
4.2.4 Psychosocial aspects of work
The stressful psychosocial work conditions reported by the nurses are shown in
Table 4.4. The majority (79.7%) felt that they were working under time pressure,
Table 4.4: Stressful psychosocial work conditions of SA public hospital nurses (N=251) Psychosocial work
condition Hospital A (N=130) Hospital B (N=121) Total
n (%) n (%) N (%)
Working under time pressurea
Yes No
Total
99 (76.2) 31 (23.8)
130 (100.0)
101 (84.2) 19 (15.8)
120 (100.0)
200 (79.7) 50 (20.3)
250 (100.0)
Job dissatisfactionb
Yes No
Total
50 (38.5) 80 (61.5)
130 (100.0)
36 (29.8) 85 (70.2)
121 (100.0)
86 (34.3) 165 (65.7)
251 (100.0)
Job insecurityc
Yes No
Total
28 (22.1) 99 (77.9)
127 (100.0)
43 (35.8) 77 (64.2)
120 (100.0)
71 (28.7) 176 (71.3)
247 (100.0)
Lack of controld
Yes No
Total
41 (31.5) 89 (68.5)
130 (100.0)
18 (15.0) 102 (85.0)
120 (100.0)
59 (23.6) 191 (76.4)
250 (100.0)
Incentivese
Yes No
Total
8 (6.3) 119 (93.7)
127 (100.0)
45 (38.1) 73 (61.9)
118 (100.0)
53 (21.6) 192 (78.4)
245 (100.0)
Lack of social supportf
Yes No
Total
20 (15.5) 109 (84.5)
129 (100.0)
12 (10.1) 107 (89.9)
119 (100.0)
32 (13.4) 216 (86.6)
248 (100.0) aA target amount of work or a number of articles done or finished in a day or working under time pressure trying to complete
tasks by a fixed time. b Very dissatisfied or dissatisfied about the job taking everything into consideration.
c Feel that job would be insecure or very insecure if off work for three months due to serious illness.
d Choice in all of: how work is done; what is done at work; and work time table and breaks times-seldom or never.
e Piecework or payment of a bonus if an agreed number of tasks are finished in a day.
f Assistance or support from colleagues or supervisors-seldom or never.
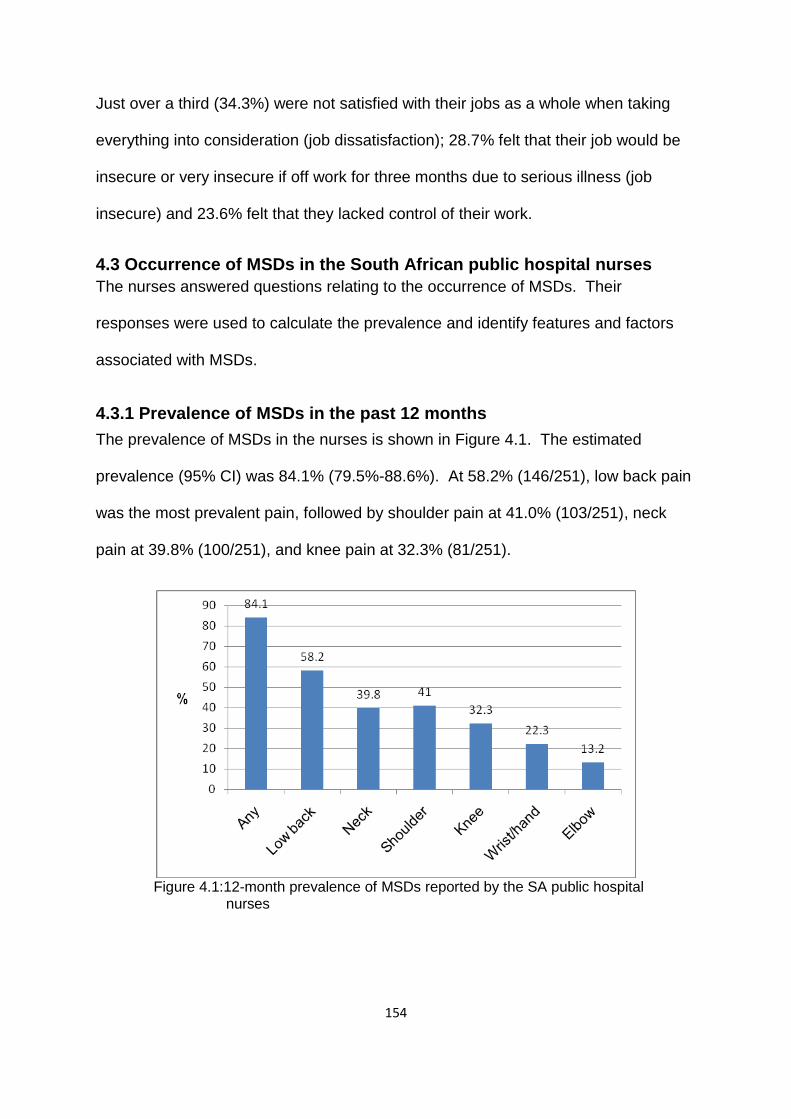
154
Just over a third (34.3%) were not satisfied with their jobs as a whole when taking
everything into consideration (job dissatisfaction); 28.7% felt that their job would be
insecure or very insecure if off work for three months due to serious illness (job
insecure) and 23.6% felt that they lacked control of their work.
4.3 Occurrence of MSDs in the South African public hospital nurses
The nurses answered questions relating to the occurrence of MSDs. Their
responses were used to calculate the prevalence and identify features and factors
associated with MSDs.
4.3.1 Prevalence of MSDs in the past 12 months
The prevalence of MSDs in the nurses is shown in Figure 4.1. The estimated
prevalence (95% CI) was 84.1% (79.5%-88.6%). At 58.2% (146/251), low back pain
was the most prevalent pain, followed by shoulder pain at 41.0% (103/251), neck
pain at 39.8% (100/251), and knee pain at 32.3% (81/251).
Figure 4.1:12-month prevalence of MSDs reported by the SA public hospital nurses
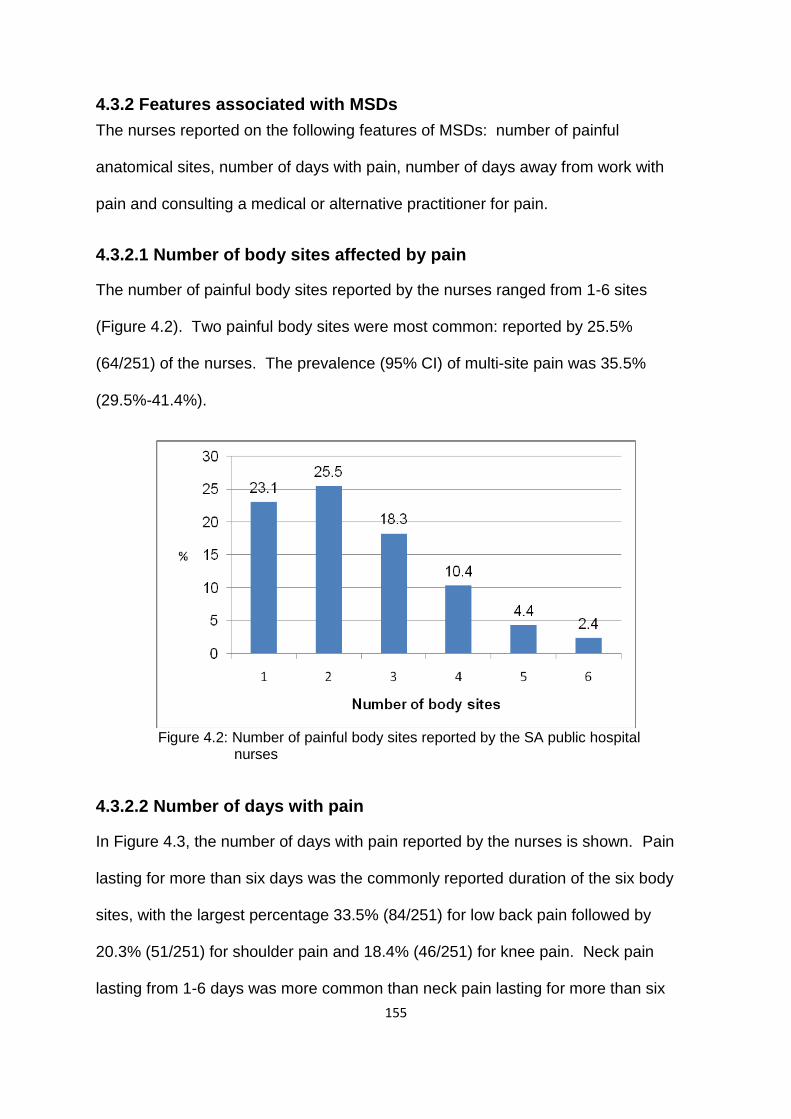
155
4.3.2 Features associated with MSDs
The nurses reported on the following features of MSDs: number of painful
anatomical sites, number of days with pain, number of days away from work with
pain and consulting a medical or alternative practitioner for pain.
4.3.2.1 Number of body sites affected by pain
The number of painful body sites reported by the nurses ranged from 1-6 sites
(Figure 4.2). Two painful body sites were most common: reported by 25.5%
(64/251) of the nurses. The prevalence (95% CI) of multi-site pain was 35.5%
(29.5%-41.4%).
Figure 4.2: Number of painful body sites reported by the SA public hospital nurses
4.3.2.2 Number of days with pain
In Figure 4.3, the number of days with pain reported by the nurses is shown. Pain
lasting for more than six days was the commonly reported duration of the six body
sites, with the largest percentage 33.5% (84/251) for low back pain followed by
20.3% (51/251) for shoulder pain and 18.4% (46/251) for knee pain. Neck pain
lasting from 1-6 days was more common than neck pain lasting for more than six

156
days. Pain occurring for 1-12 months was the least common in all the different body
sites.
Figure 4.3: Number of days with site specific pain reported by the SA public hospital nurses
4.3.2.3 Number of days away from work with pain
The number of days that the nurses had been away from work due to site specific
pain is shown in Figure 4.4. The number of days that was most common for all site
specific pain was 1-5 days. Low back pain accounted for the largest percentage
19.9% (50/251) of the nurses reporting 1-5 days.
A total of 99 (39.6%) of the nurses had taken days away from work because of MSD
pain. The largest percentage (27.6% (69/250)) had taken 1-5 days, 8.8% (22/250)
had taken 6-30 days and 3.2% (8/250) had taken more than 30 days. A
conservative estimate of the total number of days away from work in a year due to
pain was 604.5 days that is, an average of 2.4 days per nurse.
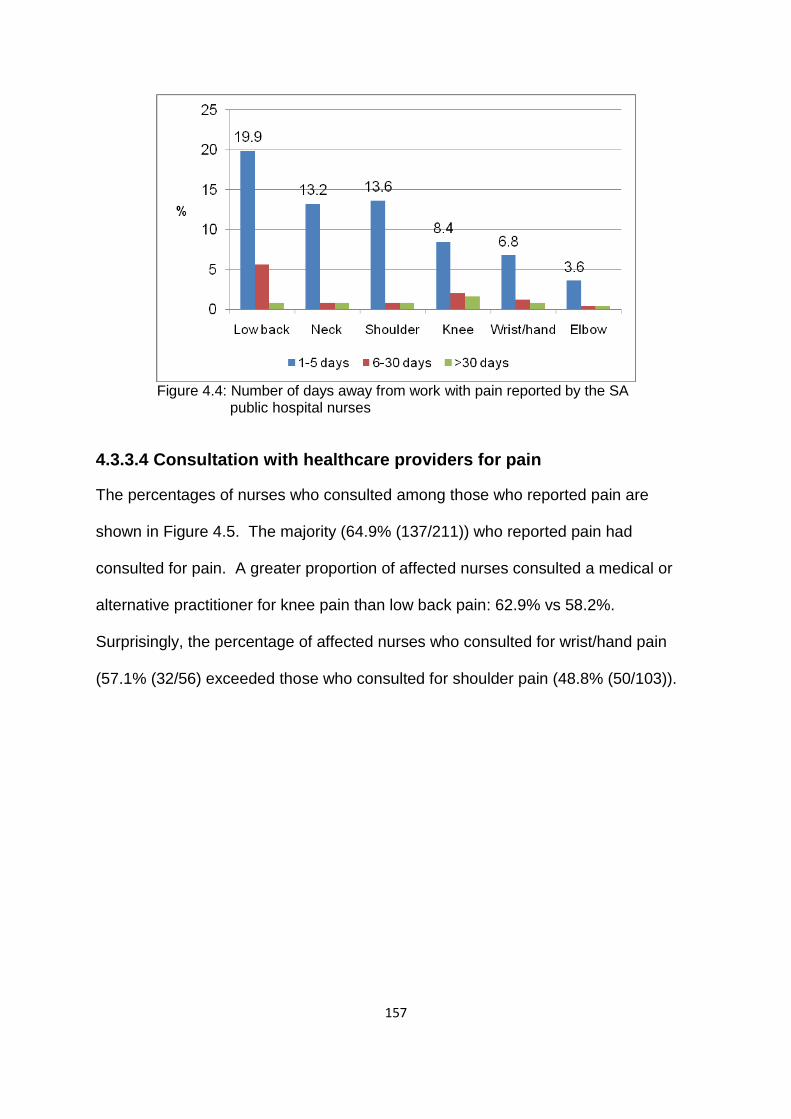
157
Figure 4.4: Number of days away from work with pain reported by the SA public hospital nurses
4.3.3.4 Consultation with healthcare providers for pain
The percentages of nurses who consulted among those who reported pain are
shown in Figure 4.5. The majority (64.9% (137/211)) who reported pain had
consulted for pain. A greater proportion of affected nurses consulted a medical or
alternative practitioner for knee pain than low back pain: 62.9% vs 58.2%.
Surprisingly, the percentage of affected nurses who consulted for wrist/hand pain
(57.1% (32/56) exceeded those who consulted for shoulder pain (48.8% (50/103)).

158
Figure 4.5: Consultation for pain reported by the SA public hospital nurses
4.4 Risk factors associated with MSDs in the South African public
hospital nurses
The information presented in 3.4 is applicable in this subsection. However, the
variables occupational group, sex and smoking status were excluded from the
analyses. Occupational group was not applicable as the data were from one
occupational group (nurses). In terms of sex and smoking status, very few subjects
were men or had ever-smoked regularly in the study sample. These variables were
therefore, excluded from further analyses. Multiple regression analysis was
performed to identify associations between MSD risk factors and MSDs in the South
African public hospital nurses.
4.4.1 Multiple regression analysis of MSD pain in the past 12 months
with possible risk factors in the South African public hospital nurses
Binary logistic regression was used for partial, full and final models. The models are
presented in tables summarizing the results of multiple regression analysis of “any”,
low back, neck, shoulder, wrist or hand, upper limb and knee pain. Elbow pain was
excluded from the analyses because there were not enough events for the selected
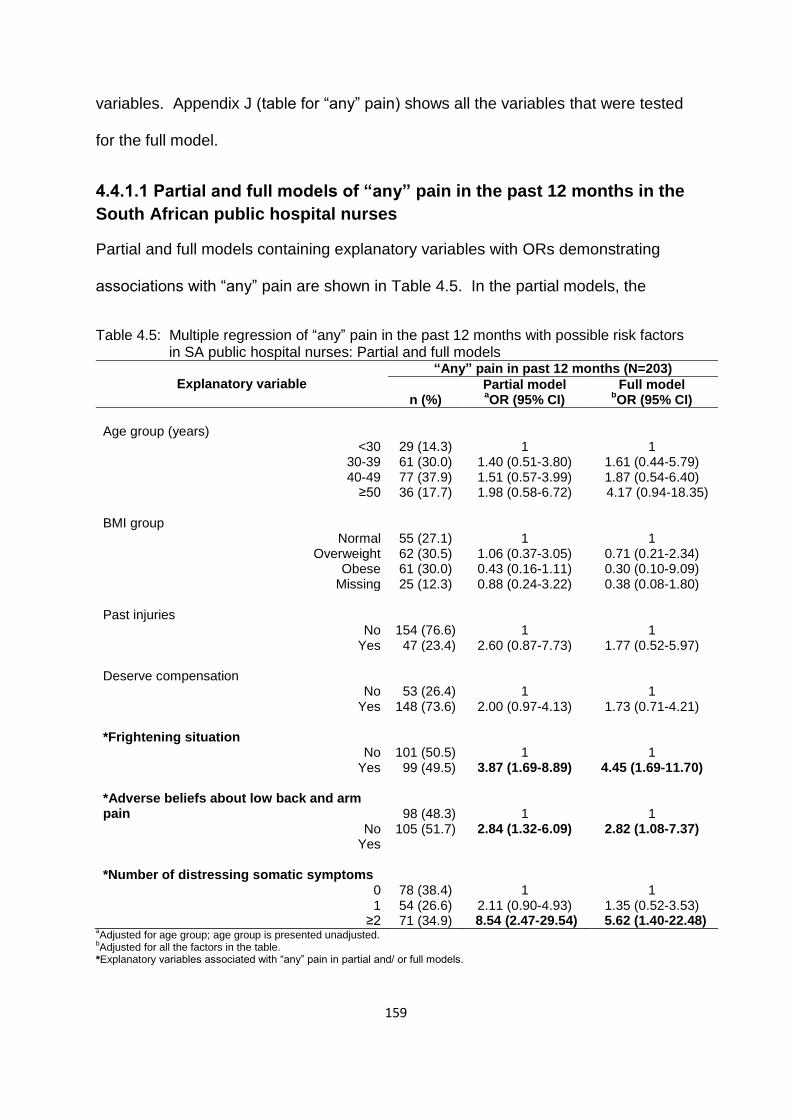
159
variables. Appendix J (table for “any” pain) shows all the variables that were tested
for the full model.
4.4.1.1 Partial and full models of “any” pain in the past 12 months in the
South African public hospital nurses
Partial and full models containing explanatory variables with ORs demonstrating
associations with “any” pain are shown in Table 4.5. In the partial models, the
Table 4.5: Multiple regression of “any” pain in the past 12 months with possible risk factors in SA public hospital nurses: Partial and full models
Explanatory variable
“Any” pain in past 12 months (N=203)
n (%)
Partial model Full model aOR (95% CI)
bOR (95% CI)
Age group (years)
<30 30-39 40-49
≥50
29 (14.3) 61 (30.0) 77 (37.9) 36 (17.7)
1
1.40 (0.51-3.80) 1.51 (0.57-3.99) 1.98 (0.58-6.72)
1
1.61 (0.44-5.79) 1.87 (0.54-6.40)
4.17 (0.94-18.35) BMI group
Normal Overweight
Obese Missing
55 (27.1) 62 (30.5) 61 (30.0) 25 (12.3)
1
1.06 (0.37-3.05) 0.43 (0.16-1.11) 0.88 (0.24-3.22)
1
0.71 (0.21-2.34) 0.30 (0.10-9.09) 0.38 (0.08-1.80)
Past injuries
No Yes
154 (76.6) 47 (23.4)
1
2.60 (0.87-7.73)
1
1.77 (0.52-5.97) Deserve compensation
No Yes
53 (26.4) 148 (73.6)
1
2.00 (0.97-4.13)
1
1.73 (0.71-4.21) *Frightening situation
No Yes
101 (50.5) 99 (49.5)
1
3.87 (1.69-8.89)
1
4.45 (1.69-11.70) *Adverse beliefs about low back and arm pain
No Yes
98 (48.3) 105 (51.7)
1
2.84 (1.32-6.09)
1
2.82 (1.08-7.37)
*Number of distressing somatic symptoms
0 1
≥2
78 (38.4) 54 (26.6) 71 (34.9)
1
2.11 (0.90-4.93) 8.54 (2.47-29.54)
1
1.35 (0.52-3.53) 5.62 (1.40-22.48)
aAdjusted for age group; age group is presented unadjusted.
bAdjusted for all the factors in the table.
*Explanatory variables associated with “any” pain in partial and/ or full models.
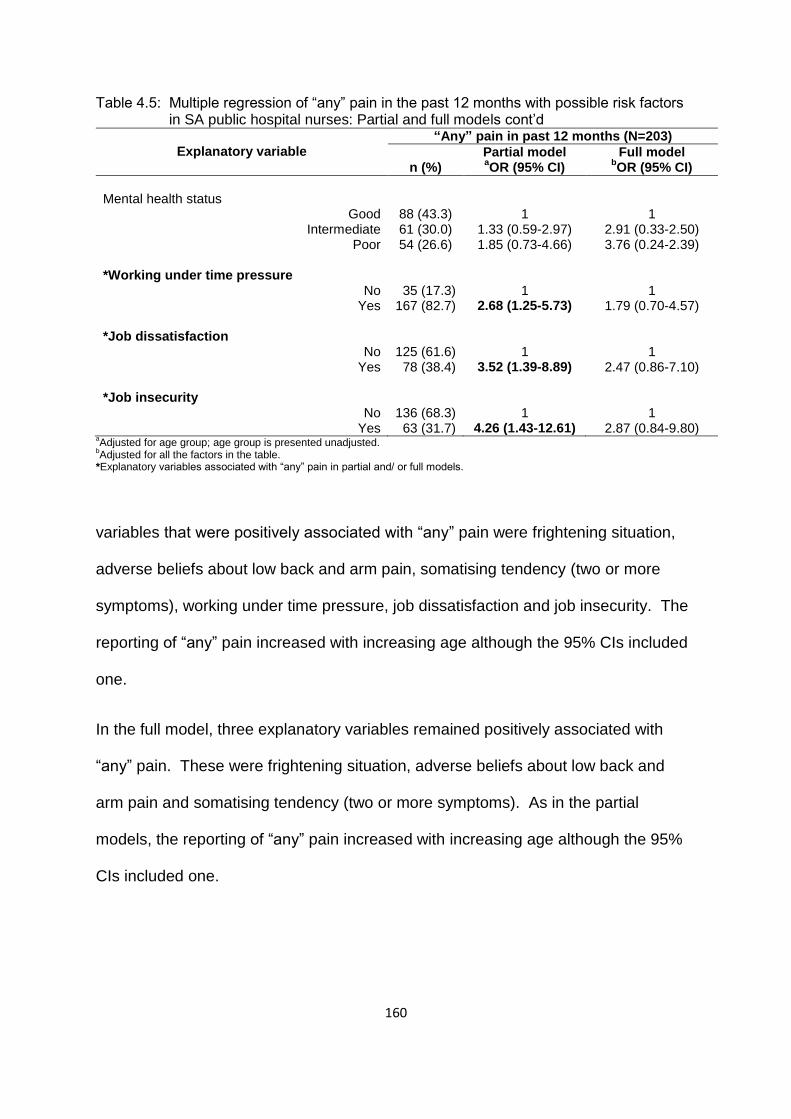
160
Table 4.5: Multiple regression of “any” pain in the past 12 months with possible risk factors in SA public hospital nurses: Partial and full models cont’d
Explanatory variable
“Any” pain in past 12 months (N=203)
n (%)
Partial model Full model aOR (95% CI)
bOR (95% CI)
Mental health status
Good Intermediate
Poor
88 (43.3) 61 (30.0) 54 (26.6)
1
1.33 (0.59-2.97) 1.85 (0.73-4.66)
1
2.91 (0.33-2.50) 3.76 (0.24-2.39)
*Working under time pressure
No Yes
35 (17.3) 167 (82.7)
1
2.68 (1.25-5.73)
1
1.79 (0.70-4.57) *Job dissatisfaction
No Yes
125 (61.6) 78 (38.4)
1
3.52 (1.39-8.89)
1
2.47 (0.86-7.10) *Job insecurity
No Yes
136 (68.3) 63 (31.7)
1
4.26 (1.43-12.61)
1
2.87 (0.84-9.80) aAdjusted for age group; age group is presented unadjusted.
bAdjusted for all the factors in the table.
*Explanatory variables associated with “any” pain in partial and/ or full models.
variables that were positively associated with “any” pain were frightening situation,
adverse beliefs about low back and arm pain, somatising tendency (two or more
symptoms), working under time pressure, job dissatisfaction and job insecurity. The
reporting of “any” pain increased with increasing age although the 95% CIs included
one.
In the full model, three explanatory variables remained positively associated with
“any” pain. These were frightening situation, adverse beliefs about low back and
arm pain and somatising tendency (two or more symptoms). As in the partial
models, the reporting of “any” pain increased with increasing age although the 95%
CIs included one.
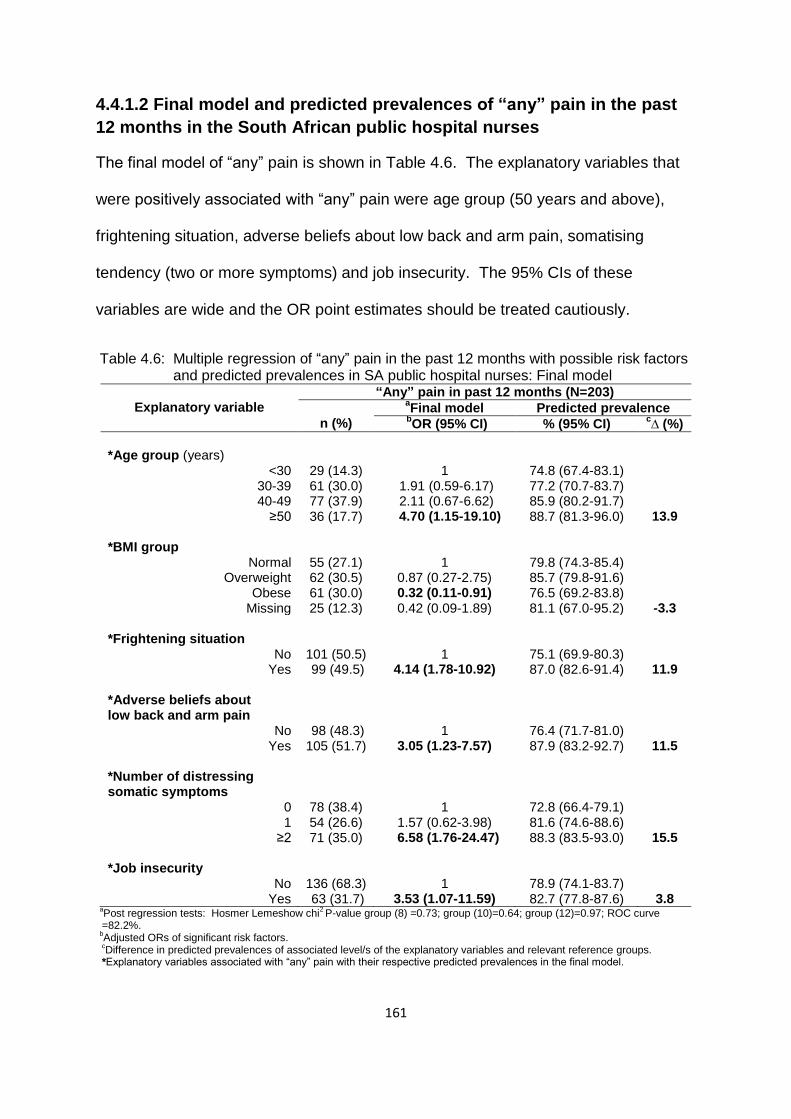
161
4.4.1.2 Final model and predicted prevalences of “any” pain in the past
12 months in the South African public hospital nurses
The final model of “any” pain is shown in Table 4.6. The explanatory variables that
were positively associated with “any” pain were age group (50 years and above),
frightening situation, adverse beliefs about low back and arm pain, somatising
tendency (two or more symptoms) and job insecurity. The 95% CIs of these
variables are wide and the OR point estimates should be treated cautiously.
Table 4.6: Multiple regression of “any” pain in the past 12 months with possible risk factors and predicted prevalences in SA public hospital nurses: Final model
Explanatory variable
“Any” pain in past 12 months (N=203)
n (%)
aFinal model Predicted prevalence
bOR (95% CI) % (95% CI)
c∆ (%)
*Age group (years)
<30 30-39 40-49
≥50
29 (14.3) 61 (30.0) 77 (37.9) 36 (17.7)
1
1.91 (0.59-6.17) 2.11 (0.67-6.62)
4.70 (1.15-19.10)
74.8 (67.4-83.1) 77.2 (70.7-83.7) 85.9 (80.2-91.7) 88.7 (81.3-96.0)
13.9 *BMI group
Normal Overweight
Obese Missing
55 (27.1) 62 (30.5) 61 (30.0) 25 (12.3)
1
0.87 (0.27-2.75) 0.32 (0.11-0.91) 0.42 (0.09-1.89)
79.8 (74.3-85.4) 85.7 (79.8-91.6) 76.5 (69.2-83.8) 81.1 (67.0-95.2)
-3.3 *Frightening situation
No Yes
101 (50.5) 99 (49.5)
1
4.14 (1.78-10.92)
75.1 (69.9-80.3) 87.0 (82.6-91.4)
11.9 *Adverse beliefs about low back and arm pain
No Yes
98 (48.3) 105 (51.7)
1
3.05 (1.23-7.57)
76.4 (71.7-81.0) 87.9 (83.2-92.7)
11.5 *Number of distressing somatic symptoms
0 1
≥2
78 (38.4) 54 (26.6) 71 (35.0)
1
1.57 (0.62-3.98) 6.58 (1.76-24.47)
72.8 (66.4-79.1) 81.6 (74.6-88.6) 88.3 (83.5-93.0)
15.5 *Job insecurity
No Yes
136 (68.3) 63 (31.7)
1
3.53 (1.07-11.59)
78.9 (74.1-83.7) 82.7 (77.8-87.6)
3.8 a
Post regression tests: Hosmer Lemeshow chi2 P-value group (8) =0.73; group (10)=0.64; group (12)=0.97; ROC curve
=82.2%. b
Adjusted ORs of significant risk factors.
cDifference in predicted prevalences of associated level/s of the explanatory variables and relevant reference groups.
*Explanatory variables associated with “any” pain with their respective predicted prevalences in the final model.

162
The BMI group “obese” was negatively associated with “any” pain.
The largest estimated increase (15.5%) in the prevalence of “any” pain in the SA
public hospital nurses is associated with somatising tendency. Age group (50 years
and above) and adverse beliefs about low back and arm pain would increase the
prevalence by11.9% and 11.5%, respectively. Surprisingly, the BMI group “obese”
resulted in a decrease of the prevalence by 3.3%.
4.4.1.3 Partial and full models of low back pain in the past 12 months in
the South African public hospital nurses
The partial and full models with explanatory variables and the ORs showing
associations with low back pain are presented in Table 4.7. Adverse beliefs about
Table 4.7: Multiple regression of low back pain in the past 12 months with possible risk factors in SA public hospital nurses: Partial and full models
Explanatory variable
Low back pain in past 12 months (N=143)
n (%)
Partial model Full model aOR (95% CI)
bOR (95% CI)
*Age group (years)
<30 30-39 40-49
≥50
17 (11.9) 41 (28.7) 59 (41.3) 26 (18.2)
1
1.50 (0.68-3.33) 2.16 (0.99-4.71) 2.03 (0.82-5.04)
1
1.88 (0.76-4.68) 2.06 (0.87-4.98) 2.93 (1.07-8.03)
Frightening situation
No Yes
71 (50.4) 70 (49.6)
1
1.65 (0.97-282)
1
1.53 (0.83-2.81) *Adverse belief about low back pain
No Yes
82 (57.3) 61 (42.7)
1
1.99 (1.13-3.49)
1
1.82 (0.96-3.44) *Number of distressing somatic symptoms
0 1
≥2
47 (32.9) 38 (26.6) 58 (40.6)
1
1.78 (0.93-3.42) 4.60 (2.31-9.13)
1
1.41 (0.70-2.82) 3.15 (0.70-2.82)
Mental health status
Good Intermediate
Poor
59 (41.3) 48 (33.6) 36 (25.2)
1
1.63 (0.90-3.17) 1.21 (0.64-2.31)
1
2.12 (0.62-2.59) 3.70 (0.33-1.49)
aAdjusted for age group; age group is presented unadjusted.
bAdjusted for all the factors in the table.
*Explanatory variables associated with low back pain in partial or full models.

163
Table 4.7: Multiple regression of low back pain in the past 12 months with possible risk factors in SA public hospital nurses: Partial and full models cont’d
Explanatory variable
Low back pain in past 12 months (N=143)
n (%)
Partial model Full model aOR (95% CI)
bOR (95% CI)
Working under time pressure
No Yes
24 (16.8) 119 (83.2)
1
1.69 (0.89-3.21)
1
1.28 (0.62-2.63) Lack of social support
No Yes
117 (83.0) 24 (17.0)
1
2.20 (0.93-5.20)
1
1.83 (0.72-4.64) Job dissatisfaction
No Yes
87 (60.8) 56 (39.2)
1
1.58 (0.90-2.78)
1
1.23 (0.64-2.36) *Job insecurity
No Yes
94 (66.7) 47 (33.3)
1
1.93 (1.04-3.58)
1
1.42 (0.71-2.81) aAdjusted for age group; age group is presented unadjusted.
bAdjusted for all the factors in the table.
*Explanatory variables associated with low back pain in partial or full models.
low back pain, somatising tendency (two or more symptoms) and job insecurity were
positively associated with low back pain in the partial models. In the full model, age
group (50 years and above) was the only variable positively associated with low back
pain.
4.4.1.4 Final model and predicted prevalences of low back pain in the
past 12 months in the South African public hospital nurses
The final model of low back pain and predicted prevalences are presented in Table
4.8. Somatising tendency (two or more symptoms) was the only variable that was
positively associated with low back pain. The odds of reporting low back pain tended
to increase with increasing age group although the 95% CIs included one.

164
Table 4.8: Multiple regression of low back pain in the past 12 months with possible risk factors and predicted prevalences in the SA public hospital nurses: Final model
Explanatory variable
Low back pain in past 12 months (N=143)
n (%)
aFinal model Predicted prevalence
bOR (95% CI) % (95% CI)
c∆ (%)
Age group (years)
<30 30-39 40-49
≥50
17 (11.9) 41 (28.7) 59 (41.3) 26 (18.2)
1
1.70 (0.72-4.04) 2.12 (0.91-4.90) 2.56 (0.96-6.82)
49.6 (41.5-57.6) 52.3 (44.3-60.3) 36.8 (56.0-71.7) 67.9 (56.5-79.4)
18.3 *Number of distressing somatic symptoms
0 1
≥2
47 (32.9) 38 (26.6) 58 (40.6)
1
1.72 (0.88-3.34) 4.12 (2.05-8.27)
42.4 (35.1-49.7) 58.8 (49.9-67.7) 68.6 (62.1-75.1)
26.2 aPost regression tests: Pearson Chi
2 p-value=0.59; ROC curve=67.4%.
bAdjusted ORs of significant risk factors.
cDifference in predicted prevalences of associated level/s of explanatory variables and relevant reference groups.
*Explanatory variable associated with low back pain with respective predicted prevalence in the final model.
The predicted prevalences of low back pain show that somatising tendency would
increase the prevalence of low back pain by 26.2% in the nurses reporting two or
more symptoms compared to those not reporting symptoms.
4.4.1.5 Partial and full models of neck pain in the past 12 months in the
South African public hospital nurses
The partial and full models of neck pain appear in Table 4.9. They contain
explanatory variables with ORs indicating associations with neck pain. Past injuries,
financial difficulties, frightening situation and somatising tendency (two or more
symptoms) were positively associated with neck pain in the partial models. The
variable frightening situation remained positively associated with neck pain in the full
model.

165
Table 4.9: Multiple regression of neck pain in the past 12 months with possible risk factors in SA public hospital nurses: Partial and full models
Explanatory variable
Neck pain in past 12 months (N=96)
n (%)
Partial model Full model aOR (95% CI)
bOR (95% CI)
Age group (years)
<30 30-39 40-49
≥50
11 (11.4) 31 (32.3) 40 (41.7) 14 (14.6)
1
1.74 (0.75-4.05) 1.85 (0.81-4.19) 1.22 (0.47-3.18)
1
1.26 (0.49-3.23) 1.53 (0.61-3.81) 1.18 (0.41-3.37)
*Past injuries
No Yes
67 (71.3) 27 (28.7)
1
2.02 (1.07-3.80)
1
1.82 (0.91-3.63) *Financial difficulties
No Yes
22 (23.4) 72 (76.6)
1
1.86 (1.02-3.37)
1
1.70 (0.88-3.26) *Frightening situation
No Yes
39 (41.9) 54 (58.1)
1
2.38 (1.39-4.07)
1
2.22 (1.22-4.03) *Number of distressing somatic symptoms
0 1
≥2
33 (34.4) 28 (29.2) 35 (36.4)
1
1.66 (0.86-3.20) 1.91 (1.03-3.56)
1
1.71 (0.84-3.47) 1.50 (0.74-3.03)
Mental health status
Good Intermediate
Poor
38 (39.6) 29 (30.2) 29 (30.2)
1
1.23 (0.66-2.29) 1.64 (0.86-3.13)
1
1.01 (0.49-2.05) 1.32 (0.63-2.77)
Working under time pressure
No Yes
14 (14.7) 81 (84.3)
1
1.74 (0.87-3.47)
1
1.86 (0.85-4.05) Lack of control
No Yes
68 (70.8) 28 (29.2)
1
1.66 (0.90-3.04)
1
1.68 (0.84-3.33) aAdjusted for age group; age group is presented unadjusted.
bAdjusted for all the factors in the table.
*Explanatory variables associated with neck pain in partial or full models.
4.4.1.6 Final model and predicted prevalences of neck pain in the past 12
months in the South African public hospital nurses
The final model and predicted prevalences of neck pain are shown in Table 4.10.
The variable, frightening situation continued to be associated with neck pain in the
final model.

166
Table 4.10: Multiple regression of neck pain in the past 12 months with possible risk factors and predicted prevalences in the SA public hospital nurses: Final model
Explanatory variable
Neck pain in past 12 months (N=96)
n (%)
aFinal model Predicted prevalence
bOR (95% CI) % (95% CI)
c∆ (%)
Age group (years)
<30 30-39 40-49
≥50
11 (11.4) 31 (32.3) 40 (41.7) 14 (14.6)
1
1.49 (0.60-3.68) 2.01 (0.85-4.77) 1.32 (0.48-3.62)
42.0 (34.0-50.0) 45.9 (37.9-53.9) 50.6 (42.4-58.9) 42.3 (29.7-54.9)
0.3 *Frightening situation
No Yes
39 (41.9) 54 (58.1)
1
2.61 (1.50-4.53)
35.7 (29.8-41.6) 56.9 (50.4-63.4)
21.2 a
Post regression tests: Pearson’ chi2 p-value=0.49; ROC curve=64.9.
bAdjusted ORs of significant risk factors.
cDifference in predicted prevalences of associated level/s of explanatory variables and relevant reference groups.
*Explanatory variable associated with neck pain with respective predicted prevalence in the final model.
An increase of 21.2% in the prevalence of neck pain would be attributed to
frightening situation in the nurses.
4.4.1.7 Partial and full models of shoulder pain in the past 12 months in
the South African public hospital nurses
The partial and full models of shoulder pain appear in Table 4.11. They contain
explanatory variables with ORs representing associations with shoulder pain. In the
partial models, the variables that were positively associated with shoulder pain were
age group (40-49 years), past injuries, somatising tendency (two or more
symptoms), job dissatisfaction and job insecurity. In the full model, age group (40-49
and 50 years and above) and past injuries were positively associated with shoulder
pain.

167
Table 4.11: Multiple regression of shoulder pain in the past 12 months with possible risk factors in SA public hospital nurses: Partial and full models
Explanatory variable
Shoulder pain in past 12 months (N=101)
n (%)
Partial model Full model aOR (95% CI)
bOR (95% CI)
*Age group (years)
<30 30-39 40-49
≥50
11 (10.9) 25 (24.8) 47 (46.5) 18 (17.8)
1
1.23 (0.52-2.89) 2.52 (1.11-5.71) 1.84 (0.72-4.71)
1
1.53 (0.54-4.34) 4.09 (1.47-11.35) 4.01 (1.28-12.52)
BMI group
Normal Overweight
Obese Missing
29 (28.7) 28 (27.7) 33 (32.7) 11 (10.9)
1
0.64 (0.31-1.32) 0.58 (0.28-1.22) 0.56 (0.21-1.43)
1
0.42 (0.17-1.00) 0.52 (0.22-1.23) 0.37 (0.12-1.11)
*Past injuries
No Yes
71 (71.7) 28 (28.3)
1
2.05 (1.08-3.89)
1
2.11 (1.01-4.42) Deserve compensation
No Yes
29 (29.3) 71 (71.7)
1
1.00 (0.56-1.79)
1
0.92 (0.47-1.78) Frightening situation
No Yes
49 (49.5) 50 (50.5)
1
1.52 (0.89-2.59)
1
1.38 (0.73-2.62) *Number of distressing somatic symptoms
0 1
≥2
37 (36.6) 25 (24.8) 39 (38.6)
1
1.07 (0.55-2.07) 2.01 (1.08-3.75)
1
0.89 (0.42-1.90) 2.04 (0.98-4.25)
Mental health status
Good Intermediate
Poor
42 (41.6) 27 (26.7) 32 (31.7)
1
0.93 (0.50-1.75) 1.79 (0.94-3.43)
1
2.65 (0.30-1.39) 3.10 (0.47-2.19)
Incentives
No Yes
73 (74.5) 25 (25.5)
1
1.69 (0.88-3.25)
1
1.26 (0.60-2.65) Lack of social support
No Yes
83 (82.2) 18 (17.8)
1
1.71 (0.79-3.71)
1
1.50 (0.62-3.65) aAdjusted for age group; age group is presented unadjusted.
bAdjusted for all the factors in the table.
*Explanatory variables associated with shoulder pain in partial and/ or full models.
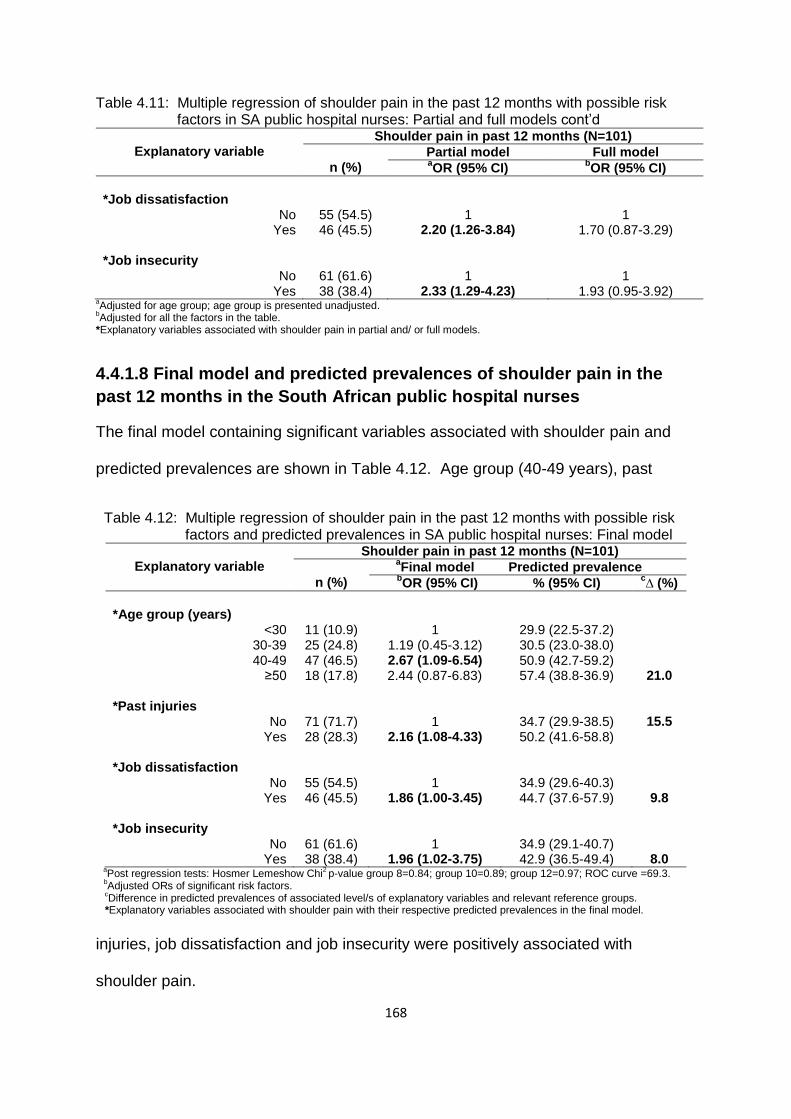
168
Table 4.11: Multiple regression of shoulder pain in the past 12 months with possible risk factors in SA public hospital nurses: Partial and full models cont’d
Explanatory variable
Shoulder pain in past 12 months (N=101)
n (%)
Partial model Full model aOR (95% CI)
bOR (95% CI)
*Job dissatisfaction
No Yes
55 (54.5) 46 (45.5)
1
2.20 (1.26-3.84)
1
1.70 (0.87-3.29) *Job insecurity
No Yes
61 (61.6) 38 (38.4)
1
2.33 (1.29-4.23)
1
1.93 (0.95-3.92) aAdjusted for age group; age group is presented unadjusted.
bAdjusted for all the factors in the table.
*Explanatory variables associated with shoulder pain in partial and/ or full models.
4.4.1.8 Final model and predicted prevalences of shoulder pain in the
past 12 months in the South African public hospital nurses
The final model containing significant variables associated with shoulder pain and
predicted prevalences are shown in Table 4.12. Age group (40-49 years), past
Table 4.12: Multiple regression of shoulder pain in the past 12 months with possible risk factors and predicted prevalences in SA public hospital nurses: Final model
Explanatory variable
Shoulder pain in past 12 months (N=101)
n (%)
aFinal model Predicted prevalence
bOR (95% CI) % (95% CI)
c∆ (%)
*Age group (years)
<30 30-39 40-49
≥50
11 (10.9) 25 (24.8) 47 (46.5) 18 (17.8)
1
1.19 (0.45-3.12) 2.67 (1.09-6.54)
2.44 (0.87-6.83)
29.9 (22.5-37.2) 30.5 (23.0-38.0) 50.9 (42.7-59.2) 57.4 (38.8-36.9)
21.0 *Past injuries
No Yes
71 (71.7) 28 (28.3)
1
2.16 (1.08-4.33)
34.7 (29.9-38.5) 50.2 (41.6-58.8)
15.5
*Job dissatisfaction
No Yes
55 (54.5) 46 (45.5)
1
1.86 (1.00-3.45)
34.9 (29.6-40.3) 44.7 (37.6-57.9)
9.8 *Job insecurity
No Yes
61 (61.6) 38 (38.4)
1
1.96 (1.02-3.75)
34.9 (29.1-40.7) 42.9 (36.5-49.4)
8.0 a
Post regression tests: Hosmer Lemeshow Chi2 p-value group 8=0.84; group 10=0.89; group 12=0.97; ROC curve =69.3.
bAdjusted ORs of significant risk factors.
cDifference in predicted prevalences of associated level/s of explanatory variables and relevant reference groups.
*Explanatory variables associated with shoulder pain with their respective predicted prevalences in the final model.
injuries, job dissatisfaction and job insecurity were positively associated with
shoulder pain.
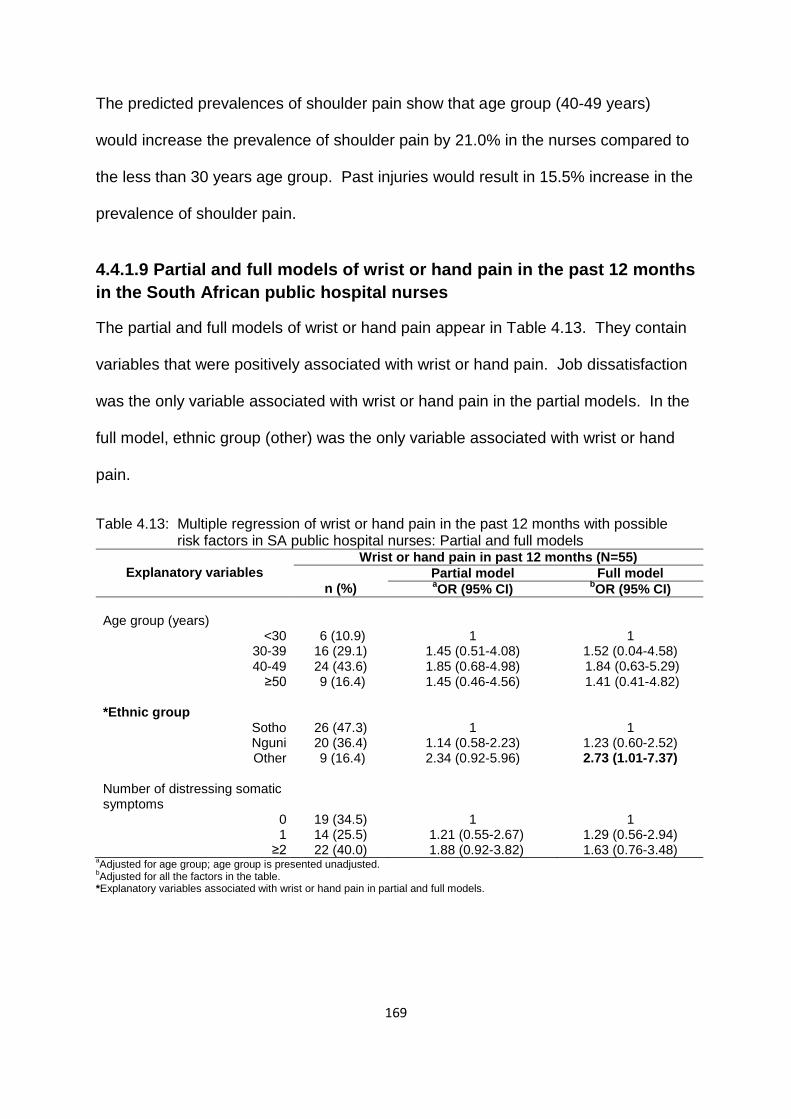
169
The predicted prevalences of shoulder pain show that age group (40-49 years)
would increase the prevalence of shoulder pain by 21.0% in the nurses compared to
the less than 30 years age group. Past injuries would result in 15.5% increase in the
prevalence of shoulder pain.
4.4.1.9 Partial and full models of wrist or hand pain in the past 12 months
in the South African public hospital nurses
The partial and full models of wrist or hand pain appear in Table 4.13. They contain
variables that were positively associated with wrist or hand pain. Job dissatisfaction
was the only variable associated with wrist or hand pain in the partial models. In the
full model, ethnic group (other) was the only variable associated with wrist or hand
pain.
Table 4.13: Multiple regression of wrist or hand pain in the past 12 months with possible risk factors in SA public hospital nurses: Partial and full models
Explanatory variables
Wrist or hand pain in past 12 months (N=55)
n (%)
Partial model Full model aOR (95% CI)
bOR (95% CI)
Age group (years)
<30 30-39 40-49
≥50
6 (10.9) 16 (29.1) 24 (43.6) 9 (16.4)
1
1.45 (0.51-4.08) 1.85 (0.68-4.98) 1.45 (0.46-4.56)
1
1.52 (0.04-4.58) 1.84 (0.63-5.29) 1.41 (0.41-4.82)
*Ethnic group
Sotho Nguni Other
26 (47.3) 20 (36.4) 9 (16.4)
1
1.14 (0.58-2.23) 2.34 (0.92-5.96)
1
1.23 (0.60-2.52) 2.73 (1.01-7.37)
Number of distressing somatic symptoms
0 1
≥2
19 (34.5) 14 (25.5) 22 (40.0)
1
1.21 (0.55-2.67) 1.88 (0.92-3.82)
1
1.29 (0.56-2.94) 1.63 (0.76-3.48)
aAdjusted for age group; age group is presented unadjusted.
bAdjusted for all the factors in the table.
*Explanatory variables associated with wrist or hand pain in partial and full models.

170
Table 4.13: Multiple regression of wrist or hand pain in the past 12 months with possible risk factors in SA public hospital nurses: Partial and full models cont’d
Explanatory variables
Wrist or hand pain in past 12 months (N=55)
n (%)
Partial model Full model aOR (95% CI)
bOR (95% CI)
Incentives
No Yes
38 (71.7) 15 (28.3)
1
1.77 (0.86-3.63)
1
1.76 (0.82-3.77) Lack of social support
No Yes
43 (78.2) 12 (21.8)
1
2.20 (0.98-4.91)
1
2.20 (0.94-5.13) *Job dissatisfaction
No Yes
29 (52.7) 26 (47.3)
1
1.92 (1.03-3.64)
1
1.5 (0.75-2.97) aAdjusted for age group; age group is presented unadjusted.
bAdjusted for all the factors in the table.
*Explanatory variables associated with wrist or hand pain in partial and full models.
4.4.1.10 Final model and predicted prevalences of wrist or hand pain in
the past 12 months in the South African public hospital nurses
The final model and predicted prevalences of wrist or hand pain are presented in
Table 4.14. Two variables demonstrated positive association with wrist or hand pain.
These were ethnic group (other) and lack of social support.
Table 4.14: Multiple regression of wrist or hand pain in the past 12 months with possible risk factors and predicted prevalences in SA public hospital nurses: Final model
Explanatory variable
Wrist or hand pain in past 12 months (N=55)
n (%)
aFinal model Predicted prevalence
bOR (95% CI) % (95% CI)
c∆ (%)
Age group (years)
<30 30-39 40-49
≥50
6 (10.9) 16 (29.1) 24 (43.6) 9 (16.4)
1
1.40 (0.48-4.08) 1.81 (0.65-5.03) 1.16 (0.35-3.85)
22.9 (16.0-29.8) 19.7 (13.1-26.3) 29.7 (22.1-37.3) 26.2 (14.9-37.4)
3.3 *Ethnic group
Sotho Nguni Other
26 (47.3) 20 (36.4) 9 (16.4)
1
1.15 (0.58-2.30) 2.81 (1.07-7.39)
17.5 (12.2-22.7) 27.9 (20.7-35.2) 31.2 (23.1-39.3)
13.7 *Lack of social support
No Yes
43 (78.2) 12 (21.8)
1
2.32 (1.02-5.27)
23.3 (19.1-27.3) 30.1 (20.1-40.2)
6.8 a
Post regression tests: Hosmer Lemeshow chi2 p-value group 8=055; group 10=0.82; group 12=0.74; ROC curve =63.6.
bAdjusted ORs of significant risk factors.
cDifference in predicted prevalences of associated level/s of explanatory variables and relevant reference groups.
*Explanatory variables associated with wrist or hand pain with their respective predicted prevalences in the final model.

171
The prevalence of wrist or hand pain is predicted to increase by 13.7% in the ethnic
group (other) of the nurses compared to the Sotho group.
4.4.1.11 Partial and full models of upper limb pain in the past 12 months
in the South African public hospital nurses
The partial and full models of upper limb pain are presented in Table 4.15. They
include variables with corresponding ORs representing associations with upper limb
pain. In the partial models, the variables that showed positive associations with
upper limb pain were frightening situation, somatising tendency (two or more
symptoms), mental health status (poor), job dissatisfaction and job insecurity.
Table 4.15: Multiple regression of upper limb pain in the past 12 months with possible risk factors in SA public hospital nurses: Partial and full model
Explanatory variable
Upper limb pain in past 12 months (N=133)
n (%)
Partial model Full model aOR (95% CI)
bOR (95% CI)
*Age group (years)
<30 30-39 40-49
≥50
17 (12.8) 38 (28.6) 56 (42.1) 22 (16.5)
1
1.27 (0.57-2.82) 1.88 (0.86-4.07) 1.36 (0.55-3.32)
1
1.39 ( 0.55-3.54) 2.60 (1.03-6.60) 2.89 (1.00-8.30)
BMI group
Normal Overweight
Obese Missing
38 (28.6) 38 (28.6) 39 (29.3) 18 (13.5)
1
0.69 (0.33-1.41) 0.51 (0.24-1.05) 0.96 (0.38-2.44)
1
0.41 (0.17-0.94) 0.37 (0.16-0.84) 0.53 (0.18-1.52)
Past injuries
No Yes
98 (74.8) 33 (25.2)
1
1.69 (0.88-3.24)
1
1.74 (0.84-3.59) *Frightening situation
No Yes
64 (48.9) 67 (51.1)
1
1.79 (1.06-3.03)
1
1.76 (0.95-3.26) Adverse beliefs about arm pain
No Yes
76 (57.1) 57 (42.9)
1
1.50 (0.88-2.56)
1
1.34 (0.72-2.52) aAdjusted for age group; age group is presented unadjusted.
bAdjusted for all the factors in the table.
*Explanatory variables associated with upper limb pain in partial or full models.
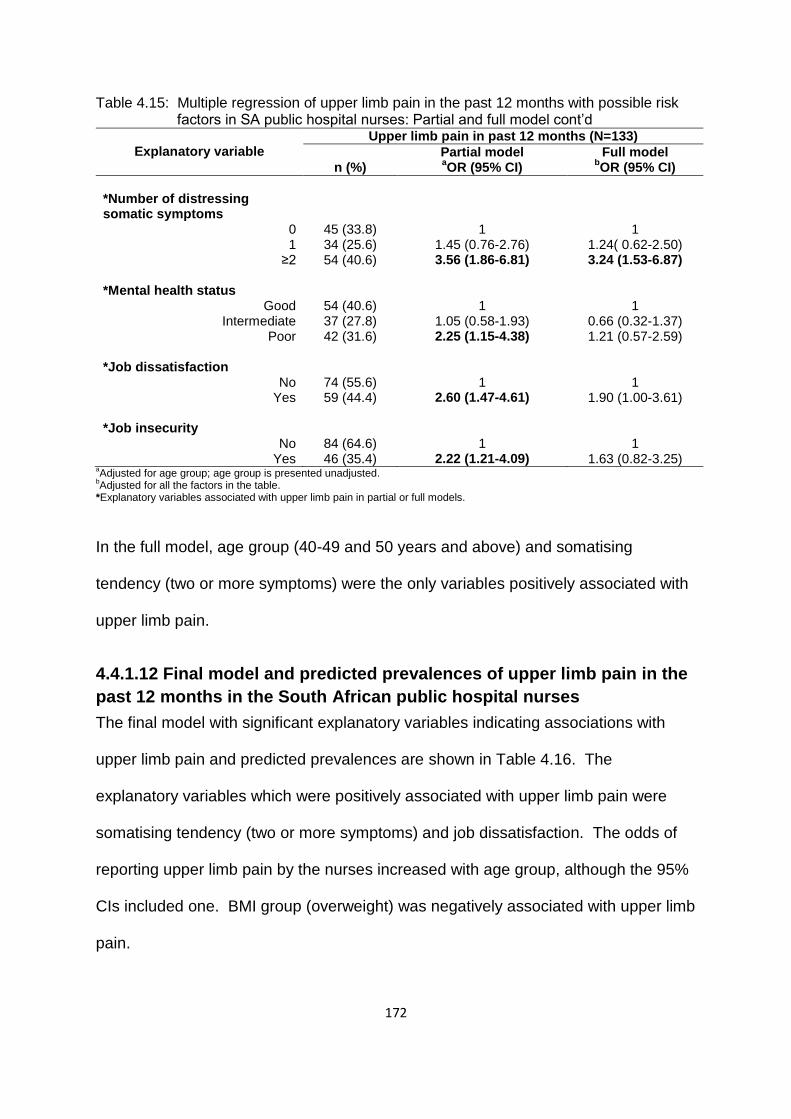
172
Table 4.15: Multiple regression of upper limb pain in the past 12 months with possible risk factors in SA public hospital nurses: Partial and full model cont’d
Explanatory variable
Upper limb pain in past 12 months (N=133)
n (%)
Partial model Full model aOR (95% CI)
bOR (95% CI)
*Number of distressing somatic symptoms
0 1
≥2
45 (33.8) 34 (25.6) 54 (40.6)
1
1.45 (0.76-2.76) 3.56 (1.86-6.81)
1
1.24( 0.62-2.50) 3.24 (1.53-6.87)
*Mental health status
Good Intermediate
Poor
54 (40.6) 37 (27.8) 42 (31.6)
1
1.05 (0.58-1.93) 2.25 (1.15-4.38)
1
0.66 (0.32-1.37) 1.21 (0.57-2.59)
*Job dissatisfaction
No Yes
74 (55.6) 59 (44.4)
1
2.60 (1.47-4.61)
1
1.90 (1.00-3.61) *Job insecurity
No Yes
84 (64.6) 46 (35.4)
1
2.22 (1.21-4.09)
1
1.63 (0.82-3.25) aAdjusted for age group; age group is presented unadjusted.
bAdjusted for all the factors in the table.
*Explanatory variables associated with upper limb pain in partial or full models.
In the full model, age group (40-49 and 50 years and above) and somatising
tendency (two or more symptoms) were the only variables positively associated with
upper limb pain.
4.4.1.12 Final model and predicted prevalences of upper limb pain in the
past 12 months in the South African public hospital nurses
The final model with significant explanatory variables indicating associations with
upper limb pain and predicted prevalences are shown in Table 4.16. The
explanatory variables which were positively associated with upper limb pain were
somatising tendency (two or more symptoms) and job dissatisfaction. The odds of
reporting upper limb pain by the nurses increased with age group, although the 95%
CIs included one. BMI group (overweight) was negatively associated with upper limb
pain.

173
Table 4.16: Multiple regression of upper limb pain in the past 12 months with possible risk factors and predicted prevalences in SA public hospital nurses: Final model
Explanatory variable
Upper limb pain in past 12 months (N=133)
n (%)
aFinal model Predicted prevalence
bOR (95% CI) % (95% CI)
c∆ (%)
Age group (years)
<30 30-39 40-49
≥50
17 (12.8) 38 (28.6) 56 (42.1) 22 (16.5)
1
1.36 (0.55-3.33) 2.45 (1.00-6.02) 2.56 (0.93-7.07)
48.5 (40.0-56.9) 44.6 (36.6-52.5) 62.7 (54.7-70.8) 62.3 (50.2-74.5)
13.8 *BMI group
Normal Overweight
Obese Missing
38 (28.6) 38 (28.6) 39 (29.3) 18 (13.5)
1
0.49 (0.22-1.09) 0.41 (0.18-0.89) 0.60 (0.21-1.67)
52.9 (45.6-60.2) 56.0 (47.8-64.3) 50.0 (41.6-58.5)
3.1 *Number of distressing somatic symptoms
0 1
≥2
45 (33.8) 34 (25.6) 54 (40.6)
1
1.37 (0.69-2.68) 3.43 (1.71-6.87)
39.8 (32.5-47.1) 50.3 (41.3-59.3) 66.9 (60.2-73.6)
27.1 *Job dissatisfaction
No Yes
74 (55.6) 59 (44.4)
1
2.20 (1.19-4.05)
48.3 (40.7-55.9) 67.7 (57.7-77.7)
19.4 aPost regression tests: Hosmer Lemeshow chi
2 P-value group (8) =0.34; group (10)=0.09; group (12)=0.33; ROC curve=70.4%.
bAdjusted ORs of significant risk factors.
cDifference in predicted prevalences of associated level/s of explanatory variables and relevant reference groups.
*Explanatory variables associated with upper limb pain with their respective predicted prevalences in the final model.
It is quite surprising that the predicted prevalence of upper limb pain decreased by
3.1% in the nurses who are in the “obese” BMI group versus those in the “normal”
BMI group. Multiple comparisons are a likely explanation.
4.4.1.13 Partial and full models of knee pain in the past 12 months in the
South African public hospital nurses
The partial and full models of knee pain are presented in Table 4.17. They contain
explanatory variables with ORs demonstrating associations with knee pain. The
variables that were positively associated with knee pain were past injuries, financial
difficulties, frightening situation, somatising tendency (two or more symptoms),
working under time pressure and job dissatisfaction. Ethnic group (Nguni) was
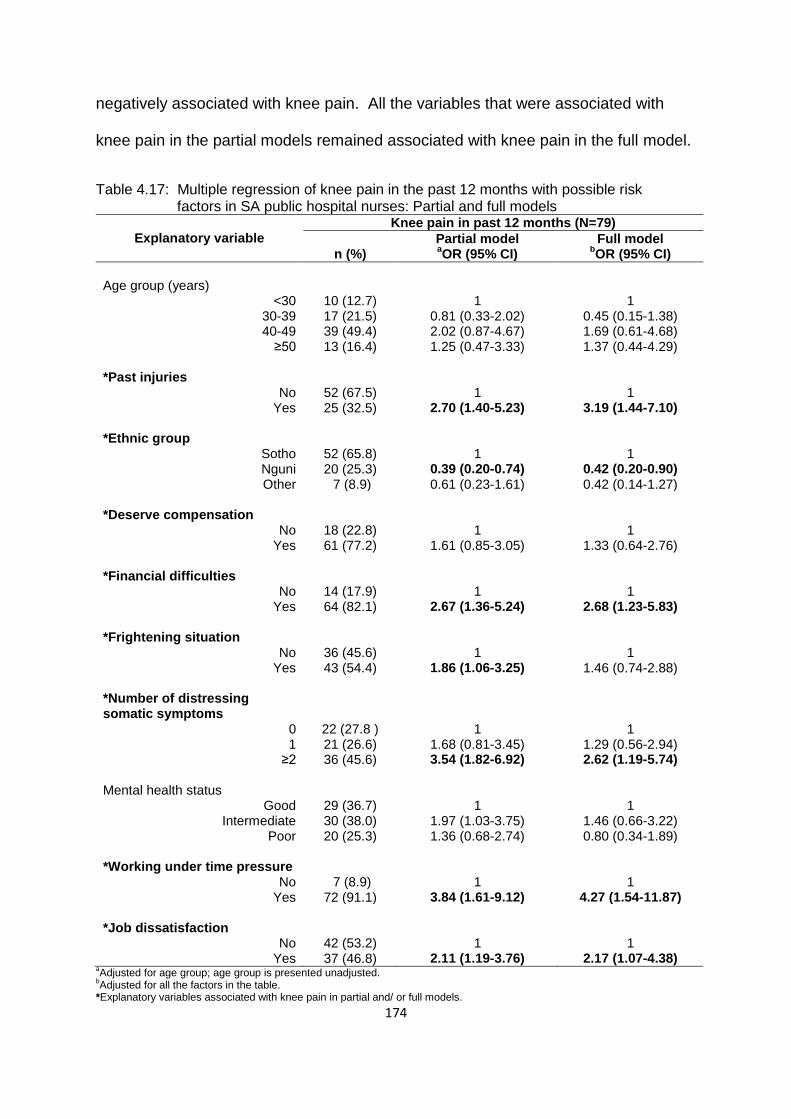
174
negatively associated with knee pain. All the variables that were associated with
knee pain in the partial models remained associated with knee pain in the full model.
Table 4.17: Multiple regression of knee pain in the past 12 months with possible risk factors in SA public hospital nurses: Partial and full models
Explanatory variable
Knee pain in past 12 months (N=79)
n (%)
Partial model Full model aOR (95% CI)
bOR (95% CI)
Age group (years)
<30 30-39 40-49
≥50
10 (12.7) 17 (21.5) 39 (49.4) 13 (16.4)
1
0.81 (0.33-2.02) 2.02 (0.87-4.67) 1.25 (0.47-3.33)
1
0.45 (0.15-1.38) 1.69 (0.61-4.68) 1.37 (0.44-4.29)
*Past injuries
No Yes
52 (67.5) 25 (32.5)
1
2.70 (1.40-5.23)
1
3.19 (1.44-7.10) *Ethnic group
Sotho Nguni Other
52 (65.8) 20 (25.3) 7 (8.9)
1
0.39 (0.20-0.74) 0.61 (0.23-1.61)
1
0.42 (0.20-0.90) 0.42 (0.14-1.27)
*Deserve compensation
No Yes
18 (22.8) 61 (77.2)
1
1.61 (0.85-3.05)
1
1.33 (0.64-2.76) *Financial difficulties
No Yes
14 (17.9) 64 (82.1)
1
2.67 (1.36-5.24)
1
2.68 (1.23-5.83) *Frightening situation
No Yes
36 (45.6) 43 (54.4)
1
1.86 (1.06-3.25)
1
1.46 (0.74-2.88) *Number of distressing somatic symptoms
0 1
≥2
22 (27.8 ) 21 (26.6) 36 (45.6)
1
1.68 (0.81-3.45) 3.54 (1.82-6.92)
1
1.29 (0.56-2.94) 2.62 (1.19-5.74)
Mental health status
Good Intermediate
Poor
29 (36.7) 30 (38.0) 20 (25.3)
1
1.97 (1.03-3.75) 1.36 (0.68-2.74)
1
1.46 (0.66-3.22) 0.80 (0.34-1.89)
*Working under time pressure
No Yes
7 (8.9) 72 (91.1)
1
3.84 (1.61-9.12)
1
4.27 (1.54-11.87) *Job dissatisfaction
No Yes
42 (53.2) 37 (46.8)
1
2.11 (1.19-3.76)
1
2.17 (1.07-4.38) aAdjusted for age group; age group is presented unadjusted.
bAdjusted for all the factors in the table.
*Explanatory variables associated with knee pain in partial and/ or full models.

175
4.4.1.14 Final model and predicted prevalences of knee pain in the past
12 months in the South African public hospital nurses
The final model and predicted prevalences of knee pain are shown in Table 4.18.
Past injuries, financial difficulties, somatising tendency (two or more symptoms) and
working under time pressure were positively associated with knee pain. Job
Table 4.18: Multiple regression of knee pain in the past 12 months with possible risk factors and predicted prevalences in SA public hospital nurses: Final model
Explanatory variable
Knee pain in past 12 months (N=79)
n (%)
aFinal model Predicted prevalence
bOR (95% CI) % (95% CI)
c∆ (%)
Age group (years)
<30 30-39 40-49
≥50
10 (12.7) 17 (21.5) 39 (49.4) 13 (16.4)
1 0.41 (0.14-1.20) 1.32 (0.50-3.49) 1.19 (0.39-3.60)
19.4 (13.2-25.5) 24.3 (17.5-31.1) 38.7 (31.2-46.3) 41.1 (29.8-52.8)
21.7 *Past injuries
No Yes
52 (67.5) 25 32.5)
1
3.38 (1.61-7.09)
26.9 (21.2-32.8) 50.3 (38.2-62.3)
23.4 *Financial difficulties
No Yes
14 (17.9) 64 (82.1)
1
2.84 (1.34-6.05)
18.7 (12.3-25.1) 32.9 (28.2-37.5)
14.2 *Number of distressing somatic symptoms
0 1
≥2
22 (27.8) 21 (26.6) 36 (45.6)
1
1.42 (0.64-3.15) 2.80 (1.33-5.86)
21.4 (15.2-27.6) 28.4 (20.7-36.1) 35.2 (28.9-41.4)
13.8 *Working under time pressure
No Yes
7 (8.9) 72 (91.1)
1
4.22 (1.57-11.31)
13.3 (4.6-21.9) 31.0 (26.9-35.2)
17.7 Job dissatisfaction
d
No Yes
42 (53.2) 37 (46.8)
1
1.91 (0.99-3.65)
23.7 (19.1-28.4) 37.2 (30.6-43.7)
13.5 a
Post regression tests: Hosmer Lemeshow chi2 p-value group (8) =0.47; group (10)=0.50; group (12)=0.55; ROC curve
=78.4. b
Adjusted ORs of significant risk factors.
cDifference in predicted prevalences of associated level/s of explanatory variables and relevant reference groups.
dReturned to the model LR test=0.0429.
*Explanatory variables associated with knee pain with respective predicted prevalences in the final model.
dissatisfaction was returned to the final model because the p-value of the LR test
became significant when it was removed from the model.
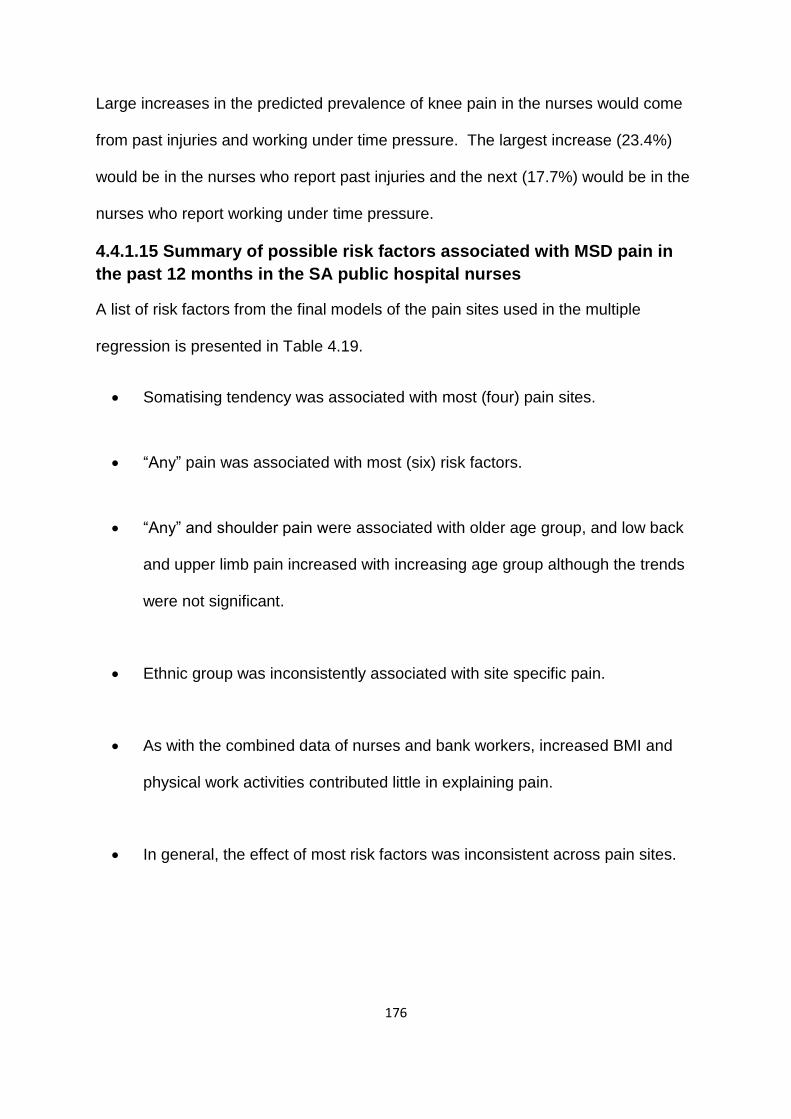
176
Large increases in the predicted prevalence of knee pain in the nurses would come
from past injuries and working under time pressure. The largest increase (23.4%)
would be in the nurses who report past injuries and the next (17.7%) would be in the
nurses who report working under time pressure.
4.4.1.15 Summary of possible risk factors associated with MSD pain in
the past 12 months in the SA public hospital nurses
A list of risk factors from the final models of the pain sites used in the multiple
regression is presented in Table 4.19.
Somatising tendency was associated with most (four) pain sites.
“Any” pain was associated with most (six) risk factors.
“Any” and shoulder pain were associated with older age group, and low back
and upper limb pain increased with increasing age group although the trends
were not significant.
Ethnic group was inconsistently associated with site specific pain.
As with the combined data of nurses and bank workers, increased BMI and
physical work activities contributed little in explaining pain.
In general, the effect of most risk factors was inconsistent across pain sites.
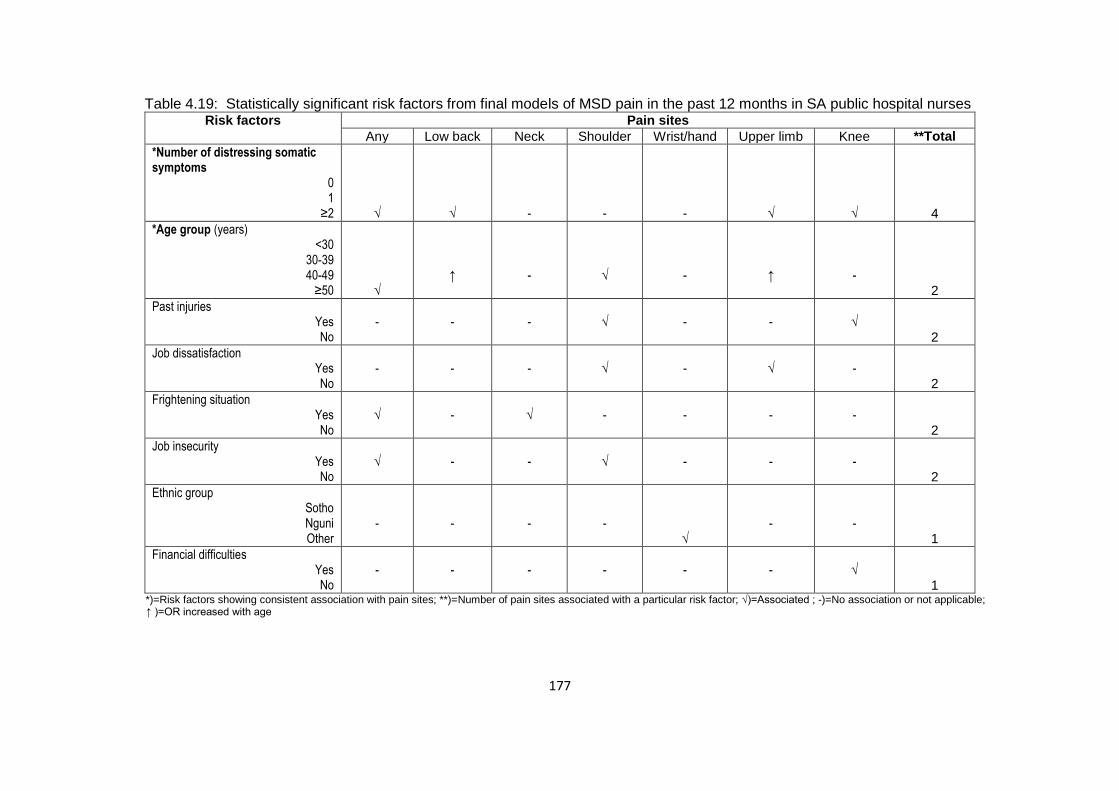
177
Table 4.19: Statistically significant risk factors from final models of MSD pain in the past 12 months in SA public hospital nurses Risk factors Pain sites
Any Low back Neck Shoulder Wrist/hand Upper limb Knee **Total
*Number of distressing somatic symptoms
0 1
≥2
√
√
-
-
-
√
√
4
*Age group (years) <30
30-39 40-49
≥50
√
↑
-
√
-
↑
-
2
Past injuries Yes No
-
-
-
√
-
-
√
2
Job dissatisfaction Yes No
-
-
-
√
-
√
-
2
Frightening situation Yes No
√
-
√
-
-
-
-
2
Job insecurity Yes No
√
-
-
√
-
-
-
2
Ethnic group Sotho Nguni Other
-
-
-
-
√
-
-
1
Financial difficulties Yes No
-
-
-
-
-
-
√
1
*)=Risk factors showing consistent association with pain sites; **)=Number of pain sites associated with a particular risk factor; √)=Associated ; -)=No association or not applicable; ↑ )=OR increased with age
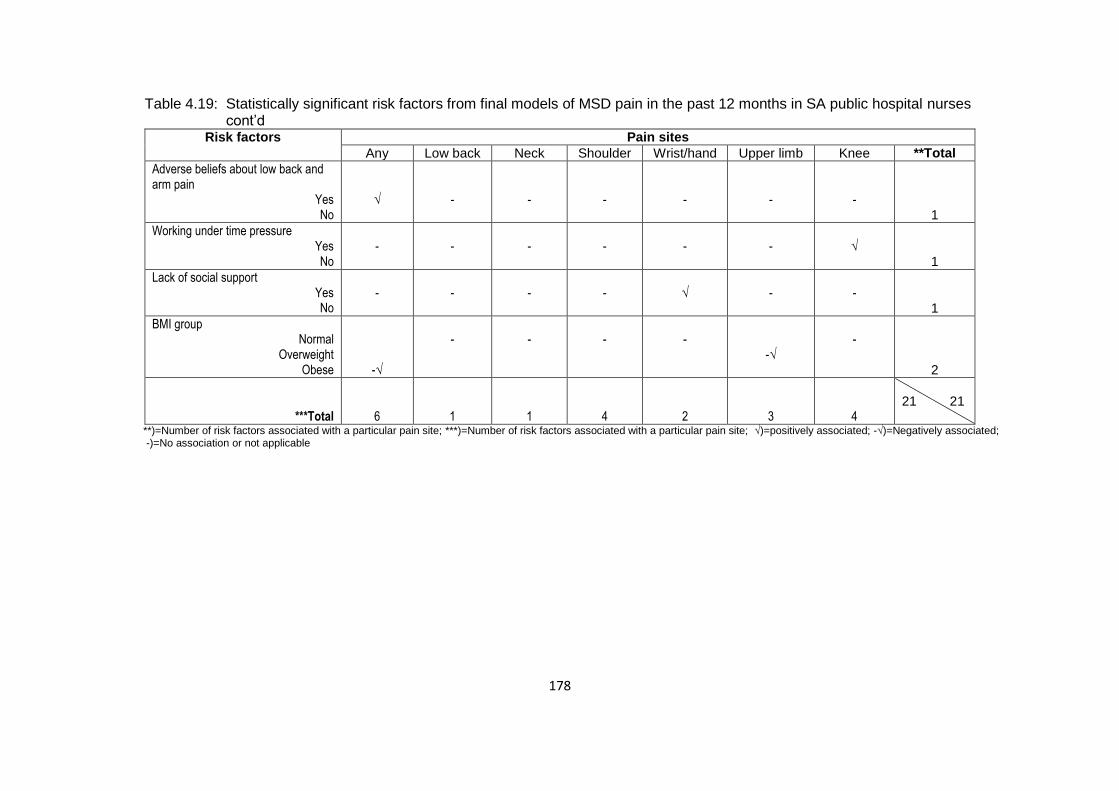
178
Table 4.19: Statistically significant risk factors from final models of MSD pain in the past 12 months in SA public hospital nurses cont’d
Risk factors Pain sites
Any Low back Neck Shoulder Wrist/hand Upper limb Knee **Total
Adverse beliefs about low back and arm pain
Yes No
√
-
-
-
-
-
-
1
Working under time pressure Yes No
-
-
-
-
-
-
√
1
Lack of social support Yes No
-
-
-
-
√
-
-
1
BMI group Normal
Overweight Obese
-√
-
-
-
-
-√
-
2
***Total
6
1
1
4
2
3
4
21 21
**)=Number of risk factors associated with a particular pain site; ***)=Number of risk factors associated with a particular pain site; √)=positively associated; -√)=Negatively associated; -)=No association or not applicable
179
Part 2: Follow-up study of the South African public hospital nurses
4.5 Introduction
After about a year, on average ± SD 12.2 ± 0.2 months, 189 nurses (75.3%) who
had participated in the baseline cross-sectional study were successfully re-
interviewed. In the following sub-sections, participation and response rates
according to baseline MSD risk factors and 1-month MSD prevalence, MSD
occurrence at the follow-up interview, and associated risk factors are summarised.
4.6 Participation and response rates according to baseline MSD risk
factors in the South African public hospital nurses
In the next subsection, participation and response rates at the follow-up interview are
presented based on MSD risk factors at baseline.
4.6.1 MSD risk factors
The nurses who completed the follow-up interview were very similar to those who
completed the baseline interview with respect to all of the MSD risk factors
considered in the study. Table 4.20 shows the similarity using physical and
psychosocial characteristics of the nurses. The similarities in psychological
characteristics, physical work conditions and psychosocial aspects of work are
presented in Appendix K.

180
Table 4.20: Participation and response rates according to individual physical and psycho- social characteristics of SA public hospital nurses at baseline
Individual
characteristic
Participation Response rate
Baseline (N=251) Follow-up (N=189)
n (%) n (%) %
Physical Sex
Men Women
Total
9 (3.5) 242 (96.4)
251 (100.0)
6 (3.2) 183 (96.8)
189 (100.0)
66.7 75.6 75.3
Age group (years)
<30 30-39 40-49
≥50 Total
40 (15.9) 78 (31.1) 92 (36.6) 41 (16.3)
251 (100.0)
28 (14.8) 55 (29.1) 71 (37.4) 35 (18.5)
189 (100.0)
70.0 70.5 77.2 85.4 75.3
BMI group
Normal Overweight
Obese Total
69 (31.4) 72 (32.7) 79 (35.9)
220 (100.0)
49 (29.2) 57 (33.9) 62 (36.9)
168 (100.0)
71.0 79.1 78.5 76.4
Past injuries
Yes No
Total
56 (22.5) 193 (77.5)
249 (100.0)
44 (23.3) 143 (76.5)
187 (100.0)
78.6 74.1 75.1
Psychosocial
Ethnic group
Sothoa
Ngunib
Otherc
Total
139 (55.4) 87 (34.6) 25 (10.0)
251 (100.0)
106 (56.1) 64 (33.9) 19 (10.1)
189 (100.0)
76.3 73.6 76.0 75.3
Educational level
High school Tertiary
Total
16 (6.4) 235 (93.6)
251 (100.0)
12 (6.4) 177 (93.6)
189 (100.0)
75.0 75.3 75.3
Smoking status
Never-smoked Ever-smoked
Total
233 (92.8) 18 (7.2)
251 (100.0)
177 (93.6) 12 (6.4)
189 (100.0)
75.9 66.7 75.3
aConsists of Pedi, Tswana and Sotho.
bConsists of Xhosa and Zulu.
cConsists of Afrikaner, Coloured, Indian Tsonga and Venda.
4.7 Participation and response rates according to 1-month MSD
prevalence at baseline in the South African public hospital nurses
The comparison of the participation of nurses at baseline and follow-up interviews
regarding the prevalence of site specific MSD pain during the 1-month prior to

181
baseline appears in Table 4.21. The results indicate that there were very small
differences in the participation and response rates of nurses at baseline and follow-
up interviews based on 1-month MSD prevalence at baseline. Thus, having MSD
pain at baseline did not influence follow-up participation.
Table 4.21: Participation and response rate according to 1-month MSD prevalence of SA public hospital nurses at baseline
Pain site
1-month MSD prevalence
Baseline (N=251) Follow-up (N=189) Response rate
n (%) n (%) %
“Any”
Yes No
Total
144 (57.60) 106 (42.40) 250 (100.0)
105 (55.85) 83 (44.15) 188 (100.0)
72.9 78.3 75.2
Low back
Yes No
Total
89 (35.46) 162 (64.54) 251 (100.0)
64 (32.86) 125 (66.14) 188 (100.0)
71.9 77.2 74.9
Neck
Yes No
Total
52 (20.80) 198 (79.20) 250 (100.0)
39 (20.74) 149 (79.26) 188 (100.0)
75.0 75.3 75.2
Shoulder
Yes No
Total
57 (22.71) 194 (77.29) 251 (100.0)
41 (21.69) 148 (78.31) 189 (100.0)
71.9 76.3 75.3
Elbow
Yes No
Total
14 (5.58) 237 (94.28) 251 (100.0)
11 (5.82) 178 (9418) 189 (100.0)
78.6 75.1 75.3
Wrist/hand
Yes No
Total
35 (13.94) 216 (86.06) 251(100.0)
26 (13.76) 163 (86.24) 189 (100.0)
74.3 75.5 75.3
Upper limb Yes No
Total
76 (30.28) 175 (69.72) 251 (100.0)
56 (29.63) 133 (70.37) 189 (100.0)
73.7 76.0 75.3
Knee Yes No
Total
53 (21.12) 198 (78.88) 251 (100.0)
43 (22.75) 146 (77.25) 189 (100.0)
81.1 73.7 75.3

182
4.8 Occurrence of MSDs at follow-up interview in the South African
public hospital nurses
At the follow-up interview, the nurses were asked about site specific pain in the
month before the follow-up interview. Their responses provided the 1-month
prevalence of pain. This prevalence was compared with the 1-month prevalence of
pain obtained at the baseline (Table 4.22).
Table 4.22: 1-month MSD prevalence in SA public hospital nurses at baseline and follow-up interviews (N=189)
Pain site Baseline interview Follow-up interview McNemar test p-value n % n %
“Any”
Yes No
Total
105 83 188
55.8 44.2
100.0
122 59 181
67.4 32.6
100.0
0.002 Low back
Yes No
Total
64 125 189
33.9 66.1
100.0
78 111 189
41.3 58.7
100.0
0.08 Neck
Yes No
Total
39 149 188
20.7 79.3
100.0
52 137 189
27.5 72.5
100.0
0.07 Shoulder
Yes No
Total
41 148 189
21.7 78.3
100.0
54 134 188
28.7 71.3
100.0
0.09 Elbow
Yes No
Total
11 178 189
5.8 94.2
100.0
19 168 187
10.2 89.8
100.0
0.08 Wrist/hand
Yes No
Total
26 163 189
13.8 86.2
100.0
38 148 186
20.4 79.6
100.0
0.03 Upper limb
Yes No
Total
56 133 189
29.6 70.4
100.0
76 110 186
40.9 59.1
100.0
0.009 Knee
Yes No
Total
43 146 189
22.8 77.2
100.0
57 128 185
30.8 69.2
100.0
0.01

183
It was observed that all the 1-month MSD prevalences at the follow-up interview
were higher than those at baseline. The differences of wrist or hand, upper limb,
knee and “any” pain were statistically significant. It is important to note that none of
the nurses who participated at the follow-up interview had changed their jobs
because of MSD pain.
4.8.1 Incident and persistent MSD pain in the South African public
hospital nurses at follow-up interview
The results from the 1-month prevalence of pain at baseline and follow-up interview
were used to determine incident (new onset) and persistent pain at follow-up
interview. Eighty three nurses had had no pain at baseline (that is in the 1-month
before the baseline) and were thus eligible for the development of incident pain in
the 1-month prior to follow-up interview.
One hundred and five nurses had had pain at the baseline interview. These nurses
were eligible for the development of persistent pain in the 1-month before the follow-
up interview.
4.8.2 Incident MSD pain in the South African public hospital nurses
The occurrence of incident pain in the nurses is shown in Figure 4.6. Nearly half
(47.6% (39/82)) of the nurses who did not have pain during the 1-month prior to
baseline, developed pain in the 1-month before the follow-up interview. Incident low
back pain had the highest occurrence (32.8% (41/125)) and incident elbow pain had
the lowest (8.5% (15/176)).
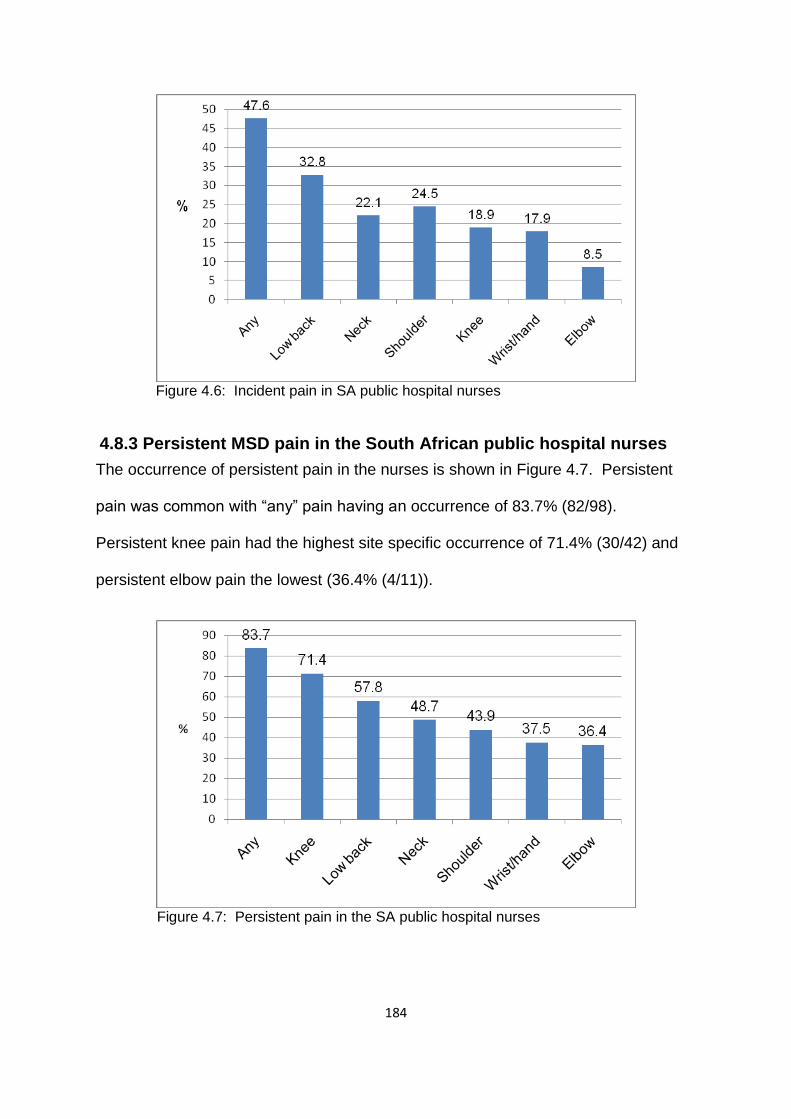
184
Figure 4.6: Incident pain in SA public hospital nurses
4.8.3 Persistent MSD pain in the South African public hospital nurses
The occurrence of persistent pain in the nurses is shown in Figure 4.7. Persistent
pain was common with “any” pain having an occurrence of 83.7% (82/98).
Persistent knee pain had the highest site specific occurrence of 71.4% (30/42) and
persistent elbow pain the lowest (36.4% (4/11)).
Figure 4.7: Persistent pain in the SA public hospital nurses

185
4.9 Risk factors associated with MSDs at follow-up interview in the
South African public hospital nurses
The information presented in 4.4 applies here. The MSDs of interest at follow-up
interview were incident and persistent pain. Multiple regression analysis was done
to investigate the relationship between MSD risk factors and MSDs in the nurses.
4.9.1 Multiple regression of incident and persistent pain with possible
risk factors in the South African public hospital nurses
Multiple regression analysis in the form of binary logistic regression was carried out
for persistent “any” pain only. For persistent site specific and all incident pain, the
number of events was not sufficient for the selected explanatory variables. The
results of multiple regression analysis of persistent “any” pain have been
summarised in tables of partial, full and final models. The tables show variables that
satisfied the selection criterion of p≤0.2 for the full model. All the variables that were
tested for the full model appear in Appendix L.
4.9.1.1 Partial and full models of persistent “any” pain in the South
African public hospital nurses
The partial and full models are presented with ORs showing positive relationships
with persistent “any” pain in Table 4.23. Somatising tendency (two or more
symptoms) was the only variable that was positively associated with persistent “any”
pain in the partial models and full models.
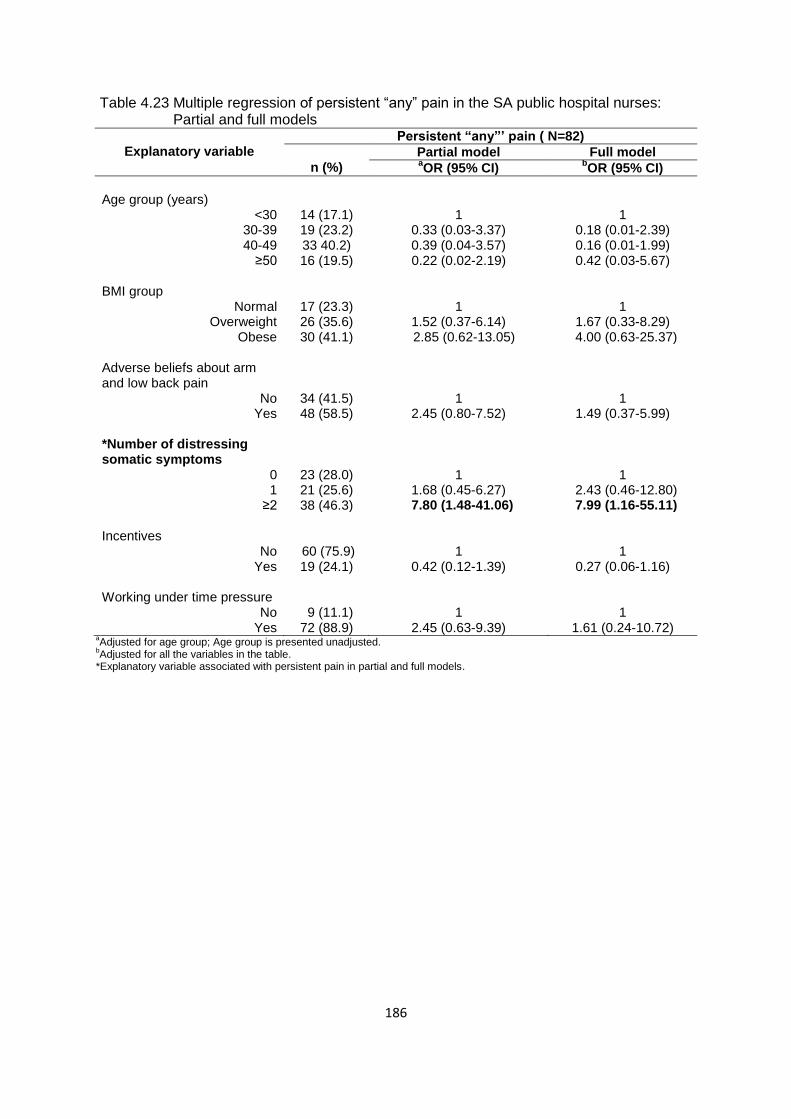
186
Table 4.23 Multiple regression of persistent “any” pain in the SA public hospital nurses: Partial and full models
Explanatory variable
Persistent “any”’ pain ( N=82)
n (%)
Partial model Full model aOR (95% CI)
bOR (95% CI)
Age group (years)
<30 30-39 40-49
≥50
14 (17.1) 19 (23.2) 33 40.2) 16 (19.5)
1
0.33 (0.03-3.37) 0.39 (0.04-3.57) 0.22 (0.02-2.19)
1
0.18 (0.01-2.39) 0.16 (0.01-1.99) 0.42 (0.03-5.67)
BMI group
Normal Overweight
Obese
17 (23.3) 26 (35.6) 30 (41.1)
1
1.52 (0.37-6.14) 2.85 (0.62-13.05)
1
1.67 (0.33-8.29) 4.00 (0.63-25.37)
Adverse beliefs about arm and low back pain
No Yes
34 (41.5) 48 (58.5)
1
2.45 (0.80-7.52)
1
1.49 (0.37-5.99) *Number of distressing somatic symptoms
0 1
≥2
23 (28.0) 21 (25.6) 38 (46.3)
1
1.68 (0.45-6.27) 7.80 (1.48-41.06)
1
2.43 (0.46-12.80) 7.99 (1.16-55.11)
Incentives
No Yes
60 (75.9) 19 (24.1)
1
0.42 (0.12-1.39)
1
0.27 (0.06-1.16) Working under time pressure
No Yes
9 (11.1) 72 (88.9)
1
2.45 (0.63-9.39)
1
1.61 (0.24-10.72) aAdjusted for age group; Age group is presented unadjusted.
bAdjusted for all the variables in the table.
*Explanatory variable associated with persistent pain in partial and full models.

187
4.9.1.3 Final model and predicted prevalences of persistent “any” pain in
the South African public hospital nurses
The final model of persistent “any” pain and predicted prevalences appear in Table
4.24. Somatising tendency (two or more symptoms) remained positively associated
with persistent “any” pain in the final model. The predicted prevalence of
Table 4.24: Multiple regression of persistent “any” pain with possible risk factors and predicted prevalences in the SA public hospital nurses: Final model
Explanatory variable
Persistent “any”pain (N=82)
n (%)
aFinal model Predicted prevalence
bOR (95% CI) % (95% CI)
c∆ (%)
Age group (years)
<30 30-39 40-49
≥50
14 (17.1) 19 (23.2) 33 (40.2) 16 (19.5)
1
0.27 (0.02-3.12) 0.36 (0.03-3.61) 0.55 (0.04-6.41)
94.0 (82.8-105.2) 78.2 (59.9-96.6) 82.5 (70.2-94.7) 81.4 (66.9-95.8)
-12.6 *Number of distressing somatic symptoms
0 1
≥2
23 (28.0) 21 (25.6) 38 (46.3)
1
1.86 (0.45-7.68) 7.32 (1.34-39.88)
71.3 (55.3-87.4) 79.2 (62.9-95.6)
95.1 (88.5-101.8)
23.8
aPost regression tests: Pearson Chi
2 -pvalue =0.90; ROC curve =71.8%.
bAdjusted ORs of significant risk factors.
cDifference in predicted prevalences of associated level/s of explanatory variables and relevant reference groups.
*Explanatory variable associated with persistent pain with respective predictive prevalence in the final model.
somatising tendency would increase the prevalence of persistent “any” pain in
nurses reporting two or more distressing somatic symptoms compared to those not
reporting symptoms.

188
Chapter 5: Cross-sectional study of the South African bank workers
5.1 Introduction
The cross-sectional study included 236 bank workers who were working in one of
South Africa’s big banks. In this chapter, the description of the bank workers’
exposure to MSD risk factors, the occurrence of MSDs and identification of possible
risk factors associated with MSDs are presented.
5.2 Description of the South African bank workers
The bank workers were working in open plan computerised office environment. Fifty
point eight percent of the participating bank workers were from HLC while 49.2%
were from CCC. They worked an average of 44 hours per week.
The information they provided on MSD risk factors is divided into individual
characteristics and workplace conditions. The individual characteristics cover
physical, psychosocial and psychological characteristics. Workplace conditions
include physical workplace activities and psychosocial aspects of work.
5.2.1 Individual physical and psychosocial characteristics
The distributions of the physical and psychosocial characteristics are shown in Table
5.1. Just over two thirds (67.8%) of the workers were women. The mean BMI ± SD
was 20.1 ± 6.0 and BMI ranged from 15-44. BMI distribution had nearly equal
percentages in the overweight (30.0%) and obese (29.0%) groups. The mean age ±
SD was 33.2 ± 9.6 years. The youngest worker was 19 years and the oldest 58
years. A large percentage of bank workers (43.9%) was younger than 30 years.
Close to half (44.3%) had tertiary education and 46.4% belonged to the “other”
ethnic group.
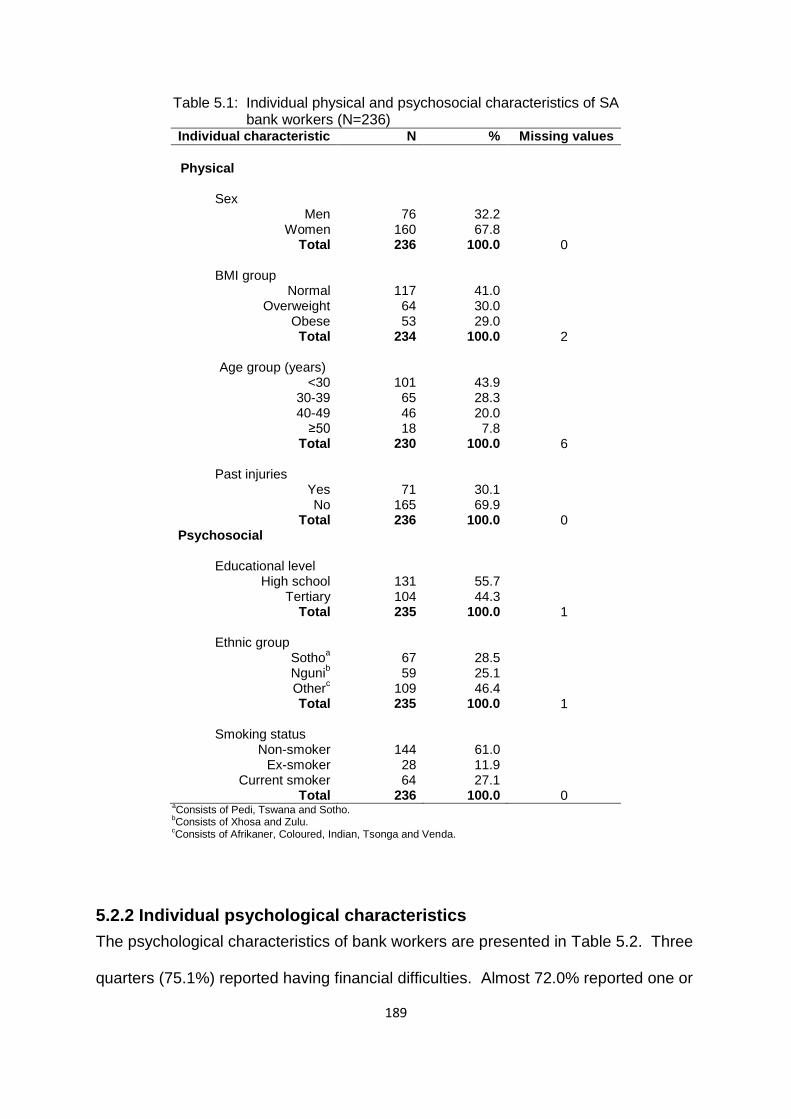
189
Table 5.1: Individual physical and psychosocial characteristics of SA bank workers (N=236)
Individual characteristic N % Missing values
Physical
Sex
Men Women
Total
76
160 236
32.2 67.8
100.0
0
BMI group
Normal Overweight
Obese Total
117 64 53
234
41.0 30.0 29.0
100.0
2
Age group (years)
<30 30-39 40-49
≥50 Total
101 65 46 18
230
43.9 28.3 20.0 7.8
100.0
6
Past injuries
Yes No
Total
71 165 236
30.1 69.9
100.0
0 Psychosocial
Educational level High school
Tertiary Total
131 104 235
55.7 44.3
100.0
1 Ethnic group
Sothoa
Ngunib
Otherc
Total
67 59
109 235
28.5 25.1 46.4
100.0
1
Smoking status Non-smoker
Ex-smoker Current smoker
Total
144 28 64
236
61.0 11.9 27.1
100.0
0 a
Consists of Pedi, Tswana and Sotho. b
Consists of Xhosa and Zulu. c
Consists of Afrikaner, Coloured, Indian, Tsonga and Venda.
5.2.2 Individual psychological characteristics
The psychological characteristics of bank workers are presented in Table 5.2. Three
quarters (75.1%) reported having financial difficulties. Almost 72.0% reported one or

190
more distressing somatic symptoms, half (50.0%) had experienced a frightening
situation and 27.5% believed that low back and arm pain is caused by work.
Table 5.2: Individual psychological characteristics of SA bank workers (N=236)
Individual psychological characteristic
N
%
Missing values
Financial difficulties
a
Yes No
Total
175 58
233
75.1 24.9
100.0
3 Number of distressing somatic symptoms
b
0 1
2+ Total
66 51
117 234
28.2 21.8
50.0 100.0
2 Deserve compensation
c
Yes No
Total
127 100 227
44.1 55.9
100.0
9 Frightening situation
d
Yes No
Total
116 116 232
50.0 50.0
100.0
4 a
Being in financial difficulties-slight or big problem. b
Number of at least moderately distressing somatic symptoms in the past seven days from a total of seven. c
People with musculoskeletal disorders deserve compensation. d
Being in a frightening situation-slight or big problem.

191
Table 5.2: Individual psychological characteristics of SA bank workers (N=236) cont’d
Individual psychological characteristic
N
%
Missing values
Adverse belief about pain
e
Low back and arm
Yes No
Total
Arm Yes No
Total
Low back Yes
No Total
65 171 236
57 179 236
52 184 236
27.5 72.5
100.0
24.2 75.8
100.0
22.0 78.0
100.0
0
0
0
Mental health statusf
Good Intermediate
Poor Total
64 66
106 236
27.1 28.0 44.9
100.0
0
eBelief that low back and /or arm pain is caused by work.
fClassified into three levels corresponding to approximate thirds of the observed distribution of
scores in the study sample.
5.2.3 Physical workplace activities
The bank workers reported on physically demanding work activities in their jobs on
an average day. Their responses are presented in Table 5.3. As expected, all of
them reported the use of a keyboard for more than 4 hours. Other physically
demanding work activities reported by most of them, involved repeated elbow
bending for more than an hour (79.5%) and repeated wrist or finger movement for
more than four hours (78.8%). The least commonly reported work activities were
lifting ≥ 25 kg of loads by hand (4.7%) and kneeling or squatting for more than an
hour (1.3%).

192
Table 5.3: Physically demanding work activities on an average day in the jobs of SA bank workers (N=236)
Physical work activity N % Missing values
Use of keyboard >4 hours
Yes No
Total
236 0
236
100 0
100.0
0 Repeated elbow bending >1 hour*
Yes No
Total
186 48
234
79.5 20.5
100.0
2 Repeated wrist/finger movement >4 hours*
Yes No
Total
183 49
232
78.8 21.1
100.0
4
Upper limb loada
Yes No
Total
164 65
229
71.6 28.4
100.0
7
Working with hands above shoulder height >1 hour*
Yes No
Total
62 171 233
26.6 73.4
100.0
3
Physical loadb
Yes No
Total
56 172 228
24.6 75.4
100.0
8
Lifting ≥25 kg loads by hand**
Yes No
Total
11 224 235
4.7 95.3
100.0
1
Kneeling or squatting >1 hour** Yes No
Total
3 232 235
1.3 98.7
100.0
1
aReports of any two or more of the variables marked with 1 asterisk.
bReports of any three or more of the variables marked with 1 and 2 asterisks.

193
5.2.4 Psychosocial aspects of work
Psychosocial work conditions that were perceived to be stressful by the bank
workers appear in Table 5.4. Most of them (83.1%) felt that they were working under
Table 5.4: Stressful psychosocial work conditions in the jobs of SA bank workers (N=236)
Psychosocial work condition
N
%
Missing values
Working under time pressurea
Yes No
Total
196 40
236
83.1 16.9
100.0
0
Job insecurityb
Yes No
Total
156 79
235
66.4 33.6
100.0
1
Incentivesc
Yes No
Total
121 110 231
52.4 47.6
100.0
5
Job dissatisfactiond
Yes No
Total
99 135 234
42.3 57.7
100.0
2
Lack of controle
Yes No
Total
89 145 234
38.0 62.0
100.0
2
Lack of social supportf
Yes No
Total
47 184 231
20.4 79.6
100.0
5
aA target amount of work or a number of articles done or finished in a day or working under pressure
to complete tasks by a fixed time. b
Feel that job would be insecure or very insecure if off work for three months due to serious illness. c
Piecework or payment of a bonus if an agreed number of tasks are finished in a day. d
Very dissatisfied or dissatisfied about the job taking everything into consideration. e
Choice in all of; how work is done; what is done at work; and work time table and break times-seldom or never. f
Assistance or support from colleagues or supervisors-seldom or never.
time pressure and nearly two thirds (66.4) felt that their jobs would be insecure if
they were to be away from work for three months due to illness. Just over half
(52.4%) were receiving incentives and 42.3% were dissatisfied with their jobs.
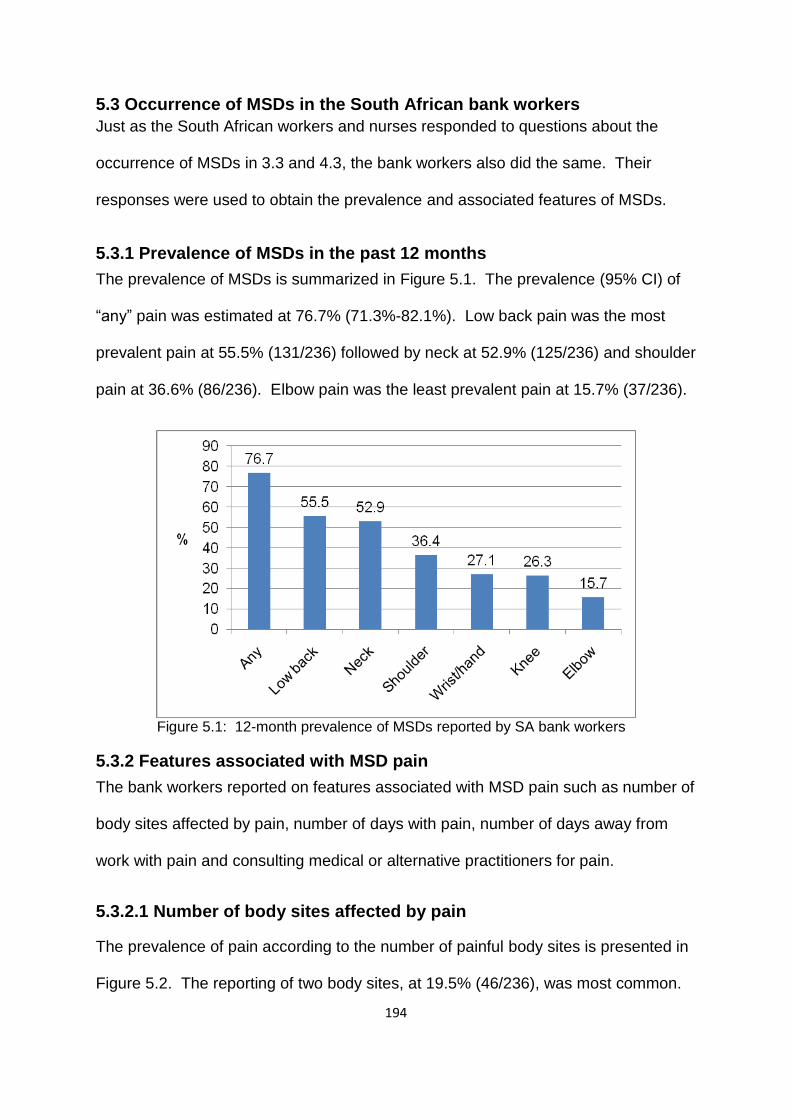
194
5.3 Occurrence of MSDs in the South African bank workers
Just as the South African workers and nurses responded to questions about the
occurrence of MSDs in 3.3 and 4.3, the bank workers also did the same. Their
responses were used to obtain the prevalence and associated features of MSDs.
5.3.1 Prevalence of MSDs in the past 12 months
The prevalence of MSDs is summarized in Figure 5.1. The prevalence (95% CI) of
“any” pain was estimated at 76.7% (71.3%-82.1%). Low back pain was the most
prevalent pain at 55.5% (131/236) followed by neck at 52.9% (125/236) and shoulder
pain at 36.6% (86/236). Elbow pain was the least prevalent pain at 15.7% (37/236).
Figure 5.1: 12-month prevalence of MSDs reported by SA bank workers
5.3.2 Features associated with MSD pain
The bank workers reported on features associated with MSD pain such as number of
body sites affected by pain, number of days with pain, number of days away from
work with pain and consulting medical or alternative practitioners for pain.
5.3.2.1 Number of body sites affected by pain
The prevalence of pain according to the number of painful body sites is presented in
Figure 5.2. The reporting of two body sites, at 19.5% (46/236), was most common.

195
The next common was three body sites at 18.2% (43/236) and one body site at
16.9% (40/236). The prevalence (95% CI) of multi-site pain was 40.2% (33.9%-
46.6%).
Figure 5.2: Number of painful body sites reported by SA bank workers
5.3.2.2 Number of days with pain
The number of days for which bank workers reported pain is depicted in Figure 5.3.
Pain lasting for more than six days had the largest percentages in all the pain sites
except wrists or hands which had the smallest percentage of 8.1% (19/236). Low
back had the largest percentage of 33.9% (80/236) followed by neck (29.7%
(70/236)) and shoulder (22.5% (53/236)). The pattern of the other time periods: 1-6
days; 1-4 weeks; and 1-12 months was similar in all the pain sites except wrists or
hands. In all the other pain sites 1-6 days had the largest percentage followed by 1-
4 weeks and 1-12 months.

196
Figure 5.3: Number of days with pain reported by SA bank workers
5.3.2.3 Number of days away from work with pain
The responses of the bank workers about the number of days they had been away
from work due to the pain are summarized in Figure 5.4. The figure clearly shows
that 1-5 days had the largest percentage of bank workers who stayed away from
work due to pain in all the pain sites. Twenty two point nine percent (54/236) stayed
away from work because of low back pain; 19.9% (47/236) because of neck and
2.5% (21/236) because of wrist or hand pain.
The number that had been away from work because of “any” pain in the past 12
months was 38.1% (88/232). Of these, 27.6% (64/232) had taken 1-5 days, 8.6%
(20/232) had taken 6-30 days and 1.7% (4/232) had taken more than 30 days of sick
leave. A conservative estimate of the total number of days away from work due to
pain in the past 12 months was 448 days. This is an average of 1.9 days per worker
per year.

197
Figure 5.4: Number of days away from work reported by SA bank workers
5.3.2.4 Consultation with healthcare providers for pain
The percentages of bank workers who responded to the question about consulting
medical or alternative practitioners for pain are shown in Figure 5.5. Just over half
(51.4% (93/181)) of those who reported pain consulted for the pain. The percentage
of the bank workers who had consulted for neck pain (49.6%) exceeded those who
Figure 5.5: Consultation for pain in different body sites reported by SA bank workers
198
had consulted for low back pain (48.1%). The lowest percentage consulted for wrist
or hand pain (25.0%).
5.4 Risk factors associated with MSDs in the past 12 months in the
South African bank workers
The information provided in 3.4 still applies here with the exception of occupational
group. It was excluded from the analyses as data were from one occupational group
(bank workers). Multiple regression analysis was performed to establish if there is
an association between MSD risk factors and MSDs in the South African bank
workers.
5.4.1 Multiple regression of MSD pain with possible risk factors in the
South African bank workers
Binary logistic regression was used for partial, full and final models. They are
presented in tables summarizing the results of multiple regression analysis of “any”,
low back, neck, shoulder, wrist or hand, upper limb and knee pain. Elbow pain was
excluded from the analyses as there were not sufficient numbers of events for the
selected explanatory variables. The tables show variables that satisfied the
selection criterion for the full model (p≤0.2). The categories ex-smoker and current
smoker were combined because of small numbers. Appendix M (table for ‘any” pain)
shows all the variables tested for the full model.
5.4.1.1 Partial and full models of “any” pain in the past 12 months in the
South African bank workers
The partial and full models of “any” pain list explanatory variables with ORs showing
associations with “any” pain. The models are shown in Table 5.5. The partial
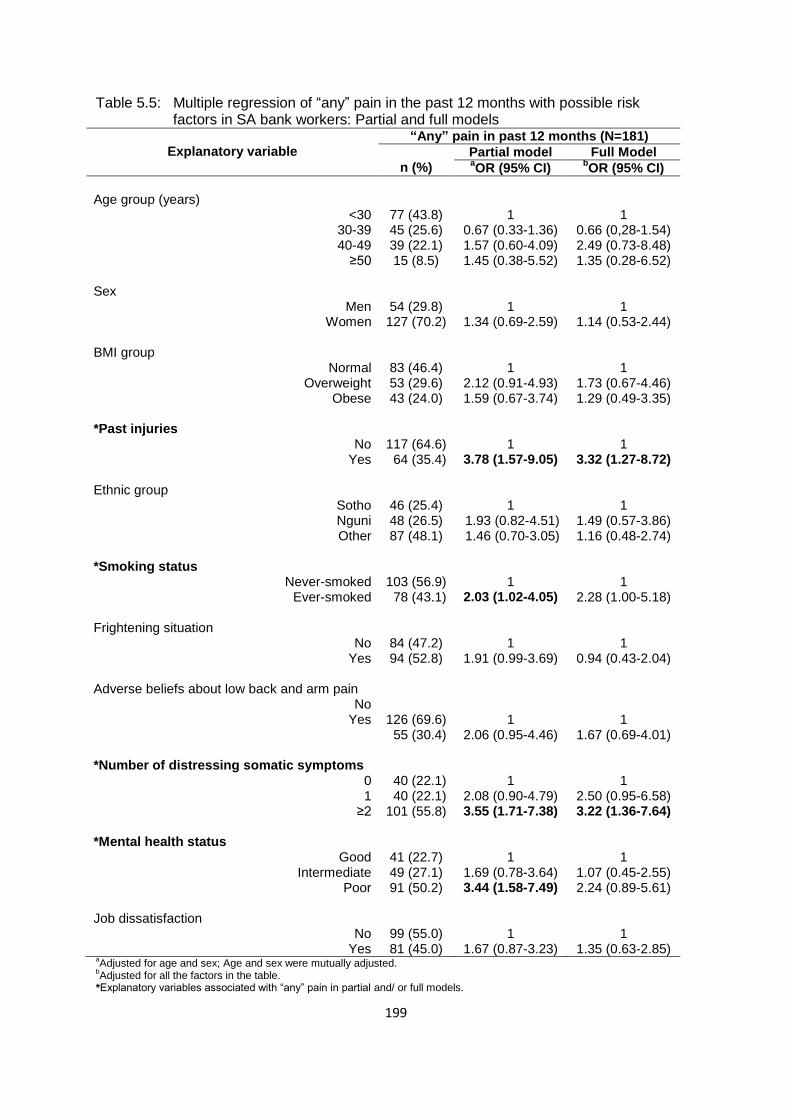
199
Table 5.5: Multiple regression of “any” pain in the past 12 months with possible risk factors in SA bank workers: Partial and full models
Explanatory variable
“Any” pain in past 12 months (N=181)
n (%)
Partial model Full Model aOR (95% CI)
bOR (95% CI)
Age group (years)
<30 30-39 40-49
≥50
77 (43.8) 45 (25.6) 39 (22.1) 15 (8.5)
1
0.67 (0.33-1.36) 1.57 (0.60-4.09) 1.45 (0.38-5.52)
1
0.66 (0,28-1.54) 2.49 (0.73-8.48) 1.35 (0.28-6.52)
Sex
Men Women
54 (29.8) 127 (70.2)
1
1.34 (0.69-2.59)
1
1.14 (0.53-2.44) BMI group
Normal Overweight
Obese
83 (46.4) 53 (29.6) 43 (24.0)
1
2.12 (0.91-4.93) 1.59 (0.67-3.74)
1
1.73 (0.67-4.46) 1.29 (0.49-3.35)
*Past injuries
No Yes
117 (64.6) 64 (35.4)
1
3.78 (1.57-9.05)
1
3.32 (1.27-8.72) Ethnic group
Sotho Nguni Other
46 (25.4) 48 (26.5) 87 (48.1)
1
1.93 (0.82-4.51) 1.46 (0.70-3.05)
1
1.49 (0.57-3.86) 1.16 (0.48-2.74)
*Smoking status
Never-smoked Ever-smoked
103 (56.9) 78 (43.1)
1
2.03 (1.02-4.05)
1
2.28 (1.00-5.18) Frightening situation
No Yes
84 (47.2) 94 (52.8)
1
1.91 (0.99-3.69)
1
0.94 (0.43-2.04) Adverse beliefs about low back and arm pain
No Yes
126 (69.6) 55 (30.4)
1
2.06 (0.95-4.46)
1
1.67 (0.69-4.01) *Number of distressing somatic symptoms
0 1
≥2
40 (22.1) 40 (22.1) 101 (55.8)
1
2.08 (0.90-4.79) 3.55 (1.71-7.38)
1
2.50 (0.95-6.58) 3.22 (1.36-7.64)
*Mental health status
Good Intermediate
Poor
41 (22.7) 49 (27.1) 91 (50.2)
1
1.69 (0.78-3.64) 3.44 (1.58-7.49)
1
1.07 (0.45-2.55) 2.24 (0.89-5.61)
Job dissatisfaction
No Yes
99 (55.0) 81 (45.0)
1
1.67 (0.87-3.23)
1
1.35 (0.63-2.85) aAdjusted for age and sex; Age and sex were mutually adjusted.
bAdjusted for all the factors in the table.
*Explanatory variables associated with “any” pain in partial and/ or full models.

200
models showed past injuries, smoking status (ever-smoked), somatising tendency
(two or more symptoms) and mental health status (poor) to be positively associated
with “any” pain. In the full model, past injuries and somatising tendency (two or more
symptoms) remained positively associated with “any” pain.
5.4.1.2 Final model and predicted prevalences of “any” pain in the past
12 months in the South African bank workers
The final model and predicted prevalences of “any” pain (Table 5.6) contains
statistically significant explanatory variables having ORs associated with “any” pain.
Table 5.6: Multiple regression of “any” pain in the past 12 months with possible risk factors and predicted prevalences in SA bank workers: Final models
Explanatory variable
“Any” pain in past 12 months (N=181)
n (%)
aFinal model Predicted prevalence
bOR (95% CI) % (95% CI)
c∆ (%)
Age group (years)
<30 30-39 40-49
≥50
77 (43.8) 45 (25.6) 39 (22.1)
15 (8.5)
1
0.71 (0.32-1.58) 2.55 (0.80-8.11) 1.66 (0.39-7.02)
77.3 (70.4-84.2) 76.9 (70.3-83.4) 84.1 (78.0-90.1) 87.3 (79.3-95.3)
10 Sex
Men Women
54 (29.8) 127 (70.2)
1
1.17 (0.55-2.48)
72.4 (64.7-82.1) 81.9 (78.4-85.6)
9.5 *Past injuries
No Yes
117 (64.6) 64 (35.4)
1
3.45 (1.37-8.68)
77.1 (72.9-81.3) 90.5 (85.2-95.8)
13.4 Smoking status
d
Never-smoked Ever-smoked
103 (56.9) 78 (43.1)
1
2.16 (0.99-4.73)
79.0 (75.1-82.9) 85.7 (78.8-92.6)
6.7 *Number of distressing somatic symptoms
0 1
≥2
40 (22.1) 40 (22.1) 101 (55.8)
1
2.56 (1.00-6.53) 3.17 (1.40-7.19)
70.9 (64.4-71.5) 81.8 (74.9-88.7) 88.8 (84.2-93.4)
17.9 *Mental health status
Good Intermediate
Poor
41 (22.7) 49 (27.1) 91 (50.2)
1
1.20 (0.52-2.76) 2.49 (1.03-6.03)
78.6 (72.9-84.2) 78.6 (72.0-85.2) 84.6 (78.7-90.4)
6.0 a
Post regression tests: Hosmer Lemeshow chi2 p-value group (8) =0.13; group (10); =0.67;group (12) =0.15; ROC curve
=76.7%. b
Adjusted ORs of significant risk factors.
cDifference in predicted prevalences of associated level/s of explanatory variables and relevant reference groups.
dReturned to model as LR test p-value=0.04.
*Explanatory variables associated with “any” pain with their respective predictive prevalences in the final model.
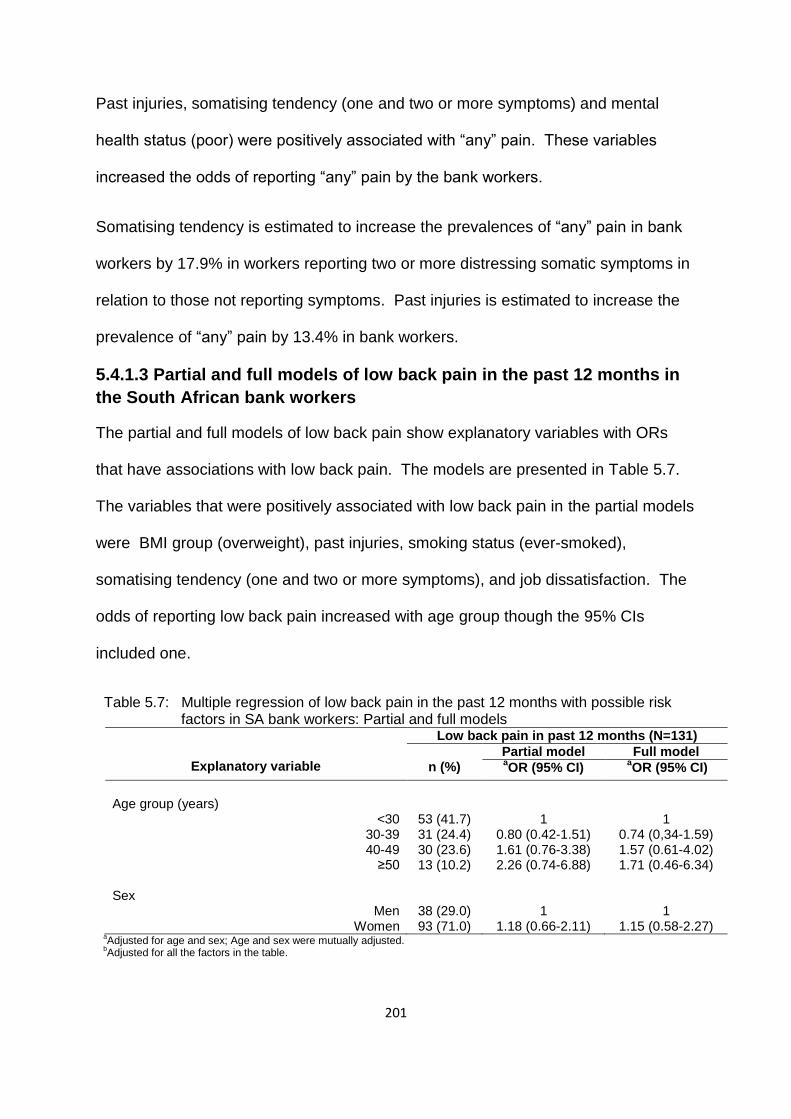
201
Past injuries, somatising tendency (one and two or more symptoms) and mental
health status (poor) were positively associated with “any” pain. These variables
increased the odds of reporting “any” pain by the bank workers.
Somatising tendency is estimated to increase the prevalences of “any” pain in bank
workers by 17.9% in workers reporting two or more distressing somatic symptoms in
relation to those not reporting symptoms. Past injuries is estimated to increase the
prevalence of “any” pain by 13.4% in bank workers.
5.4.1.3 Partial and full models of low back pain in the past 12 months in
the South African bank workers
The partial and full models of low back pain show explanatory variables with ORs
that have associations with low back pain. The models are presented in Table 5.7.
The variables that were positively associated with low back pain in the partial models
were BMI group (overweight), past injuries, smoking status (ever-smoked),
somatising tendency (one and two or more symptoms), and job dissatisfaction. The
odds of reporting low back pain increased with age group though the 95% CIs
included one.
Table 5.7: Multiple regression of low back pain in the past 12 months with possible risk factors in SA bank workers: Partial and full models
Explanatory variable
Low back pain in past 12 months (N=131)
n (%)
Partial model Full model aOR (95% CI)
aOR (95% CI)
Age group (years)
<30 30-39 40-49
≥50
53 (41.7) 31 (24.4) 30 (23.6) 13 (10.2)
1
0.80 (0.42-1.51) 1.61 (0.76-3.38) 2.26 (0.74-6.88)
1
0.74 (0,34-1.59) 1.57 (0.61-4.02) 1.71 (0.46-6.34)
Sex
Men Women
38 (29.0) 93 (71.0)
1
1.18 (0.66-2.11)
1
1.15 (0.58-2.27) a
Adjusted for age and sex; Age and sex were mutually adjusted. b
Adjusted for all the factors in the table.

202
Table 5.7: Multiple regression of low back pain in the past 12 months with possible risk factors in SA bank workers: Partial and full models cont’d
Explanatory variable
Low back pain in past 12 months (N=131)
n (%)
Partial model Full model aOR (95% CI)
aOR (95% CI)
*BMI group
Normal Overweight
Obese
55 (42.6) 45 (34.9) 29 (22.5)
1
2.54 (1.24-5.16) 1.08 (0.52-2.22)
1
2.53 (1.11-5.74) 0.86 (0.37-1.99)
*Past injuries
No Yes
79 (60.3) 52 (39.7)
1
3.17 (1.67-6.01)
1
2.99 (1.45-6.16) *Ethnic group
Sotho Nguni Other
30 (22.9) 32 (24.4) 69 (52.7)
1
1.43 (0.70-2.92) 1.80 (0.94-3.45)
1
1.59 (0.70-3.61) 2.57 (1.16-5.65)
*Smoking status
Never-smoked Ever-smoked
71 (54.2) 60 (45.8)
1
1.82 (1.04-3.18)
1
1.45 (0.74-2.85) Financial difficulties
No Yes
28 (21.5) 102 (78.5)
1
1.54 (0.83-2.84)
1
1.69 (0.82-3.50) *Number of distressing somatic symptoms
0 1
≥2
27 (20.6) 30 (22.9) 74 (56.5)
1
1.97 (0.92-4.19) 2.37 (1.25-4.49)
1
2.45 (1.02-5.90) 2.60 (1.20-5.63)
Mental health status
Good Intermediate
Poor
30 (22.9) 36 (27.5) 65 (49.6)
1
1.41 (0.69-2.85) 1.81 (0.94-3.48)
1
0.72 (0.31-1.66) 0.96 (0.43-2.12)
Working under time pressure
No Yes
3 (2.3) 128 (97.7)
1
2.90 (0.73-11.44)
1
5.19 (0.89-30.19) Lack of social support
No Yes
96 (76.2) 30 (23.8)
1
1.58 (0.80-3.13)
1
1.35 (0.61-2.99) *Job dissatisfaction
No Yes
67 (51.1) 64 (48.9)
1
1.97 (1.13-3.44)
1
2.28 (1.20-4.35) a
Adjusted for age and sex; Age and sex were mutually adjusted. b
Adjusted for all the factors in the table. *Explanatory variables associated with low back pain in partial and/ or full models.
In the full model, BMI group (overweight), past injuries, ethnic group “other”,
somatising tendency (one and two or more symptoms) and job dissatisfaction were
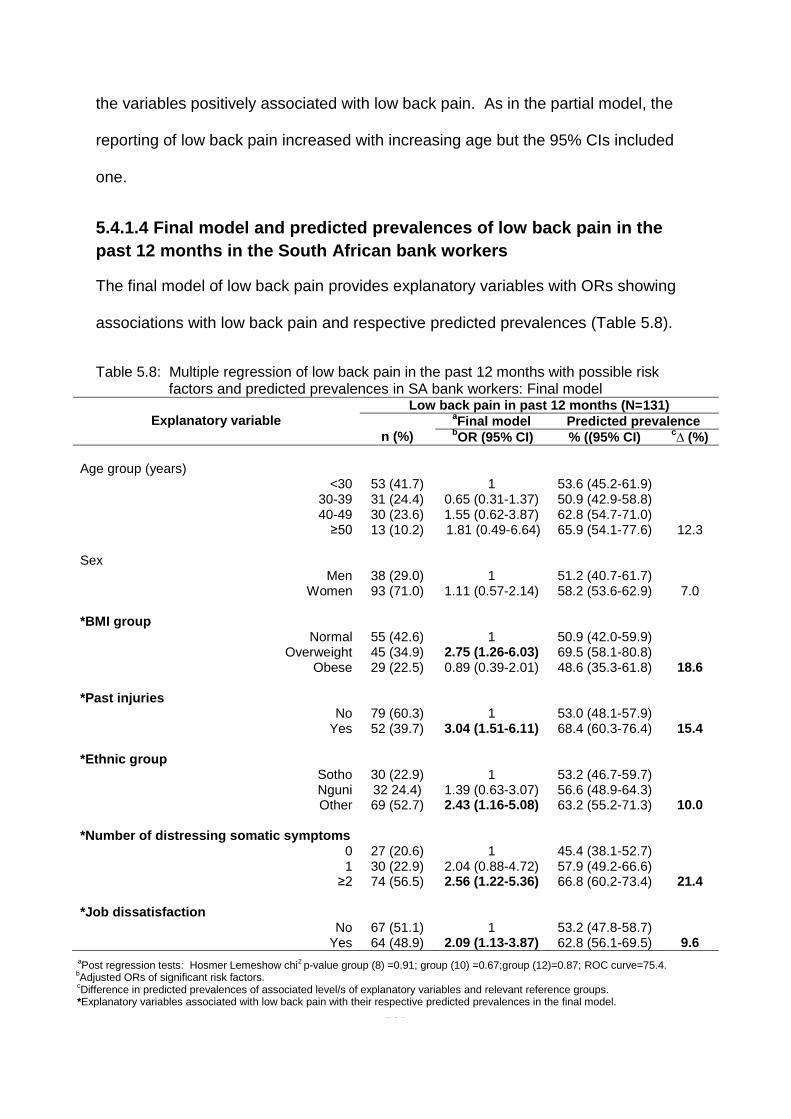
203
the variables positively associated with low back pain. As in the partial model, the
reporting of low back pain increased with increasing age but the 95% CIs included
one.
5.4.1.4 Final model and predicted prevalences of low back pain in the
past 12 months in the South African bank workers
The final model of low back pain provides explanatory variables with ORs showing
associations with low back pain and respective predicted prevalences (Table 5.8).
Table 5.8: Multiple regression of low back pain in the past 12 months with possible risk factors and predicted prevalences in SA bank workers: Final model
Explanatory variable
Low back pain in past 12 months (N=131)
n (%)
aFinal model Predicted prevalence
bOR (95% CI) % ((95% CI)
c∆ (%)
Age group (years)
<30 30-39 40-49
≥50
53 (41.7) 31 (24.4) 30 (23.6) 13 (10.2)
1
0.65 (0.31-1.37) 1.55 (0.62-3.87) 1.81 (0.49-6.64)
53.6 (45.2-61.9) 50.9 (42.9-58.8) 62.8 (54.7-71.0) 65.9 (54.1-77.6)
12.3 Sex
Men Women
38 (29.0) 93 (71.0)
1
1.11 (0.57-2.14)
51.2 (40.7-61.7) 58.2 (53.6-62.9)
7.0 *BMI group
Normal Overweight
Obese
55 (42.6) 45 (34.9) 29 (22.5)
1
2.75 (1.26-6.03) 0.89 (0.39-2.01)
50.9 (42.0-59.9) 69.5 (58.1-80.8) 48.6 (35.3-61.8)
18.6 *Past injuries
No Yes
79 (60.3) 52 (39.7)
1
3.04 (1.51-6.11)
53.0 (48.1-57.9) 68.4 (60.3-76.4)
15.4 *Ethnic group
Sotho Nguni Other
30 (22.9) 32 24.4) 69 (52.7)
1
1.39 (0.63-3.07) 2.43 (1.16-5.08)
53.2 (46.7-59.7) 56.6 (48.9-64.3) 63.2 (55.2-71.3)
10.0 *Number of distressing somatic symptoms
0 1
≥2
27 (20.6) 30 (22.9) 74 (56.5)
1
2.04 (0.88-4.72) 2.56 (1.22-5.36)
45.4 (38.1-52.7) 57.9 (49.2-66.6) 66.8 (60.2-73.4)
21.4 *Job dissatisfaction
No Yes
67 (51.1) 64 (48.9)
1
2.09 (1.13-3.87)
53.2 (47.8-58.7) 62.8 (56.1-69.5)
9.6
a
Post regression tests: Hosmer Lemeshow chi2 p-value group (8) =0.91; group (10) =0.67;group (12)=0.87; ROC curve=75.4.
bAdjusted ORs of significant risk factors.
cDifference in predicted prevalences of associated level/s of explanatory variables and relevant reference groups.
*Explanatory variables associated with low back pain with their respective predicted prevalences in the final model.

204
The following explanatory variables were positively associated with low back pain:
BMI group (overweight); past injuries; ethnic group “other”; somatising tendency (one
and two or more symptoms); and job dissatisfaction. All of these variables increased
the odds of reporting low back pain by the bank workers. It was observed that
increased odds of reporting of low back pain increased with age group category,
though the 95% CIs included one.
The three variables with the largest predicted prevalences of low back pain are
somatising tendency, BMI group and past injuries.
5.4.1.5 Partial and full models of neck pain in the past 12 months in the
South African bank workers
The partial and full models of neck pain show explanatory variables with ORs
associated with neck pain. The models are presented in Table 5.9. In the partial
models the following variables were positively associated with neck pain: BMI group
(overweight); past injuries; frightening situation; somatising tendency (two or more
symptoms); mental health status (poor); working under time pressure; and lack of
social support.
Table 5.9: Multiple regression of neck pain in the past 12 months with possible risk factors in SA bank workers: Partial and full models
Explanatory variable
Neck pain in past 12 months (N=125)
n (%)
Partial model Full model aOR (95% CI)
bOR (95% CI)
Age group (years)
<30 30-39 40-49
≥50
51 (42.1) 32 (26.4) 28 (23.1) 10 (8.3)
1
0.91 (0.48-1.71) 1.39 (0.66-2.89) 1.14 (0.41-3.17)
1
1.26 (0.54-2.92) 0.73 (0.26-2.05) 0.56 (0.14-2.15)
Sex
Men Women
35 (28.0) 90 (72.0)
1
1.34 (0.75-2.38)
1
1.47 (0.72-2.98) aAdjusted for age and sex; Age and sex were mutually adjusted.
bAdjusted for all the factors in the table.
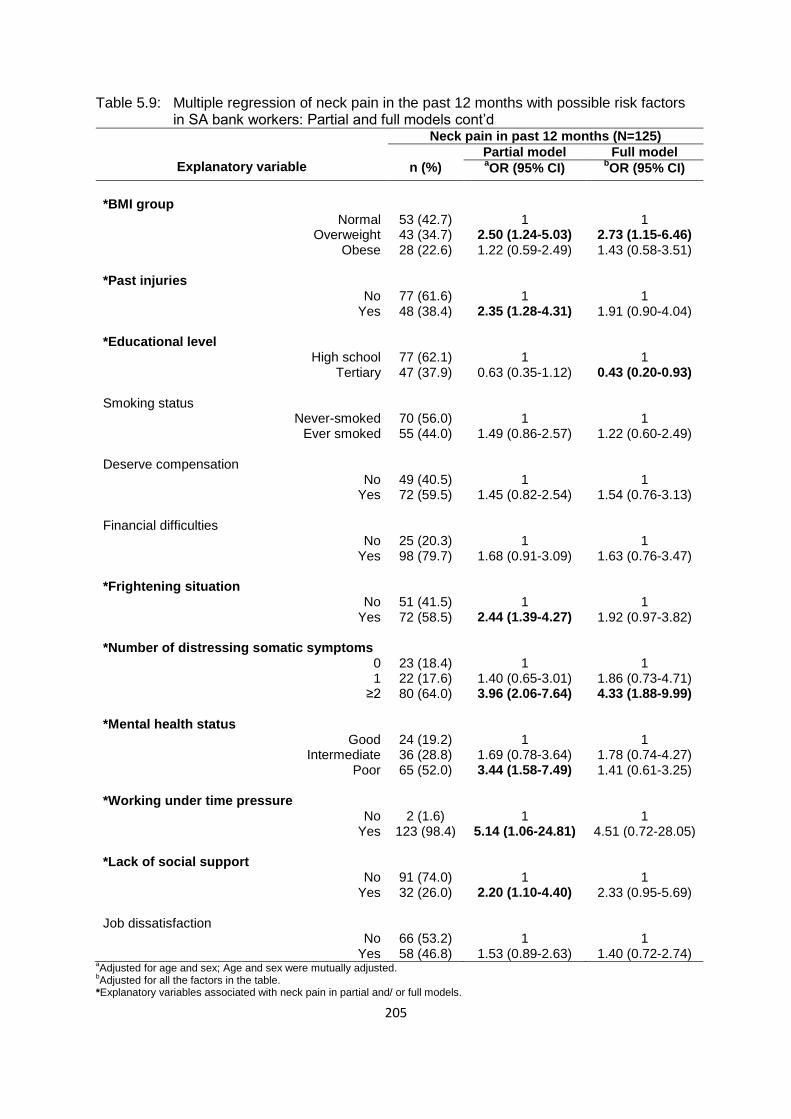
205
Table 5.9: Multiple regression of neck pain in the past 12 months with possible risk factors in SA bank workers: Partial and full models cont’d
Explanatory variable
Neck pain in past 12 months (N=125)
n (%)
Partial model Full model aOR (95% CI)
bOR (95% CI)
*BMI group
Normal Overweight
Obese
53 (42.7) 43 (34.7) 28 (22.6)
1
2.50 (1.24-5.03) 1.22 (0.59-2.49)
1
2.73 (1.15-6.46) 1.43 (0.58-3.51)
*Past injuries
No Yes
77 (61.6) 48 (38.4)
1
2.35 (1.28-4.31)
1
1.91 (0.90-4.04) *Educational level
High school Tertiary
77 (62.1) 47 (37.9)
1
0.63 (0.35-1.12)
1
0.43 (0.20-0.93) Smoking status
Never-smoked Ever smoked
70 (56.0) 55 (44.0)
1
1.49 (0.86-2.57)
1
1.22 (0.60-2.49) Deserve compensation
No Yes
49 (40.5) 72 (59.5)
1
1.45 (0.82-2.54)
1
1.54 (0.76-3.13) Financial difficulties
No Yes
25 (20.3) 98 (79.7)
1
1.68 (0.91-3.09)
1
1.63 (0.76-3.47) *Frightening situation
No Yes
51 (41.5) 72 (58.5)
1
2.44 (1.39-4.27)
1
1.92 (0.97-3.82) *Number of distressing somatic symptoms
0 1
≥2
23 (18.4) 22 (17.6) 80 (64.0)
1
1.40 (0.65-3.01) 3.96 (2.06-7.64)
1
1.86 (0.73-4.71) 4.33 (1.88-9.99)
*Mental health status
Good Intermediate
Poor
24 (19.2) 36 (28.8) 65 (52.0)
1
1.69 (0.78-3.64) 3.44 (1.58-7.49)
1
1.78 (0.74-4.27) 1.41 (0.61-3.25)
*Working under time pressure
No Yes
2 (1.6) 123 (98.4)
1
5.14 (1.06-24.81)
1
4.51 (0.72-28.05) *Lack of social support
No Yes
91 (74.0) 32 (26.0)
1
2.20 (1.10-4.40)
1
2.33 (0.95-5.69) Job dissatisfaction
No Yes
66 (53.2) 58 (46.8)
1
1.53 (0.89-2.63)
1
1.40 (0.72-2.74) aAdjusted for age and sex; Age and sex were mutually adjusted.
bAdjusted for all the factors in the table.
*Explanatory variables associated with neck pain in partial and/ or full models.

206
In the full model, only BMI group (overweight) and somatising tendency (two or more
symptoms) were positively associated with neck pain and educational level (tertiary)
was negatively associated with neck pain.
5.4.1.6 Final model and predicted prevalences of neck pain in the past 12
months in the South African bank workers
The final model of neck pain and predicted prevalences are presented in Table 5.10.
The variables that were positively associated with neck pain were BMI group
Explanatory variable
Neck pain in past 12 months (N=125)
n (%)
aFinal model Predicted prevalence
bOR (95% CI) % (95% CI)
c∆ (%)
Age group (years)
<30 30-39 40-49
≥50
51 (42.1) 32 (26.4) 28 (23.1) 10 (8.3)
1
1.01 (0.47-2.18) 0.74 (0.27-2.04) 0.56 (0.15-2.10)
41.9 (33.7-50.3) 48.6 (40.7-56.5) 49.4 (40.9-57.8) 41.7 (29.2-54.3)
-0.2 Sex
Men Women
35 (28.0) 90 (72.0)
1
1.34 (0.68-2.66)
44.7 (34.1-55.3) 46.3 (41.6-51.1)
1.6 *BMI group
Normal Overweight
Obese
53 (42.7) 43 (34.7) 28 (22.6)
1
3.04 (1.35-6.80) 1.41 (0.59-3.34)
44.8 (35.8-53.8) 68.8 (57.7-79.8) 52.5 (39.1-65.9)
24.0 *Educational level
High school Tertiary
77 (62.1) 47 (37.9)
1
0.44 (0.22-0.87)
54.7 (46.7-62.7) 42.4 (37.3-47.5)
12.3 *Frightening situation
No Yes
51 (41.5) 72 (58.5)
1
2.51 (1.33-4.75)
37.4 (31.5-43.3) 55.4 (49.0-61.8)
18.0 *Number of distressing somatic symptoms
0 1
≥2
23 (18.4) 22 (17.6) 80 (64.0)
1
1.46 (0.61-3.48) 3.93 (1.83-8.46)
35.1 (27.9-42.3) 43.7 (34.8-52.5) 57.3 (50.5-64.3)
22.2 *Lack of social support
No Yes
91 (74.0) 32 (26.0)
1
2.62 (1.15-5.98)
44.5 (39.8-49.2) 53.7 (43.0-64.3)
9.2
aPost regression tests: Hosmer Lemeshow chi
2 p-value group (8) =0.21; group (10) =0.27;group (12)=0.12; ROC curve =76.4.
b
Adjusted ORs of significant risk factors. c
Difference in the predicted prevalences of associated level/s of explanatory variables and relevant reference group. *Explanatory variables associated with neck pain with their respective predicted prevalences in the final model.
Table 5.10: Multiple regression of neck pain in the past 12 months with possible risk factors and predicted prevalences in SA bank workers: Final model
207
(overweight), frightening situation, somatising tendency (two or more symptoms)
and lack of social support. Educational level (tertiary) was still negatively associated
with neck pain.
The predicted prevalences indicated that tertiary education would decrease the
prevalence of neck pain by 12.3%. Increases (24.0%) in the prevalence of neck
pain were predicted to occur in bank workers who are in the overweight BMI group in
relation to those in the normal group, and two or more somatic symptoms increased
the pain by 22.2%.
5.4.1.7 Partial and full model of shoulder pain in the past 12 months in
the South African bank workers
The partial and full models of shoulder pain have explanatory variables with ORs
showing associations with shoulder pain. The models are shown in Table 5.11. In
the partial models: sex (women); past injuries; smoking status (ever-smoked);
frightening situation; somatising tendency (two or more symptoms); and mental
health status (poor) were positively associated with shoulder pain. Age group
increased with the reporting of shoulder pain although the 95% CIs included one.
Somatising tendency (two or more symptoms) remained positively associated with
shoulder pain, in the full model. The reporting of shoulder pain increased with
increasing age group though the 95% CIs included one.
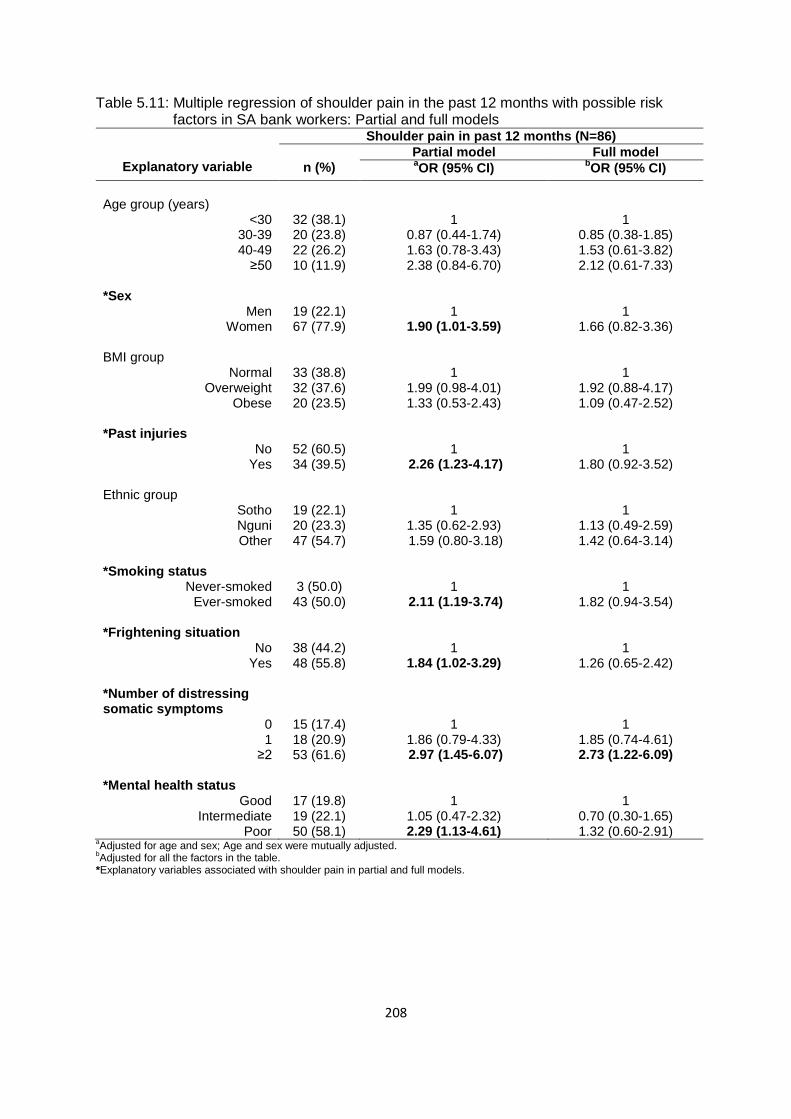
208
Table 5.11: Multiple regression of shoulder pain in the past 12 months with possible risk factors in SA bank workers: Partial and full models
Explanatory variable
Shoulder pain in past 12 months (N=86)
n (%)
Partial model Full model aOR (95% CI)
bOR (95% CI)
Age group (years)
<30 30-39 40-49
≥50
32 (38.1) 20 (23.8) 22 (26.2) 10 (11.9)
1
0.87 (0.44-1.74) 1.63 (0.78-3.43) 2.38 (0.84-6.70)
1
0.85 (0.38-1.85) 1.53 (0.61-3.82) 2.12 (0.61-7.33)
*Sex
Men Women
19 (22.1) 67 (77.9)
1
1.90 (1.01-3.59)
1
1.66 (0.82-3.36) BMI group
Normal Overweight
Obese
33 (38.8) 32 (37.6) 20 (23.5)
1
1.99 (0.98-4.01) 1.33 (0.53-2.43)
1
1.92 (0.88-4.17) 1.09 (0.47-2.52)
*Past injuries
No Yes
52 (60.5) 34 (39.5)
1
2.26 (1.23-4.17)
1
1.80 (0.92-3.52) Ethnic group
Sotho Nguni Other
19 (22.1) 20 (23.3) 47 (54.7)
1
1.35 (0.62-2.93) 1.59 (0.80-3.18)
1
1.13 (0.49-2.59) 1.42 (0.64-3.14)
*Smoking status
Never-smoked Ever-smoked
3 (50.0) 43 (50.0)
1
2.11 (1.19-3.74)
1
1.82 (0.94-3.54) *Frightening situation
No Yes
38 (44.2) 48 (55.8)
1
1.84 (1.02-3.29)
1
1.26 (0.65-2.42) *Number of distressing somatic symptoms
0 1
≥2
15 (17.4) 18 (20.9) 53 (61.6)
1
1.86 (0.79-4.33) 2.97 (1.45-6.07)
1
1.85 (0.74-4.61) 2.73 (1.22-6.09)
*Mental health status
Good Intermediate
Poor
17 (19.8) 19 (22.1) 50 (58.1)
1
1.05 (0.47-2.32) 2.29 (1.13-4.61)
1
0.70 (0.30-1.65) 1.32 (0.60-2.91)
aAdjusted for age and sex; Age and sex were mutually adjusted.
bAdjusted for all the factors in the table.
*Explanatory variables associated with shoulder pain in partial and full models.
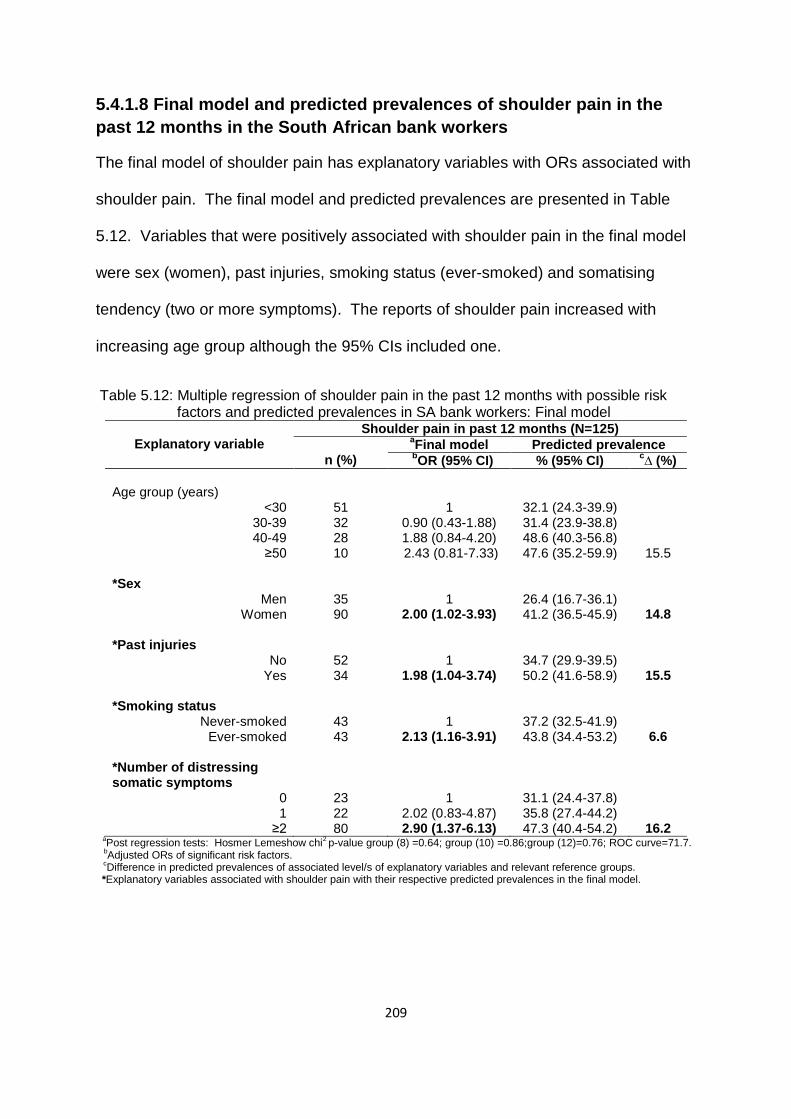
209
5.4.1.8 Final model and predicted prevalences of shoulder pain in the
past 12 months in the South African bank workers
The final model of shoulder pain has explanatory variables with ORs associated with
shoulder pain. The final model and predicted prevalences are presented in Table
5.12. Variables that were positively associated with shoulder pain in the final model
were sex (women), past injuries, smoking status (ever-smoked) and somatising
tendency (two or more symptoms). The reports of shoulder pain increased with
increasing age group although the 95% CIs included one.
Table 5.12: Multiple regression of shoulder pain in the past 12 months with possible risk factors and predicted prevalences in SA bank workers: Final model
Explanatory variable
Shoulder pain in past 12 months (N=125)
n (%)
aFinal model Predicted prevalence
bOR (95% CI) % (95% CI)
c∆ (%)
Age group (years)
<30 30-39 40-49
≥50
51 32 28 10
1
0.90 (0.43-1.88) 1.88 (0.84-4.20) 2.43 (0.81-7.33)
32.1 (24.3-39.9) 31.4 (23.9-38.8) 48.6 (40.3-56.8) 47.6 (35.2-59.9)
15.5 *Sex
Men Women
35 90
1
2.00 (1.02-3.93)
26.4 (16.7-36.1) 41.2 (36.5-45.9)
14.8 *Past injuries
No Yes
52 34
1
1.98 (1.04-3.74)
34.7 (29.9-39.5) 50.2 (41.6-58.9)
15.5 *Smoking status
Never-smoked Ever-smoked
43 43
1
2.13 (1.16-3.91)
37.2 (32.5-41.9) 43.8 (34.4-53.2)
6.6 *Number of distressing somatic symptoms
0 1
≥2
23 22 80
1
2.02 (0.83-4.87) 2.90 (1.37-6.13)
31.1 (24.4-37.8) 35.8 (27.4-44.2) 47.3 (40.4-54.2)
16.2 a
Post regression tests: Hosmer Lemeshow chi2 p-value group (8) =0.64; group (10) =0.86;group (12)=0.76; ROC curve=71.7.
bAdjusted ORs of significant risk factors.
cDifference in predicted prevalences of associated level/s of explanatory variables and relevant reference groups.
*Explanatory variables associated with shoulder pain with their respective predicted prevalences in the final model.
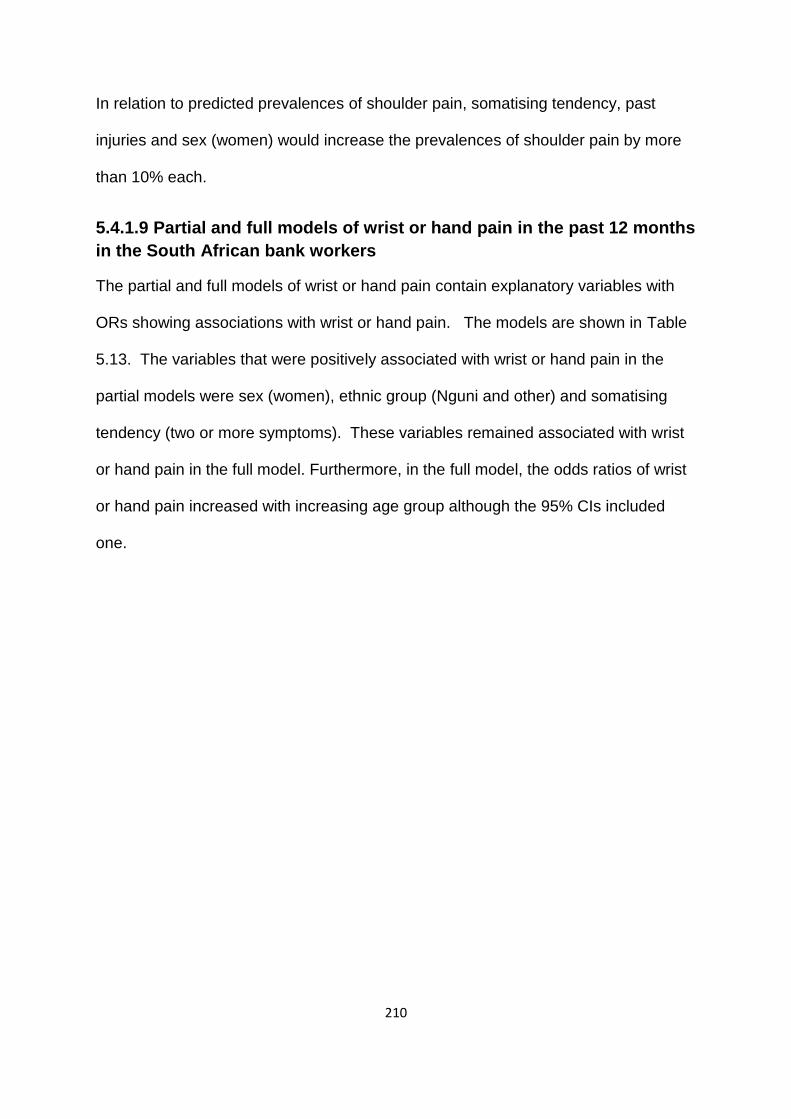
210
In relation to predicted prevalences of shoulder pain, somatising tendency, past
injuries and sex (women) would increase the prevalences of shoulder pain by more
than 10% each.
5.4.1.9 Partial and full models of wrist or hand pain in the past 12 months
in the South African bank workers
The partial and full models of wrist or hand pain contain explanatory variables with
ORs showing associations with wrist or hand pain. The models are shown in Table
5.13. The variables that were positively associated with wrist or hand pain in the
partial models were sex (women), ethnic group (Nguni and other) and somatising
tendency (two or more symptoms). These variables remained associated with wrist
or hand pain in the full model. Furthermore, in the full model, the odds ratios of wrist
or hand pain increased with increasing age group although the 95% CIs included
one.

211
Table 5.13: Multiple regression of wrist/hand pain in the past 12 months with possible risk factors in SA bank workers: Partial and full models
Explanatory variable
Wrist or hand pain in past 12 months (N=64)
n (%)
Partial model Full model aOR (95% CI)
bOR (95% CI)
Age group (years)
<30 30-39 40-49
≥50
25 (41.6) 11 (18.3) 18 (30.0) 6 (10.0)
1
0.55 (0.24-1.23) 1.57 (0.72-3.40) 1.30 (0.43-3.89)
1
0.56 (0.22-1.39) 1.63 (0.67-3.99) 1.83 (0.53-0.63)
*Sex
Men Women
12 (18.8) 52 (81.2)
1
2.18 (1.05-4.55)
1
2.72 (1.17-6.34) *Ethnic group
Sotho Nguni Other
9 (14.1) 20 (31.3) 35 (54.7)
1
3.73 (1.49-9.33) 2.37 (1.01-5.59)
1
4.37 (1.59-11.98) 3.11 (1.20-8.08)
Frightening situation
No Yes
26 (41.3) 37 (58.7)
1
1.87 (0.98-3.55)
1
1.70 (0.84-3.44) *Number of distressing somatic symptoms
0 1
≥2
8 (12.5) 11 (17.2) 45 (70.3)
1
2.13 (0.74-6.10) 4.64 (1.90-11.31)
1
2.05 (0.68-6.19) 3.72 (1.45-9.54)
Repeated wrist/hand movement > 4 hours
No Yes
9 (14.3) 54 (85.7)
1
1.78 (0.78-4.06)
1
2.00 (0.82-4.89) aAdjusted for age and sex; Age and sex were mutually adjusted.
bAdjusted for all the factors in the table.
*Explanatory variables associated with wrist or hand pain in partial and full models.
5.4.1.10 Final model and predicted prevalences of wrist or hand pain in
the past 12 months in the South African bank workers
The final model contains statistically significant explanatory variables that are
associated with wrist or hand pain. The final model and predicted prevalences are
shown in Table 5.14. Sex (women), ethnic group (Nguni and other) and somatising
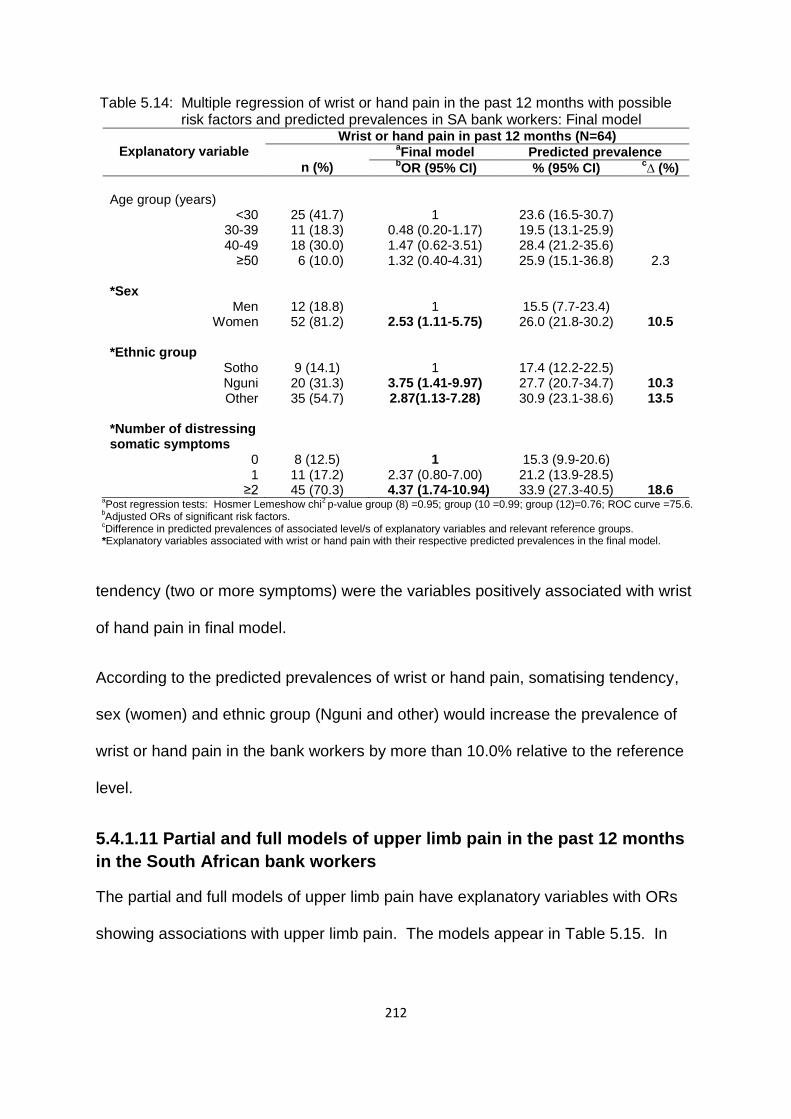
212
Table 5.14: Multiple regression of wrist or hand pain in the past 12 months with possible risk factors and predicted prevalences in SA bank workers: Final model
Explanatory variable
Wrist or hand pain in past 12 months (N=64)
n (%)
aFinal model Predicted prevalence
bOR (95% CI) % (95% CI)
c∆ (%)
Age group (years)
<30 30-39 40-49
≥50
25 (41.7) 11 (18.3) 18 (30.0) 6 (10.0)
1
0.48 (0.20-1.17) 1.47 (0.62-3.51) 1.32 (0.40-4.31)
23.6 (16.5-30.7) 19.5 (13.1-25.9) 28.4 (21.2-35.6) 25.9 (15.1-36.8)
2.3 *Sex
Men Women
12 (18.8) 52 (81.2)
1
2.53 (1.11-5.75)
15.5 (7.7-23.4) 26.0 (21.8-30.2)
10.5 *Ethnic group
Sotho Nguni Other
9 (14.1) 20 (31.3) 35 (54.7)
1
3.75 (1.41-9.97) 2.87(1.13-7.28)
17.4 (12.2-22.5) 27.7 (20.7-34.7) 30.9 (23.1-38.6)
10.3 13.5
*Number of distressing somatic symptoms
0 1
≥2
8 (12.5) 11 (17.2) 45 (70.3)
1
2.37 (0.80-7.00) 4.37 (1.74-10.94)
15.3 (9.9-20.6) 21.2 (13.9-28.5) 33.9 (27.3-40.5)
18.6
aPost regression tests: Hosmer Lemeshow chi
2 p-value group (8) =0.95; group (10 =0.99; group (12)=0.76; ROC curve =75.6.
bAdjusted ORs of significant risk factors.
cDifference in predicted prevalences of associated level/s of explanatory variables and relevant reference groups.
*Explanatory variables associated with wrist or hand pain with their respective predicted prevalences in the final model.
tendency (two or more symptoms) were the variables positively associated with wrist
of hand pain in final model.
According to the predicted prevalences of wrist or hand pain, somatising tendency,
sex (women) and ethnic group (Nguni and other) would increase the prevalence of
wrist or hand pain in the bank workers by more than 10.0% relative to the reference
level.
5.4.1.11 Partial and full models of upper limb pain in the past 12 months
in the South African bank workers
The partial and full models of upper limb pain have explanatory variables with ORs
showing associations with upper limb pain. The models appear in Table 5.15. In
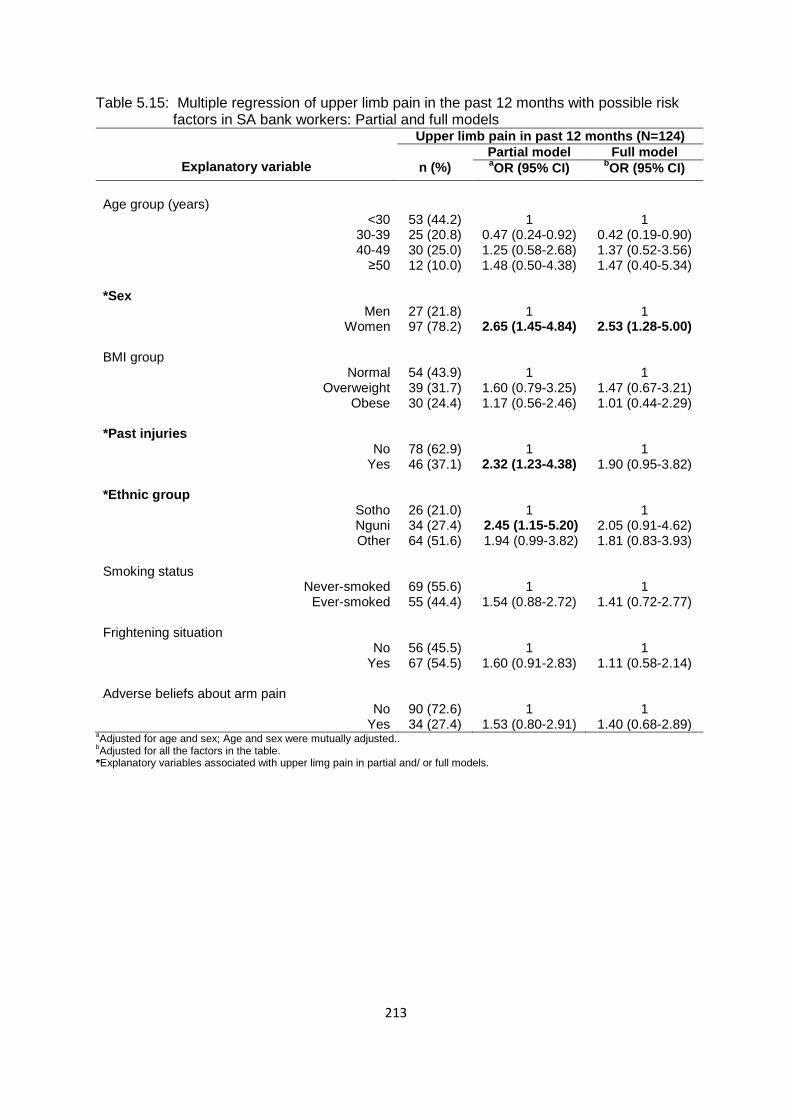
213
Table 5.15: Multiple regression of upper limb pain in the past 12 months with possible risk factors in SA bank workers: Partial and full models
Explanatory variable
Upper limb pain in past 12 months (N=124)
n (%)
Partial model Full model aOR (95% CI)
bOR (95% CI)
Age group (years)
<30 30-39 40-49
≥50
53 (44.2) 25 (20.8) 30 (25.0) 12 (10.0)
1
0.47 (0.24-0.92) 1.25 (0.58-2.68) 1.48 (0.50-4.38)
1
0.42 (0.19-0.90) 1.37 (0.52-3.56) 1.47 (0.40-5.34)
*Sex
Men Women
27 (21.8) 97 (78.2)
1
2.65 (1.45-4.84)
1
2.53 (1.28-5.00) BMI group
Normal Overweight
Obese
54 (43.9) 39 (31.7) 30 (24.4)
1
1.60 (0.79-3.25) 1.17 (0.56-2.46)
1
1.47 (0.67-3.21) 1.01 (0.44-2.29)
*Past injuries
No Yes
78 (62.9) 46 (37.1)
1
2.32 (1.23-4.38)
1
1.90 (0.95-3.82) *Ethnic group
Sotho Nguni Other
26 (21.0) 34 (27.4) 64 (51.6)
1
2.45 (1.15-5.20) 1.94 (0.99-3.82)
1
2.05 (0.91-4.62) 1.81 (0.83-3.93)
Smoking status
Never-smoked Ever-smoked
69 (55.6) 55 (44.4)
1
1.54 (0.88-2.72)
1
1.41 (0.72-2.77) Frightening situation
No Yes
56 (45.5) 67 (54.5)
1
1.60 (0.91-2.83)
1
1.11 (0.58-2.14) Adverse beliefs about arm pain
No Yes
90 (72.6) 34 (27.4)
1
1.53 (0.80-2.91)
1
1.40 (0.68-2.89) aAdjusted for age and sex; Age and sex were mutually adjusted..
bAdjusted for all the factors in the table.
*Explanatory variables associated with upper limg pain in partial and/ or full models.

214
Table 5.15: Multiple regression of upper limb pain in the past 12 months with possible risk factors in SA bank workers: Partial and full models cont’d
Explanatory variable
Upper limb pain in past 12 months (N=124)
n (%)
Partial model Full model aOR (95% CI)
bOR (95% CI)
*Number of distressing somatic symptoms
0 1
≥2
22 (17.7) 26 (21.0) 76 (61.3)
1
1.96 (0.89-4.31) 3.58 (1.82-7.06)
1
2.01 (0.85-4.76) 3.13 (1.45-6.75)
*Mental health status
Good Intermediate
Poor
27 (21.8) 30 (24.2) 67 (54.0)
1
1.05 (0.47-2.32) 2.29 (1.13-4.61)
1
0.80 (0.36-1.79) 1.24 (0.56-2.72)
Job insecurity No
Yes
37 (29.8) 87 (70.2)
1
1.50 (0.84-2.69)
1
1.48 (0.76-2.87) aAdjusted for age and sex; Age and sex were mutually adjusted..
bAdjusted for all the factors in the table.
*Explanatory variables associated with upper limg pain in partial and/ or full models.
the partial models, the variables that were positively associated with upper limb pain
were sex (women), past injuries, ethnic group (Nguni), somatising tendency (two or
more symptoms) and mental health status (poor). The reporting of upper limb pain
increased with increasing age group though the 95% CIs included one. In the full
model, sex (women) and somatising tendency (two or more symptoms) were the
variables positively associated with upper limb pain. Again, the ORs of upper limb
pain increased with increasing age group with 95% CIs including one.
5.4.1.12 Final model and predicted prevalences of upper limb pain in the
past 12 months in the South African bank workers
The final model contains statistically significant explanatory variables which are
associated with upper limb pain. The model and predicted prevalences are shown in
Table 5.16. The variables that were associated with upper limb pain were sex

215
Table 5.16: Multiple regression of upper limb pain in the past 12 months with possible risk factors and predicted prevalences in SA bank workers: Final model
Explanatory variable
Upper limb pain in past 12 months (N=124)
n (%)
aFinal model Predicted prevalence
bOR (95% CI) % (95% CI)
c∆ (%)
Age group (years)
<30 30-39 40-49
≥50
53 (44.2) 25 (20.8) 30 (25.0) 12 (10.0)
1
0.43 (0.21-0.88) 1.35 (0.59-3.10) 1.53 (0.49-4.82)
53.3 (45.2-61.5) 44.6 (36.8-52.5) 59.4 (51.4-67.3) 57.6 (45.6-69.5)
4.3 *Sex
Men Women
27 (21.8) 97 (78.2)
1
2.88 (1.51-5.49)
35.0 (24.9-45.1) 56.9 (52.2-61.6)
21.9 *Past injuries
No Yes
78 (62.9) 46 (37.1)
1
2.12 (1.09-4.09)
49.3 (44.4-54.2) 64.1 (55.9-72.3)
14.8 *Number of distressing somatic symptoms
0 1
≥2
22 (17.7) 26 (21.0) 76 (61.3)
1
1.85 (0.82-4.17) 3.28 (1.63-6.62)
39.8 (32.7-46.9) 50.3 (41.5-59.0) 66.9 (60.4-73.5)
27.1 aPost regression tests: Hosmer Lemeshow chi
2 p-value group (8) =0.61; group (10) =0.05;group (12)=0.47; ROC curve=73.9%.
bAdjusted ORs of significant risk factors.
cDifference in predicted prevalences of associated level/s of explanatory variables and relevant reference groups.
*Explanatory variables associated with upper limb pain with their respective predicted prevalences in the final model.
(women), past injuries and somatising tendency (two or more symptoms). These
variables increased the odds of reporting upper limb pain by the bank workers. As in
the partial and full models, the reporting of upper limb pain increased with increasing
age group although the 95% CIs included one.
Somatising tendency and sex (women) were the variables predicted to increase the
prevalence of upper limb pain by more than 20%.
5.4.1.13 Partial and full models of knee pain in the past 12 months in the
South African bank workers
The partial and full models demonstrating explanatory variables that are associated
with knee pain are shown in Table 5.17. Past injuries, somatising tendency (two or
216
Table 5.17: Multiple regression of knee pain in the past 12 months with possible risk factors in SA bank workers: Partial and full models
Explanatory variable
Knee pain in past 12 months (N=62)
n (%)
Partial model Full model aOR (95% CI)
bOR (95% CI)
*Age group (years)
<30 30-39 40-49
≥50
18 (30.5) 18 (30.5) 15 (25.4) 8 (13.6)
1
1.67 (0.79-3.55) 1.98 (0.86-4.51) 1.50 (0.74-3.04)
1
2.03 (0.89-4.63) 2.53 (0.99-6.45)
3.91 (1.21-12.64) Sex
Men Women
14 (22.6) 48 (77.4)
1
1.50 (0.74-3.04)
1
1.38 (0.65-2.94) *Past injuries
No Yes
36 (58.1) 26 (41.9)
1
2.03 (1.06-3.88)
1
1.79 (0.90-3.57) Ethnic group
Sotho Nguni Other
12 (20.0) 16 (26.7) 32 (53.3)
1
1.76 (0.74-4.20) 1.51 (0.69-3.31)
1
1.89 (0.75-4.71) 2.11 (0.89-5.00)
*Financial difficulties
No Yes
10 (16.1) 52 (83.9)
1
2.02 (0.93-4.38)
1
2.44 (1.04-5.69) *Number of distressing somatic symptoms
0 1
≥2
12 (19.4) 13 (21.0) 37 (59.6)
1
1.65 (0.65-4.71) 2.21 (1.01-4.83)
1
1.56 (0.59-4.11) 1.96 (0.84-4.52)
*Job dissatisfaction
No Yes
27 (43.5) 35 (56.5)
1
2.64 (1.40-4.99)
1
3.02 (1.52-5.97) aAdjusted for age and sex; Age and sex were mutually adjusted.
bAdjusted for all the factors in the table.
*Explanatory variables associated with knee pain in partial and/ or full models.
more symptoms) and job dissatisfaction were positively associated with knee pain in
the partial models. In the full model, age group (50 years and above), financial
difficulties and job dissatisfaction were the variables associated with knee pain.
5.4.1.13 Final model and predicted prevalences of knee pain in the past
12 months in the South African bank workers
The final model of knee pain and predicted prevalences are presented in Table 5.18.
The model shows explanatory variables that are positively associated with knee

217
pain. The variables that were associated with knee pain in the full model remained
associated with knee pain in the final model. These were age group (40-49 and 50
years and above), financial difficulties, and job dissatisfaction.
Table 5.18: Multiple regression of knee pain in the past 12 months with possible risk factors and predicted prevalences in SA bank workers: Final model
Explanatory variable
Knee pain in past 12 months (N=62)
n (%)
aFinal model Predicted prevalence
bOR (95% CI) % (95%CI)
c∆ (%)
*Age group (years)
<30 30-39 40-49
≥50
18 (30.5) 18 (30.5) 15 (25.4) 8 (13.6)
1
2.09 (0.94-4.62) 2.91 (1.19-7.10)
4.04 (1.32-12.38)
21.1 (14.3-27.9) 25.4 (18.4-32.5) 37.5 (29.6-45.5) 37.4 (25.3-49.5)
16.4 16.3
Sex
Men Women
14 (22.6) 48 (77.4)
1
1.40 (0.67-2.91)
23.1 (13.4-32.8) 30.4 (25.9-34.7)
7.3 *Financial difficulties
No Yes
10 (16.1) 52 (83.9)
1
2.26 (1.01-5.07)
17.9 (11.6-24.2) 33.7 (28.9-38.5)
15.8 *Job dissatisfaction
No Yes
27 (43.5) 35 (56.5)
1
2.87 (1.49-5.51)
22.9 (18.3-27.6) 39.5 (32.6-46.4)
16.6
aPost regression tests: Hosmer Lemeshow chi
2 p-value group (8) =041; group (10); =0.46;group (12) =0.66; ROC curve
=71.4%. b
Adjusted ORs of significant risk factors.
cDifference in predicted prevalences of associated level/s of explanatory variables and relevant reference groups.
*Explanatory variables associatedwith knee pain with their respective predicted prevalences in the final model.
The variables age group, job dissatisfaction and financial difficulties had predicted
prevalence differences ranging from 15.8% to 16.6%.

218
5.4.1.14 Summary of possible risk factors associated with MSD pain in
the past 12 months in the SA bank workers
All the risk factors from the final models of pain sites used in the multiple regression
analysis are presented in Table 5.19.
Somatising tendency was associated with most pain sites (six) followed by
past injuries (four).
Low back pain had the largest (five) number of risk factors.
Upper limb pain was associated with sex (women).
Knee pain was associated with age group, and low back, shoulder and upper
limb pain increased with increasing age group, although the trends were not
significant.
“Bank workers” was the only group in which sex was examined. Interestingly,
“women” was positively associated with upper limb pain.
In general, the effect of most risk factors was inconsistent across pain sites.

219
Table 5.19: Statistically significant risk factors from final models of MSD pain in the past 12 months in the SA bank workers
*)=Risk factors showing consistent association with pain sites; **)=Number of pain sites associated with a particular risk factor; √)=Associated; -)= Not associated or not applicable
Risk factor Pain site **Total
Any Low back Neck Shoulder Wrist/hand Upper limb Knee
*Number of distressing somatic symptoms
0 1
≥2
√
√
√
√
√
√
-
6
*Past injuries Yes No
√
√
-
√
-
√
-
4
*Sex Men
Women
-
-
-
√
√
√
-
3
Job dissatisfaction Yes No
-
√
-
-
-
-
√
2
BMI group Normal
Overweight Obese
-
√
√
-
-
-
-
2
Ethnic group Sotho Nguni Other
-
√
-
-
√ √
-
-
2
*Age group <30
30-39 40-49
≥50
-
↑
-
↑
-
↑
√ √
1
Smoking status Never-smoked Ever- smoked
-
-
-
√
-
-
-
1
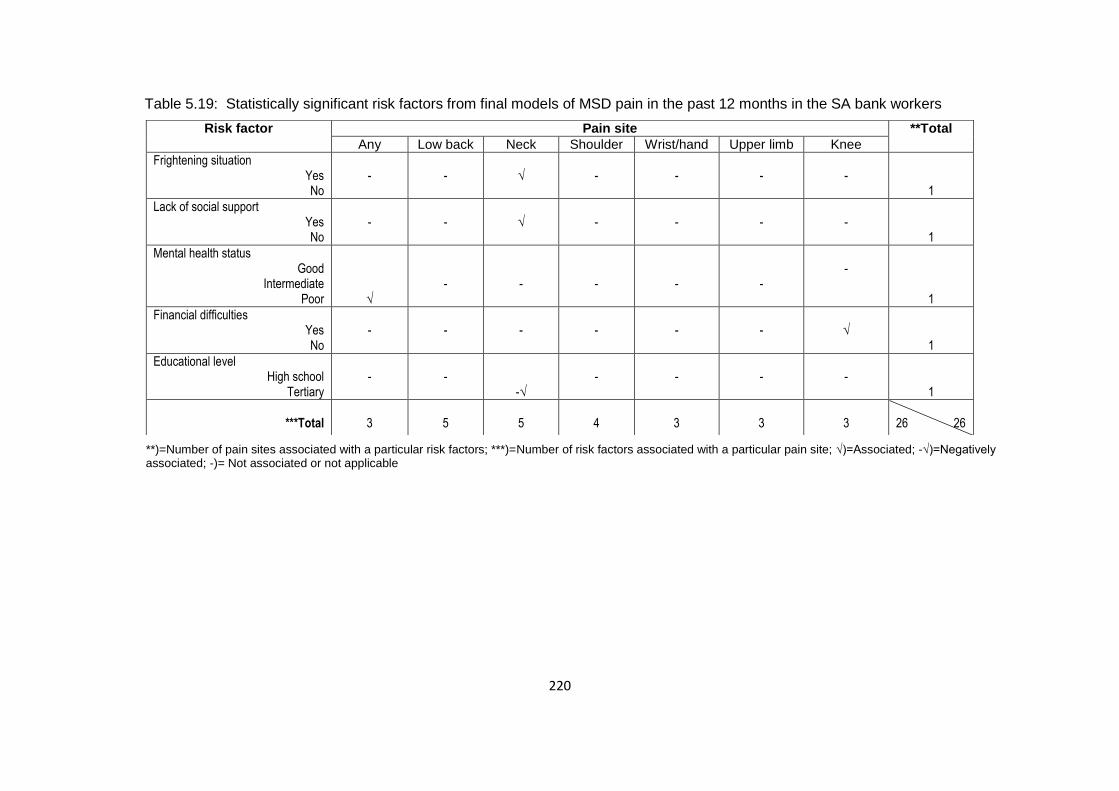
220
Table 5.19: Statistically significant risk factors from final models of MSD pain in the past 12 months in the SA bank workers
**)=Number of pain sites associated with a particular risk factors; ***)=Number of risk factors associated with a particular pain site; √)=Associated; -√)=Negatively associated; -)= Not associated or not applicable
Risk factor Pain site **Total
Any Low back Neck Shoulder Wrist/hand Upper limb Knee
Frightening situation Yes No
-
-
√
-
-
-
-
1
Lack of social support Yes No
-
-
√
-
-
-
-
1
Mental health status Good
Intermediate Poor
√
-
-
-
-
-
-
1
Financial difficulties Yes No
-
-
-
-
-
-
√
1
Educational level High school
Tertiary
-
-
-√
-
-
-
-
1
***Total
3
5
5
4
3
3
3
26 26
221
Chapter 6: Discussion
6.1 Introduction
The research on which this thesis is based set out to investigate the exposure effect
relationship between MSD pain in the low back, neck, shoulders, elbows, wrists or
hands, upper limbs and knees, and potential work and non-work risk factors in two
South African occupational groups, namely public hospital nurses and bank workers.
In combined analyses, the two groups were referred to as South African (SA)
workers. The data from each group were analysed separately. In this section, the
summary and discussion of the results are presented.
The estimated 12-month prevalences (95% CI) of pain in at least one body site were
high at 80.5% (77.0%-84.0%) in the SA workers, 84.1% (79.5%-88.6%) in the nurses
and 76.7% (71.3%-82.1%) in the bank workers. The most prevalent MSD at a single
site was pain in the low back and the least prevalent was pain in the elbows in all the
three groups of workers. The second most prevalent MSDs was pain in the
shoulders and neck in nurses and bank workers, respectively. Multi-site pain was
the most frequently reported MSD, followed by pain in two sites. Most of the workers
reporting MSDs reported consulting a medical or alternative practitioner for the pain.
The average number of lost work days due to MSDs in the past year in the SA
workers was estimated at 1052.5 days which is equivalent to 2.2 days per worker per
year.
Incident and persistent MSDs were only investigated in the nurses. Incident MSDs
(95% CI) were estimated at 47.6% (36.5%-58.6%). Having incident low back pain
was reported by the largest percentage of nurses, followed by incident shoulder pain.
Incident elbow pain was the least reported MSD. Persistent MSDs (95% CI) were
222
estimated at 83.7% (76.2%-91.1%). Persistent knee pain had the highest
percentage followed by persistent low back pain. Persistent elbow pain had the
lowest percentage.
Individual risk factors were more prominent than physical and psychosocial aspects
of work. Somatising tendency was associated with prevalent and persistent MSDs.
Somatising tendency demonstrated increasing linear trends with prevalent MSDs in
a few body sites. In the SA workers and bank workers which are the groups that
included sex, “women” was positively associated with pain in the upper limbs. Older
age groups (40-49 and 50 years and older) were positively associated with MSDs in
1-2 body sites in the three groups of workers. In addition to these sites, in 2-4 body
sites the ORs increased with increasing age although the trends were not significant.
The ORs for pain in the shoulders and knees in the SA workers demonstrated linear
trends. BMI contributed little in explaining MSDs in the three groups of workers. In
nurses, obese and overweight BMI categories were negatively associated with pain
in “any” body site and upper limbs, respectively which was unexpected. The
occupational group “bank workers” was positively associated with pain in the neck
but no positive association was found with pain in “any” body site compared to
nurses. Ethnic group was inconsistent in its association with MSDs in the three
groups of workers. “Other” (Afrikaner, Coloured, Indian, Tsonga and Venda) ethnic
group was associated with pain in the upper limbs, low back and wrists or hands, in
one, two and three groups of workers, respectively.
Finally, work risk factors encompassing physical and psychosocial aspects of work
showed positive associations with MSDs in the SA workers only. These were
repeated elbow bending for more than one hour on an average day and job
223
dissatisfaction. “Repeated elbow bending” was positively associated with pain in the
elbows while job dissatisfaction was associated with pain in five body sites in the SA
workers and two body sites each in nurses and bank workers. In general, the
remaining risk factors were inconsistent across the body sites considered in the
study.
6.2 Prevalences and body site localisation of MSDs
The estimated 12-month prevalences and body site localisation of MSDs in SA
workers, public hospital nurses and bank workers are discussed. It has been noted
that prevalences of “any” MSD pain tend to increase with the increasing number of
body sites included in the studies. Hence, comparisons among studies need to take
this into consideration, that is higher prevalences may be a function of studying
many body sites.
6.2.1 South African workers
The prevalences of MSDs in the selected body sites of the SA workers is discussed
in the context of other studies on workers, including nurses and office workers who
use computers. The estimated 12-month prevalence of “any” MSDs in this study
(80.5% vs 87.0% and 88.0%) was high so, was that of an unpublished SA study by
Dyosi and Nyantumbu (2007), which included nurses and office workers, and
another study conducted in New Zealand (Harcombe et al., 2009) on nurses, office
workers and postal workers. In this study, body site specific MSD prevalences in the
low back (56.9% vs 55.6% and 51.4%) and elbows (14.3% vs 1.9% and 16.8%) had
similar patterns as those of unpublished SA and New Zealand studies with low back
MSD being the most common and elbow MSD the least common. MSD prevalences
of the other body sites: neck (46.2% vs 37.0% and 51.4%), shoulders (38.8% vs

224
44.4% and 44.3%), wrists or hands (24.6% vs 19.4% and 28.1%) and knees (29.4%
vs 16.7% and 28.1%) did not show any particular pattern in this study and other two
studies.
Body site specific MSD prevalences of the SA workers in this study showed a
similar pattern to those of the CUPID studies (Matsudaira et al., 2011,
Warnakulasuriya et al., 2012). The results were similar to these studies in respect of
body sites, with pain in the low back (56.9% vs 27.3% and 22.9%) and elbows
(14.3% vs 3.2% and 3.6%) being the most and least common respectively, and in
the other body sites; neck (46.2% vs 29.4% and 13.9%), shoulders (38.8% vs 21 2%
and 11.1%), wrists or hands (24.6% vs 6.3% and 8.5%) and knees (29.4% vs 12.0%
and 17.7%) showing no particular pattern. However, the magnitude of the
prevalences of the SA study was higher than those of the CUPID studies partly, due
to the different period prevalences used and occupational groups included in the
studies.
6.2.2 Public hospital nurses
The estimated 12-month prevalence (95% CI) of reported MSDs in at least one body
site in the public hospital nurses in the SA study was high at 84.1% (79.5%-88.6%).
This prevalence was within the range of 77.0%-89.5% reported by recent SA studies
in public hospital nurses (Dyosi and Nyantumbu, 2007, Madiba et al., 2013, Kumalo,
2015). A study by Kumalo (2015) found a slightly lower prevalence (77.0%) while
that of Madiba and colleagues (2013) found a prevalence of 84.0% which compares
well with that of the current SA study. The study of Dyosi and Nyantumbu (2007)
had a slightly higher prevalence of 89.5%.

225
Regarding the localisation of MSDs, the current study was in agreement with the SA
studies in so far as pain in the low back having the highest prevalence (Botha and
Bridger, 1998, Madiba et al., 2013) and elbows the lowest prevalence (Dyosi and
Nyantumbu, 2007). In the current study, the prevalence for the localisation of pain in
the shoulders ranked second while that of the neck ranked third which was similar to
that reported by two SA studies (Dyosi and Nyantumbu 2007, Madiba et al. 2013).
Botha and Bridger (1998) found the opposite, with the neck and shoulders ranking
second and third, respectively. As in the current study, the remaining body sites of
the other SA studies did not show any particular pattern in the localisation of pain.
The broad similarities in the South African studies suggest that the findings of this
thesis are reliable.
The prevalence in the SA study on nurses (84.1%) is encompassed in the range of
prevalences from 70.0%-85.5% reported by the studies investigating MSDs in nurses
from other countries. A Chinese study (Smith et al., 2004a) investigating 282 nurses
reported a prevalence of 70.0%; a Japanese study (Smith et al., 2006), including 844
nurses, reported a prevalence marginally higher (85.5%) than that of the SA study.
Two studies, one conducted in Iran and the other in Estonia, found prevalences that
are comparable to the SA study. The Iranian study (Choobineh et al., 2006) included
641 nurses and found a prevalence of 84.4% while the Estonian study (Freimann et
al., 2013) investigated 221 nurses and reported a prevalence of 84.0%.
The pattern of MSD localisation by body site in the SA study was similar to that
found in studies conducted in other countries. Localisation of pain in the low back
was the most common (Smith et al., 2004a, Choobineh et al., 2006, Smith et al.,
2006, Freimann et al., 2013) while localisation in the elbows was the least common
226
(Choobineh et al., 2006, Freimann et al., 2013). As in the SA study, localisation of
pain in the shoulders was second most common followed by neck (Smith et al.,
2006) while the opposite was true in other studies, with the neck (Smith et al., 2004a,
Freimann et al., 2013) being second and shoulders (Smith et al., 2004a, Choobineh
et al., 2006) third. The remaining body sites did not follow a particular pattern. The
preponderance of MSDs in the SA nurses and nurses from other countries is clear.
The contributing factors may be due to the unabated exposures to MSD risk factors
emanating from the nursing job and the susceptibility of nurses to the development
of MSDs. Futhermore, the lack of a regulatory framework to deal with MSD risk
factors in South Africa, particularly, in nursing, may be a hindrance in the prevention
and control of MSDs in nurses.
6.2.3 South African bank workers
Taking into consideration the number of body sites studied in the SA study, the
estimated 12-month prevalence (95% CI) of reported MSDs by SA bank workers in
at least one body site was found to be high at 76.7% (71.3%-82.1%). The result
obtained in an Egyptian study to determine the prevalence and work-related factors
of neck and upper extremity MSDs in telecommunications workers was 28.3%
(Fouad El-Bestar et al., 2011). In a Swedish study investigating the working
conditions and MSD symptoms among employees in a call centre the prevalence
was 77.2% (Norman et al., 2004).
In the SA bank workers, the low back (55.5%) had the highest prevalence followed
by neck (52.9%) and shoulders (36.4%). The low back prevalence was higher than
that (48.0%) obtained in the Swedish (Norman et al., 2004) and (27.0%-47.0%)
United Kingdom (Sprigg et al., 2007) studies. The MSD prevalence in the neck was

227
lower than that (62.0%-67.0%) found in the Swedish studies (Norman et al., 2004,
2008). The MSD prevalence in the shoulders was also lower than the one (41.0%)
reported in the Swedish study (Norman et al., 2004).
These results show high prevalences of upper extremity (neck and/or shoulders) and
low back MSDs both in SA bank workers and workers from other countries. These
MSDs may be due to the configuration of their workstations; work organisational
factors and susceptibility of the workers to the development of MSDs. In the SA
bank workers the lack of a regulatory framework in South Africa may be another
reason for the observed results.
6.3 Characteristics of MSDs
The characteristics of MSDs covered duration of pain, number of body sites affected
by pain and consequences of MSDs which included number of days away from work
with pain and consulting healthcare providers.
6.3.1 South African workers
Pain lasting at least seven days, in each body site of interest in the study was
reported by 8.0% of SA workers for pain in the elbow and 33.7% for pain in the low
back. Approximately 66.7% of MSDs reported by the New Zealand workers in the
past 12 months, the pain lasted for at least seven days (Harcombe et al., 2009). The
percentage of SA workers reporting multi-site pain was more than threefold (37.8%)
compared to 11.0% of Japanese workers (Matsudaira et al., 2011).
Besides experiencing pain, the SA workers also reported the impact of MSDs in their
lives such as consulting for pain and sickness absence. Close to 60.0% of the SA
workers consulted for MSDs with most of them consulting healthcare providers for
pain in the knees and low back. A larger percentage (27.6%) of SA workers reported
228
taking up to five days away from work due to MSDs than the 15.0% of New Zealand
workers (Harcombe et al., 2009). The difference in the proportions of SA (38.8%)
and Japanese workers (5.4%) who took days away from work due to pain in “any”
body site, was sevenfold.
The higher proportion of SA workers who consulted healthcare providers for pain as
compared to workers from other countries may be partly due to the severity of the
pain even though it was not determined in this study. Also, the higher levels of
sickness absenteeism may be partly attributed to the pain being disabling thus
preventing workers from going to work. Another possible explanation may be that
workers may have taken advantage of paid sick leave as provided for by the Basic
Conditions of Employment Act of 1997.
6.3.2 Public hospital nurses
In the SA nurses compared to American nurses classified as MSD cases (Trinkoff et
al., 2002), the pain duration of more than six days in the low back (33.5% vs 31.8%)
was higher, than that reported in the shoulders (20.3% vs 22.2%) and neck (15.5%
vs 24.1%). The term “MSD case” incorporated pain, frequency, intensity and
duration occurring at least one week or monthly in the past 12 months. The
differences in the definition of the duration of pain in the two studies are more likely
to have influenced the observed results.
Pain reported at three or more sites (35.5%) was the most common in the SA nurses
and was comparable to that (35.8%) reported by the Estonian nurses (Freimann et
al., 2013). The similarities in the measurement methods used in the SA and
Estonian studies may have contributed to the observed outcome. The

229
consequences of MSDs in the SA nurses included consulting medical or alternative
practitioners and taking days away from work because of pain. Of the SA nurses
who reported pain in at least one body site, 64.9% consulted for the pain which was
higher than the 42.6%, 31.0% and 30.3% reported by the Australian (Surawera et al.,
2013), Iranian (Choobineh et al., 2006) and Nigerian (Tinubu et al., 2010) nurses.
The SA nurses who had reported MSDs also reported that MSDs caused them to
take days away from work. A higher percentage (39.6% vs 22.5% and 18.4%) of the
SA nurses took days away from work due to MSDs than Australian (Surawera et al.,
2013) and Iranian (Choobineh et al., 2006) nurses. However, the average number of
days (2.4 days) away from work taken by each SA nurse per year due to MSDs was
similar to that taken by the Iranian nurses (Choobineh et al., 2006). In summary, the
characteristics of MSDs in the SA nurses reaffirm what is already known from the
literature that the social and economic cost of MSDs is substantial.
6.3.3 Bank workers
Pain lasting more than six days was common in all the body sites considered in the
SA bank workers. Low back was most common (33.9%) followed by neck (29.7%)
and shoulders (22.5%). The average (26.1%) of the combined neck and shoulder
results is closer to 27.4% which is the combined result of neck and shoulder MSDs in
the two call centres investigated in the Brazilian study (Ferreira and Saldiva, 2002).
In this study, the duration of symptoms was greater than seven days with sickness
absence of any duration in the current job of the operators which was less than a
year.
The reporting of MSDs in two body sites was most common at 19.5%. Multi-site pain
in this case, pain reported in more than one body sites was 59.7%. This result is

230
higher than the 50.0% of Italian call centre operators who reported pain in more than
one body sites (d'Errico et al., 2010).
Sickness absence due to MSDs in the past year was 38.1% in the SA bank workers.
This result was higher than that found in the Brazilian study where 20.9% of call
centre operators were absent from work due to MSDs (Ferreira and Saldiva, 2002).
More than half (51.4%) of the SA workers who reported MSDs consulted medical or
alternative practitioners for pain. Of these workers, 49.4% consulted for pain in the
neck which exceeded those who consulted for pain in the low back (48.1%). These
results are higher than the 45.0% of call centre operators who consulted a physician
in the Italian study and 39.0% who consulted for pain in the neck (d'Errico et al.,
2010).
6.4 Risk factors for prevalent MSDs
Individual risk factors, physical and psychosocial work risk factors were associated
with MSDs in SA workers. These were somatising tendency, past injuries, sex, age
group, occupational group and repeated elbow bending for more than an hour in an
average day and job dissatisfaction. Individual risk factors were associated with
MSDs in public hospital nurses and bank workers. Somatising tendency and age
group was associated with MSDs in public hospital nurses and somatising tendency,
past injuries, sex and age group in SA bank workers. Physical and psychosocial
work risk factors did little to explain MSDs in these two groups of workers.
6.4.1 Somatising tendency
6.4.1.1 South African workers
Somatising tendency was positively associated with MSDs in the SA workers. It
showed linear trends in the effect of one and two or more distressing somatic
231
symptoms compared to no symptoms. The predicted prevalence of 24.9% would
make somatising tendency the risk factor producing the second largest estimated
increase of MSD prevalence in SA workers reporting two or more distressing somatic
symptoms in relation to those reporting no symptoms, in this study.
The associations of somatising tendency with MSDs have been found in studies
conducted in groups of workers in other countries A Japanese study investigating
the risk factors for MSDs in four groups of Japanese workers found consistent,
positive and statistically significant associations of two or more distressing somatic
symptoms in relation to no somatic symptoms in the past month with pain in all the
body sites considered in the study (Matsudaira et al., 2011). Another study using the
fifth European Working Conditions data, evaluated the role of risk factors for MSDs
in 34 European countries including 27 occupational groups (Farioli et al., 2014). This
study found consistent, positive and statistically significant associations between one
and two or more distressing somatic symptoms in the past year and pain in the back
and neck or upper limbs. The SA study is in congruence with these studies.
Before addressing the objectives, background data analysis showed that a number
of factors namely, financial difficulties, frightening situation, adverse beliefs about the
work-relatedness of MSDs, poor mental health status and time pressure at work
were significantly associated with somatising tendency in the SA workers. These
factors may have acted as triggers of somatising tendency. Somatising tendency
can be explained by the concept of somatisation (Lipowski, 1988) which suggests
that somatising tendency is psychogenic since the somatic symptoms occur without
any demonstrable underlying pathology. Most MSDs are categorised as non-specific
because similar to somatic symptoms, they have been found to occur without any
232
underlying pathology (Aptel et al., 2002, Buckle and Devereux, 2002, Punnett and
Wegman, 2004, Coggon et al., 2012). This feature puts them in the same category
as somatic symptoms and their association with somatising tendency characterises
them as somatic symptoms (Baker et al., 1999). Based on the characterisation of
MSDs as non-specific, it can be said that most of the MSDs reported by the SA
workers were non-specific even though no clinical examination was performed to
determine this. Also, it can be said that they belong to the somatic syndrome as
stated by others (Vargas-Prada et al., 2016).
6.4.1.2 Public hospital nurses
Somatising tendency was positively and statistically associated with MSDs in the
effect of two or more distressing somatic symptoms in relation to no symptoms. The
predicted prevalences indicated that somatising tendency is estimated to increase
the prevalence of MSDs in the nurses by up to 27.1%.
Studies in other countries investigating risk factors for MSDs in nurses have reported
positive and statistically significant associations with somatising tendency. A study
conducted among 1 111 Australian nurses found association with pain in the wrists
or hands in the past month, the only body site investigated in the study (Surawera et
al., 2013). In their study which included 221 Estonian nurses, Freimann and
colleagues (2013) found associations with pain in more than one site and the neck in
the past 12 months. Another study conducted among Brazilian (193) and Italian
(588) nurses reported associations with pain in more than one site, low back, neck
and shoulders in the past month (Carugno et al., 2012). The SA study is in accord
with these studies.
233
In the SA study more than half of the nurses reported somatising tendency.
Somatisation has been linked with psychological distress and job stress (De Gucht et
al., 2003). This may imply that somatisation in the SA nurses is influenced by
individual psychological and adverse work organisational factors. These factors
were adverse beliefs about the work-relatedness of MSDs, poor mental health, job
insecurity and dissatisfaction, which were found to be associated with somatising
tendency during background data analysis in this study.
6.4.1.3 South African bank workers
Somatising tendency was associated with MSDs in most body sites in the SA bank
workers. It was predicted to increase the prevalence of MSDs by 27.1% in bank
workers reporting two or more distressing somatic symptoms in relation to those
reporting no symptoms. This would make somatising tendency the risk factor
producing the largest estimated increase of MSD prevalence in this study. None of
the reviewed studies on workers performing CTI tasks included somatising tendency
among the risk factors studied.
In the SA bank workers, somatising tendency may have been influenced by
psychological individual risk factors and psychosocial aspects of work based on
background data analysis of the SA bank workers’ data. These risk factors include
frightening situation, poor mental health and time pressure at work.
6.4.2 Past injuries
6.4.2.1 South African workers
“Past injuries” was associated with MSDs in SA workers. A literature review on risk
factors associated with MSDs found studies showing no association and those
showing associations with past injuries (Malchaire et al., 2001). More recent studies
234
have, however, shown positive associations between past injuries and MSDs. A
United States cross-sectional study using data from the General Social Survey was
conducted to investigate pain in the upper extremity (arms) and low back (back) and
associated risk factors in 1 484 US adults classified into eight occupational groups
(Waters et al., 2007). The study showed strong associations between reports of
sustaining injuries three times or more at work in the past year and pain in the back
and arms. A similar study which included 10 body sites of MSDs (neck, shoulder,
upper back, lower back, thigh/knee, leg, ankle, elbow, hand/wrist and finger) was
conducted in China amongst 3 248 workers employed in nine industry types (Yu et
al., 2012). The findings of this study also showed positive associations between past
injuries and MSDs.
The increased odds of reporting MSDs related to “past injuries” by the SA workers,
may reflect acquired vulnerability or lower tolerance in the affected body site (Cole
and Rivilis, 2004). Injuries usually arise through traumatic damage to the tissues
(Coggon et al., 2012). After the injury, an inflammatory response is initiated to
replace or repair the injured tissues. Healing of the affected area would occur
typically with the formation of scar tissue. The tolerance threshold level of this area
to repeated strains from physical and psychosocial stresses may be lowered. As a
result the area becomes more prone to MSDs (Barbe and Barr, 2006).
6.4.2.2 South African bank workers
“Past injuries” was also positively associated with MSDs in the SA bank workers.
One of the reviewed studies which included “past injuries” in the risk factors studied,
found an association with MSD symptoms in the neck or shoulders and elbows or
wrists in 775 Italian call centre operators (d'Errico et al., 2010). One of the objectives
235
of the South African study was to assess the relationship between MSD symptoms in
the upper limbs and work-related risk factors in the operators. The increased odds
of reporting MSDs by the SA bank workers reflect the acquired vulnerability and low
tolerance threshold level conferred by past injuries.
6.4.3 Sex
6.4.3.1 South African workers
Sex (women) was positively associated with MSDs in SA workers. These findings
are in line with literature reviews such as the one by Malchaire and colleagues
(2001). Another study by da Costa and Viera (2010) found “women” to have
reasonable evidence of a causal relationship with MSDs in longitudinal studies.
Similarly, Farioli and colleagues (2010) conducted a study of 43 816 workers to
determine the role of individual, occupational and social risk factors in 27
occupational groups from 34 European countries. In this study, “men” was
negatively associated with pain in the back and neck or upper limbs in the past year.
Other population based studies have shown associations between sex “women” and
MSDs. One was conducted in Belgium amongst 3 829 Flemish and French
speaking people to explore the influence of socio-cultural and work-related factors on
pain in the low back (Skovron et al., 1994). Sex “women” was associated with a
history and first episode of pain in the low back. A study based on the 1998 Quebec
Health and Social Survey with 11 735 workers was conducted to compare two
analytical strategies for a number of MSDs with a wide range of exposures (Messing
et al., 2009). In the multiple regression analysis, “women” was significantly
associated with pain in the neck, lower legs or calves and pain in the feet or ankles
in the final model after controlling for the factors measured in the study.
236
Possible explanations for the sex differences in the odds of reporting MSDs in the
SA workers can be categorised under anthropometric factors (Cole and Rivilis, 2004,
Treaster and Burr, 2004), physical and psychosocial aspects of work (Treaster and
Burr, 2004) and social responsibility (Messing et al., 2003, Treaster and Burr, 2004).
The majority of women in the SA workers had abnormal BMI compared to the
minority of men (64.6% vs 34.1%). The implication of body size of these women
may be that during task performance the interaction with work activities and
workstation subjects the body to biomechanical stresses (Stevenson et al., 1996) of
the upper limbs in particular. This may lead to more frequent reporting of pain in the
upper limbs by the women than men. There were significant differences in the
reporting of repeated elbow bending for more than an hour in an average day (84.5%
vs 15.5%), time pressure at work (80.9% vs 19.1%) and job insecurity (78.9% vs
21.1%) between women and men. These factors have been associated with pain in
the upper limbs (Treaster and Burr, 2004). Women’s work tends to overload the
upper limbs and women may use different workstyles than those used by men and
may react differently to psychosocial stressors such as time pressure than men
(Treaster and Burr, 2004). As a result, they become more prone to developing pain
in the upper limbs than men. Another possible explanation of the effect of sex
“women” on the reporting of MSDs is the differences in social responsibility between
women and men (Messing et al., 2003). SA women are more involved in the
performance of household chores than men. Consequently the strain from using the
upper limbs while cleaning the house, for instance, may be compounded by
workplace exposures hence, the increase in reporting pain in the upper limbs.
However, these exposures were not measured in this study. The effect of sex

237
“women” is estimated to increase the prevalence of MSDs in the SA workers by up to
19.0%.
6.4.3.2 South African bank workers
Sex (women) was positively associated with MSDs in the SA bank workers. Other
studies investigating risk factors for MSDs in call centre workers found sex
differences in the reporting of MSDs. A Swedish study assessing associations
between exposures and MSD symptoms among 1 183 call centre operators found
women to be at increased odds of reporting pain in the neck or shoulders and arms
or hands than men operators (Norman et al., 2008). Similar results were obtained in
another study conducted in Taiwan (Lin et al., 2009). The study explored the
associations between perceived stress and multiple physical discomforts in
telecommunications call centre operators. It found an association between MSD
discomfort and sex “women”. Another study conducted in Italy to assess the
relationship between pain in the upper limbs and potential risk factors in call centre
operators reported increased odds for reporting pain in the neck or shoulders by
women than men operators (d'Errico et al., 2010).
One of the explanations given by Norman and colleagues (2008) for the sex
difference observed in their study was anthropometric factors. Similarly, in the SA
bank workers, BMI presented a sex difference with 59.0% vs 41.0% of women bank
workers having abnormal BMI compared to men. Furthermore, in the SA bank
workers the sex difference was explained by the significantly higher reporting of
repeated elbow bending for more than one hour in an average day by women bank
workers (71.5%) than men (28.5%). Additional details about factors explaining sex
differences in the previous section also apply in SA bank workers.
238
6.4.4 Age group
6.4.4.1 South African workers
Older age groups (40-49 and 50 years and above) were associated with MSDs and
demonstrated linear trends in the SA workers. The relationship between age group
and MSDs has been inconsistent across studies with only 40% of the studies
showing associations between age and MSDs (Malchaire et al., 2001). The SA
study is in agreement with that of Farioli and colleagues (2014) who found similar
results in a study to explore the variation in MSDs between European countries and
the extent to which they might be explained by, among others, personal risk factors
using data from the fifth European Working Conditions Survey. In the Farioli and
colleagues’ study, although there were younger workers included in comparison with
the SA study, older age groups in 10-year age bands between 25 and 64 years
increased the odds of reporting pain in the back and neck or upper limbs
respectively, in relation to the age group 15-24 years. Moreover, the ORs increased
with increasing age groups. In contrast, a study investigating the determinants of
MSDs among 3 479 workers from 60 factories in China found a negative association
between MSDs and age group (Yu et al., 2012). The ORs showed inverse
relationships between MSDs and age group in 10-year age bands between 25 and
45 years and above compared to less than or equal to 24 years age group. One of
the explanations, was seniority which meant that they were less exposed to the
hazards in the workplace. However, in the SA workers, the increase in the odds of
MSDs with older age groups may represent cumulative exposure to MSD risk factors
both at work and outside of work (Cole and Rivilis, 2004) although the extra work
physical risk factors were not considered in this study.
239
6.4.4.2 Public hospital nurses
Age groups (40-49 and 50 years and above) was found to be associated with MSDs
in the SA nurses. Associations with age group and MSDs have been reported by
studies in other countries. For example, a study examining relationships between
risk factors and MSDs in 351 Greek nurses reported an association with older age
group as in our study (Alexopoulos et al., 2003). In this study age group greater than
40 years was associated with pain in the shoulders. Lagerström and colleagues
(1996) reported an increase in odds of ongoing MSD symptoms in the neck,
shoulders, hands and knees for every 10-year increase in age in 688 Swedish
nurses. Every one year increase in age was found to be associated with shoulder
MSD case in 1 163 American nurses (Trinkoff et al., 2003).
The result obtained from MSD association with the 40-49 years but not the 50 years
and above age groups in the SA nurses is unusual. The expectation in this case
would be that both age groups would be associated with MSD pain. The observed
result may be spurious due to multiple comparisons in the 40-49 years age group
from analysing many explanatory variables in the study. In the 50 years and above
age group, it could have arisen from the lack of power in the study due to small
numbers.
6.4.4.3 South African bank workers
Older age groups (40-49 and 50 years and above) was found to be positively and
significantly associated with MSDs in the SA bank workers. They even showed
linear trends with MSDs.
The reviewed studies showed inconsistent results with one showing association
between MSDs and age group while two did not show associations. The Italian
240
study demonstrated an association between greater than 49 years age group and
pain in the neck or shoulders (d'Errico et al., 2010). The Swedish and Taiwanese
studies failed to show associations between age group and MSDs (Norman et al.,
2008, Lin et al., 2009).
The associations of MSDs with older age groups in the SA bank workers are in line
with the length of service they have had with the bank. About 59.6% of those aged
40 years and above had spent six years or more in their current positions in the bank
compared to the 40.4% of those under 40 years. The older age groups (40 years
and above) and longer service (6 years and above) of these SA bank workers
suggest cumulative exposure at work and outside of work and their acquired
vulnerability to the development of MSDs (Cole and Rivilis, 2004).
6.4.5 Occupational group
6.4.5.1 South African workers
Occupational group (bank workers) had lower odds of reporting pain in “any” body
site but had increased odds of reporting pain in the neck compared to the nurses.
Similar findings were reported in a study to assess the prevalence of MSDs and their
associations with risk factors in four occupational groups which included computer
operators and nurses in Sri Lanka (Warnakulasuriya et al., 2012). The nurses had
increased odds of reporting pain in the low back and knees compared to computer
operators whereas, in the SA study, the nurses had increased odds of reporting pain
in all the body sites of interest compared to bank workers. Another study, similar to
the SA study except that it investigated incident rather than prevalent MSDs, was
conducted in Iranian nurses and office workers using computers (Sadeghian et al.,

241
2013). The study found that pain in the neck or shoulders was more common in
office workers than in nurses, probably due to computer use.
“Occupational group” in the SA workers may indicate the differences in the MSD risk
factors reported by the nurses and the bank workers. Lifting loads of 25 kg and
above by hand, use of keyboard for more than four hours in an average day and
somatising tendency were identified as possible factors responsible for the different
patterns of MSD occurrence in nurses and bank workers. The reports of lifting loads
of 25 kg and above by hand were higher in nurses than in bank workers (94.8% vs
5.26%) while the majority of bank workers reported the use of keyboard for more
than four hours in an average day (89.1% vs 10.9%) and somatising tendency
(72.0% vs 56.2%) compared to nurses.
6.5 Physical and psychosocial work risk factors
Physical and psychosocial work risk factors were associated with MSDs in SA
workers only. These were repeated elbow bending for more than an hour in an
average day and job dissatisfaction.
6.5.1 South African workers
A number of studies have found associations between physical work activities and
MSDs. A New Zealand study which included nurses, postal workers and office
workers reported associations between a total task score (eight physical work tasks
combined to give a total task score) and pain in the low back, shoulders, elbows and
wrists or hands (Harcombe et al., 2010). Another study conducted in four
occupational groups, including nurses and office workers in Japan, examined
prevalence and risk factors for MSDs (Matsudaira et al., 2011). Associations were
found between pain in the low back, wrists or hands, and knees and respective risk
242
factors defined for each body site which were lifting weights of 25 kg by hand, use of
keyboard or other repetitive movements of the wrists or fingers for at least four hours
in total and kneeling or squatting for more than one hour in total. The observed
patterns of reported MSDs in the different studies may reflect the differences in the
physical work activities of the studied occupational groups (Warnakulasuriya et al.,
2012).
Most of the SA workers (82.5%) reported repeated elbow bending for more than an
hour on an average day but the corresponding body site (elbow) had the least
reported prevalence of MSDs (14.3%) suggesting that repeated elbow bending may
not be that important in the development of elbow pain in SA workers. Furthermore,
the ORs of “repeated elbow bending” were high and the CIs were wide in all the
different stages of multiple regression analysis probably due to small numbers of SA
workers reporting pain in the elbows. For this reason, the point estimate for elbow
pain may be unreliable.
The only psychosocial work-related risk factor associated with MSDs in the SA
workers was job dissatisfaction. Studies have shown inconsistencies in the
associations between MSDs and job dissatisfaction. A study examining the
association between physical and psychosocial risk factors in three groups of New
Zealand workers, reported a positive association between pain in the shoulders and
job dissatisfaction (Harcombe et al., 2010). In contrast, a study to determine MSD
prevalence and risk factors in four groups of Japanese workers failed to show an
association between MSDs and job dissatisfaction (Matsudaira et al., 2011).
More than a third of the SA workers reported dissatisfaction with their jobs as a
whole. Of these, a quarter of them had also reported lack of social support at work.

243
One of the sources of job dissatisfaction has been linked to adverse organisational
aspects of work such as poor relationships with managers and colleagues (Sousa-
Poza and Sousa-Poza, 2000). Lack of social support was identified as a possible
source of job dissatisfaction in the SA workers despite being reported by the least
number of workers compared to the other work organisational factors. In order to
change the negative perceptions of the SA workers about their jobs, sources of job
dissatisfaction need to be identified. However, this was outside the scope of this
study.
6.6 Follow-up study on public hospital nurses
6.6.1 Incident MSDs
“Any” incident MSDs (95% CI) was estimated at 47.6% (36.5%-58.6%) in the SA
nurses. This was higher than that reported in studies of nurses from other countries.
A study of 971 Spanish workers comprising nurses and office workers found 4.2% of
“any” incident MSDs from a total number of affected body sites reported by the
workers (Vargas-Prada et al., 2013). Seventeen percent of the 518 Greek workers,
including nurses, reported “any” incident MSDs at two or more body sites (Solidaki et
al., 2012). An Iranian study to explore the predictors of incident and persistent
MSDs in their workers reported 25.0% of incident pain in the neck or shoulders in
the nurses (Sadeghian et al., 2013), whereas a study investigating incident pain and
risk factors in the neck or shoulders in 1 239 English nurses reported 34.0% of
incident pain in the neck or shoulders (Smedley et al., 2003).
Incident MSDs for the different body sites of the SA nurses varied according to the
body site. Incident low back pain had the largest percentage (32.8%) followed by
incident shoulder pain (24.5%) and incident neck pain (22.1%). A similar pattern
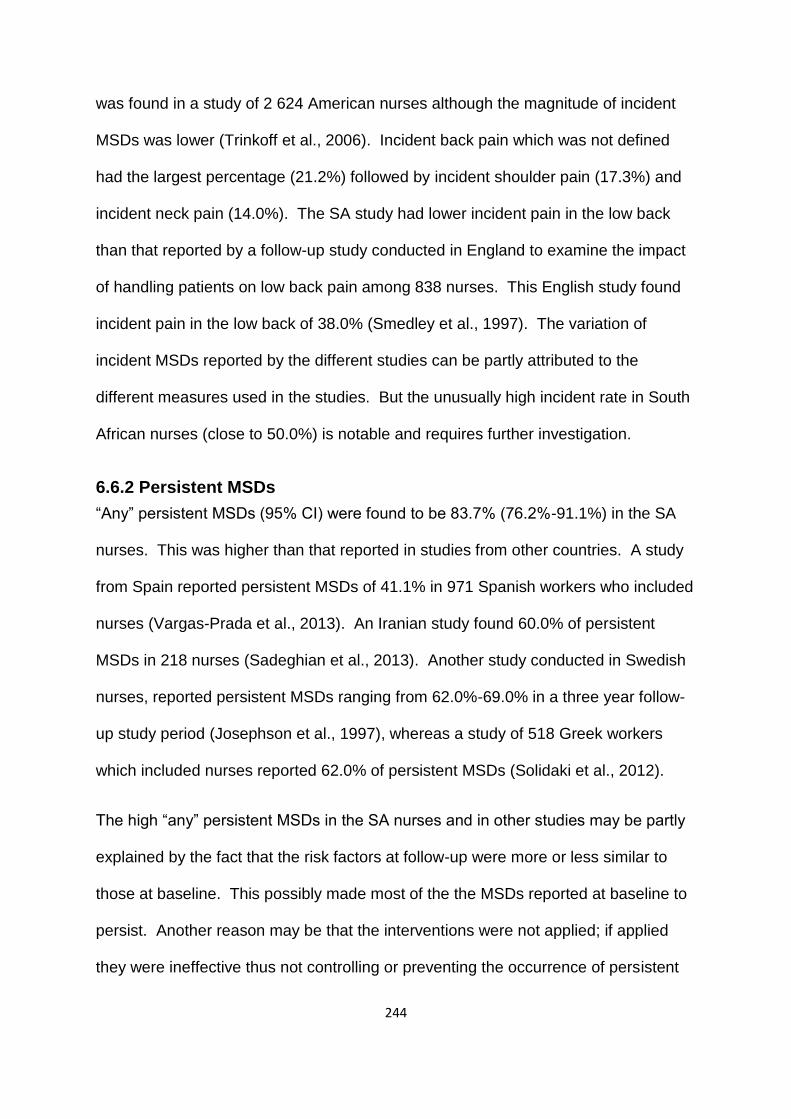
244
was found in a study of 2 624 American nurses although the magnitude of incident
MSDs was lower (Trinkoff et al., 2006). Incident back pain which was not defined
had the largest percentage (21.2%) followed by incident shoulder pain (17.3%) and
incident neck pain (14.0%). The SA study had lower incident pain in the low back
than that reported by a follow-up study conducted in England to examine the impact
of handling patients on low back pain among 838 nurses. This English study found
incident pain in the low back of 38.0% (Smedley et al., 1997). The variation of
incident MSDs reported by the different studies can be partly attributed to the
different measures used in the studies. But the unusually high incident rate in South
African nurses (close to 50.0%) is notable and requires further investigation.
6.6.2 Persistent MSDs
“Any” persistent MSDs (95% CI) were found to be 83.7% (76.2%-91.1%) in the SA
nurses. This was higher than that reported in studies from other countries. A study
from Spain reported persistent MSDs of 41.1% in 971 Spanish workers who included
nurses (Vargas-Prada et al., 2013). An Iranian study found 60.0% of persistent
MSDs in 218 nurses (Sadeghian et al., 2013). Another study conducted in Swedish
nurses, reported persistent MSDs ranging from 62.0%-69.0% in a three year follow-
up study period (Josephson et al., 1997), whereas a study of 518 Greek workers
which included nurses reported 62.0% of persistent MSDs (Solidaki et al., 2012).
The high “any” persistent MSDs in the SA nurses and in other studies may be partly
explained by the fact that the risk factors at follow-up were more or less similar to
those at baseline. This possibly made most of the the MSDs reported at baseline to
persist. Another reason may be that the interventions were not applied; if applied
they were ineffective thus not controlling or preventing the occurrence of persistent

245
MSDs. It is also possible that the psychological and cultural make up of the nurses
may have predisposed them to persistent pain through propensity to report pain. It
has been found that certain individuals have a propensity to report pain which does
not change over short periods of time (Coggon et al., 2016). Lastly, the underlying
pathophysiological mechanism of MSDs may result in permanent damage which
would result in persistent pain.
Except for the knees, a body site infrequently investigated in nurses, persistent
MSDs in the different body sites of the SA nurses was lower than that found in
studies from other countries. In this study, persistent pain in the knees was the
highest (71.4%) followed by low back (57.8%), neck (48.7%) and shoulders (43.9%).
In a study conducted in Spain among 971 Spanish workers, which included nurses,
persistent pain in the low back was reported to be 59.4% (Vargas-Prada et al.,
2012). Persistent pain in the neck or shoulders in 218 Iranian nurses was 60.0% in a
study exploring the predictors of incident and persistent pain in the neck or shoulders
(Sadeghian et al., 2013). In a two year follow-up study investigating the temporal
changes in incident, persistent, chronicity, and recovery from pain in the neck and
shoulders in a group of 769 nursing home workers in the Netherlands found
persistent pain in the neck ranging from 61.0%-64.7% and persistent pain in the
shoulders ranging from 64.1% and 69.4% (Luime et al., 2005).
Persistent knee pain overtook persistent low back pain making it the most common
and probably most important persistent MSD in SA nurses. This may be due to the
morphology of the knees especially the cartilage and bones which may be more
susceptible to permanent damage. Also, close to 70.0% of the nurses were in the
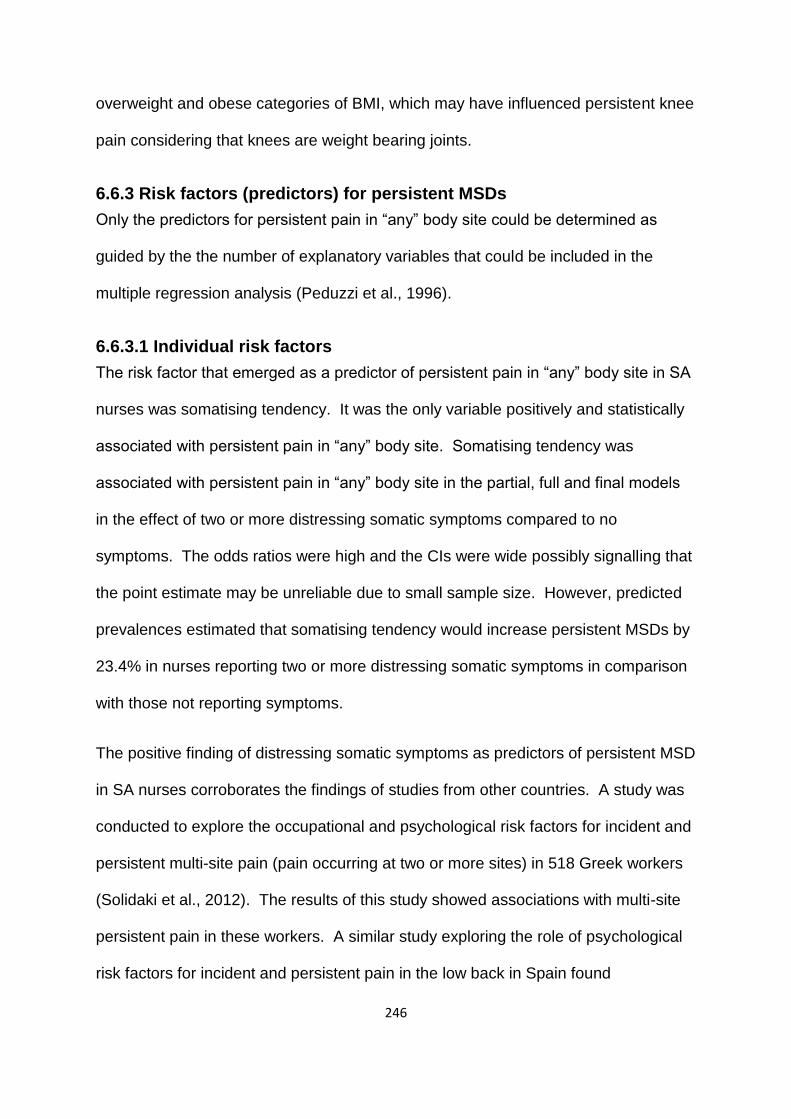
246
overweight and obese categories of BMI, which may have influenced persistent knee
pain considering that knees are weight bearing joints.
6.6.3 Risk factors (predictors) for persistent MSDs
Only the predictors for persistent pain in “any” body site could be determined as
guided by the the number of explanatory variables that could be included in the
multiple regression analysis (Peduzzi et al., 1996).
6.6.3.1 Individual risk factors
The risk factor that emerged as a predictor of persistent pain in “any” body site in SA
nurses was somatising tendency. It was the only variable positively and statistically
associated with persistent pain in “any” body site. Somatising tendency was
associated with persistent pain in “any” body site in the partial, full and final models
in the effect of two or more distressing somatic symptoms compared to no
symptoms. The odds ratios were high and the CIs were wide possibly signalling that
the point estimate may be unreliable due to small sample size. However, predicted
prevalences estimated that somatising tendency would increase persistent MSDs by
23.4% in nurses reporting two or more distressing somatic symptoms in comparison
with those not reporting symptoms.
The positive finding of distressing somatic symptoms as predictors of persistent MSD
in SA nurses corroborates the findings of studies from other countries. A study was
conducted to explore the occupational and psychological risk factors for incident and
persistent multi-site pain (pain occurring at two or more sites) in 518 Greek workers
(Solidaki et al., 2012). The results of this study showed associations with multi-site
persistent pain in these workers. A similar study exploring the role of psychological
risk factors for incident and persistent pain in the low back in Spain found

247
associations with persistent pain in the low back in 971 Spanish workers. Vargas
Prada et al., 2012, 2013). Another study using the data from the same study
population showed association with disabling persistent MSDs (Vargas-Prada et al.,
2013). However, one study from Iran failed to show an association with somatic
symptoms and persistent pain in the neck or shoulders in 383 Iranian workers
(Sadeghian et al., 2013).
The possible explanations for somatising tendency to be associated with MSDs in
the SA nurses presented in section 6.4.1.2 suffice in explaining somatising tendency
as a predictor of “any” persistent pain in SA nurses.
6.7 Ethnicity as a possible risk factor for MSDs in the study
Ethnicity in the SA study was represented by workers who belonged to three ethnic
groups, namely Sotho, Nguni and “Other”. The “other” group comprised: Afrikaner,
Coloured, Indian, Tsonga and Venda subjects. Ethnic group was inconsistently
associated with MSDs in the SA workers (combined), nurses and bank workers.
“Other” group was positively associated with pain in the wrists or hands in the
combined dataset and in both groups separately. Pain in the low back was
associated with SA workers and bank workers but not nurses; and pain in the upper
limbs with the combined datasets only. Nguni group was associated with pain in the
wrists or hands in the SA workers and bank workers.
The findings of this SA study are in line with those of a recent study conducted in the
South African mining industry which used language as a proxy for ethnicity (Dias,
2014). The Dias study reported associations between Sotho and “other” languages
with upper limb MSDs but no consistent associations were found. Studies which
included ethnicity or race in their investigations of MSD risk factors have found

248
inconsistent results. Three of such studies have been conducted in the US. One of
these studies examined the relationship between workplace factors and work-related
MSDs in 498 telecommunications workers. The study found an association between
“non-white” race and pain in the elbows and no association with other MSDs
considered in the study in relation to white race. Non-white race comprised African-
American, Hispanic, Asian and Native American (Hales et al., 1994). The next two
studies showed negative associations between pain in the neck or shoulders and
ethnicity (non-whites) in 632 newly employed computer users (Gerr et al., 2002)
while in the other study negative association was between pain in the neck and back
and race (non-whites) among 1 163 nurses (Trinkoff et al., 2003). The non-white
groups were similar to those of the first study but included another group “other”.
Hales and colleagues (1994) and Dias (2014) explained their positive findings as
possible statistical artefacts due to multiple comparisons, while in the other studies
no explanations were given.
The terms ethnicity and race have sometimes been used interchangeable although
their meanings differ (Senior and Bhopal, 1994, Chaturvedi, 2001). Race in
epidemiological studies has been discouraged because of its inaccurate and
misleading use in classifying population groups according to biological variation
based on genetic differences (Chaturvedi, 2001, Bradby, 2003). Ethnicity is
increasingly the preferred term (Chaturvedi, 2001, Bradby, 2003) and has been used
in the SA study as an initial descriptor of elements of culture in the identification of
MSD risk factors. However, as a multi-dimensional social construct, the complexity
and the challenges ethnicity presents in epidemiological studies is recognised. Of

249
particular importance is its method of measurement and constitution as it pertains to
this SA study.
This SA study used self perception of ethnicity (Heath, 1991) as its measure. The
groups of workers studied classified themselves as belonging to one of the ethnic
groups considered in the study. This type of self classification may change with time
due to various reasons. One of the reasons could be that when women get married
they take up the self identification with their husbands’ ethnicity which amount to
conversion to the husband’s ethnic group. This switch from one ethnic group to the
other has implications for the constitution and identities of ethnic groups. This
scenario invokes the history of the advent of the SA ethnic groups which were
created by missionaries and colonial administrators in the nineteenth and twentieth
centuries. Diverse groups of SA people were ordered under narrow linguistic lines,
rendering them “static’ and “homogeneous” (Braun and Hammonds, 2008). On the
contrary, the uptake of the spouse’s ethnic identity is one of the indicators of the
dynamic nature and heterogeneity of the SA ethnic groups. The difficulty in
measuring ethnicity and its heterogeneity has been identified as problematic in
epidemiological studies (Senior and Bhopal, 1994, Chaturvedi, 2001) as ethnicity
encompasses a wide range of exposures, both biological and environmental
(Chaturvedi, 2001). The results of the SA study need to be interpreted in this light.
6.8 Strengths and limitations of the study
6.8.1 Strengths
The strengths of the SA study lie in its study design, response rates, its use of
standardised and validated instruments, the number of explanatory variables
selected, the inclusion of bank workers, and the use of predicted prevalences.
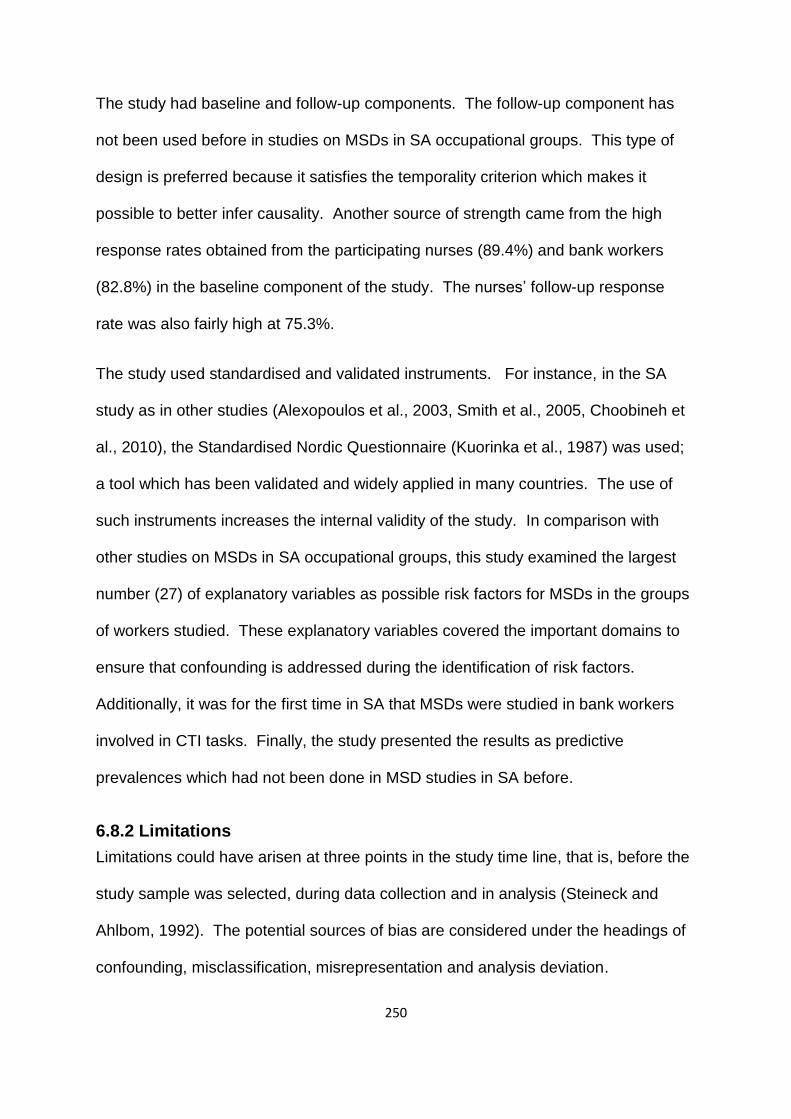
250
The study had baseline and follow-up components. The follow-up component has
not been used before in studies on MSDs in SA occupational groups. This type of
design is preferred because it satisfies the temporality criterion which makes it
possible to better infer causality. Another source of strength came from the high
response rates obtained from the participating nurses (89.4%) and bank workers
(82.8%) in the baseline component of the study. The nurses’ follow-up response
rate was also fairly high at 75.3%.
The study used standardised and validated instruments. For instance, in the SA
study as in other studies (Alexopoulos et al., 2003, Smith et al., 2005, Choobineh et
al., 2010), the Standardised Nordic Questionnaire (Kuorinka et al., 1987) was used;
a tool which has been validated and widely applied in many countries. The use of
such instruments increases the internal validity of the study. In comparison with
other studies on MSDs in SA occupational groups, this study examined the largest
number (27) of explanatory variables as possible risk factors for MSDs in the groups
of workers studied. These explanatory variables covered the important domains to
ensure that confounding is addressed during the identification of risk factors.
Additionally, it was for the first time in SA that MSDs were studied in bank workers
involved in CTI tasks. Finally, the study presented the results as predictive
prevalences which had not been done in MSD studies in SA before.
6.8.2 Limitations
Limitations could have arisen at three points in the study time line, that is, before the
study sample was selected, during data collection and in analysis (Steineck and
Ahlbom, 1992). The potential sources of bias are considered under the headings of
confounding, misclassification, misrepresentation and analysis deviation.

251
6.8.2.1 Confounding
Confounding can be described as the distortion in the estimate of effect of the
exposure factor of interest due to the influence of another factor that can increase or
decrease the odds of reporting the outcome of interest (Driscoll, 2011). Although a
large number of variables were adjusted for in the models, some potential
determinants of MSDs were not measured in this study. If they were associated with
explanatory variables of MSDs, they are potential confounders. Importantly, the
physical risk factors outside of work, such as house chores, may have acted together
with work-related risk factors, possibly influencing the odds of reporting upper limb
pain by the women in the study in a positive direction. The sex difference in the
reporting of upper limb pain by the women has been attributed to social responsibility
by other researchers (Messing et al., 2003, Treaster and Burr, 2004). There is also
a possibility that some of the workers might have been suffering from conditions that
produce symptoms of pain, for example cardio-vascular diseases, which might have
increased the odds of reporting MSD pain by these workers, if these diseases were
associated with other stressors.
6.8.2.2 Misclassification
Misclassification refers to the erroneous classification of an individual, a value, or an
attribute into a category other than that to which it should be assigned (Rothman et
al., 2008). The probability of misclassification given the true value may vary between
groups (differential misclassification) or may be the same in all study groups
(nondifferential misclassification). In the SA study, misclassification may have
occurred through information bias regarding exposure and outcome.
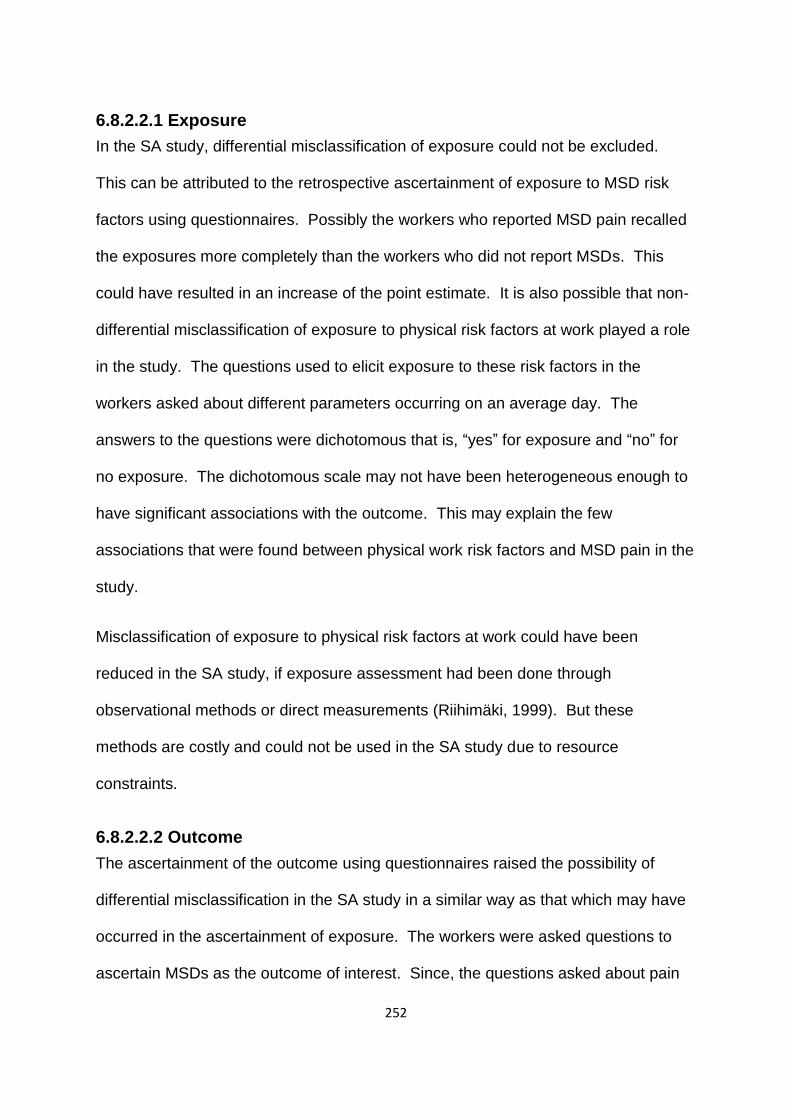
252
6.8.2.2.1 Exposure
In the SA study, differential misclassification of exposure could not be excluded.
This can be attributed to the retrospective ascertainment of exposure to MSD risk
factors using questionnaires. Possibly the workers who reported MSD pain recalled
the exposures more completely than the workers who did not report MSDs. This
could have resulted in an increase of the point estimate. It is also possible that non-
differential misclassification of exposure to physical risk factors at work played a role
in the study. The questions used to elicit exposure to these risk factors in the
workers asked about different parameters occurring on an average day. The
answers to the questions were dichotomous that is, “yes” for exposure and “no” for
no exposure. The dichotomous scale may not have been heterogeneous enough to
have significant associations with the outcome. This may explain the few
associations that were found between physical work risk factors and MSD pain in the
study.
Misclassification of exposure to physical risk factors at work could have been
reduced in the SA study, if exposure assessment had been done through
observational methods or direct measurements (Riihimäki, 1999). But these
methods are costly and could not be used in the SA study due to resource
constraints.
6.8.2.2.2 Outcome
The ascertainment of the outcome using questionnaires raised the possibility of
differential misclassification in the SA study in a similar way as that which may have
occurred in the ascertainment of exposure. The workers were asked questions to
ascertain MSDs as the outcome of interest. Since, the questions asked about pain

253
that occurred in the past 12 months, the workers had to rely on recall to answer
these questions. Those exposed to particular risk factors, would tend to recall the
outcome more readily than those without the said exposures (Driscoll, 2011), hence,
the differential misclassification of outcome. This would tend to inflate the point
estimate.
6.8.2.3 Misrepresentation
Misrepresentation occurs when the study subjects do not represent the target
population, for example through selection bias which arises from the methods used
to select the study participants from the target population, or if the study participants
select themselves by agreeing to participate in the study (Pearce et al., 2007).
Systematic differences between the characteristics of the participants selected for
the study and the characteristics of those not selected indicate that the study
participants are not representative of the target population (Beaglehole et al., 1993).
In the SA study, the selection of the study hospitals and bank was based on ensuring
that at least the main ethnic groups of South Africa were obtained. The study
hospitals were typical of the SA public hospitals regarding the tasks performed by
the nurses. Similarly, the study bank was typical of the four SA big banks in relation
to CTI tasks. External validity may be an issue for the nurses group in that the study
hospitals were large tertiary academic hospitals; working conditions may differ
between these hospitals and smaller less well resourced hospitals. Similarly, the
bank was one of the big four SA banks which are well resourced and working
conditions may differ between the study bank and other banks not belonging to the
big four banks. Consequently, caution is required in generalising the findings to all
hospital and bank settings. But it is reassuring that the findings of this study are
254
consistent with other local and international studies, suggesting that the findings are
generalisable.
Nurses were invited to participate in the study and those who were able to leave their
nursing stations volunteered to participate as the study was conducted during
working hours. In a similar manner, the bank workers were invited to take part in the
study. Selection bias could have been introduced if the nurses and bank workers
participated because they had MSDs. This would tend to increase the estimates of
MSD frequencies in the study. Again, it is reassuring that the findings of this study
were in accord with those of CUPID studies.
Workers who suffer from MSDs may leave their jobs for jobs with lower exposures.
In severe cases, the workers may become relegated from the labour market due to
disability from MSDs (Menzel et al., 2004). In the baseline component of the SA
study, such a scenario may have happened, leaving behind a relatively healthy
workforce. This phenomenon is known as the “healthy worker effect” and tends to
underestimate the disease estimate which in this case would be the MSD
prevalence. This phenomenon seems unlikely in the SA study as none of the nurses
who participated at follow-up had changed their jobs because of MSDs.
The participation and response rates of nurses at baseline and follow-up were
compared regarding MSD risk factors measured at baseline and the occurrence of
MSDs in the past month. The results showed minor differences between the two
measurement periods. However, when considering the nurses who participated at
follow-up only, the prevalence of MSDs in the past month at follow-up was
consistently higher than at baseline.
255
Studies investigating the predictors of incident and persistent MSD pain have done
similar comparisons of participation and response rates based on MSD risk factors at
baseline and found similar results as those of the SA study (Palmer et al., 2008,
Sadeghian et al., 2013). Furthermore both studies, when it came to arm pain
(Palmer et al., 2008) and neck or shoulder pain (Sadeghian et al., 2013) the
comparisons were similar. This was contrary to the results of the SA study. The
explanation for the results of the SA study is unclear.
6.8.2.4 Analysis deviation
Analysis deviation may arise during data analysis due to errors in data processing or
modelling (Steineck and Ahlbom, 1992). In the SA study, multiple regression
modelling and missing data were identified as possible sources of analysis deviation.
Binary logistic regression was used to determine the association between MSDs and
explanatory variables as possible risk factors for MSDs. The advantages of using
logistic regression are that a large number of explanatory variables can be
considered at the same time and it is flexible in the way in which terms in the model
are treated. In the logistic regression the OR has been used to estimate the
prevalence ratio. However, it has been found to overestimate the ORs of common
conditions. A study by Lagerström (1996), demonstrated that although the
prevalence ratios were generally lower than the odds ratios, the interpretation of the
results was similar, that is both ratios showed an association if there was one. It is
important to note that one of the objectives of the SA study was to determine the
associations between the explanatory variables and MSDs in the workers studied
and not the strength of the relationship between the two.

256
In the initial stages of data collection in the SA study, it was found that 33 workers
did not know their body weights and heights, hence the physical measurement of
these parameters rather than reliance on questionnaire data. This led to 33 missing
values for the BMI. In the logistic regression, the BMI was entered into the full model
excluding the missing values and again in the full model including the missing values
in a separate category to determine if there would be a change in the ORs. The
changes were minor and did not alter the structure or significance of the individual
variables in the final model. A Swedish study with 36 missing values for the variable
“work demands”, performed a similar check and obtained results similar to those
found in the SA study (Lagerström et al., 1996).
6.9 Contribution to existing knowledge
The SA study is unique and innovative in that it has generated and presented
predicted prevalences alongside odds ratios which has not been done in
studies on MSDs in nurses and/or bank workers in South Africa and
elsewhere. The predicted prevalences provide an alternative interpretation of
the results which is easy to understand compared to the odds ratios.
The combination of baseline components of two occupational groups the
nurses and bank workers (SA workers) in this study is novel in SA. The
results produced MSD prevalences and risk factors associated with MSDs.
The estimated prevalence of MSDs in the SA workers was found to be
80.5% (77.0%-84.0%).
The risk factors associated with prevalent MSDs were somatising
tendency, past injuries, job dissatisfaction, sex, age group,

257
occupational group and repeated elbow bending for more than an hour
on an average day.
For the first time in SA, a study on MSDs in nurses including baseline and
follow-up was conducted yielding risk factors associated with prevalent MSDs,
incident and persistent MSDs and a risk factor associated with persistent
MSDs.
The risk factor associated with prevalent MSDs was somatising
tendency and age group.
The estimated Incident MSDs was 47.6% (36.5%-58.6%) and
persistent MSDs 83.7% (76.2%-91.1%).
The risk factors associated with persistent MSDs was somatising
tendency.
MSDs in bank workers who perform CTI tasks were studied for the first time in
SA. The results included MSD prevalence and risk factors associated with
prevalent MSDs.
The estimated prevalence of MSDs was 76.7% (71.3%-82.1%).
The risk factors associated with prevalent MSDs were somatising
tendency, past injuries, sex and age group.
Ethnicity, uncommonly studied in South Africa, was found to be inconsistent
with MSDs in the groups of workers studied.
258
6.10 Conclusions
The findings of this study have highlighted that the two occupational groups studied
are high risk groups for MSDs. High prevalences of MSDs were found with low back
pain having the highest prevalence. In comparison, the nurses were at high risk of
“any” MSDs while bank workers were at high risk of neck MSD which suggests
differences in the jobs performed by these workers. MSDs caused workers to stay
away from work and consult healthcare providers. These have implications for
productivity at work and healthcare utilisation which are known to be drivers of the
economic cost of MSDs. Somatising tendency and older age groups were the risk
factors associated with MSDs in both occupational groups, thus indicating their
importance in the development of MSDs in the these groups. Ethnicity did not show
convincing evidence about its association with MSDs in this study.
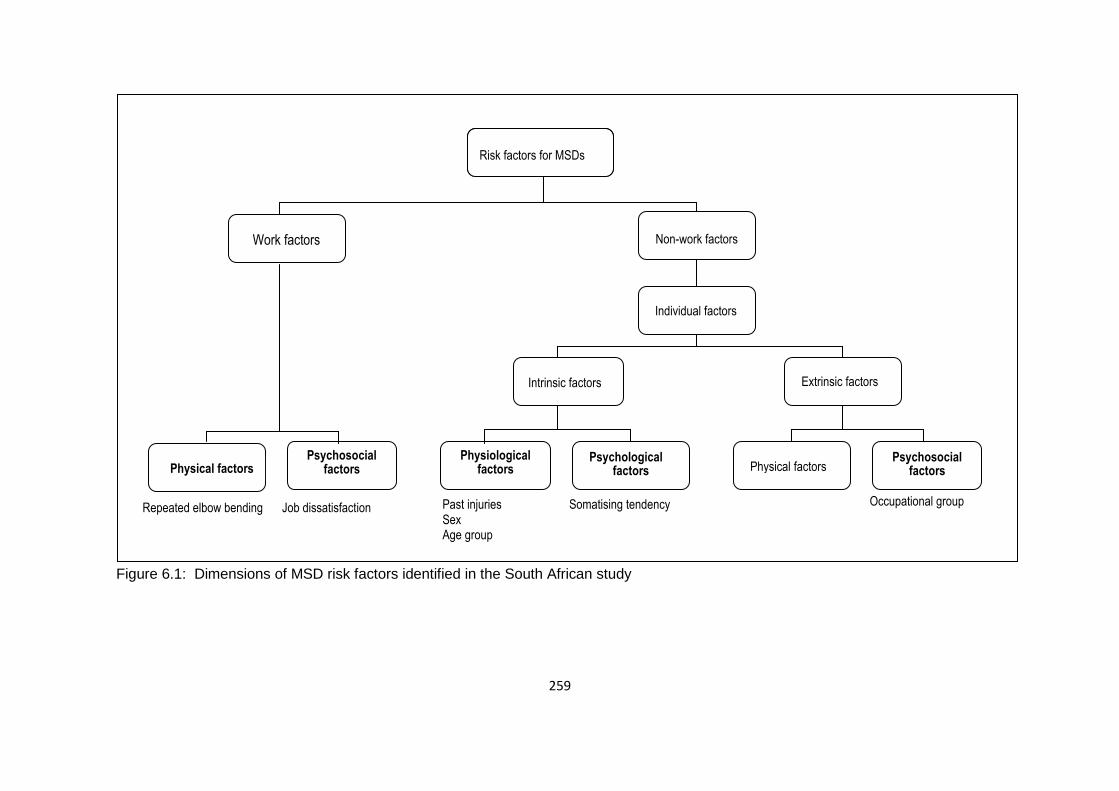
259
Figure 6.1: Dimensions of MSD risk factors identified in the South African study
Risk factors for MSDs
Somatising tendency
Past injuries Sex Age group
Job dissatisfaction Repeated elbow bending Occupational group
Work factors Non-work factors
Individual factors
Intrinsic factors Extrinsic factors
Psychological factors Physical factors
Psychosocial factors
Physiological factors
Psychosocial factors Physical factors
Risk factors for MSDs

260
References
ALEXOPOULOS, E. C., BURDORF, A. & KALOKERINOU, A. 2003. Risk factors for musculoskeletal disorders among nursing personnel in Greek hospitals. International Archives of Occupational and Environmental Health, 76, 289-294.
ALEXOPOULOS, E. C., BURDORF, A. & KALOKERINOU, A. 2006. A comparative
analysis on musculoskeletal disorders between Greek and Dutch nursing personnel. International Archives of Occupational and Environmental Health, 79, 82-88.
ANDO, S., ONO, Y., SHIMAOKA, M., HIRUTA, S., HATTORI, Y., HORI, F. &
TAKEUCHI, Y. 2000. Associations of self estimated workloads with musculoskeletal symptoms among hospital nurses. Occupational and Environmental Medicine, 57, 211-216.
APTEL, M., AUBLET-CUVELIER, A. & CLAUDE CNOCKAERT, J. 2002. Work-
related musculoskeletal disorders of the upper limb. Joint Bone Spine, 69, 546-555.
ARMSTRONG, T., BUCKLE, P., FINE, L., HAGBERG, M., HARING-SWEENEY, M.,
MARTIN, B., PUNNETT, L., SILVERSTEIN, B., SJØGAARD, G. & THEORELL, T. 1996. Musculoskeletal Disorders: Work-related Risk Factors and Prevention. International Journal of Occupational and Environmental Health, 2, 239-246.
ARMSTRONG, T. J., BUCKLE, P., FINE, L. J., HAGBERG, M., JONSSON, B.,
KILBOM, A., KUORINKA, I. A., SILVERSTEIN, B. A., SJOGAARD, G. & VIIKARI-JUNTURA, E. R. 1993. A conceptual model for work-related neck and upper-limb musculoskeletal disorders. Scandinavian Journal of Work, Environment & Health, 73-84.
ATTAR, S. M. 2014. Frequency and risk factors of musculoskeletal pain in nurses at
a tertiary centre in Jeddah, Saudi Arabia: a cross sectional study. BMC research notes, 7, 1-6.
BAKER, N. A., JACOBS, K. & CARIFIO, J. 1999. The ability of background factors,
work practices, and psychosocial variables to predict the severity of musculoskeletal discomfort. Occupational Ergonomics, 2, 27-41.
BARBE, M. F. & BARR, A. E. 2006. Inflammation and the pathophysiology of work-
related musculoskeletal disorders. Brain, Behavior, and Immunity, 20, 423-429.
BARONDESS, J. A., CULLEN, M., DE LATEUR, B., DEYO, R., DONALDSON, K. &
DRURY, C. 2001. Musculoskeletal disorders and the workplace: Low back and upper extremities. Washington, DC: National Academy of Sciences, 1-512.
261
BARSKY, A. J., GOODSON, J. D., LANE, R. S. & CLEARY, P. D. 1988. The
amplification of somatic symptoms. Psychosomatic Medicine, 50, 510-519. BEAGLEHOLE, R., BONITA, R. & KJELLSTROM, T. 1993. Measuring health and
disease. Basic Epidemiology, 13-20. BERGQVIST, U., WOLGAST, E., NILSSON, B. & VOSS, M. 1995. Musculoskeletal
disorders among visual display terminal workers: individual, ergonomic, and work organizational factors. Ergonomics, 38, 763-776.
BERNAL, D., CAMPOS-SERNA, J., TOBIAS, A., VARGAS-PRADA, S.,
BENAVIDES, F. G. & SERRA, C. 2015. Work-related psychosocial risk factors and musculoskeletal disorders in hospital nurses and nursing aides: a systematic review and meta-analysis. International Journal of Nursing Studies, 52, 635-648.
BERNARD, B. P. 1997. Musculoskeletal disorders and workplace factors: a critical
review of epidemiologic evidence for work-related musculoskeletal disorders of the neck, upper extremity, and low back. NIOSH.
BONZINI, M., VERONESI, G., CONTI, M., COGGON, D. & FERRARIO, M. M. 2015.
Is musculoskeletal pain a consequence or a cause of occupational stress? A longitudinal study. International Archives of Occupational and Environmental Health, 88, 607-612.
BORG, G. A. 1982. Psychophysical bases of perceived exertion. Medicine & Science
in Sports & Exercise, 14, 377-381. BOTHA, W. & BRIDGER, R. 1998. Anthropometric variability, equipment usability
and musculoskeletal pain in a group of nurses in the Western Cape. Applied Ergonomics, 29, 481-490.
BRADBY, H. 2003. Describing ethnicity in health research. Ethnicity and Health, 8,
5-13. BRAUN, L. & HAMMONDS, E. 2008. Race, populations, and genomics: Africa as
laboratory. Social Science & Medicine, 67, 1580-1588. BROWN, G.W., HARRIS, T.O. 1989. Life Events and Illness, London. BUCKLE, P. W. & JASON DEVEREUX, J. 2002. The nature of work-related neck
and upper limb musculoskeletal disorders. Applied Ergonomics, 33, 207-217. CARUGNO, M., PESATORI, A. C., FERRARIO, M. M., FERRARI, A. L., SILVA, F. J.
D., MARTINS, A. C., FELLI, V. E. A., COGGON, D. & BONZINI, M. 2012. Physical and psychosocial risk factors for musculoskeletal disorders in Brazilian and Italian nurses. Cadernos de saude publica, 28, 1632-1642.
262
CHARBOTEL, B., CROIDIEU, S., VOHITO, M., GUERIN, A.-C., RENAUD, L., JAUSSAUD, J., BOURBOUL, C., IMBARD, I., ARDIET, D. & BERGERET, A. 2009. Working conditions in call-centers, the impact on employee health: a transversal study. Part II. International Archives of Occupational and Environmental Health, 82, 747-756.
CHATURVEDI, N. 2001. Ethnicity as an epidemiological determinant—crudely racist
or crucially important? International Journal of Epidemiology, 30, 925-927. CHOOBINEH, A., MOVAHED, M., TABATABAIE, S. H. & KUMASHIRO, M. 2010.
Perceived demands and musculoskeletal disorders in operating room nurses of Shiraz city hospitals. Industrial Health, 48, 74-84.
CHOOBINEH, A., RAJAEEFARD, A. & NEGHAB, M. 2006. Association between
perceived demands and musculoskeletal disorders among hospital nurses of Shiraz University of Medical Sciences: a questionnaire survey. International Journal of Occupational Safety and Ergonomics, 12, 409-416.
CITY PRESS, 2013. Plan to centralise teaching hospitals. News24.
http://www.news24.com/Archives/City-Press/Plan-to-centralise-teaching-hospitals-20150430 [accessed on 6 October 2016].
COGGON, D. 2005. Occupational medicine at a turning point. Occupational and
Environmental Medicine, 62, 281-283. COGGON, D., NTANI, G., PALMER, K. T., FELLI, V. E., HARARI, R., BARRERO, L.
H., FELKNOR, S. A., GIMENO, D., CATTRELL, A. & SERRA, C. 2012. The CUPID (Cultural and Psychosocial Influences on Disability) study: methods of data collection and characteristics of study sample. PLoS One, 7, e39820.
COGGON D., NTANI G., PALMER K., & WALKERBONE-BONE K., 2016. General
propensity to pain is a major risk factor for disabling wrist/hand pain. In: Proceeding of the 25th EPICOH Epidemiology in Occupational Health Conference, Barcelona, Spain, September 4-7.
COLE, D. C. & RIVILIS, I. 2004. Individual factors and musculoskeletal disorders: a
framework for their consideration. Journal of Electromyography and Kinesiology, 14, 121-127.
CRAWFORD, J. O., LAIOU, E., SPURGEON, A. & MCMILLAN, G. 2008.
Musculoskeletal disorders within the telecommunications sector—a systematic review. International Journal of Industrial Ergonomics, 38, 56-72.
CROIDIEU, S., CHARBOTEL, B., VOHITO, M., RENAUD, L., JAUSSAUD, J.,
BOURBOUL, C., ARDIET, D., IMBARD, I., GUERIN, A. C. & BERGERET, A. 2008. Call-handlers’ working conditions and their subjective experience of work: a transversal study. International Archives of Occupational and Environmental Health, 82, 67-77.
263
D'ERRICO, A., CAPUTO, P., FALCONE, U., FUBINI, L., GILARDI, L., MAMO, C., MIGLIARDI, A., QUARTA, D. & COFFANO, E. 2010. Risk factors for upper extremity musculoskeletal symptoms among call center employees. Journal of Occupational Health, 1002160118.
DA COSTA, B. R. & VIEIRA, E. R. 2010. Risk factors for work‐related
musculoskeletal disorders: a systematic review of recent longitudinal studies. American Journal of Industrial Medicine, 53, 285-323.
DALTON, J. H., ELIAS, M. J. & WANDERSMAN, A. 2001. Community psychology.
Wadsworth, Belmont, CA. DAVIS, K. G. & KOTOWSKI, S. E. 2015. Prevalence of Musculoskeletal Disorders
for Nurses in Hospitals, Long-Term Care Facilities, and Home Health Care A Comprehensive Review. Human Factors: The Journal of the Human Factors and Ergonomics Society, 0018720815581933.
DE GUCHT, V., FISCHLER, B. & HEISER, W. 2003. Job stress, personality, and
psychological distress as determinants of somatization and functional somatic syndromes in a population of nurses. Stress and Health, 19, 195-204.
DEROGATIS, L. R. & MELISARATOS, N. 1983. The brief symptom inventory: an
introductory report. Psychological Medicine, 13, 595-605. DIAS, B. 2014. Musculoskeletal Disorders in the South African Mining Industry. A
thesis submitted to the Faculty of Health Sciences, University of Witwatersrand.
DRISCOLL, T. 2011. Epidemiological aspects of studying work-related
musculoskeletal disorders. Best Practice & Research Clinical Rheumatology, 25, 3-13.
DYOSI, S. NYANTUMBU, B. 2007. An ergonomics audit in a South African hospital
in Gauteng. Project No. 924703. National institute for Occupational Health.
FARIOLI, A., MATTIOLI, S., QUAGLIERI, A., CURTI, S., VIOLANTE, F. S. & COGGON, D. 2014. Musculoskeletal pain in Europe: role of personal, occupational and social risk factors. Scandinavian Journal of Work, Environment & Health, 40, 36.
FAUCETT, J. 2005. Integrating ‘psychosocial’factors into a theoretical model for
work-related musculoskeletal disorders. Theoretical Issues in Ergonomics Science, 6, 531-550.
FERREIRA, M., CONCEIÇÃO, G. M. D. S. & SALDIVA, P. H. N. 1997. Work
organization is significantly associated with upper extremities musculoskeletal
disorders among employees engaged in interactive computer‐telephone tasks
of an international bank subsidiary in São Paulo, Brazil. American Journal of Industrial Medicine, 31, 468-473.
264
FERREIRA, M. & SALDIVA, P. H. 2002. Computer–telephone interactive tasks:
predictors of musculoskeletal disorders according to work analysis and workers’ perception. Applied Ergonomics, 33, 147-153.
FEUERSTEIN, M., SHAW, W. S., NICHOLAS, R. A. & HUANG, G. D. 2004. From
confounders to suspected risk factors: psychosocial factors and work-related upper extremity disorders. Journal of Electromyograph & Kinesiology, 14, 171-178.
FORDE, M.S., PUNNETT, L. AND WEGMAN, D.H., 2005. Prevalence of
musculoskeletal disorders in union ironworkers. Journal of Occupational and Environmental Hygiene, 2, 203-212.
FOUAD EL-BESTAR, S., ABDEL-MONIEM EL-MITWALLI, A. & OMAR KHASHABA,
E. 2011. Neck–Upper Extremity Musculoskeletal Disorders Among Workers in the Telecommunications Company at Mansoura City. International Journal of Occupational Safety and Ergonomics, 17, 195-205.
FRANCO, G. & FUSETTI, L. 2004. Bernardino Ramazzini's early observations of the
link between musculoskeletal disorders and ergonomic factors. Applied Ergonomics, 35, 67-70.
FREIMANN, T., COGGON, D., MERISALU, E., ANIMÄGI, L. & PÄÄSUKE, M. 2013.
Risk factors for musculoskeletal pain amongst nurses in Estonia: a cross-sectional study. BMC Musculoskeletal disorders, 14, 334.
GERR, F., MARCUS, M., ENSOR, C., KLEINBAUM, D., COHEN, S., EDWARDS, A.,
GENTRY, E., ORTIZ, D. J. & MONTEILH, C. 2002. A prospective study of computer users: I. Study design and incidence of musculoskeletal symptoms and disorders. American Journal of Industrial Medicine, 41, 221-235.
GUN, R. 1990. The incidence and distribution of RSI in South Australia 1980-81 to
1986-87. The Medical Journal of Australia, 153, 376-380. HAGBERG, M., VIOLANTE, F. S., BONFIGLIOLI, R., DESCATHA, A., GOLD, J.,
EVANOFF, B. & SLUITER, J. K. 2012. Prevention of musculoskeletal disorders in workers: classification and health surveillance–statements of the Scientific Committee on Musculoskeletal Disorders of the International Commission on Occupational Health. BMC Musculoskeletal disorders, 13, 109.
HALES, T. R. & BERNARD, B. P. 1996. Epidemiology of work-related
musculoskeletal disorders. The Orthopedic Clinics of North America, 27, 679-709.
HALES, T. R., SAUTER, S. L., PETERSON, M. R., FINE, L. J., PUTZ-ANDERSON,
V., SCHLEIFER, L. R., OCHS, T. T. & BERNARD, B. P. 1994.

265
Musculoskeletal disorders among visual display terminal users in a telecommunications company. Ergonomics, 37, 1603-1621.
HALFORD, V. & COHEN, H. H. 2003. Technology use and psychosocial factors in
the self-reporting of musculoskeletal disorder symptoms in call center workers. Journal of Safety Research, 34, 167-173.
HARCOMBE, H., MCBRIDE, D., DERRETT, S. & GRAY, A. 2009. Prevalence and
impact of musculoskeletal disorders in New Zealand nurses, postal workers and office workers. Australian and New Zealand Journal of Public Health, 33, 437-441.
HARCOMBE, H., MCBRIDE, D., DERRETT, S. & GRAY, A. 2010. Physical and
psychosocial risk factors for musculoskeletal disorders in New Zealand nurses, postal workers and office workers. Injury Prevention, 16, 96-100.
HEALTH AND SAFETY EXECUTIVE., 2003. Work with display screen equipment:
Health and Safety (Display Screen Equipment Regulations 1992. Health and Safety Executive Books, 2003. ISBN9780717625826 11.
HEATH, I. 1991. The role of ethnic monitoring in general practice. British Journal of
General Practice, 41, 310-311. JENSEN, C., BORG, V., FINSEN, L., HANSEN, K., JUUL-KRISTENSEN, B. &
CHRISTENSEN, H. 1998. Job demands, muscle activity and musculoskeletal symptoms in relation to work with the computer mouse. Scandinavian Journal of Work, Environment & Health, 418-424.
JOBSON, M. 2015. Structure of the health system in South africa. Khulumani
Support Group. JOSEPHSON, M., LAGERSTRÖM, M., HAGBERG, M. & HJELM, E. W. 1997.
Musculoskeletal symptoms and job strain among nursing personnel: a study over a three year period. Occupational and Environmental Medicine, 54, 681-685.
KANG, D., KIM, Y.-K., KIM, E.-A., KIM, D. H., KIM, I., KIM, H.-R., MIN, K.-B., JUNG-
CHOI, K., OH, S.-S. & KOH, S.-B. 2014. Prevention of Work-Related Musculoskeletal Disorders. Annals of Occupational and Environmental Medicine, 26, 1-2.
KARASEK, R., BRISSON, C., KAWAKAMI, N., HOUTMAN, I., BONGERS, P. &
AMICK, B. 1998. The Job Content Questionnaire (JCQ): an instrument for internationally comparative assessments of psychosocial job characteristics. Journal of Occupational Health Psychology, 3, 322-355.
KUMALO, B. T. E. 2015. The relationship between work-related musculoskeletal
disorders, absenteeism and visits to the staff clinic by nurses in an e thekwini

266
District Hospital. A dissertation submitted to the Faculty of Health Sciences, Durban University of Technology.
KUORINKA, I., JONSSON, B., KILBOM, A., VINTERBERG, H., BIERING-
SØRENSEN, F., ANDERSSON, G. & JØRGENSEN, K. 1987. Standardised Nordic questionnaires for the analysis of musculoskeletal symptoms. Applied Ergonomics, 18, 233-237.
LAGERSTRÖM, M., WENEMARK, M., HAGBERG, M. & HJELM, E. W. 1996.
Occupational and individual factors related to musculoskeletal symptoms in five body regions among Swedish nursing personnel. International Archives of Occupational and Environmental Health, 68, 27-35.
LARSSON, B., SØGAARD, K. & ROSENDAL, L. 2007. Work related neck–shoulder
pain: a review on magnitude, risk factors, biochemical characteristics, clinical picture and preventive interventions. Best Practice & Research Clinical Rheumatology, 21, 447-463.
LAURITSEN, J.M., BRUUS, M. AND MYATT, M., 2000. EpiData, a tool for validated
data entry and documentation of data. Version 3.1. UK: County of Denmark and Brixton Health.
LEE, H., AHN, H., PARK, C. G., KIM, S. J. & MOON, S. H. 2011. Psychosocial
factors and work-related musculoskeletal disorders among Southeastern Asian female workers living in Korea. Safety and Health at Work, 2, 183-193.
LIN, Y.-H., CHEN, C.-Y. & LU, S.-Y. 2009. Physical discomfort and psychosocial job
stress among male and female operators at telecommunication call centers in Taiwan. Applied Ergonomics, 40, 561-568.
LIPOWSKI, Z. J. 1988. Somatization: the concept and its clinical application.
American Journal of Psychiatry, 145, 1358-1368. LONG, M. H., JOHNSTON, V. & BOGOSSIAN, F. 2012. Work-related upper
quadrant musculoskeletal disorders in midwives, nurses and physicians: a systematic review of risk factors and functional consequences. Applied Ergonomics, 43, 455-467.
LORUSSO, A., BRUNO, S. & L'ABBATE, N. 2007. A review of low back pain and
musculoskeletal disorders among Italian nursing personnel. Industrial Health, 45, 637-644.
LUIME, J. J., KOES, B. W., MIEDEM, H. S., VERHAAR, J. A. & BURDORF, A. 2005.
High incidence and recurrence of shoulder and neck pain in nursing home employees was demonstrated during a 2-year follow-up. Journal of Clinical Epidemiology, 58, 407-413.

267
MADIBA, S., HOQUE, M. & RAKGASE, R. 2013. Musculoskeletal disorders among nurses in high acuity areas in a tertiary hospital in South Africa. Occupational Health Southern Africa, 19 (1), 20-23.
MALCHAIRE, J., COCK, N. & VERGRACHT, S. 2001. Review of the factors
associated with musculoskeletal problems in epidemiological studies. International Archives of Occupational and Environmental Health, 74, 79-90.
MALDONADO, G. AND GREENLAND, S., 1993. Simulation study of confounder-
selection strategies. American Journal of Epidemiology, 138, 923-936. MARCH, L., SMITH, E. U., HOY, D. G., CROSS, M. J., SANCHEZ-RIERA, L.,
BLYTH, F., BUCHBINDER, R., VOS, T. & WOOLF, A. D. 2014. Burden of disability due to musculoskeletal (MSK) disorders. Best Practice & Research Clinical Rheumatology, 28, 353-366.
MARCUS, M., GERR, F., MONTEILH, C., ORTIZ, D. J., GENTRY, E., COHEN, S.,
EDWARDS, A., ENSOR, C. & KLEINBAUM, D. 2002. A prospective study of computer users: II. Postural risk factors for musculoskeletal symptoms and disorders. American Journal of Industrial Medicine, 41, 236-249.
MARRAS, W. S., CUTLIP, R. G., BURT, S. E. & WATERS, T. R. 2009. National
occupational research agenda (NORA) future directions in occupational musculoskeletal disorder health research. Applied Ergonomics, 40, 15-22.
MATOTI, N. 2014. South African Banking Sector overview. The Banking Association
of South Africa. MATSUDAIRA, K., PALMER, K. T., READING, I., HIRAI, M., YOSHIMURA, N. &
COGGON, D. 2011. Prevalence and correlates of regional pain and associated disability in Japanese workers. Occupational and Environmental Medicine, 68, 191-196.
MAUL, I., LÄUBLI, T., KLIPSTEIN, A. & KRUEGER, H. 2003. Course of low back
pain among nurses: a longitudinal study across eight years. Occupational and Environmental Medicine, 60, 497-503.
MEHRDAD, R., DENNERLEIN, J. T., HAGHIGHAT, M. & AMINIAN, O. 2010.
Association between psychosocial factors and musculoskeletal symptoms among Iranian nurses. American Journal of Industrial Medicine, 53, 1032-1039.
MELZACK, R. & WALL, P. D. 1967. Pain mechanisms: a new theory. Survey of
Anesthesiology, 11, 89-90. MELZACK, R. & WALL, P. D. 1970. Psychophysiology of Pain. International
Anesthesiology Clinics, 8, 3-34.
268
MENZEL, N. N., BROOKS, S. M., BERNARD, T. E. & NELSON, A. 2004. The physical workload of nursing personnel: association with musculoskeletal discomfort. International Journal of Nursing Studies, 41, 859-867.
MESSING, K., PUNNETT, L., BOND, M., ALEXANDERSON, K., PYLE, J., ZAHM,
S., WEGMAN, D., STOCK, S. R. & DE GROSBOIS, S. 2003. Be the fairest of them all: challenges and recommendations for the treatment of gender in occupational health research. American Journal of Industrial Medicine, 43, 618-629.
MESSING, K., TISSOT, F. & STOCK, S. R. 2009. Should studies of risk factors for
musculoskeletal disorders be stratified by gender? Lessons from the 1998 Québec Health and Social Survey. Scandinavian Journal of Work, Environment & Health, 96-112.
MUNABI, I. G., BUWEMBO, W., KITARA, D. L., OCHIENG, J. & MWAKA, E. S.
2014. Musculoskeletal disorder risk factors among nursing professionals in low resource settings: a cross-sectional study in Uganda. BMC nursing, 13, 7.
NET INDUSTRIES, 2016. First National bank of South Africa: History of First
National bank South Africa. Net industries. http://encyclopedia.jrank.org/articles/pages/cmgh3r9x1i/First-National-Bank-South-Africa.html [Accessed on 6 October 2016].
NJOBVU, P., HUNT, I., POPE, D. & MACFARLANE, G. 1999. Pain amongst ethnic
minority groups of South Asian origin in the United Kingdom: a review. Rheumatology, 38, 1184-1187.
NORMAN, K., FLODERUS, B., HAGMAN, M., TOOMINGAS, A. & TORNQVIST, E.
W. 2008. Musculoskeletal symptoms in relation to work exposures at call centre companies in Sweden. Work, 30, 201-214.
NORMAN, K., NILSSON, T., HAGBERG, M., TORNQVIST, E. W. & TOOMINGAS,
A. 2004. Working conditions and health among female and male employees at a call center in Sweden. American Journal of Industrial Medicine, 46, 55-62.
PALMER, K., READING, I., LINAKER, C., CALNAN, M. & COGGON, D. 2008.
Population-based cohort study of incident and persistent arm pain: role of mental health, self-rated health and health beliefs. Pain, 136, 30-37.
PEARCE, N., CHECKOWAY, H. & KRIEBEL, D. 2007. Bias in occupational
epidemiology studies. Occupational and Environmental Medicine, 64, 562-568.
PEDUZZI, P., CONCATO, J., KEMPER, E., HOLFORD, T. R. & FEINSTEIN, A. R.
1996. A simulation study of the number of events per variable in logistic regression analysis. Journal of Clinical Epidemiology, 49, 1373-1379.

269
PUNNETT, L. 2014. Musculoskeletal disorders and occupational exposures: How should we judge the evidence concerning the causal association? Scandinavian Journal of Public Health, 42, 49-58.
PUNNETT, L. & WEGMAN, D. H. 2004. Work-related musculoskeletal disorders: the epidemiologic evidence and the debate. Journal of Electromyography and Kinesiology, 14, 13-23.
RASMUSSEN, C., RECHTER, L., SCHMIDT, I., HANSEN, V.K. AND
THERKELSEN, K., 2001. The association of the involvement of financial compensation with the outcome of cervicobrachial pain that is treated conservatively. Rheumatology, 40, 552-554.
RIIHIMÄKI, H. 1999. Musculoskeletal diseases—a continuing challenge for
epidemiologic research. Scandinavian Journal of Work, Environment & Health, 31-35.
ROCHA, L. E., GLINA, D. M. R., MARINHO, M. D. F. & NAKASATO, D. 2005. Risk
factors for musculoskeletal symptoms among call center operators of a bank in Sao Paulo, Brazil. Industrial Health, 43, 637-646.
ROTHMAN, K. J., GREENLAND, S. & LASH, T. L. 2008. Modern Epidemiology,
Lippincott Williams & Wilkins. SADEGHIAN, F., RAEI, M., NTANI, G. & COGGON, D. 2013. Predictors of incident
and persistent neck/shoulder pain in Iranian workers: a cohort study. PLoS One, 8, e57544.
SENIOR, P. A. & BHOPAL, R. 1994. Ethnicity as a variable in epidemiological
research. BMJ: British Medical Journal, 309, 327. SHEREHIY, B., KARWOWSKI, W. & MAREK, T. 2004. Relationship between risk
factors and musculoskeletal disorders in the nursing profession: A systematic review. Occupational Ergonomics, 4, 241-279.
SILLANPÄÄ, J., HUIKKO, S., NYBERG, M., KIVI, P., LAIPPALA, P. & UITTI, J.
2003. Effect of work with visual display units on musculo‐skeletal disorders in
the office environment. Occupational Medicine, 53, 443-451. SIM, J., LACEY, R. J. & LEWIS, M. 2006. The impact of workplace risk factors on
the occurrence of neck and upper limb pain: a general population study. BMC Public Health, 6, 234.
SKOVRON, M., SZPALSKI, M., NORDIN, M., MELOT, C. & CUKIER, D. 1994.
Sociocultural Factors and Back Pain: A Population-Based Study in Belgian Adults. Spine, 19, 129-137.
SMEDLEY, J., EGGER, P., COOPER, C. & COGGON, D. 1997. Prospective cohort
study of predictors of incident low back pain in nurses. BMJ: British Medical Journal, 314, 1225.

270
SMEDLEY, J., INSKIP, H., TREVELYAN, F., BUCKLE, P., COOPER, C. &
COGGON, D. 2003. Risk factors for incident neck and shoulder pain in hospital nurses. Occupational and Environmental Medicine, 60, 864-869.
SMITH, D. R., CHOE, M.-A., JEON, M. Y., CHAE, Y. R., AN, G. J. & JEONG, J. S.
2005. Epidemiology of musculoskeletal symptoms among Korean hospital nurses. International Journal of Occupational Safety and Ergonomics, 11, 431-440.
SMITH, D. R., MIHASHI, M., ADACHI, Y., KOGA, H. & ISHITAKE, T. 2006. A
detailed analysis of musculoskeletal disorder risk factors among Japanese nurses. Journal of Safety Research, 37, 195-200.
SMITH, D. R., WEI, N., KANG, L. & WANG, R.-S. 2004a. Musculoskeletal disorders
among professional nurses in mainland China. Journal of Professional Nursing, 20, 390-395.
SMITH, D. R., WEI, N., ZHAO, L. & WANG, R.-S. 2004b. Musculoskeletal
complaints and psychosocial risk factors among Chinese hospital nurses. Occupational Medicine, 54, 579-582.
SOLIDAKI, E., CHATZI, L., BITSIOS, P., COGGON, D., PALMER, K. T. &
KOGEVINAS, M. 2012. Risk factors for new onset and persistence of multi-site musculoskeletal pain in a longitudinal study of workers in Crete. Occupational and Environmental Medicine, oemed-2012-100689.
SOUSA-POZA, A. & SOUSA-POZA, A. A. 2000. Well-being at work: a cross-national
analysis of the levels and determinants of job satisfaction. The Journal of Socio-Economics, 29, 517-538.
SPRIGG, C. A., STRIDE, C. B., WALL, T. D., HOLMAN, D. J. & SMITH, P. R. 2007.
Work characteristics, musculoskeletal disorders, and the mediating role of psychological strain: a study of call center employees. Journal of Applied Psychology, 92, 1456.
STAAL, J.B., DE BIE, R.A. AND HENDRIKS, E.J.M., 2007. Aetiology and
management of work-related upper extremity disorders. Best Practice & Research Clinical Rheumatology, 21, 123-133.
STATISTICS S. A. 2012. Gauteng Province population, Census 2011. STEINECK, G. & AHLBOM, A. 1992. A definition of bias founded on the concept of
the study base. Epidemiology, 477-482. STEVENSON, J. M., GREENHORN, D., BRYANT, J., DEAKIN, J. M. & SMITH, J.
1996. Gender differences in performance of a selection test using the incremental lifting machine. Applied Ergonomics, 27, 45-52.

271
SURAWERA, I. K., HOE, V. C., KELSALL, H. L., URQUHART, D. M. & SIM, M. R. 2013. Physical and psychosocial factors associated with wrist or hand pain among Australian hospital-based nurses. Injury Prevention, 19, 13-18.
TAYLOR, P., BALDRY, C., BAIN, P. & ELLIS, V. 2003. A unique working
environment': health, sickness and absence management in UK call centres. Work, Employment & Society, 17, 435-458.
TEZEL, A. 2005. Musculoskeletal complaints among a group of Turkish nurses.
International Journal of Neuroscience, 115, 871-880. TINUBU, B. M., MBADA, C. E., OYEYEMI, A. L. & FABUNMI, A. A. 2010. Work-
related musculoskeletal disorders among nurses in Ibadan, South-west Nigeria: a cross-sectional survey. BMC Musculoskeletal disorders, 11, 12.
TOOMINGAS, A. & GAVHED, D. 2008. Workstation layout and work postures at call
centres in Sweden in relation to national law, EU-directives and ISO-standards, and to operators’ comfort and symptoms. International Journal of Industrial Ergonomics, 38, 1051-1061.
TOOMINGAS, A., NILSSON, T., HAGBERG, M., HAGMAN, M. & WIGAEUS
TORNQVIST, E. 2003. Symptoms and clinical findings from the musculoskeletal system among operators at a call centre in Sweden—a 10-month follow-up study. International Journal of Occupational Safety and Ergonomics, 9, 405-418.
TREASTER, D. E. & BURR, D. 2004. Gender differences in prevalence of upper
extremity musculoskeletal disorders. Ergonomics, 47, 495-526.
TRINKOFF, A. M., LE, R., GEIGER‐BROWN, J., LIPSCOMB, J. & LANG, G. 2006.
Longitudinal relationship of work hours, mandatory overtime, and on‐call to
musculoskeletal problems in nurses. American Journal of Industrial Medicine, 49, 964-971.
TRINKOFF, A. M., LIPSCOMB, J. A., GEIGER-BROWN, J., STORR, C. L. &
BRADY, B. A. 2003. Perceived physical demands and reported musculoskeletal problems in registered nurses. American Journal of Preventive Medicine, 24, 270-275.
TRINKOFF, A. M., LIPSCOMB, J. A., GEIGER‐BROWN, J. & BRADY, B. 2002.
Musculoskeletal problems of the neck, shoulder, and back and functional consequences in nurses. American Journal of Industrial Medicine, 41, 170-178.
VARGAS-PRADA, S. & COGGON, D. 2015. Psychological and psychosocial determinants of musculoskeletal pain and associated disability. Best Practice & Research Clinical Rheumatology, 29, 374-390.
VARGAS-PRADA, S., COGGON, D., NTANI, G., WALKER-BONE, K., PALMER, K.
T., FELLI, V. E., HARARI, R., BARRERO, L. H., FELKNOR, S. A. & GIMENO,
272
D. 2016. Descriptive Epidemiology of Somatising Tendency: Findings from the CUPID Study. PLoS One, 11, e0153748
VARGAS-PRADA, S., MARTÍNEZ, J. M., COGGON, D., DELCLOS, G.,
BENAVIDES, F. G. & SERRA, C. 2013. Health beliefs, low mood, and somatizing tendency: contribution to incidence and persistence of musculoskeletal pain with and without reported disability. Scandinavian Journal of Work, Environment & Health, 39, 589-598.
VARGAS-PRADA, S., SERRA, C., MARTÍNEZ, J. M., NTANI, G., DELCLOS, G. L.,
PALMER, K. T., COGGON, D. & BENAVIDES, F. G. 2012. Psychological and culturally-influenced risk factors for the incidence and persistence of low back pain and associated disability in Spanish workers: findings from the CUPID study. Occupational and Environmental Medicine, oemed-2011-100637.
WADDELL, G., NEWTON, M., HENDERSON, I., SOMERVILLE, D. & MAIN, C. J.
1993. A Fear-Avoidance Beliefs Questionnaire (FABQ) and the role of fear-avoidance beliefs in chronic low back pain and disability. Pain, 52, 157-168.
WAHLSTRÖM, J. 2005. Ergonomics, musculoskeletal disorders and computer work.
Occupational Medicine, 55, 168-176. WARE JR, J. E. 2000. SF-36 health survey update. Spine, 25, 3130-3139. WARNAKULASURIYA, S. S., PEIRIS-JOHN, R. J., COGGON, D., NTANI, G.,
SATHIAKUMAR, N. & WICKREMASINGHE, A. R. 2012. Musculoskeletal pain in four occupational populations in Sri Lanka. Occupational Medicine, 62, 269-272.
WATERS, T. R., DICK, R. B., DAVIS-BARKLEY, J. & KRIEG, E. F. 2007. A cross-
sectional study of risk factors for musculoskeletal symptoms in the workplace using data from the General Social Survey (GSS). Journal of Occupational and Environmental Medicine, 49, 172-184.
WOOLF, A. D. & PFLEGER, B. 2003. Burden of major musculoskeletal conditions.
Bulletin of the World Health Organization, 81, 646-656. YASSI, A. 2000. Work-related musculoskeletal disorders. Current Opinion in
Rheumatology, 12, 124-130. YU, W., IGNATIUS, T., LI, Z., WANG, X., SUN, T., LIN, H., WAN, S., QIU, H. & XIE,
S. 2012. Work-related injuries and musculoskeletal disorders among factory workers in a major city of China. Accident Analysis & Prevention, 48, 457-463.

273
Appendix A: Search strategy for literature on MSDs in hospital
nurses and workers involved in CTI tasks
Google scholar
“~musculoskeletal risk factors” and “musculoskeletal*” and “nurses*”
“~risk factors” and ”musculoskeletal*” and “call centre workers” or “bank workers” or
“computer telephone interactive tasks”
“~prevalence” and musculoskeletal*” and “nurses*”
“~prevalence” and “musculoskeletal*” and “call centre workers” or “bank workers” or
“telecommunications workers”
“course musculoskeletal*” and “nurses*”
“~incident” and “musculoskeletal*” and “nurses*”
“~persistent” and “musculoskeletal*” and “nurses*”
“~follow-up” and “musculoskeletal*” and “nurses*”
PubMed
("epidemiology"[Subheading] OR "epidemiology"[All Fields] OR "prevalence"[All
Fields] OR "prevalence"[MeSH Terms]) AND ("musculoskeletal diseases"[MeSH
Terms] OR ("musculoskeletal"[All Fields] AND "diseases"[All Fields]) OR
"musculoskeletal diseases"[All Fields] OR ("musculoskeletal"[All Fields] AND
"disorders"[All Fields]) OR "musculoskeletal disorders"[All Fields]) AND
("pain"[MeSH Terms] OR "pain"[All Fields]) AND discomfort[All Fields] AND
("nurses"[MeSH Terms] OR "nurses"[All Fields])
("epidemiology"[Subheading] OR "epidemiology"[All Fields] OR "prevalence"[All
Fields] OR "prevalence"[MeSH Terms]) AND ("musculoskeletal diseases"[MeSH
Terms] OR ("musculoskeletal"[All Fields] AND "diseases"[All Fields]) OR
"musculoskeletal diseases"[All Fields] OR ("musculoskeletal"[All Fields] AND
"disorders"[All Fields]) OR "musculoskeletal disorders"[All Fields]) AND
("pain"[MeSH Terms] OR "pain"[All Fields]) AND discomfort[All Fields] AND
("telecommunications"[MeSH Terms] OR "telecommunications"[All Fields]) AND
("manpower"[Subheading] OR "manpower"[All Fields] OR "workers"[All Fields])
"musculoskeletal diseases"[MeSH Terms] OR ("musculoskeletal"[All Fields] AND
"diseases"[All Fields]) OR "musculoskeletal diseases"[All Fields] OR
("musculoskeletal"[All Fields] AND "disorders"[All Fields]) OR "musculoskeletal
disorders"[All Fields]) AND ("pain"[MeSH Terms] OR "pain"[All Fields]) AND
discomfort[All Fields] AND ("risk factors"[MeSH Terms] OR ("risk"[All Fields] AND
274
"factors"[All Fields]) OR "risk factors"[All Fields]) AND ("nurses"[MeSH Terms] OR
"nurses"[All Fields])
("musculoskeletal diseases"[MeSH Terms] OR ("musculoskeletal"[All Fields] AND
"diseases"[All Fields]) OR "musculoskeletal diseases"[All Fields] OR
("musculoskeletal"[All Fields] AND "disorders"[All Fields]) OR "musculoskeletal
disorders"[All Fields]) AND ("pain"[MeSH Terms] OR "pain"[All Fields]) AND
discomfort[All Fields] AND ("risk factors"[MeSH Terms] OR ("risk"[All Fields] AND
"factors"[All Fields]) OR "risk factors"[All Fields]) AND centre[All Fields] AND
("manpower"[Subheading] OR "manpower"[All Fields] OR "workers"[All Fields])
("musculoskeletal diseases"[MeSH Terms] OR ("musculoskeletal"[All Fields] AND
"diseases"[All Fields]) OR "musculoskeletal diseases"[All Fields] OR
("musculoskeletal"[All Fields] AND "disorders"[All Fields]) OR "musculoskeletal
disorders"[All Fields]) AND ("pain"[MeSH Terms] OR "pain"[All Fields]) AND
discomfort[All Fields] AND ("risk factors"[MeSH Terms] OR ("risk"[All Fields] AND
"factors"[All Fields]) OR "risk factors"[All Fields]) AND ("telecommunications"[MeSH
Terms] OR "telecommunications"[All Fields])
incident[All Fields] OR (persisten[All Fields] AND ("pain"[MeSH Terms] OR "pain"[All
Fields]) AND discomfort[All Fields] AND ("risk factors"[MeSH Terms] OR ("risk"[All
Fields] AND "factors"[All Fields]) OR "risk factors"[All Fields]) AND ("nurses"[MeSH
Terms] OR "nurses"[All Fields]))
ScienceDirect
{“risk factors”} “determinants” or “explanatory variable” or “independent variable” or
“association” and “musculoskeletal*” and “nurses*”
{“risk factors”} or “determinants” or “explanatory variable” or “independent variable”
or “association” and “musculoskeletal*” and “call centre workers*” or “bank workers”
or “telecommunications workers” or computer telephone interactive tasks”
“prevalence” or “course” or “incident” or “persistent” or {“follow-up”} and
“musculoskeletal*” and “nurses*”
“prevalence” and “musculoskeletal*” and “call centre workers*” or “bank workers” or
“telecommunications workers” or computer telephone interactive tasks”

275
Appendix B: National Academies Press permission letter
Marketing Department
Rights & Permissions
May 12, 2015 Reference #: 05191500
Busisiwe Nyantumbu National Institute for Occupational Health No.25 Hospital Street Constitution Hill Johannesburg 2000, South Africa Dear Ms. Nyantumbu:
You have requested permission to reproduce the following material copyrighted by the National Academy of Sciences in a PhD thesis:
Figure ES-1, Musculoskeletal Disorders and the Workplace: Low Back and Upper Extremities, 2001
Your request is granted for the material cited above provided that credit is given to the copyright holder. Nonexclusive rights are extended for noncommercial use of this material.
Suggested credit (example):
Reprinted with permission from (title), (year) by the National Academy of Sciences, Courtesy of the National Academies Press, Washington, D.C. (This credit may be edited pursuant to the publisher’s house style and format so long as the essential elements are included).
Thank you,
Barbara Murphy
Permissions Coordinator
National Academies Press
276
Appendix C: Study information sheet Musculoskeletal Disorders and Associated Factors in Nurses and Bank Workers in South Africa
Information Sheet for Nurses and Bank Workers
Good day, my name is Busisiwe Nyantumbu a researcher from the National Institute for
Occupational Health (NIOH). I am doing research on musculoskeletal disorders to obtain a doctorate
from the University of Witwatersrand. Musculoskeletal disorders have been found to be a major
problem in developed countries. Here in South Africa, there is lack of information about
musculoskeletal disorders. The purpose of the study is to determine the occurrence of
musculoskeletal disorders and their risk factors in nurses, and bank workers.
You are requested to participate in this study. The benefits of the study to you are that feedback
sessions about the study will be given in the form of findings of the study and best practice methods.
Your participation is not going to advantage or disadvantage you if you choose to participate or not
to participate. Participation is voluntary. If you agree to participate, we request that you sign a
consent form. Participation in the study involves:
1) Answering questions from a baseline questionnaire and
2) Follow up questionnaire 12 months later. Filling in of questionnaires takes ±30 minutes.
Questions from a baseline questionnaire deal with personal information, occupational activities,
psychosocial aspects of work, somatic symptoms, musculoskeletal symptoms and their
characteristics and contact details for follow up. Questions from a follow up questionnaire deal with
personal information, any change of job from the time you answered the baseline questionnaire
until follow up and reasons for the change. It also asks about musculoskeletal symptoms in the past
month.
The information that you will provide will be safeguarded for confidentiality purposes. Your name
will not be written on the questionnaire but codes will be used. The findings of the study will be
compiled in a report where no names will be written but group results will be presented.
Presentations of the findings will be arranged for management of your company and workers’
representatives. Should you have any questions and concerns about the study you can raise them
now or contact me later at the National Institute for Occupational Health, PO Box 4788,
Johannesburg, 2000, Tel: (011) 712 6470 Fax: (011) 712 6531, Email:

277
Appendix D: Study consent form Musculoskeletal Disorders and Associated Factors in Nurses and Bank Workers in South Africa
Consent Form I give my consent to answer questions from the baseline and follow-up questionnaires on the study
about musculoskeletal disorders.
I understand that:
Participation in the study is voluntary.
I may withdraw from the study at any time if I so wished.
My responses will be kept confidential and no information that may identify me will be
included in the report or thesis
Name: Signature:
…………………………………….. …………………………………
Date: ……………………………….
Contact details for follow-up
Your contact details:
Work Telephone number :…………… Work Fax number :……………
Home Telephone number :…………… Home Fax number :……………
Cell number :…………… Email address :……………
Your relative’s contact details:
Name:…………………………. Relationship…………………
Work Telephone number…………………. Work Fax number…………………………
Home Telephone number………………… Home Fax number…………………………
Cell number………………………………. Email address………………………………
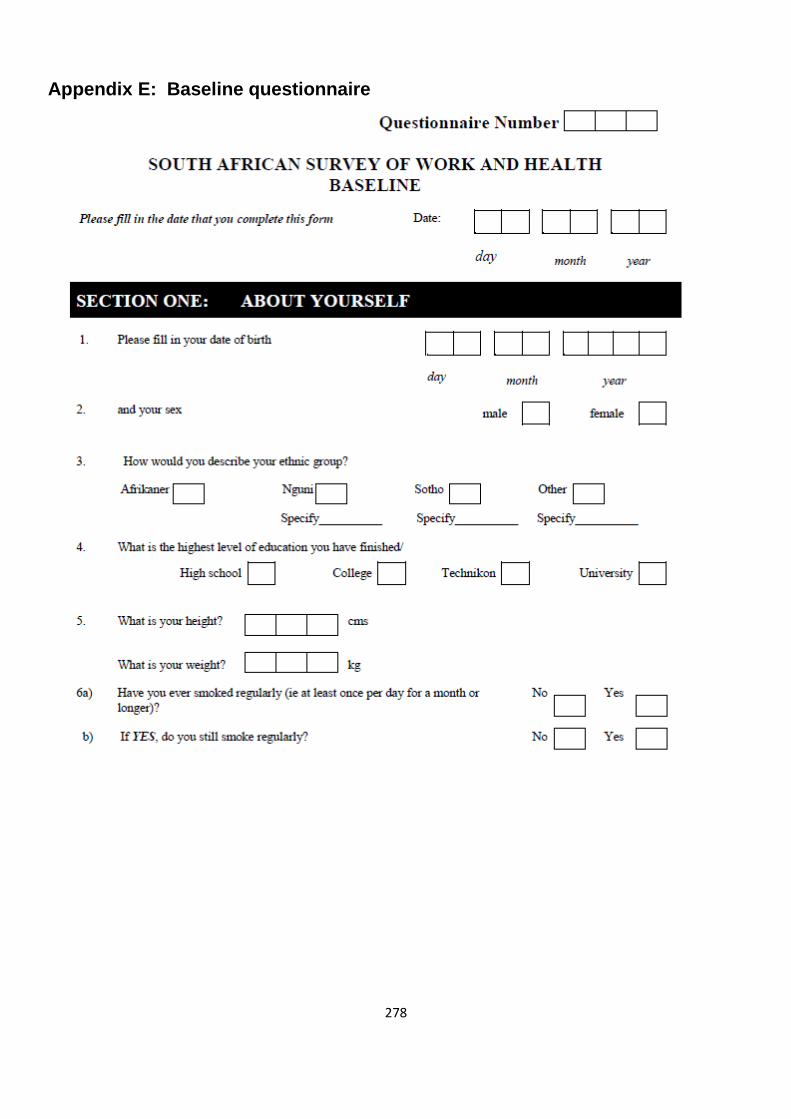
278
Appendix E: Baseline questionnaire

279

280

281
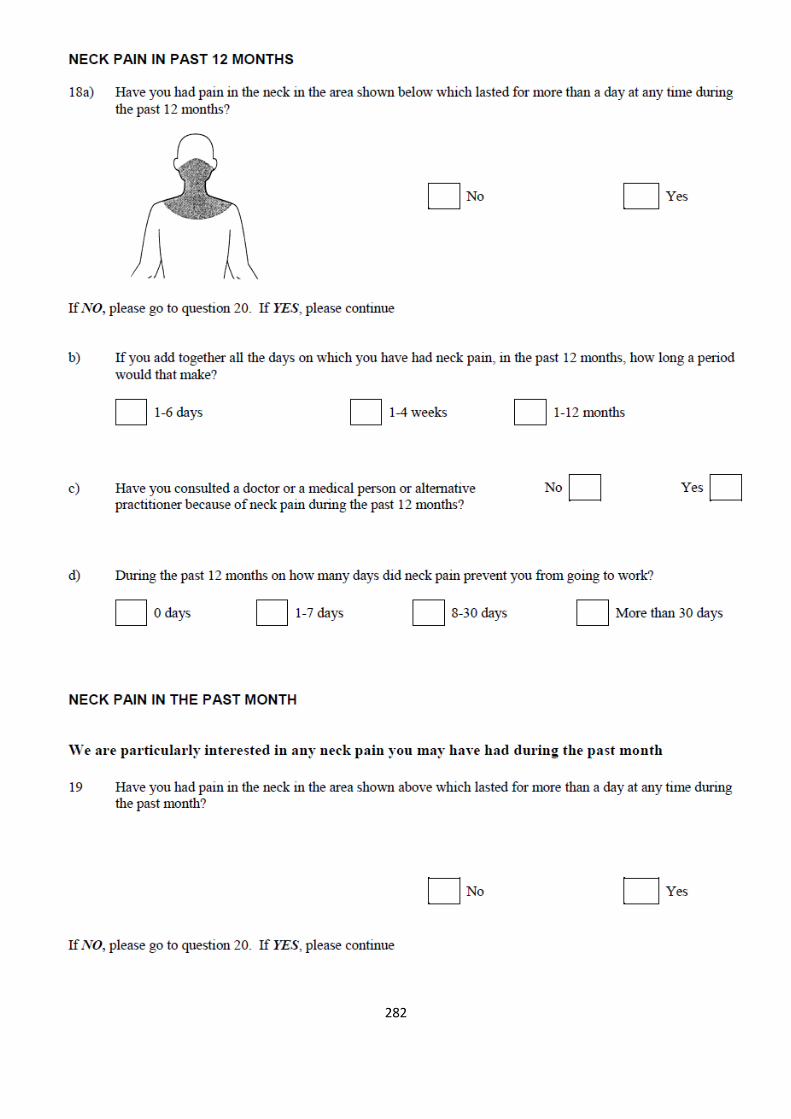
282
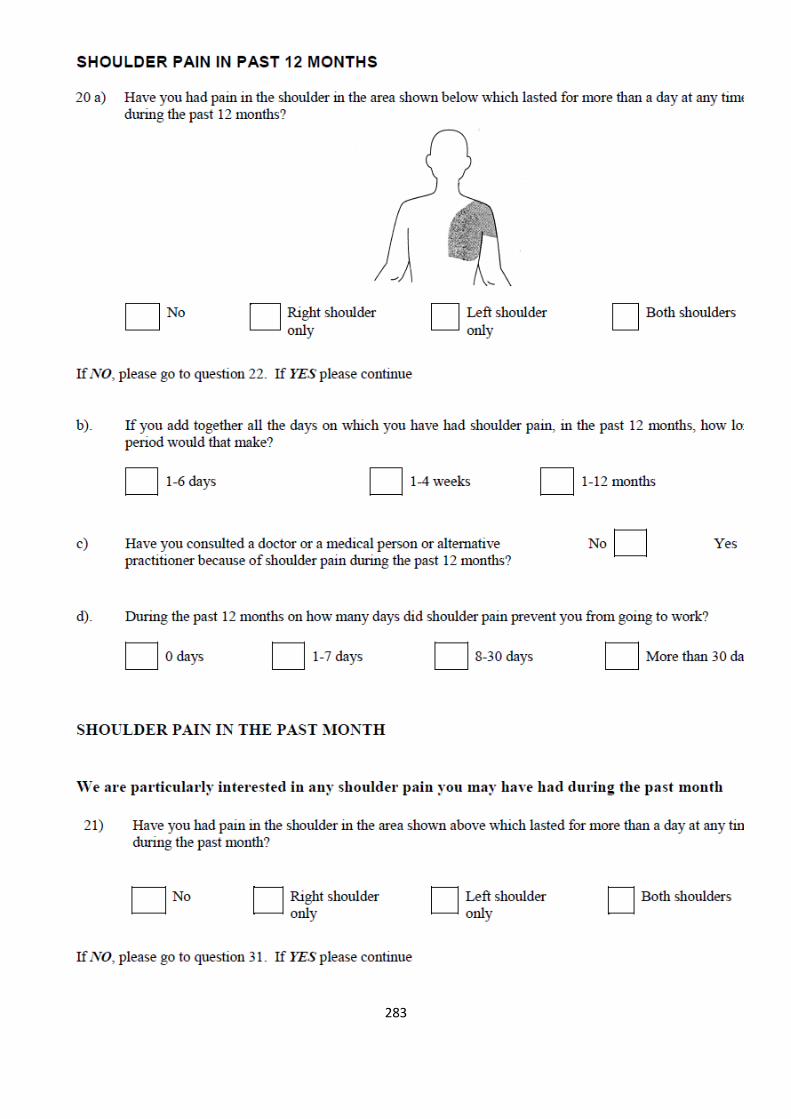
283

284

285

286
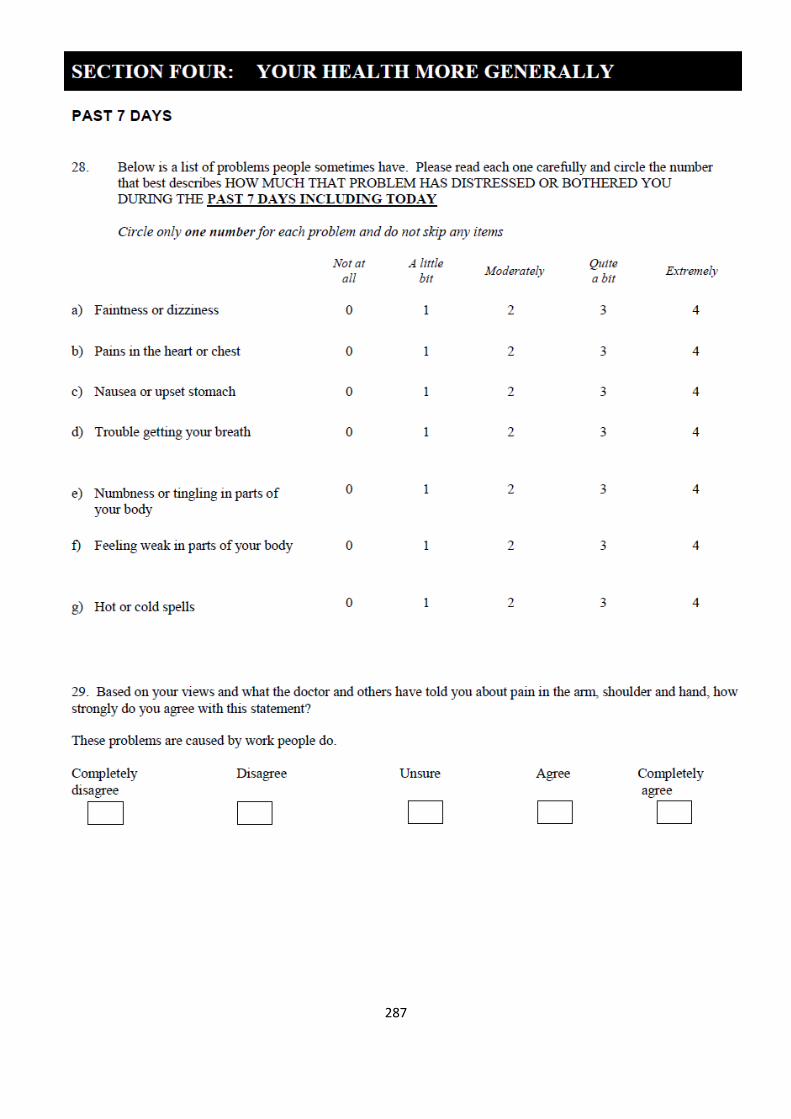
287

288

289
Appendix F: Follow-up questionnaire

290

291

292

293
Appendix G: University of Pretoria ethics certificate
294
Appendix H: University of Witwatersrand ethics certificate
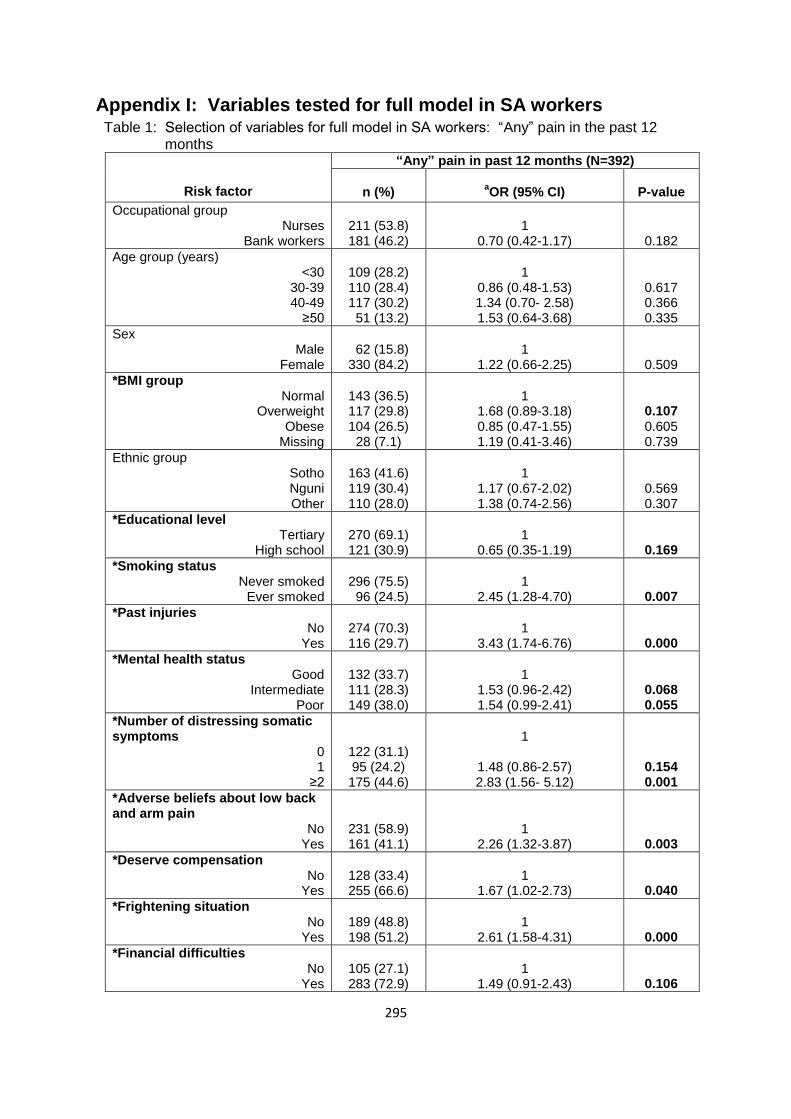
295
Appendix I: Variables tested for full model in SA workers Table 1: Selection of variables for full model in SA workers: “Any” pain in the past 12 months
Risk factor
“Any” pain in past 12 months (N=392)
n (%)
aOR (95% CI)
P-value
Occupational group Nurses
Bank workers
211 (53.8) 181 (46.2)
1
0.70 (0.42-1.17)
0.182
Age group (years) <30
30-39 40-49
≥50
109 (28.2) 110 (28.4) 117 (30.2) 51 (13.2)
1
0.86 (0.48-1.53) 1.34 (0.70- 2.58) 1.53 (0.64-3.68)
0.617 0.366 0.335
Sex Male
Female
62 (15.8) 330 (84.2)
1
1.22 (0.66-2.25)
0.509
*BMI group Normal
Overweight Obese
Missing
143 (36.5) 117 (29.8) 104 (26.5)
28 (7.1)
1
1.68 (0.89-3.18) 0.85 (0.47-1.55) 1.19 (0.41-3.46)
0.107 0.605 0.739
Ethnic group Sotho Nguni Other
163 (41.6) 119 (30.4) 110 (28.0)
1
1.17 (0.67-2.02) 1.38 (0.74-2.56)
0.569 0.307
*Educational level Tertiary
High school
270 (69.1) 121 (30.9)
1
0.65 (0.35-1.19)
0.169
*Smoking status Never smoked
Ever smoked
296 (75.5) 96 (24.5)
1
2.45 (1.28-4.70)
0.007
*Past injuries No
Yes
274 (70.3) 116 (29.7)
1
3.43 (1.74-6.76)
0.000
*Mental health status Good
Intermediate Poor
132 (33.7) 111 (28.3) 149 (38.0)
1
1.53 (0.96-2.42) 1.54 (0.99-2.41)
0.068 0.055
*Number of distressing somatic symptoms
0 1
≥2
122 (31.1) 95 (24.2) 175 (44.6)
1
1.48 (0.86-2.57) 2.83 (1.56- 5.12)
0.154 0.001
*Adverse beliefs about low back and arm pain
No Yes
231 (58.9) 161 (41.1)
1
2.26 (1.32-3.87)
0.003
*Deserve compensation No
Yes
128 (33.4) 255 (66.6)
1
1.67 (1.02-2.73)
0.040
*Frightening situation No
Yes
189 (48.8) 198 (51.2)
1
2.61 (1.58-4.31)
0.000
*Financial difficulties No
Yes
105 (27.1) 283 (72.9)
1
1.49 (0.91-2.43)
0.106

296
Physical load No
Yes
189 (49.2) 195 (50.8)
1
0.95 (0.56-1.62)
0.866
Incentives No
Yes
242 (63.4) 140 (36.6)
1
1.17 (0.71-1.94)
0.529
*Working under time pressure No
Yes
43 (11.0) 348 (89.0)
1
2.42 (1.27-4.62)
0.007
Lack of control No
Yes
271 (69.5) 119 (30.5)
1
1.06 (0.64-1.76)
0.812
Lack of social support No
Yes
320 (83.1) 65 (16.9)
1
1.20 (0.63-2.29)
0.565
*Job dissatisfaction No
Yes
230 (58.8) 161 (41.2)
1
2.18 (1.30-3.66)
0.003
*Job insecurity No
Yes
200 (51.5) 188 (48.5)
1
1.76 (1.06-2.94)
0.028
aAdjusted for occupational group, age group, and sex; occupational group, age group and sex were mutually adjusted
*Variables with p-values ≤0.2 selected for inclusion in the full model for “any” pain in the past 12 months with adjustment variables included irrespective of the p-value: BMI group, educational level, smoking status, past injuries, mental health status, number of somatic symptoms, adverse beliefs about low back and arm pain, deserve compensation, frightening situation, financial difficulties, working under time pressure, job dissatisfaction, job insecurity.

297
Appendix J: Variables tested for full model in SA nurses Table 1: Selection of variables for full model in SA public hospital nurses: “Any” pain in past 12 months
Risk factor
“Any” pain in past 12 months (N=203)
n (%) aOR (95% CI) P-value
Age group (years) <30
30-39 40-49
≥50
29 (14.3) 61 (30.0) 77 (37.9) 36 (17.7)
1
1.40 (0.51-3.809) 1.51 (0.57-3.99) 1.98 (0.58-6.72)
0.507 0.399 0.270
*BMI group Normal
Overweight Obese
Missing
55 (27.1) 62 (30.5) 61 (30.0) 25 (12.3)
1
1.06 (0.37-3.05) 0.43 (0.16-1.11) 0.88 (0.24-3.22)
0.902 0.084 0.850
*Past injuries No
Yes
154 (76.6) 47 (23.4)
1
2.60 (0.87-7.73)
0.085
Ethnic group Sotho Nguni Other
110 (54.2) 70 (34.5) 23 (11.3)
1
0.80 (0.38-1.66) 2.14 (0.46-9.86)
0.556 0.326
*Deserve compensation No
Yes
53 (26.4) 148 (73.6)
1
2.00 (0.97-4.13)
0.058
Financial difficulties No
Yes
61 (30.3) 140 (69.7)
1
1.57 (0.76-3.24)
0.220
*Frightening situation No
Yes
101 (50.5) 99 (49.5)
1
3.87 (1.69-8.89)
0.001
*Adverse beliefs about low back and arm pain
No Yes
98 (48.3) 105 (51.7)
1
2.84 (1.32-6.09)
0.007
*Number of distressing somatic symptoms
0 1
≥2
78 (38.4) 54 (26.6) 71 (35.0)
1
2.11 (0.90-4.93) 8.54 (2.47-29.54)
0.083 0.001
*Mental health status Good
Intermediate Poor
88 (43.3) 61 (30.0) 54 (26.6)
1
1.33 (0.59-2.97) 1.85 (0.73-4.66)
0.482 0.191
Physical load No
Yes
56 (27.7) 146 (72.3)
1
1.08 (0.50-2.33)
0.842
Incentives No
Yes
154 (77.8) 44 (22.2)
1
1.61 (0.62-4.18)
0.319
*Working under time pressure
No Yes
35 (17.3) 167 (82.7)
1
2.68 (1.25-5.73)
0.011
Lack of control No
Yes
155 (76.4) 48 (23.6)
1
0.98 (0.43-2.24)
0.978
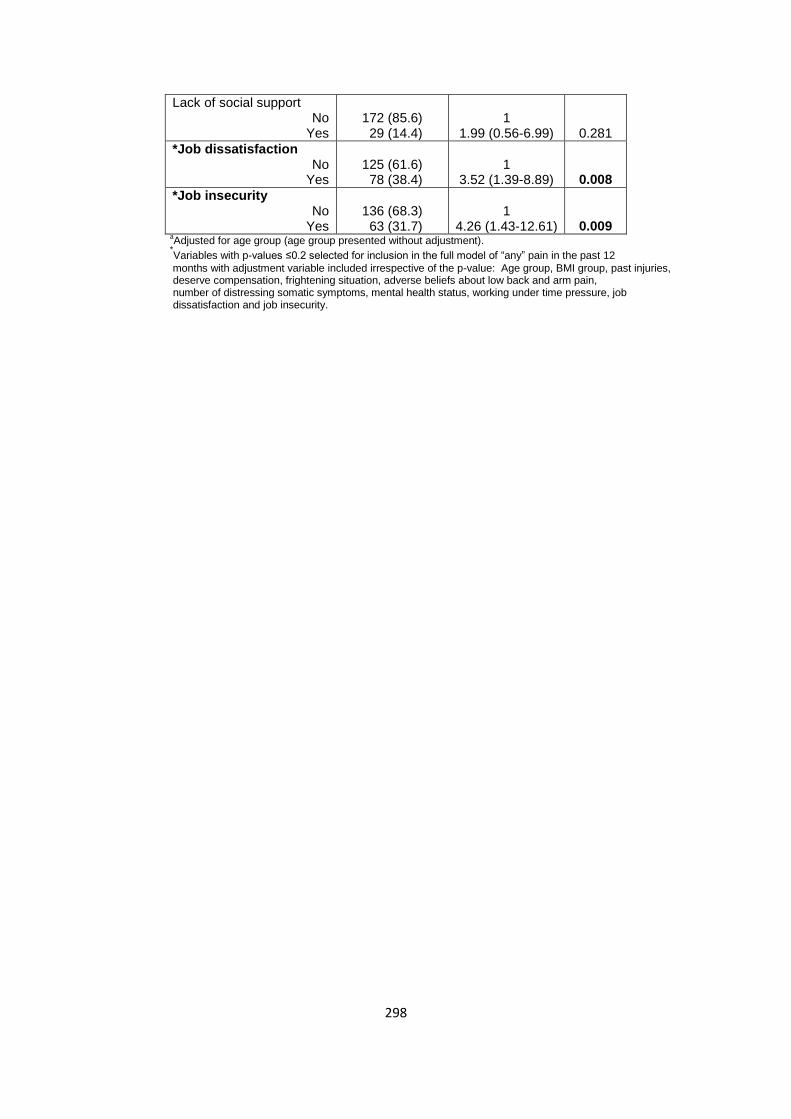
298
Lack of social support No
Yes
172 (85.6) 29 (14.4)
1
1.99 (0.56-6.99)
0.281
*Job dissatisfaction No
Yes
125 (61.6) 78 (38.4)
1
3.52 (1.39-8.89)
0.008
*Job insecurity No
Yes
136 (68.3) 63 (31.7)
1
4.26 (1.43-12.61)
0.009
aAdjusted for age group (age group presented without adjustment).
*Variables with p-values ≤0.2 selected for inclusion in the full model of “any” pain in the past 12
months with adjustment variable included irrespective of the p-value: Age group, BMI group, past injuries, deserve compensation, frightening situation, adverse beliefs about low back and arm pain, number of distressing somatic symptoms, mental health status, working under time pressure, job dissatisfaction and job insecurity.
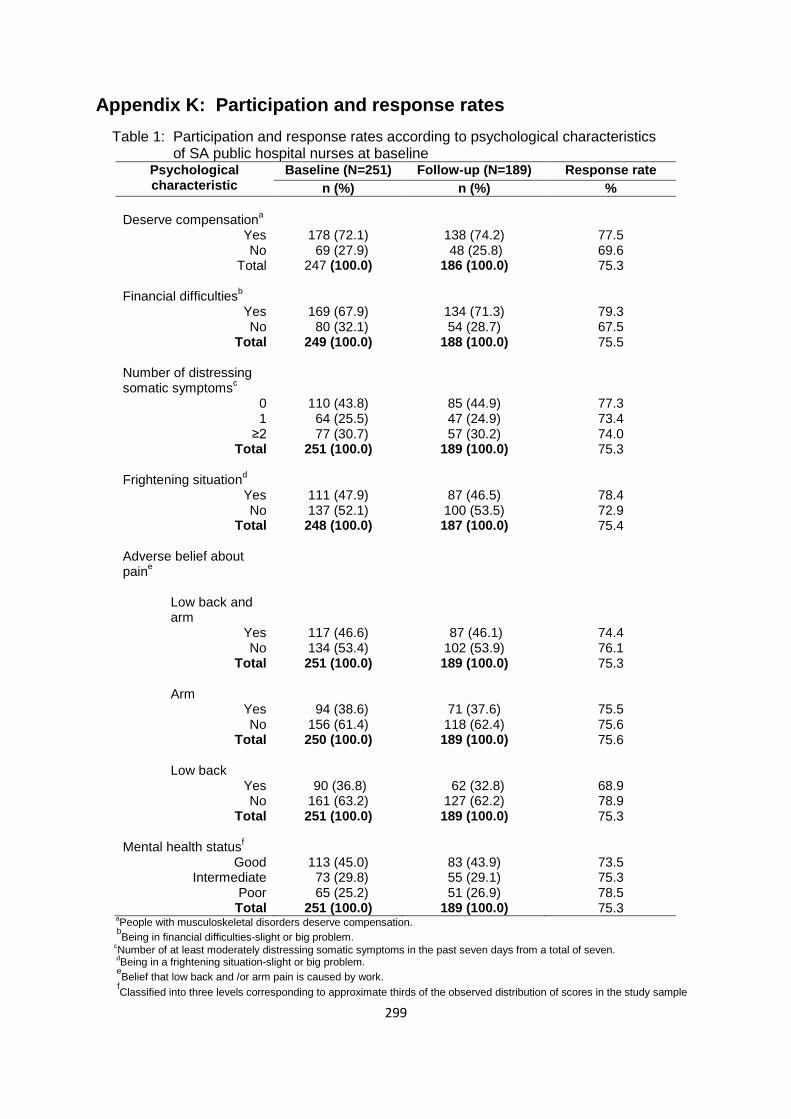
299
Appendix K: Participation and response rates
Table 1: Participation and response rates according to psychological characteristics of SA public hospital nurses at baseline
Psychological characteristic
Baseline (N=251) Follow-up (N=189) Response rate
n (%) n (%) %
Deserve compensation
a
Yes No
Total
178 (72.1) 69 (27.9) 247 (100.0)
138 (74.2) 48 (25.8)
186 (100.0)
77.5 69.6 75.3
Financial difficulties
b Yes No
Total
169 (67.9) 80 (32.1) 249 (100.0)
134 (71.3) 54 (28.7)
188 (100.0)
79.3 67.5 75.5
Number of distressing somatic symptoms
c
0 1
≥2 Total
110 (43.8) 64 (25.5) 77 (30.7) 251 (100.0)
85 (44.9) 47 (24.9) 57 (30.2)
189 (100.0)
77.3 73.4 74.0 75.3
Frightening situation
d Yes No
Total
111 (47.9) 137 (52.1) 248 (100.0)
87 (46.5) 100 (53.5) 187 (100.0)
78.4 72.9 75.4
Adverse belief about pain
e
Low back and arm
Yes No
Total
Arm Yes No
Total
Low back Yes
No Total
117 (46.6) 134 (53.4) 251 (100.0)
94 (38.6) 156 (61.4) 250 (100.0)
90 (36.8) 161 (63.2) 251 (100.0)
87 (46.1) 102 (53.9) 189 (100.0)
71 (37.6) 118 (62.4) 189 (100.0)
62 (32.8) 127 (62.2) 189 (100.0)
74.4 76.1 75.3
75.5 75.6 75.6
68.9 78.9 75.3
Mental health status
f
Good Intermediate
Poor Total
113 (45.0) 73 (29.8) 65 (25.2) 251 (100.0)
83 (43.9) 55 (29.1) 51 (26.9)
189 (100.0)
73.5 75.3 78.5 75.3
aPeople with musculoskeletal disorders deserve compensation.
bBeing in financial difficulties-slight or big problem.
cNumber of at least moderately distressing somatic symptoms in the past seven days from a total of seven.
dBeing in a frightening situation-slight or big problem.
eBelief that low back and /or arm pain is caused by work.
fClassified into three levels corresponding to approximate thirds of the observed distribution of scores in the study sample
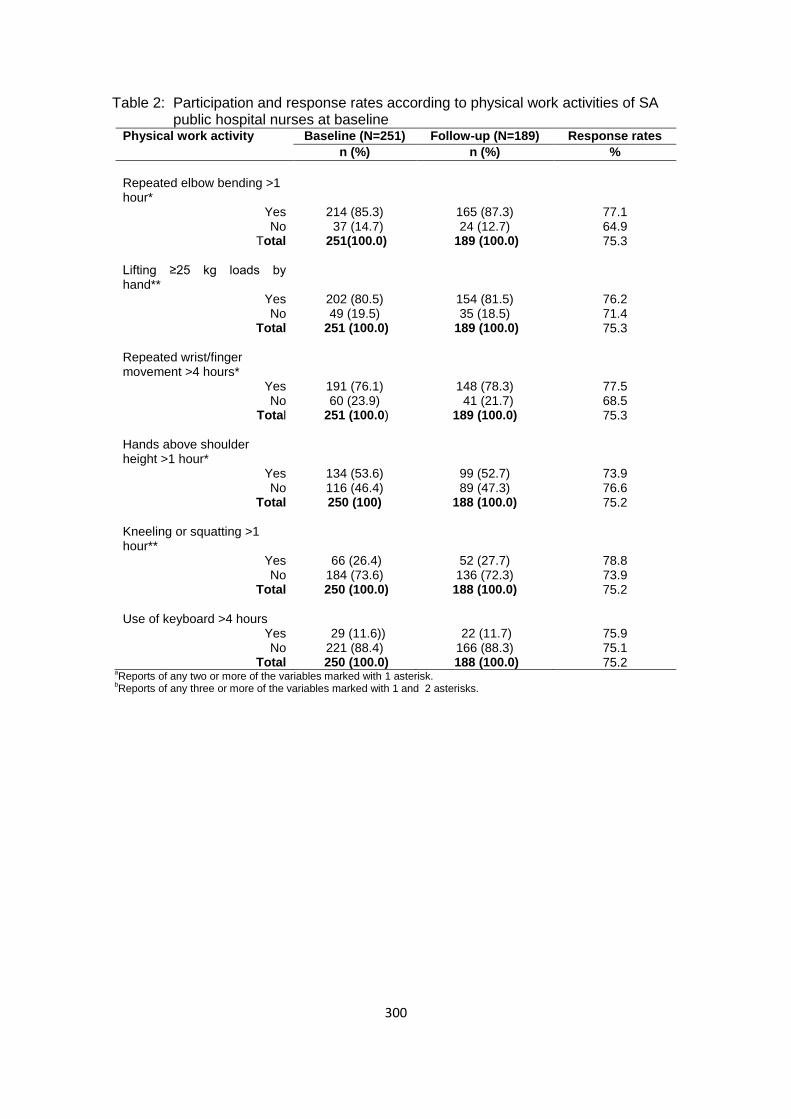
300
Table 2: Participation and response rates according to physical work activities of SA public hospital nurses at baseline
Physical work activity Baseline (N=251) Follow-up (N=189) Response rates
n (%) n (%) %
Repeated elbow bending >1 hour*
Yes No
Total
214 (85.3) 37 (14.7)
251(100.0)
165 (87.3) 24 (12.7)
189 (100.0)
77.1 64.9 75.3
Lifting ≥25 kg loads by hand**
Yes No
Total
202 (80.5) 49 (19.5)
251 (100.0)
154 (81.5) 35 (18.5)
189 (100.0)
76.2 71.4 75.3
Repeated wrist/finger movement >4 hours*
Yes No
Total
191 (76.1) 60 (23.9)
251 (100.0)
148 (78.3) 41 (21.7)
189 (100.0)
77.5 68.5 75.3
Hands above shoulder height >1 hour*
Yes No
Total
134 (53.6) 116 (46.4) 250 (100)
99 (52.7) 89 (47.3)
188 (100.0)
73.9 76.6 75.2
Kneeling or squatting >1 hour**
Yes No
Total
66 (26.4) 184 (73.6)
250 (100.0)
52 (27.7) 136 (72.3)
188 (100.0)
78.8 73.9 75.2
Use of keyboard >4 hours
Yes No
Total
29 (11.6)) 221 (88.4)
250 (100.0)
22 (11.7) 166 (88.3)
188 (100.0)
75.9 75.1 75.2
aReports of any two or more of the variables marked with 1 asterisk.
bReports of any three or more of the variables marked with 1 and 2 asterisks.

301
Table 3: Participation and response rates according to psychosocial work conditions of South African public hospital nurses at baseline
Psychosocial work condition
Baseline (N=251) Follow-up (N=189) Response rate
n (%) n (%) %
Lack of social supporta
Yes No
Total
32 (13.4) 216 (86.6)
248 (100.0)
24 (12.8) 163 (87.2)
187 (100.0)
75.0 75.5 75.4
Working under time
pressureb
Yes No
Total
200 (79.7) 50 (20.3)
250 (100.0)
152 (80.9) 36 (19.2)
188 (100.0)
76.0 72.0 75.2
Lack of controlc
Yes No
Total
59 (23.6) 191 (76.4)
250 (100.0)
43 (22.9) 145 (77.1)
188 (100.0)
72.9 75.9 75.2
Job dissatisfactiond
Yes No
Total
86 (34.3) 165 (65.7)
251 (100.0)
65 (34.4) 124 (65.6)
189 (100.0)
75.6 75.2 75.3
Job insecuritye
Yes No
Total
71 (28.7) 176 (71.3)
247 (100.0)
53 (28.3) 134 (71.7)
187 (100.0)
74.6 76.1 75.7
Incentivesf
Yes No
Total
53 (21.6) 192 (78.4)
245 (100.0)
38 (20.8) 145 (79.2)
183 (100.0)
71.7 75.5 74.7
aAssistance or support from colleagues or supervisors-seldom or never. b
A target amount of work or a number of articles done or finished in a day or working under pressure to complete tasks by a fixed time. c
Choice in all of; how work is done; what is done at work; and work time table and break times-seldom or never. d
Very dissatisfied or dissatisfied about the job taking everything into consideration. e
Feel that job would be insecure or very insecure if off work for three months due to serious illness. f
Piecework or payment of a bonus if an agreed number of tasks are finished in a day.
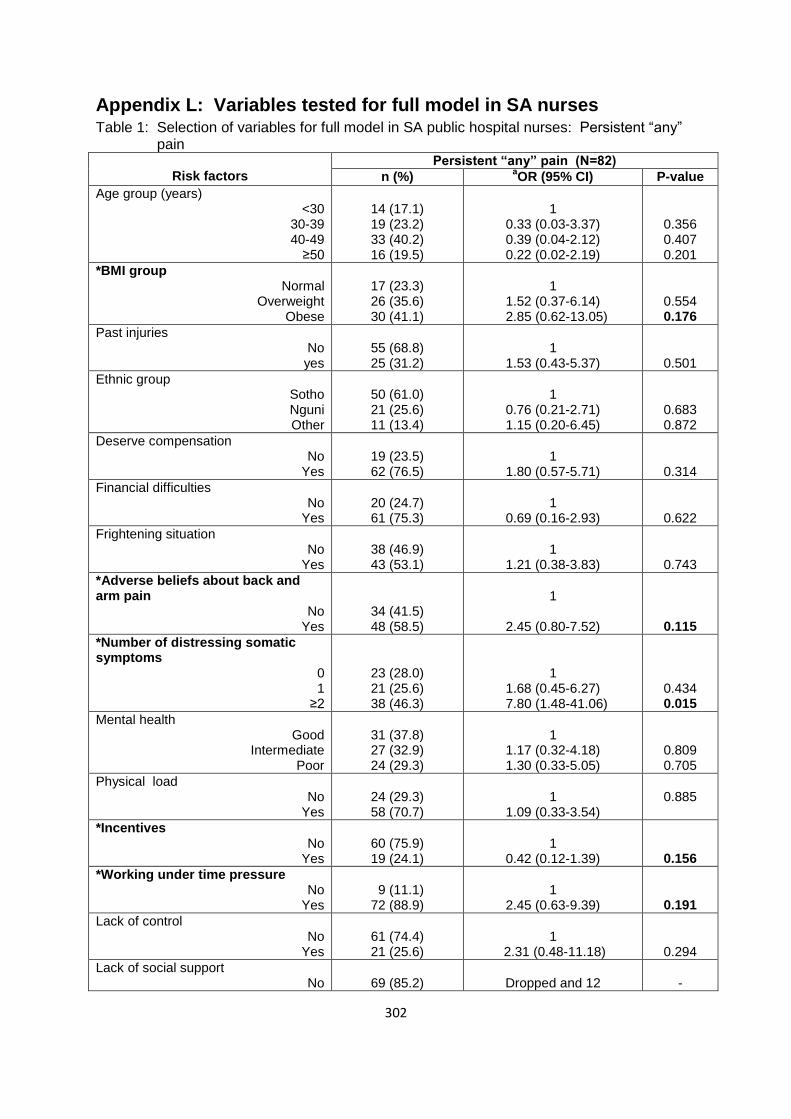
302
Appendix L: Variables tested for full model in SA nurses Table 1: Selection of variables for full model in SA public hospital nurses: Persistent “any” pain
Risk factors
Persistent “any” pain (N=82)
n (%) aOR (95% CI) P-value
Age group (years) <30
30-39 40-49
≥50
14 (17.1) 19 (23.2) 33 (40.2) 16 (19.5)
1
0.33 (0.03-3.37) 0.39 (0.04-2.12) 0.22 (0.02-2.19)
0.356 0.407 0.201
*BMI group Normal
Overweight Obese
17 (23.3) 26 (35.6) 30 (41.1)
1
1.52 (0.37-6.14) 2.85 (0.62-13.05)
0.554 0.176
Past injuries No yes
55 (68.8) 25 (31.2)
1
1.53 (0.43-5.37)
0.501
Ethnic group Sotho Nguni Other
50 (61.0) 21 (25.6) 11 (13.4)
1
0.76 (0.21-2.71) 1.15 (0.20-6.45)
0.683 0.872
Deserve compensation No
Yes
19 (23.5) 62 (76.5)
1
1.80 (0.57-5.71)
0.314
Financial difficulties No
Yes
20 (24.7) 61 (75.3)
1
0.69 (0.16-2.93)
0.622
Frightening situation No
Yes
38 (46.9) 43 (53.1)
1
1.21 (0.38-3.83)
0.743
*Adverse beliefs about back and arm pain
No Yes
34 (41.5) 48 (58.5)
1
2.45 (0.80-7.52)
0.115
*Number of distressing somatic symptoms
0 1
≥2
23 (28.0) 21 (25.6) 38 (46.3)
1
1.68 (0.45-6.27) 7.80 (1.48-41.06)
0.434 0.015
Mental health Good
Intermediate Poor
31 (37.8) 27 (32.9) 24 (29.3)
1
1.17 (0.32-4.18) 1.30 (0.33-5.05)
0.809 0.705
Physical load No
Yes
24 (29.3) 58 (70.7)
1
1.09 (0.33-3.54)
0.885
*Incentives No
Yes
60 (75.9) 19 (24.1)
1
0.42 (0.12-1.39)
0.156
*Working under time pressure No
Yes
9 (11.1) 72 (88.9)
1
2.45 (0.63-9.39)
0.191
Lack of control No
Yes
61 (74.4) 21 (25.6)
1
2.31 (0.48-11.18)
0.294
Lack of social support No
69 (85.2)
Dropped and 12
-
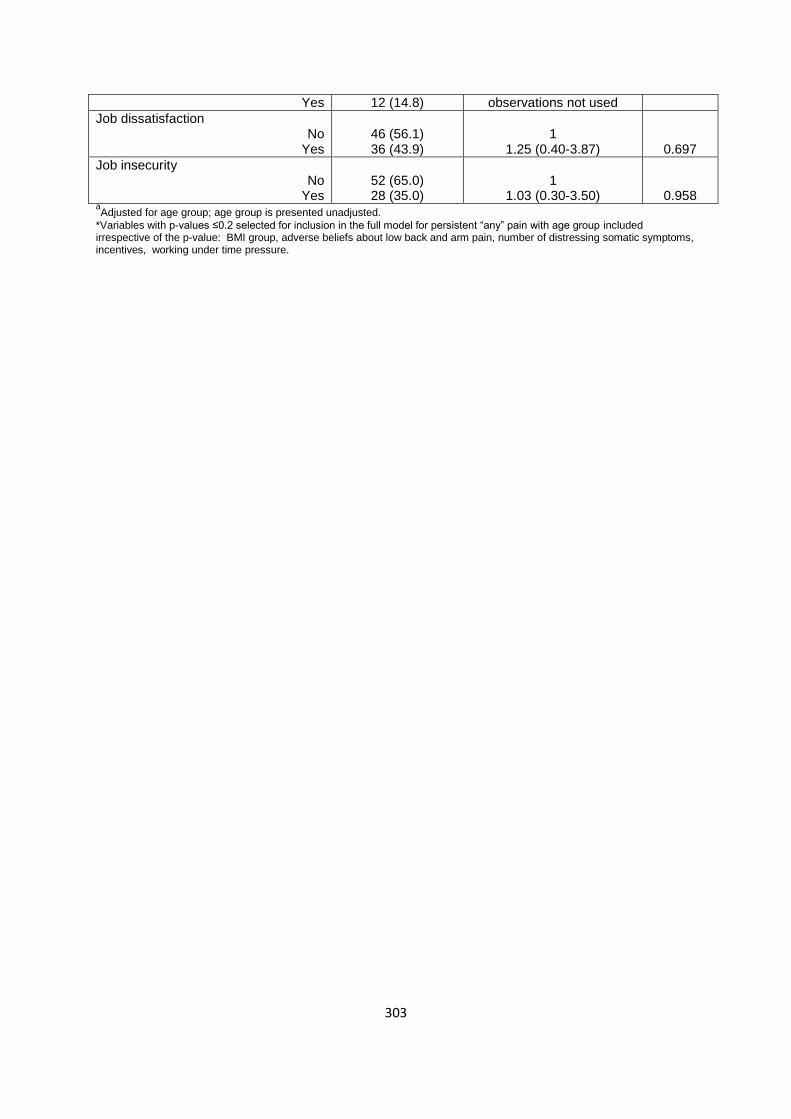
303
Yes 12 (14.8) observations not used
Job dissatisfaction No
Yes
46 (56.1) 36 (43.9)
1
1.25 (0.40-3.87)
0.697
Job insecurity No
Yes
52 (65.0) 28 (35.0)
1
1.03 (0.30-3.50)
0.958 aAdjusted for age group; age group is presented unadjusted.
*Variables with p-values ≤0.2 selected for inclusion in the full model for persistent “any” pain with age group included irrespective of the p-value: BMI group, adverse beliefs about low back and arm pain, number of distressing somatic symptoms, incentives, working under time pressure.

304
Appendix M: Variables tested for full model in SA bank workers Table 1: Selection of variables for full model in SA bank workers: “Any” pain in past 12 months
Risk factor
“Any” pain in past 12 months (N=181)
n (%)
aOR (95% CI)
P-value
Age group (years) <30
30-39 40-49
≥50
77 (43.8) 45 (25.6) 39 (22.2) 15 (8.5)
1
0.67 (0.33-1.36) 1.57 (0.60-4.09) 1.45 (0.38-5.52)
0.270 0.347 0.579
Sex Male
Female
54 (29.8) 127 (70.2)
1
1.34 (0.69-2.59)
0.380
*BMI group Normal
Overweight Obese
83 (46.4) 53 (29.6) 43 (24.0)
1
2.12 (0.91-4.93) 1.59 (0.67-3.74)
0.080 0.287
*Past injuries No
Yes
117 (64.6) 64 (35.4)
1
3.78 (1.57-9.05)
0.003
*Ethnic group Sotho Nguni Other
46 (25.4) 48 (26.5) 87 (48.1)
1
1.93 (0.82-4.51) 1.46 (0.70-3.05)
0.129 0.308
Educational level High school
Tertiary
106 (58.9) 74 (41.1)
1
0.73 (0.37-1.44)
0.378
*Smoking status Never-smoked
Ever-smoked
103 (56.9) 78 (43.1)
1
2.03 (1.02-4.05)
0.042
Deserve compensation No
Yes
75 (42.6) 101 (57.4)
1
1.36 (0.69-2.68)
0.359
Financial difficulties No
Yes
42 (23.5) 137 (76.5)
1
1.38 (0.69-2.76)
0.356
*Frightening situation No
Yes
84 (47.2) 94 (52.8)
1
1.91 (0.99-3.69)
0.052
*Adverse beliefs about low back and arm pain
No Yes
126 (69.6) 55 (30.4)
1
2.06 (0.95-4.46)
0.066
*Number of distressing somatic symptoms
0 1
≥2
40 (22.1) 40 (22.1) 101 (55.8)
1
2.08 (0.90-4.79) 3.55 (1.71-7.38)
0.083 0.001
*Mental health status Good
Intermediate Poor
41 (22.7) 49 (27.1) 91 (50.2)
1
1.69 (0.78-3.64) 3.44 (1.58-7.49)
0.176 0.002
Physical load No
Yes
46 (26.4) 128 (73.6)
1
1.30 (0.66-2.54)
0.438
Incentives

305
No Yes
83 (47.2) 93 (52.8)
1 0.97 (0.52-1.82)
0.942
Working under time pressure No
Yes
7 (3.9)
174 (96.1)
1
1.62 (0.44-5.88)
0.463
Lack of control No
Yes
109 (60.9) 70 (39.1)
1
1.20 (0.62-2.33)
0.575
Lack of social support No
Yes
140 (79.5) 36 (20.5)
1
0.99 (0.45-2.15)
0.988
*Job dissatisfaction No
Yes
99 (55.0) 81 (45.0)
1
1.67 (0.87-3.23)
0.122
Job insecurity No
Yes
60 (33.1) 121 (66.9)
1
1.17 (0.60-2.26)
0.634 aAdjusted for age group and sex; age group and sex adjusted mutually.
*Variables with p-values ≤0.2 selected for inclusion in the full model for “any” pain in the past 12 months with adjustment
variables included irrespective of the p-value: Age group, sex, BMI group, past injuries, ethnic group, smoking status, frightening situation, adverse beliefs about low back and arm pain mental health status, number of distressing somatic symptoms, mental health status, job dissatisfaction.