murine albino-deletion complex: high-resolution ... albino-deletion complex: high-resolution...
TRANSCRIPT

Copyright 0 1997 by the Genetics Society of America
Murine Albino-Deletion Complex: High-Resolution Microsatellite Map and Genetically Anchored YAC Framework Map
Brad A. Rikke," Dabney K. Johnsont and Thomas E. Johnson*
*Institute for Behavioral Genetics, University of Colorado, Boulder, Colorado 80309-0447 and tOak Ridge National Laboratory, Biology Division, Oak Ridge, Tennessee 37831-8077
Manuscript received April 4, 1997 Accepted for publication July 7, 1997
ABSTRACT The murine albinodeletion complex developed as part of the Oak Ridge specific-locus test covers 6-
11 cM of chromosome 7. This complex has proven to be a valuable resource for localizing traits to a small target region suitable for positional cloning. In this study, we mapped the endpoints of deletions in this complex using all of the available Mzt simple-sequence length polymorphism (SSLP) markers. Concurrently, this mapping has determined the map order of nearly all of the SSLP markers, most of which were previously unresolved. The SSLP-based deletion map was confirmed and genetic distances were determined using the European Collaborative Interspecific Backcross panel of nearly a thousand mice. The average SSLP marker resolution is 0.3-0.4 cM, comparable to the cloning capacity of yeast artificial chromosomes (YACs). The SSLP markers were then used to construct a genetically anchored YAC framework map that further confirms the deletion map. We find that the largest deleted region distal to Tyr is about two to three times larger than the largest proximal deleted region, and the original C3H/101 regions flanking the deletions (moved to an St2A &*/fh background) are smaller than anticipated, which we suggest may result from increased recombination rates immediately flanking the deleted regions.
T HE murine albinodeletion complex on chromo- some 7 was developed as part of the mouse spe-
cific-locus test developed at Oak Ridge National Labora- tory to assess the damaging effects of ionizing radiation (Figure 1; reviewed by RINCHIK and RUSSELL 1990). This complex currently consists of about three dozen dele- tions that also remove many other genes besides the albino gene Tyr (formerly c). S o far, -20 such genes have been either physically or genetically mapped to the region (BRILLIANT et al. 1996, Mouse Genome Database, World Wide Web, URL: http://www.informatics.jax. org/mgd.html), but considering the estimated size of the complex of 6-11 cM (RUSSELL et al. 1982), it is likely that hundreds of additional genes are yet to be discovered. Assuming a random distribution of end- points, the average resolution with which these genes can be mapped is 0.1 -0.2 cM, thus making the complex a powerful resource for positional cloning (reviewed by HOLDENER et al. 1992). The complex has already been used to clone Fah (fumarylacetoacetate hydrolase, RUP- PERT et al. 1992) and eed (embryonic ectoderm, SCHU- MACHER et al. 1996) and is currently being used to clone exed and msd (B. HOLDENER and T. MAGNUSON, personal communications). We are interested in cloning quanti- tative trait loci (QTLs) tightly linked to Tyr that influ- ence initial sleep-time sensitivity to ethanol and other
Corresponding author: Thomas E. Johnson, Institute for Behavioral Genetics, University of Colorado at Boulder, Campus Box 447, Boul- der, CO 80303-0447. E-mail: [email protected]
Genetics 147: 787-799 (October, 1997)
general anesthetics (WL and CORLEY 1994; R~KKE et al. 1995; SIMPSON et al. 1997).
Previous maps of the albino-deletion complex em- ployed restriction fragment length polymorphism (RFLP) markers genotyped by Southern blotting (NIS WANDER et al. 1991; SHARAN et al. 1991; KELSN et al. 1992; SCHEDL et al. 1992; HOLDENER et al. 1995). How- ever, this complex has not been mapped using the higher density, simple-sequence length polymorphism (SSLP) markers (COPELAND et al. 1993; DIETRICH et al. 1994, 1996) genotyped by PCR. To integrate the dele- tion complex with these newer markers, we have used all of the available Mit SSLP markers from the region to map the endpoints of 27 deletions. In addition, we have used the European Interspecific Backcross panel (BREEN et al. 1994) of nearly a thousand mice to confirm the deletion map and determine genetic distances be- tween the markers. Finally, we have used the SSLP markers to construct a genetically anchored yeast arti- ficial chromosome (YAC) framework map that further validates the deletion map and provides additional re- agents to support positional cloning.
MATERIALS AND METHODS
PCR Either the forward or reverse MapPair primer (Re- search Genetics) was radiolabeled using 0.5 units/pl T4 Poly- nucleotide Kinase (New England Biolab) and final concentra- tions of 0.16 p~ y-"P-ATP (2000 Ci/mmol, Amersham or New England Nuclear), 4.5 /AM primer, and 1 X Kinase buffer (50 mM Tris-C1 pH 7.5; 5 mM dithiothreitol). The reaction was

788 B. A. Rikke, D. K Johnson and T. E. Johnson
incubated 30 min at 37" and then inactivated by incubation at 65" for 10 min.
PCRs of SSLP markers were carried out in 10-p1 reactions containing the following as final concentrations: 200 p~ each nucleotide (dATP, dCTP, dGTP, TTP), 0.25 units AmpliTaq DNA polymerase (Perkin Elmer), 1 X commercial buffer (Per- kin Elmer; 10 mM TrisHCl pH 8.3 at 25", 50 mM KCl), 1.8 mM MgC12, 0.12 p M forward primer, 0.12 p M reverse primer, and DNA template (1-20 ng). After incubation for 2 min at 94", PCR reactions went through 35-40 cycles of denaturation at 94" for 20 sec, annealing at 50-55" for 45 sec, and extension at 72" for 0-30 sec (Perkin Elmer Thermocycler 9600). Pi- petting of reaction mixes and template DNAs was done using a Biomek 1000 Workstation (Beckman).
After PCR, 7 p1 of stopdye solution (95% formamide, 20 mM EDTA, 0.05% bromophenol blue, 0.05% xylene cyanol) was added to each reaction. After incubating at 80" for 1-3 min, 4p1 samples were run on denaturing, 0.5 mm thick, 5% polyacrylamide gels (Sequagel, National Diagnostics) in 1 X TBE buffer at 45 watts using an IBI sequencing gel apparatus (40-cm plates). Gels were dried 1 hr at 80" under vacuum on gel blot paper (Schleicher & Schuell) and exposed 1-10 days using Kodak BioMax BMR film.
Deletions were generated and maintained as shown in Fig- ure 1. With the exception of 20FA", which was homozygous for the deletion, each deletion was hemizygous and opposite an Mus spretus chromosome for genotyping. Deletion panel genotypes were scored by comparison with C3H, 101, StSa, St2a/deletions, and M. spretus parental controls. Markers in which amplification of the M. spretus allele was relatively weak were run with controls in which M. spretus DNA and M. muscu- lus St2A DNA were mixed in 1:l ratios to simulate heterozy- gosity.
The interspecific backcross genotypes were scored by com- parison with LBC and PSC parental control DNA obtained from EUCIB. The LSC control samples from EUCIB did not amplify. Of the 31 recombinants shown in Figure 4,15 recom- bination sites (LS215, LS313, LS318, LS365, LS715, LS762, LS765, LS836, LB171, LB247, LB419, PS13, PS62, PS69, PB72) were mapped using all of the markers. Eight recombination sites (LS38, LB356, LB539, PS27, PS35, PS46, PS50, PS59) were mapped using all of the markers except D7Mit261. (For mapping the recombination sites of LB171, LB247, LB356, LB419, and LB539, D7Mit62 was not informative because the B6 stutter pattern overlapped the M. spretus allele; D7Mit32 and D7Mit351 were not informative because the M. spretus allele was null). The LS728 recombination site was mapped using all of the markers except D7Mit216. The LS121 and PS16 recombination sites were mapped using markers D7Mit233, D7Mit350, D7Mit261, D7Mit62, D7Mit234, D7Mit321, and D7Mit124. The LS491, LS720, and PS47 recom- bination sites were mapped using the same markers used for LS121 plus marker D7Mitl9. The LB208 recombination site was mapped using the same markers used for LS491 plus marker D7Mit300. The LB386 recombination site was mapped using the same markers used for LS491 plus D7Mit123 and D7Mit320.
The YAC library was purchased from Research Genetics as block, plate, row, and column DNA pools in 96-well microtiter plates. No further DNA preparation was required.
Sizing of C3H and 101 differential segments. The length of each differential region was estimated as the midpoint be- tween the minimum and maximum distances possible. The minimum distance represents the distance between the most proximal and distal SSLP markers that lie within the unambig- uous C3H/101 region. For example, proximal to Tyr, cIDThm (Figure 2) had no SSLP markers within the C3H/101 region; therefore, the minimum distance could be as small as 0 cM.
Distal to Tyr, cIwrhWb had only one SSLP marker (D7Mit123) within the unambiguous C3H/101 region; therefore, the min- imum distance could again be as small as 0 cM. Maximum distances equal the distance between the first unambiguous St2A allele flanking the C3H/101 region and the first marker flanking the deletion endpoint. Therefore, the c'Drhm C3H/ 101 region could be as large as the interval between D7Mit215/D7Mit233 and D7Mit350. Distal to Tyr, the C3H/ 101 region could be as large as the interval between D7Mit3l and D7Mit32. Because each maximum distance includes all of the recombination region interval, the maximum distance on average tends to be an overestimate. Map distances were based on the WI/MIT CGR map (Figure 3A). For some mark- ers whose placement was still tentative (i.e., integrated with only 5-cM resolution based on the MGD map), we used the map position of the next closest marker based on data from this study. Therefore, for D7Mit31 we used the map position of D7Mit216, for D7Mitl71 and D7Mit351 we used the map position of D7Mit184, and for D7Mit262 we used the map position of the Hbb bin. For markers not resolved by the WI/ MIT CGR map, we used the genetic distances determined using the EUCIB panel. Average marker resolution, therefore, was better than the WI/MIT CGR map. The equation used to calculate the predicted one-sided differential length was (lOO/N) [ l - (1 /2)N, where Nequals the generation num- ber (SILVER 1995).
RESULTS
Deletion map: The Mit markers used to construct the deletion map of Figure 2 were selected by first con- sulting the Whitehead Institute/MIT Center for Ge- nome Research (WI/MIT CGR) m a p (http://www.gen- ome.wi.mit.edu) and the Mouse Genome Database/ Chromosome 7 Committee map (MGD map) for mark- ers closest to Tyr; current WI/MIT CGR and MGD maps for the region are shown in Figure 3, A and B. These markers were then tested against 27 of the albino dele- tions. To minimize the risk of not f inding all of the available markers within the complex, we continued testing markers further from Tyr until we encountered at least two markers outside each end of the complex. We found 19 markers that m a p within the complex. As indicated by the WI/MIT CGR map (Figure 3A), the first markers we encountered outside the complex, D7Mit215 a n d D7Mit233 at the proximal end and D7Mit321 and D7Mit262 a t the distal end, were consis- tent with previous studies indicating the deletion com- plex is closely flanked by tp (taupe gene) and Hbb (he- moglobin beta chain gene) (RUSSELL et al. 1982). An- other marker, D7Mit124, was also found to flank the complex; however, it is not shown in Figure 2 because it maps distal to D7Mit321 and D7Mit262 and thus did not provide any additional mapping information. The allele sizes we determined for each of the markers are reported in Table 1.
The deletion map was constructed by determining which markers were present or absent on each deletion chromosome and comparing the deletions to each other. For example, deletion removed all of the SSLPs proximal to Tyr except D7Mit350, whereas dele-

Albino-Deletion Complex 789
A.
T Stock (101lRI x C3wRI) F, (chinchilla) (wild-type)
D.
bl- 1 1 - 1 1 * St2AlSUA St2Alddction
(chinchilla) (light chinchilla)
1 c-
r T/101 or TlC3H T/deletion
(nonalbino) (light chinchilla) T/deletion St2A
(light chinchilla) (chinchilla)
St2A St2Aldeletion (chinchilla) (light chinchilla)
St2Ndeletion St2AfT (light chinchilla) (chinchilla)
St2A St2Aldeletion St2AlSt2A St2Aldeletion St2Aldeletion M. spretus M. spretusISUA (chinchilla) (light chinchilla) (chinchilla) (light chinchilla) (light chinchilla) M spretusldclction
FIGURE 1.-Chromosome 7 derivation of the albino-locus deletion mice used in this study. Deletions were induced in large numbers of radiation mutagenesis experiments at Oak Ridge using the specific-locus method (RUSSELL 1951; RUSSELL et al. 1979, 1982). Boxed genotypes indicate selection of an individual sib for further breeding. (A) A noninbred chinchilla ( L h / t h ) tester strain (T stock, chromosomes represented by thin black lines) was crossed with irradiated males or females from an intercross between inbred strains 101/RI and CJH/RI (chromosomes represented by thick black lines), wild-type ( C ) for Tyr. The radiation- induced deletion is represented by a gap in the chromosome. (B) Most offspring inherited an intact C3H or 101 chromosome, resulting in a nonchinchilla coat color due to dominance of the wild-type Tyr allele. Offspring exhibiting a lighter than normal chinchilla coat color (light chinchilla) indicated a mutation in Tyr that was subsequently screened to identify those carrying the deletions analyzed here (RUSSELL et al. 1979, 1982). (C) The deletions have since been maintained by crossing with the Oak Ridge closed colony, noninbred chinchilla strain St2A (chromosomes represented by thin rectangles). Offspring inheriting a Tyr deletion were again distinguishable as light chinchilla. (D) Repeated backcrossing with St2A has resulted in a chromosome 7 that is almost entirely St2A-like except for the small region encompassing the deletion site. The X between the St2A chromosome and the deletion chromosome indicates recombination. The deletions were also maintained at times by sib mating (not shown) in which hemizygotes were again distinguishable as light chinchilla (homozygous deletions were nonviable). (E) For the purpose of deletion mapping, hemizygotes were crossed with M. spretus (chromosomes represented by thin, shaded rectangles) to maximize the probability of polymorphic differences between the deletion chromosome and the intact chromosome. Offspring inheriting the deletion chromosome were identified by test crossing with an albino (c/c) strain (not shown). Only animals carrying the deletion chromosome produced albino offspring and thus were selected for analysis in this study.
tions ?YP.Sd, ZOZG, 24R145L, c7h?250H, PI. , c1013360L , and 26DcT removed all of the SSLPs proximal to Tyr except D7Mit350and D7Mit261. Therefore, it followed that the proximal endpoint of 29sAs is between D7Mit350 and D7Mit261. By comparison with deletions that removed all but D7Mit350, D7Mit261, and one other marker proximal to Tyr (c1IDm, 2"*, clFR60Hb, and c14m60Hb ), it followed that the proximal endpoints of 2""'", c?",
D7Mit261 and D7Mit62. In this manner, we were able
24R1451. c7R250H, P L , cIOFR601,, and 2 6 D W map between ,
to endpoint map all of the deletions and found no inconsistencies with the underlying assumption that each deletion was continuous. There initially appeared to be a discordancy in the map position of D7Mit262; however, by genotyping multiple St2A parental con- trols, it became clear that this marker was not absent but rather there was a second St2A allele of 110 bp that matched one of the M. spetus allele sizes. The correct placement of D7Mit262 outside the deletion complex was confirmed by the EUCIB panel data.

790 B. A. IZikke, D. K. Johnson and T. E. Johnson
3, ry
5- w
$ 4 -
.c s-
- 2- - .c
Y , s h,
E b % - - 9
2- Ur-
2 -
F 9-
9 - 3 - 2-
3 - - x
2- 3-
2- 2
9 - - q c? g- -- 0 Y
E
q 9 % - -
$ 3- e ? "I G- ry-
- k
s- - -4 n ? Q ". i
~ m - D O b
2 2" - Q 2 - - 3 9 5 - 3 - 3- P -
8-
-
: 2- : 5- k 3- 3 7
E -4
.. 0
Y
B E -
9;
-
I # , ,
I , , , ,
* I # , ,
I I 4 I I I I , I , , , ,
I I I I I I I I I I , , ,
I I I I I I I I I I I l l
8 I I I I I I I I I I I I
' ' ' " ' 'I 1 1 1 1 1 1 1 1 1 1 1 1 1 1 .I
U LL
I I , , , , , = , , , , o , , , , , , , , ,
LLP' I , , , ' , , , , , I , I * I # , I , m I
w , , , , , , , , , , , I I I I I I I I I -
nn n & 4 I I I I I I I I I Be. c3 O I I I
- m m a a n&"a'X"n"a m m m m m m m m , , , , , 1 1 1 1 1 I I I - m
I I I I W n m v G ? , , , , , , , , , , , , !=rJrn.%
, , , , , , , , , , b b b c 5 , I I , I I , , I I , I I I I
, , , , , , - m m ~ I , , I I , , I I I I I I I t , , #
- nn g g g m Y C G m m m , , , , , , , , , , , , , , I I , , , , ~~
.= 2 !2 .z .z u u a u a , , , , , , , , I
, , , I
I
, , , , , ~ o , , , 4 ~ l l l l
I
I , , ,
, , , I
, , # I
I , , , ah, ~ k % % % c P g , g p p E Q % % s z s % - 3 3 3 L A % % % t B % t % % - Q % - Q u%Ctt5%Stt2% u
e - ¶ - $ e s ~ ~ ~ ~ . s ~ P , , ~ l o & ~ ~ ~ ~ ~ ~ ~ ~ ~ ~ ~ ~ ~
- E 0 ....
3 0 c
- 0 E
." c. s
- E II i : I - 0 .I
- 2
2 - 8
M -
.... E! - E - 3 m
:0
z g $ 2 % $?,$q-$$? m c n E T % * &2Z2 g g;+ c A % 2
- q + z & + m g w C Q , 2 g 2 s a w - 2 u w g S-s i-d,5.0 c gz 5s W U S E.2 6 u, 6b2 g a s p 2: : r e Z a E ? ; ~ g 2 ~ G B % 2 8 kgs 3 a.g
p - .- ,gm; 2 3 4 0 - l p u s .5 z 0 c z 8 s z s X x a azi"-dg..-m, "2 'u % . - 2 $ & 5 2 y i 3 ;$ : m T c e ; 2 0 i o
- d p e g 2 3 d m a L g B $z;5s u 2 q o E W w c b * d , m a ZZ.""" : m 2 .- gyi+ 8 g2 0 i CY w - d L 0 e 4 0 u
s . - Q x s 2 y s S 2 k % s s $ x ? c r m $ 8 - s E w + e c o " , 2ou:z 8 :u O w
' S Q ] wz;da m"; p . g % $
sC0-z &&;5 o - d c 5 a- 0 0 L Q D
'Sm .^ c 4.3 2 a e, y 0 0
2 3 ezs .- * u m Z . $ c .3 3 w % % z 4 , ~ G < ~ a o n 6 - m p 0 - 9 c 5s 0 b%;" y gcn Q, E : w g; L i & g 8 g - & + % 52 m l u 9 ' $ g r n E Z ' G + c & ? urn O k U W + ~ G
j $ g 6 gu&g c g ' p z 2 Z E c u & a 2 cy cz & E $ c.;: a a c 0
u 6 w 2 5 5 . 5 z5 w ? S 2 p j ;2 p z N - d 5 + % r , @ y z i W & Y g 2.2 g.5 w?4 " $ E % $ 2 5 2 0 . 3 e, 2 ' 3 E 2 s & .-ea e m 0 3 u) 0 $ 3 2 4 E y z p ; 3 3 2 2
$ % & E 0 m m
w Q, .2.El-ds $ 2 8 " , $ y , , + l k E C i
y 3 3 . 5 ; z 0 2 - P L o 2.g 9 $4 6 ;p E-. $ 6 - d w c e d - 2 c z $ 2 8 - - " W o 3 ." 3 3 W * - q 3 , 3 & . 9'3 x 2 & e z c ~ W 5 - m
9 2 % 5 3 a p - d w ._ m 0 $ ;j ,?$ :$ ; c p * c .5 52; 3 2 % E Y % E ~ z ~ ~ ~ ~ $ < m '-
C . 5 - d " B P 5 z z c m
2 5 4 5 2 5 % 0 ' 3
b 4 i Lorn^ 520 si
ea 1 3 & . 5 u m . 5 w w 2 $ J g d c : 5 G z 2 ET
k z z g5 5 1 6 5 3 ? w,sz J g 2 g p & ' w 2 02
[; A: d * O Z " C El -&p:-- w-dg-CY 5 g; 2 : s g $23$ $2
p 2 8 4 z 2 2 8 a 8 E
w c n c e w w c
0 % w i
2 .53 p Fz $6 5 2.2 E k w z g * %
."A El . -C-J p\ ld C. x - m C ;a $ " Q E 0 2 $: 2 :.zag;L i. as M Q 0 0 e$.S:?E $ c
a g % n q y m
f g 2 c ^ 2 2 y % x % E
.- . ;de
C " m u ) z C ~ D o m '
E - & " + cs
c d z.0 M $ S = e, u' m
E & - R9 E ' & r n Z a y .E
$ % e! 3 E a4 O C ~ G
2 % 0 0 E b y ' . $ j z g
* m.u 0 El Lz2 0
3 i c n s b 5 . 5 $ s i E 5 4 -
.2 kg+Js 9 3 E m % 8 8 w a vlrn u c z ;4 &am
22-5 o - c g m " " 8 m a L - ; w ;: $ 2 2 G e + m
3 - T 2 G , = c n - o z 5 L u u u c z m w L d " O & . -
i m - 8,m, M S s 2 5 s w-$gmo w a . 3
%,:gs E % 2 F g , 2 L
, a ..I E 8 8 @ $ & 8
Albino-Deletion Complex 79 1
A. 1997 Whitehead InstituteMIT Center for Genome Research Map
D7MIT markers: I rp, 215,233 ,...I 1261,35Oll?)v, 19,31,62,-1 1171,184 I 321 1124,262,Hbb ,... I
0 7 5 5 ; ..........: ..... ".. :... ...... ............ : . -~ . . . . . . . : . . . . .~ .~~~. . . .... ... : ... CM 29.5 30.6 31.7 33.9 35.0 36.1 31.2
B. 1997 Mouse Genome Database and Chromosome 7 Committee Map
D7MIT m a r k e r s :
CM 40.0? 41.0? 42.07 44.0
C. 1997 Rikke et al. Map
wF.;J' !!..!.r..........,i.'~I,
D7MIT m a r k e r s : T~ 123,320 19 216 31 352 300301
I 1
,21%233.... 350 261 62 234 32 148 5 183 171 184 351 321 262 124, ... /+& CM 36.8 43.1 44 .O 46.4 47.6
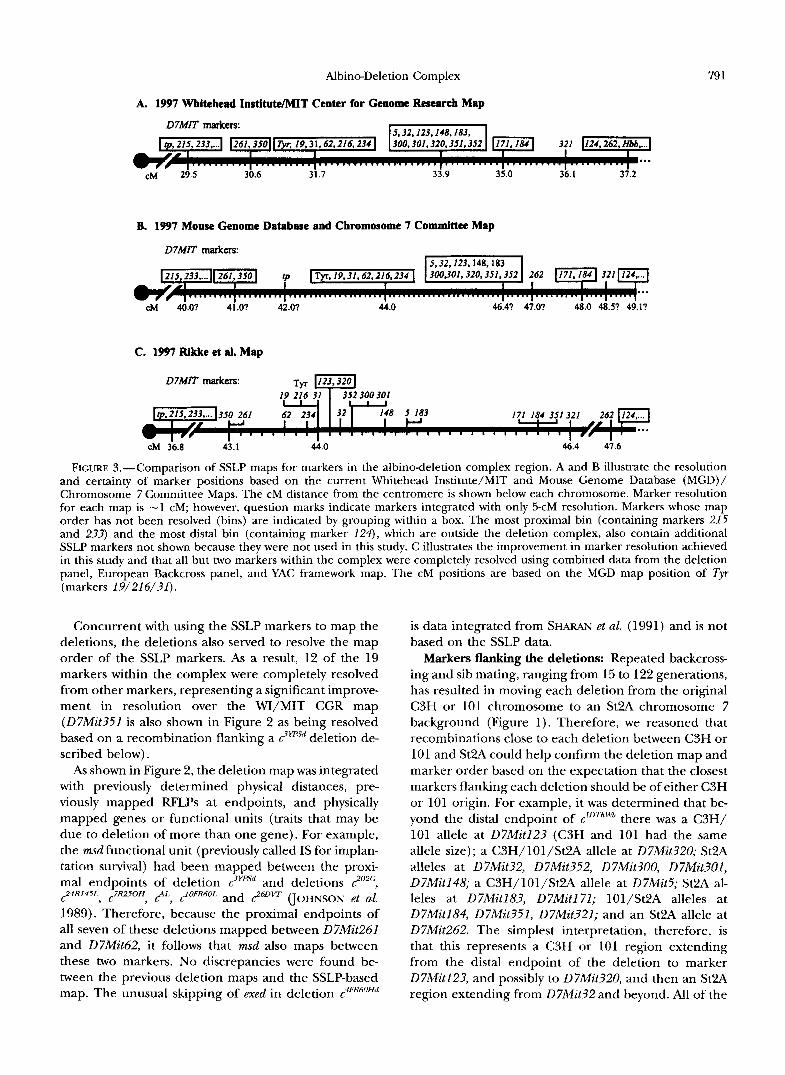
Frcum 3.-Comparison of SSLP maps for markers in the albinodeletion complex region. A and B illustrate the resolution and certainty of marker positions based on the current Whitehead Institute/MIT and Mouse Genome Database (MGD)/ Chromosome 7 Committee Maps. The cM distance from the centromere is shown below each chromosome. Marker resolution for each map is -1 cM; however, question marks indicate markers integrated with only 5-cM resolution. Markers whose map order has not been resolved (bins) are indicated by grouping within a box. The most proximal bin (containing markers 215 and 2?3) and the most distal bin (containing marker 124), which are outside the deletion complex, also contain additional SSLP markers not shown because they were not used in this study. C illustrates the improvement in marker resolution achieved in this study and that all but two markers within the complex were completely resolved using combined data from the deletion panel, European Backcross panel, and YAC framework map. The cM positions are based on the MGD map position of Tyr (markers 19/21 6/31),
Concurrent with using the SSLP markers to map the deletions, the deletions also served to resolve the map order of the SSLP markers. As a result, 12 of the 19 markers within the complex were completely resolved from other markers, representing a significant improve- ment in resolution over the WI/MIT CGR map (D7Mit351 is also shown in Figure 2 as being resolved based on a recombination flanking a 2wsd deletion de- scribed below).
As shown in Figure 2, the deletion map was integrated with previously determined physical distances, pre- viously mapped FSLPs at endpoints, and physically mapped genes or functional units (traits that may be due to deletion of more than one gene). For example, the msd functional unit (previously called IS for implan- tation survival) had been mapped between the proxi- mal endpoints of deletion ?"'sd and deletions ,"*',
1989). Therefore, because the proximal endpoints of all seven of these deletions mapped between D7Mit261 and D7Mit62, it follows that msd also maps between these two markers. No discrepancies were found be- tween the previous deletion maps and the SSLP-based map. The unusual skipping of exed in deletion c4iR60Hd
24RI45L c7RZ50H > pi*, C1OFR6OL and 26Dw (JOHNSON et al.
is data integrated from SHARAN et al. (1991) and is not based on the SSLP data.
Markers flanking the deletions: Repeated backcross- ing and sib mating, ranging from 15 to 122 generations, has resulted in moving each deletion from the original C3H or 101 chromosome to an St2A chromosome 7 background (Figure 1). Therefore, we reasoned that recombinations close to each deletion between C3H or 101 and St2A could help confirm the deletion map and marker order based on the expectation that the closest markers flanking each deletion should be of either C3H or 101 origin. For example, it was determined that be- yond the distal endpoint of cJDPIm there was a C3H/ 101 allele at D7Mitl23 (C3H and 101 had the same allele size) ; a C3H/101/St2A allele at D7Mit320; St2A alleles at D7Mit32, D7Mzt332, D7Mit300, D7Mit301, D7Mit148; a C3H/101/St2A allele at D7Mit5; St2A al- leles at D7Mit183, D7Mitl71; 101/St2A alleles at D7Mit184, D7Mit351, D7Mit321; and an St2A allele at D7Mit262. The simplest interpretation, therefore, is that this represents a C3H or 101 region extending from the distal endpoint of the deletion to marker D7Mit123, and possibly to D7Mit320, and then an St2A region extending from D7Mit?2 and beyond. All of the

792 B. A. Rikke, D. K. Johnson and T. E. Johnson
TABLE 1
SSLP allele sizes determined in this study
Deletion panel EUCIB
Oak Ridge L) 7Mit marker C3H 101 St2a" M. sfwetus C57BL/6 M. spretus M. spretus
London Paris
5 1 4 31 32 62
123 124 148 171 183 184 215 216 233 234 261 262 300 301 320 ?21 ?50 351 ?52
223 134 226 140 156 141
146 Null 143 175 109 186 147 144 104 96
126 109, 135* 84
128 126 121 118
-
223 134 222 140 156 141
146 76
143 152 109 186 147 144 104 96
126 135 84
105 126 107 118
-
223 134 246' 132 148 143
136 82
147 152
182 149' 144 104
139" 114 84
105'l 120, 140 107 108
-
96, 112
96, 110
224,h 226" 128 19Od Null 146 204d
148
202d 179, 181, 187
146 124,' 161,' 16gb 146' 118', 121h 100, 110" 134, 142"'
-
92, 100
82, 86
94" 94d
107 114 Null 128
223 134 240' 132 148 143 114 134 84
147 152
182 139 130 104 110 126 116 84
113 120 107 120
-
224," 226h 128 156, 164 Null 146 211 160, 164 148 76, 96
186,h 194 179, 194
146 155k 144 118", 122' 96, 114
106, 133 96, 114 94, 98
107, 121 114 Null 106, 110
-
2 2 6" 128 192 Null 1 7 6 155" 160" 1 52" 76
149, 176 175'
146 124 142 1 o d 124 129" 92 88, 94
127/ 108/ Null 118'
-
Values are allele size, expressed as number of base pairs. Estimated error range is ?2 bp. -, no data. St2A is a closed-colony, noninbred chinchilla ( cCh/c") strain. Often weak or missing due to inefficient amplification, particularly when M. spretus allele competed with M. domesticus allele.
M. spretus C/c9"R60H6 (female 11039) and M. spretus C/F"" (female '7598) had a 198-bp allele at D7Mit31, a 215-bp allele at ' St2a r'h/c6"' (female 2885) had a 240-bp allele for D7Mit31.
D7Mit123, a 186-bp allele at D7Mit183, a 106-bp allele at D7Mit320. I' Mouse PS50 had a 242-bp allele for D7Mit31. 'Mice PS69 and PS71 had a 148-bp allele at D7Mzt62, a 112-bp allele at D7Mit261, a 119-bp allele at D7Mit321, a 126bp allele
"Mice PS69 and PB72 had a 170-bp allele at D7Mit123 and a 154bp allele at D7Mit148.
'Mouse PS69 (mouse PS71 not tested) had a 177-bp allele at D7Mit184.
at D7Mit350, and a 102-bp allele at D7Mit352.
Mouse LB247 had a 188-bp allele at D7Mit183.
/ st2* 6"/c3YP.sd (female 1130) and St2A c'h/r68'' (female 2885) had a 147-bp allele at D7Mit233. When this allele competed with the C57BL/6 allele or when C57BL/6 DNA was mixed with M. spetus parental DNA, a 160- allele was often obtained instead.
bpL M. Spretus C/?"'" (female 7598) had a 142-bp allele at D7Mit234.
allele at D7Mit300. "I M. Spretus C/C'"""~' (female 4083) and M. Spretus C/cy'R6nHb (female 13081) had a 114bp allele at D7Mit262 and a 141-bp
,I s t 2 ~ r,h/c231J1'~ (no. 1307) had a 141-bp allele at D7Mit300. I2 M , Spretus c/ Yl:l260lll, (female 11039) had a 107-bp allele at D7Mit301.
c / r 2 4 ~ ~ 4 5 ~ . , St2A c r ~ 8 , c ~ ~ 2 m ~ ,
Laboratory.
P This allele was not detected in our parental C3H; however, it was inferred based on genotype of St2A 6h/2"R'45L, M. Spretus M. Spretus C/c7R250H, and C3H allele size determined by DIETRICH et al. (1996) and C3H from Jackson
</ St2A r,l,/c?YP.sd (female 1130) had a 128-bp allele at D7Mit321.
recombinations were consistent with the marker order three different mice were genotyped (Figure 2). One determined using the deletion map. of the ZyPSd recombinations indicated that D7Mit351
We also found that different recombination sites were maps distal to D7Mitl71 and D7Mit184; whereas, the typically not observed when multiple mice carrying the WI/MIT CGR map indicates D7Mit351 maps proximal same deletion were genotyped ( c ~ ~ ' ~ ' ~ ~ ' , c"'""; L~"", dl., to D7Mitl71 and D7Mit184. This was investigated fur-
bination sites were found flanking deletion zY*?5d when mouse line (RI 6) that had previously been shown by
C11.K60HI, WMOHI, C3K601. , C , ) . However, three different recom- ther by genotyping an LSXSS recombinant inbred (RI)

Albino-Deletion Complex 793
MARKEL et al. (1996) to have a recombination placing D7Mit184 distal to D7Mitl71. We confirmed this recom- bination and also found that D7Mit351 maps distal to D7Mitl71, thus confirming the placement of D7Mit351 distal to D7Mitl71 and D7Mitl84 as indicated by zWsd.
Mapping the recombinations also indicated that
PL, c14FR60Hb, I ? ~ ~ ~ ~ ~ ) had originated on a C3H chromo- some, and 10 deletions (?'"", ZFR6OHg, ?Wq, e""",
on a 101 chromosome. For the other nine deletions, there was no allele present that distinguished between C3H and 101. Two deletions, ?4R145L and c7m50H, had C3H alleles at D7Mitl71, D7Mitl84 and D7Mit351 but initially appeared to have a 101 allele at D7Mit301. It is possible that there was a recombination between the C3H and 101 chromosome when the (C3H X 101) Fls were first crossed with St2A, however, the WI/MIT CGR database and our own testing of C3H from Jackson Laboratory indicated C3H also has a D7Mit301 allele the same size as the 101 allele, strongly suggesting that the 101 allele of ?4R145L and is actually another C3H allele. Therefore, each deletion was consistent with having originated on either a C3H or 101 chromo- some, and the C3H:lOl ratio of 8:lO was consistent with the expectation that deletions induced in Fls would have an equal probability of occurring on either a C3H or 101 chromosome.
We also characterized the recombinations to deter- mine whether the lengths of the C3H or 101 regions flanking each deletion (i.e., the differential segments) were consistent with the expected lengths based on the number of St2A backcross generations and sib matings used to maintain each deletion (Table 2). The number of generations used to maintain the deletions, however, was quite high, having a mean of 53.3. Therefore, dele- tions maintained more than 53.3 generations were ex- cluded because the differential segment length no longer changes appreciably (SILVER 1995) and any devi- ations from the predicted length would be undetectable at the limited resolution (1 cM) of the WI/MIT CGR and MGD maps. It was found that deletions maintained <53.3 generations (average 35.3) had proximal and distal one-sided differential segment lengths that aver- aged 1.1 cM (SE = 0.13) and 1.8 cM (SE = 0.20), respectively (see MATERIALS AND METHODS), which are both significantly less (two-tailed significance P 5 0.001, Student's t-test) than the predicted length of 2.8 cM (100 cM/35.3 generations). This test, however, assumes the average distance between the markers is not s u b stantially greater than the 1-cM resolution of the maps, which has not been shown.
European Interspecific Backcross panel map: To confirm, further resolve, and add genetic map distance information to the SSLP-based deletion map, we also mapped each of the SSLPs using the European Collabo- rative Interspecific Backcross (EUCIB) panel. This
eight deletions ( Z Y P S d , 2 0 F A T W c4FR60Hd 24R145L c7R2f0H 9 9 , 9
clFR60Hb z R 6 O L 2 R 1 4 5 L lOFR6OL 146G, 29SA.Y) had originated 9 , , c , c
TABLE 2
Sizes of C3H or 101 regions flanking the deletions
Size range (cM) '
Generations Proximal Distal Deletion" maintainedb segment segment
122 0-1.1 0-2.2 31 0-1.1 1.1-5.5 55 0-2.2 0.2-0.3 73 1.1-2.2 0-2.2 71 1.1-2.2 1.1-3.3 70 0.2-1.1 0-1.1
1.1-2.2 0-3.3 31 1.1-2.2 1.1-3.3 31 1.1-2.2 1.2-2.2
102 0-1.1 0.6-1.1 34 0-2.2 1.1-2.2 44 0-2.2 1.1-2.2
64L 15 0-2.2 P
1.1-2.2 18 0-2.2 1.1-2.2 42 0-1.1 0.5-1.1 66 0-1.1 1.1-3.3 43 0-2.2 0-3.3 84 0-1.1 0-3.3
0-1.1 0-? 84 0-1.1 0-3.3 51 0-1.1 0-?
Mean 53.3 1 .Od 1 .6d SD 27.7 0.45 0.63 SEM 0.10 0.15
clDThWZ
2 3 D W
2- clIDFoHx
clFR60Hb
zFR60Hb
2R60L 53 2R145L
2R145L
202G
24R145L
c7R250H
cI 9DTR
C68G
cI OFR6OL
c146G
c12FR60Hb 51 c146G
c12FR60Hb
"The other deletions of Figure 2 were excluded because the exact number of generations was not known.
Number of backcrosses and sib matings. 'Size range based on WI/MIT CGR and EUCIB panel
'Mean was obtained by averaging the size range midpoints.
panel consists of 983 progeny from reciprocal back- crosses made after an interspecific cross between M. musculus C57BL/6 (B6) and M. sp-etus. Theoretically, this panel makes it possible to obtain marker resolution down to 0.3 cM with 95% confidence (BREEN et al. 1994). The SSLP allele sizes we determined are given in Table 1.
Screening the EUCIB panel was accomplished in three stages. In the first stage, 222 DNA samples recom- binant between two "anchor" markers (D7Nd.s and D7Mit40) flanking the complex were sent to us and these were genotyped using markers D7Mit233 and D7Mit124 (Figure 3), which more closely flank (within 1-3 cM) the ends of the deletion complex. Of 212 samples that gave a reliable PCR product, 104 recombi- nants were identified. The genetic distance between these markers is, therefore, -11.1 cM (104/212 X 222/ 983 X 100% X 1 cM/1% recombination). This is 3.4 cM (32 recombinants) larger than expected based on the WI/MIT CGR map and 2.1 cM (20 recombinants) larger than expected based on the MGD map (Figure 3).
In the second stage of screening, the 104 recombi-
ma s.

794 B. A. Rikke, D. K. Johnson and T. E. Johnson
nants were genotyped using markers between D7Mit233 and D7Mit124. From this data, we determined that the proximal end of the complex was between the tp bin of markers (DYMit215/D7Mit233. . .) and D7Mit350, and the distal end was between D7Mit351 and D7Mit321, indicating a genetic distance for the complex of -4-9 cM based on the WI/MIT CGR and MGD maps. Between D7Mit233 and D7Mit350, there were 60 recombinants, indicating a distance of -6 cM (60/212 X 222/983 X 100% X 1 cM/1% recombination = 6.4 cM), which was -50 recombinants (5 cM) more than expected based on the WI/MIT CGR and MGD maps. Between D7Mit350and D7Mit321, there were 31 recom- binants (3 cM), which is -21 recombinants (2 cM) and 40 recombinants (4 cM) smaller than expected based WI/MIT and MGD maps, respectively (Figure 4). Based on a Poisson distribution, the standard deviation of the WI/MIT CGR map for the D7Mit35QD7Mit321 interval would be 52l’* or 7.2 recombinants, and thus the EU- CIB panel distance for markers within the deletion com- plex was significantly smaller ( P < 0.05) than expected. To check whether any recombinants were missed, nearly all of the 104 recombinants were genotyped with D7Mit234, which lies just proximal to Tyr, and no addi- tional recombinants were suggested.
The EUCIB panel map distances tended to be smaller than the WI/MIT CGR and MGD map distances throughout the D7Mit35OD7Mit321 interval, suggesting the lack of recombinants was not due to the genotyping of any particular marker. In the region proximal to Tyr (D7Mit35OTy~) the EUCIB panel map distance is 2.2 cM smaller than the MGD map distance and 0.3-0.8 cM smaller than the WI/MIT CGR map distance (Figure 3). Just distal to Tyr (Tyr to D7Mit5/DyMit32/D7Mitl23/ . . . D7Mit352), the EUCIB panel map distance is 1.4 cM smaller than the WI/MIT CGR map distance and 1.6 cM smaller than the MGD map distance. In the distal region of the complex from D7Mitl84 to D7MIt321, the EUCIB panel map distance is 0.8 cM smaller than the WI/MIT CGR map and 0.2 cM smaller than the MGD map distance.
In the third and final stage of screening, the 31 re- combinants between D7Mit350and D7Mit321 were used to map all of the SSLP markers within the deletion complex (Figure 4), resulting in the resolution of five individual markers and six marker bins. Therefore, the average resolution obtained, based on the WI/MIT CGR and MGD map distances, was 0.7 cM (5.5-7.5 cM/10 marker intervals). Although the EUCIB panel confirmed the map order of markers determined using the deletion panel and provided genetic map distance information, it did not resolve any additional markers.
Discordant mapping data was obtained for marker D7Mit62. This marker was clearly heterozygous in mouse PS71 from the M. spetus (Paris) backcross (data not shown), but all of the flanking markers were homozy- gous. We also found that the heterozygous genotype of
mouse PS69 from the same backcross was inconsistent with the map order of D7Mit62, based on data from the deletion panel and other data from the EUCIB panel. These discordancies were resolved by postulating a sec- ond M. spetus (Paris) allele for D7Mit62 that matches the B6 allele size. This interpretation was further sup- ported by repeated assays in which both the PS69 and PS71 “B6 alleles” tended to have a slightly slower mobil- ity than the B6 alleles of the other EUCIB samples.
YAC framework map: As shown in Figure 5, the 19 SSLP markers within the complex were also used to construct a genetically anchored YAC framework map by screening the MIT mouse YAC library of KUSAMI et al. (1993). This library has an average insert size of 600 kb and represents 4.3 genome equivalents. Consistent with this, all but one marker (D7Mitl71) detected four to seven positive YAC addresses, and the average num- ber of positive addresses was 4.8. Four additional YACs from the same library (125h3, 61a10,60al, and 169e9) have been detected by HOLDENER et al. (1995) as part of a contig covering eed, and thus appear to map between D7Mitl23/07Mit320 and D7Mit32.
The close proximity of markers suggested by the dele- tion panel and EUCIB panel maps was also suggested by the YAC framework map. For example, D7Mit350 and D7Mit261, whose map order was resolved by only one deletion endpoint, were found in six of the same YACs. D7Mit19 and D7Mit216, whose map order could not be resolved using either the deletion panel or the EUCIB panel, were found in four of the same YACs, which were also positive for D7Mit31. D7Mit123 and D7Mit320, whose map order could not be resolved us- ing the deletion panel or the EUCIB panel, were found together in one YAC. D7Mit32 and D7Mit352, which mapped to a 360-kb region containingJit1, were found in two of the same YACs. D7Mit352 and D7Mit300, re- solved by only one deletion endpoint, were found in two of the same YACs. D7Mitl71, D7Mit184, and D7Mit351, resolved by only one recombination found among the deletions and the recombination found in LSXSS RI 6, were found in two of the same YACs. No markers were found to be so close together that they were completely redundant for all of the same YACs.
Sequence-tagged site (STS) content mapping (GREEN and GREEN 1991) of the YACs also helped to confirm and resolve some of the marker map orders. For exam- ple, the contig that includes YACs 2g4, lla10, 122e7, 157bl1, and 177e2 suggested that D7Mit184 is between D7Matl71 and D7Mit351, which is consistent with the order D7Mitl71-07Mitl84-07Mit351 determined using the deletion panel and LSXSS RI 6. The contig that includesYACs 3d12,44d5,51b12, 124d10,191cll, and 193a12 suggested D7Mit3l is distal to D7Mit216, which is consistent with deletion 2R145L. This contig also sug- gested D7Mit216 is distal to D7Mitl9, which was not resolved using the deletion panel; however, chimerism of YAC 124d10 cannot be ruled out and thus D7Mitl9

Albino-Deletion Complex 795
350.261 62 234 5,183 171,184,351 321 352,300,301)
148 I I I ...
I I I l l t l l l I l l l l l l l l l l l l
LB171 1 LB419 I LS765 5 PS59 1 Y
PS69 1 r PSI3 ) V
LS38 I LS491 )
LB208 LS720 LB386 -m 1
PSI6 3 LS728 -2 3 LS836 1 1 I
PB72 l I Z 9 i LB356 ~~3 1 LS215 ’1 1 LS313 ‘ ~ m 1 LS318 1 LS365 s m 1 LS715 I LS762 ;% 1
PS62 5- I LB247 LB539 1 PS27 r/mr/o i
PS46 3
Ps47 I
Ls121 1
PS50 -m 3
PS35 j
H approximately 0.1 cM, 0 heterozygous region, recombination region, = homozgyous region
FIGURE 4,“European Collaborative Interspecific Backcross panel map. The panel consisted of nearly 1000 animals; therefore, each recombinant represents -0.1 cM. The order of markers within bins (indicated by underlying brackets) is based on additional mapping information obtained in this study. Beneath the chromosome diagram, the recombinants identified are listed in the column at the left. The rectangular box to the right of each recombinant name indicates the genotypes and region of recombina- tion. Within the rectangular boxes, white areas indicate regions homozygous for the backcross strain, black areas indicate a heterozygous region, and hatched areas indicate the region where the recombination occurred. Some of the marker genotypes are inferred based on flanking markers (see MATERIALS AND METHODS). The marker allele scores are available via the World Wide Web at URL site http://www.hgmp.mrc.ac.uk/MBx/MBx/MBxHomepage.html. LS and PS prefixes indicate F,s backcrossed with M. spretus London or Paris, respectively; LB and PB prefixes indicate Fls backcrossed with C57BL/6. For example, the map of recombinant LB171 indicates that the region from marker 3550 up to and including marker bin 5/183 was homozygous for C57BL/6, the recombination was between bin 5/183 and bin 171/184/351, and markers 171, 184, 351, and 321 were heterozygous.
could map between D7Mit216and D7Mit31. According to the WI/MIT CGR and MGD maps, D7Mitl9 and D7Mit31 are within the Tyrgene, which covers 70-80 kb (RUPPERT et al. 1988), and the 2R145L deletion endpoint between D7Mitl9 and D7Mit3l is also within Tyr (RIN-
CHIK et al. 1993); therefore, the D7MitlgD7Mit216 D7Mit31 map order would also suggest that D7Mit216 also lies within Tyr, which has not previously been recog- nized.
DISCUSSION
Significance: This study provides the first microsatel- lite-based deletion map of the albino-deletion complex.
This represents a significant improvement over previ- ous RFLP-based maps because more regions of the com- plex can now be easily accessed using PCR. Because Mit SSLP markers have become “common currency” for mapping genetic traits, it will also be easier to integrate the deletion complex with newly identified genes. The estimated size of the deletion complex using the Mzt markers is 4-9 cM, which is consistent with the previous estimate of 6-11 cM (RUSSELL et al. 1982). Based on 80,000 genes per haploid genome (1450 cM), it can be estimated that the complex contains on the order of 200-500 genes (4-9 cM/1450 cM X 80,000).
The size of the complex distal to Tyr appears to be about two to three times larger than the size proximal

796 B. A. Rikke, D. K. Johnson and T. E. Johnson
193.12 I
FIGURE 5.-Genetically anchored YAC framework map. The YAC library was the MIT library constructed by KUSAMI et al. (1993). Boxes indicate YACs positive for each SSLP marker. The length of each box corresponds to the number of positive markers and does not necessarily reflect YAC size. Each YAC name represents a plate, row, and column address. For example, YAC 30d10 corresponds to plate 30, row d, column 10. Addresses are based on screening a pooled library distributed by Research Genetics. Multiple addresses within a box indicate the marker was positive for two different YACs within the same plate, row, or column pool; therefore, the exact address could not be determined. The approximate locations of genes with respect to YACs were determined based on the deletion map of Figure 2. Gene names in bold indicate genes that have already been cloned. The parentheses around markers 12? and ?20 indicates their map order has not been resolved.
to Tyr based on the WI/MIT CGR map. Based on our deletion panel map, there is a similar asymmetry in distribution of SSLP markers, with 12 markers distal to Tyr and four markers proximal. This suggests the asymmetry of the complex may be physical as well as genetic. An asymmetric distribution of markers and ge- netic distances has previously been observed for the browndeletion complex and it was suggested that this is due to nonviability of hemizygotes that limits the extent of the complex (BELL et al. 1995).
To our knowledge, this study also represents the first attempt to characterize the recombinations flanking a mammalian deletion complex. Contrary to what one might expect (YOSHINO et al. 1995), the deletions did not appear to interfere with recombination. Instead, the differential chromosomal segments were signifi- cantly smaller than predicted based on classical genet- ics; however, these results probably need to be con- firmed using a higher resolution map. The EUCIB panel map, unfortunately, was not satisfactory for this purpose because the proximal end of the complex may be within an interspecific recombination hot spot, whereas the remainder of the complex appears to be within a recombination cold spot (discussed further be- low). Previous examples of chromosomal rearrange- ments that accelerate recombination have been ob- served in a number of species (HEWITT 1967; LUCCHESI 1976; h N A et al. 1980; PARKER et al. 1982; PARKER 1987), and accelerated rates have been observed in mice for chromosomal rearrangements such as translo- cations, inversions, and large heterochromatin inser- tions (AGULNIK et al. 1986; BORODIN et al. 1990; GORLOV and BORODIN 1995). It has been proposed that these rearrangements accelerate recombination because the
discontinuity of chromosome pairing in the rearranged region allows crossovers to occur independently on each side of the rearrangement (GORLOV and BORODIN 1995), whereas normally there is genetic interference that prevents double crossovers in regions smaller than -25 cM (KING et al. 1989; KWIATKOWSKI et al. 1993). Considering the availability of many different deletions of various sizes, the albino-deletion complex may be a particularly useful model system for further studies of mammalian recombination and genetic interference.
It is curious that zwsd had three different recombina- tions flanking its distal breakpoint when other deletions for which multiple mice were tested appeared to have only one. Because the deletions were maintained using multiple families, it is expected that some variation in recombination breakpoints would arise. However, the number of families used was small; therefore, much of the variation has apparently been lost. We are unaware of any systematic bias in the maintenance of c?yp,'d ex- plaining the retention of more variants; therefore, we assume that this was by chance.
In conjunction with developing the deletion map, we also were able to resolve the map order of all but two SSLP markers (D7Mitl23 and D7Mit320) between the tp bin and the Hbb bin. It can be seen by comparing C with A and B of Figure 3 that this is a significant improvement over the current WI/MIT CGR and MGD maps; on these maps only six loci out of the 20 or 21 markers are completely resolved (D7Mit262 was placed in this interval on the MGD map based on the WI/MIT CGR map before the most recent update.)
The panel of 27 deletions had better resolving power than the EUCIB panel of nearly 1000 mice, which theo- retically should have given an average resolution of 0.1

Albino-Deletion Complex 797
cM. The EUCIB panel, however, gave almost 50% fewer recombinants than expected in the D7Mit35OD7Mit?21 interval and thus was only able to resolve 11 loci out of 20 markers. The smaller number of recombinants using the EUCIB panel compared with the WI/MIT CGR and MGD maps (see also JOHNSON et al. 1989) suggests an interspecific recombination cold spot. Because of this, we have been using the WI/MIT CGR and MGD maps, rather than the EUCIB panel map, to define the genetic distances between the markers.
The results of this study also provide a genetically anchored YAC framework map covering the deletion complex, which represents a significant improvement in reagents to support positional cloning. The WI/MIT CGR has begun building a YAC framework map across the albino deletion complex region as part of an effort to develop a contig for each murine chromosome by screening a new YAC library with an average insert size of 820 kb (HALDI et al. 1996). Data is available via the WI/MIT CGR World Wide Web site. To date, the YAC map is less developed than the one presented in this article, but it does agree with the adjacent placement of markers D7Mit350 and D7Mit261, D7Mit32 and D7Mit352, D7Mit352 and D7Mit300, D7Mit300 and D7Mit301, D7Mitl71 and D7Mitl84, and D7Mitl84 and D 7Mit351.
A primary motivation for developing a microsatellite- based map of the albino-deletion complex is to support the positional cloning of genes. Therefore, an im- portant question is whether the SSLP markers are use- fully distributed. We found that most of the known genes in the region were closely associated with at least one SSLP marker. The Fah gene maps between the same endpoints as D7Mit62. Tyr maps between the same end- points as D7Mit31. jdf (not cloned) maps between the same endpoints as markers D7Mit123 and D7Mit320. fit1 and pid (both not cloned) map between the same endpoints as D7Mit?2 and D7Mitl48, respectively. It would seem, therefore, that the SSLP markers are in- deed usefully distributed.
Reliability: SSLP markers are particularly useful for positional cloning because they provide a high density of markers for accessing target regions. However, as marker density increases, the reliability of marker map order decreases due to fewer informative events (e.g., recombinations). In this study the resources used (dele- tion panel, backcross panel of nearly 1000 animals, and YAC library) represent three of the most powerful tools available for determining the map order of closely spaced markers. The other powerful tool is the radia- tion hybrid panel, which has been used extensively for mapping the human genome, but only recently has a wholegenome panel (164 radiation hybrids) been de- veloped for the mouse (SCHMITT et al. 1996).
The internal consistency of the mapping resources used in this study, as well as the consistency with previ- ous maps, suggests high reliability of our SSLP-based
deletion map. There were, however, a number of incon- sistencies in allele scores between our data and data already in the EUCIB database; there were also several discrepancies between the allele sizes we determined for certain markers compared with the WI/MIT CGR- determined allele sizes, and there were potential geno- typing difficulties due to the mixed backgrounds pres- ent in both the EUCIB panel and the deletion panel.
The most difficult issue to address was discrepancies in allele scores between our EUCIB panel data and data already in the EUCIB database. These discrepancies were either inferred from our data on flanking markers, or they were in direct conflict with our allele scores. As much as possible with the limited amount of DNA available to us, we tried to resolve these discrepancies by repeating PCRs or testing additional markers to make direct allele score comparisons. We found that many of the discrepancies were due to difficult calls in which the M. spretus band was weak (noted in Table 1) , or the B6 band was much weaker than expected relative to the M. spretus band, or the M. spretus and B6 stutter patterns overlapped. Many of the discrepancies were also impossible to resolve since they arose from incon- sistencies already within the database. For example, the allele scores in the database for mouse LS282 indicate D7Mit320 to be proximal to D7Mit350, whereas allele scores for mouse LS362 indicate D7Mit320 to be proxi- mal to D7Mit350. Some discrepancies within the data- base arise from samples (e.g., LB543) that we had ex- cluded because they did not give a reliable PCR product for most of the SSLP markers we tested.
A second issue is correct identification of the PCR band representing each allele. Comparing the allele sizes determined in this study (Table 1) with those de- termined by WI/MIT CGR, we found that about half of the allele sizes were significantly different for M. spetus. However, this was to be expected since the M. spretus strains we tested were not inbred, nor were they from the same M. spretus stock used by WI/MIT CGR. Comparing the B6 and C3H allele sizes with those deter- mined by WI/MIT CGR, we found that there was gener- ally very good agreement, almost always within two bases. Therefore, we consider two bases to be about the error range. There were three alleles that differed by three, four, and six bases (the B6 allele of D7mit321, the C3H allele of D7Mit351, and the B6 allele of D7MZT?l, respectively) that are probably explained by sizing dif- ferences as well. However, three markers had discrepan- cies that are probably not explained by sizing differ- ences. In our hands, D7Mit5 and D7Mit184 gave a more reliable and intense band eight bases above the band indicated by WI/MIT CGR as the allele size; and for D7Mitl71, our results consistently indicated a null C3H allele, whereas the WI/MIT CGRdetermined allele size is 84 bp. These results were obtained using different DNA samples and PCR reactions. Similar to our results, MATOUK et al. (1996) have found that -5% (6/123) of

798 B. A. Rikke, D. K. Johnson and T. E. Johnson
the Mit markers they used gave allele sizes different from the WI/MIT CGR-determined allele size. It is pos- sible that some discrepancies are due to segregation of alternate alleles.
Another potential difficulty was that the M. spretus parental strains of the EUCIB panel were only partially inbred. Therefore, when genotyping a large number of markers, there is a significant risk that at least one marker will detect an alternate M. spretus allele (i.e., not present in the M. spetus control DNA) that matches the B6 allele size. Consequently, an M. spfetus allele of low frequency might only be recognized based on incongruous data. This appeared to be the case with the D7Mit62 results.
Like the EUCIB panel, the M. spretus parental strain of the deletion panel also was not inbred and was segre- gating multiple alleles for most markers (Table 1). Fur- thermore, the deletion chromosomes were also segre- gating two to three different alleles for most markers (Table 1) due to their derivation from C3H or 101 and the noninbred St2A chinchilla strain. Therefore, a marker on the deletion chromosome could be misinter- preted as being absent when in fact the allele size hap- pened to match that of an M. spretus allele (e.g., D7Mit262). However, by genotyping parental control DNAs from C3H, 101, St2A (two controls), M. spretus (two controls), and all but two of the deletions ( c39sAs
) opposite an St2a chromosome, the one dis- cordancy we did obtain was easily resolved.
In conclusion, consistency with previous mapping re- sults, the recombinations flanking the deletions, the European Backcross panel, and the YAC framework map indicate the SSLP-based deletion map should be a useful and reliable resource to support positional cloning.
and 261)Vr
JACKIE GRAYSON assisted with genotyping the EUCIB panel. MARY
BEESON, JENNYCOSTELLO, and LENA GORDON provided excellent tech- nical support. This work was funded by National Institutes of Health (NIH) grants AA-00195, AA-03527, AA-08940, and the Denver Veter- ans Administration Research Center. B.A.R. was a NIH postdoctoral fellow (5.T32-AA07464).
LITERATURE CITED
AGULNIK, S. I., A. I. ACULNIK and A. 0. RUVINSKY, 1986 Recombina- tion distances between the loci in the proximal part of the chro-
RB(8,17)1IEM, Rb(16,17)7Bnr, and T(16,17)43H. Mouse News mosome 17 in females heterozygous for translocations
Lett. 75: 34-35. ARANA, P., L. SANTOS and R. GIRALDEZ, 1980 Chiasma interference
and centromere co- orientation in a spontaneous translocation heterozygote of Euchwthippus puluinatus gallicus (Acrididae; Or- thoptera). Chromosoma 78: 327-340.
BELL, J. A,, E. M. RINCHIK, S. RAYMOND, R. SUFFOLK and I. J. JACKSON, 1995 A high- resolution map of the brown (b, Tyrpl) deletion complex of mouse chromosome 4. Mamm. Genome 6 389-395.
BORODIN, P. M., I. P. GORLOV and T. Y. MYGINA, 1990 Double in- sertion of homogeneously staining regions in chromosome 1 of wild Mus musculus musculus: effects on chromosome pairing and recombination. Heredity 81: 91-95.
BREEN, M., L. DEAKIN, B. MACDONALD, S. MILLER, R. SIBSON et al., 1994 Towards high resolution maps of the mouse and human
genomes-a faciliity for ordering markers to 0.1 cM resolution. Hum. Mol. Genet. 3: 621-627.
BRILI.UNT, M. H., R. W. WILLIAMS, B. C. HOLDENER and J. M. ANGEL, 1996 Mouse chromosome 7. Mamm. Genome 6: S135S150.
COPELAND, N. G., D. J. GILBERT, N. A. JENKINS, J. H. NADEAU, J. T. EPPIG et al., 1993 Genome maps N . Science 262: 67-82.
DIETRICH, W. F., J. C. MILLER, R. G. STEEN, M. MERCHANT, D. DAMRON et al., 1994 A genetic map of the mouse with 4,006 simple se- quence length polymorphisms. Nature Genet. 7: 220-225.
DIETRICH, W. F., J. MILLER, R. STEEN, M. A. MERCHANT, D. DAMRON- BOLES et al., 1996 A comprehensive genetic map of the mouse genome. Nature 380: 149-152.
GI.UECK~OHN-WAEI.SCH, S., M. B. SCHIFFMAN, J. THORNDIKE and C. F. CORI, 1974 Complementation studies of lethal alleles in the mouse causing deficiencies of glucose-6-phosphatase, tyrosine aminotransferase and serine dehydratase. Proc. Natl. Acad. Sci. USA 71: 825-829.
GORLOV, I. P., and P. M. BORODIN, 1995 Recombination in single and double heterozygotes for two partially overlapping inversions in chromosome 1 of the house mouse. Heredity 75: 113-125.
GREEN, E. D., and P. GREEN, 1991 Sequence-tagged site (STS) con- tent mapping of human chromosomes: theoretical considera- tions and early experiences. PCR Methods Appl. 1: 77-90.
HA1.DI, M. L., C. STRICKLAND, P. LIM, V. VANBERKEL, X.-N. CHEN et al., 1996 A comprehensive large-insert yeast artificial chromosome library for physical mapping of the mouse genome. Mamm. Ge- nome 7: 767-769.
HEWITT, G. M., 1967 An interchange which raises chiasma fre- quency. Chromosoma 21: 285-295.
HOLDENER-KENNY, B., S. K. SHARAN and T. MAGNUSON, 1992 Mouse albino-deletion complex: from genetics to genes in development. Bioessays 1 4 831-839.
HOLDENER, B. C., J. W. THOMAS,A. SCHUMACKER, M. D. POTTER, E. M. RINCHIK et al., 1995 Physical localization of eed a region of mouse chromosome 7 required for gastrulation. Genomics 27: 44'7-456.
JOHNSON, D. R, E. H. RUSSELL, JR. and E. M. RINCHIK, 1989 Molecu- lar mapping within the mouse albinodeletion complex. Proc. Natl. Acad. Sci. USA 86: 8862-8866.
KELSEY, G., A. SCHEDL, S. RUPPERT, L. NISWANDER, T. MAGNUSON et al., 1992 Physical mapping of the albinc-deletion complex in the mouse to localize alf/hsdr-l, a locus required for neonatal survival. Genomics 14: 275-287.
KING, T. R., W. F. DOVE, B. HERRMANN, A. R. MOSER and A. SHEDI.OV- Shy, 1989 Mapping to molecular resolution in the T to H-2 region of the mouse genome with a nested set of meiotic recom- binants. Proc. Natl. Acad. Sci. USA 86: 222-226.
KLEBIG, M. L., B. S. KWON and E. M. RINCHIK, 1992 Physical analysis of murine albino deletions that disrupt liver-specific gene regula- tion or mesoderm development. Mamm. Genome 2: 51-63.
KUSAMI, R, J. S. SMITH, J. A. SEGRE, D. S. KOOS and E. S. LANDER, 1993 Construction of a large-insert yeast artificial chromosome library of the mouse genome. Mamm. Genome 4: 391-392.
KWIATKOWSKI, D. J., C . DIB, S. A. SIAUGENHAUPT, S. P o w , J. F. Gu- SELLA et al., 1993 An index marker map of chromosome 9 pro- vides strong evidence for positive interference. Am. J. Hum. Genet. 53: 1279-1288.
LUCCHESI, J. C., 1976 Interchromosomal effects, pp. 313-315 in The Genetics and Biology of Drosophila, Vol. 1, edited by M. ASHBURNER and E. NOVITSKI. Academic Press, London.
MARKEI., P. D., and R. P. CORIXY, 1994 A multivariate analysis of repeated measures: linkage of the albinism gene (Tyr) to a QTL influencing ethanol-induced anesthesia in laboratory mice. Pyschiatr. Genet. 4 205-210.
MARKEL, P. D., B. BENNETT, M. A. BEESON, L. GORDON, V.J. SIMPSON et al., 1996 Strain distribution patterns for genetic markers in the LSXSS recombinant-inbred series. Mamm. Genome 7: 408- 412.
MATOUK, C., D. GOSSELIN, D. MALO, E. SKAMENE and D. RADZIOCH, 1996 PCR-analyzed microsatellites for the inbred strain 129/ Sv, the strain most commonly used in gene knockout technology. Mamm. Genome 7: 603-605.
NISWANDER, L., D. YEE, E. M. RINCHIK, I,. B. RUSSELL and T. MAGNU- SON, 1988 The albindeletion complex and early postimplan- tation survival in the mouse. Development 102: 45-53.
NISWANDER, L., D. YEE, E. M. RINCHIK, L. B. R~JSSELI. and T. MAGNU-

Albino-Deletion Complex 799
SON, 1989 The albino-deletion complex in the mouse defines genes necessary for development of embryonic and extraembry- onic ectoderm. Development 105 175-182.
NISWANDER, L., G. KELSEY, A. SCHEDL, S. RUPPERT, S. K. SHARAN et al., 1991 Molecular mapping of albino deletions associated with early embryonic lethality in the mouse. Genomics 9: 162-169.
PARKER, J. S., R. W. PAMER, M. A. F. WHITEHORN and L. A. EDGAR, 1982 Chiasma frequency effects of structural chromosome change. Chromosoma 8 5 673-686.
PARKER, J. S., 1987 Increased chiasma frequency as a result of chro- mosome rearrangement. Heredity 58: 87-94.
POTTER, M. D., and E. M. RINCHIK, 1993 Deletion mapping of the chocolate (cht) locus within the Fes-Hbb region of mouse chromo- some 7. Mamm. Genome 4 46-48.
POTTER, M. D., M. L. KLEBIG, D. A. CARPENTER and E. M. RINCHIK, 1995 Genetic and physical mapping of the fitness 1 y i t l ) locus within the Fes-Hbb region of mouse chromosome 7. Mamm. Ge- nome 6: 70-75.
RIKKE, B. A,, B. BENNETT, P. D. MARKEL, V. J. SIMPSON, D. K. JOHNSON et al., 1995 Identification of a QTL for ethanol and general anesthetic sensitivity near the albino locus. Alcohol. Clin. Exp. Res. 19: 47A.
RINCHIK, E. M., and L. B. RUSSELL, 1990 Germ-line deletion muta- tions in the mouse: tools for intensive functional and physical mapping of regions of the mammalian genome. Genome Anal.
RINCHIK, E. M., R. MACHANOFF, C. C. CUMMINGS and D. K. JOHNSON, 1989 Molecular cloning and mapping of the ecotropic leuke- mia provirus Emu-23 provides molecular access to the albino- deletion complex in mouse chromosome 7. Genomics 4: 251- 258.
RINCHIK, E. M., R. R. TONJES,D. PAuLandM. D. POTTER, 1993 Molec- ular analysis of radiation-induced albino (c)-locus mutations that cause death at preimplantation stages of development. Genetics 135: 1107-1116.
RUPPERT, S., G. MULLER, B. KWON and G. SCHUTZ, 1988 Multiple transcripts of the mouse tyrosinase gene are generated by alter- nate splicing. EMBO J. 7: 2715-2722.
RUPPERT, S., G. KELSEY, A. SCHEDL, E. SCHMID, E. THIES et al., 1992
1: 121-158.
Deficiency of an enzyme of tyrosine metabolism underlies altered gene expression in newborn liver of lethal albino mice. Genes Dev. 6: 1430-1443.
RUSSELL, L. B., 1989 Functional and structural analyses of mouse genomic regions screened by the morphological specific-locus test. Mutat. Res. 212: 23-32.
RUSSELL, L. B., W. L. RUSSEJL and E. M. KELLY, 1979 Analysis of the albino-locus region of the mouse. I. origin and viability. Genetics 91: 127-139.
RUSSELL, L. B., C. S. MONTGOMERY and G. D. RAYMER, 1982 Analysis of the albino-locus region of the mouse: IV. Characterization of 34 deficiencies. Genetics 100: 427453.
RUSSELL, W. L., 1951 X-ray induced mutations in mice. Cold Spring Harbor Symp. Quant. Biol. 16: 327-336.
SCHEDL, A,, S. RUPPERT, G. KELSEY, E. THIES, L. NISWANDER et al., 1992 Chromosome jumping from flanking markers defines the minimal region for alf/hsdr-l within the albinodeletion com- plex. Genomics 1 4 288-297.
SCHMITT, K., J. W. FOSTER, R. W. FEAKES, C. KNIGHTS, M. E. DAVIS et al., 1996 Construction of a Mouse Whole-Genome Radiation Hybrid Panel and Application to MMU11. Genomics 3 4 193- 197.
SCHUMACHER, A,, C. FAUST and T. MAGNUSON, 1996 Positional clon- ing of a global regulator of anterior-posterior patterning in mice. Nature 383: 250-253.
SHARAN, S. R, B. HOLDENER-KENNY, S. RUPPERT, A. SCHEDL, G. KELSEY et al., 1991 The albino-deletion complex of the mouse: molecu- lar mapping of deletion breakpoints that define regions neces- sary for development of the embryonic and extraembryonic ecto- derm. Genetics 129: 825-832.
SILVER, L. M., 1995 Mouse Genetics, Concepts, and Applications. Oxford University Press.
SIMPSON, V. J., B. A. RIKKE, J. N. COSTELLO, R. CORLEY and T. E. JOHN- SON, 1997 Identification of a locus specifylng sensitivity to pro- pofol in mice. Anesthesiology (in press).
YOSHINO, M., T. SAGAI, K. F. LINDAHL, Y. TOYODA, K. Mowm et al., 1995 Alleledependent recombination frequency: homology re- quirement in meiotic recombination at the hot spot in the mouse major histocompatability complex. Genomics 27: 298-305.
Communicating editor: R. E. GANSCHOW