muriithi wangeci scolastica
TRANSCRIPT

i
1
TO FIND OUT FACTORS THAT CONTRIBUTE TO LOW
ENROLMENT IN YOUTH POLYTECHNICS IN NYERI ZONE
IN NYERI SOUTH DISTRICT.
BY
MURIITHI WANGECI SCOLASTICA
A RESEARCH PROPORSAL SUBMITTED IN PARTIAL FULFILMENT OF THE
REQUIREMENT FOR THE AWARD OF MASTER OF EDUCATION DEGREE
IN EDUCATIONAL FOUNDATIONS IN THE UNIVERSITY OF NAIROBI.
2013

ii
DECLARATION
This is my original work and has not been presented for a degree in any other university.
__________________________
MURIITHI SCOLASTICA WANGECI
E56/62605/2011
This research project has been presented for examination with my approval as the university
supervisor.
________________________
CALEB MACKATIANI
Lecturer
Department of Education Foundations
University of Nairobi

iii
DEDICATION
This report is dedicated to my beloved husband, George Muriithi Matiru, my dear children Julius
Matiru and wife Eva, Suzan Watetu and husband Wahome, and Nelson Muya, whose
encouragement, patience, technical and financial support are invaluable, and finally to my grand
daughter, Samara Wangeci Matiru, whose birth has brought us joy we never knew.
I also feel compelled to dedicate it to my long gone dad, Moses Muya Kabucho, and my late
mum, Peris Wanjiku, (who died this June as I worked on this project), for teaching me, among
many things, the value of hard work. The encouragement l used to get from my beloved mother-
in- law, the late Elisheba Watetu Matiru, is also invaluable. May their souls rest in eternal peace.

iv
ACKNOWLEDGEMENTS
First and foremost is to give honour and glory to God Almighty for giving me all that it has
taken to start and complete this research project; life, health, sense of purpose and finance,
among others.
I am grateful to my supervisor, Caleb Mackatiani, for his invaluable assistance and patience as
he shared his expertise and knowledge with me during this research project.
I highly appreciate the co operation accorded me by those I approached for information in
offices and the institutions I visited.
I feel highly indebted to my family for their prayers, love and encouragement, and more so to
Michael Githaiga Muya, his wife Winnie, and their children Phi and Nelson, whose home had
been my second home all through my study.
Finally, I thank my colleagues and friends for their encouragement and support throughout the
course. Special thanks go to Ann Muthoni Maina (and her family), for being not only a friend,
but also a wonderful companion throughout the course.

v
TABLE OF CONTENT
Content Page
Title page…………………………………………………………………………………..……....i
Declaration……………………………………………………...…………………………..……..ii
Dedication……………………………………………………...………………………………....iii
Acknowledgement……………………………………………………………………..............…iv
Table of content……………………………………………………...…………………............…v
List of Tables……………………………………………………………………………...........…ix
List of Figures………………………………………………………………………..…..………...x
Abstract …………………………………………………………………………………………..xi
List of Acronyms and Abbreviations ……………………………...………………………….... xii
CHAPTER ONE: Introduction
1.0 Introduction ……………………………………………………………………………...……..1
1.1 Background information of the study ……………………………………….………….……… 1
1.2 Statement of the problem………………………………….................................................…..… 5
1.3 Purpose of the study………………………………………………………………..…….…...… 6
1.4 Research Objectives …………………………………………………………..…..……..…....… 6
1.5 Research questions……………………………………………..………………..……...…….… 6
1.6 Significance of the study………………………………………………………..………….....… 7
1.7 Limitations …………… …………………………………………………………….…….…… 7
1.8 Delimitations………………………………………..…………………………….……….……. 7
1.9 Basic Assumptions……………..……………………………………………..……………….... 8
1.10 Definition of Operational Terms……………………………………………………….………... 8
1.11 Organization of the Study……………………………………………………………….……… 9
vi
CHAPTER TWO: LITERATURE REVIEW
2.0 Introduction………………………………………………………………………....………..…10
2.1 Policies for Youth Training …………………………………..………………..……….......….. 10
2.2 Attitudes of Youth towards Youth Developments …………………..…….....…………….…..16
2.3 Awareness of Courses Offered in Youth Polytechnics ………………...…………………….. 19
2.4 Co-Curricular Activities in Youth Polytechnics ………………………………...………….…. 19
2.5 Financing Youth Polytechnics……………………………….………………………..........….. 20
2.6 Theoretical Framework …………………………………………………………………..…..... 22
2.7 Conceptual Framework ………………………………………………………………….......… 23
CHAPTER THREE: METHODOLOGY
3.0 Introduction…………………………………………………………………………………..… 24
3.1 Research design…………………..………………………………………………………….… 24
3.2 Target population………………………………………………………………….………….….24
3.3 Sample Size and Sampling Procedure ……………………………………………..……........…25
3.4 Research instruments………………………………………………………………..………..… 25
3.5 Piloting ………………………………………………………………………………....…..…. 26
3.5.1 Validity of Instrument ………………………………………………………………...……….. 26
3.5.2 Reliability of the Instrument. ………………………………………………………..….......…. 27
3.6 Data Collection Procedure……………………………………………………………………… 27
3.7 Data Analysis Techniques…………………………………………….…………………..……. 28

vii
CHAPTER FOUR: DATA PRESENTATION, ANALYSIS AND DISCUSSION
4.0 Introduction…………………………………………………………………………….…….…29
4.0.1 Response Rate …………………..……………………………………………….….…..….…. 29
4.1 Effect of Youth Training Policies on Enrolment in Youth Polytechnics……………………….30
4.1.1 Clarity and Consistency of Policy Framework…………………………………..………….…..30
4.1.2 Government Support………………………………………………………………………….…31
4.1.3 Entry Requirements………………………………………………………………….….…….... 32
4.1.4 Consistency of the Policy Guideline…………………………………………………………… 33
4.2 Effect of Attitude towards Youth Polytechnics on Enrolment in Youth Polytechnics…............34
4.3 Effect of Awareness of Courses Offered on Enrolment in Youth Polytechnics………………..37
4.3.1 Level of Awareness in the Community………………………………………....................37
4.3.2 Frequency of Receiving Inquiries………………………………………………………..…..…. 38
4.3.3 Modes of Awareness Creation Used………………………………………………..….…….….39
4.3.4 Effect of Awareness of Courses Offered on Enrolment………………………………….….….40
4.4 Effect of Co-curricular Activities on Enrolment in Youth Polytechnics……………...……..…..42
4.4.1 Co-curricular Activities in the YPs………………………………………………………………42
4.4.2 Factors Influencing Introduction of Co-curricular Activities in YPS……………………….….. 45
4.4.3 Effect of Co-Curricular Activities on Enrolment in the YPs……………………….………....…45
4.5 Effect of Levies Charged on Enrolment in Youth Polytechnics………………….…….……..... 46
CHAPTER FIVE: SUMMARY OF MAJOR FINDINGS, CONCLUSION AND
RECOMMENDATIONS
5.1 Introduction ………………………………………………………………………………..…….49

viii
5.2 Summary of the Major Findings……………………………………………..………….….……49
5.3 Conclusion…………………………………………………………………………………..……52
5.4 Recommendations………………………………………………………………………..…....…53
5.5 Recommendation for Further Study……………………………………………………..…...….54
REFERENCE………………………………………………………………………………….….....…55
APPENDICES
Appendix I: Letter of Introduction…………………………………………………………………....62
Appendix II: Work Schedule…………………………………………………..………………..…...... 63
Appendix III: Research Expenditure Budget……………………………………….…………..…...…. 64
Appendix IV: Questionnaire for a Youth in Class………………………………………………………65
Appendix V: Questionnaire for a Youth Dropout………………………………..…………….……….68
Appendix VI: Questionnaire for YP Managers…………………………………………….……………70
Appendix VII: Questionnaire for Teachers………………………………………...…..……………...76
Appendix VIII: Questionnaire for Area Administrators………………………………….…...…………81
Appendix IX: Observation Checklist……………………………………………………………………84
ix
LIST OF TABLES
Table 1 Enrolment in the 5 youth polytechnics under study
Table 4.1 Respondents who gave their Responses
Table 4.2 Clarity of the Policy Guideline
Table 4.3 Consistency of the Policy Guidelines
Table 4.4 Reasons for Dropping out of YP’s
Table 4.5 Awareness of Courses Offered
Table 4.6 Frequency of Receiving Inquiries on Courses Offered in the YP’s
Table 4.7 Modes of Awareness Creation
Table 4.8 Extent of Awareness of Courses Offered on Enrolment
Table 4.9 Co-Curricular Activities Engaged In
Table 4.10 Hindrances to Introduction of More Co-Curricular Activities in YP’s
Table 4.11 Effect of Co-Curricular Activities on Enrolment
Table 4.12 Dropout Rates Occasioned by Inability to Raise Levies Charged
Table 4.13 Effects of Levies Charged on Enrolment

x
LIST OF FIGURES
Figure 4.1 Extent of Government’s Support to YP’s
Figure 4.2 Prevalence of Youths Locked Out Due to Entry Requirements
Figure 4.3 Frequency of Participation of Assistant Chiefs in YP Activities

xi
ABSTRACT
This study is aimed at establishing the factors that contribute to low enrolment in youth
polytechnics in Nyeri Zone of Nyeri South District in Nyeri County. The study was guided by
the following objectives: a) to explore the extent to which the policies set for youth training
affect enrolment, b) to determine the extent to which attitude towards youth polytechnics affect
enrolment, c) to establish the extent to which the level of awareness of courses offered
influences enrolment, d) to investigate the extent to which co-curricular activities in polytechnics
affect enrolment and e) to establish the extent to which levies paid by students in youth
polytechnics affect enrolment.
The study used descriptive survey design. The target population was managers, teachers and
students of the 16 youth polytechnics in Nyeri Zone, out of school youth and administrators.
Questionnaires were used to obtain important information about the population. The researcher
used both qualitative and quantitative techniques to analyze the data with the help of Statistical
Package for Social Sciences (SPSS).
The study found out that the policy guidelines governing the running of YPs are not clear and are
also inconsistent. It was however noted that the policy guidelines on entry are favourable to a
wide cross section of youths which increases the accessibility of youth to the institutions. This in
turn encourages enrolment. On the effect of attitude on enrolment, it was found that the majority
of youth who drop out of YPs do so because they develop negative attitude towards the training.
Further results showed that area assistant chiefs rarely participate in YPs implying that their
attitude towards YPs is negative. This adversely affects enrolment as they are opinion shapers in

xii
their locations. On the effect of awareness of courses offered in YPs it was found that the level
is very low. This was evident in the fact that the majority of the respondents learn about the
courses offered through friends. On the effect of co-curricular activities on enrolment, it was
found that the only activity mostly found was football and that the matches are mostly organized
at institutional level. This was attributed to lack of funds and facilities. Finally, on the effect of
levies charged, it was established that about half of the dropouts do so for they cannot raise the
fees expected. This contradicted sharply with the government subsidies of Kshs 15,000 per
student. This indicates that the government should put in more support to reduce the levies the
students are charged.
Based on the findings, the researcher recommended that the government should streamline the
policies that govern the running of YPs and give more financial supports to reduce levies
students are charged. It should also sensitize the youth and public on the importance of
vocational training through its relevant agencies. This should change the attitude of the society
towards youth polytechnics. The YPs and other stakeholders should publicize the courses offered
to improve awareness. They should also introduce more co-curricular activities to attract more
youth to join the institutions.
xiii
LIST OF ACRONYMS AND ABBREVIATIONS
AIDS Acquired Immune Deficiency Syndrome
AU African Union
DFID Department for International Development.
DYTO District Youth Training Officer
EFA Education for All
MOYAS Ministry of Youth and Sports
NCCK National Christian Churches of Kenya
NGOs Non-Governmental Organization
NIC Newly industrialised Countries.
NIVTCS National Industrial, Vocational, Training Centres.
TIVET Technical, Industrial, Vocational and Entrepreneurial Training.
TVET Technical, Vocational Education and Training.
TVSD Technical and Vocational Skills Development
UNDP United Nations Development Programme
UNESCO United Nations Educational, Scientific and Cultural Organization
UNEVOC The international Project on technical and vocational education. (A UN
Agency)
VET Vocational Education and Training.

xiv
SSA Sub-Saharan Africa
YPs Youth Polytechnics

1
CHAPTER ONE
INTRODUCTION
1.1 Background information of the study
Technical, Vocational and Entrepreneurship Training (TVET) is a comprehensive term referring to
the education process which involves, apart from general education, the study of technology and
related sciences, and the acquisition of practice, skills and knowledge relating to an occupation in
various sectors of economic and social life.
A UNESCO report, (1984) says that in present study, the concept of vocational education implies
the preparation of an individual for career or an occupation. This involves both liberal and
technical aspects of education. The liberal aspect includes the philosophical, moral and cultural
elements that an individual must posses to fit in a given society. Technical aspect includes the
knowledge and skills required to perform a job successfully.
According to an editorial of the United Nations Educational, Scientific and Cultural Organisation
(UNESCO) – The international project on Technical and Vocational Education -a UN agency-
(UNEVOC) & UNESCO – UIS (2006), a particularly important area of work and employment
consists of those occupations which centre on the application of technical and vocational skills to
the world of work. The paper says that it is estimated that world-wide some 80% of all occupations
are of this type.
A survey by Adana, (1986), revealed that education in Africa has not adequately helped to open the
youth to himself so that he becomes knowledgeable about himself, his interests, capacities, values,
attitudes and the world around him. Education he stresses should be planned adequately to help
youths understand their strengths and limitations by assessing themselves objectively so as to
exercise intelligently their freedom of choice in both vocational and leisure activities.

2
The field of technical and vocational education has changed throughout history, usually in response
to the society it serves. TVET is therefore fundamental in the field of work, be it private or public.
Lasonen and Burge (1991) believe that one major issue relating to the world of work is the changes
that should be done in school curriculum at all levels so that it produces young people who are work
oriented. This can be solved more effectively by TVET institutions as they ought to be the stepping
out institutions for most youth other than universities.
TVET in Kenya started in mid 60s when the National Council of Churches of Kenya initiated
Village Polytechnics which later transformed to Youth Polytechnics. According to Fatuma and
Sifuna (1966) there were four village polytechnics to start with.
The aim was to equip primary school leavers with skills for self-employment and wage-
employment (Mbuthia et al, 2005). This was in response to primary school leavers who found it
increasingly difficult to find employment in the modern-wage economy(Court and Dharam,
1974).They were also supposed to provide cheap labour in carpentry, masonry, mechanics,
electronics and tailoring (Orodho,1984).
Unemployment was also noticed among secondary school leavers in 1968.The problem of youth
unemployment did not lie much in the number of school leavers joining the job market but much
more on the whole philosophy of education which prepared pupils for non-rural employment in the
context of an economy that failed to generate enough opportunities of this sort (Orodho, 1984). The
education did not equip the school leavers with the kind of life they were inevitably living, but it
added to social and economic problems by inculcating inappropriate attitudes and values by raising
false expectations.
The Central Bureau of Statistics Survey, 1999, revealed that participation rate for young people
aged 15-24 in employment in Kenya was very low. One of causes of this low participation was
ineffective education and training system that does not equip students with entrepreneurial skills for
self-employment and industrial employment. The youth polytechnics were intended to provide
training linked to production in order to produce a cadre of trained artisans (Mbuthia et al 2005).

3
According to Eshiwani (1993), the original concept of polytechnics was not formal technical
training but a flexible training programme in the villages. This changed completely with
government involvement in 1972. The strategy was how to ensure that school leavers access
entrepreneurial and business skills alongside the technical skills to enable them engage in income
generating activities and improve the standards of living in communities (ibid). Middleton, 1993,
asserted that training, of this kind can be effective and efficient if the objective is feasible and in a
favourable socio-economic environment.
With the advent of 8-4-4 education system entrepreneurship curriculum was placed first in the
technical entrepreneurial and business skills development in Youth Polytechnics, (Republic of
Kenya report, 1984). Entrepreneurship is used to mean the process of creating something new with
the value of devoting the necessary time and effort, assuming the accompanying, financial, psychic
and social risks and receiving the resulting rewards of monetary and personal satisfaction and
independence (Hirsch et al, 2007).
Murage et al, (2007) observed that the rate of unemployment of youths aged between 15 and 30
years was estimated to be 67%, 90% of whom not only unemployed, but are also lacking in
entrepreneurial skills that would assist them in engaging in meaningful employment. This called for
the enhancement of technical training and education in youth polytechnics.
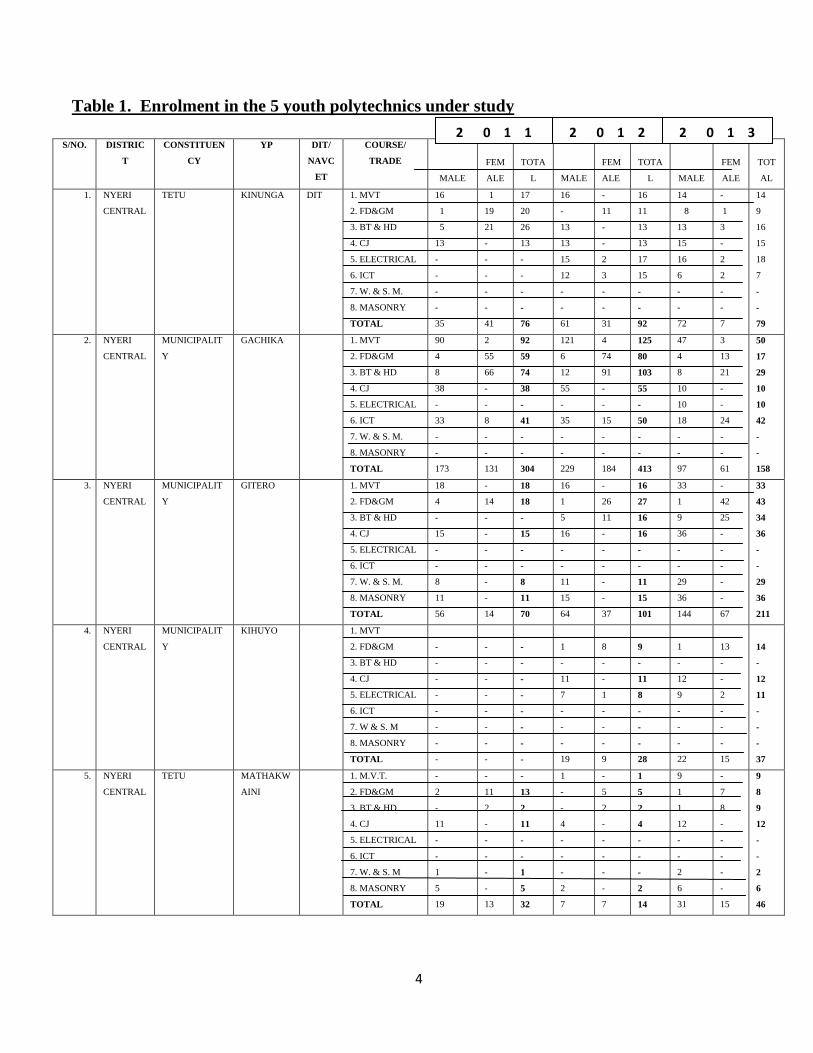
The government of Kenya is putting emphasis on TVET education by providing the tools and
equipment necessary, and also paying a subsidy of Ksh 15 000 for each student in the polytechnic
every year. However, enrolment remains low as is proven by the table below.
4
Table 1. Enrolment in the 5 youth polytechnics under study
S/NO. DISTRIC
T
CONSTITUEN
CY
YP DIT/
NAVC
ET
COURSE/
TRADE
MALE
FEM
ALE
TOTA
L
MALE
FEM
ALE
TOTA
L MALE
FEM
ALE
TOT
AL
1. NYERI
CENTRAL
TETU KINUNGA DIT 1. MVT
2. FD&GM
3. BT & HD
4. CJ
5. ELECTRICAL
6. ICT
7. W. & S. M.
8. MASONRY
TOTAL
16
1
5
13
-
-
-
-
35
1
19
21
-
-
-
-
-
41
17
20
26
13
-
-
-
-
76
16
-
13
13
15
12
-
-
61
-
11
-
-
2
3
-
-
31
16
11
13
13
17
15
-
-
92
14
8
13
15
16
6
-
-
72
-
1
3
-
2
2
-
-
7
14
9
16
15
18
7
-
-
79
2. NYERI
CENTRAL
MUNICIPALIT
Y
GACHIKA 1. MVT
2. FD&GM
3. BT & HD
4. CJ
5. ELECTRICAL
6. ICT
7. W. & S. M.
8. MASONRY
TOTAL
90
4
8
38
-
33
-
-
173
2
55
66
-
-
8
-
-
131
92
59
74
38
-
41
-
-
304
121
6
12
55
-
35
-
-
229
4
74
91
-
-
15
-
-
184
125
80
103
55
-
50
-
-
413
47
4
8
10
10
18
-
-
97
3
13
21
-
-
24
-
-
61
50
17
29
10
10
42
-
-
158
3. NYERI
CENTRAL
MUNICIPALIT
Y
GITERO 1. MVT
2. FD&GM
3. BT & HD
4. CJ
5. ELECTRICAL
6. ICT
7. W. & S. M.
8. MASONRY
TOTAL
18
4
-
15
-
-
8
11
56
-
14
-
-
-
-
-
-
14
18
18
-
15
-
-
8
11
70
16
1
5
16
-
-
11
15
64
-
26
11
-
-
-
-
-
37
16
27
16
16
-
-
11
15
101
33
1
9
36
-
-
29
36
144
-
42
25
-
-
-
-
-
67
33
43
34
36
-
-
29
36
211
4. NYERI
CENTRAL
MUNICIPALIT
Y
KIHUYO 1. MVT
2. FD&GM
3. BT & HD
4. CJ
5. ELECTRICAL
6. ICT
7. W & S. M
8. MASONRY
TOTAL
-
-
-
-
-
-
-
-
-
-
-
-
-
-
-
-
-
-
-
-
-
-
-
-
1
-
11
7
-
-
-
19
8
-
-
1
-
-
-
9
9
-
11
8
-
-
-
28
1
-
12
9
-
-
-
22
13
-
-
2
-
-
-
15
14
-
12
11
-
-
-
37
5. NYERI
CENTRAL
TETU MATHAKW
AINI
1. M.V.T.
2. FD&GM
3. BT & HD
4. CJ
5. ELECTRICAL
6. ICT
7. W. & S. M
8. MASONRY
TOTAL
-
2
-
11
-
-
1
5
19
-
11
2
-
-
-
-
-
13
-
13
2
11
-
-
1
5
32
1
-
-
4
-
-
-
2
7
-
5
2
-
-
-
-
-
7
1
5
2
4
-
-
-
2
14
9
1
1
12
-
-
2
6
31
-
7
8
-
-
-
-
-
15
9
8
9
12
-
-
2
6
46
2 0 1 2 2 0 1 1 2 0 1 3
5
KEY
MVT............... MOTOR VEHICLE TECHNOLOGY
FD & GM........ FASHION DESIGN AND GARMENT MANAGEMENT
BT & HD......... BEAUTY AND HAIRDRESSING
CJ................... CARPENTRY AND JOINERY
ICT................. INFORMATION AND COMPUTER TECHNOLOGY
W & S M....... WELDING AND SHEET METAL
DIT................ DIRECTORATE OF INDUSTRIAL TRAINING
NAVCET......... NATIONAL VOCATIONAL CERTIFICATE IN ENTREPRENEURSHIP TRAINING.
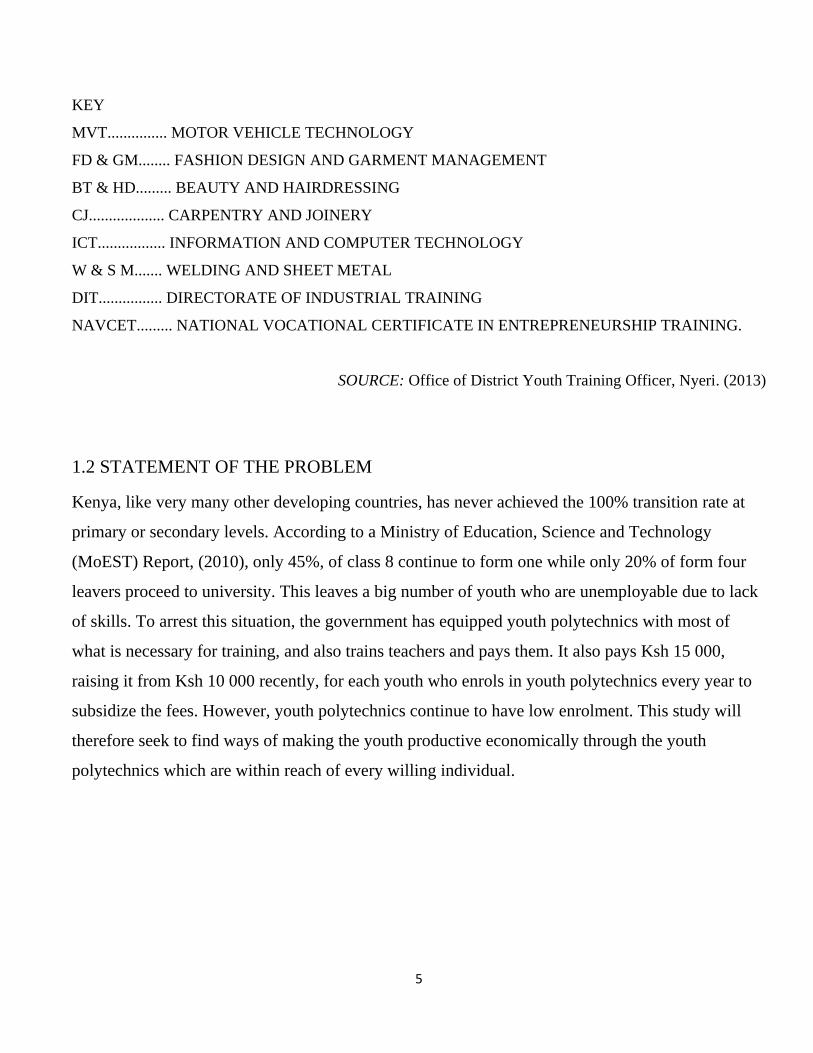
SOURCE: Office of District Youth Training Officer, Nyeri. (2013)
1.2 STATEMENT OF THE PROBLEM
Kenya, like very many other developing countries, has never achieved the 100% transition rate at
primary or secondary levels. According to a Ministry of Education, Science and Technology
(MoEST) Report, (2010), only 45%, of class 8 continue to form one while only 20% of form four
leavers proceed to university. This leaves a big number of youth who are unemployable due to lack
of skills. To arrest this situation, the government has equipped youth polytechnics with most of
what is necessary for training, and also trains teachers and pays them. It also pays Ksh 15 000,
raising it from Ksh 10 000 recently, for each youth who enrols in youth polytechnics every year to
subsidize the fees. However, youth polytechnics continue to have low enrolment. This study will
therefore seek to find ways of making the youth productive economically through the youth
polytechnics which are within reach of every willing individual.

6
1.3 PURPOSE OF STUDY
The purpose of the study is to investigate the factors for the low enrolment in youth
polytechnics in Nyeri South District. The findings will make it possible to suggest
solutions to low enrolment in youth polytechnics.
1.4 RESEARCH OBJECTIVES
i) To explore the extent to which the policies set for youth training affect enrolment.
ii) To determine the extent to which attitude towards youth polytechnics affect enrolment.
iii) To establish the extent to which the level of awareness of the courses offered in
polytechnics influence enrolment.
iv) To investigate the extent to which co-curricular activities in polytechnics affect
enrolment.
v) To establish the extent to which the levies paid by students in youth polytechnics
affect enrolment.
1.5 RESEARCH QUESTIONS
i) To what extent do the policies set for youth training affect enrolment?
ii) To what extent does the attitude towards youth polytechnics affect enrolment?
iii) To what extent does the level of awareness of the courses offered in polytechnics
affect enrolment?
iv) How do the co-curricular activities that take place in polytechnics influence
enrolment?
v) What is effect of the levies paid by students in youth polytechnics on enrolment?

7
1.6 SIGNIFICANCE OF THE STUDY
This study is significant to youth polytechnic policymakers as the policies they make will
be used by the managers in their effort to make the institution popular to potential
trainees. It is expected to yield findings which will bridge the gap between the ever-
increasing number of idle youths and the government’s effort to train them in preparation
for the real responsibilities which include career changes and alternating periods of
unemployment. This should improve their individual economic status and finally the
country’s general economic development.
1.7 LIMITATIONS
According to Kerlinger (1993), limitations refer to the constraints that the researcher has
no control over. The major limitation for the study was that a direct control of
independent variables such as courses offered, attitude towards youth polytechnics
among others, by the researcher was not possible. The dependent variable, enrolment,
could not be manipulated, as it was already set when the study ensued. Other factors like
attitude and level of awareness had already occurred and so could also be manipulated.
1.8 DELIMITATIONS
A single study cannot cover all the aspects of any subject area. Delimitation is the act of
restricting a study to a certain geographical area or subject (Kombo, 2006). This study
was therefore carried out in Nyeri zone, in Nyeri District. The study cannot be
generalised to address other factors inhibiting the youth involvement in manual labour in
their homes or the most recent effort by the government to engage them responsibly,
“Kazi Kwa Vijana”, which literally ended up better duped ”Kazi Kwa kina Mama.”
This would require another research.
8
1.9 BASIC ASSUMPTIONS
The study assumes that there are negative factors that influence the enrolment in youth
polytechnics, the respondents will be able to understand the questionnaires, the target
population will give genuine responses, the managers of the youth polytechnics will co-
operate and that the research findings will cut across all youth polytechnics in the
country.
1.10 DEFINITION OF OPERATIONAL TERMS
Competency-based training – training that gives more emphasis to trainees’ ability to
master specific practical tasks as competencies than to the level type of certification or to
the length of training they have received.
Enrolment –registering as a member and continuing to attend classes regularly.
Facilitator – one who assists adults and out -of- school youth in the learning process
without being the provider of information or the demonstrator of skills.
Out-of-school youth – any individual who has attained the age of 15 years and above
and has been, due to certain reasons, out of school for about one year.
Participation – a situation of being present so as to give assistance physically, mentally
or emotionally as it is required.
Skills development – The acquisition of practical competencies, know-how and attitudes
necessary to perform a trade or occupation of benefit in the labour market.
Technology education – used of school based preparations for technicians, usually in
institutions associated with education ministries.
Technical vocational skills development (TVSD) –TVSD is intended to marry the well-
known older terms, Technical and Vocational, with the newer term, Skill development.

9
Vocational education training – (VET) commonly used especially in Europe, along
with TVET to cover the whole skills systems, whether in schools or in training centres.
Vocational education – Used of school-based preparation for crafts people usually in
association with education ministries.
1.11 ORGANIZATION OF THE STUDY
The study will be divided into five chapters.
Chapter one consists of background information on the problem, statement of the
problem, purpose, objectives, research questions, significance, basic assumptions,
limitations and delimitation of the study. The Chapter also consists of organization of the
study and definition of significant terms.
Chapter two will consist of a brief discussion of the related literature to the study under
the following sub topics: Policies for Youth education, Awareness of courses offered,
Attitude towards Youth Polytechnics, Financing Youth Polytechnics and Co curricular
Activities in Youth Polytechnics.
Chapter three will describe research methodology to be used in the study. The chapter
will have the topics, research design, target population, sample size and sampling
techniques, research instruments, reliability of instruments, validity of the instruments
piloting, data collection procedure and data analysis procedure.
Chapter four will consist of findings from data analysis, a summary of the research
findings, conclusion, recommendations and suggestions for further research in the area.
The last section of the project – Chapter five will consist of bibliography and appendices.

10
CHAPTER TWO
LITERATURE REVIEW
2.0 INTRODUCTION
TIVET is a comprehensive term referring to the education process which involves apart
from general education, the study of technology and related sciences, and the acquisition
of practice, skills and knowledge relating to an occupation in various sectors of economic
and social life,
Literature review, according to Mugenda and Mugenda, (1999), involves the systematic
identification, location and analysis of documents containing information related to the
research problem. However, since the literature reviewed does not comprise of
everything associated with the research on low enrolment in youth polytechnics, it is
hoped that the review done here will give the background information to the area of
study. Karuri (1976) says that literature is not appropriately reviewed simply by
enumerating previous studies, but rather the relevant literature is used to develop the
logic and background of the proposed study.
In this chapter literature review will focus on the following topics: Policies for Youth
Training, Attitude of youth towards Youth Polytechnics, Awareness of courses offered in
youth polytechnics, Co curricular activities in Youth Polytechnics and Financing Youth
Polytechnics.
2.1 POLICIES FOR YOUTH TRAINING
The World Conference on education for all held in Jomtien, Thailand in 1990, marked the
beginning of a new era of global agreements on education development. The goals set
then were re-emphasized in the year 2000. Two of the six goals were related to adult
education: (1) To expand access to adult education and (2) to have 50% increase in the
adult literacy rate by 2015. Both goals relate to the youth as it is them who either drop

11
out of main stream learning or those who do not transit to the next level from primary or
secondary schools. They become frustrated and get wasted. Educating the youth by
equipping them with training and skills gives youth self reliance.
According to the Education International (EI) Paper of October 2009, it is evident that
both the knowledge-based societies and the developing countries should invest in a
strong, public, vocational education and training sector. The paper continues to quote the
UNESCO (2001) Revised Recommendation on Technical and Vocational Education and
Training, “Given the immense Scientific, Technological and socio-economic
development, either in progress or envisaged, which characterises the present era,
particularly globalisation, and the revolution in information and communication
technology, technical and vocational education should be a vital aspect of educational
process in all countries.”
The same paper gives the international recommendations for training and vocational
education policies grouped as follows: Improvement of co ordination to improve
efficiency and avoid duplication of services; Increasing and improving private provide of
which the Philippines is an example where the vast majority of TVET students are
financed by private investors; The introduction of new funding methods. Examples are
Australia and the Philippines where payment vouchers are in use. This increases
competition among the providers who are also able to choose who to sponsor.
The German policy beats all as it is has been quoted in the Business Week journal of July
2012 as having the lowest jobless rates among young people of any industrialised country
in the world – between 7 and 8 per cent. This contrasts sharply with the American
situation where so many youths are struggling to find employment after graduating high
school or college. The article, titled ‘Would Germany Style Apprenticeship Work in the
US?’ explains the policy which requires each German youth to apply for a 2-3 years
training contract in a private company. If accepted, the government supplements the
trainees on- the- job learning with more broad-based education in their field of choice at a
publicly funded vocational school. The trainee spends 3 or 4 days at work and 2- 3 days

12
in the classroom. This helps the youth to come out with both practical and technical skills
to compete in a global market and also a good overall perspective on the nature of their
profession. They are also issued with a certificate for passing the companies exam which
would allow for transfer to similarly oriented businesses if the training company does not
retain them. The advantage is that TVET ensures that there is a job for every youth in
vocational training: No job offer, no training. This is to prevent heartbreaks after the long
hard years of work at school with no job opportunity after completion.
In Greece, which is one of the developing countries, institutions that offered vocational
training were called Practical Lyceums. Although the Greek law introduced practical
education in 1889, the institutions could not start due to structures. Like in many parts of
the world, the Lyceums were perceived as inferior vocational schools that absorbed
primary school leavers who could not advance to high school.
Research in Sub-Saharan Africa shows that improved access development is critical in
addressing youth unemployment- World Bank, (2009) –features prominently to facilitate
the transmission of young people to the world of work, and many countries in Sub-
Saharan Africa are taking on policy activities on training both the formal and informal
sector, (King and Palmer 2010). It is acknowledged that the private investments in Africa
are constrained by the Economic Community of West Africa States, (ECOWAS) and the
East African Community also place Polytechnics high on their agenda. African Union,
(AU), rates polytechnics as one of its seven priority areas for investment in the continent
in its Plan for Action for the 2nd
Decade of Education and has adopted a policy
framework for polytechnics in Africa (AU, 2007).
Ghana is among the sub-Saharan countries whose governments are renewing efforts to
promote technical and vocational training (TVET), with the belief that skill formation
enhances productivity and sustains competitiveness in global economy. According to
World Youth Report, (2007), in recent years, concerns have been raised by most African
countries about the move towards making TVET a complementally to post basic
education. He pointed out that the paradigm shift towards skills training with TVET in
13
Africa is increasingly being reshaped to make it more attractive, efficient and effective.
The African governments have recognised that the most important features of a TVET
are in the orientation towards the world of work with the curriculum emphasizing the
acquisition of employable skills. The African Union, (AU) report of 2007also stressed the
current vision of African countries in developing a new strategy in revitalizing TVET in
Africa. The governments expect that TVET will promote skills acquisition through
competency-based training.
According to Commonwealth of Learning, (2001), enough trainees are not available for
positions of greater need, “blue collar jobs’’, which involve manual labour, and are dirty,
dangerous and difficult. Louglo and Lillis, (1998), cite more than one major problem in
many countries – whether to concentrate investment in general education or vocational
training. According to human capital theory, general education creates ‘general human
capital’ while TVET leads to ‘specific human capital’. This is proof enough that before
one engages in training, they should be clear what type of capital they would like to
create.
A DFID Practice Paper – Briefing (2007) writes that in the 1960s and early 1970s,
Technical and Vocational Skills Development (TVSD) was a key sub-sector for many
bilateral and multilateral donors in support for developing countries. Initiatives that had
the objective of providing employable skills to ease school leavers’ unemployment
became popular in many countries in Sub-Saharan Africa (SSA). Examples were workers
Brigades in Ghana, Village Polytechnics in Kenya, Botswana’s Brigades and Tanzania’s
Education for self-reliance. However, in the mid 1980s, TVSD had structural adjustment
and cost-sharing measures which deeply affected public provision of education and
training. Even though vocalized secondary school education remained for many national
governments, TVSD has remained politically popular in many developed and developing
countries. This is because of the presumed close link with the world of employment and
work. King and Palmer (2006) and Palmer (2006) note that both politicians and policy

14
makers have greater expectations on TVSD than on primary education, yet the budget for
TVSD is much lower.
The DFID Briefing Practice Paper (2007), writes that in the mid 2000s the Commission
for Africa, the Millennium Project and Summit, New World Bank policies on secondary
higher and general education and on skills development, as well as World development
Report of 2007 on youth, have all agreed that a holistic, integrated, inter-sectoral
approach to education is crucial, including TVSD. In the 2006 Briefing on secondary,
vocational and higher education, DFID asserts the same.
In many developing countries, the political and policy makers still cling to the link
between TVSD and a reduction in unemployment through the acquisition of skills. The
background document for the African Union’s TVET Experts meeting, (13-14 Dec. 2006,
Addis Ababa, the Strategy to revitalize Technical and Vocational Education and
Training, (TVET), in Africa is an example.
Youth Polytechnics are among the institutions that provide technical and vocational
education and training, which is nowadays also called Technical and Industrial Education
Training (TIVET) in Kenya. They include National Industrial Vocational Training
Centres (NIVTCS), Technical Training Institutes of Technology, National Polytechnics
and Universities. Youth polytechnics were initiated by the National Council of Churches
in Kenya (NCCK) and the local community in 1968. At that time they were known as
Village Polytechnics. The main aim of the Youth Polytechnics was to ensure that school
leavers had access to technical entrepreneurial and business skills which would lead them
to income generating activities and so improve the standards of living of their
communities as well as reduce rural urban migration.
According to GoK, (1999), and Eshiwani, (1993), the government of Kenya policy and
the immediate demands and needs existing at the local and national levels dictated the
direction of EFA activities and programmes. Some of these needs were to meet the high

15
level of human resource requirements of the emerging independent nation. This was
articulated in the 1970-1974 Development Plan.
Later, according to the Sessional Paper No.2, (1996): Industrial Transformation and
Development, it was decided that for Kenya to become a Newly Industrialized Country
(NIC) by the year 2020, it requires to be ingested with vigorous skills and
entrepreneurship skills which can be achieved by the training of the youth. The policy
cited in the Children’s Act (No.8 of 2001), still requires the government to support
Youth Polytechnic education because the young school leavers of between 15 and 18
years who are ejected out of main school pipeline at class eight or form four, about
275,000 in number, have a right to education as they are still children. The responsibility
of educating them is therefore on the government and the parents.
However, the Youth Polytechnic sector lacks a stable coordinated institutional
framework. It lacks a clear policy and regulatory framework that guide planning,
administration and management roles of different stakeholders. As a result there has
been very limited financial investment, management support and presence of the
government in Youth Polytechnics as compared to other sectors of education and
training.
Lack of clear policy is manifested in the frequent changes of parent ministries. First the
Youth Polytechnics were under the Ministry of Culture and Social Services. They then
moved to the Ministry of Technical Training and \Applied Technology before moving to
the Ministry of Labour and Human Resource Development. For some time they were
under the Directorate of Industrial Training, but in the provinces and districts they were
under the Department of Small Micro enterprises. This confusion impacted negatively on
the planning, management and promotion of Youth Polytechnics.
Currently Youth Polytechnics are under the Ministry of Youth Affairs and Sports
(MOYAS) established in December, 2005, in the department of Youth Training.

16
2.2 ATTITUDES OF YOUTH TOWARDS YOUTH POLYTECHNIC
The aim of TVET is to equip learners with basic skills needed to perform productive
work but according to Kerre, (1996), and Tum, (1996), research has shown that people in
the society: politicians, educators, administrators, parents and learners do not fully
appreciate the value of TVET. Some studies have suggested that the major reason for
this negative attitude is the long term low status of TVET compared to general education.
Omulando and Shiundu, (1992), write that negative attitudes towards TVET among a
large section of the community has been reported which is claimed to have been bred and
crystallized by the coming of rulers in Africa where subjects were expected to be manual
workers and, therefore, were provided with technical and vocational training while
general academic education was reserved for Europeans who filled the white collar jobs.
This results in negative attitude towards the incorporation of technical and vocational
education in formal education systems especially in developing countries. This is done in
the technical and vocational education.
Another explanation for the low status of TVET is that it is regarded as a second chance
for those who have failed to find a place in academic education. This situation is
worsened by the low level wages earned by vocationally trained graduates. Accordingly,
in the recent years many technical and vocational students have ended up with limited
opportunities for pursuing graduate or advanced technological education (Tum, 1996).
This has resulted in low morale among those students taking TVET education.
In a comparison between the economic success of German and Switzerland; and the low
success of France and UK, the main reason was found to be in the different approach that
the countries give to vocational education. The French were said to “Look down on
vocational training perpetuating the notion that intellectual education are more worthy
than manual work.” This is as reported in an article the web by Jerome Frantz headed,
‘Vocational education: learning the works’. He was the chairman of des Industries
Mechaniques.

17
On the other hand, German and Switzerland have taken a very different view of on the
value of vocational training. About 65 per cent of youth between 15 and 19 years obtain
apprenticeships compared with only 6 per cent in England. The apprenticeships take three
to four years, spending an average of three days in a week in college. The result is highly
employable youths.
A study by UNESCO-UNEVOC, (2000) revealed that the community exerts a great deal
of influence and ones choice of career. Kerre, (2001) notes that parents want their
children to be teachers, doctors, nurses, and very few encourage their children to enter
blue collar jobs.
Kapiyo & Otieno, (1986) observed that in the recent past students heartily loathed manual
labour; hence agricultural and technical education were neglected. However, they also
affirmed that recent developments have indicated that things are at least beginning to
change. Technical education is now viewed in a more favourable light although pupils
may still have personal misgivings about manual work.
Musaazi, (2001) in his Keynote address to the sub regional workshops on the theme
‘Promotion & Reform of Technical Education and Training in Africa says that part of the
problem that inhibits career in favour of technical and vocational education is lack of a
clearly conceptualized curriculum in the field. Shiundu & Omulando, (1992), also share
the same sentiments. They exert that the existing TVET curriculum lacks a clearly
articulated philosophy and balance where education training aspects are visible and can
be understood by learners, teachers and parents.
The result of negative attitude is lack of skills for the labour market which is a major
cause of unemployment. Most of the adult youth who form 60% of the active employable
labour force remain unemployed because they lack the appropriate skills for the labour
market. These are the skills mostly offered in the YPs. Clark and Palmer (2011), citing
African Economic Outlook 2011, points that the African youth face high rates of
unemployment despite having a vast reservoir of talents, skills and opportunities that

18
through smart interventions can be transformed into a productive workforce. This
information is brought out in a study done on West and East African countries. The study
shows that the worst hit are Kenya and Madagascar in East Africa and Cameroon,
Nigeria and Cote d Ivoire (Adams, 2011). A skills mismatch makes the situation worse
where for example the youth may insist on getting a course in IT while the demand is on
plumbers or even farmers.
It has however been noted according to Charner (1996) that over the recent years and
especially in the developing countries, learners have began to show more interest in
technology. This has led to many countries infusing the essential components of
technology into their school curriculum. This is done in the form of technical and
vocational education. This will hopefully raise the interest of the YPs education as it will
be a continuation of something they appreciate.
In Kenya, technical studies have been re-introduced in secondary Schools as examinable
subjects. These had been dropped out of the programme in 2003 when the Ministry of
Education launched a revised syllabus for primary and secondary schools in a bid to
relieve the learners of their strenuous workload of the then 8-4-4 curriculum. It was in
the year 2007 that the PS for education said that the ministry had reconsidered its
decision to scrap the technical subjects. This was recorded in a Daily Nation that year.
Inhibitive socio-cultural practices affect the youth in their choice of training. Certain
socio-cultural practices have given the youth predetermined ideas which inhibit their
career development. Some of these could be male students’ enroling for a hair and beauty
course. Even though it might be marketable, the males will shy away as it is mostly
associated with females. A survey by Adana, (1986), revealed that education in Africa
has not adequately helped to open the youth to himself so that he becomes knowledgeable
to himself, his interests, capacities, values, attitudes and the world around him. Early
marriages also fit in this category.

19
2.3 AWARENESS OF COURSES OFFERED IN YOUTH POLYTECHNICS
According to an article in the internet entitled ‘FICCI Skill Development Forum address
national skill gap by facilitating skill training for Indian workforce in formal and informal
sectors’, vocational training is often considered to be a not so glamorous occupation and
the jobs also lack respect from the society. In addition to the negativity, there is limited
information available about job opportunities. FICCI intends to overcome this hurdle by
creating a successful awareness campaign about vocational training by conducting road
shows, workshops and regional events. To commission Regional Profiling Studies to
identify a region’s specific skills demand for industries, and developing a communication
plan which is delivered by local brand ambassadors to drive a greater sense of dignity of
the labour, would also go a long way in advertising vocational training.
Jan Shikshan Sansthan is a unique scheme made up by the government of India. It is a
scheme that helps the poor by giving them vocational skills. They “shape their
beneficiaries into self reliant and self reliant employees and entrepreneurs.” This is in the
internet under the title ‘Jan Shikshan Sansthan.’ The most in interested aspect is the
initiative to reach out to their clientele. They set up sub centres in the heart of the slums
or in the remote areas.
2.4 CO CURRICULAR ACTIVITIES IN YOUTH POLYTECHNIC
‘Vocational training to polish practical skills’ is a Hindu article in the internet on the
relationship between extra activities such as music, yoga, karate and learning, it was
found that the youth preferred the activities to vocational skills such as carpentry,
tailoring, automobile repair and electrical works though they would help the in their day
to day lives.
Singapore, apart from introducing more courses in the curriculum of Institute of
Technical Education (ITE), it has also introduced co curricular activities in a bid to ‘help

20
students stay in school’. These include sports and computer games. This is in the internet
under the title ‘Contact, The Teacher Digest’.
Kwa Zulu Natal in South Africa had an encouraging report: that 77 per cent of the
schools always offered co curricular activities, including 58 per cent of persons with
disabilities. Most respondents revealed that their school have never received any funding
for co curricular activities. This was reported in a Special Schools Survey report posted in
the internet.
Inadequate sports facilities in Kenya has inhibited the youth in developing their
competencies and talents in the sector. The sporting sector has not been recognised as an
alternative source of employment to the youth. However according to information in the
internet by the Directorate of Technical Accreditation and Quality Assurance, have a
policy to improve co ordination promotion of technical, industrial vocational and
entrepreneurship training institutions co curricular activities.
2.5 FINANCING YOUTH POLYTECHNICS.
The delivery of TVET requires smaller classes and expensive equipment. This is
according to the International Institute for Educational Planning (IIEP) Newsletter
vol.XXV no 4 of October 2007. It continues to state that TVET is privileged have private
partnership and that in many countries private providers are many with linkages with
employers for apprenticeship programmes. The Philippines is an example of countries
where public funds from central and local governments and official and development
assistance constitute of 46 per cent of TVET expenditures. Companies also fund
apprenticeship programmes or give allowances to students within the dual system (where
the students learn on the job), non governmental organisations run short community-
based courses and foundations sponsor training institutions. Altogether, private suppliers
constitute 22 per cent of the total TVET expenditure. Students’ fees in both private and
public institutions represent 29 per cent of the total TVET expenditure while the TVETs

21
generate 3 per cent of their income. Companies are also asked to contribute towards
TVET as they are beneficiaries of the training. Students also pay tuition fees both in
public and private institutions.
The Indian institutions called Jan Shikshan Sanstham provide vocational skills to the
poor in the slums and the rural as have been mentioned above. It provides the institutions
with a lump sum grant in a set pattern. They are to be spent under different heads given
by the government.
In Kenya, the education sector makes up to a quarter to more than a third of the public
expenditures. This is a high proportion against the GDP as well – consisting around 6%
of the total GDP or at times closer to 7%. According to regional comparison of UNDP
data, it is among the highest in the sub-Saharan Africa following Zimbabwe and Lesotho,
which allocated 10.4% and 10.0% by their GDP respectively to the education sector
during the period of 1999-2001. (UNDP, 2004).
The pattern of Kenya’s allocation of funds among the sub-sectors of education is
different when compared to Ethiopia and Tanzania. It allocates less to primary school
and more to TVET and secondary school. This shows that EFA has more meaning to
Kenya than in the other countries. This is proven by the government subsidy of Ksh
15,000 per student in YP as compared to Ksh 10,000 per student in secondary school.
There are about 600 Youth Polytechnics of which 395 are government aided. The
government started the support for the Youth Polytechnics in 1971. At first the assistance
used to be top-up salaries for the instructors as well as providing the equipment needed
for instruction. However in a bid to capture more youths, the government recently
subsidized the fees the learners should pay by allocating Ksh.10,000 per student per year
since the year 2006 and more recently the subsidy has been raised to Ksh 15,000. The
student was left with only payments for boarding facilities or for lunch for the day
scholars. This has happened because first as quoted in the National policy for Youth
Polytechnics and Vocational Training sectors by the Ministry of State for Youth Affairs

22
and Sports (MOYAS) of December 2006. Youth training is not a liability but an
investment.
At basic level the financing of education and training is the responsibility of the
government and parents. The government`s role, however, has been limited to just small
grants to bridge the staff salaries until recently when it started paying subsidies of Ksh
10,000 per student per year which has now risen to Ksh 15,000. The government is also
responsible for training the teachers which is done at Kenya Institute of Technical
Training.
2.6 THEORETICAL FRAMEWORK
It is a theory postulated by Joyce, Weil and Calhoun, (2003).The concept is of learner
characteristics as an important dimension of the social foundation of TVET. Thompson,
(1973) observed that this concept influences how to prepare, structure and execute
programmes in technical and vocational education. He further explained that managers
must have purposeful goals. This means that they have responsibilities and goals towards
which to direct their activities. Thompson asserts that there is a rather general agreement
today that the conditions for gaining knowledge are much more favourable when those
concerned experience feelings of need for subject matter and when mastery of subject
results in personal satisfaction. Institutions should therefore endeavour to have trainees
learn only things and processes which are of use and value in real life situation.
Joyce, Weil and Calhoun`s 2003 theory believes that goal setting is an effective way of
increasing motivation and performance. The intention of achieving a goal is a primary
force for behaviour. Goals direct both mental and physical actions in individuals.
Having gone through this study, the gap that the researcher would like to fill is to find
out the factors that contribute to low enrolment in Youth Polytechnics despite the fact
that technical and vocational training has been endorsed crutial, not only to the individual
youth, but also to the community they live in. Many governments in the world have
emphasized that technical and vocational training go hand in hand with academic

23
education if any country is going to succeed in improving its economy. All having been
said and done, enrolment in Youth Polytechnics continue to remain low while the youth
continue to idle about and engage in malpractices seeing unemployment soaring higher
and higher levels.
In the study, the researcher intends to highlight the contributing factors and give
recommendations in an attempt to make Youth Polytechnics perform their intended
functions: to provide the youth with training and skills for employability and provide the
country with the much needed cadre, for the all-important blue collar jobs.
2.7 CONCEPTUAL FRAMEWORK
INPUT OUTPUT
Adopted from Joyce, Weils and Calhoun’s Theory, (2003), Goal-setting Theory
The concepts of this study were based on the assumption that independent variables such
as the right attitude towards youth polytechnics, improved awareness, enough funding
and co-curricular activities that are attractive to youth, if implemented will play a major
role in ensuring high enrolment in Youth Polytechnics. The high enrolment will in turn
yield outputs such as self-reliant youths, increased employment, and economic
development among others.
Improved awareness
courcours
Right attitude towards YPs
Enough funding
Co-curricular activities that
attract youth
High enrolment in
Youth Polytechnics
Self reliant youths
Increased employment
Economic development
Social development
Skilled human resource

24
CHAPTER THREE
METHODOLOGY
3.0 INTRODUCTION
This chapter has the research design, details of the target population, sample size and
sampling procedure, research instruments, instrument reliability and validity, data
collection and data analysis procedure.
3.1 RESEARCH DESIGN
A research design is the plan, structure and strategy of investigation proposed for
obtaining answers to research questions (Orodho, 2005). This study was conducted using
a survey design. Survey is a method of collecting information by interviewing or
administering questionnaires to a sample of individuals. It is a design mostly used in
studying attitudes, opinions, preferences and perceptions of people. The design attempts
to collect data from members of a population so as to determine the actual status of the
population. By the use of the design, this study sought to establish the effects of certain
variables under investigation, that is, various factors as independent variables that cause
low enrolment in YPs, and enrolment as the dependent variable.
3.2 TARGET POPULATION
A population is defined as a complete set of individuals, cases or objects with common
observable characteristics (Mugenda and Mugenda, 1999). It is the population to which
the researcher would like to generalize their results. The population of this study
consisted of managers, teachers, and students of the 16 YPs in Nyeri zone, out of school
youth, and administrators. Target population, according to Borg and Gall (1989), is all
the members of a real and hypothetical set of people, events, and objects to which we
generalize the results of our research.
25
3.3 SAMPLE SIZE AND SAMPLING PROCEDURE
A sample size is the number of items to be selected from the universe or target
population. The sample size selected should remain optimum, that is, should fulfil the
requirements of efficiency, representativeness, reliability and flexibility. It is a subject of
a particular population whose characteristics are representative of the entire population
(Kothari, 2003)
Resources and time tend to be the major constraints in deciding on the sample size to use.
The proximity between the researcher’s residence and study sample is a factor of
consideration in research (Mugenda and Mugenda, 1999). One third of the target
population is representative enough to make estimate of the characteristics being studied,
(Mulusa, 1990). In this study, a total of 5 YPs, being ⅓ of the total 16, were used due
their accessibility. They are listed below with their enrolment: Kinunga, 79; Gitero, 113;
Gachika, 158; Kihuyo, 37 and Mathakwaini, 46. The sample size, therefore, was 26, 53,
38, 12, and 15 respectively. This study then used random sampling, where each element
of a group has an equal chance of being selected for questioning. There were 39 teachers
who were all given questionnaires as the numbers was not overwhelming. All the 5
managers and the 5 Assistant chiefs were also included in the sample size.
3.4 RESEARCH INSTRUMENTS.
The instruments used in this study included questionnaires and an observation checklist.
The researcher opted for the questionnaire because the responses are gathered in a
standardized way making it more objective compared with other tools of data collection.
It is also relatively quick to collect information using it. Ngechu, (2006), adds that it
makes it possible to collect potential information from a large portion of a group.
The questionnaires contained two sections , A and B. Section A contained questions on
the respondents background while section B contained detailed but simple questions that
the researcher used to establish the inhibitors of high enrolment in YPs. The questions
were both open-ended and close-ended. Open-ended questions give the respondent

26
freedom to respond in their own words while the close-ended questions require the
respondent to select the answer that satisfies them best. After some of the questions, some
space was left where the respondent explained their selected answer further. Open-ended
questions allow a greater depth of response which may be of great help to the researcher.
The checklist sought to find out the availability and condition of both the physical
facilities and teaching resources in the institutions
3.5 PILOTING.
Before using the questionnaire for generating data for the study, a pilot study was
conducted in one of the YPs not in the sample. The target group consisted of, a youth in
YP class, another who dropped out, a YP manager, a YP teacher, and an administrator
(Ass chief).
Piloting is supposed to pre-test the instrument by firstly verifying if the questionnaire is
clear to the respondents, secondly by establishing if the questionnaire will provide the
data needed for the study and thirdly by assessing and identifying any problems
respondents might encounter in filling the questionnaires. The researcher administered
the questionnaires and collected them the same day after they were filled. Corrections
were made in the final draft.
3.5.1 Validity of Instruments
According to Kathuri and Pals, (1993), validity is the accuracy and meaningfulness of
inferences which are based on the research results. This implies that validity is the degree
to which results obtained from the analysis of the data actually represent the phenomenon
under study. To enhance validity, the researcher consulted the experts in the field of
research. This helped to ensure that the questionnaires and observation checklist
represented the content, they were appropriate for the samples and that they were
comprehensive enough to collect all the information needed to address the purpose and
goals of the study.

27
3.5.2 Reliability of the Instruments.
Reliability is a measure of the degree to which a research instrument yields consistent
results of data after repeated trials. Reliability in research is influenced by random errors.
As random error increases, reliability decreases (Mugenda and Mugenda, 1999). The
researcher tried to minimize errors by using accurate coding of questionnaires, clarifying
instructions on the questionnaires and using non- biased questions.
The study used a pilot study in order to determine the level of reliability of the research
instruments. Data obtained was analyzed using spearman order correlation coefficient to
determine the reliability of the instrument. The correlation between the responses given for the
closed ended questions was determined with aid of SPSS. The correlation between the responses
for the instruments was found to be r=0.834, p=.000. The results indicated that the responses
obtained demonstrated a statistically significant positive correlation implying that the
instruments were reliable.
3.6 DATA COLLECTION PROCEDURE.
To carry out the study, permission and authority was sought from the National Council of
Science. Subsequent clearance to carry out the study was obtained from the District
Commissioner (DC) and the District Education Officer (DEO) located in Nyeri
Municipality. After permission was granted, the researcher paid a visit to the participating
institutions to inform them of the intended study and to create a rapport. Piloting was
done in one of the institutions not included in the samples. Corrections were made to
clear any ambiguities. The questionnaires were administered by drop and pick method
and the filled in questionnaires were picked four days later and the checklist was ticked
according to the availability of the physical facilities and teaching resources as observed
during the visit.

28
3.7 DATA ANALYSIS TECHNIQUES.
The questionnaires were checked for completeness in preparation for analysis. Data were
appropriately coded for ease of use with Statistical Package for Social Sciences (SPSS).
The simplest way to present data according to Ngechu, (2006), is in descriptive statistics.
Descriptive statistics enables the researcher to meaningfully describe a distribution of
scores or measurements using a few indices or statistics (Kothari, 2008). Each statistic
used in descriptive statistics has a purpose. The type of statistics or indices used depends
on the type of variables in the study and the scale of measurement to be used. Using the
SPSS programme can give such descriptive statistics and therefore the programme is
much appropriate for the analysis.
Content analysis is a research tool focused on the actual content and internal features of
media. It is used to determine the presence of certain words, themes, phrases, characters
or sentences within texts or sets of texts and to quantify this presence in an objective
manner. To achieve this, the researcher followed the procedure below:
a. Coded and classified various responses,
b. Identified key responses for various themes,
c. Listed and tallied key responses by specific themes,
d. Identified patterns emerging from key responses,
e. Studied the inter-relationships between identified patterns, and
f. Drew inferences from patterns and their interrelationships.
Each research question has quantitative and qualitative data. For the quantitative data, the
responses were coded, tallied and their frequencies and percentages identified. For the
qualitative data, similar responses were coded and tallied after which deductions were
made.

29
CHAPTER FOUR
DATA PRESENTATION, ANALYSIS AND DISCUSSION
4.0 INTRODUCTION.
This chapter presents the findings guided by the following research objectives and
questions. The objectives are: a) to explore the extent to which the policies set for youth
training affect enrolment, b) to determine the extent to which attitude towards youth
polytechnics affect enrolment, c) to establish the extent to which the level of awareness
of the courses offered in polytechnics influence enrolment, d) To investigate the extent to
which co-curricular activities in polytechnics affect enrolment, and e) to establish the
extent to which the levies paid by students in polytechnics affect enrolment. The
questions the study sought to answer are a) to what extent do the policies set for youth
training affect enrolment? b) To what extent does the attitude towards youth polytechnics
affect enrolment? c) To what extent does the level of awareness of the courses offered in
polytechnics affect enrolment? d) How do the co-curricular activities in youth
polytechnics affect enrolment? e) What is the effect of the levies paid by the students
paid by students in youth polytechnics on enrolment?
The study was of descriptive nature. The data was therefore largely analyzed using
percentages and presented using descriptive methods; that is, pie charts, bar graphs and
tables.
4.0.1 Response Rate
A sizable number of the respondents targeted give their responses to the research
instruments. Table 4.1 shows the statistics of the respondents who gave their responses.
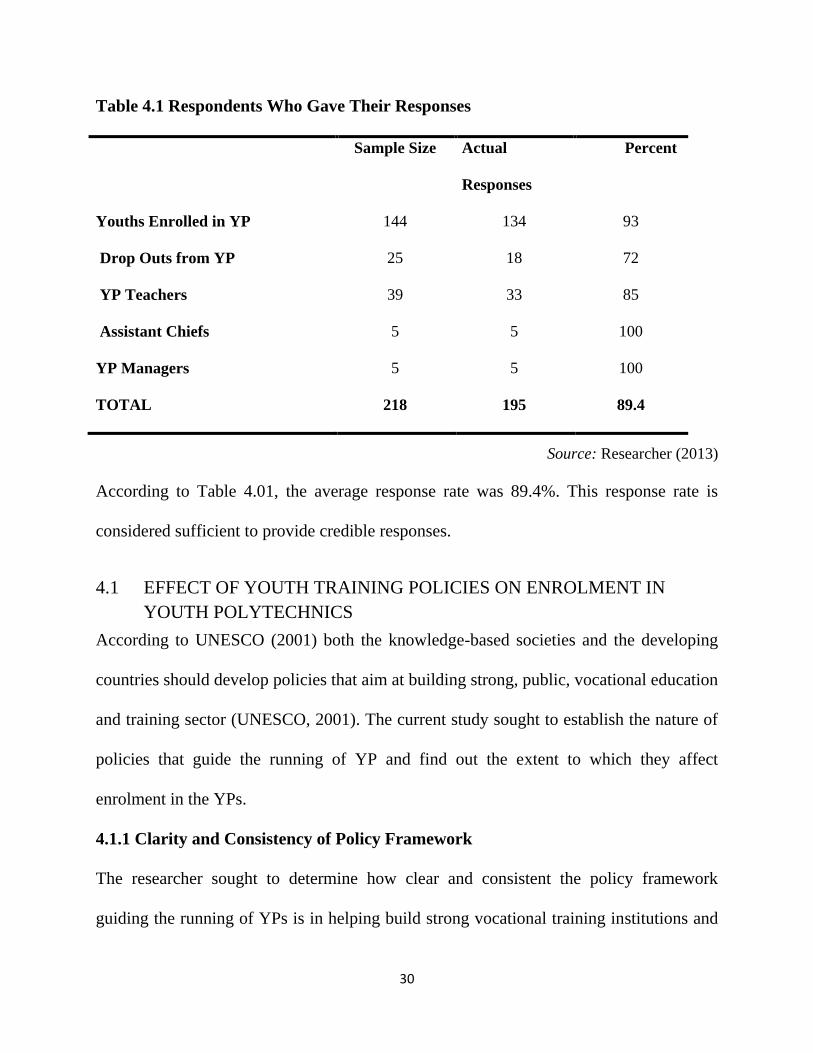
30
Table 4.1 Respondents Who Gave Their Responses
Sample Size Actual
Responses
Percent
Youths Enrolled in YP 144 134 93
Drop Outs from YP 25 18 72
YP Teachers 39 33 85
Assistant Chiefs 5 5 100
YP Managers 5 5 100
TOTAL 218 195 89.4
Source: Researcher (2013)
According to Table 4.01, the average response rate was 89.4%. This response rate is
considered sufficient to provide credible responses.
4.1 EFFECT OF YOUTH TRAINING POLICIES ON ENROLMENT IN
YOUTH POLYTECHNICS
According to UNESCO (2001) both the knowledge-based societies and the developing
countries should develop policies that aim at building strong, public, vocational education
and training sector (UNESCO, 2001). The current study sought to establish the nature of
policies that guide the running of YP and find out the extent to which they affect
enrolment in the YPs.
4.1.1 Clarity and Consistency of Policy Framework
The researcher sought to determine how clear and consistent the policy framework
guiding the running of YPs is in helping build strong vocational training institutions and

31
increase the accessibility of the same to a large population. This was achieved by asking
the managers of the YPs to rate the characteristics of the policy framework guiding
establishment and operations of YPs as they perceive them. Tables 4.2 and 4.3 display
the responses obtained.
Table 4.1 Clarity of the Policy Guidelines
Frequency Percent
Very Clear 0 0
Clear 0 0
Somewhat Clear 1 20
Unclear 2 40
Very Unclear 2 40
TOTAL 5 100
Source: Researcher (2013)
4.1.2 Government Support
The researcher sought to establish whether the guidelines on the government support is a
factor affecting the enrolment in the YPs. The findings of the study were as displayed in
Figure 4.1.

32
Source: Researcher (2013)
Figure 4.1 Extent of Government Support to YPs
According to Figure 4.1, the amount of support given to the YPs by the government is too
low according to majority of the respondents. These findings of the study echoes the
findings of Lauglo, J. and Naima, A. (1988) which reported that there has been very
limited financial investment, management support and presence of the Government in
YPs as compared to other sectors of education and training. This was also confirmed by
use of the observation checklist which showed buildings and furniture were in poor
condition.
4.1.3 Entry Requirements
In an attempt to establish whether the government policy on the minimum entry academic
qualifications is a factor affecting enrolment in the YPs, the researcher asked the
Assistant Chiefs to rate the prevalence of youths being locked out from joining the YPs

33
for failure to meet the academic entry criteria. The responses obtained were as displayed
in Figure 4.2.
Source: Researcher (2013)
Figure 4.2 Prevalence of Youths Locked out Due to Entry Requirements
According to Figure 4.2, the prevalence of youths being locked out from the YPs for
failure to meet the entry criteria is low (18%). This implies that the policy guidelines on
the entry criteria are favourable to a wide cross section of youths. This increases the
accessibility of training opportunities in the institutions. The academic entry requirements
therefore encourage enrolment in the institutions.
4.1.4 Consistency of the policy guidelines
The researcher sought to establish whether the policy guidelines governing the running of
YP’s are clear. The findings of the study were as displayed in Figure 4.3.

34
Table 4.3 Consistency of the policy guidelines
Frequency Percent
Very Consistent 0 0
Consistent 0 0
Somewhat Consistent 1 20
Inconsistent 1 20
Very Inconsistent 3 60
TOTAL 5 100
Source: Researcher (2013)
The findings indicate that majority of the respondents (80%) said that the policy
guidelines governing the running of YPs are not clear and also majority (80%) also said
that the policy guidelines said that the policy guidelines on running of YPs are
inconsistent. The findings concur with the sentiments of Eshiwani, (1993) that Youth
Polytechnic sector lacks a stable coordinated institutional framework. It lacks a clear
policy and regulatory framework to guide planning, administration and management roles
of different stakeholders. This is further evidenced in the frequent shifts in the Ministries
responsible of running of YPs.
4.2 EFFECT OF ATTITUDE TOWARDS YOUTH POLYTECHNICS ON
ENROLMENT IN YOUTH POLYTECHNICS
A study by UNESCO-UNEVOC, (2000) revealed that the community exerts a great deal
of influence on one’s choice of career. The current study therefore sought to find out the

35
extent to which the community’s attitude towards YPs has affected the enrolment in the
institutions.
The researcher asked the youths who had dropped out of the YPs to state the main
reasons that prompted them to drop out of the institutions. Table 4.4 summarizes the
responses obtained.
Table 4.4 Reasons for Dropping Out of YPs
Frequency Percent
Fees 3 17
Family Issues 4 22
Negative Attitude 10 56
Others 1 5
TOTAL 18 100
Source: Researcher (2013)
According to Table 4.4, majority of the youths who drop out of the YPs (56%) do so as
they develop negative attitude towards the training, 22% due to family issues, 17% due to
inability to raise the fee charged and 5% due to other reasons. The findings of the study
therefore indicate that that attitude plays a big role in influencing the enrolment levels in
the YPs.

36
Further, the study sought to find out the attitude of the community leaders on YP. To
have the Assistant chiefs rate their participation in the affairs of the YPs in their areas of
jurisdiction.
Figure 4.3 summarizes the responses obtained.
Source: Researcher (2013)
Figure 4.3 Frequency of Participation of Assistant Chiefs in YP Activities.
Figure 4.3 indicates that majority of the assistant chiefs rarely participate in YPs activities
in their areas of jurisdiction. This implies that their attitude towards YPs is negative.
Given that the assistant chiefs are opinion shapers in their localities; their negative
attitude is likely to be translated to the community which may adversely affect enrolment
in the YPs.
The findings of the study concur with the findings of past studies (Kerre, 1996 and Tum,
1996) which reported that people in the society: politicians, educators, administrators,

37
parents and learners do not fully appreciate the value of TVET. In addition, other studies
(Omulando and Shiundu, (1992) found that the major reason for this negative attitude is
historical notion where Africans were expected to be manual workers and, therefore,
were provided with technical and vocational training while general academic education
was reserved for Europeans who filled the white collar jobs. The issue of negative
attitude on vocational training and its adverse effect on enrolment in the YPs is further
reinforced by low level wages earned by vocationally trained graduates and shortage of
opportunities for pursuing graduate or advanced technological education (Tum, 1996).
The findings are in relation with research question 2 which is: To what extent does
attitude towards youth polytechnics affect enrolment?
4.3 EFFECT OF AWARENESS OF COURSES OFFERED ON ENROLMENT IN
YOUTH POLYTECHNICS
The current study sought to establish the extent to which lack of awareness on the courses
offered in the YPs affects enrolment in the institutions. A number of factors on awareness
were explored.
The researcher asked the Assistant Chiefs to rate the level of awareness about the courses
offered in the YPs in their areas of jurisdiction. Table 4.5 summarizes the responses
obtained.

38
Table 4.5 Awareness of Courses Offered
Frequency Percent
Very Low 2 40
Low 2 40
High 1 20
Very High 0 0
TOTAL 5 100
Source: Researcher (2013)
Majority of the respondents (80%) reported that the level of awareness among the
members of the community on the courses offered in the institutions was low. The low
level of awareness on the courses offered at the institutions is likely to affect adversely
the enrolment at the institutions.
4.3.2 Frequency of Receiving Inquiries
The researcher sought to establish how frequent the members of the local communities
inquired about the courses offered in the institutions. The findings will indicate the level
of awareness and interest in the courses offered at the YPs. The managers of the YPs
were asked to rate the frequency of receiving inquiries about the courses offered in their
institutions. Table 4.6 displays the responses obtained.
Table 4.6 Frequency of Receiving Inquiries on Courses Offered in the YPs
Frequency Percent
Very Frequent 0 0

39
Frequent 0 0
Rare 2 40
Very Rarely 3 60
TOTAL 5 100
Source: Researcher (2013)
The findings of the study indicated that majority of the managers (40%) rarely receive
inquiries on courses offered and 60% of the managers very rarely receive inquiries about
the courses offered in their institutions. The infrequency in making inquiries about the
courses offered in the institutions will be reflected in the low levels of awareness in the
community.
4.3.3 Modes of Awareness Creation Used
The researcher sought to find out the methods used by the government through the
institutions and other channels to create publicity about the YPs and the courses they
offer. This was done by asking the students how they got to know about the courses
offered in the institutions. Figure 4.7 summarizes the responses obtained.

40
Table 4.7 Modes of Awareness Creation
Percent
Churches/Baraza 36
Friends 26
Brochures 16
Visits 13
Open Days 9
TOTAL 100
Source: Researcher (2013)
According to Figure 4.7, majority of the respondents (36%) got to know about the
courses offered at the YPs through friends, 26% through barazas and churches, 16%
through brochures, and 13% by visiting the YPs and 9% through open days organized by
the institutions. The findings of the study indicate that awareness creation is not
generated by the YPs themselves but by other means.
4.3.4 Effect of Awareness of Courses Offered on Enrolment
The study further sought to establish the extent to which the level of awareness of the
courses offered in the YPs affects enrolment in the institutions. This was achieved by
asking the YP teachers to rate the influence of awareness of the courses offered in the
institutions on the enrolment in the institutions. The responses were as tabulated in Table
4.8.

41
Table 4.8 Extent of Awareness of Courses Offered on Enrolment
Frequency Percent
Very Large Extent 16 49
Large Extent 11 33
Small Extent 4 12
Very Small Extent 2 6
TOTAL 33 100
Source: Researcher (2013)
The findings of the study indicated that majority of the teachers (49%) think awareness of
courses offered affects enrolment to a very large extent, 33% to large extent, 12% to a
small extent and only 6% to a very small extent. The findings therefore imply that low
levels of awareness coupled with ineffective publicity creation strategies may lead to low
enrolment in the YPs. The findings of the study resonate well with the sentiments
expressed by FICCI that vocational training is often considered to be a not so glamorous
occupation and the jobs also lack respect from the society partly due to limited
information available about job opportunities. FICCI recommends that this can be
overcome by creating a successful awareness campaign about vocational training by
conducting road shows, workshops and regional events.

42
4.4 EFFECT OF CO-CURRICULAR ACTIVITIES ON ENROLMENT IN
YOUTH POLYTECHNICS
The study sought to establish whether inclusion of co-curricular activities in YPs can be
used to boost enrolment in the institutions. This involved finding out the co-curricular
activities trainees are exposed to in the YPs, their expectations, factors affecting
introduction of co-curricular activities and the influence of co-curricular activities on
enrolment in YPs.
4.4.1 Co-curricular Activities in the YPs
The researcher asked the students to identify the co curricular activities they engage in
while in the centres. The responses were as displayed in Table 4.9.
Table 4.9 Co-Curricular Activities Engaged In
Percent
Soccer 37
Volley Ball 26
Hand Ball 20
Drama 0
Music 8
Excursions 9
Talent Shows
Basketball
Rugby
0
0
0

43
Swimming
Athletics
0
0
TOTAL 100
Source: Researcher (2013)
According to Table 4.9, majority of the trainees (37%) participate in soccer, 26% in
volley ball, 20% in handball, 9% in excursions, and 8% in music. However, the study
shows that no trainees participate in drama and talents shows. When asked why no
trainees participated in the drama and talent shows, it was found that the activities are not
offered in the YPs.
Further, the researcher sought to find out the levels to which the co curricular activities
are organized. The findings of the study revealed that the co curricular activities are only
organized at the institutional level and are not competitive. This as was explained wa
mm s due to shortage of funds allocated to co curricular activities and lack of support
from the government. The students also said that they would like other co-curricular
activities be introduced such as drama, basketball, rugby, swimming, athletics, martial
arts and more excursions. This, they were of the opinion that would attract and maintain
more youths, thereby boosting enrolment in the YPs.
4.4.2 Factors Influencing Introduction of Co-curricular Activities in YPs.
The study sought to determine the factors that influence the introduction of more co-
curricular activities in the YPs. The managers were asked to identify the factors hindering
introduction of more co-curricular activities in the institutions. The responses were as
tabulated in Table 4.10.

44
Table 4.10 Hindrances to Introduction of More Co-curricular Activities in YPs
Frequency Percent
Finance 2 40
Shortage of Time 0 0
Lack of Facilities 2 40
Low Motivation from
Authorities
1 20
TOTAL 5 100
Source: Researcher (2013)
The findings of the study indicated that in majority of the cases, the factors hindering
introduction of more co-curricular activities in the YPs are finances and lack of facilities
such as field and rooms. Low motivation from the authorities was also identified as a
hindrance to introduction of more co-curricular activities. The managers of the YPs said
that more co-curricular activities could be introduced if more funds were availed
especially if the government could offer funds to finance organization of co curricular
activities especially at upper levels.
From the data collected through observation checklist on the availability of facilities and
their effects on introduction of more co-curricular activities in YPs, the study found out
that there is a big disparity between the facilities required and the facilities available.
Many of the facilities and resources required such as playfields, and other key
installations were either missing of in poor condition. The findings imply that the luck of

45
adequate suitable resources could be a major factor hindering introduction of more co-
curricular activities in the YPs
4.4.3 Effect of Co-Curricular Activities on Enrolment in the YPs
The researcher sought to determine the extent to which presence of Co curricular
activities in the YPs affected the enrolment in the institutions. The managers of the YPs
were asked to rate the extent of effect co-curricular activities on enrolment. The
responses were as presented in Figure 4.11.
Table 4.11 Effect of Co-curricular Activities on Enrolment
Frequency Percent
Very Frequent 2 40
Frequent 2 40
Rare 1 20
Very Rarely 0 0
TOTAL 5 100
Source: Researcher (2013)
According to Table 4.11 cumulatively, majority of the respondents (80%) were of the
opinion that co-curricular activities have a high impact on enrolment in YPs, as in
relation to research question 4: To what extent do co-curricular activities that take place
in polytechnics influence enrolment? Only 20% of the respondents were of a contrary
opinion. The findings of the study therefore underscore the importance of co-curricular
activities in boosting enrolment in the YPs. This link is further supported in the plan of

46
Ministry of Youth that shows the direction for the youth and sports development policies
and strategies, including National Youth Policy, Sports Development Bill and the
National Policy for Youth Polytechnics and Vocational Training Sector (Ministry of
Youth Affairs and Sports (2010).
4.5 EFFECT OF LEVIES CHARGED ON ENROLMENT IN YOUTH
POLYTECHNICS
The study sought to determine the extent of the influence of the levies charged in YPs on
the enrolment in the institutions. This was achieved by asking the managers to state the
average percentage of the trainees who drop due to inability to raise fees charged and the
trainees to state whether fees charged are a determinant of enrolment levels.
On the drop our rate occasioned by inability to raise the fees, the managers gave the
responses summarized in table 4.12.
Table 4.12 Dropout Rates Occasioned by Inability to Raise the Levies Charged
Frequency Percent
More than 70% 2 40
50%-69% 2 40
30-49% 1 20
Below30% 0 0
TOTAL 5 100
Source: Researcher (2013)

47
According to table 4.12, majority of the respondents (80%) said that more than 50% of
the entire drop out case in the YPs is related to inability to raise the levies charged. Only
20% of the respondents were of a contrary opinion. This point to the levies charged as a
key factor adversely affecting the enrolment in the institutions.
Further, the researcher sought to establish the opinion of the enroled trainees on the effect
of fees levied on enrolment levels. Table 4.13 summarizes the responses obtained.
Table 4.13 Effect of Levies charged on Enrolment
Percent
Very High 66
High 32
Low 2
Very Low 0
TOTAL 100
Source: Researcher (2013)
According to Table 4.13, majority of the respondent (66%) the effect of levies charged in
the YPs on enrolment as very high, 32% as high and the remaining 2% as low. The
findings of the study therefore indicate that levies charged have a substantial effect on the
enrolment in the YPs, as in research question 5: What is the effect of the levies paid by
students in youth polytechnics on enrolment? These findings contradict the effort the
government has made by providing subsidies of Ksh.15000 per student. It indicates that

48
the government needs to offer more financial support to the institutions in order to reduce
the levies charged in the YPs.

49
CHAPTER FIVE
SUMMARY OF MAJOR FINDINGS, CONCLUSION AND
RECOMMENDATIONS
5.0 INTRODUCTION
This chapter addresses the summary of the major findings of the study in relation to the
objectives outlined in chapter one. It also presents the conclusion of the study together
with the recommendations of the researcher based on the findings.
5.1 SUMMARY OF THE MAJOR FINDINGS
The findings indicate that majority of the respondents said that the policy guidelines
governing the running of YPs are not clear and also majority also said that the policy
guidelines said that the policy guidelines on running of YPs are inconsistent. The amount
of support given to the YPs by the government is low according to majority of the
respondents. The prevalence of youths being locked out from the YPs for failure to meet
the minimum academic entry criteria is low implying that the policy guidelines on the
entry criteria are favourable to a wide cross section of youths. This increases the
accessibility of training opportunities in the institutions and therefore encourages
enrolment in the institutions.
On the effect of attitude on enrolment, majority of the youths who drop out of the YPs do
so as they develop negative attitude towards the training indicating that that attitude plays
a big role in influencing the enrolment levels in the YPs. Further, majority of the assistant
chiefs rarely participate in YPs activities in their areas of jurisdiction implying that their

50
attitude towards YPs is negative. Given that the assistant chiefs are opinion shapers in
their localities; their negative attitude is likely to be translated to the community which
may adversely affect enrolment in the YPs.
On the effect of awareness on the courses offered in the institutions on enrolment,
majority of the respondents reported that the level of awareness among the members of
the community on the courses offered in the institutions was low. Also, majority of the
managers rarely receive inquiries on courses offered. Majority of the respondents get to
know about the courses offered at the YPs through friends indicating that awareness
creation is not generated by the YPs themselves but by other means. Further, majority of
the teachers think awareness of courses offered affects enrolment to a very large extent
implying that low levels of awareness coupled with ineffective publicity creation
strategies may lead to low enrolment in the YPs.
On the effect of co-curricular activities on enrolment, majority of the trainees play
football but no trainees participate in drama and talents shows. When asked why no
trainees participated in the drama and talent shows, it was found that the activities are not
offered in the YPs. The study revealed that the co curricular activities are only organized
at the institutional level and are not competitive. This as was explained was due to
shortage of funds allocated to co curricular activities and lack of support from the
government. The students also said that they would like other co-curricular activities to
be introduced such as drama, martial arts and more excursions. This, they were of the

51
opinion that would attract and maintain more youths thereby boosting enrolment in the
YPs. In addition, the study demonstrated that in majority of the cases, the factors
hindering introduction of more co-curricular activities in the YPs are finances and lack of
facilities such as fields and rooms. Low motivation from the authorities was also
identified as a hindrance to introduction of more co-curricular activities. The managers of
the YPs said that more co-curricular activities could be introduced if more funds were
availed especially if the government could offer funds to finance organization of co
curricular activities especially at upper levels. Majority of the respondents were of the
opinion that co-curricular activities have a high impact on enrolment in YPs underscoring
the importance of co-curricular activities in boosting enrolment in the YPs.
Finally, on the effect of levies charged on enrolment, the study found that more than 50%
of the entire drop out case in the YPs is related to inability to raise the levies charged
implying that the levies charged is a key factor adversely affecting the enrolment in the
institutions. In addition, majority of the respondent were of the opinion that the effect of
levies charged in the YPs on enrolment as very high. These findings contradict the effort
the government has made by providing subsidies of Ksh.15000 per student. It indicates
that the government needs to offer more support to the institutions in order to reduce the
levies charged in the YPs.

52
5.2 CONCLUSION
Based on the findings of the study, it can be concluded that;
Firstly, the policy guidelines governing the running of YPs are not clear and are
inconsistent and government’s support for the institutions is too low. However, the policy
guidelines on the entry criteria are favourable to a wide cross section of youths thereby
increasing the accessibility of training opportunities in the institutions and therefore
encourage enrolment in the institutions.
Secondly, the low attitude towards vocational training among the community leaders and
opinion shapers and implementers affects adversely on the enrolment of youths in the
YPs.
Thirdly, awareness of the courses offered by the YPs was found to be low yet the
institutions are not making any deliberate effort to publicize them. This may have
negative influence on the enrolment levels in the institutions.
Fourthly, co curricular activities are only organized at the institutional level and are not
competitive. This as was explained was due to shortage of funds allocated to co curricular
activities and lack of support from the government. The students also said that they
would like other co-curricular activities be introduced such as drama, basketball, rugby,
swimming, athletics and more excursions. This, they were of the opinion that would
attract and maintain more youths thereby boosting enrolment in the YPs.

53
Finally, it was found that more than 50% of the entire drop out case in the YPs is related
to inability to raise the levies charged implying that the levies charged is a key factor
adversely affecting the enrolment in the institutions.
5.3 RECOMMENDATIONS
The study recommends that,
The Government streamlines the policies that regulate the running of YPs and
ensure they are effectively implemented.
The government through its relevant agents sensitizes the youths and the public on
the importance of vocational training as well as creates employment for the
graduates of the institutions. This will change the society’s attitude towards YPs.
The YPs should make concerted effort to publicize the courses and the
programmes offered in their institutions. This will improve awareness and boost
enrolment in the institutions.
The YPs introduce more co-curricular activities on top of soccer, volleyball, and
handball, which have a relatively high percentage of activities offered, as well as
making them competitive. Some of those that could be included are basketball,
rugby, swimming and athletics. This would attract more youth to join the
institutions.

54
The government increase funding and subsidy towards the vocational training.
This will lower the levies charged and make the training more affordable and
accessible.
5.5 RECOMMENDATION FOR FURTHER STUDY
The current study was based only on enrolment in the YPs. More research need to be
devoted to the status and the quality of training offered in the YPs. In addition, more
research should be conducted on the methods of cultivation the right attitude to enhance
enrolment in the YPs.

55
REFERENCE
Adams, A. (2006). The Role of Skills Development in the Transition of Work: A
Global Review Paper for the WDR. World Bank.
Adams, V.A. (2011).The Roles of Skills Development in overcoming skills disadvantage;
Background prepared for the Education for Al Global Monitoring Report 2012
Amkombe. (2000) Technical, Vocational Education and Training as a Tool for
Sustainable Development.
Adana S. (1983). ”Finding Jobs” in Educational Guidance: Concepts and Approaches.
Ibadan University of Ife Press.
Borg, W. and Gall, A. (1989). Education Research: An introduction, 5th
ed. London.
Charner. (1996): Study of School-to-work, reform initiatives. Washington, D.C.
Academy for Editorial DVT (ERIC 397 550)
Court & Dhraham, (1974).Education, Society and Development: New perspectives in
Kenya.Nairobi. OUP.
Dahl, J. (2003). Evaluating Distance Education in the 21st C. Distance Education Report
vol.7 no 8
DANIDA, (2002). Denmark’s Development Assistance 2001. Copenhagen; Youth and
Labour Markets in Africa. A critical Review Liti working document. DIAL DT-
2007, DIAL AND AFD, Paris.
DFID, (2006). The importance of Secondary, Vocational and Higher Education in

56
Development. Briefing paper: July 2006.DFID. London.
Eshiwani, (1993). Education in Kenya since Independence. Nairobi. East Africa
Education Publishers.
Fatuma et al, (2005). Girls & Women in Kenya. General Perspectives and Trends.
Nairobi. UNESCO.
Joyce B. Et al. (2003). Models of Teaching: 7th
Edition. Englewood Cliffs. N.J: Prentice
Hall.
Kapiyo, J. A & Otieno, F. (1986). What do girls and boys think of technology?
Pupils’ Attitudes toward Technology in Raat. J.H, de vries. M. Educational
Report: PAAT Conference. Eindhoven, Netherlands. Eindhoven University of
Technology.
Kathuri, J. N. & D.A. Pals, (1993). Introduction to education research. Egerton
University, Njoro Education media centre.
Kenya National Bureau of Statistics, (2007). Kenya National Adult Literacy Survey
Report.
Kerlinger, F, (1986). Foundations of Behaviour Research. 3rd
Ed. New York. Rienhart
and Winston Inc.
Kerre, B. W. (1995). Technical &Vocational Education in Africa: A synthesis of case
studies. Dakar: UNESCO
King, K and Palmer, R. (2006), Skills development and poverty reduction: the state of the

57
art .Post basic education training working paper no. 7.Centre of African studies.
Edinburgh University.
Kothari, C. (2003). Research Methodology, Methods and Techniques. 2nd
Edition.
New Delhi. New Age International LTD.
Lasonen J. and Burge P. (1991). Women in the workplace: Vocational Ed & segregated
division of labour .Los Angeles, Michigan. State University Extension.
Lauglo, J. and Naima, A. (1988). Diversity Sec Ed in Kenya: The state practical subjects
& their uses after school. In Lauglo, J.; Lillis, K. Vocationalising Education: An
international perspective. Toronto, Canada. Pergamon.
Middleton et al.(1993). Skills for Productivity: Vocation Education and training in
Developing Countries. World Bank. Washington
MOEST, (2005).The Executive Summary of the Paper on ‘The role of Education and
Training in Transforming Kenyainto an NIC by the year 2020. Nairobi. Kenya.
Mulusa, T. (1990). Evaluation for Beginners: Practical Guide. Nairobi. University of
Nairobi Press.
Mugenda O.M. et al (1999).Research Methods Quantitative and Qualitative Approaches.
Nairobi.Acts Press.
Musaazi, J. (2001) Business, Technical and Vocational Education. And Training
(BTVET) as a catalysts for development in Africa. (Keynote speech at the sub-

58
regional workshop on Promotion & Reform of Technical & Vocational Education
& Training in Africa). Kampala.
Mwaluko, N. J. et al (2009). Adult Education learners’ recruitment: Challenges and
Prospects for reengineering access to adult education. Masinde Murilo
University of Science and Technology.
Ngau, M. (1997). Situation Analysis of Adult Education in Kenya. University of Nairobi,
Department of Adult Education.
Ngechu, M. (2006). Understanding the research process and methods: An introduction.
Starbright services ltd.
Orodho, H. (2008). Elements of Education and Social Science Research Methods.
Nairobi. Masola Publishers.
Orodho, J. (1984). The Role of Village Polytechnics in the Social-Economic
Development of Rural Areas of Western Kenya. Nairobi. Kenyatta University
Report vol.7 no 8.
Palmer, R. (2006) Skills Development, the enabling and informal micro-enterprise in
Ghana .An unpublished doctorial dissertation. Centre of African studies,
university of Edinburgh. Edinburgh.
Republic of Kenya. (1984). 8-4-4 System of Education. Nairobi. Ministry of Education
Science and Technology.
Republic of Kenya. (2006). Kenya National Policy for Youth Polytechnic. UNDP.

59
Republic of Kenya. (1996). Sessional paper no. 2: Industrial Transformation and
development. GoK. Nairobi.
Republic of Kenya. (2011). Children’s Act no. 8. GoK
Shiundu J. and Omulando, S. (1992): Curriculum, Theory & Practice in Kenya. Nairobi.
Oxford University Press.
Simiyu, J. (2007). Introducing e-learning as a strategy to increase enrolment in TVET.
(A paper presented at the first African UNESCO-UNEVOC Summit on
Access and inclusion for TVET in Africa through New ICT-based solutions, Safari
Park Hotel, Nairobi. Kenya 28.30 May, 2007).
Thompson, J. (1973). Foundation of Vocational Education: Social & philosophical
concepts. Englewood Cliffs NJ: Prentice Hall.
Tum, P. (1996). Education Trends in Kenya a vocational Perspective. Nairobi. Jomo
Kenyatta Foundation.
UNESCO. (1990). Trends & development of Technical & Vocational education. Paris:
UNESCO (Trends & issues in tech & vocational education, 5.)
UNESCO. (1984) Terminology of Tech &Vocational education. Paris: UNESCO.
UNESCO-UNEVOC. (1996). Trends & development of technical & vocational
education:
Modalities & experiences Berlin: UNESCO-UNEVOC.
World Bank. (1991). Vocational and Technical Education and Training: A World Bank
60
policy paper. World Bank. Washington.
World Bank. (2002). Constructing Knowledge Societies: New Challenges for Tertiary
Education. World Bank. Washington.
World Bank. (2006). World Bank Development Report 2007: Development and the next
generation. World Bank. Washington.
World Bank. (2009). Youth Unemployment PPP Skills Development Programme. World
Bank. Washington DC.
http://www.unevoc.unesco.org/fileadmin/user_upload/docs/CS1_SIMIYU_formatted_fi
nal.pdf
http://schoklandtvet.pbworks.com/f/Microsoft%2BWord%2B-
%2BMapping%2Breport%2Bfinal-Nyerere%2Bmrt%2B09%2Bhp%2B2.pdf
http://scholar.google.com/scholar?hl=en&q=youth+polytechnics+research%2C+literature
+review++samples+kenya&btnG=&as_sdt=1%2C5
http://scholar.google.com/scholar?hl=en&q=youth+polytechnics+research%2C+literature
+review++samples+kenya&btnG=&as_sdt=1%2C5
http://scholar.google.com/scholar?hl=en&q=youth+polytechnics+research%2C+literature
+review++samples+kenya&btnG=&as_sdt=1%2C5
http://www.kmafrica.com/group.social.challenges.Technical.vocational.education.and.tra
ining.in.Africa

61
file:///C:/Documents%20and%20Settings/Administrator/Desktop/tvet-in-the-21st-
century.htm
file:///C:/Documents%20and%20Settings/Administrator/Desktop/german-vocational-
training-model-offers-alternative-path-to-youth.htm
file:///C:/Documents%20and%20Settings/Administrator/Desktop/Vocational-Technical-
Education-INTERNATIONAL-CONTEXT.html

62
Appendix I
LETTER OF INTRODUCTION
University of Nairobi
Department of Education Foundations
P. O. Box 92,
KIKUYU
13th
April 2013.
The District Youth Training Officer,
Nyeri Zone,
Dear Sir/Madam
REQUEST TO CONDUCT RESEARCH IN NYERI MUNICIPALITY
I am a final year M. Ed student at the University of Nairobi. My area of specialization is
Adult Education. I am currently undertaking research study on factors that contribute to
low enrolment in Youth Polytechnics in Nyeri Zone of Nyeri South, Nyeri County-
Kenya.
I would be grateful if you allowed me to collect the relevant data necessary for the
completion of my project. All the information provided will be treated with utmost
confidence. A copy of the final report will be made available to you on request. Your
timely response will be highly appreciated.
Yours Faithfully,
Muriithi Scolastica Wangeci

63
Appendix II
Work Schedule
Sep
Oct
Nov
Dec
Jan
Feb
Mar
Apr
May
Jun
Jul
Aug
Proposal Writing
Preparation of proposal
and defending
Pilot study, actual
field work and
data collection
Analysis and report
writing
Submission of 1st draft,
corrections and final
submission
Graduation

64
APPENDIX III
Research Expenditure Budget
SERIAL
NO.
ACTIVITY TOTAL
A. Stationary
Writing Materials 9,000/=
B.
Secretarial Services
Photocopying
Binding
15,000/=
C.
Field Work
Subsistence
Travelling
Piloting
Consultation
Data collection expenses
15,000/=
D.
Report Writing
Data Analysis
8,000/=
Typing and printing of the final Report
8,000/=
Binding Services of the Final Report
4,000/=
Miscellaneous
6,000/=
26,000/=
TOTAL 65,000/=

65
APPENDIX IV
Questionnaire for a Youth in Class
Please respond to the questions as accurately, completely and as honestly as possible
and tick ( ) one response in the space or explain briefly in the blank space.
Section A: Demographic information
1. What is your gender? Male ( ) Female ( )
2. What is your age in years? Below 18 ( ), Between18 and 20 ( ), Between21 and
25 ( ), Above25 ( )
3. Indicate your education level. Below KCPE ( ), KCPE ( ), KCSE ( ), Above KCSE
( )
4. What is your marital status? Single ( ), Married ( )
Section B: General information
1. Who told you about this polytechnic? A friend ( ), The manager ( ), My parent ( ),
The Ass Chief ( ), A former teacher ( )
2. What course are you taking
__________________________________________________________
3. Why did you choose this course? Most youth are doing it ( ), It is easy ( ), It has
many job opportunities ( )
4. How much fees does a) a student pay per year? _____________________
b) the government pay per year? ___________________
5. a) Do you know of youths who should be enroled in youth polytechnics but are not?
66
Yes ( ) No ( )
b) If yes, what reasons do they give for not enroling?
Please rate your answer as: 1. Very many 2. Many 3. Few 4. Very few
i) Negative attitude towards YPs: (1) (2) (3) (4)
ii) Graduates do not look successful: (1), (2), (3), (4).
iii) High fees: (1), (2), (3), (4).
iv) Polytechnic education is of low standard: ( 1 ), ( 2 ), ( 3 ), ( 4 ).
v) Not being aware of courses offered: ( 1 ), ( 2 ), ( 3 ), ( 4 ).
vi) Jobs after training are “dirty jobs”: ( 1 ), ( 2 ), ( 3 ), ( 4 ).
vi) Jobs after training are not well paying: ( 1 ), ( 2 ), ( 3 ), ( 4 ).
vii) Do not think certificates attained in YPs are important: ( 1 ), ( 2 ), ( 3 ),( 4 )
viii) Polytechnics are for failures: ( 1 ), ( 2 ), ( 3 ), ( 4 ).
ix) Friends would laugh at them: ( 1 ), ( 2 ), ( 3 ),( 4 ).
x) They do not know of the possibility of higher training i.e. Certificate, Diploma, and
Degree in skills learnt in YPs: ( 1 ) ( 2 ), ( 3 ), ( 4 ).
6. Which other activities are found in youth polytechnics?
Rate them as 1.Often 2.Rarely 3.Never.
a) Games and athletics: ( 1 ) ,( 2 ), ( 3 ).
b) Drama and music festivals: ( 1 ),( 2 ), ( 3 )
c) Tours: ( 1 ), ( 2 ), ( 3 ).

67
d) Swimming ( 1 ) ( 2 ) ( 3 ).
7. What would you like improved in polytechnics education to attract more youth?
a_________________________________________________________________
b_________________________________________________________________
THANK YOU

68
APPENDIX V
Questionnaire for a Youth Dropout
Please respond to the questions as accurately, completely and as honestly as possible
by ticking one response in the space ( ), or explaining briefly in the blank space.
Section A: Demographic information
1. What is your gender? Male ( ) Female ( )
2. What is your age in years? Below 18 ( ), Between18 and 20 ( ), Between21 and
25 ( ), Above25 ( )
3. Indicate your education level. Below KCPE ( ), KCPE ( ), KCSE ( ), Above KCSE
( )
4. What is your marital status? Single ( ), Married ( )
Section B: General Information
1. Which is the year that you joined the polytechnic? ______________________
2. Which are the main reasons that you joined the polytechnic?
a) To obey parents YES ( ) NO ( )
b) To join friends YES ( ) NO ( )
c) To get a course YES ( ) NO ( )
d) I could not continue schooling YES ( ) NO ( )
e) Other reasons:_____________________________________________________
3. a) How much fees were you paying per year? _____________________________
b) What was it used for? i) Lunch YES ( ) NO ( )
69
ii) Paying teachers YES ( ) NO ( )
iii) I do not know YES ( )
4. How much fees was the government paying for each student? _____________
5. Which is the year that you dropped out of polytechnic? __________________
6. Which are the main reasons for dropping out?
a) It was boring YES ( ) NO ( )
b) Lack of fees YES ( ) NO ( )
c) Those that have finished have no employment. YES ( ) NO ( )
d) I did not find a course I liked. YES ( ) NO ( )
e) Friends at home discouraged me. YES ( ) NO ( )
f) Other reasons:_________________________________________________________
7. Do you think a polytechnic certificate is important for employment? YES ( ) NO ( )
a) If YES, would you like go back to the polytechnic? YES ( ) NO ( )
b) If NO, explain briefly
________________________________________________________________________
8. Did you know that by getting a polytechnic certificate one can go for diploma course
and then a degree in the university? YES ( ) NO ( )
9. Do you think that youth polytechnic education is for failures? YES ( ) NO ( )
10. Would you encourage other youth to join the polytechnic? YES ( ) NO ( )
THANK YOU

70
APPENDIX VI
Questionnaire for YP Managers
Please respond to the questions as accurately, completely and as honestly as possible
by ticking one response in the space ( ), or explaining briefly in the blank space.
Section A: Demographic information
1. What is your gender? Male ( ) Female ( )
2. What is your age in years? ____________________________
3. Indicate your education level. Below KCSE ( ), Above KCSE ( )
4. What is your marital status? Single ( ), Married ( )
5. What is your professional training?
i) __________________________________________________
ii) _________________________________________________
iii) __________________________________________________
Section B: General Information
1. For how long have you been a manager of a YP? _________________________
2. The biggest number of students you have ever enrolled is______________ at
______________________ polytechnic.
3. What was/is the capacity of the polytechnic? __________ students.
4. For how long have you been in this institution? _________________.
5. What is the capacity for your present polytechnic (if different from 4 above)? _____
Students.

71
6. Please give the following information rating it as: 1. None 2. Needs improvement.
3. Fairly good. 4. Good 5.Very Good
a) Infrastructure
1. Office ( 1 ) ( 2 ) ( 3 ) ( 4 ) ( 5 )
2. Classrooms ( 1 ) ( 2 ) ( 3 ) ( 4 ) ( 5 )
3. Kitchen ( 1 ) ( 2 ) ( 3 ) ( 4 ) ( 5 )
4. Furniture ( 1 ) ( 2 ) ( 3 ) ( 4 ) ( 5 )
5. Water ( 1 ) ( 2 ) ( 3 ) ( 4 ) ( 5 )
6. Electricity ( 1 ) ( 2 ) ( 3 ) ( 4 ) ( 5 )
b)Number of instructors in the institution ( 1 ) ( 2 ) ( 3 ) ( 4 ) ( 5 )
c) Number of non-teaching staff ( 1 ) ( 2 ) ( 3 ) ( 4 ) ( 5 )
d) Availability of learning materials for different courses
1. Motor Vehicle Technology ( 1 ) ( 2 ) ( 3 ) ( 4 ) ( 5 )
2. Appropriate Carpentry and Joinery ( 1 ) ( 2 ) ( 3 ) ( 4 ) ( 5 )
3. Fashion Design & Garment Making ( 1 ) ( 2 ) ( 3 ) ( 4 ) ( 5 )
4. Building Technology ( 1 ) ( 2 ) ( 3 ) ( 4 ) ( 5 )
5. Metal Processing Technology ( 1 ) ( 2 ) ( 3 ) ( 4 ) ( 5 )
6. Hair Dressing and Beauty Therapy ( 1 ) ( 2 ) ( 3 ) ( 4 ) ( 5 )
7. Information and Communication Technology ( 1 ) ( 2 ) ( 3 ) ( 4 ) ( 5)
8.Entrepreneurship ( 1 ) ( 2 ) ( 3 ) ( 4 ) ( 5 )

72
9. Communication Skills ( 1 ) ( 2 ) ( 3 ) ( 4 ) ( 5 )
10. Life Skills ( 1 ) ( 2 ) ( 3 ) ( 4 ) ( 5 )
11. Agriculture ( 1 ) ( 2 ) ( 3 ) ( 4 ) ( 5 )
12. Plumbing Technology ( 1 ) ( 2 ) ( 3 ) ( 4 ) ( 5 )
e) What are the qualifications of the instructors?
Academic qualification Number
i) KSES (Untrained) ______________
ii) Certificate ______________
iii) Diploma ______________
iv) Degree ______________
v) Others (Specify) ______________
Total ______________
7. Are there some courses that are compulsory?
YES ( ) Explain
________________________________________________________________________
NO ( ) Explain
________________________________________________________________________
8. Does the local community support the institution?
YES ( )

73
(Give evidence)
________________________________________________________________________
________________________________________________________________________
NO ( )
(Give evidence).
________________________________________________________________________
_______________________________________________________________________
9. a) How much is the government subsidy per student per year? ___________________
b) What are the vote heads for it?
Vote head Amount
i) _________________________________________ ________________________
ii) ________________________________________ ________________________
iii) ________________________________________ ________________________
iv) ________________________________________ ________________________
v) _________________________________________ ________________________
10. a) How much does each student pay per year? _____________________
b) List the uses of that money.
Vote head Amount
i) _________________________________________ ____________________

74
ii) _________________________________________ ____________________
iii) _________________________________________ ____________________
11. How do you market your institution?
Please use the following rater to give the information required.
1. Never 2.Sometimes 3.Often 4.Mostly
i) By addressing people in meetings, churches and barazas ( 1 ) ( 2 ) ( 3 ) ( 4 )
ii) By seeking audience in education meetings ( 1 ) ( 2 ) ( 3 ) ( 4 )
iii) By visiting schools in the neighbourhood ( 1 ) ( 2 ) ( 3 ) ( 4 )
iv) By distributing brochures ( 1 ) ( 2 ) ( 3 ) ( 4 )
v) By sending invitation letters to lists of possible students of neighbouring schools
( 1 ) (2 ) ( 3 ) ( 4 )
vi) By inviting people for open days ( 1 ) ( 2 ) ( 3 ) ( 4 )
12.a) List the extra-curricular activities that students engage in.
i) __________________________________________
ii) __________________________________________
iii) __________________________________________
iv) __________________________________________
b) List other extra-curricular activities you think would attract more youth to the
polytechnics.

75
i) __________________________________________
ii) __________________________________________
iii) __________________________________________
iv) __________________________________________
13. How do you think the enrolment could be improved?
________________________________________________________________________
________________________________________________________________________
________________________________________________________________________
________________________________________________________________________
________________________________________________________________________
________________________________________________________________________
________________________________________________________________________
THANK YOU

76
APPENDIX VII
Questionnaire for teachers
Please respond to the questions as accurately, completely and as honestly as possible
by ticking one response in the space ( ) or explaining briefly in the blank space.
Section A: Demographic information
1. What is your gender? Male ( ) Female ( )
2. What is your age in years? ____________________________
3. Indicate your education level. Below KCSE ( ), Above KCSE ( )
4. What is your marital status? Single ( ), Married ( )
5. What is your professional training?
1.__________________________________________________
2.__________________________________________________
3.__________________________________________________
Section B: General Information
1. For how long have you been an instructor of a YP? _________________________
2. The biggest number of students you have ever handled in a class is______________
at ______________________ polytechnic.
3. What was the capacity of the class? _____________ students.
4. What is your area of specialization? ____________________________________
5 a) For how long have you been in this institution? _________________

77
b) Has the enrolment been i) improving? YES ( ) ( )
ii) Stagnant? YES ( ) NO ( )
iii) Reducing? YES ( ) NO ( )
6. Please give the following information about this institution rating it as: 1. None 2.
Needs improvement. 3. Fairly good. 4. Good 5.Very Good
a) Infrastructure
1. Office ( 1 ) ( 2 ) ( 3 ) ( 4 ) ( 5 )
2. Classrooms ( 1 ) ( 2 ) ( 3 ) ( 4 ) ( 5 )
3. Kitchen ( 1 ) ( 2 ) ( 3 ) ( 4 ) ( 5 )
4. Furniture ( 1 ) ( 2 ) ( 3 ) ( 4 ) ( 5 )
5. Water ( 1 ) ( 2 ) ( 3 ) ( 4 ) ( 5 )
6. Electricity ( 1 ) ( 2 ) ( 3 ) ( 4 ) ( 5 )
b) Availability of learning materials for different courses
1. Motor Vehicle Technology ( 1 ) ( 2 ) ( 3 ) ( 4 )( 5 )
2. Appropriate Carpentry and Joinery ( 1 ) ( 2 ) ( 3 ) ( 4 ) ( 5 )
3. Fashion Design & Garment Making ( 1 ) ( 2 ) ( 3 ) ( 4 ) ( 5 )
4. Building Technology ( 1 ) ( 2 ) ( 3 ) ( 4 ) ( 5 )
5. Metal Processing Technology ( 1 ) ( 2 ) ( 3 ) ( 4 ) ( 5 )

78
6. Hair Dressing and Beauty Therapy ( 1 ) ( 2 ) ( 3 ) ( 4 ) ( 5 )
7. Information and Communication Technology ( 1 ) ( 2 ) ( 3 ) ( 4 ) ( 5 )
8.Entrepreneurship ( 1 ) ( 2 ) ( 3 ) ( 4 ) ( 5 )
9. Communication Skills ( 1 ) ( 2 ) ( 3 ) ( 4 ) ( 5 )
10. Life Skills ( 1 ) ( 2 ) ( 3 ) ( 4 ) ( 5 )
11. Agriculture ( 1 ) ( 2 ) ( 3 ) ( 4 ) ( 5 )
12. Plumbing Technology ( 1 ) ( 2 ) ( 3 )
7. Is there a course you wish was offered in your YP?
YES ( ) Explain__________________________________________
__________________________________________
__________________________________________
NO ( ) Explain___________________________________________
8. How would your previous institution compare to the present one?
i) Better ( ).
Explain_________________________________________________________________
________________________________________________________________________
________________________________________________________________________
________________________________________________________________________
_________________________
ii) Worse ( ).
Explain_________________________________________________________________
________________________________________________________________________

79
________________________________________________________________________
________________________________________________________________________
_________________________
9. Give factors contributing to low enrolment given below in your opinion as
1. Very many 2. Many 3.Few 4. Very few
i) Negative attitude towards YPs: (1) (2) (3) (4)
ii) Graduates do not portray success: (1) (2) (3) (4)
iii) High fees: (1) (2) (3) (4)
iv) Polytechnic education is of low standard: ( 1 ), ( 2 ), ( 3 ), ( 4 ).
v) Not being aware of courses offered: ( 1 ), ( 2 ), ( 3 ), ( 4 ).
vi) Jobs after training are “dirty jobs”: ( 1 ), ( 2 ), ( 3 ), ( 4 ).
vi) Jobs after training are not well paying: ( 1 ), ( 2 ), ( 3 ), ( 4 ).
vii) Do not value certificates attained in YPs: ( 1 ), ( 2 ), ( 3 ),( 4 )
viii) They do not know of the possibility of higher training i.e. Certificate, Diploma, and
Degree in skills learnt in YPs :( 1 ) ( 2 ), ( 3 ), ( 4 ).
ix) Polytechnics are for failures: Very many ( 1 ), ( 2 ), ( 3 ), ( 4 ).
x) Peers would laugh at them: Very many ( 1 ), ( 2 ), ( 3 ),( 4 ).
10. Which other activities are found in youth polytechnics?
Rate them as 1.Often 2.Rarely 3.Never.
a) Games and athletics: ( 1 ) ,( 2 ), ( 3 ).
b) Drama and music festivals: Often ( 1 ),( 2 ), ( 3 ).

80
c) Tours: ( 1),( 2 ),( 3 ).
11. What would you like improved in polytechnics education to attract more youth?
a_________________________________________________________________
b_________________________________________________________________
c_________________________________________________________________
d_______________________________________________________________
THANK YOU

81
APPENDIX VIII
Questionnaire for Area Administrators
Please respond to the questions as accurately, completely and as honestly as possible
by ticking one response in the space ( ) or explaining briefly in the blank space.
Section A: Demographic information
1. What is your gender? Male ( ) Female ( )
2. What is your age in years? ____________________________
3. Indicate your education level. Below KCSE ( ), KCSE (O LEVEL) ( ), Above
KCSE
(A LEVEL) ( ).
4. What is your marital status? Single ( ), Married ( )
5. What is your professional training?
i) ________________________________________________
ii) _________________________________________________
iii) ________________________________________________
Section B : General information about the institution
1. For how long have you been working in this area? _______________
2. Are you involved in the running of the area YP? YES ( ), NO ( )
If YES, explain

82
______________________________________________________________________
3. How would you rate the enrolment in this institution, HIGH ( ) LOW ( )
4. What reason would you attribute the low enrolment to?
Please answer ticking your responses as 1. Mainly 2. Moderately 3. To a small
extent 4. To a negligible
extent
i) Negative attitude towards YPs by both parents and youths: (1) ( 2 ) ( 3 ) ( 4 )
ii) Graduates do not portray success: ( 1 ) ( 2 ) ( 3 ) ( 4 )
iii) High fees: ( 1 ) ( 2 ) ( 3 ) ( 4 )
iv) Polytechnic education is of low standard: ( 1 ), ( 2 ), ( 3 ), ( 4 ).
v) Not being aware of courses offered: ( 1 ), ( 2 ), ( 3 ), ( 3 ).
vi) Jobs after training are “dirty jobs”: ( 1 ), ( 2 ), ( 3 ), ( 4 ).
vi) Jobs after training are not well paying: ( 1 ), ( 2 ), ( 3 ), ( 4 ).
vii) Do not value certificates attained in YPs: ( 1 ), ( 2 ), ( 3 ),( 4 )
viii) They do not know of the possibility of higher training i.e. Certificate, Diploma, and
Degree in skills learnt in YPs :( 1 ) ( 2 ), ( 3 ), ( 4 ).
ix) Polytechnics are for failures: ( 1 ), ( 2 ), ( 3 ), ( 4 ).
x) Peers would laugh at them: ( 1 ), ( 2 ), ( 3 ),( 4 ).
6. Is polytechnic education discussed in your higher offices? ( 1 ) ( 2 ) ( 3 ) ( 4 )
7. Education in youth polytechnics reduces criminal activity in the society: ( 1 ) ( 2 ) ( 3 )
( 4 )

83
8. Skills from youth polytechnics increases chances of employment: ( 1 ), ( 2 ), ( 3 ), ( 4 )
9. How would you rate the success in marketing YP education by the following people?
i) Polytechnic managers: ( 1 ), ( 2 ), ( 3 ), ( 4 )
ii) Instructors of polytechnics ( 1 ), ( 2 ), ( 3 ) , ( 4 )
iii) Heads of primary and secondary schools: ( 1 ), ( 2 ),( 3 ),( 4 )
iv) Area administrators: ( 1 ), ( 2 ),( 3 ),( 4 )
10. How can enrolment in YPs be improved?
________________________________________________________________________
________________________________________________________________________
________________________________________________________________________
________________________________________________________________________
THE END
THANK YOU

84
APPENDIX IX
Observation Checklist
CENTER CODE ________________________
DATE ________________________
(a)Physical Facilities
FACILITY REQUIRED AVAILABLE BALANCE
NUMBER CONDITION
CLASSROOMS
LIBRARY
TOILETS
CHALKBOARDS
OFFICES
PLAYFIELDS
WORKSHOPS
(b)Teaching Resources
RESOURCE REQUIRED AVAILABLE BALANCE
NUMBER CONDITION
TEACHING AIDS
TEXT BOOKS
EXERCISE BOOKS
CHALK
TEACHING CHARTS
COMPUTERS
WORKSHOP
EQUIPMENTS