municipal solid waste characterization study - state of indiana
TRANSCRIPT
MAY 25, 2012

ii
Contact Information:
Professor Harvey Abramowitz
Department of Mechanical Engineering
Purdue University Calumet
Hammond, IN 46323-2094
(219) 989-2473 office
(219) 989-2898 fax
e-mail: [email protected]
WWW.PURDUECAL.EDU
iii
EXECUTIVE SUMMARY
The Indiana Recycling Market Development Board commissioned a statewide municipal
solid waste (MSW) characterization study. This is the first field study to characterize the
composition of MSW going into Indiana landfills. The objectives included: (1) develop a
reliable statewide characterization of MSW received for disposal at Indiana MSW
facilities; (2) compare Indiana findings to other state and national results; and (3)
estimate the types and quantities of potentially recoverable and compostable materials
in the Indiana MSW stream. The study also was structured to provide an educational
opportunity for Purdue students in solid waste management and performing data
collection and research.
Field sorts were conducted at a number of Indiana MSW facilities during parts of three
seasons of 2008 and 2009. When selecting the participating facilities, attention was
given to both geographic and demographic diversity and disposal facility and size. The
selected facilities represented urban, suburban and rural service areas. The sort data
used for analysis came from the Newton County Landfill (urban), Bartholomew County
Landfill (suburban), the Daviess County Landfill (rural) and the Adams County Transfer
Station (rural). For each site, a minimum of 20 samples from Indiana origins, each
ranging in weight from 210 to 250 pounds, was sorted. It is assumed that the majority of
samples collected was from residential sectors; however, it is acknowledged that some
commercial and institutional waste could have been included. To provide the samples,
a random grab sampling technique proved to be the most efficient method for this
project. The waste materials were classified into 49 different categories. These fell into
the following 16 major categories: paper, plastic, metal, glass, yard waste, food waste,
wood, demolition and construction debris, durables, textiles and leather, diapers,
rubber, household hazardous materials, sharps, fines and other.
The overall MSW composition from Indiana origins for disposal at Indiana landfills and
incinerator is estimated as follows, to the nearest percent: Paper – 29; Plastic – 17;

iv
Metal – 6; Glass – 3; Yard Waste – 7; Food Waste – 10; Wood – 7; Demolition and
Construction Debris – 5; Durables – 4; Textiles & Leather – 6; Diapers – 3; Rubbers – 1;
Household Hazardous Materials – 1; Sharps – 0; Fines – 2; Other – 1. This average
composition was then compared to the results from other state sorts and to the national
average. States used for comparison were: IL, IA, PA, WI, MN, CA, GA and DE. A
comparison was made for the following components: paper, plastic, metal, glass, wood,
organics, inorganics, and special waste (e.g, bulky items and tires).
The analysis showed that Indiana has the highest percentage of plastic (16.7)
compared to the average of 13.3. It has the lowest percentages of special waste (1.7)
compared to the average of 2.6; and inorganics (8.9) compared to the average of 11.5.
Indiana is in the middle range of all nine states for paper, metal, glass, wood and
organics. Using the national average composition provided by the EPA, Indiana has a
higher percentage for paper and paperboard (29.1 vs. 20.7); and miscellaneous
inorganic wastes (15.4 vs. 2.3). The percentages for Indiana are lower for glass (2.9
vs. 5.6); ferrous metal (4.7 vs.6.2); aluminum (0.8 vs. 1.6); total metal (6.0 vs. 8.1);
textiles (5.7 vs. 6.3); wood (6.8 vs. 8.9); and food scraps (9.9 vs. 18.6).
The greatest opportunities for source reduction and recycling in the MSW stream are
OCC (634,150 tons, 10.6%), mixed recyclable paper (73,954 tons, 1.2%), and
film/wrap/bags (306,032 tons, 5.1%). Food waste (591,557 tons, 9.9%), and
compostable paper (269,540 tons, 4.5%) also have source reduction and recycling
opportunities through composting.
In conclusion, the first study of MSW characterization for Indiana was successfully
completed. The methodology for sampling and data analysis was similar to other state
waste characterization studies and gave comparable results.
The following is recommended: (1) To have a more reliable MSW composition
determination, more sites should be sampled. (2) To facilitate more sampling sites,
better cooperation of the landfills, both public and private, in the state is necessary. (3)

v
To further disseminate the results, add the information found in this study to the IN map
project.

vi
ACKNOWLEDGMENTS
The authors would like to thank the Indiana Recycling Market Development Board
(initially the Indiana Recycling and Energy Development Board) for funding this work
and the Indiana Department of Environmental Management (IDEM) for overseeing the
project.
Special thanks to the staff of the Office of Compliance Support, Office of Planning and
Assessment (initially the Office of Pollution Prevention and Technical Assistance,
Source Reduction and Recycling Branch) and other IDEM Offices for their continuous
support:
Ms. Monica Hartke-Tarr, Chief, Planning and Assessment Branch (OPA);
Ms. Pam Koons, Program Manager, OPA;
Mr. Tom Leas, Program Engineer, OPA; and
Ms. Megan Murray, Environmental Manager, OPA; and
Ms. Michelle Weddle, IDEM, Senior Environmental Manager
We could not have done this work without the involvement and cooperation of those
who operate and are responsible for the landfills, and transfer stations that we sampled.
Credit for allowing us onto the waste sites goes to:
Mr. Hank Mayer, Adams County Solid Waste Management District;
Mr. Jim Murray, Bartholomew County Landfill;
Mayor Larry Haag, Washington, Indiana;
Mr. Lee Spaulding, Daviess County Landfill
Mr. Tony Schroeder, General Manager Indiana District Landfills, Allied Waste
Newton County Landfill

vii
We thank Mr. Lance Hodge, former Executive Director of the Association of Indiana
Solid Waste Management Districts (AISWMD); Mr. Steve Christman, Executive Director,
Northeast Indiana Solid Waste District; and Mr. Jeffrey Miller, Indiana Recycling
Coalition, for introducing us to many involved in solid waste issues in Indiana.
Thanks also to Prof. Debra Reinhart, University of Central Florida, for providing some
expert advice.
This topic was the basis for a MS thesis written by one of the authors (Yu Sun). She
would like to thank Drs. Chenn Q. Zhou and Bipin K. Pai for serving on her thesis
advisory committee.
Finally, the PI (Harvey Abramowitz) wishes to thank the exceptional student research
group:
Ms. Anna Stariha, Ms. Deanna Miskimins, Mr. Mark Arciaga, Ms. Yu Sun,
Ms. Dayin Zhang, Mr. Weizhuo Zhao, Mr. Huasheng Zhou, Mr. Xiangyu Gao,
Ms. Heather Wontor, Ms. Euna Choi, Mr. Adam Korman, Mr. Yandong Tang and
Mr. Ivan Garcia. The group consisted of both undergraduates and graduates majoring
in Biology, Chemistry, Mechanical Engineering, Electrical Engineering, and
Mathematics. It was truly an international mix of students. Due to their dedication, hard
work, and teamwork, the project was able to be completed.
We were fortunate that the state saw fit to hire a university to perform the study. This
enabled the students to gain firsthand knowledge and experiences about the municipal
solid waste issue facing Indiana. This knowledge and experience have been brought
back to the school (Purdue University Calumet) in a multitude of ways, including the first
ever solid waste sort on the campus at the end of 2010, to help evaluate the new
recycling program.

viii
TABLE OF CONTENTS
ACKNOWLEDGMENTS ..................................................................................................vi TABLE OF CONTENTS ................................................................................................ viii LIST OF TABLES ............................................................................................................ix LIST OF FIGURES .......................................................................................................... x GLOSSARY ....................................................................................................................xi ABSTRACT .................................................................................................................... xii CHAPTER 1. INTRODUCTION ....................................................................................... 1
1.1. Background ................................................................................................... 1
1.2. Study Objectives ........................................................................................... 1 1.3. Participating Facilities .................................................................................... 1
CHAPTER 2. STUDY ELEMENTS .................................................................................. 3 2.1. Introduction .................................................................................................... 3 2.2. Literature Review .......................................................................................... 3
2.3. Model Development....................................................................................... 4 2.4. Characterization for Sites Sampled ............................................................... 5
2.5. Characterization for Non-participating Waste Facilities ............................... 15 2.6. Potential for Increased Recycling ................................................................ 16 2.7. Documentation ............................................................................................ 16
2.8. Presentation ................................................................................................ 16
CHAPTER 3. STUDY RESULTS .................................................................................. 23
3.1. Overview ..................................................................................................... 23 3.2. Statistical Measures .................................................................................... 24
3.3. Participating Facilities .................................................................................. 25 3.4. Non-participating Facility ............................................................................. 27 3.5. MSW Imports to Indiana .............................................................................. 37
3.6. Statewide ..................................................................................................... 40 CHAPTER 4. COMPARISON AND DIVERSION OPPORTUNITIES ............................ 46
4.1. Introduction .................................................................................................. 46 4.2. Study Comparison for Urban/Suburban/Rural ............................................. 47 4.3. Study Comparison with Other States........................................................... 50
4.4. Study Comparison with National Results ..................................................... 55 4.5. Recycling Opportunities ............................................................................... 57
4.6. Conclusions ................................................................................................. 58 4.7. Recommendations....................................................................................... 58
REFERENCES .............................................................................................................. 60 Appendix A. Waste Sort Categories ................................................................... 62 Appendix B. Questions for Landfill Operator ...................................................... 66 Appendix C. Detailed Results ............................................................................. 68 Appendix D. Data for All Waste Sorts ................................................................. 88 Appendix E. Description of Calculation and Statistical Procedures .................. 152

ix
LIST OF TABLES
Table Page
Table 1-1 Participating Facilities …………… 2
Table 2-1 Comparison of MSW Studies Conducted by Various States
…………… 4
Table 2-2 Sort Categories for the Indiana MSW Characterization Study
…………… 6
Table 2-3 Sorting Events for Participating Facilities …………… 9
Table 3-1 Bartholomew County Landfill …………… 25
Table 3-2 Adams County Transfer Station …………… 26
Table 3-3 Newton County Landfill …………… 26
Table 3-4 Daviess County Landfill …………… 27
Table 3-5 MSW Composition from Different IN Origins …………… 28
Table 3-6 MSW Disposal Facilities in IN …………… 34
Table 3-7 Annual Disposal of MSW at Indiana Landfills and Incinerators by Origin, 2008 (Tons)
…………… 35
Table 3-8 Annual Disposal of MSW at IN Landfills and Incinerators by Origin 2008
…………… 37
Table 3-9 Estimated Composition of MSW Imports to IN …………… 37
Table 3-10 Overall IN MSW Composition (Includes imports) …………… 42
Table 3-11 Statewide MSW Composition (IN Waste) excludes imports
…………… 44
Table 4-1 MSW Composition Comparison for U/S/R …………… 47
Table 4-2 Comparison Between IN and National Results - 1 …………… 56
Table C-1 Bartholomew County Landfill (detailed results) …………… 68
Table C-2 Adams County Transfer Station (detailed results) …………… 71
Table C-3 Newton County Landfill (detailed results) …………… 74
Table C-4 Daviess County Landfill (detailed results) …………… 77
Table C-5 Statewide MSW Annual Tonnage for Different Origins …………… 80
Table C-6 Statewide MSW Annual Tonnage Imported to Indiana …………… 83
Table C-7 Comparison of IN Results with Other States (%) …………… 86
Table D-1 Bartholomew County Landfill Data …………… 88
Table D-2 Adams County Transfer Station Data …………… 104
Table D-3 Newton County Landfill Data …………… 120
Table D-4 Daviess County Landfill Data …………… 136

x
LIST OF FIGURES
Figure ........................................................................................................................ Page
Figure 2-1 Location of Participating Facilities .................................................................. 9 Figure 2-2 Waste Hauler Truck Unloading .................................................................... 17
Figure 2-3 Waste Piles as an Elongated Mound ........................................................... 17 Figure 2-4 Predetermined Section taken from the Elongated Mound ............................ 18
Figure 2-5 Front End Loader Bringing Waste to the Tarp ............................................. 18 Figure 2-6 Garbage Bags & Loose Garbage are Randomly Picked Out from the Pile .. 19
Figure 2-7 Some of Forty Nine Plastic Totes................................................................. 19 Figure 2-8 Working Area ............................................................................................... 20 Figure 2-9 Custom-made Sorting Grids ........................................................................ 20
Figure 2-10 Sorting a Grab Sample .............................................................................. 21 Figure 2-11 Balance (OHAUS, 5000 Series, Xtreme W) ............................................... 21
Figure 3-1 Landfill Map of IN ......................................................................................... 31 Figure 3-2 IN Municipal Solid Waste, Non-Municipal Solid Waste and Restricted Waste Site ................................................................................................................................ 33
Figure 3-3 Overall MSW Composition for the State of IN (includes imports) ................. 41
Figure 4-1 State Comparison of Percentage for Paper Component .............................. 50 Figure 4-2 State Comparison of Percentage for Plastic Component ............................. 51 Figure 4-3 State Comparison of Percentage for Metal Component ............................... 51
Figure 4-4 State Comparison of Percentage for Glass Component .............................. 52 Figure 4-5 State Comparison of Percentage for Wood Component .............................. 52 Figure 4-6 State Comparison of Percentage for Organic Component ........................... 53
Figure 4-7 State Comparison of Percentage for Inorganic Component ......................... 53
Figure 4-8 State Comparison of Percentage for Special* Component ........................... 54
.
xi
GLOSSARY
90% Confidence Interval – represents that there is a 90% level of confidence that
the true mean for the overall population falls within the upper and lower bounds of
the confidence interval (R.W. Beck, Inc., 2006).
Confidence Interval – the upper and lower limits of the “actual” mean for the overall
population (R.W. Beck, Inc., 2006).
Indiana Origin – refers to Indiana waste that comes solely from Indiana. The waste
from trucks specifically designated by the landfill/transfer station operators as
carrying and unloading only waste loaded from Indiana pickup sites. Waste from
Indiana Origin does not include imported waste from other states.
Mean – the mathematical average or average percent of material composing the
MSW stream by weight (R.W. Beck, Inc., 2006).
Municipal Solid Waste (MSW) – garbage, refuse and other solid waste from
commercial, industrial and community activities that the generator of the waste
aggregates for collection. MSW does not include auto hulks, street sweepings, ash,
dedicated construction debris, mining waste, sludges, agricultural wastes, and other
materials collected, processed and disposed of as separate waste streams (R.W.
Beck, Inc., 2006).

xii
ABSTRACT
The Indiana Recycling Market Development Board, commissioned the completion of a
statewide municipal solid waste (MSW) characterization study for Indiana. MSW
facilities were sampled mainly during Spring and Fall seasons. The study was divided
into seven steps: literature review, model development, characterization for sites
sampled, characterization for non-participating waste facilities, potential for increased
recycling, documentation and presentation. The following results were obtained: MSW
composition for four participating facilities, MSW composition for non-participating
facilities, overall MSW composition for different sector origins, and overall composition
of MSW disposed at Indiana waste facilities as received from in-state origins and from
in-state/import origins. A comparison between Indiana, other states and national results
was made. Based on the composition results and comparison, opportunity for source
reduction and recycling was found, especially for paper and plastic.

1
CHAPTER 1. INTRODUCTION
1.1. Background
This chapter describes the relevant background for the study, characterizes the
objectives of the Municipal Solid Waste Characterization Study for Indiana, and
identifies the participating municipal solid waste facilities in Indiana. The Indiana
Recycling Market Development Board commissioned the completion of a statewide
municipal solid waste characterization study (Indiana Department of Environmental
Management, 2006). This is the first field study to characterize the composition of MSW
going into Indiana landfills and included waste sorts over three seasons at five Indiana
MSW facilities.
1.2. Study Objectives
The objectives of the study were to:
1. Develop a reliable statewide characterization of Municipal Solid Waste (MSW)
received for disposal at Indiana MSW facilities.
2. Compare Indiana results to other state and national results.
3. Estimate the types and quantities of potentially recoverable and compostable
materials in the Indiana MSW stream.
1.3. Participating Facilities
To accomplish the objectives described above, during parts of three seasons, field sorts
were conducted at five Indiana MSW facilities. When selecting the participating facility,
attention was given to both geographic and demographic diversity, and disposal facility
and size. The selected MSW facilities represented urban, suburban and rural service
areas.

2
The five MSW facilities participating in the study included:
Bartholomew County Landfill
Adams County Transfer Station
Newton County Landfill
Daviess County Landfill
Pulaski County Transfer Station
Unfortunately the samples from Pulaski County Transfer Station were not representative
enough, and sorts from that transfer station were not incorporated into this study, as
explained in Chapter 3. Table 1-1 lists the facilities that were considered in the study
and general site characteristics (United States Census Bureau), (United States
Environmental Protection Agency, 2008).
Table 1-1:Participating Facilities
Waste Facility Region Population
(county)
Waste
Disposal(ton)
Bartholomew County Landfill
Central Region 76,063 81,402
Adams County Transfer Station
East 34,256 9,579
Newton County Landfill
Northwest 13,736 2,460,650
Daviess County Landfill
South 30,620 22,692

3
CHAPTER 2. STUDY ELEMENTS
2.1. Introduction
The study was divided into seven main steps:
1. Literature review
2. Model development
3. Characterization for sites sampled
4. Characterization for non-participating waste facilities
5. Potential for increased recycling
6. Documentation
7. Presentation
Each step had specific tasks.
2.2. Literature Review
a. Do a literature search on MSW characterization and modeling studies for such a
characterization.
b. Critically evaluate collected literature.
The starting point for the review was the Iowa Statewide Waste Characterization Study
(R.W. Beck, Inc., 2006), Iowa Solid Waste Characterization (R.W. Beck, Inc., 1998), A
Collection of Solid Waste Resources CD (United States Environmental Protection
Agency, 2004), California Statewide Waste Characterization Study (Cascadia
Consulting Group, Inc., 2004), Pennsylvania Statewide Waste Composition Study, Final
Report (R.W. Beck, Inc., 2003), Wisconsin Statewide Waste Characterization Study
(Cascadia Consulting Group, Inc., 2003), Minnesota Statewide MSW Composition
Study (Engineering Solutions and Design, Inc., 2004), the Georgia Statewide Waste
Characterization Study (R.W. Beck, Inc., 2005), and Illinois Commodity/Waste

4
Generation and Characterization Study (Camp Dresser & McKee, Inc., 2009). The
study scope, size and time of sampling for individual states were reviewed and
compared. Table 2-1 summarizes the time and number of sampling for different states.
Table 2-1: Comparison of MSW Studies Conducted by Various States
State IN IL IA IA PA WI MN CA GA
Year 12 09 98 06 03 03 00 04 05
#Season 1 1 2 1 4 1 1 4 4
Season
Sm 08
-
Sm 09
F 08 F 97
Sp 98 F 05
Sm 01
F 01
W 02
Sp 02
F 02 F 09
Sm 03
F 03
W 03
Sp 04
F 03
-
Sm 04
# Sites 4+ 19 5 6 13 14 8 22 13
% Sites 13 39 7 8 28 39 21 8 21
It can be seen that the studies conducted previously around the United States varied
widely in scope. Some states (PA03, CA04 and GA05) conducted sorts over all four
seasons. One (IA 98) did the sort over two seasons. The rest (IL09, IA 06, WI03 and
MN00) only sorted during one season. Some states (IL09, PA03, WI03, MN00 and
GA05) were able to sample more than twenty percent of all facilities in the state. From
this survey, and the fact that the two Iowa studies were deemed the most appropriate by
IDEM to emulate, the original intent was to sample six sites over two seasons; this
turned out not to be possible. Due to a number of limitations, only one sort per site was
conducted. These limitations included: difficulty of getting landfills to participate in the
study, schedules of the students which restricted their availability, and the cost of
sending teams into the field.
2.3. Model Development
a. Develop a modeling strategy for conducting a statewide MSW characterization study
based on literature review and discussions with field managers and the research
group.
b. Decide locations to sample, number of samples to be analyzed, and the time of
sampling. In order to provide the most accurate information to the state, urban,

5
suburban and rural sites were selected. A total of four MSW facilities were visited
including one urban site, two suburban sites, and one rural site. For further
representative analysis, a geographical diversity of locations was selected so that
sites ranging from the northwest, eastern, central and southern portions of the state
were included in the study. For each site, a minimum of 20 samples was taken. The
Summer season was a good time to do most of the sorts because of the availability
of students.
2.4. Characterization for Sites Sampled
The methodology used by R.W. Beck Inc. for both Iowa MSW Characterization Studies
was followed at each site sampled (R.W. Beck, Inc., 1998), (R.W. Beck, Inc., 2006). The
procedure includes the following steps:
1. Determine and confirm the material categories and definitions
2. Conduct pre-sort assessment
3. Define waste sort protocol
4. Conduct waste sorts
5. Compile and review collected data
6. Complete statistical modeling
2.4.1. Determine and Confirm the Material Categories and Definitions
The material categories were provided by IDEM in the initial call for proposals and
agreed to by Purdue University Calumet. Definitions were similar to those found in the
Iowa and Pennsylvania studies (R.W. Beck, Inc., 1998), (R.W. Beck, Inc., 2006), (R.W.
Beck, Inc., 2003). A set of 49 categories was selected for this study. The definitions of
each of these materials are included in Appendix A for reference. Table 2-2 lists the sort
categories for the Indiana MSW characterization study.

6
Table 2-2: Sort Categories for the Indiana MSW Characterization Study
CATEGORIES SUBCATEGORIES
PAPER
OCC and Kraft bags
Newspaper
Magazines
High Grade/Office
Mixed Recyclable Paper
(including Books, Boxboard)
Compostable Paper
Other Non-recyclable,
Non-compostable Paper
PLASTIC
#1 PET Non-Deposit Beverage Containers
#1 PET Deposit Beverage Containers
#1 PET All Other Containers
#2 HDPE Containers
# 6 Styrofoam
All Other Numbered Containers (#3,4,5,6,7)
Other Plastic – NOT Numbered
Film/Wrap/Bags
METAL
Aluminum Non-Deposit Beverage Containers
Aluminum Deposit Beverage Containers
Aluminum All Other Containers
Other Non-Ferrous Scrap
Ferrous Food & Beverage Containers
Other Ferrous Scrap
GLASS
Clear
Green
Blue
Brown
YARD Waste
FOOD WASTE
WOOD Non-Treated Wood

7
Table 2-2: Sort Categories for the Indiana MSW Characterization Study
CATEGORIES SUBCATEGORIES
Treated Wood
DEMOLITION/RENOVATION/
CONSTRUCTION DEBRIS
(excluding Wood)
DURABLES
All Electrical & Household Appliances
Central Processing Units/Peripherals
Computer Monitors/TV’s
Cell Phones
Other (Furniture & Furnishings)
TEXTILES & LEATHER
DIAPERS
RUBBER
HOUSEHOLD HAZARDOUS
MATERIALS (HHMs)
Oil Filters
Paints & Solvents
Batteries (Lead-Acid)
Batteries (Other)
Mercury Containing Products
Other (HHM Containers with Product Inside)
SHARPS
FINES/SUPERMIX
OTHER-SPECIFY
2.4.2. Conduct Pre-sort Assessment
Prior to initiating the sorting events, it was critical to conduct site assessments at each
of the participating facilities. A site visit was made to each facility prior to the actual
sampling. The purpose of the site assessments was two-fold — to promote facility staff
support and cooperation for the sorting events and gather data and site information
needed to develop a sampling and sorting plan for each site. During these visits,
discussions took place with the operators of the facilities and the standard operating

8
procedure of each facility was obtained. A questionnaire was prepared for the landfill
operators (Appendix B). Such details like what equipment will be necessary to perform
the sampling, how the sampling is to be done, the date of sampling, etc., were decided.
In addition, a pre-sort workshop for the research group to explain the sorting
methodology and procedure was conducted. Safety was of primary importance. Each
group member was immunized against Hepatitis and Tetanus before any sorting was
begun.
2.4.3. Define Waste Sort Protocol
In conjunction with each facility, a sorting protocol was established. The protocol
included identifying the Indiana origin of a sample. Origins would be urban, suburban,
rural, or mixed (urban/suburban or suburban/rural). The protocol also included how the
samples were to be selected and sorted. Safety regulations and issues were
considered and guidelines for the people doing the sampling were written.
2.4.4. Conduct Waste Sorts
Sorting events were conducted at each of the participating facilities from late Summer
2008 through Summer 2009. The first facility visited was Bartholomew County Landfill.
It took almost four months to complete the sorting because the research group was not
familiar with the sorting procedure and weekends were the only time available for
students, since school started in late August. For other sites, two weeks was the
general time for sorting. Table 2-3 lists the major participating facilities, locations,
seasons and dates for each sorting event. Figure 2-1 shows the location of the four
participating facilities.

9
Table 2-3: Sorting Events for Participating Facilities
Participating Facility Location Season Date
Bartholomew County
Landfill Columbus Sum, F 08 08/18-11/12
Adams County
Transfer Station Decatur Sp 09 05/28-06/11
Newton County
Landfill Brook Sp, Sum 09 06/17-07/01
Daviess County
Landfill Montgomery Sum 09 07/17-08/15
A total of 81 samples representing more than 18,382 pounds of municipal solid waste
were sorted for the study.
Figure 2-1 Location of Participating Facilities
10
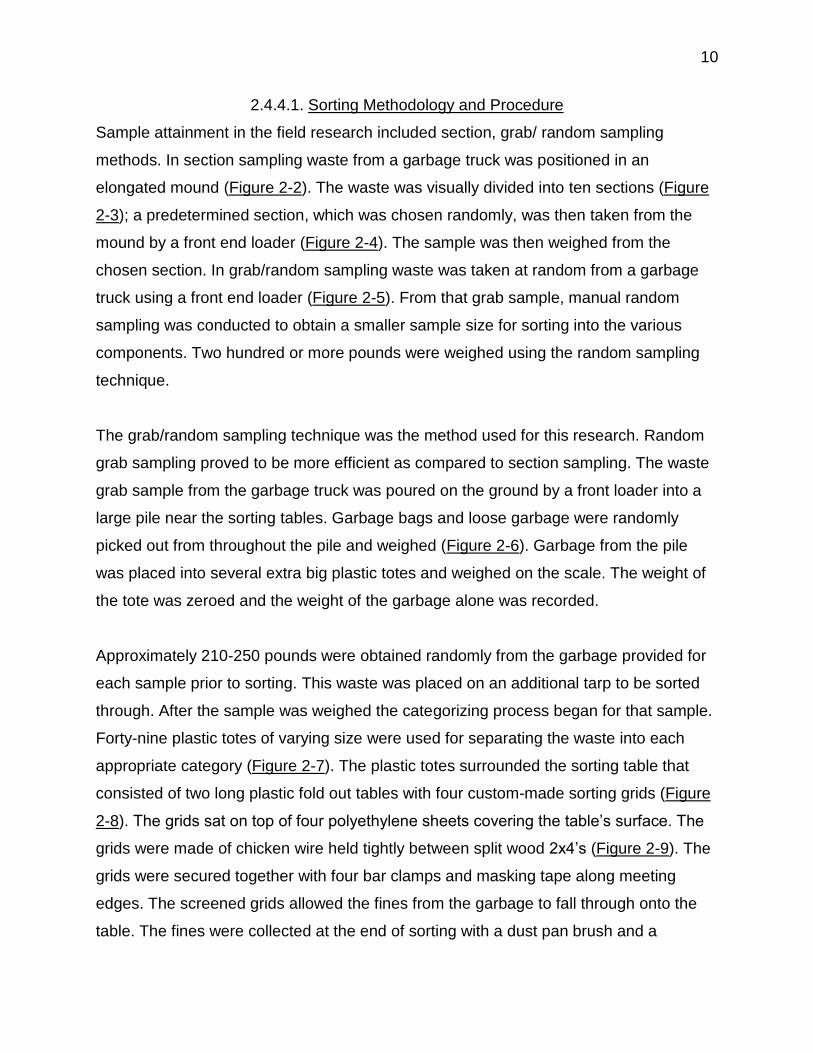
2.4.4.1. Sorting Methodology and Procedure
Sample attainment in the field research included section, grab/ random sampling
methods. In section sampling waste from a garbage truck was positioned in an
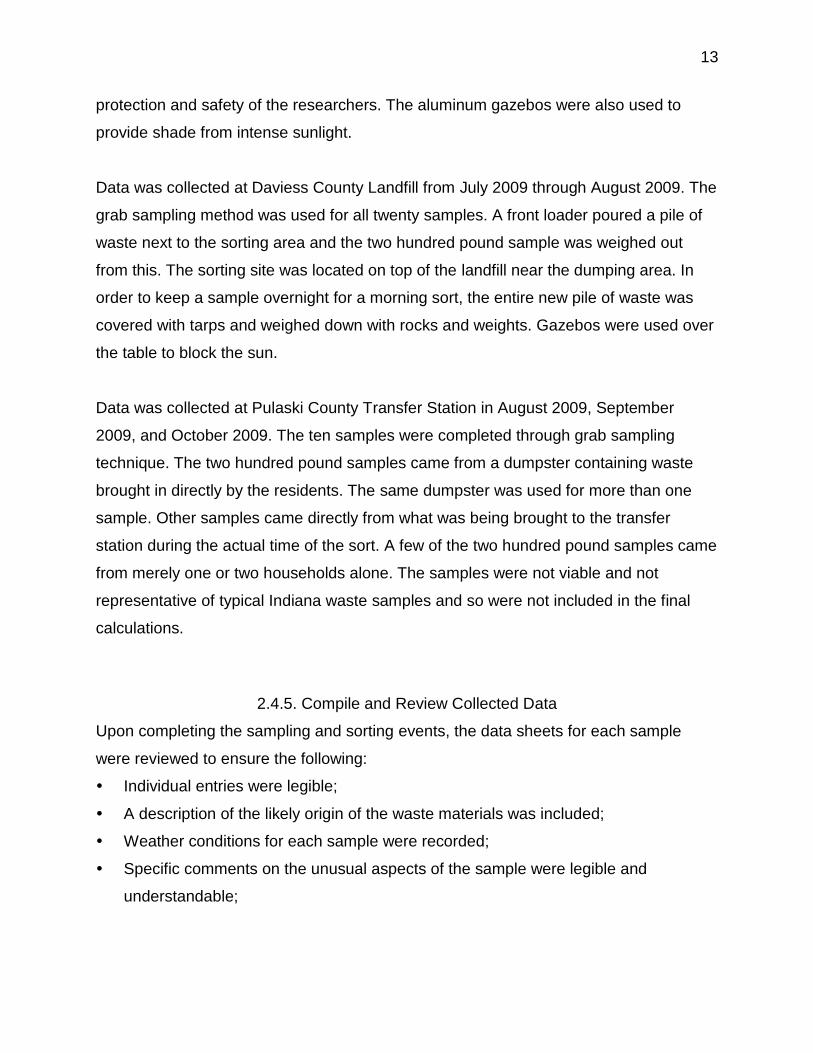
elongated mound (Figure 2-2). The waste was visually divided into ten sections (Figure
2-3); a predetermined section, which was chosen randomly, was then taken from the
mound by a front end loader (Figure 2-4). The sample was then weighed from the
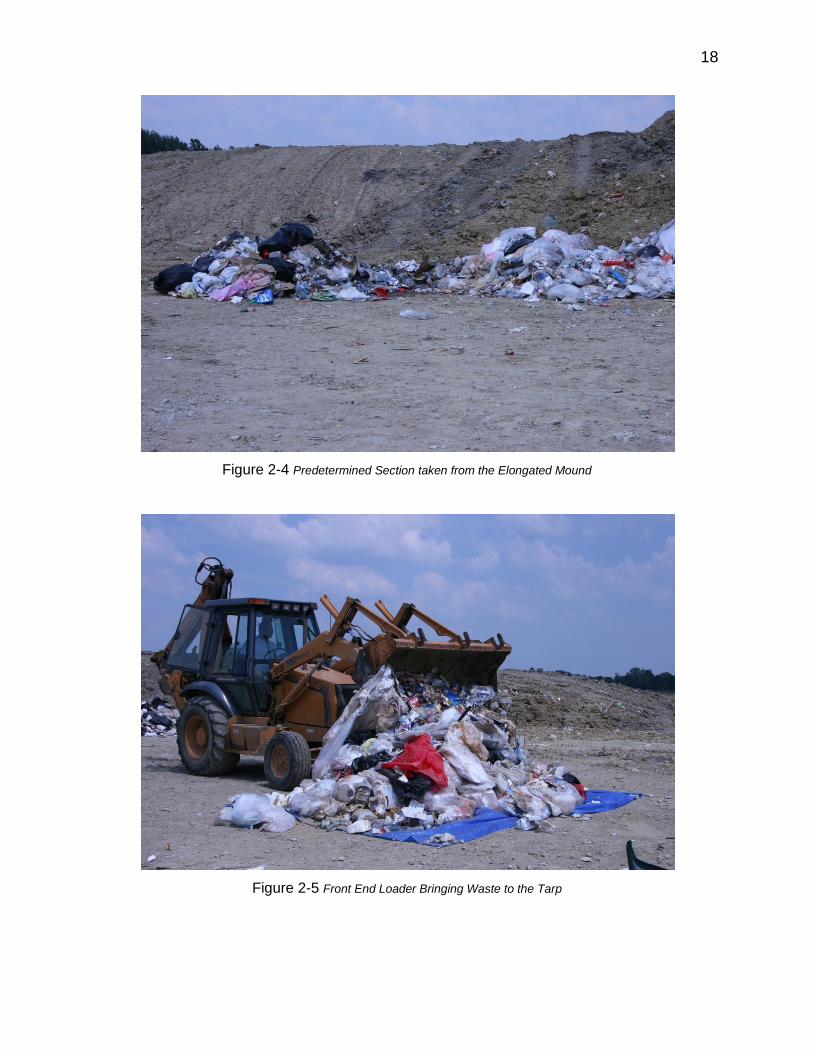
chosen section. In grab/random sampling waste was taken at random from a garbage
truck using a front end loader (Figure 2-5). From that grab sample, manual random
sampling was conducted to obtain a smaller sample size for sorting into the various
components. Two hundred or more pounds were weighed using the random sampling
technique.
The grab/random sampling technique was the method used for this research. Random
grab sampling proved to be more efficient as compared to section sampling. The waste
grab sample from the garbage truck was poured on the ground by a front loader into a
large pile near the sorting tables. Garbage bags and loose garbage were randomly
picked out from throughout the pile and weighed (Figure 2-6). Garbage from the pile
was placed into several extra big plastic totes and weighed on the scale. The weight of
the tote was zeroed and the weight of the garbage alone was recorded.
Approximately 210-250 pounds were obtained randomly from the garbage provided for
each sample prior to sorting. This waste was placed on an additional tarp to be sorted
through. After the sample was weighed the categorizing process began for that sample.
Forty-nine plastic totes of varying size were used for separating the waste into each
appropriate category (Figure 2-7). The plastic totes surrounded the sorting table that
consisted of two long plastic fold out tables with four custom-made sorting grids (Figure
2-8). The grids sat on top of four polyethylene sheets covering the table’s surface. The
grids were made of chicken wire held tightly between split wood 2x4’s (Figure 2-9). The
grids were secured together with four bar clamps and masking tape along meeting
edges. The screened grids allowed the fines from the garbage to fall through onto the
table. The fines were collected at the end of sorting with a dust pan brush and a

11
squeegee off the polyethylene sheet into the fines category plastic tote. The garbage
bags from the two hundred pound sample were picked up from the pile on the tarp one
by one or poured from the extra totes used for weighing out the waste onto the grids on
top of the sorting table. The bags were cut open with box cutters and the contents
spread over the grids in order to be sorted. In the beginning of the research, E-Z
grabbers were used to pick up various pieces of garbage from the table and then drop
them into the appropriate plastic tote. However, the E-Z grabbers broke and were found
to slow the sorting process. In order to be more efficient in categorizing, all researchers
began using their hands to sort and pick through the waste (Figure 2-10). Everyone
wore double layered leather gloves over a pair of nitrile gloves at all times on the
research site and during sorting. All participants also wore steel toe working boots at all
times for safety and ease of walking around on the work site. After the sample was
completely sorted each plastic tote was weighed on the pre-leveled scale and weights
recorded on the data sheets (Figure 2-11). After the plastic totes were weighed the
contents were emptied into a pile and removed by landfill staff for final deposition. New
waste was obtained after sorting of the previous sample was completed.
In addition, some general rules were followed during sorting:
No working during the rain – cover tarp and weights
New garbage, every sample
Tare weight all buckets every morning
Level scale everyday
Thoroughly clean all working materials for each location
Safety-wear: gloves, suits, masks, boots
2.4.4.2. Sorting Event at each Facility
This research project included five sampling sites; in order of completion: Bartholomew
County Landfill located in Columbus, Indiana; Adams County Transfer Station located in
Decatur, Indiana; Newton County Landfill located in Brook, Indiana; Daviess County
Landfill located in Montgomery, Indiana; Pulaski County Transfer Station located in
Winamac, Indiana (result not being used). The sampling method and process exercised
at each location were in the best interest and convenience of the facility.

12
Data was collected at Bartholomew County Landfill August 2008 through November
2008. The sampling methods began with section sampling and then used random grab
sampling at this site. The first two samples’ data were collected using the section
sampling method. A garbage truck dumped the waste into an elongated pile. The pile
was visually divided into ten sections and one section was taken aside by a front loader.
From this section a sample of over two hundred pounds was sorted. After these first two
samples, random grab sampling method was followed for the remaining eighteen
samples in order to be more efficient. A good amount of waste from a garbage truck
was poured on the ground close to the sorting work site by a front loader. A sample of
over two hundred pounds was weighed from this pile to be categorized. The sorting site
was located on the landfill away from the current dumping area. Aluminum frame pop-
up portable gazebos were used to block out the rain and sun.
Data was collected at Adams County Transfer Station May 2009 through June 2009.
The grab sampling technique was performed for all twenty-one samples. A front loader
brought waste into the sorting area and put it onto a tarp. The two hundred pound
sample was picked from this pile. The area provided for sorting was an indoor facility
which allowed the waste to be categorized in rain or shine weather conditions.
Disposable face masks were worn a majority of the time for protection from fumes and
debris. Tyvek suits were worn for additional protection and cleanliness while sorting the
waste.
Data was collected at Newton County Landfill from June 2009 through July 1, 2009. The
grab sampling technique was also performed for all twenty samples. A big front loader
dumped the waste into a large pile just inside the fenced in work area. The two hundred
pound sample was weighed out of this pile from the front loader. Reflective vests and
hardhats were required while on site in addition to the gloves and boots safety gear.
The sorting site was located at the very top of the landfill away from most activity and
the tipping site. This work area was located in a provided fenced in area for the
13
protection and safety of the researchers. The aluminum gazebos were also used to
provide shade from intense sunlight.
Data was collected at Daviess County Landfill from July 2009 through August 2009. The
grab sampling method was used for all twenty samples. A front loader poured a pile of
waste next to the sorting area and the two hundred pound sample was weighed out
from this. The sorting site was located on top of the landfill near the dumping area. In
order to keep a sample overnight for a morning sort, the entire new pile of waste was
covered with tarps and weighed down with rocks and weights. Gazebos were used over
the table to block the sun.
Data was collected at Pulaski County Transfer Station in August 2009, September
2009, and October 2009. The ten samples were completed through grab sampling
technique. The two hundred pound samples came from a dumpster containing waste
brought in directly by the residents. The same dumpster was used for more than one
sample. Other samples came directly from what was being brought to the transfer
station during the actual time of the sort. A few of the two hundred pound samples came
from merely one or two households alone. The samples were not viable and not
representative of typical Indiana waste samples and so were not included in the final
calculations.
2.4.5. Compile and Review Collected Data
Upon completing the sampling and sorting events, the data sheets for each sample
were reviewed to ensure the following:
Individual entries were legible;
A description of the likely origin of the waste materials was included;
Weather conditions for each sample were recorded;
Specific comments on the unusual aspects of the sample were legible and
understandable;

14
A minimum of 200 pounds as recorded on each sample sheet was sorted for each
sample;
Non- MSW loads were excluded from the analysis; and
The facility name and sample number were included on the data sheet.
The tare weight of the individual material’s container and the weight of individual
material plus the tare weight were recorded on the data sheet for all materials.
2.4.6. Complete Statistical Modeling
The data obtained from sorting events were used to statistically calculate the mean and
90% confidence level for the waste composition. A statistical model has been
developed in Microsoft Excel for easy accessibility and use. The model statistically
manipulates the data to calculate the mean, and 90% confidence intervals for individual
material categories by site and statewide results.
The mean represents the mathematical average or average percent of material
composing the MSW stream by weight. The confidence interval is an expression of
accuracy. It provides the upper and lower limits of the "actual" mean for all the MSW
received at the participating facility based upon the sorting and sampling observations
of the sampled materials. For example, the 90% confidence interval represents that
there is a 90% level of confidence that the true population mean falls within the upper
and lower bounds of the confidence interval. The 90% confidence interval is the
generally accepted industry standard for solid waste composition studies. In general,
the more samples that are sorted, the narrower the confidence interval becomes for a
given level of confidence. The narrower the intervals are, the less variability in the data.
Overall, the outputs of the model provide multiple measures for evaluating the results. It
is critical when comparing the MSW composition results that the confidence intervals
are considered along with the mean percentages.

15
2.5. Characterization for Non-participating Waste Facilities
Indiana disposes MSW at thirty landfills and one incinerator plant. Three of these
facilities participated in the study. The MSW composition received at the non-
participating facilities needs to be estimated when determining a statewide
characterization. Waste streams can vary due to local and regional economic trends,
local tipping fees, urban versus rural population distribution, waste diversion program
effectiveness, total and type of industrial employment, and population demographics
(R.W. Beck, Inc., 2006). R.W. Beck has suggested a methodology for determining the
composition from such non-participating facilities. The methodology consists of three
approaches:
“The first approach is to utilize the waste composition percentages developed in
the statewide characterization and apply those percentages to the tonnages for
the particular service area.
The second approach is to select a service area from the waste composition
study that is similar to the service area in question and average the waste
composition percentages of the similar service area with the statewide results.
The third approach is to select the service area that is most similar to the service
area in question and to identify the specific characteristics of the service area in
question that will make it dissimilar from the selected service area. Using the
specific characteristics of the service area in question, the waste composition
percentages would then be adjusted to reflect the specific waste
characterization.” (R.W. Beck, Inc., 2006)
The methodology is shown as a flow diagram in Figure 2-12.
R.W. Beck has also identified several key variables to be used to determine differences
between given service areas. These key variables are: curbside recycling availability,
extent of urbanization, employment to population ratio, and percent total employment by
sector. The Beck methodology will be used for non-participants.

16
2.6. Potential for Increased Recycling
Based on the analysis of statewide MSW composition and comparison with other states,
opportunities for source reduction and recycling can be found.
For the state, determine the types and quantities of present and potentially available
recyclables for the state.
2.7. Documentation
A final report and a thesis are required for this study. Those reports will document all
findings and will:
Determine average compositions of MSW streams from urban, suburban, rural,
urban/suburban, and suburban/rural areas.
Determine overall composition of Indiana’s MSW stream.
Compare results with other state and national characterization studies.
Estimate the types and quantities of potentially recoverable and compostable
materials in the Indiana MSW stream.
Present data in both tabular and graphical form for ease of interpretation.
2.8. Presentation
When possible, the results of the study will be presented, as appropriate, to local,
regional, and state governmental agencies, to the facilities and organizations involved in
MSW issues in Indiana, to the public in Indiana, and at conferences held regionally and
nationally.

17
Figure 2-2 Waste Hauler Truck Unloading
Figure 2-3 Waste Piles as an Elongated Mound
18
Figure 2-4 Predetermined Section taken from the Elongated Mound
Figure 2-5 Front End Loader Bringing Waste to the Tarp

19
Figure 2-6 Garbage Bags & Loose Garbage are Randomly Picked Out from the Pile
Figure 2-7 Some of Forty Nine Plastic Totes

20
Figure 2-8 Working Area
Figure 2-9 Custom-made Sorting Grids

21
Figure 2-10 Sorting a Grab Sample
Figure 2-11 Balance (OHAUS, 5000 Series, Xtreme W)

22
Figure 2-12: Flow Diagram for Characterizing Non-Participating Waste Facility
Identify characteristics
of site.
Compare to
characteristics of sites
with existing information.
Is there one participating facility that is comparable
to the site in question?
The best option is to
use the statewide
waste characterization
data.
Can you identify specific characteristics
to differentiate the site in question from
the similar site?
Average the statewide
waste composition results
with the similar site results
to determine the results
for the site in question.
Identify the material
types that will be
affected by the
specific
characteristics of the
site and adjust those
compositions
percentages. If
there is a decrease
or an increase,
spread the difference
throughout the other
numbers.
YES NO
YES
NO

23
CHAPTER 3. STUDY RESULTS
3.1. Overview
This section presents the results for the study based on the data from sorting events
and tonnage reports for all thirty-one MSW disposal facilities. The research group used
a “bottom up” approach in conducting the statistical analysis. In other words, results
were calculated individually for the smallest subsets of data, and then aggregated to
estimate facility-wide and statewide results. The specific steps of the analysis are
summarized below:
Step 1- Participating Facilities: For each participating facility, 20 samples were used
to develop a weighted- average aggregate composition of the MSW entering that
facility from Indiana origins. For each sample, the weight of each material was
calculated by subtracting tare weight of the tote from the total weight for that
material. The single material weights were added up to get the total weight for the
sample. Single material weight divided by the total weight of all the 49 materials
gives the waste composition percentage for each material category. Using the
weight of all the 20 samples for each material category, the weight fraction of a
material category for each facility was obtained.
Step 2- Non-participating Facilities: The study assumes that the MSW composition
of participating facilities is the same for non-participating facilities having similar
characteristics. The participating and non-participating facilities were grouped into
five waste origins: urban (U), suburban (S), rural (R), half urban/half suburban (U/S),
and half suburban/half rural (S/R). The data from Step 1 was the basis for
determining MSW composition of different origins.
Step 3- Statewide: The overall statewide results were calculated by aggregating the
overall composition for all 31 MSW disposal facilities in Indiana. By multiplying the
annual tonnage of each facility by the percent composition of each material category
24
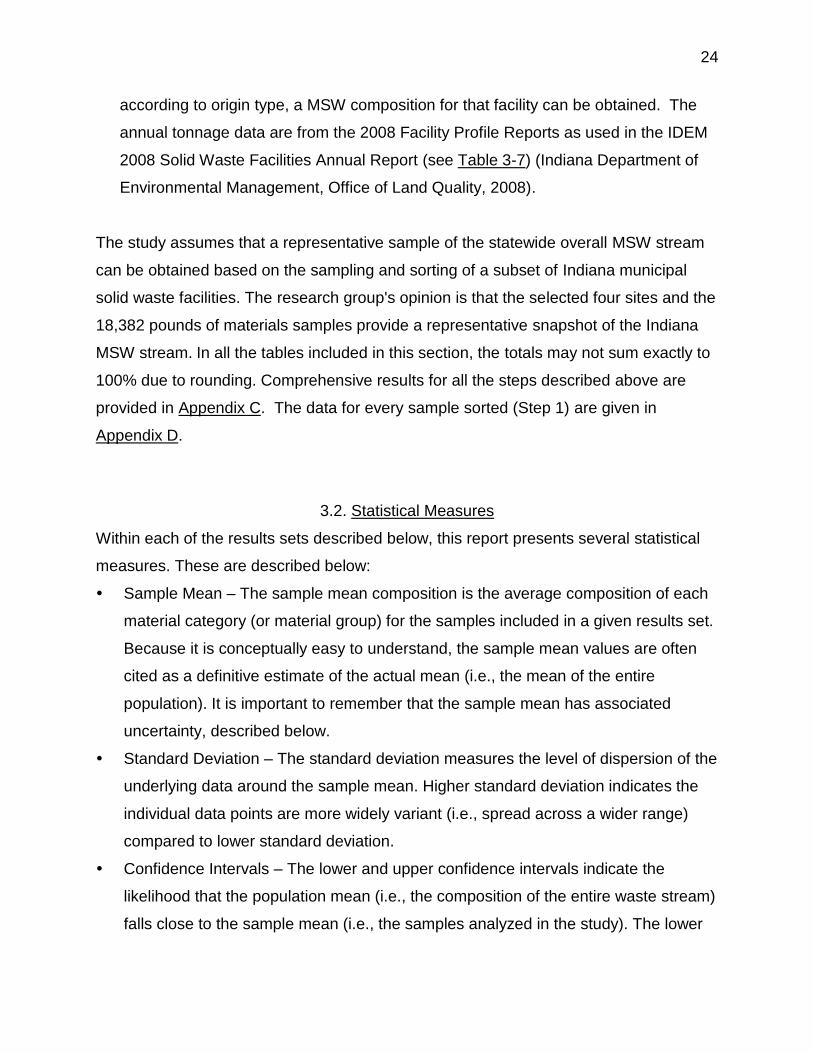
according to origin type, a MSW composition for that facility can be obtained. The
annual tonnage data are from the 2008 Facility Profile Reports as used in the IDEM
2008 Solid Waste Facilities Annual Report (see Table 3-7) (Indiana Department of
Environmental Management, Office of Land Quality, 2008).
The study assumes that a representative sample of the statewide overall MSW stream
can be obtained based on the sampling and sorting of a subset of Indiana municipal
solid waste facilities. The research group's opinion is that the selected four sites and the
18,382 pounds of materials samples provide a representative snapshot of the Indiana
MSW stream. In all the tables included in this section, the totals may not sum exactly to
100% due to rounding. Comprehensive results for all the steps described above are
provided in Appendix C. The data for every sample sorted (Step 1) are given in
Appendix D.
3.2. Statistical Measures
Within each of the results sets described below, this report presents several statistical
measures. These are described below:
Sample Mean – The sample mean composition is the average composition of each
material category (or material group) for the samples included in a given results set.
Because it is conceptually easy to understand, the sample mean values are often
cited as a definitive estimate of the actual mean (i.e., the mean of the entire
population). It is important to remember that the sample mean has associated
uncertainty, described below.
Standard Deviation – The standard deviation measures the level of dispersion of the
underlying data around the sample mean. Higher standard deviation indicates the
individual data points are more widely variant (i.e., spread across a wider range)
compared to lower standard deviation.
Confidence Intervals – The lower and upper confidence intervals indicate the
likelihood that the population mean (i.e., the composition of the entire waste stream)
falls close to the sample mean (i.e., the samples analyzed in the study). The lower

25
and upper bound throughout this report have been calculated at a 90 percent level
of confidence. In layman’s terms, this means we can be 90 percent confident that
the fraction of this material in the overall population falls between the lower and
upper bound shown. The inverse is also true—that there is a ten percent chance
that the true mean falls outside the intervals.
3.3. Participating Facilities
Tables 3-1 through 3-4 depict the composition of municipal solid waste for the four
participating facilities by weight and the quantities of the individual material components.
The ten most prevalent material types, by weight, are shown in Tables 3-1 through 3-4.
The measures provided include the mean and lower and upper bounds of the
composition for each of the material categories (see Appendix E). The lower and upper
bounds represent a 90% confidence interval for the various material means. Note that
the lower and upper bounds are not necessarily equivalent from the mean composition.
Table 3-1: Bartholomew County Landfill
Materials Mean (%) Weight (lb)
Paper 31.38 1382.15
Plastic 14.62 640.31
Food Waste 14.13 615.50
Yard Waste 9.34 411.07
Glass 4.63 200.65
Metal 4.16 184.98
Textiles & Leathers 4.13 180.10
Wood 3.69 170.25
Other-Specify 3.31 145.63
Diapers 3.18 140.35

26
Table 3-2: Adams County Transfer Station
Materials Mean (%) Weight (lb)
Paper 33.43 1590.27
Plastic 16.77 796.97
Food Waste 13.48 637.45
Yard Waste 6.43 311.10
Diapers 4.89 230.60
Demolition 4.60 225.00
Textiles 4.70 223.85
Metal 3.71 177.05
Glass 3.20 151.45
Wood 2.40 114.44
Table 3-3: Newton County Landfill
Materials Mean (%) Weight (lb)
Paper 27.88 1299.05
Plastic 17.27 814.69
Wood 8.85 410.34
Food Waste 7.70 365.35
Demolition/Renovation/
Construction Debris 7.23 338.45
Yard Waste 6.75 316.10
Metal 6.67 307.50
Textiles & Leathers 5.85 271.40
Durables 3.62 169.61
Diapers 2.60 118.20

27
Table 3-4: Daviess County Landfill
Materials Mean (%) Weight (lb)
Paper 29.29 1338.47
Plastic 16.45 748.28
Food Waste 13.84 634.38
Textiles & Leathers 7.86 356.13
Yard Waste 6.10 278.53
Diapers 5.52 249.24
Metal 5.24 239.18
Glass 4.79 217.11
Durables 3.15 142.04
Demolition/Renovation/
Construction Debris 2.43 105.75
3.4. Non-participating Facility
There are a total of 28 non-participating facilities in Indiana that need estimation based
on the MSW composition obtained from sampling. The MSW disposal facilities were
divided into five different waste origins: urban (U), suburban(S), rural (R),
urban/suburban (U/S) and suburban/rural(S/R). From the methodology R.W. Beck used,
similar site results can be used to determine the results for the site in question (R.W.
Beck, Inc., 2006) To be more specific, on a composition basis, Newton County Landfill
represents urban (U), Bartholomew County Landfill represents suburban (S), average of
the compositions of Adams and Daviess represents rural (R), average of the
compositions of Newton and Bartholomew represents urban/suburban (U/S), and
average of the compositions of Bartholomew and rural (R) represents suburban/rural
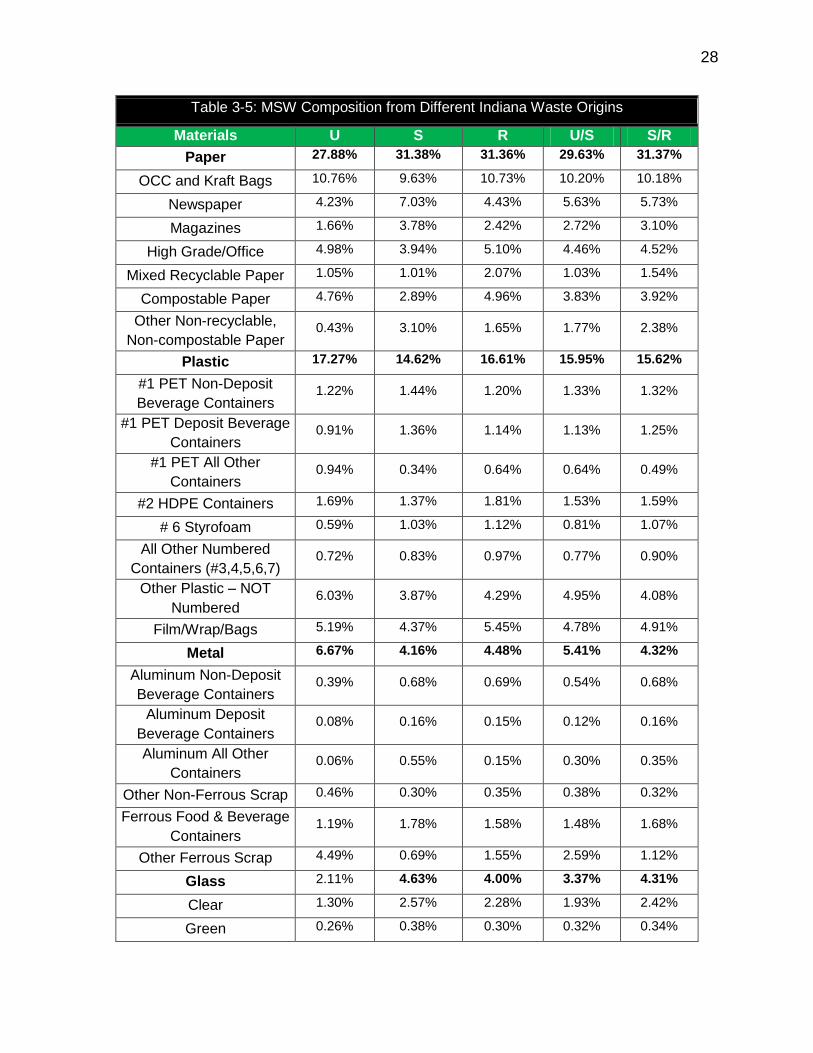
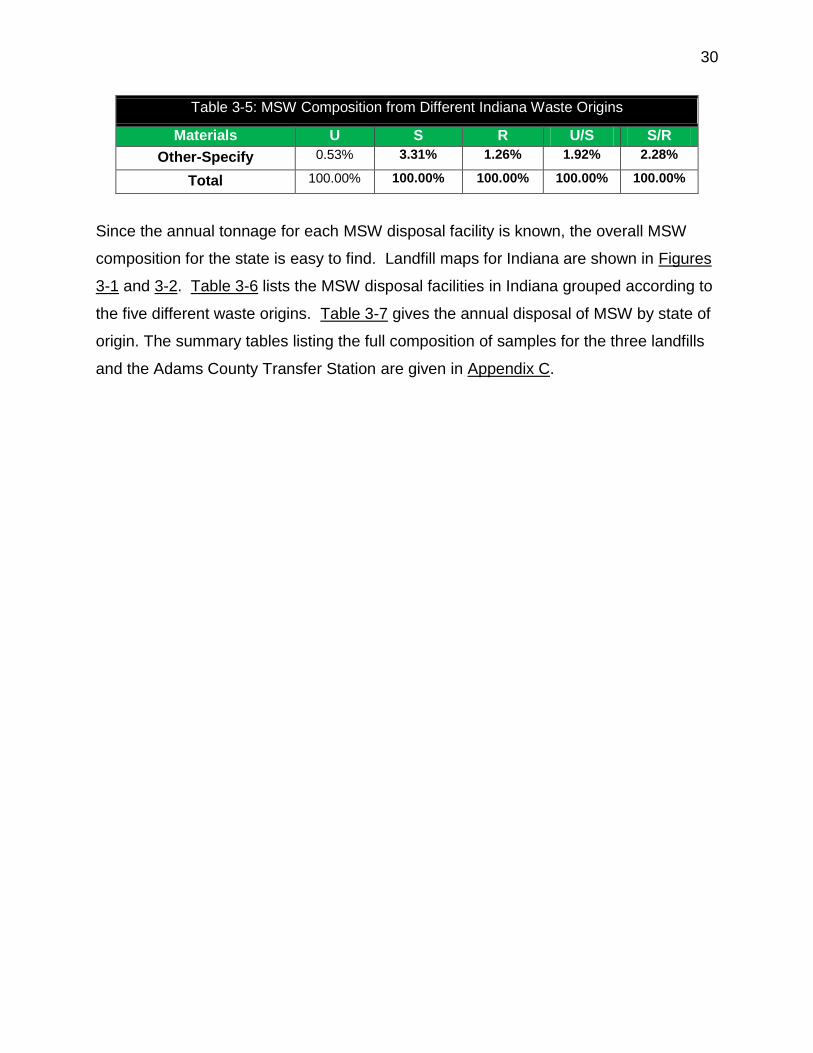
(S/R). Table 3-5 shows MSW composition from different Indiana origins.
28
Table 3-5: MSW Composition from Different Indiana Waste Origins
Materials U S R U/S S/R
Paper 27.88% 31.38% 31.36% 29.63% 31.37%
OCC and Kraft Bags 10.76% 9.63% 10.73% 10.20% 10.18%
Newspaper 4.23% 7.03% 4.43% 5.63% 5.73%
Magazines 1.66% 3.78% 2.42% 2.72% 3.10%
High Grade/Office 4.98% 3.94% 5.10% 4.46% 4.52%
Mixed Recyclable Paper 1.05% 1.01% 2.07% 1.03% 1.54%
Compostable Paper 4.76% 2.89% 4.96% 3.83% 3.92%
Other Non-recyclable,
Non-compostable Paper 0.43% 3.10% 1.65% 1.77% 2.38%
Plastic 17.27% 14.62% 16.61% 15.95% 15.62%
#1 PET Non-Deposit
Beverage Containers 1.22% 1.44% 1.20% 1.33% 1.32%
#1 PET Deposit Beverage
Containers 0.91% 1.36% 1.14% 1.13% 1.25%
#1 PET All Other
Containers 0.94% 0.34% 0.64% 0.64% 0.49%
#2 HDPE Containers 1.69% 1.37% 1.81% 1.53% 1.59%
# 6 Styrofoam 0.59% 1.03% 1.12% 0.81% 1.07%
All Other Numbered
Containers (#3,4,5,6,7) 0.72% 0.83% 0.97% 0.77% 0.90%
Other Plastic – NOT
Numbered 6.03% 3.87% 4.29% 4.95% 4.08%
Film/Wrap/Bags 5.19% 4.37% 5.45% 4.78% 4.91%
Metal 6.67% 4.16% 4.48% 5.41% 4.32%
Aluminum Non-Deposit
Beverage Containers 0.39% 0.68% 0.69% 0.54% 0.68%
Aluminum Deposit
Beverage Containers 0.08% 0.16% 0.15% 0.12% 0.16%
Aluminum All Other
Containers 0.06% 0.55% 0.15% 0.30% 0.35%
Other Non-Ferrous Scrap 0.46% 0.30% 0.35% 0.38% 0.32%
Ferrous Food & Beverage
Containers 1.19% 1.78% 1.58% 1.48% 1.68%
Other Ferrous Scrap 4.49% 0.69% 1.55% 2.59% 1.12%
Glass 2.11% 4.63% 4.00% 3.37% 4.31%
Clear 1.30% 2.57% 2.28% 1.93% 2.42%
Green 0.26% 0.38% 0.30% 0.32% 0.34%

29
Table 3-5: MSW Composition from Different Indiana Waste Origins
Materials U S R U/S S/R
Blue 0.00% 0.00% 0.01% 0.00% 0.01%
Brown 0.55% 1.68% 1.41% 1.12% 1.54%
Yard Waste 6.75% 9.34% 6.27% 8.04% 7.80%
Food Waste 7.70% 14.13% 13.66% 10.91% 13.89%
Wood 8.85% 3.69% 2.26% 6.27% 2.98%
Non-Treated Wood 1.38% 1.02% 0.09% 1.20% 0.55%
Treated Wood 7.47% 2.68% 2.17% 5.07% 2.42%
Demolition/Renovation/
Construction Debris 7.23% 0.37% 3.51% 3.80% 1.94%
Durables 3.62% 4.03% 2.58% 3.82% 3.30%
All Electrical & Household
Appliances 0.78% 1.25% 1.43% 1.02% 1.34%
Central Processing
Units/Peripherals 0.00% 0.28% 0.53% 0.14% 0.40%
Computer Monitors/TV’s 0.00% 0.00% 0.60% 0.00% 0.30%
Cell Phones 0.00% 0.01% 0.00% 0.00% 0.01%
Other (Furniture &
Furnishings) 2.84% 2.48% 0.02% 2.66% 1.25%
Textiles & Leathers 5.85% 4.13% 6.28% 4.99% 5.20%
Diapers 2.60% 3.18% 5.21% 2.89% 4.19%
Rubbers 0.88% 0.29% 0.34% 0.58% 0.31%
Household hazardous
Materials 0.21% 1.73% 0.92% 0.97% 1.33%
Oil Filters 0.06% 0.16% 0.05% 0.11% 0.11%
Paints & Solvents 0.11% 0.94% 0.46% 0.52% 0.70%
Pesticides, Herbicides,
Fungicides 0.00% 0.16% 0.09% 0.08% 0.12%
Household Cleaners 0.00% 0.05% 0.04% 0.03% 0.05%
Batteries (Lead-Acid) 0.00% 0.05% 0.01% 0.03% 0.03%
Batteries (Other) 0.04% 0.09% 0.05% 0.07% 0.07%
Mercury Containing
Products 0.00% 0.00% 0.00% 0.00% 0.00%
Other (HHM Containers
with Product Inside) 0.00% 0.27% 0.21% 0.13% 0.24%
Sharps 0.01% 0.00% 0.02% 0.00% 0.01%
Fines/Supermix 1.86% 1.02% 1.27% 1.44% 1.15%
30
Table 3-5: MSW Composition from Different Indiana Waste Origins
Materials U S R U/S S/R
Other-Specify 0.53% 3.31% 1.26% 1.92% 2.28%
Total 100.00% 100.00% 100.00% 100.00% 100.00%
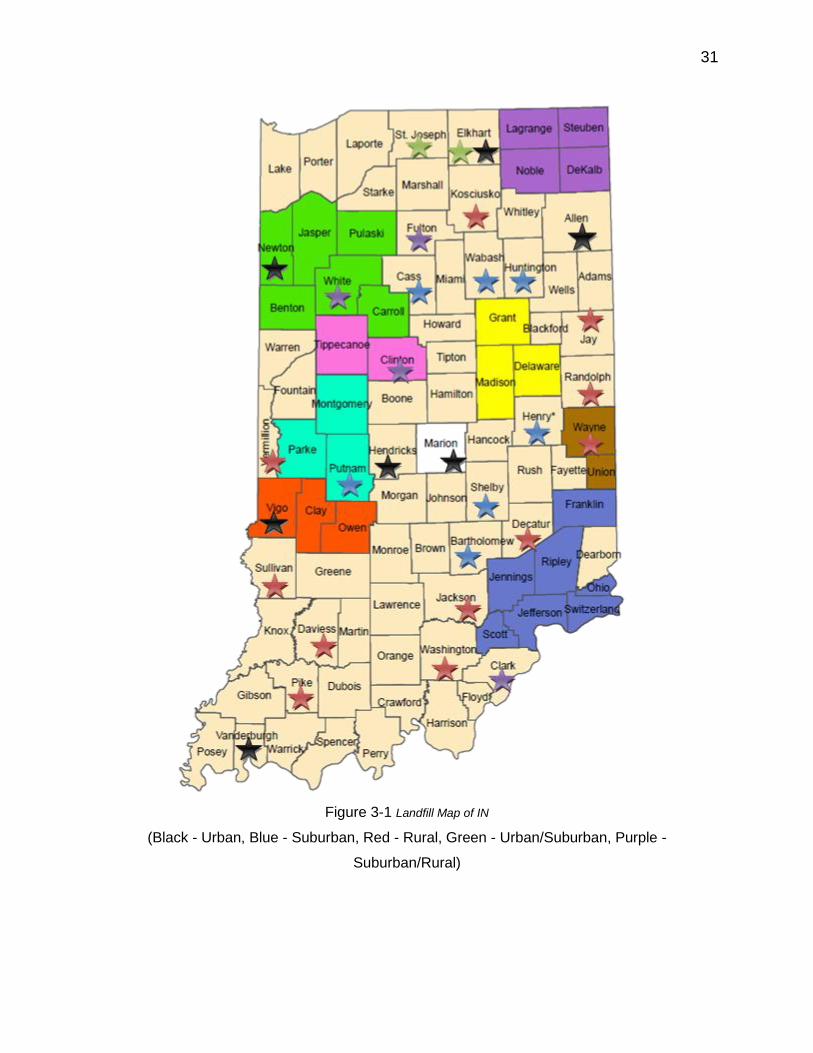
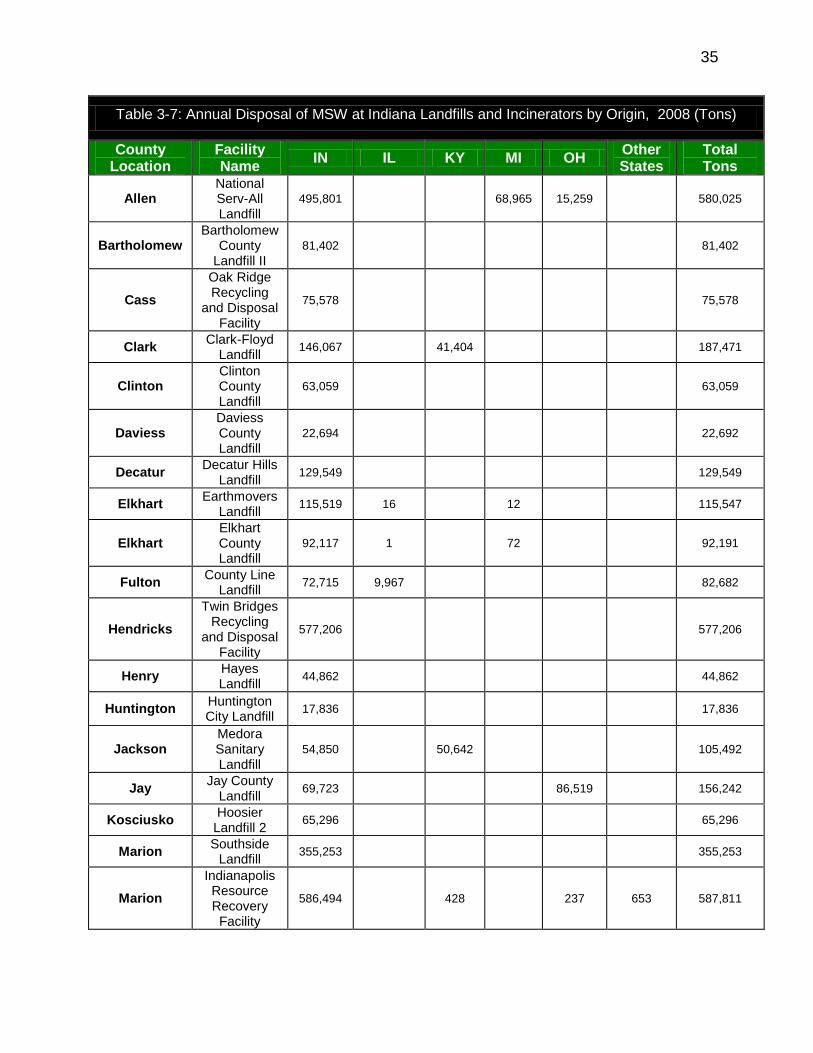
Since the annual tonnage for each MSW disposal facility is known, the overall MSW
composition for the state is easy to find. Landfill maps for Indiana are shown in Figures
3-1 and 3-2. Table 3-6 lists the MSW disposal facilities in Indiana grouped according to
the five different waste origins. Table 3-7 gives the annual disposal of MSW by state of
origin. The summary tables listing the full composition of samples for the three landfills
and the Adams County Transfer Station are given in Appendix C.
31
Figure 3-1 Landfill Map of IN
(Black - Urban, Blue - Suburban, Red - Rural, Green - Urban/Suburban, Purple -
Suburban/Rural)

32

33
Figure 3-2 IN Municipal Solid Waste, Non-Municipal Solid Waste and Restricted Waste Site

34
Table 3-6: MSW Disposal Facilities in IN
Origin/ Designation Facility Name
Urban
Newton County Landfill
South Side Landfill
Sycamore Ridge Landfill
National Serv-All Landfill
Twin Bridges Recycling & Disposal Facility
Laubscher Meadows Landfill
Elkhart County Landfill
Indianapolis Resource Recovery Facility
Suburban
Wabash Valley Landfill
Oak Ridge Recycling And Disposal Facility
Caldwell Landfill
Huntington City Landfill
Hayes Landfill
Bartholomew County Landfill
Rural
Randolph Farms Landfill
Veolia ES Blackfoot Landfill
Jay County Landfill
Decatur Hills Landfill
Medora Sanitary Landfill
New Paris Pike Landfill
Hoosier Landfill #2
Daviess County Landfill
Washington County Landfill
CNSW Center Landfill
West Clinton Landfill
Urban/Suburban Earthmovers Landfill
Prairie View Recycling And Disposal Facility
Suburban/Rural
Liberty Landfill
County Line Landfill
Clark-Floyd Landfill
Clinton County Landfill
35
Table 3-7: Annual Disposal of MSW at Indiana Landfills and Incinerators by Origin, 2008 (Tons)
County Location
Facility Name
IN IL KY MI OH Other States
Total Tons
Allen National Serv-All Landfill
495,801 68,965 15,259 580,025
Bartholomew Bartholomew
County Landfill II
81,402 81,402
Cass
Oak Ridge Recycling
and Disposal Facility
75,578 75,578
Clark Clark-Floyd
Landfill 146,067 41,404 187,471
Clinton Clinton County Landfill
63,059 63,059
Daviess Daviess County Landfill
22,694 22,692
Decatur Decatur Hills
Landfill 129,549 129,549
Elkhart Earthmovers
Landfill 115,519 16 12 115,547
Elkhart Elkhart County Landfill
92,117 1 72 92,191
Fulton County Line
Landfill 72,715 9,967 82,682
Hendricks
Twin Bridges Recycling
and Disposal Facility
577,206 577,206
Henry Hayes Landfill
44,862 44,862
Huntington Huntington City Landfill
17,836 17,836
Jackson Medora Sanitary Landfill
54,850 50,642 105,492
Jay Jay County
Landfill 69,723 86,519 156,242
Kosciusko Hoosier
Landfill 2 65,296 65,296
Marion Southside
Landfill 355,253 355,253
Marion
Indianapolis Resource Recovery Facility
586,494 428 237 653 587,811

36
Table 3-7: Annual Disposal of MSW at Indiana Landfills and Incinerators by Origin, 2008 (Tons)
County Location
Facility Name
IN IL KY MI OH Other States
Total Tons
Martin
Crane Naval Surface Warfare Center Landfill
400 400
Newton Newton County Landfill
543,309 1,917,341 2,460,650
Pike Veolia ES Blackfoot
Landfill Inc
212,582 18 66 212,666
Randolph Randolph
Farms Landfill
230,923 60,362 291,285
St. Joseph
Prairie View Recycling
and Disposal Facility
188,624 50 188,674
Shelby Caldwell Landfill
124,026 2,353 2 126,381
Vanderburgh Laubscher Meadows Landfill
192,121 2,678 194,799
Vermillion West Clinton
Landfill 509 6 515
Vigo Sycamore
Ridge Landfill 898,725 23,867 922,592
Wabash Wabash Valley Landfill
198,318 198,318
Washington Washington
County Landfill
16,377 16,377
Wayne New Paris
Pike Landfill 54,649 54,649
White Liberty Landfill
270,376 322,641 593,017
Total 5,996,960 2,276,210 95,217 69,099 162,379 653 8,600,518

37
3.5. MSW Imports to Indiana
Approximately 8.6 million tons (includes imports) of MSW were disposed at Indiana
waste disposal facilities in 2008, which consist of 30 landfills and the Indianapolis
Resource Recovery Facility. Nearly, seventy percent of the MSW was from Indiana
origins. The remaining imports were mainly from Illinois. Table 3-8 gives the MSW
tonnage disposed in Indiana and the percent origin by state. Table 3-9 estimates the
composition of MSW imports from adjacent states. Import tonnages at Indiana waste
disposal facilities are listed in Table 3-7.
Table 3-8: Annual Disposal of MSW at IN Landfills and Incinerator by Origin 2008
(Tons)
State of Origin MSW Percentage (%)
Indiana 5,996,960 69.7
Illinois 2,276,210 26.4
Ohio 162,379 1.9
Michigan 69,099 0.8
Kentucky 95,217 1.1
Other 653 <0.1
Total 8,600,518 100.00
The compositions for Illinois and Ohio are from their respective waste characterizations
studies (Camp Dresser & McKee, Inc., 2009), (Engineering Solutions and Design, Inc.,
2004). Default values were assumed for Michigan, Kentucky and “other” based on the
final landfill destinations.
Table 3-9: Estimated Composition of MSW Imports to IN
Materials Illinois Ohio Michigan Kentucky Other
Paper 26.2% 31.4% 27.9% 31.4% 31.4%
OCC and Kraft bags 11.0% 10.7% 10.8% 10.2% 10.2%
Newspaper 3.1% 4.4% 4.2% 5.7% 5.7%
Magazines 1.8% 2.4% 1.7% 3.1% 3.1%
High Grade/Office 1.1% 5.1% 5.0% 4.5% 4.5%

38
Table 3-9: Estimated Composition of MSW Imports to IN
Materials Illinois Ohio Michigan Kentucky Other
Mixed Recyclable Paper
(including Books,
Boxboard)
3.1% 2.1% 1.0% 1.5% 1.5%
Compostable Paper 3.3% 5.0% 4.8% 3.9% 3.9%
Other Non-recyclable,
Non-compostable Paper 3.0% 1.6% 0.4% 2.4% 2.4%
Plastic 14.4% 16.6% 17.3% 15.6% 15.6%
#1 PET Non-Deposit
Beverage Containers 1.1% 1.2% 1.2% 1.3% 1.3%
#1 PET Deposit Beverage
Containers 0.1% 1.1% 0.9% 1.3% 1.3%
#1 PET All Other
Containers 0.0% 0.6% 0.9% 0.5% 0.5%
#2 HDPE Containers 1.2% 1.8% 1.7% 1.6% 1.6%
# 6 Styrofoam 0.9% 1.1% 0.6% 1.1% 1.1%
All Other Numbered
Containers (#3,4,5,6,7) 0.9% 1.0% 0.7% 0.9% 0.9%
Other Plastic – NOT
Numbered 5.6% 4.3% 6.0% 4.1% 4.1%
Film/Wrap/Bags 4.8% 5.4% 5.2% 4.9% 4.9%
Metal 5.3% 4.5% 6.7% 4.3% 4.3%
Aluminum Non-Deposit
Beverage Containers 0.0% 0.7% 0.4% 0.7% 0.7%
Aluminum Deposit
Beverage Containers 0.4% 0.2% 0.1% 0.2% 0.2%
Aluminum All Other
Containers 0.5% 0.2% 0.1% 0.4% 0.4%
Other Non-Ferrous Scrap 1.1% 0.3% 0.5% 0.3% 0.3%
Ferrous Food & Beverage
Containers 1.0% 1.6% 1.2% 1.7% 1.7%
Other Ferrous Scrap 2.2% 1.5% 4.5% 1.1% 1.1%
Glass 3.2% 4.0% 2.1% 4.3% 4.3%
Clear 2.9% 2.3% 1.3% 2.4% 2.4%
Green 0.0% 0.3% 0.3% 0.3% 0.3%
Blue 0.0% 0.0% 0.0% 0.0% 0.0%
Brown 0.2% 1.4% 0.6% 1.5% 1.5%
Yard Waste 2.8% 6.3% 6.7% 7.8% 7.8%

39
Table 3-9: Estimated Composition of MSW Imports to IN
Materials Illinois Ohio Michigan Kentucky Other
Food Waste 13.4% 13.7% 7.7% 13.9% 13.9%
Wood 10.1% 2.3% 8.9% 3.0% 3.0%
Non-Treated Wood 4.3% 0.1% 1.4% 0.6% 0.6%
Treated Wood 5.7% 2.2% 7.5% 2.4% 2.4%
Demolition/Renovation/
Construction Debris 7.9% 3.5% 7.2% 1.9% 1.9%
Durables 2.3% 2.6% 3.6% 3.3% 3.3%
All Electrical & Household
Appliances 0.0% 1.4% 0.8% 1.3% 1.3%
Central Processing
Units/Peripherals 0.0% 0.5% 0.0% 0.4% 0.4%
Computer Monitors/TV’s 1.4% 0.6% 0.0% 0.3% 0.3%
Cell Phones 0.0% 0.0% 0.0% 0.0% 0.0%
Other (Furniture &
Furnishings) 0.9% 0.0% 2.8% 1.3% 1.3%
Textiles & Leathers 7.7% 6.3% 5.8% 5.2% 5.2%
Diapers 2.2% 5.2% 2.6% 4.2% 4.2%
Rubbers 0.2% 0.3% 0.9% 0.3% 0.3%
Household hazardous
Materials 0.4% 0.9% 0.2% 1.3% 1.3%
Oil Filters 0.1% 0.1% 0.1% 0.1% 0.1%
Paints & Solvents 0.1% 0.5% 0.1% 0.7% 0.7%
Pesticides, Herbicides,
Fungicides 0.0% 0.1% 0.0% 0.1% 0.1%
Household Cleaners 0.0% 0.0% 0.0% 0.0% 0.0%
Batteries (Lead-Acid) 0.0% 0.0% 0.0% 0.0% 0.0%
Batteries (Other) 0.0% 0.0% 0.0% 0.1% 0.1%
Mercury Containing
Products 0.0% 0.0% 0.0% 0.0% 0.0%
Other (HHM Containers
with Product Inside) 0.2% 0.2% 0.0% 0.2% 0.2%
Sharps 0.0% 0.0% 0.0% 0.0% 0.0%
Fines/Supermix 0.9% 1.3% 1.9% 1.1% 1.1%
Other-Specify 2.9% 1.3% 0.5% 2.3% 2.3%
Total 100.0% 100.0% 100.0% 100.0% 100.0%

40
3.6. Statewide
This objective characterizes the statewide MSW disposal as received at participating
and non-participating facilities in Indiana. Estimates of the MSW composition and
material tonnages are given for the (1) overall MSW stream with imports, and (2)
statewide MSW stream without imports.
3.6.1. Characterization of MSW Stream with Imports
Composition estimates by broad material class for the overall MSW stream (includes
imports) are illustrated in Figure 3-3. The largest material class in the overall waste
stream was paper, which accounted for about 30 percent of the waste stream, by
weight, followed by plastic (16 percent) and food waste (10 percent). Table 3-10 lists
the overall Municipal Solid Waste composition (mean value %) by weight and estimated
material tonnages.

41
Figure 3-3 Overall MSW Composition for the State of IN (includes imports)
28.39%
16.10%
5.67%
2.98%
5.93%
10.90%
7.54%
6.01%
3.17%
6.20%
2.97%
0.55%
0.56%
0.01% 1.43%
1.60%
MSW Stream Percentage
Paper
Plastic
Metal
Glass
Yard Waste
Food Waste
Wood
Demolition/Renovation/Construction Debris
Durables
Textiles & Leather
Diapers
Rubbers
Household Hazardous Materials
Sharps
Fines/Supermix
Other-Specify

42
Table 3-10: Overall IN MSW Composition (includes imports)
Materials Tonnage Mean (%)
Paper 2,442,109 28.39%
OCC and Kraft bags 918,533 10.68%
Newspaper 368,210 4.28%
Magazines 177,142 2.06%
High Grade/Office 330,087 3.84%
Mixed Recyclable Paper 149,034 1.73%
Compostable Paper 359,658 4.18%
Other Non-Recyclable, non-compostable paper 139,445 1.62%
Plastic 1,384,406 16.10%
#1 PET Non-Deposit Beverage Containers 103,407 1.20%
#1 PET Deposit Beverage Containers 67,028 0.78%
#1 PET All Other Containers 49,153 0.57%
#2 HDPE Containers 131,670 1.53%
# 6 Styrofoam 68,341 0.79%
All Other Numbered Containers (#3,4,5,6,7) 69,556 0.81%
Other Plastic – NOT Numbered 463,236 5.39%
Film/Wrap/Bags 432,017 5.02%
Metal 487,879 5.67%
Aluminum Non-Deposit Beverage Containers 31,832 0.37%
Aluminum Deposit Beverage Containers 16,649 0.19%
Aluminum All Other Containers 21,806 0.25%
Other Non-Ferrous Scrap 51,495 0.60%
Ferrous Food & Beverage Containers 110,290 1.28%
Other Ferrous Scrap 255,808 2.97%
Glass 256,067 2.98%
Clear 174,884 2.03%
Green 18,147 0.21%
Blue 159 0.00%
Brown 62,876 0.73%
Yard Waste 510,322 5.93%
Food Waste 937,119 10.90%
Wood 648,110 7.54%
Non-Treated Wood 164,796 1.92%
Treated Wood 483,314 5.62%
Demolition/Renovation/Construction Debris 517,260 6.01%
Durables 272,332 3.17%
All Electrical & Household Appliances 63,466 0.74%
Central Processing Units/Peripherals 9,918 0.12%
Computer Monitors/TV’s 40,358 0.47%
Cell Phones 121 0.00%

43
Table 3-10: Overall IN MSW Composition (includes imports)
Materials Tonnage Mean (%)
Other (Furniture & Furnishings) 158,468 1.84%
Textiles & Leathers 532,862 6.20%
Diapers 255,175 2.97%
Rubbers 47,112 0.55%
Household hazardous Materials 48,375 0.56%
Oil Filters 6,805 0.08%
Paints & Solvents 22,214 0.26%
Pesticides, Herbicides, Fungicides 2,854 0.03%
Household Cleaners 1,090 0.01%
Batteries (Lead-Acid) 740 0.01%
Batteries (Other) 4,330 0.05%
Mercury Containing Products 179 0.00%
Other (HHM Containers with Product Inside) 10,164 0.12%
Sharps 1,037 0.01%
Fines/Supermix 122,719 1.43%
Other-Specify 137,603 1.60%
Total* 8,600,518 100.00% *Rounding difference of 32.57 noted in final total

44
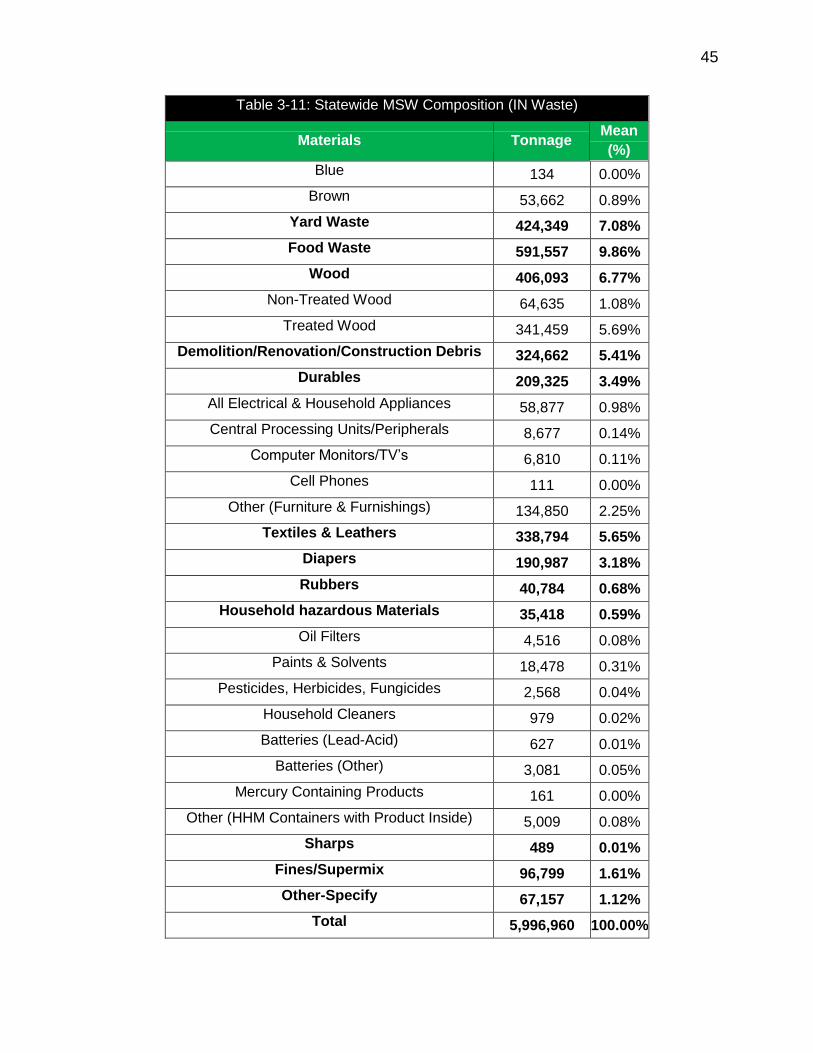
3.6.2. Characterization of MSW Stream without Imports
Table 3-11 gives the overall statewide MSW composition without imports.
Table 3-11: Statewide MSW Composition (IN Waste)
Materials Tonnage Mean
(%)
Paper 1,745,322 29.10%
OCC and Kraft bags 634,150 10.57%
Newspaper 283,031 4.72%
Magazines 128,913 2.15%
High Grade/Office 290,081 4.84%
Mixed Recyclable Paper 73,954 1.23%
Compostable Paper 269,540 4.49%
Other Non-Recyclable, non-compostable paper 65,652 1.09%
Plastic 1,002,396 16.72%
#1 PET Non-Deposit Beverage Containers 74,993 1.25%
#1 PET Deposit Beverage Containers 61,388 1.02%
#1 PET All Other Containers 46,996 0.78%
#2 HDPE Containers 99,482 1.66%
# 6 Styrofoam 45,714 0.76%
All Other Numbered Containers (#3,4,5,6,7) 46,956 0.78%
Other Plastic – NOT Numbered 320,834 5.35%
Film/Wrap/Bags 306,032 5.10%
Metal 350,578 5.85%
Aluminum Non-Deposit Beverage Containers 29,780 0.50%
Aluminum Deposit Beverage Containers 6,575 0.11%
Aluminum All Other Containers 9,343 0.16%
Other Non-Ferrous Scrap 24,558 0.41%
Ferrous Food & Beverage Containers 81,452 1.36%
Other Ferrous Scrap 198,870 3.32%
Glass 172,251 2.87%
Clear 101,295 1.69%
Green 17,159 0.29%
45
Table 3-11: Statewide MSW Composition (IN Waste)
Materials Tonnage Mean
(%)
Blue 134 0.00%
Brown 53,662 0.89%
Yard Waste 424,349 7.08%
Food Waste 591,557 9.86%
Wood 406,093 6.77%
Non-Treated Wood 64,635 1.08%
Treated Wood 341,459 5.69%
Demolition/Renovation/Construction Debris 324,662 5.41%
Durables 209,325 3.49%
All Electrical & Household Appliances 58,877 0.98%
Central Processing Units/Peripherals 8,677 0.14%
Computer Monitors/TV’s 6,810 0.11%
Cell Phones 111 0.00%
Other (Furniture & Furnishings) 134,850 2.25%
Textiles & Leathers 338,794 5.65%
Diapers 190,987 3.18%
Rubbers 40,784 0.68%
Household hazardous Materials 35,418 0.59%
Oil Filters 4,516 0.08%
Paints & Solvents 18,478 0.31%
Pesticides, Herbicides, Fungicides 2,568 0.04%
Household Cleaners 979 0.02%
Batteries (Lead-Acid) 627 0.01%
Batteries (Other) 3,081 0.05%
Mercury Containing Products 161 0.00%
Other (HHM Containers with Product Inside) 5,009 0.08%
Sharps 489 0.01%
Fines/Supermix 96,799 1.61%
Other-Specify 67,157 1.12%
Total 5,996,960 100.00%
46
CHAPTER 4. COMPARISON AND DIVERSION OPPORTUNITIES
4.1. Introduction
This report section compares the overall Indiana Statewide MSW Composition Study
results (excludes imports) to other state and national results. In addition, potential
opportunities for diverting additional materials from disposal are identified for further
analysis.
The comparison consists of three aspects. First, the statewide MSW compositions for
different Indiana waste origins (urban, suburban, rural) were compared to see what is
going on in the waste stream. Next, the mean percentages for the material categories
in Indiana and other states were compared. For a third comparison, the Indiana results
were compared to the national record.

47
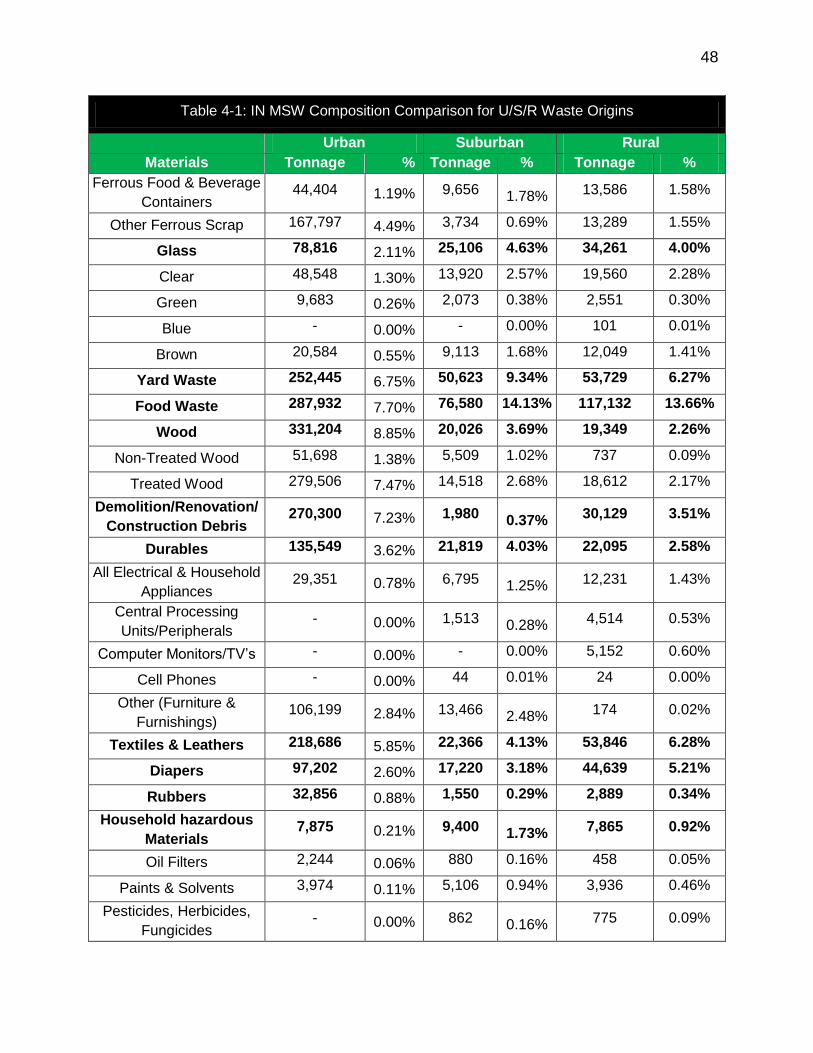
4.2. Study Comparison for Urban/Suburban/Rural
Table 4-1: IN MSW Composition Comparison for U/S/R Waste Origins
Urban Suburban Rural
Materials Tonnage % Tonnage % Tonnage %
Paper 1,042,983 27.88% 170,064 31.38% 268,941 31.36%
OCC and Kraft bags 402,630 10.76% 52,212 9.63% 92,056 10.73%
Newspaper 158,226 4.23% 38,091 7.03% 37,967 4.43%
Magazines 62,284 1.66% 20,462 3.78% 20,780 2.42%
High Grade/Office 186,480 4.98% 21,343 3.94% 43,736 5.10%
Mixed Recyclable Paper
(including Books,
Boxboard)
39,133 1.05% 5,451 1.01%
17,756 2.07%
Compostable Paper 178,058 4.76% 15,676 2.89% 42,500 4.96%
Other Non-recyclable,
Non-compostable Paper 16,172 0.43% 16,830 3.10% 14,144 1.65%
Plastic 645,944 17.27% 79,264 14.62% 142,451 16.61%
#1 PET Non-Deposit
Beverage Containers 45,571 1.22% 7,828 1.44% 10,256 1.20%
#1 PET Deposit Beverage
Containers 33,884 0.91% 7,369 1.36% 9,786 1.14%
#1 PET All Other
Containers 34,988 0.94% 1,863 0.34% 5,485 0.64%
#2 HDPE Containers 63,159 1.69% 7,424 1.37% 15,482 1.81%
# 6 Styrofoam 22,136 0.59% 5,586 1.03% 9,592 1.12%
All Other Numbered
Containers (#3,4,5,6,7) 26,782 0.72% 4,511 0.83% 8,329 0.97%
Other Plastic – NOT
Numbered 225,438 6.03% 21,000 3.87% 36,796 4.29%
Film/Wrap/Bags 193,986 5.19% 23,684 4.37% 46,724 5.45%
Metal 249,360 6.67% 22,532 4.16% 38,390 4.48%
Aluminum Non-Deposit
Beverage Containers 14,764 0.39% 3,678 0.68% 5,925 0.69%
Aluminum Deposit
Beverage Containers 3,158 0.08% 879 0.16% 1,298 0.15%
Aluminum All Other
Containers 2,200 0.06% 2,981 0.55% 1,299 0.15%
Other Non-Ferrous Scrap 17,037 0.46% 1,604 0.30% 2,993 0.35%
48
Table 4-1: IN MSW Composition Comparison for U/S/R Waste Origins
Urban Suburban Rural
Materials Tonnage % Tonnage % Tonnage %
Ferrous Food & Beverage
Containers 44,404 1.19% 9,656 1.78% 13,586 1.58%
Other Ferrous Scrap 167,797 4.49% 3,734 0.69% 13,289 1.55%
Glass 78,816 2.11% 25,106 4.63% 34,261 4.00%
Clear 48,548 1.30% 13,920 2.57% 19,560 2.28%
Green 9,683 0.26% 2,073 0.38% 2,551 0.30%
Blue - 0.00% - 0.00% 101 0.01%
Brown 20,584 0.55% 9,113 1.68% 12,049 1.41%
Yard Waste 252,445 6.75% 50,623 9.34% 53,729 6.27%
Food Waste 287,932 7.70% 76,580 14.13% 117,132 13.66%
Wood 331,204 8.85% 20,026 3.69% 19,349 2.26%
Non-Treated Wood 51,698 1.38% 5,509 1.02% 737 0.09%
Treated Wood 279,506 7.47% 14,518 2.68% 18,612 2.17%
Demolition/Renovation/
Construction Debris 270,300 7.23% 1,980 0.37% 30,129 3.51%
Durables 135,549 3.62% 21,819 4.03% 22,095 2.58%
All Electrical & Household
Appliances 29,351 0.78% 6,795 1.25% 12,231 1.43%
Central Processing
Units/Peripherals - 0.00% 1,513 0.28% 4,514 0.53%
Computer Monitors/TV’s - 0.00% - 0.00% 5,152 0.60%
Cell Phones - 0.00% 44 0.01% 24 0.00%
Other (Furniture &
Furnishings) 106,199 2.84% 13,466 2.48% 174 0.02%
Textiles & Leathers 218,686 5.85% 22,366 4.13% 53,846 6.28%
Diapers 97,202 2.60% 17,220 3.18% 44,639 5.21%
Rubbers 32,856 0.88% 1,550 0.29% 2,889 0.34%
Household hazardous
Materials 7,875 0.21% 9,400 1.73% 7,865 0.92%
Oil Filters 2,244 0.06% 880 0.16% 458 0.05%
Paints & Solvents 3,974 0.11% 5,106 0.94% 3,936 0.46%
Pesticides, Herbicides,
Fungicides - 0.00% 862 0.16% 775 0.09%

49
Table 4-1: IN MSW Composition Comparison for U/S/R Waste Origins
Urban Suburban Rural
Materials Tonnage % Tonnage % Tonnage %
Household Cleaners - 0.00% 290 0.05% 349 0.04%
Batteries (Lead-Acid) - 0.00% 288 0.05% 84 0.01%
Batteries (Other) 1,545 0.04% 514 0.09% 419 0.05%
Mercury Containing
Products 113 0.00% - 0.00% 33 0.00%
Other (HHM Containers
with Product Inside) - 0.00% 1,460 0.27% 1,811 0.21%
Sharps 207 0.01% 6 0.00% 199 0.02%
Fines/Supermix 69,671 1.86% 5,550 1.02% 10,864 1.27%
Other-Specify 19,996 0.53% 17,936 3.31% 10,774 1.26%
Total 3,741,026 100.00% 542,022 100.00% 857,552 100.00%
Comparing overall MSW composition for U/S/R for Indiana, some findings were
obtained:
For urban site, a higher percentage was found in the following material
subcategories: High grade/office paper, Other plastic-not numbered, Other ferrous
scrap, Wood, Demolition/ renovation/construction debris. Also, a lower percentage
was found in the following material subcategories: Other non-recyclable, non-
compostable paper, #1 PET non-deposit beverage container, #6 Styrofoam,
Aluminum containers, Clear bottles, Food waste.
For suburban site, a higher percentage was found in the following material
subcategories: Magazines, Other non-recyclable, non-compostable paper, #1 PET
beverage container, Aluminum all other containers, Ferrous food & beverage
containers, Yard waste, Food waste, Household hazardous materials. Also, a lower
percentage was found in the following material subcategories: High grade/office
paper, Compostable paper, Other ferrous scrap, Wood, Demolition/
renovation/construction debris.
For rural site, a higher percentage was found in the following material
subcategories: Textiles & leathers, Diapers. Also, a lower percentage was found in
the durables category.
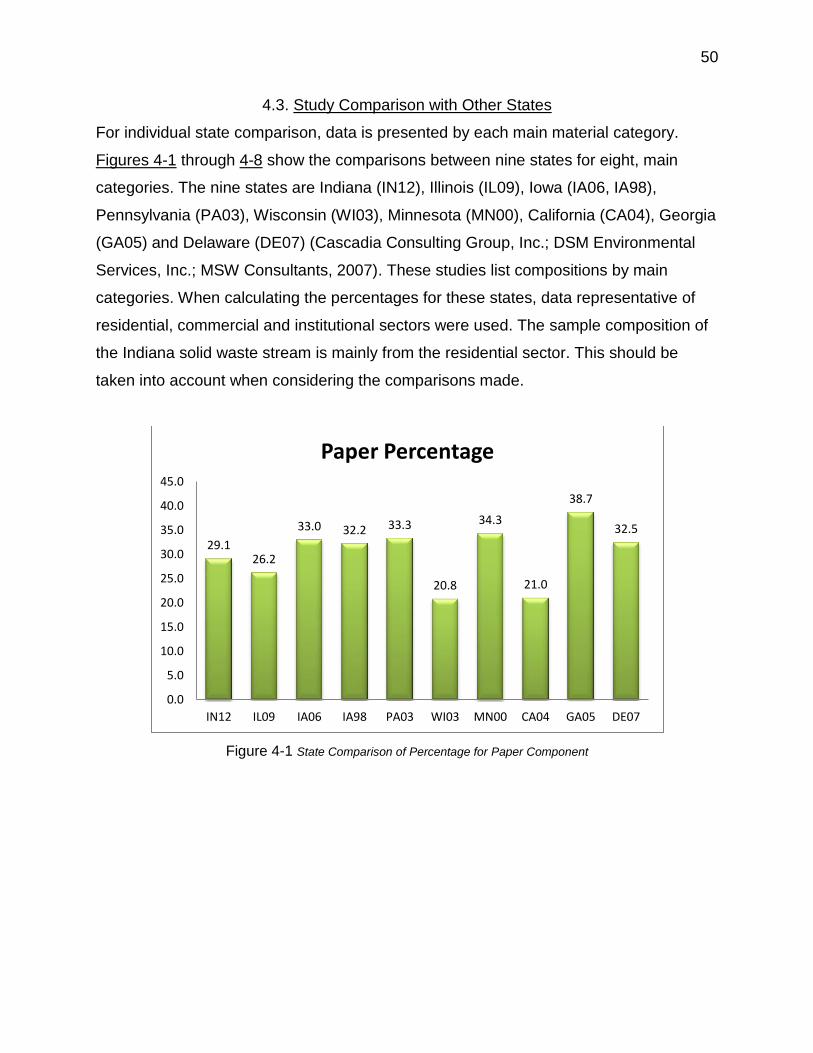
50
4.3. Study Comparison with Other States
For individual state comparison, data is presented by each main material category.
Figures 4-1 through 4-8 show the comparisons between nine states for eight, main
categories. The nine states are Indiana (IN12), Illinois (IL09), Iowa (IA06, IA98),
Pennsylvania (PA03), Wisconsin (WI03), Minnesota (MN00), California (CA04), Georgia
(GA05) and Delaware (DE07) (Cascadia Consulting Group, Inc.; DSM Environmental
Services, Inc.; MSW Consultants, 2007). These studies list compositions by main
categories. When calculating the percentages for these states, data representative of
residential, commercial and institutional sectors were used. The sample composition of
the Indiana solid waste stream is mainly from the residential sector. This should be
taken into account when considering the comparisons made.
Figure 4-1 State Comparison of Percentage for Paper Component
29.1 26.2
33.0 32.2 33.3
20.8
34.3
21.0
38.7
32.5
0.0
5.0
10.0
15.0
20.0
25.0
30.0
35.0
40.0
45.0
IN12 IL09 IA06 IA98 PA03 WI03 MN00 CA04 GA05 DE07
Paper Percentage

51
Figure 4-2 State Comparison of Percentage for Plastic Component
Figure 4-3 State Comparison of Percentage for Metal Component
16.7
14.4 14.9 14.4
11.3 10.5
11.4
9.5
15.8
13.7
0.0
2.0
4.0
6.0
8.0
10.0
12.0
14.0
16.0
18.0
IN12 IL09 IA06 IA98 PA03 WI03 MN00 CA04 GA05 DE07
Plastics Percentage
5.8 5.3
4.7
6.0
5.4
6.3
5.1
6.2
5.4
4.8
0.0
1.0
2.0
3.0
4.0
5.0
6.0
7.0
IN12 IL09 IA06 IA98 PA03 WI03 MN00 CA04 GA05 DE07
Metals Percentage

52
Figure 4-4 State Comparison of Percentage for Glass Component
Figure 4-5 State Comparison of Percentage for Wood Component
2.9 3.2
1.7
2.6
3.0
2.3
2.8
2.3
3.7
2.6
0.0
0.5
1.0
1.5
2.0
2.5
3.0
3.5
4.0
IN12 IL09 IA06 IA98 PA03 WI03 MN00 CA04 GA05 DE07
Glass Percentages
6.8
10.1
8.0
6.4
8.3
13.7
7.5
9.6
4.4 5.6
0.0
2.0
4.0
6.0
8.0
10.0
12.0
14.0
16.0
IN12 IL09 IA06 IA98 PA03 WI03 MN00 CA04 GA05 DE07
Wood Percentage

53
Figure 4-6 State Comparison of Percentage for Organic Component
Figure 4-7 State Comparison of Percentage for Inorganic Component
28.1 30.1
22.4 24.9 25.9
21.0 21.6
30.9
25.5
32.6
0.0
5.0
10.0
15.0
20.0
25.0
30.0
35.0
IN12 IL09 IA06 IA98 PA03 WI03 MN00 CA04 GA05 DE07
Organic Percentage
8.9 10.2 10.6
8.6 10.2
24.7
10.4
17.8
6.1 7.8
0.0
5.0
10.0
15.0
20.0
25.0
30.0
IN12 IL09 IA06 IA98 PA03 WI03 MN00 CA04 GA05 DE07
Inorganic Percentage

54
Figure 4-8 State Comparison of Percentage for Special* Component
* Special waste includes ash, sewage solid, industrial sludge, treated medical waste, bulky item,
tires, etc.
Comparing the main material catergories among nine states, some findings were
obtained (United States Environmental Protection Agency, 2008):
Wisconsin and Califorina have siginificant lower percentage of paper; 20.8 and
21.0 respectively
Indiana has the highest percentage of plastic (16.7) compared with the average
level of 13.3
Indiana has the lowest percentage of special (1.7) compared with the average
level of 2.6
Indiana has lower percentage of inorganics (8.9) compared with the average
level of 11.5
Georgia has the lowest percentage of wood (4.4) compared with the average
level of 8.0
Composition percentage of MSW in Indiana is in the middle range of all nine
states on paper (29.1), metal (5.8), glass (2.9), wood (6.8) and organic (28.1)
1.7
0.5
4.8 4.9
2.5
0.8
7.0
2.7
0.4 0.4
0.0
1.0
2.0
3.0
4.0
5.0
6.0
7.0
8.0
IN12 IL09 IA06 IA98 PA03 WI03 MN00 CA04 GA05 DE07
Special Percentage

55
Comparing the overall MSW compostion among nine states (see Appendix C), a higher
percentage in the following material subcategories for Indiana was found:
High grade/office paper
OCC and Kraft bags
#1 PET bottle
#2 HDPE bottle
Remainder/ composite and other plastic
Other ferrous scrap
Treated wood
Comparing the overall MSW compostion among nine states (see Appendix C), a lower
percentage in the following material subcategories for Indiana was found:
Other non-recyclable/non-compostable paper,
Mixed recyclable paper
Other glass
Non-treated wood.
Food waste
4.4. Study Comparison with National Results
The overall MSW composition result was compared to the United States’ result from
EPA in Table 4-2 (United States Environmental Protection Agency, 2008). Estimated
disposal tonnages of MSW are also given.

56
Table 4-2: Comparison Between IN and National Results
Material
Indiana
(thousands of
tons)
%
United States,
2008
(thousands of tons)
%
1 Paper and Paperboard 1,745 29.1% 34,515 20.7%
2 Glass 172 2.9% 9,337 5.6%
3 Total Metals
(Rows 4-6) 351 5.8% 13,506 8.1%
4 Ferrous 280 4.7% 10,338 6.2%
5 Aluminum 46 0.8% 2,668 1.6%
6 Other Nonferrous 25 0.4% 500 0.3%
7 Plastics 1,002 16.7% 28,012 16.8%
8 Rubber and Leather 41 0.7% 6,336 3.8%
9 Textiles 339 5.6% 10,505 6.3%
10 Wood 406 6.8% 14,840 8.9%
11 Other 0 0.0% 3,335 2.0%
12 Total Materials in Products
(Rows 1-3, 7-11) 4,056 67.6% 120,386 72.2%
13 Food Scraps 592 9.9% 30,847 18.5%
14 Yard Trimmings 424 7.1% 11,672 7.0%
15 Miscellaneous Inorganic Wastes 925 15.4% 3,835 2.3%
16 Total Other Wastes
(Rows 13-15) 1,941 32.4% 46,354 27.8%
17 Total MSW Discarded
(Rows 12, 16) 5,997 100.0% 166,740 100.0%
Comparing the Indiana results with national results, a higher percentage in the following
material categories for Indiana was found:
Paper and Paperboard
Miscellaneous Inorganic Wastes
Comparing the Indiana results with national results, a lower percentage in the following
material categories for Indiana was found:
Glass
Ferrous
Aluminum
Total Metal
Textiles
Wood
Food Scraps
57
4.5. Recycling Opportunities
From review of the comparative analyses provided above, the statewide disposed MSW
stream continues to be composed of materials that may be recycled.
By itself, the paper component includes more than 1,410,129 tons of fiber that are
recyclable; including high grade, magazines, newsprint, OCC, and mixed recyclable
paper. The two largest material categories composing the primary category of paper are
OCC with approximately 634,150 tons and high grade/office with approximately 290,081
tons. In addition, about 269,540 tons of compostable paper could be composted.
Therefore, the disposed paper component of the MSW stream includes a total of more
than 1,745,322 tons of materials that could be recovered through composting and
recycling. This equates to nearly 29% of the total MSW landfilled.
The remainder of the disposed MSW stream offers some additional recycling and
composting opportunities. The top five materials based on both their potential for
recovery and the total quantities disposed includes the following:
Food waste (591,557 tons). Food discards can be donated, used for animal
feed, rendered, or composted. The ability to recover food waste is generally tied
to the cost effectiveness of collection and processing and the extent of
contamination that accompanies any collection program.
Demolition/construction debris (324,662 tons). Many communities and
supporting state program recovery efforts around the U.S. focus on the
recoverable portion of this substream including metals, carpet, shingles, wood,
drywall, and OCC. Please note that the MSW results only represent the portion
of this substream that is commingled with MSW and transported to MSW
landfills for disposal. Approximately 5.4% of the MSW stream is composed of
demolition/construction debris. The dedicated loads of demolition/construction
debris were not included as part of the Solid Waste composition results.
Existing demolition/construction debris recovery programs and infrastructure
should be expanded to other regions of Indiana that do not have programs and
infrastructure.
Textiles and leather (338,794 tons). This category of materials also has been

58
given additional consideration by communities throughout the U.S. within the
last decade because of the establishment of viable end markets for recovery
and reuse of clothing and rags. Promotion of additional recovery should be tied
directly to identifying sustainable end markets.
Film/wrap/bags (306,032 tons). End use markets exist for the recovery of
plastic film. The key barrier precluding additional recovery is the extensive
amount of contamination generally accompanying this type of material discard.
Non-treated wood (64,635 tons). This subcategory of wood is primarily
associated with pallets and crates that are prevalent in the
industrial/commercial/institutional (ICI) stream. The largest barrier associated
with the recovery of this material is generally the extent of contamination.
4.6. Conclusions
Some of the key conclusions that can be drawn from the above analysis include the
following:
1. First study of MSW characterization for Indiana was successfully completed.
2. Methodology used gave comparable results to similar states.
3. OCC (634,150 tons, 10.6%), Mixed recyclable paper (73,954 tons, 1.2%), and
Film/wrap/bags (306,032 tons, 5.1%) represent some of the greatest
opportunities for source reduction and recycling in the Solid Waste stream.
4. Food waste (591,557 tons, 9.9%) and Compostable paper (269,540 tons, 4.5%)
represent some of the greatest opportunities for source reduction and recycling
through composting in MSW stream.
4.7. Recommendations
In order to have a more reliable MSW composition result, more sites could be
sampled. Meanwhile, the reason for a landfill should participate in such a study
should be established.
Since permission to sample at many landfills was difficult to obtain, better
cooperation of landfills, both public and private, in state is necessary.

59
Add information to the IN map project. For more information about IN map project
please refer to HTTP://INMAP.INDIANA.EDU/VIEWER.HTM.

60
REFERENCES
1. Camp Dresser & McKee, Inc. (2009, May 22). Illinois Department of Commerce and
Economic Opportunity. Retrieved from Illinois Commodity/Waste Generation and
Characterization Study: http://illinoisrecycles.org/resources/document-
archives/doc_download/15-ICWCGS-report
2. Cascadia Consulting Group, Inc. (2004, December). California Integrated Waste
Management Board. Retrieved from Statewide Waste Characterization Study:
http://www.calrecycle.ca.gov/publications/localasst/34004005.PDF
3. Cascadia Consulting Group, Inc. (2003, May). Wisconsin Statewide Waste
Characterization Study. Retrieved from Wisconsin Department of Natural
Resources: http://dnr.wi.gov/topic/recycling/documents/wrws-finalrpt.pdf
4. Cascadia Consulting Group, Inc.; DSM Environmental Services, Inc.; MSW
Consultants. (2007, October). Delaware Department of Community Affairs.
Retrieved from Delaware Statewide Waste Characterization Study:
http://www.dswa.com/pdfs/reports/statewide%20waste%20characterization%20stud
y%202006-2007.pdf
5. Engineering Solutions and Design, Inc. (2004, April 21). Ohio Department of Natural
Resources, Division Recycling and Litter Prevention. Retrieved from State of Ohio,
Waste Characterization Study:
http://www.ohiodnr.com/portals/15/tools/pubs/wastecharfinalreport.pdf
6. Indiana Department of Environmental Management. (2006, May 15). Letter to
Howard Cohen, Purdue University Calumet.
7. Indiana Department of Environmental Management, Office of Land Quality. (2008).
Indiana Department of Environmental Management. Retrieved from Solid Waste
Publications - 2008 Facility Profile Report: http://www.in.gov/idem/5070.htm#reports

61
8. R.W. Beck, Inc. (2005, June). Georgia Department of Community Affairs. Retrieved
from Georgia Statewide Waste Characterization Study:
http://www.dca.ga.gov/gasolidwaste/gadwebcalc/gawcsreport.aspx
9. R.W. Beck, Inc. (1998). Iowa Department of Natural Resources. Retrieved from Iowa
Solid Waste Characterization Study:
http://www.iowadnr.gov/portals/idnr/uploads/waste/wastechar98.pdf
10. R.W. Beck, Inc. (2006, February). Iowa Department of Natural Resources. Retrieved
2009, from Iowa Statewide Waste Characterization Study 2006:
HTTP://WWW.IOWADNR.GOV/PORTALS/IDNR/UPLOADS/WASTE/WASTECHAR
05.PDF
11. R.W. Beck, Inc. (2003, April). Pennsylvania Department of Environmental
Management. Retrieved from Statewide Waste Composition Study, Final Report:
http://www.dep.state.pa.us/dep/deputate/airwaste/wm/recycle/waste_comp/4_state_
results.pdf
12. R.W. Beck, Inc. (2000, March). Solid Waste Coordinating Board; the Minnesota
Office of Environmental Assistance and the Minnesota Pollution Control Agency.
Retrieved from Statewide MSW Composition Study (Minnesota):
http://www.pca.state.mn.us/index.php/view-document.html?gid=13502
13. United States Census Bureau. (n.d.). American Fact Finder. Retrieved from
http://factfinder2.census.gov/faces/nav/jsf/pages/index.xhtml
14. United States Environmental Protection Agency. (2004, September). A Collection of
Solid Resources (CD); EPA530-C-04-002.
15. United States Environmental Protection Agency. (2008). Municipal Solid Waste
(MSW) in the United States. Retrieved from Data Table 2008:
http://www.epa.gov/osw/nonhaz/municipal/pubs/msw2008data.pdf
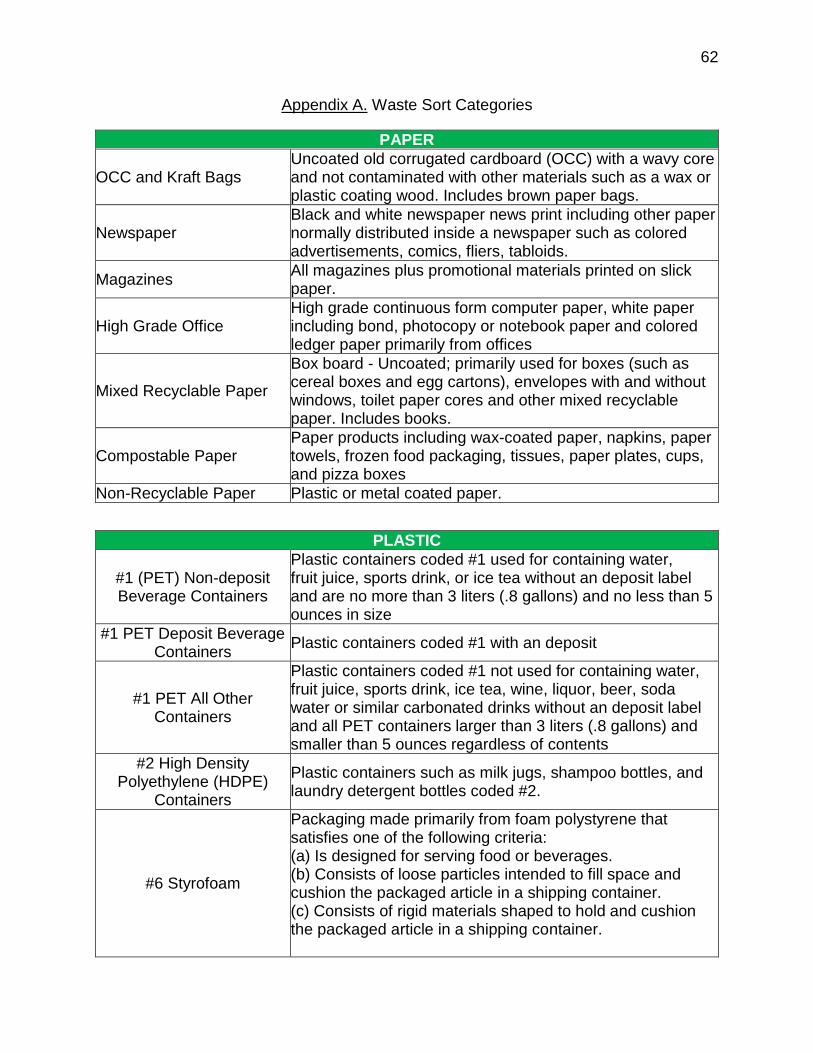
62
Appendix A. Waste Sort Categories
PAPER
OCC and Kraft Bags Uncoated old corrugated cardboard (OCC) with a wavy core and not contaminated with other materials such as a wax or plastic coating wood. Includes brown paper bags.
Newspaper Black and white newspaper news print including other paper normally distributed inside a newspaper such as colored advertisements, comics, fliers, tabloids.
Magazines All magazines plus promotional materials printed on slick paper.
High Grade Office High grade continuous form computer paper, white paper including bond, photocopy or notebook paper and colored ledger paper primarily from offices
Mixed Recyclable Paper
Box board - Uncoated; primarily used for boxes (such as cereal boxes and egg cartons), envelopes with and without windows, toilet paper cores and other mixed recyclable paper. Includes books.
Compostable Paper Paper products including wax-coated paper, napkins, paper towels, frozen food packaging, tissues, paper plates, cups, and pizza boxes
Non-Recyclable Paper Plastic or metal coated paper.
PLASTIC
#1 (PET) Non-deposit Beverage Containers
Plastic containers coded #1 used for containing water, fruit juice, sports drink, or ice tea without an deposit label and are no more than 3 liters (.8 gallons) and no less than 5 ounces in size
#1 PET Deposit Beverage Containers
Plastic containers coded #1 with an deposit
#1 PET All Other Containers
Plastic containers coded #1 not used for containing water, fruit juice, sports drink, ice tea, wine, liquor, beer, soda water or similar carbonated drinks without an deposit label and all PET containers larger than 3 liters (.8 gallons) and smaller than 5 ounces regardless of contents
#2 High Density Polyethylene (HDPE)
Containers
Plastic containers such as milk jugs, shampoo bottles, and laundry detergent bottles coded #2.
#6 Styrofoam
Packaging made primarily from foam polystyrene that satisfies one of the following criteria: (a) Is designed for serving food or beverages. (b) Consists of loose particles intended to fill space and cushion the packaged article in a shipping container. (c) Consists of rigid materials shaped to hold and cushion the packaged article in a shipping container.

63
PLASTIC
All other Numbered Containers (#3,4,5,6,7)
All other plastic “3” – “7” bottles that narrow down to a neck.
Other Plastic-NOT Numbered
Other plastic without number on it
Film/Warp/Bags Trash bags, grocery bags, storage bags, sheet film plastic.
METAL
Aluminum Non-Deposit Beverage Containers
All beverage containers made from aluminum without an deposit label
Aluminum Deposit Beverage Container
All beverage containers made from aluminum with an deposit label
Aluminum All other Containers
Aluminum containers not used for containing water, fruit juice, sports drink, ice tea, wine, liquor, beer, soda water or similar carbonated soft drinks without an Iowa deposit label and all containers larger than 3 liters (.8 gallons) and smaller than 5 ounces regardless of contents
Other Non-Ferrous Scrap Other aluminum scraps besides beverage containers. Also includes other non-ferrous metal scrap such as brass, copper, or other nonmagnetic metal.
Ferrous Food & Beverage Containers
Food and beverage containers composed primarily of iron
Other Ferrous Scrap Ferrous metal besides containers, including clothes hangers, sheet metal products, pipes, miscellaneous metal scraps, and other magnetic metal items.
GLASS
Clear Bottles All clear glass food, beverage, wine, liquor and beer containers
Green Bottles All green glass food, beverage, wine, liquor and beer containers
Blue Bottles All blue glass food, beverage, wine, liquor and beer containers
Brown Bottles All brown glass food, beverage, wine, liquor and beer containers
YARD WASTE
Debris such as grass clippings, leaves, garden waste, brush, and trees. Yard waste does include tree stumps
FOOD WASTE
Food preparation wastes, food scraps, spoiled food.
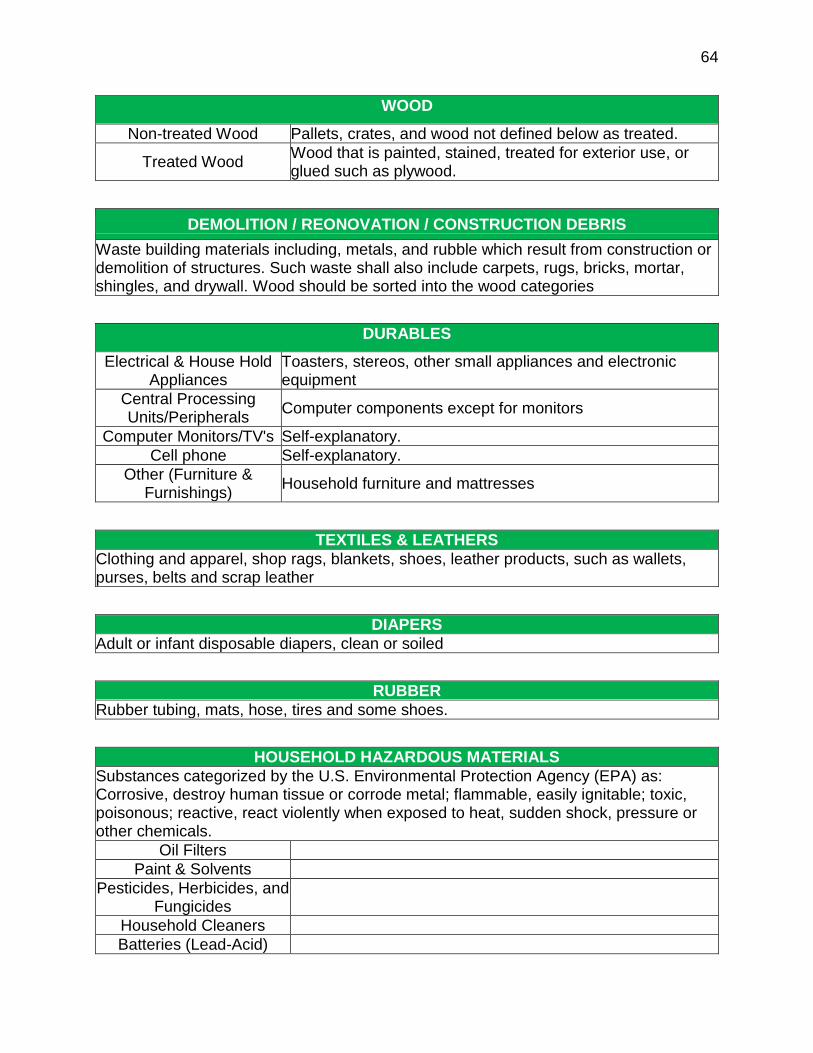
64
WOOD
Non-treated Wood Pallets, crates, and wood not defined below as treated.
Treated Wood Wood that is painted, stained, treated for exterior use, or glued such as plywood.
DEMOLITION / REONOVATION / CONSTRUCTION DEBRIS
Waste building materials including, metals, and rubble which result from construction or demolition of structures. Such waste shall also include carpets, rugs, bricks, mortar, shingles, and drywall. Wood should be sorted into the wood categories
DURABLES
Electrical & House Hold Appliances
Toasters, stereos, other small appliances and electronic equipment
Central Processing Units/Peripherals
Computer components except for monitors
Computer Monitors/TV's Self-explanatory.
Cell phone Self-explanatory.
Other (Furniture & Furnishings)
Household furniture and mattresses
TEXTILES & LEATHERS
Clothing and apparel, shop rags, blankets, shoes, leather products, such as wallets, purses, belts and scrap leather
DIAPERS
Adult or infant disposable diapers, clean or soiled
RUBBER
Rubber tubing, mats, hose, tires and some shoes.
HOUSEHOLD HAZARDOUS MATERIALS
Substances categorized by the U.S. Environmental Protection Agency (EPA) as: Corrosive, destroy human tissue or corrode metal; flammable, easily ignitable; toxic, poisonous; reactive, react violently when exposed to heat, sudden shock, pressure or other chemicals.
Oil Filters
Paint & Solvents
Pesticides, Herbicides, and Fungicides
Household Cleaners
Batteries (Lead-Acid)

65
HOUSEHOLD HAZARDOUS MATERIALS
Batteries (Other)
Mercury Containing Products
Thermostats, thermometers, light switches, and other items containing mercury.
Other (HHM Containers with Products inside)
SHARPS
Hypodermic needles.
FINES/SUPERMIX
Material fragments that are 2” sq. or less, and do not pass through the sort screen. These materials will be visually categorized into their respective component categories
OTHER-SPECIFY
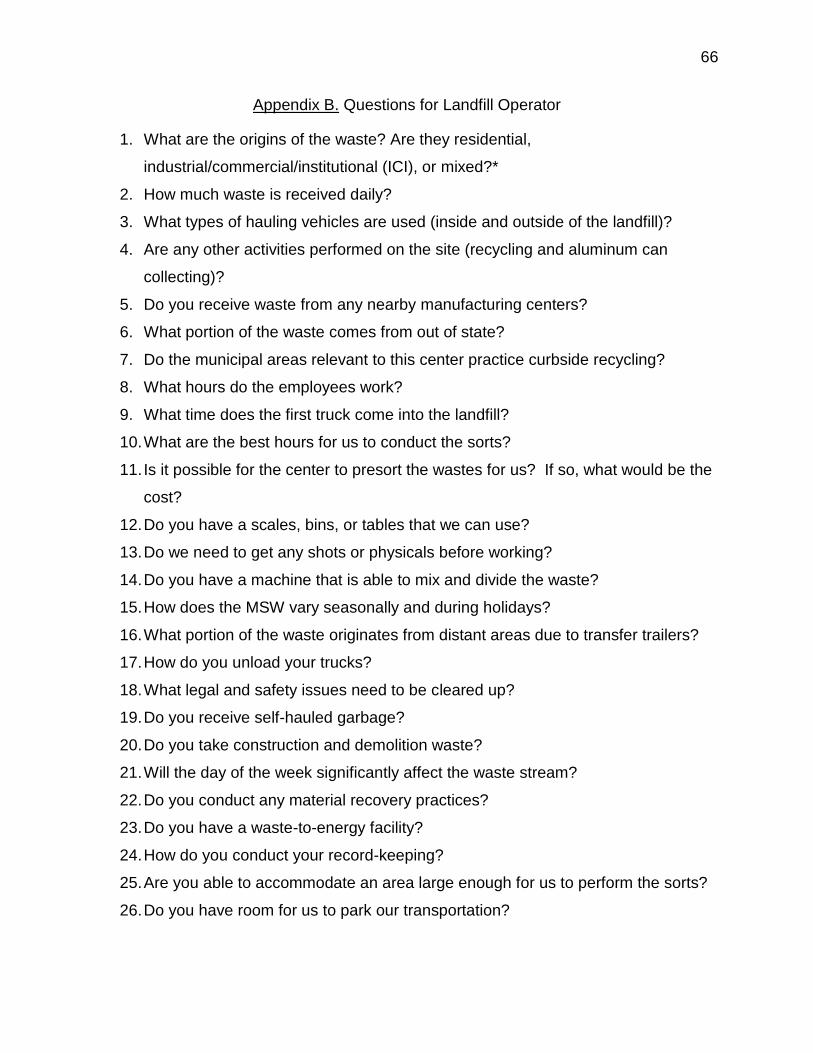
66
Appendix B. Questions for Landfill Operator
1. What are the origins of the waste? Are they residential,
industrial/commercial/institutional (ICI), or mixed?*
2. How much waste is received daily?
3. What types of hauling vehicles are used (inside and outside of the landfill)?
4. Are any other activities performed on the site (recycling and aluminum can
collecting)?
5. Do you receive waste from any nearby manufacturing centers?
6. What portion of the waste comes from out of state?
7. Do the municipal areas relevant to this center practice curbside recycling?
8. What hours do the employees work?
9. What time does the first truck come into the landfill?
10. What are the best hours for us to conduct the sorts?
11. Is it possible for the center to presort the wastes for us? If so, what would be the
cost?
12. Do you have a scales, bins, or tables that we can use?
13. Do we need to get any shots or physicals before working?
14. Do you have a machine that is able to mix and divide the waste?
15. How does the MSW vary seasonally and during holidays?
16. What portion of the waste originates from distant areas due to transfer trailers?
17. How do you unload your trucks?
18. What legal and safety issues need to be cleared up?
19. Do you receive self-hauled garbage?
20. Do you take construction and demolition waste?
21. Will the day of the week significantly affect the waste stream?
22. Do you conduct any material recovery practices?
23. Do you have a waste-to-energy facility?
24. How do you conduct your record-keeping?
25. Are you able to accommodate an area large enough for us to perform the sorts?
26. Do you have room for us to park our transportation?

67
27. On some evenings we will need to wrap up samples in tarps for overnight
storage, and we will also need to store the equipment we use for the following
day. Can we safely store the items on the site?
28. Do we need to use respirators? If so, what kinds?
29. What kind of gloves do your workers use/what kind of gloves should we use?
30. Are there any supplies that you are willing to lend us (sorting table, brooms, small
tools, etc)?
*specific to each truck

68
Appendix C. Detailed Results
Participating Facilities
Table C- 1: Bartholomew County Landfill
Materials Total weight(lb) Mean (%) Lower bound
(%)
Upper bound
(%)
Paper 1382.15 31.38 28.46 34.29
OCC and Kraft bags 422.89 9.63 8.04 11.23
Newspaper 311.00 7.03 5.51 8.55
Magazines 168.46 3.78 2.74 4.81
High Grade/Office 171.80 3.94 2.90 4.97
Mixed Recyclable Paper
(including Books, Boxboard) 44.60 1.01 0.47 1.54
Compostable Paper 127.80 2.89 2.38 3.41
Other Non-recyclable,
Non-compostable Paper 135.60 3.10 2.27 3.94
Plastic 640.31 14.62 13.10 16.15
#1 PET Non-Deposit
Beverage Containers 62.96 1.44 1.07 1.82
#1 PET Deposit Beverage
Containers 59.65 1.36 0.64 2.08
#1 PET All Other Containers 14.95 0.34 0.19 0.50
#2 HDPE Containers 59.83 1.37 1.11 1.63
# 6 Styrofoam 45.45 1.03 0.79 1.27
All Other Numbered
Containers (#3,4,5,6,7) 36.40 0.83 0.58 1.08
Other Plastic – NOT
Numbered 169.61 3.87 3.01 4.74
Film/Wrap/Bags 191.46 4.37 3.81 4.93
Metal 184.98 4.16 3.20 5.11
Aluminum Non-Deposit
Beverage Containers 29.70 0.68 0.48 0.87
Aluminum Deposit Beverage
Containers 6.95 0.16 0.05 0.28
Aluminum All Other
Containers 26.10 0.55 0.01 1.09
Other Non-Ferrous Scrap 13.15 0.30 0.01 0.58

69
Table C- 1: Bartholomew County Landfill
Materials Total weight(lb) Mean (%) Lower bound
(%)
Upper bound
(%)
Ferrous Food & Beverage
Containers 77.73 1.78 1.37 2.20
Other Ferrous Scrap 31.35 0.69 0.22 1.16
Glass 200.65 4.63 2.77 6.50
Clear 110.65 2.57 1.36 3.78
Green 16.75 0.38 0.04 0.72
Blue 0.00 0.00 0.00 0.00
Brown 73.25 1.68 0.50 2.87
Yard Waste 411.07 9.34 6.41 12.27
Food Waste 615.50 14.13 11.77 16.49
Wood 170.25 3.69 1.77 5.62
Non-Treated Wood 44.80 1.02 0.24 1.80
Treated Wood 125.45 2.68 0.73 4.63
Demolition/Renovation/
Construction Debris 14.90 0.37 0.00 0.75
Durables 172.43 4.03 1.91 6.15
All Electrical & Household
Appliances 54.25 1.25 0.75 1.76
Central Processing
Units/Peripherals 12.05 0.28 0.00 0.62
Computer Monitors/TV’s 0.00 0.00 0.00 0.00
Cell Phones 0.35 0.01 0.00 0.02
Other (Furniture &
Furnishings) 105.78 2.48 0.49 4.48
Textiles & Leathers 180.10 4.13 2.95 5.31
Diapers 140.35 3.18 1.64 4.27
Rubbers 13.51 0.29 0.02 0.55
Household hazardous
Materials 80.03 1.73 0.46 3.01
Oil Filters 8.45 0.16 0.00 0.44
Paints & Solvents 42.80 0.94 0.00 1.99
Pesticides, Herbicides,
Fungicides 8.20 0.16 0.00 0.42

70
Table C- 1: Bartholomew County Landfill
Materials Total weight(lb) Mean (%) Lower bound
(%)
Upper bound
(%)
Household Cleaners 2.30 0.05 0.01 0.10
Batteries (Lead-Acid) 2.30 0.05 0.01 0.10
Batteries (Other) 4.35 0.09 0.04 0.15
Mercury Containing
Products 0.00 0.00 0.00 0.00
Other (HHM Containers with
Product Inside) 11.63 0.27 0.00 0.62
Sharps 0.05 0.00 0.00 0.00
Fines/Supermix 45.00 1.02 0.76 1.28
Other-Specify 145.63 3.31 1.98 4.63
Total 4396.91 100.00 100.00 100.00

71
Table C- 2: Adams County Transfer Station
Materials Total Weight(lb) Mean (%) Lower bound
(%)
Upper
bound (%)
Paper 1590.27 33.43 29.92 36.94
OCC and Kraft bags 522.45 10.99 8.78 13.19
Newspaper 246.96 5.15 3.98 6.31
Magazines 131.96 2.77 2.05 3.49
High Grade/Office 264.05 5.54 4.33 6.76
Mixed Recyclable Paper
(including Books,
Boxboard) 113.05 2.39
1.80 2.98
Compostable Paper 214.05 4.52 3.72 5.33
Other Non-recyclable,
Non-compostable Paper 97.75 2.07 1.33 2.81
Plastic 796.97 16.77 15.35 18.19
#1 PET Non-Deposit
Beverage Containers 56.60 1.20 0.89 1.51
#1 PET Deposit Beverage
Containers 53.90 1.13 0.85 1.42
#1 PET All Other
Containers 26.90 0.57 0.45 0.69
#2 HDPE Containers 67.60 1.43 1.18 1.67
# 6 Styrofoam 64.85 1.37 0.98 1.76
All Other Numbered
Containers (#3,4,5,6,7) 45.90 0.97 0.82 1.12
Other Plastic – NOT
Numbered 212.57 4.44 3.49 5.38
Film/Wrap/Bags 268.65 5.66 5.10 6.22
Metal 177.05 3.71 3.28 4.15
Aluminum Non-Deposit
Beverage Containers 36.10 0.76 0.61 0.91
Aluminum Deposit
Beverage Containers 0.40 0.01 0.00 0.01
Aluminum All Other
Containers 8.75 0.19 0.13 0.24
Other Non-Ferrous Scrap 9.55 0.20 0.11 0.29
Ferrous Food & Beverage
Containers 81.55 1.72 1.41 2.02

72
Table C- 2: Adams County Transfer Station
Materials Total Weight(lb) Mean (%) Lower bound
(%)
Upper
bound (%)
Other Ferrous Scrap 40.70 0.84 0.51 1.17
Glass 151.45 3.20 2.58 3.82
Clear 86.20 1.83 1.31 2.34
Green 17.10 0.36 0.06 0.66
Blue 1.15 0.02 0.00 0.06
Brown 47.00 0.99 0.56 1.43
Yard Waste 311.10 6.43 2.99 9.87
Food Waste 637.45 13.48 11.41 15.55
Wood 114.44 2.40 0.69 4.11
Non-Treated Wood 2.90 0.06 0.00 0.13
Treated Wood 111.54 2.34 0.68 4.00
Demolition/Renovation/
Construction Debris 225.00 4.60 0.19 9.00
Durables 94.90 2.01 0.81 3.21
All Electrical & Household
Appliances 66.20 1.40 0.65 2.15
Central Processing
Units/Peripherals 0.00 0.00 0.00 0.00
Computer Monitors/TV’s 27.45 0.58 0.00 1.58
Cell Phones 0.00 0.00 0.00 0.00
Other (Furniture &
Furnishings) 1.25 0.03 0.00 0.07
Textiles & Leathers 223.85 4.70 3.58 5.82
Diapers 230.60 4.89 3.10 6.68
Rubbers 12.70 0.27 0.11 0.44
Household hazardous
Materials 48.15 1.00 0.36 1.64
Oil Filters 3.40 0.07 0.00 0.19
Paints & Solvents 29.55 0.61 0.03 1.19
Pesticides, Herbicides,
Fungicides 0.50 0.01 0.00 0.03
Household Cleaners 1.95 0.04 0.00 0.11

73
Table C- 2: Adams County Transfer Station
Materials Total Weight(lb) Mean (%) Lower bound
(%)
Upper
bound (%)
Batteries (Lead-Acid) 0.00 0.00 0.00 0.00
Batteries (Other) 3.75 0.08 0.04 0.11
Mercury Containing
Products 0.00 0.00 0.00 0.00
Other (HHM Containers
with Product Inside) 9.00 0.19 0.00 0.39
Sharps 0.65 0.01 0.00 0.02
Fines/Supermix 74.75 1.57 1.26 1.89
Other-Specify 72.05 1.53 0.71 2.36
Total 4761.38 100.00 100.00 100.00

74
Table C- 3: Newton County Landfill
Materials Total Weight(lb) Mean (%) Lower bound
(%)
Upper
bound (%)
Paper 1299.05 27.88 25.36 30.40
OCC and Kraft bags 500.85 10.76 8.55 12.97
Newspaper 195.45 4.23 3.32 5.14
Magazines 76.60 1.66 1.02 2.31
High Grade/Office 233.85 4.98 3.29 6.68
Mixed Recyclable Paper
(including Books,
Boxboard)
48.50 1.05 0.84 1.25
Compostable Paper 223.00 4.76 3.93 5.59
Other Non-recyclable,
Non-compostable Paper 20.80 0.43 0.25 0.61
Plastic 814.69 17.27 14.78 19.75
#1 PET Non-Deposit
Beverage Containers 59.35 1.22 0.07 2.36
#1 PET Deposit Beverage
Containers 42.35 0.91 0.65 1.16
#1 PET All Other
Containers 45.45 0.94 0.00 1.98
#2 HDPE Containers 80.49 1.69 1.36 2.02
# 6 Styrofoam 27.45 0.59 0.35 0.83
All Other Numbered
Containers (#3,4,5,6,7) 35.20 0.72 0.30 1.13
Other Plastic – NOT
Numbered 280.90 6.03 4.64 7.42
Film/Wrap/Bags 243.50 5.19 4.42 5.95
Metal 307.50 6.67 4.56 8.77
Aluminum Non-Deposit
Beverage Containers 18.10 0.39 0.27 0.52
Aluminum Deposit
Beverage Containers 3.90 0.08 0.03 0.14
Aluminum All Other
Containers 2.70 0.06 0.00 0.11
Other Non-Ferrous Scrap 21.05 0.46 0.21 0.70
Ferrous Food & Beverage
Containers 56.80 1.19 0.63 1.74
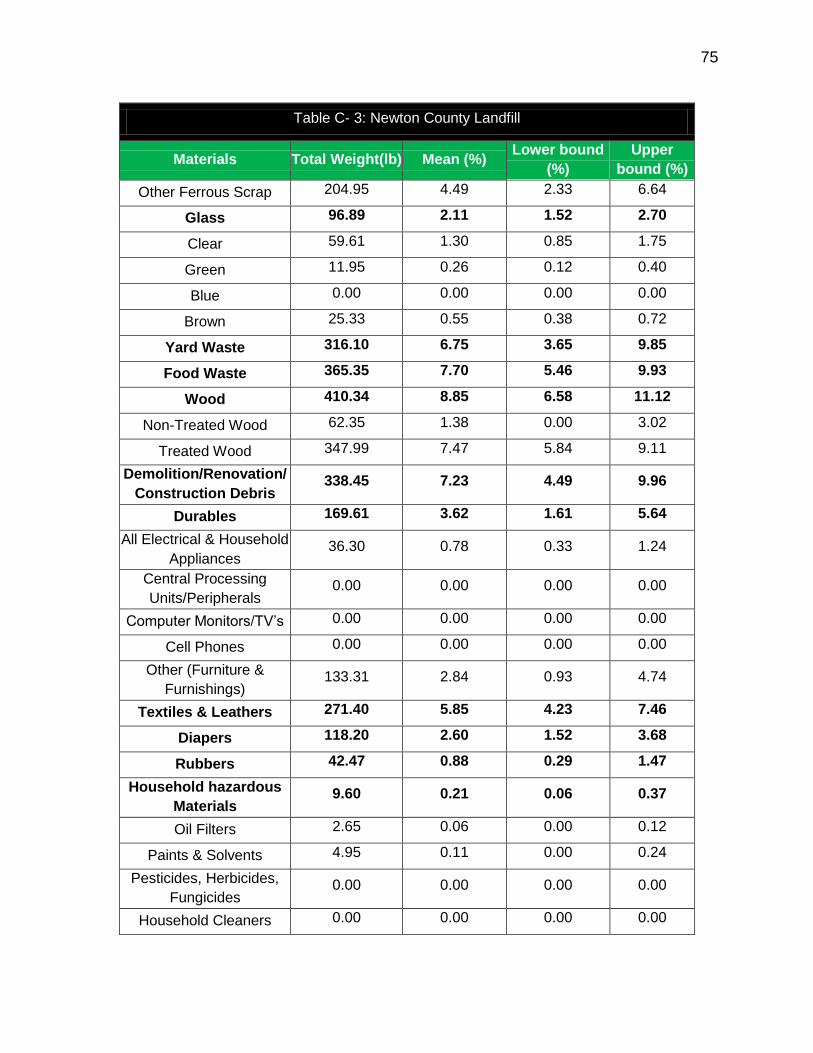
75
Table C- 3: Newton County Landfill
Materials Total Weight(lb) Mean (%) Lower bound
(%)
Upper
bound (%)
Other Ferrous Scrap 204.95 4.49 2.33 6.64
Glass 96.89 2.11 1.52 2.70
Clear 59.61 1.30 0.85 1.75
Green 11.95 0.26 0.12 0.40
Blue 0.00 0.00 0.00 0.00
Brown 25.33 0.55 0.38 0.72
Yard Waste 316.10 6.75 3.65 9.85
Food Waste 365.35 7.70 5.46 9.93
Wood 410.34 8.85 6.58 11.12
Non-Treated Wood 62.35 1.38 0.00 3.02
Treated Wood 347.99 7.47 5.84 9.11
Demolition/Renovation/
Construction Debris 338.45 7.23 4.49 9.96
Durables 169.61 3.62 1.61 5.64
All Electrical & Household
Appliances 36.30 0.78 0.33 1.24
Central Processing
Units/Peripherals 0.00 0.00 0.00 0.00
Computer Monitors/TV’s 0.00 0.00 0.00 0.00
Cell Phones 0.00 0.00 0.00 0.00
Other (Furniture &
Furnishings) 133.31 2.84 0.93 4.74
Textiles & Leathers 271.40 5.85 4.23 7.46
Diapers 118.20 2.60 1.52 3.68
Rubbers 42.47 0.88 0.29 1.47
Household hazardous
Materials 9.60 0.21 0.06 0.37
Oil Filters 2.65 0.06 0.00 0.12
Paints & Solvents 4.95 0.11 0.00 0.24
Pesticides, Herbicides,
Fungicides 0.00 0.00 0.00 0.00
Household Cleaners 0.00 0.00 0.00 0.00

76
Table C- 3: Newton County Landfill
Materials Total Weight(lb) Mean (%) Lower bound
(%)
Upper
bound (%)
Batteries (Lead-Acid) 0.00 0.00 0.00 0.00
Batteries (Other) 1.85 0.04 0.01 0.07
Mercury Containing
Products 0.15 0.00 0.00 0.01
Other (HHM Containers
with Product Inside) 0.00 0.00 0.00 0.00
Sharps 0.25 0.01 0.00 0.01
Fines/Supermix 85.59 1.86 1.31 2.41
Other-Specify 24.95 0.53 0.21 0.86
Total 4670.43 100.00 100.00 100.00

77
Table C- 4: Daviess County Landfill
Materials Total Weight(lb) Mean (%) Lower bound
(%)
Upper
bound (%)
Paper 1338.47 29.29 27.08 31.51
OCC and Kraft bags 478.38 10.48 8.33 12.64
Newspaper 170.13 3.71 2.94 4.48
Magazines 95.30 2.07 1.48 2.67
High Grade/Office 212.91 4.66 3.93 5.39
Mixed Recyclable Paper
(including Books,
Boxboard)
79.55 1.75 1.53 1.97
Compostable Paper 245.93 5.39 4.51 6.26
Other Non-recyclable,
Non-compostable Paper 56.27 1.23 0.90 1.56
Plastic 748.28 16.45 15.06 17.84
#1 PET Non-Deposit
Beverage Containers 53.71 1.19 0.86 1.51
#1 PET Deposit Beverage
Containers 52.43 1.15 0.92 1.38
#1 PET All Other
Containers 32.15 0.71 0.56 0.86
#2 HDPE Containers 98.47 2.18 1.76 2.61
# 6 Styrofoam 39.44 0.87 0.76 0.97
All Other Numbered
Containers (#3,4,5,6,7) 44.07 0.97 0.74 1.20
Other Plastic – NOT
Numbered 188.68 4.14 3.34 4.95
Film/Wrap/Bags 239.33 5.24 4.73 5.75
Metal 239.18 5.24 4.18 6.30
Aluminum Non-Deposit
Beverage Containers 28.58 0.62 0.45 0.80
Aluminum Deposit
Beverage Containers 13.48 0.29 0.20 0.38
Aluminum All Other
Containers 5.45 0.12 0.06 0.18
Other Non-Ferrous Scrap 22.55 0.50 0.16 0.84
Ferrous Food & Beverage
Containers 65.67 1.45 1.18 1.72

78
Table C- 4: Daviess County Landfill
Materials Total Weight(lb) Mean (%) Lower bound
(%)
Upper
bound (%)
Other Ferrous Scrap 103.45 2.26 1.34 3.17
Glass 217.11 4.79 3.91 5.67
Clear 124.23 2.74 2.09 3.38
Green 10.83 0.24 0.07 0.41
Blue 0.00 0.00 0.00 0.00
Brown 82.05 1.82 1.31 2.33
Yard Waste 278.53 6.10 3.76 8.44
Food Waste 634.38 13.84 11.85 15.83
Wood 97.23 2.11 1.24 2.98
Non-Treated Wood 5.15 0.11 0.01 0.21
Treated Wood 92.08 2.00 1.13 2.87
Demolition/Renovation/
Construction Debris 105.75 2.43 0.58 4.28
Durables 142.04 3.15 0.82 5.47
All Electrical & Household
Appliances 63.84 1.45 0.49 2.42
Central Processing
Units/Peripherals 48.05 1.05 0.00 2.22
Computer Monitors/TV’s 29.25 0.62 0.00 1.69
Cell Phones 0.25 0.01 0.00 0.01
Other (Furniture &
Furnishings) 0.65 0.01 0.00 0.04
Textiles & Leathers 356.13 7.86 6.37 9.35
Diapers 249.24 5.52 3.37 7.67
Rubbers 18.23 0.40 0.00 0.82
Household hazardous
Materials 39.10 0.84 0.37 1.30
Oil Filters 1.60 0.04 0.00 0.10
Paints & Solvents 14.40 0.31 0.07 0.55
Pesticides, Herbicides,
Fungicides 7.90 0.17 0.00 0.47
Household Cleaners 1.75 0.04 0.00 0.08
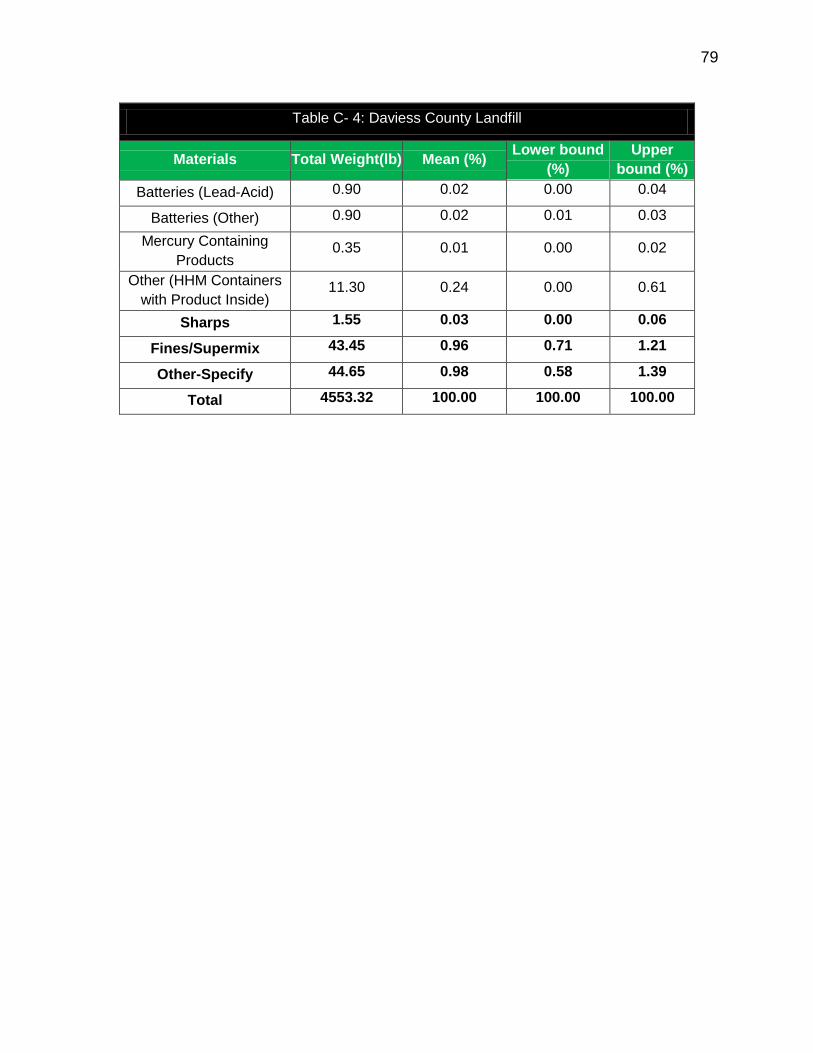
79
Table C- 4: Daviess County Landfill
Materials Total Weight(lb) Mean (%) Lower bound
(%)
Upper
bound (%)
Batteries (Lead-Acid) 0.90 0.02 0.00 0.04
Batteries (Other) 0.90 0.02 0.01 0.03
Mercury Containing
Products 0.35 0.01 0.00 0.02
Other (HHM Containers
with Product Inside) 11.30 0.24 0.00 0.61
Sharps 1.55 0.03 0.00 0.06
Fines/Supermix 43.45 0.96 0.71 1.21
Other-Specify 44.65 0.98 0.58 1.39
Total 4553.32 100.00 100.00 100.00

80
Table C- 5: Statewide MSW Annual Tonnage for Different Origins
Materials Urban Suburban Rural U/S S/R
Paper 1,042,983 170,064 268,941 90,111 173,223
OCC and Kraft bags 402,630 52,212 92,056 31,015 56,237
Newspaper 158,226 38,091 37,967 17,119 31,628
Magazines 62,284 20,462 20,780 8,273 17,114
High Grade/Office 186,480 21,343 43,736 13,568 24,954
Mixed Recyclable Paper
(including Books, Boxboard) 39,133 5,451 17,756 3,120 8,494
Compostable Paper 178,058 15,676 42,500 11,636 21,670
Other Non-recyclable,
Non-compostable Paper 16,172 16,830 14,144 5,379 13,127
Plastic 645,944 79,264 142,451 48,496 86,243
#1 PET Non-Deposit Beverage
Containers 45,571 7,828 10,256 4,049 7,290
#1 PET Deposit Beverage
Containers 33,884 7,369 9,786 3,445 6,904
#1 PET All Other Containers 34,988 1,863 5,485 1,945 2,715
#2 HDPE Containers 63,159 7,424 15,482 4,650 8,766
# 6 Styrofoam 22,136 5,586 9,592 2,467 5,934
All Other Numbered Containers
(#3,4,5,6,7) 26,782 4,511 8,329 2,354 4,980
Other Plastic – NOT Numbered 225,438 21,000 36,796 15,056 22,545
Film/Wrap/Bags 193,986 23,684 46,724 14,530 27,108
Metal 249,360 22,532 38,390 16,458 23,838
Aluminum Non-Deposit Beverage
Containers 14,764 3,678 5,925 1,632 3,781
Aluminum Deposit Beverage
Containers 3,158 879 1,298 375 866
Aluminum All Other Containers 2,200 2,981 1,299 926 1,937
Other Non-Ferrous Scrap 17,037 1,604 2,993 1,143 1,781
Ferrous Food & Beverage
Containers 44,404 9,656 13,586 4,514 9,293
Other Ferrous Scrap 167,797 3,734 13,289 7,869 6,181
Glass 78,816 25,106 34,261 10,248 23,820
Clear 48,548 13,920 19,560 5,879 13,389

81
Table C- 5: Statewide MSW Annual Tonnage for Different Origins
Materials Urban Suburban Rural U/S S/R
Green 9,683 2,073 2,551 975 1,877
Blue - - 101 - 33
Brown 20,584 9,113 12,049 3,394 8,522
Yard Waste 252,445 50,623 53,729 24,465 43,087
Food Waste 287,932 76,580 117,132 33,190 76,723
Wood 331,204 20,026 19,349 19,082 16,432
Non-Treated Wood 51,698 5,509 737 3,647 3,044
Treated Wood 279,506 14,518 18,612 15,435 13,388
Demolition/Renovation/
Construction Debris 270,300 1,980 30,129 11,543 10,710
Durables 135,549 21,819 22,095 11,632 18,229
All Electrical & Household
Appliances 29,351 6,795 12,231 3,100 7,400
Central Processing
Units/Peripherals - 1,513 4,514 425 2,224
Computer Monitors/TV’s - - 5,152 - 1,659
Cell Phones - 44 24 12 30
Other (Furniture & Furnishings) 106,199 13,466 174 8,095 6,916
Textiles & Leathers 218,686 22,366 53,846 15,165 28,730
Diapers 97,202 17,220 44,639 8,782 23,144
Rubbers 32,856 1,550 2,889 1,770 1,720
Household hazardous
Materials 7,875 9,400 7,865 2,957 7,321
Oil Filters 2,244 880 458 338 596
Paints & Solvents 3,974 5,106 3,936 1,594 3,868
Pesticides, Herbicides,
Fungicides - 862 775 242 689
Household Cleaners - 290 349 81 260
Batteries (Lead-Acid) - 288 84 81 174
Batteries (Other) 1,545 514 419 207 397
Mercury Containing Products 113 - 33 5 11
Other (HHM Containers with
Product Inside) - 1,460 1,811 410 1,327
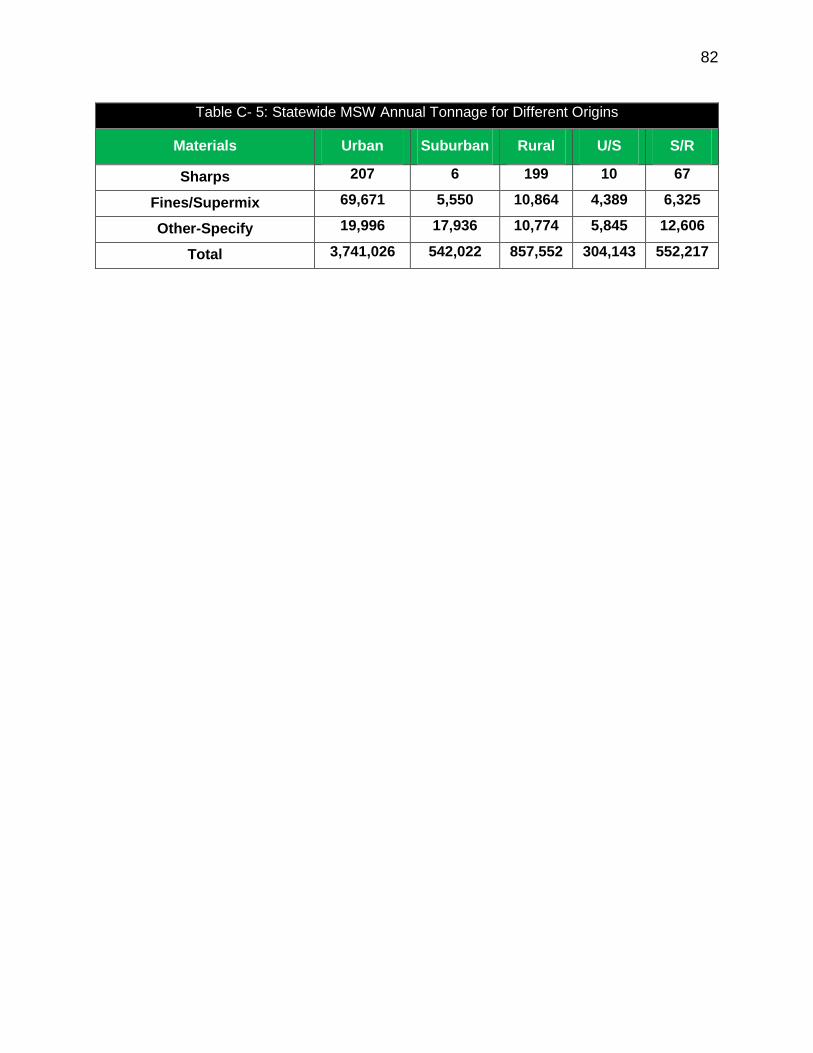
82
Table C- 5: Statewide MSW Annual Tonnage for Different Origins
Materials Urban Suburban Rural U/S S/R
Sharps 207 6 199 10 67
Fines/Supermix 69,671 5,550 10,864 4,389 6,325
Other-Specify 19,996 17,936 10,774 5,845 12,606
Total 3,741,026 542,022 857,552 304,143 552,217

83
Table C- 6: Statewide MSW Annual Tonnage Imported to IN
Materials IL OH MI KY Other
Paper 596,525 50,924 19,265 29,868 205
OCC and Kraft bags 249,752 17,431 7,437 9,697 67
Newspaper 69,576 7,189 2,923 5,454 37
Magazines 40,173 3,935 1,150 2,951 20
High Grade/Office 23,947 8,282 3,444 4,303 30
Mixed Recyclable Paper
(including Books,
Boxboard)
69,521 3,362 723 1,465 10
Compostable Paper 75,020 8,048 3,289 3,736 26
Other Non-recyclable,
Non-compostable Paper 68,537 2,678 299 2,263 16
Plastic 328,133 26,973 11,931 14,871 102
#1 PET Non-Deposit
Beverage Containers 24,365 1,942 842 1,257 9
#1 PET Deposit
Beverage Containers 1,963 1,853 626 1,191 8
#1 PET All Other
Containers - 1,039 646 468 3
#2 HDPE Containers 26,568 2,932 1,167 1,512 10
# 6 Styrofoam 19,371 1,816 409 1,023 7
All Other Numbered
Containers (#3,4,5,6,7) 19,663 1,577 495 859 6
Other Plastic – NOT
Numbered 127,356 6,967 4,164 3,887 27
Film/Wrap/Bags 108,848 8,847 3,583 4,674 32
Metal 121,288 7,269 4,606 4,110 28
Aluminum Non-Deposit
Beverage Containers - 1,122 273 652 4
Aluminum Deposit
Beverage Containers 9,620 246 58 149 1
Aluminum All Other
Containers 11,840 246 41 334 2
Other Non-Ferrous
Scrap 25,747 567 315 307 2
Ferrous Food &
Beverage Containers 23,831 2,572 820 1,602 11
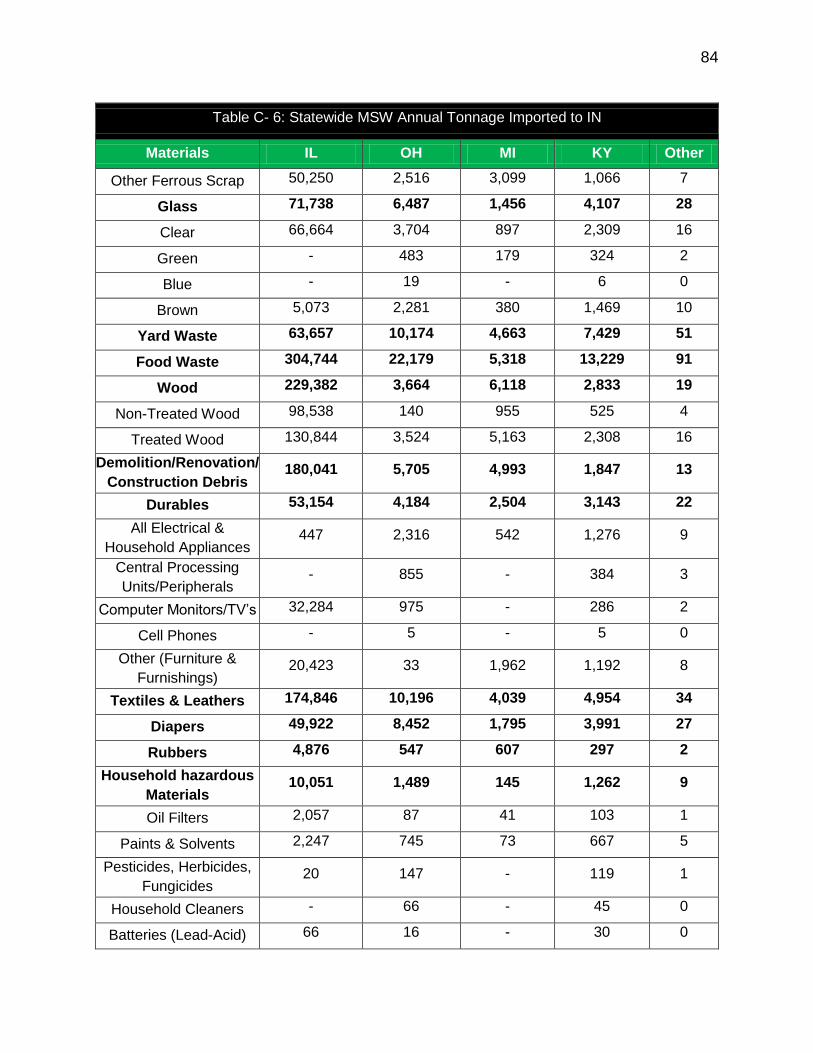
84
Table C- 6: Statewide MSW Annual Tonnage Imported to IN
Materials IL OH MI KY Other
Other Ferrous Scrap 50,250 2,516 3,099 1,066 7
Glass 71,738 6,487 1,456 4,107 28
Clear 66,664 3,704 897 2,309 16
Green - 483 179 324 2
Blue - 19 - 6 0
Brown 5,073 2,281 380 1,469 10
Yard Waste 63,657 10,174 4,663 7,429 51
Food Waste 304,744 22,179 5,318 13,229 91
Wood 229,382 3,664 6,118 2,833 19
Non-Treated Wood 98,538 140 955 525 4
Treated Wood 130,844 3,524 5,163 2,308 16
Demolition/Renovation/
Construction Debris 180,041 5,705 4,993 1,847 13
Durables 53,154 4,184 2,504 3,143 22
All Electrical &
Household Appliances 447 2,316 542 1,276 9
Central Processing
Units/Peripherals - 855 - 384 3
Computer Monitors/TV’s 32,284 975 - 286 2
Cell Phones - 5 - 5 0
Other (Furniture &
Furnishings) 20,423 33 1,962 1,192 8
Textiles & Leathers 174,846 10,196 4,039 4,954 34
Diapers 49,922 8,452 1,795 3,991 27
Rubbers 4,876 547 607 297 2
Household hazardous
Materials 10,051 1,489 145 1,262 9
Oil Filters 2,057 87 41 103 1
Paints & Solvents 2,247 745 73 667 5
Pesticides, Herbicides,
Fungicides 20 147 - 119 1
Household Cleaners - 66 - 45 0
Batteries (Lead-Acid) 66 16 - 30 0

85
Table C- 6: Statewide MSW Annual Tonnage Imported to IN
Materials IL OH MI KY Other
Batteries (Other) 1,072 79 29 68 0
Mercury Containing
Products 7 10 - 0 1
Other (HHM Containers
with Product Inside) 4,581 343 - 229 2
Sharps 494 38 4 12 0
Fines/Supermix 21,478 2,057 1,287 1,091 7
Other-Specify 65,848 2,040 369 2,174 15
Total 2,276,210* 162,379 69,099 95,217 653
**Rounding difference of 32.57 noted in final total
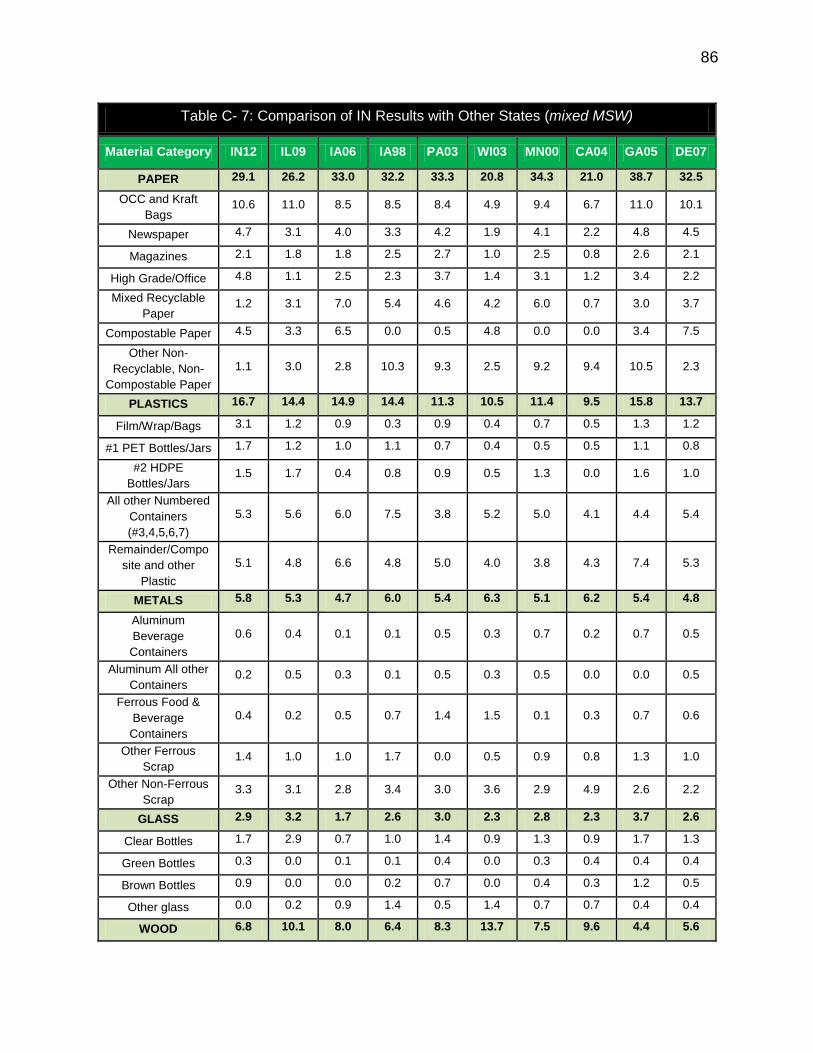
86
Table C- 7: Comparison of IN Results with Other States (mixed MSW)
Material Category IN12 IL09 IA06 IA98 PA03 WI03 MN00 CA04 GA05 DE07
PAPER 29.1 26.2 33.0 32.2 33.3 20.8 34.3 21.0 38.7 32.5
OCC and Kraft
Bags 10.6 11.0 8.5 8.5 8.4 4.9 9.4 6.7 11.0 10.1
Newspaper 4.7 3.1 4.0 3.3 4.2 1.9 4.1 2.2 4.8 4.5
Magazines 2.1 1.8 1.8 2.5 2.7 1.0 2.5 0.8 2.6 2.1
High Grade/Office 4.8 1.1 2.5 2.3 3.7 1.4 3.1 1.2 3.4 2.2
Mixed Recyclable
Paper 1.2 3.1 7.0 5.4 4.6 4.2 6.0 0.7 3.0 3.7
Compostable Paper 4.5 3.3 6.5 0.0 0.5 4.8 0.0 0.0 3.4 7.5
Other Non-
Recyclable, Non-
Compostable Paper
1.1 3.0 2.8 10.3 9.3 2.5 9.2 9.4 10.5 2.3
PLASTICS 16.7 14.4 14.9 14.4 11.3 10.5 11.4 9.5 15.8 13.7
Film/Wrap/Bags 3.1 1.2 0.9 0.3 0.9 0.4 0.7 0.5 1.3 1.2
#1 PET Bottles/Jars 1.7 1.2 1.0 1.1 0.7 0.4 0.5 0.5 1.1 0.8
#2 HDPE
Bottles/Jars 1.5 1.7 0.4 0.8 0.9 0.5 1.3 0.0 1.6 1.0
All other Numbered
Containers
(#3,4,5,6,7)
5.3 5.6 6.0 7.5 3.8 5.2 5.0 4.1 4.4 5.4
Remainder/Compo
site and other
Plastic
5.1 4.8 6.6 4.8 5.0 4.0 3.8 4.3 7.4 5.3
METALS 5.8 5.3 4.7 6.0 5.4 6.3 5.1 6.2 5.4 4.8
Aluminum
Beverage
Containers
0.6 0.4 0.1 0.1 0.5 0.3 0.7 0.2 0.7 0.5
Aluminum All other
Containers 0.2 0.5 0.3 0.1 0.5 0.3 0.5 0.0 0.0 0.5
Ferrous Food &
Beverage
Containers
0.4 0.2 0.5 0.7 1.4 1.5 0.1 0.3 0.7 0.6
Other Ferrous
Scrap 1.4 1.0 1.0 1.7 0.0 0.5 0.9 0.8 1.3 1.0
Other Non-Ferrous
Scrap 3.3 3.1 2.8 3.4 3.0 3.6 2.9 4.9 2.6 2.2
GLASS 2.9 3.2 1.7 2.6 3.0 2.3 2.8 2.3 3.7 2.6
Clear Bottles 1.7 2.9 0.7 1.0 1.4 0.9 1.3 0.9 1.7 1.3
Green Bottles 0.3 0.0 0.1 0.1 0.4 0.0 0.3 0.4 0.4 0.4
Brown Bottles 0.9 0.0 0.0 0.2 0.7 0.0 0.4 0.3 1.2 0.5
Other glass 0.0 0.2 0.9 1.4 0.5 1.4 0.7 0.7 0.4 0.4
WOOD 6.8 10.1 8.0 6.4 8.3 13.7 7.5 9.6 4.4 5.6

87
Table C- 7: Comparison of IN Results with Other States (mixed MSW)
Material Category IN12 IL09 IA06 IA98 PA03 WI03 MN00 CA04 GA05 DE07
Non-treated Wood 1.1 4.3 3.4 2.8 5.8 12.8 1.9 0.0 1.9 1.6
Treated Wood 5.7 5.7 4.6 3.6 2.5 0.9 5.6 9.6 2.5 4.0
ORGANIC 28.1 30.1 22.4 24.9 25.9 21.0 21.6 30.9 25.5 32.6
Food Waste 7.1 2.8 1.6 1.7 5.2 1.3 2.3 6.9 2.7 8.8
Yard Waste 9.9 13.4 10.6 10.7 12.0 10.2 12.4 14.6 12.0 12.7
Textiles and
Leather 5.6 7.7 4.9 4.2 3.8 2.4 2.7 2.4 4.0 4.6
Diapers 3.2 2.2 2.4 2.3 2.3 1.8 2.1 0.0 2.5 1.5
Rubber 0.7 0.2 0.5 0.8 1.7 0.6 0.8 0.3 0.2 1.4
Fines /Mixed-
Residue 1.6 3.8 2.4 5.2 1.0 4.6 1.4 6.8 4.1 3.6
INORGANIC 8.9 10.2 10.6 8.6 10.2 24.7 10.4 17.8 6.1 7.8
Demolition/
Renovation/
Construction Debris
5.4 7.9 5.5 4.8 5.8 16.6 2.8 9.6 2.0 4.5
Electronics 1.2 1.4 2.4 1.6 1.5 2.7 1.8 2.7 2.7 1.6
Furniture &
Furnishing 2.2 0.9 2.7 2.2 2.9 5.4 5.8 5.4 1.4 1.8
SPECIAL 1.7 0.5 4.8 4.9 2.5 0.8 7.0 2.7 0.4 0.4
Lead Acid Batteries 0.0 0.0 0.0 0.0 0.0 0.1 0.0 0.0 0.0 0.1
Other Batteries 0.1 0.0 0.2 0.1 0.0 0.1 0.1 0.1 0.0 0.0
Other Hazardous 0.5 0.4 4.1 4.8 0.3 0.6 1.1 1.5 0.4 0.2
Other-Specify 1.1 0.0 0.5 0.0 2.2 0.0 5.8 1.1 0.0 0.0
SUM 100.0 100.0 100.0 100.0 100.0 100.0 100.0 100.0 100.0 100.0

88
Appendix D. Data for All Waste Sorts
Table D-1 Bartholomew County Landfill Data
Table D-1: Bartholomew County Landfill Data (Columbus)
#1 (08/18/08-08/23/08 #2(08/18/08-08/23/08) #3(09/13/08-09/15/08)
Weather 77°F,sunny 77°F,sunny 74°F,cloudy
Origin N/A N/A N/A
Categories Material % Material % Material %
Paper 41.38 33.53 36.50
OCC and Kraft bags 34.90 15.80 23.90 10.64 19.45 8.79
Newspaper 1.00 0.45 20.00 8.90 17.65 7.98
Magazines 10.55 4.78 8.35 3.72 14.25 6.44
High Grade/Office 20.30 9.19 5.30 2.36 13.70 6.19
Mixed Recyclable Paper
(including Books, Boxboard) 11.90 5.39 2.15 0.96 3.45 1.56
Compostable Paper 10.65 4.82 13.40 5.97 9.20 4.16
Other Non-recyclable,
Non-compostable Paper 2.10 0.95 2.20 0.98 3.05 1.38
Plastic 20.83 19.81 11.05
#1 PET Non-Deposit Beverage
Containers 7.55 3.42 4.65 2.07 0.20 0.09
#1 PET Deposit Beverage
Containers 18.80 8.51 5.10 2.27 2.10 0.95
#1 PET All Other Containers 0.70 0.32 1.15 0.51 0.65 0.29
#2 HDPE Containers 0.30 0.14 5.20 2.32 2.25 1.02
# 6 Styrofoam 1.75 0.79 2.65 1.18 1.50 0.68
All Other Numbered
Containers (#3,4,5,6,7) 1.30 0.59 0.55 0.24 0.55 0.25
Other Plastic – NOT
Numbered 5.40 2.45 13.35 5.94 8.05 3.64
Film/Wrap/Bags 10.20 4.62 11.85 5.28 9.15 4.14
Metal 2.81 4.50 3.37
Aluminum Non-Deposit
Beverage Containers 3.10 1.40 3.30 1.47 1.85 0.84
Aluminum Deposit Beverage
Containers 0.00 0.00 0.00 0.00 0.00 0.00
Aluminum All Other Containers 0.20 0.09 0.50 0.22 0.35 0.16
Other Non-Ferrous Scrap 1.40 0.63 0.00 0.00 0.00 0.00
Ferrous Food & Beverage
Containers 1.30 0.59 5.80 2.58 5.25 2.37
Other Ferrous Scrap 0.20 0.09 0.50 0.22 0.00 0.00
Glass 3.24 4.34 0.47
Clear 6.90 3.12 9.75 4.34 1.05 0.47
Green 0.00 0.00 0.00 0.00 0.00 0.00
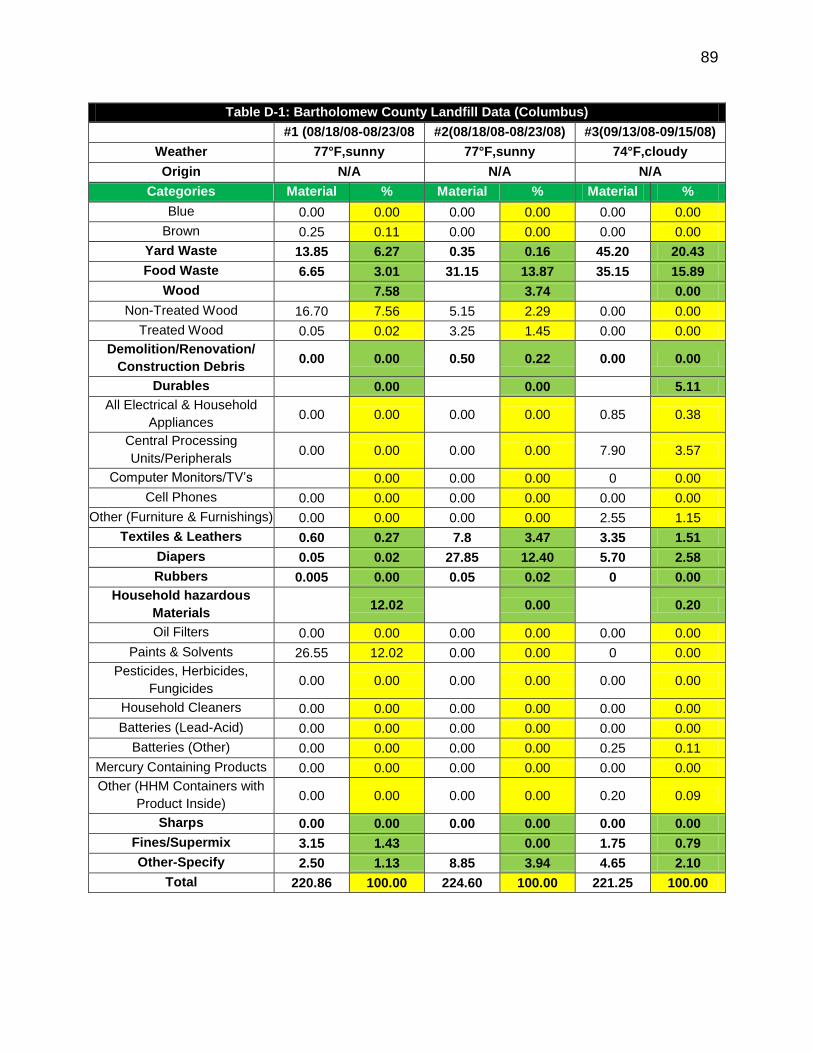
89
Table D-1: Bartholomew County Landfill Data (Columbus)
#1 (08/18/08-08/23/08 #2(08/18/08-08/23/08) #3(09/13/08-09/15/08)
Weather 77°F,sunny 77°F,sunny 74°F,cloudy
Origin N/A N/A N/A
Categories Material % Material % Material %
Blue 0.00 0.00 0.00 0.00 0.00 0.00
Brown 0.25 0.11 0.00 0.00 0.00 0.00
Yard Waste 13.85 6.27 0.35 0.16 45.20 20.43
Food Waste 6.65 3.01 31.15 13.87 35.15 15.89
Wood 7.58 3.74 0.00
Non-Treated Wood 16.70 7.56 5.15 2.29 0.00 0.00
Treated Wood 0.05 0.02 3.25 1.45 0.00 0.00
Demolition/Renovation/
Construction Debris 0.00 0.00 0.50 0.22 0.00 0.00
Durables 0.00 0.00 5.11
All Electrical & Household
Appliances 0.00 0.00 0.00 0.00 0.85 0.38
Central Processing
Units/Peripherals 0.00 0.00 0.00 0.00 7.90 3.57
Computer Monitors/TV’s 0.00 0.00 0.00 0 0.00
Cell Phones 0.00 0.00 0.00 0.00 0.00 0.00
Other (Furniture & Furnishings) 0.00 0.00 0.00 0.00 2.55 1.15
Textiles & Leathers 0.60 0.27 7.8 3.47 3.35 1.51
Diapers 0.05 0.02 27.85 12.40 5.70 2.58
Rubbers 0.005 0.00 0.05 0.02 0 0.00
Household hazardous
Materials 12.02 0.00 0.20
Oil Filters 0.00 0.00 0.00 0.00 0.00 0.00
Paints & Solvents 26.55 12.02 0.00 0.00 0 0.00
Pesticides, Herbicides,
Fungicides 0.00 0.00 0.00 0.00 0.00 0.00
Household Cleaners 0.00 0.00 0.00 0.00 0.00 0.00
Batteries (Lead-Acid) 0.00 0.00 0.00 0.00 0.00 0.00
Batteries (Other) 0.00 0.00 0.00 0.00 0.25 0.11
Mercury Containing Products 0.00 0.00 0.00 0.00 0.00 0.00
Other (HHM Containers with
Product Inside) 0.00 0.00 0.00 0.00 0.20 0.09
Sharps 0.00 0.00 0.00 0.00 0.00 0.00
Fines/Supermix 3.15 1.43 0.00 1.75 0.79
Other-Specify 2.50 1.13 8.85 3.94 4.65 2.10
Total 220.86 100.00 224.60 100.00 221.25 100.00
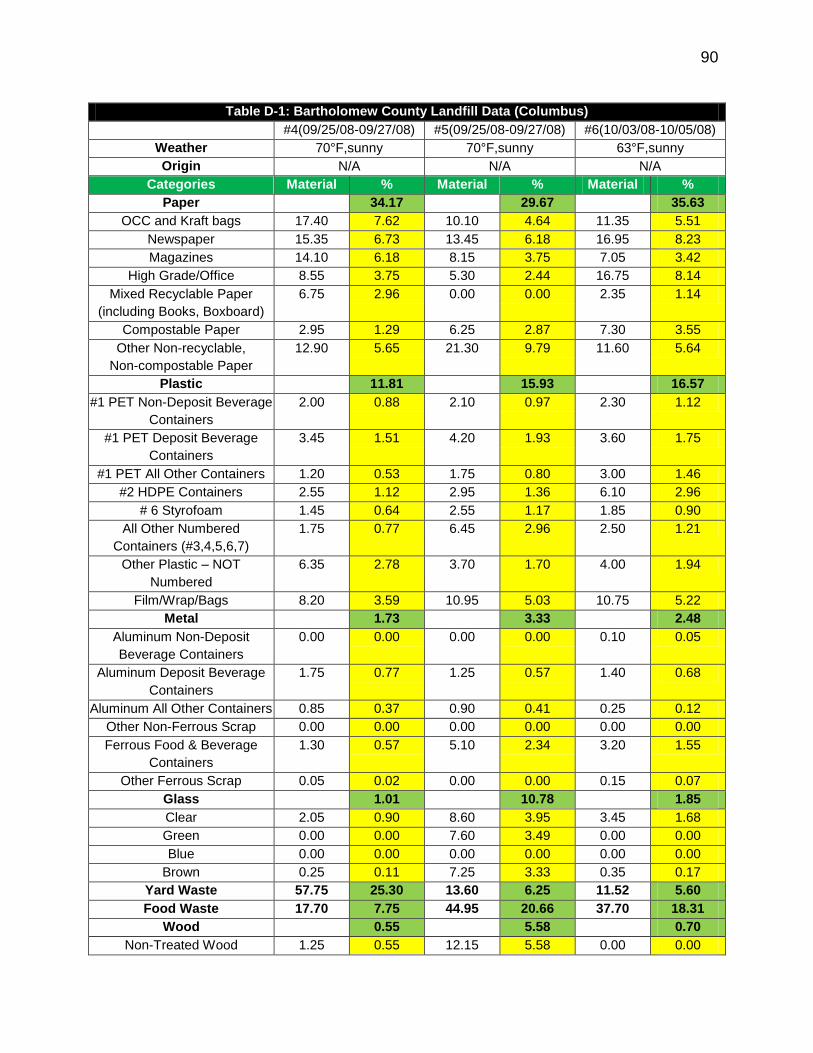
90
Table D-1: Bartholomew County Landfill Data (Columbus)
#4(09/25/08-09/27/08) #5(09/25/08-09/27/08) #6(10/03/08-10/05/08)
Weather 70°F,sunny 70°F,sunny 63°F,sunny
Origin N/A N/A N/A
Categories Material % Material % Material %
Paper 34.17 29.67 35.63
OCC and Kraft bags 17.40 7.62 10.10 4.64 11.35 5.51
Newspaper 15.35 6.73 13.45 6.18 16.95 8.23
Magazines 14.10 6.18 8.15 3.75 7.05 3.42
High Grade/Office 8.55 3.75 5.30 2.44 16.75 8.14
Mixed Recyclable Paper
(including Books, Boxboard)
6.75 2.96 0.00 0.00 2.35 1.14
Compostable Paper 2.95 1.29 6.25 2.87 7.30 3.55
Other Non-recyclable,
Non-compostable Paper
12.90 5.65 21.30 9.79 11.60 5.64
Plastic 11.81 15.93 16.57
#1 PET Non-Deposit Beverage
Containers
2.00 0.88 2.10 0.97 2.30 1.12
#1 PET Deposit Beverage
Containers
3.45 1.51 4.20 1.93 3.60 1.75
#1 PET All Other Containers 1.20 0.53 1.75 0.80 3.00 1.46
#2 HDPE Containers 2.55 1.12 2.95 1.36 6.10 2.96
# 6 Styrofoam 1.45 0.64 2.55 1.17 1.85 0.90
All Other Numbered
Containers (#3,4,5,6,7)
1.75 0.77 6.45 2.96 2.50 1.21
Other Plastic – NOT
Numbered
6.35 2.78 3.70 1.70 4.00 1.94
Film/Wrap/Bags 8.20 3.59 10.95 5.03 10.75 5.22
Metal 1.73 3.33 2.48
Aluminum Non-Deposit
Beverage Containers
0.00 0.00 0.00 0.00 0.10 0.05
Aluminum Deposit Beverage
Containers
1.75 0.77 1.25 0.57 1.40 0.68
Aluminum All Other Containers 0.85 0.37 0.90 0.41 0.25 0.12
Other Non-Ferrous Scrap 0.00 0.00 0.00 0.00 0.00 0.00
Ferrous Food & Beverage
Containers
1.30 0.57 5.10 2.34 3.20 1.55
Other Ferrous Scrap 0.05 0.02 0.00 0.00 0.15 0.07
Glass 1.01 10.78 1.85
Clear 2.05 0.90 8.60 3.95 3.45 1.68
Green 0.00 0.00 7.60 3.49 0.00 0.00
Blue 0.00 0.00 0.00 0.00 0.00 0.00
Brown 0.25 0.11 7.25 3.33 0.35 0.17
Yard Waste 57.75 25.30 13.60 6.25 11.52 5.60
Food Waste 17.70 7.75 44.95 20.66 37.70 18.31
Wood 0.55 5.58 0.70
Non-Treated Wood 1.25 0.55 12.15 5.58 0.00 0.00

91
Table D-1: Bartholomew County Landfill Data (Columbus)
#4(09/25/08-09/27/08) #5(09/25/08-09/27/08) #6(10/03/08-10/05/08)
Weather 70°F,sunny 70°F,sunny 63°F,sunny
Origin N/A N/A N/A
Categories Material % Material % Material %
Treated Wood 0.00 0.00 0 0.00 1.45 0.70
Demolition/Renovation/
Construction Debris
0.00 0.00 0.00 0.00 0.00 0.00
Durables 1.29 0.00 2.23
All Electrical & Household
Appliances
2.90 1.27 0.00 0.00 0.30 0.15
Central Processing
Units/Peripherals
0.05 0.02 0.00 0.00 4.10 1.99
Computer Monitors/TV’s 0 0.00 0.00 0.00 0 0.00
Cell Phones 0.00 0.00 0.00 0.00 0.20 0.10
Other (Furniture & Furnishings) 0.00 0.00 0.00 0.00 0.00 0.00
Textiles & Leathers 7.70 3.37 4.25 1.95 10.85 5.27
Diapers 10.50 4.60 5.6 2.57 10.70 5.20
Rubbers 0.05 0.02 0.00 0.00 1.3 0.63
Household hazardous
Materials
2.21 0.30 0.60
Oil Filters 0.00 0.00 0.00 0.00 0.00 0.00
Paints & Solvents 4.9 2.15 0.00 0.00 0 0.00
Pesticides, Herbicides,
Fungicides
0.00 0.00 0.00 0.00 0.00 0.00
Household Cleaners 0.00 0.00 0.00 0.00 0.25 0.12
Batteries (Lead-Acid) 0.00 0.00 0.00 0.00 0.00 0.00
Batteries (Other) 0.15 0.07 0.15 0.07 0.70 0.34
Mercury Containing Products 0.00 0.00 0.00 0.00 0.00 0.00
Other (HHM Containers with
Product Inside)
0.00 0.00 0.50 0.23 0.28 0.14
Sharps 0.00 0.00 0.00 0.00 0.00 0.00
Fines/Supermix 4.8 2.10 0.00 3.1 1.51
Other-Specify 9.30 4.07 6.45 2.96 7.05 3.42
Total 228.25 100.00 217.55 100.00 205.85 100.00

92
Table D-1: Bartholomew County Landfill Data (Columbus)
#7(10/03/08-10/05/08) #8(10/03/08-10/05/08) #9(10/25/08)
Weather 63°F,sunny 63°F,sunny 49°F,sunny
Origin N/A N/A N/A
Categories Material % Material % Material %
Paper 40.32 23.28 27.45
OCC and Kraft bags 35.30 15.68 12.90 6.01 13.80 6.10
Newspaper 26.85 11.93 4.45 2.07 20.70 9.14
Magazines 5.20 2.31 4.30 2.00 9.45 4.17
High Grade/Office 4.60 2.04 11.80 5.50 3.55 1.57
Mixed Recyclable Paper
(including Books, Boxboard) 6.55 2.91 0.15 0.07 1.30 0.57
Compostable Paper 5.85 2.60 9.25 4.31 7.10 3.14
Other Non-recyclable,
Non-compostable Paper 6.40 2.84 7.10 3.31 6.25 2.76
Plastic 20.17 18.64 11.93
#1 PET Non-Deposit Beverage
Containers 1.45 0.64 7.55 3.52 1.55 0.68
#1 PET Deposit Beverage
Containers 3.05 1.35 6.45 3.01 1.75 0.77
#1 PET All Other Containers 1.45 0.64 2.40 1.12 0.45 0.20
#2 HDPE Containers 3.15 1.40 1.85 0.86 3.40 1.50
# 6 Styrofoam 3.20 1.42 2.80 1.30 2.55 1.13
All Other Numbered
Containers (#3,4,5,6,7) 3.05 1.35 2.40 1.12 2.10 0.93
Other Plastic – NOT
Numbered 18.50 8.22 6.00 2.80 3.30 1.46
Film/Wrap/Bags 11.55 5.13 10.55 4.92 11.90 5.26
Metal 6.42 5.14 4.33
Aluminum Non-Deposit
Beverage Containers 0.85 0.38 2.30 1.07 3.00 1.33
Aluminum Deposit Beverage
Containers 0.80 0.36 0.00 0.00 0.00 0.00
Aluminum All Other Containers 0.20 0.09 0.55 0.26 0.65 0.29
Other Non-Ferrous Scrap 7.30 3.24 1.75 0.82 0.10 0.04
Ferrous Food & Beverage
Containers 3.75 1.67 5.98 2.79 6.05 2.67
Other Ferrous Scrap 1.55 0.69 0.45 0.21 0.00 0.00
Glass 2.20 7.95 16.30
Clear 3.60 1.60 11.85 5.52 4.05 1.79
Green 0.40 0.18 0.00 0.00 2.75 1.21
Blue 0.00 0.00 0.00 0.00 0.00 0.00
Brown 0.95 0.42 5.20 2.42 30.10 13.30
Yard Waste 3.05 1.35 11.05 5.15 1.80 0.80

93
Table D-1: Bartholomew County Landfill Data (Columbus)
#7(10/03/08-10/05/08) #8(10/03/08-10/05/08) #9(10/25/08)
Weather 63°F,sunny 63°F,sunny 49°F,sunny
Origin N/A N/A N/A
Categories Material % Material % Material %
Food Waste 22.25 9.88 27.20 12.68 17.05 7.53
Wood 1.49 3.31 0.33
Non-Treated Wood 0.00 0.00 0.00 0.00 0.60 0.27
Treated Wood 3.35 1.49 7.10 3.31 0.15 0.07
Demolition/Renovation/
Construction Debris 1.10 0.49 0.00 0.00 0.25 0.11
Durables 1.55 2.49 2.12
All Electrical & Household
Appliances 3.35 1.49 0.00 0.00 2.25 0.99
Central Processing
Units/Peripherals 0.00 0.00 0.00 0.00 0.00 0.00
Computer Monitors/TV’s 0.00 0.00 0.00 0.00 0 0.00
Cell Phones 0.15 0.07 0.00 0.00 0.00 0.00
Other (Furniture & Furnishings) 0.00 0.00 5.35 2.49 2.55 1.13
Textiles & Leathers 15.95 7.09 9.75 4.54 26.15 11.55
Diapers 7.45 3.31 24.95 11.63 1.65 0.73
Rubbers 0.00 0.00 0.90 0.42 0 0.00
Household hazardous
Materials 0.16 0.49 0.00
Oil Filters 0.00 0.00 0.00 0.00 0.00 0.00
Paints & Solvents 0.00 0.00 0.00 0.00 0 0.00
Pesticides, Herbicides,
Fungicides 0.00 0.00 0.00 0.00 0.00 0.00
Household Cleaners 0.05 0.02 0.00 0.00 0.00 0.00
Batteries (Lead-Acid) 0.00 0.00 0.20 0.09 0.00 0.00
Batteries (Other) 0.30 0.13 0.05 0.02 0.00 0.00
Mercury Containing Products 0.00 0.00 0.00 0.00 0.00 0.00
Other (HHM Containers with
Product Inside) 0.00 0.00 0.80 0.37 0.00 0.00
Sharps 0.00 0.00 0.00 0.00 0.05 0.02
Fines/Supermix 2.75 1.22 5.00 2.33 3.6 1.59
Other-Specify 9.8 4.35 4.20 1.96 34.45 15.22
Total 225.10 100.00 214.58 100.00 226.40 100.00
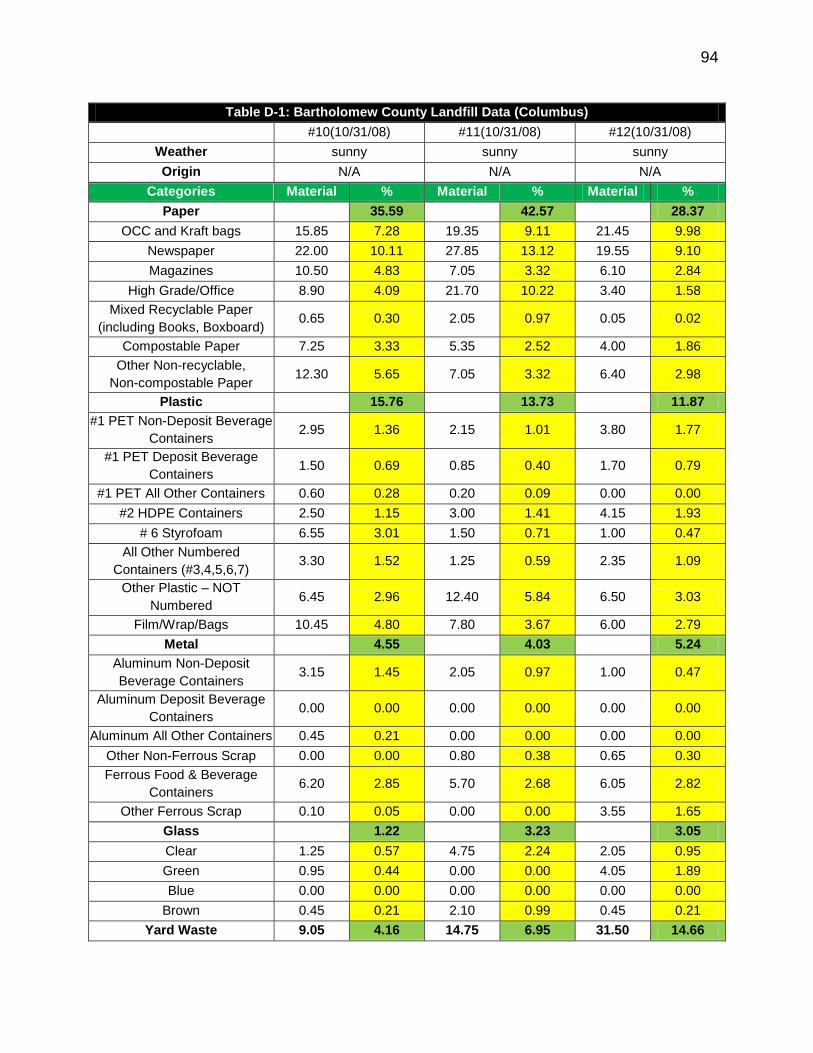
94
Table D-1: Bartholomew County Landfill Data (Columbus)
#10(10/31/08) #11(10/31/08) #12(10/31/08)
Weather sunny sunny sunny
Origin N/A N/A N/A
Categories Material % Material % Material %
Paper 35.59 42.57 28.37
OCC and Kraft bags 15.85 7.28 19.35 9.11 21.45 9.98
Newspaper 22.00 10.11 27.85 13.12 19.55 9.10
Magazines 10.50 4.83 7.05 3.32 6.10 2.84
High Grade/Office 8.90 4.09 21.70 10.22 3.40 1.58
Mixed Recyclable Paper
(including Books, Boxboard) 0.65 0.30 2.05 0.97 0.05 0.02
Compostable Paper 7.25 3.33 5.35 2.52 4.00 1.86
Other Non-recyclable,
Non-compostable Paper 12.30 5.65 7.05 3.32 6.40 2.98
Plastic 15.76 13.73 11.87
#1 PET Non-Deposit Beverage
Containers 2.95 1.36 2.15 1.01 3.80 1.77
#1 PET Deposit Beverage
Containers 1.50 0.69 0.85 0.40 1.70 0.79
#1 PET All Other Containers 0.60 0.28 0.20 0.09 0.00 0.00
#2 HDPE Containers 2.50 1.15 3.00 1.41 4.15 1.93
# 6 Styrofoam 6.55 3.01 1.50 0.71 1.00 0.47
All Other Numbered
Containers (#3,4,5,6,7) 3.30 1.52 1.25 0.59 2.35 1.09
Other Plastic – NOT
Numbered 6.45 2.96 12.40 5.84 6.50 3.03
Film/Wrap/Bags 10.45 4.80 7.80 3.67 6.00 2.79
Metal 4.55 4.03 5.24
Aluminum Non-Deposit
Beverage Containers 3.15 1.45 2.05 0.97 1.00 0.47
Aluminum Deposit Beverage
Containers 0.00 0.00 0.00 0.00 0.00 0.00
Aluminum All Other Containers 0.45 0.21 0.00 0.00 0.00 0.00
Other Non-Ferrous Scrap 0.00 0.00 0.80 0.38 0.65 0.30
Ferrous Food & Beverage
Containers 6.20 2.85 5.70 2.68 6.05 2.82
Other Ferrous Scrap 0.10 0.05 0.00 0.00 3.55 1.65
Glass 1.22 3.23 3.05
Clear 1.25 0.57 4.75 2.24 2.05 0.95
Green 0.95 0.44 0.00 0.00 4.05 1.89
Blue 0.00 0.00 0.00 0.00 0.00 0.00
Brown 0.45 0.21 2.10 0.99 0.45 0.21
Yard Waste 9.05 4.16 14.75 6.95 31.50 14.66

95
Table D-1: Bartholomew County Landfill Data (Columbus)
#10(10/31/08) #11(10/31/08) #12(10/31/08)
Weather sunny sunny sunny
Origin N/A N/A N/A
Categories Material % Material % Material %
Food Waste 48.45 22.27 31.05 14.62 38.25 17.80
Wood 1.08 2.64 0.35
Non-Treated Wood 1.75 0.80 0.00 0.00 0.75 0.35
Treated Wood 0.60 0.28 5.6 2.64 0.00 0.00
Demolition/Renovation/
Construction Debris 0.00 0.00 0.00 0.00 0.00 0.00
Durables 0.78 0.00 0.00 3.19
All Electrical & Household
Appliances 1.70 0.78 0.00 0.00 6.85 3.19
Central Processing
Units/Peripherals 0.00 0.00 0.00 0.00 0.00 0.00
Computer Monitors/TV’s 0 0.00 0.00 0.00 0.00 0.00
Cell Phones 0.00 0.00 0.00 0.00 0.00 0.00
Other (Furniture & Furnishings) 0.00 0.00 0.00 0.00 0.00 0.00
Textiles & Leathers 9.10 4.18 3.35 1.58 15.95 7.42
Diapers 8.05 3.70 6.15 2.90 4.15 1.93
Rubbers 1.85 0.85 0.05 0.02 0.00 0.00
Household hazardous
Materials 4.27 0.09 1.77
Oil Filters 0.00 0.00 0.00 0.00 0.00 0.00
Paints & Solvents 0 0.00 0.00 0.00 3.10 1.44
Pesticides, Herbicides,
Fungicides 0.00 0.00 0.00 0.00 0.00 0.00
Household Cleaners 0.15 0.07 0.00 0.00 0.70 0.33
Batteries (Lead-Acid) 0.00 0.00 0.00 0.00 0.00 0.00
Batteries (Other) 0.40 0.18 0.20 0.09 0.00 0.00
Mercury Containing Products 0.00 0.00 0.00 0.00 0.00 0.00
Other (HHM Containers with
Product Inside) 8.75 4.02 0.00 0.00 0.00 0.00
Sharps 0.00 0.00 0.00 0.00 0.00 0.00
Fines/Supermix 3.45 1.59 2 0.94 2.90 1.35
Other-Specify 0.00 0.00 14.25 6.71 6.45 3.00
Total 217.60 100.00 212.35 100.00 214.85 100.00

96
Table D-1: Bartholomew County Landfill Data (Columbus)
#13(11/1/08) #14(11/6/08) #15(11/6/08)
Weather 58°F,cloudy 65°F,sunny 65°F,sunny
Origin N/A N/A N/A
Categories Material % Material % Material %
Paper 29.88 23.17 23.82
OCC and Kraft bags 35.70 16.50 29.44 14.63 25.95 12.90
Newspaper 13.40 6.19 2.35 1.17 9.15 4.55
Magazines 1.90 0.88 0.55 0.27 0.76 0.38
High Grade/Office 2.65 1.22 5.65 2.81 4.05 2.01
Mixed Recyclable Paper
(including Books, Boxboard) 0.90 0.42 0.95 0.47 0.30 0.15
Compostable Paper 4.70 2.17 1.90 0.94 2.70 1.34
Other Non-recyclable,
Non-compostable Paper 5.40 2.50 5.80 2.88 5.00 2.49
Plastic 10.15 20.73 15.00
#1 PET Non-Deposit Beverage
Containers 2.20 1.02 6.31 3.13 4.25 2.11
#1 PET Deposit Beverage
Containers 0.85 0.39 0.35 0.17 0.05 0.02
#1 PET All Other Containers 0.00 0.00 0.00 0.00 0.00 0.00
#2 HDPE Containers 3.15 1.46 5.10 2.53 2.40 1.19
# 6 Styrofoam 2.05 0.95 0.65 0.32 1.85 0.92
All Other Numbered
Containers (#3,4,5,6,7) 2.10 0.97 0.55 0.27 0.55 0.27
Other Plastic – NOT
Numbered 3.30 1.53 17.45 8.67 14.46 7.19
Film/Wrap/Bags 8.30 3.84 11.31 5.62 6.60 3.28
Metal 8.53 5.99 1.74
Aluminum Non-Deposit
Beverage Containers 2.30 1.06 1.35 0.67 0.65 0.32
Aluminum Deposit Beverage
Containers 0.00 0.00 1.70 0.84 0.00 0.00
Aluminum All Other Containers 0.10 0.05 5.45 2.71 0.00 0.00
Other Non-Ferrous Scrap 0.00 0.00 0.00 0.00 0.00 0.00
Ferrous Food & Beverage
Containers 7.70 3.56 1.00 0.50 1.20 0.60
Other Ferrous Scrap 8.35 3.86 2.55 1.27 1.65 0.82
Glass 5.92 1.99 5.64
Clear 2.25 1.04 0.00 0.00 6.40 3.18
Green 0.00 0.00 0.00 0.00 0.00 0.00
Blue 0.00 0.00 0.00 0.00 0.00 0.00
Brown 10.55 4.88 4.00 1.99 4.95 2.46
Yard Waste 30.70 14.19 18.45 9.17 30.45 15.14

97
Table D-1: Bartholomew County Landfill Data (Columbus)
#13(11/1/08) #14(11/6/08) #15(11/6/08)
Weather 58°F,cloudy 65°F,sunny 65°F,sunny
Origin N/A N/A N/A
Categories Material % Material % Material %
Food Waste 27.40 12.66 24.50 12.17 21.70 10.79
Wood 9.41 2.98 2.26
Non-Treated Wood 0.00 0.00 0.00 0.00 0.00 0.00
Treated Wood 20.35 9.41 6.00 2.98 4.55 2.26
Demolition/Renovation/
Construction Debris 0.00 0.00 7.45 3.70 5.60 2.78
Durables 0.00 2.08 10.36 12.82
All Electrical & Household
Appliances 4.50 2.08 6.65 3.30 9.15 4.55
Central Processing
Units/Peripherals 0.00 0.00 0.00 0.00 0.00 0.00
Computer Monitors/TV’s 0.00 0.00 0 0.00 0.00 0.00
Cell Phones 0.00 0.00 0.00 0.00 0.00 0.00
Other (Furniture & Furnishings) 0.00 0.00 14.20 7.05 16.63 8.27
Textiles & Leathers 2.25 1.04 11.30 5.61 11.7 5.82
Diapers 0.85 0.39 3.60 1.79 1.6 0.80
Rubbers 0.05 0.02 1.4 0.70 0.05 0.02
Household hazardous
Materials 0.67 0.07 0.94
Oil Filters 0.00 0.00 0.00 0.00 0.00 0.00
Paints & Solvents 0.00 0.00 0 0.00 0.00 0.00
Pesticides, Herbicides,
Fungicides 0.00 0.00 0.00 0.00 0.00 0.00
Household Cleaners 0.85 0.39 0.00 0.00 0.00 0.00
Batteries (Lead-Acid) 0.00 0.00 0.15 0.07 0.95 0.47
Batteries (Other) 0.60 0.28 0.00 0.00 0.00 0.00
Mercury Containing Products 0.00 0.00 0.00 0.00 0.00 0.00
Other (HHM Containers with
Product Inside) 0.00 0.00 0.00 0.00 0.95 0.47
Sharps 0.00 0.00 0.00 0.00 0.00 0.00
Fines/Supermix 2.70 1.25 0.15 0.07 2.1 1.04
Other-Specify 8.25 3.81 3.03 1.51 2.75 1.37
Total 216.35 100.00 201.29 100.00 201.10 100.00

98
Table D-1: Bartholomew County Landfill Data (Columbus)
#16(11/608) #17(11/6/08) #18(11/12/08)
Weather 65°F,sunny 65°F,sunny 46°F,cloudy
Origin N/A N/A N/A
Categories Material % Material % Material %
Paper 16.40 23.21 25.01
OCC and Kraft bags 9.50 4.32 24.00 9.22 12.60 6.14
Newspaper 3.30 1.50 12.35 4.75 12.60 6.14
Magazines 9.60 4.36 5.30 2.04 8.55 4.16
High Grade/Office 3.05 1.39 6.65 2.56 10.20 4.97
Mixed Recyclable Paper
(including Books, Boxboard) 0.05 0.02 0.30 0.12 0.00 0.00
Compostable Paper 8.95 4.07 6.30 2.42 3.25 1.58
Other Non-recyclable,
Non-compostable Paper 1.65 0.75 5.50 2.11 4.15 2.02
Plastic 15.66 11.18 8.38
#1 PET Non-Deposit Beverage
Containers 2.15 0.98 3.85 1.48 1.00 0.49
#1 PET Deposit Beverage
Containers 1.30 0.59 0.00 0.00 1.40 0.68
#1 PET All Other Containers 0.90 0.41 0.05 0.02 0.25 0.12
#2 HDPE Containers 2.78 1.26 4.20 1.61 1.85 0.90
# 6 Styrofoam 0.80 0.36 1.45 0.56 2.05 1.00
All Other Numbered
Containers (#3,4,5,6,7) 0.60 0.27 0.55 0.21 1.35 0.66
Other Plastic – NOT
Numbered 6.85 3.11 11.70 4.50 4.40 2.14
Film/Wrap/Bags 19.10 8.68 7.30 2.81 4.90 2.39
Metal 0.70 10.78 4.02
Aluminum Non-Deposit
Beverage Containers 0.50 0.23 0.65 0.25 1.75 0.85
Aluminum Deposit Beverage
Containers 0.05 0.02 0.00 0.00 0.00 0.00
Aluminum All Other Containers 0.20 0.09 15.45 5.94 0.00 0.00
Other Non-Ferrous Scrap 0.20 0.09 0.00 0.00 0.10 0.05
Ferrous Food & Beverage
Containers 0.20 0.09 1.15 0.44 5.60 2.73
Other Ferrous Scrap 0.40 0.18 10.80 4.15 0.80 0.39
Glass 0.20 0.23 16.56
Clear 0.00 0.00 0.00 0.00 28.85 14.05
Green 0.00 0.00 0.00 0.00 0.00 0.00
Blue 0.00 0.00 0.00 0.00 0.00 0.00
Brown 0.45 0.20 0.60 0.23 5.15 2.51
Yard Waste 33.60 15.26 15.55 5.98 13.65 6.65

99
Table D-1: Bartholomew County Landfill Data (Columbus)
#16(11/608) #17(11/6/08) #18(11/12/08)
Weather 65°F,sunny 65°F,sunny 46°F,cloudy
Origin N/A N/A N/A
Categories Material % Material % Material %
Food Waste 60.20 27.35 15.50 5.96 40.60 19.77
Wood 0.52 22.04 2.46
Non-Treated Wood 0.00 0.00 0.00 0.00 2.50 1.22
Treated Wood 1.15 0.52 57.35 22.04 2.55 1.24
Demolition/Renovation/
Construction Debris 0.00 0.00 0.00 0.00 0.00 0.00
Durables 0.00 22.01 0.00 1.36 7.48
All Electrical & Household
Appliances 1.05 0.48 3.55 1.36 3.60 1.75
Central Processing
Units/Peripherals 0.00 0.00 0.00 0.00 0.00 0.00
Computer Monitors/TV’s 0.00 0.00 0.00 0.00 0 0.00
Cell Phones 0.00 0.00 0.00 0.00 0.00 0.00
Other (Furniture & Furnishings) 47.40 21.53 0.00 0.00 11.75 5.72
Textiles & Leathers 2.65 1.20 6.10 2.34 10.55 5.14
Diapers 0.00 0.00 6.90 2.65 0.80 0.39
Rubbers 0.05 0.02 7.65 2.94 0 0.00
Household hazardous
Materials 0.25 9.65 0.19
Oil Filters 0.00 0.00 8.45 3.25 0.00 0.00
Paints & Solvents 0.00 0.00 6.75 2.59 0 0.00
Pesticides, Herbicides,
Fungicides 0.00 0.00 7.90 3.04 0.30 0.15
Household Cleaners 0.00 0.00 0.00 0.00 0.10 0.05
Batteries (Lead-Acid) 0.55 0.25 0.45 0.17 0.00 0.00
Batteries (Other) 0.00 0.00 1.55 0.60 0.00 0.00
Mercury Containing Products 0.00 0.00 0.00 0.00 0.00 0.00
Other (HHM Containers with
Product Inside) 0.00 0.00 0.00 0.00 0.00 0.00
Sharps 0.00 0.00 0.00 0.00 0.00 0.00
Fines/Supermix 0.90 0.41 2.95 1.13 2.2 1.07
Other-Specify 0.00 0.00 1.40 0.54 5.95 2.90
Total 220.13 100.00 260.20 100.00 205.35 100.00
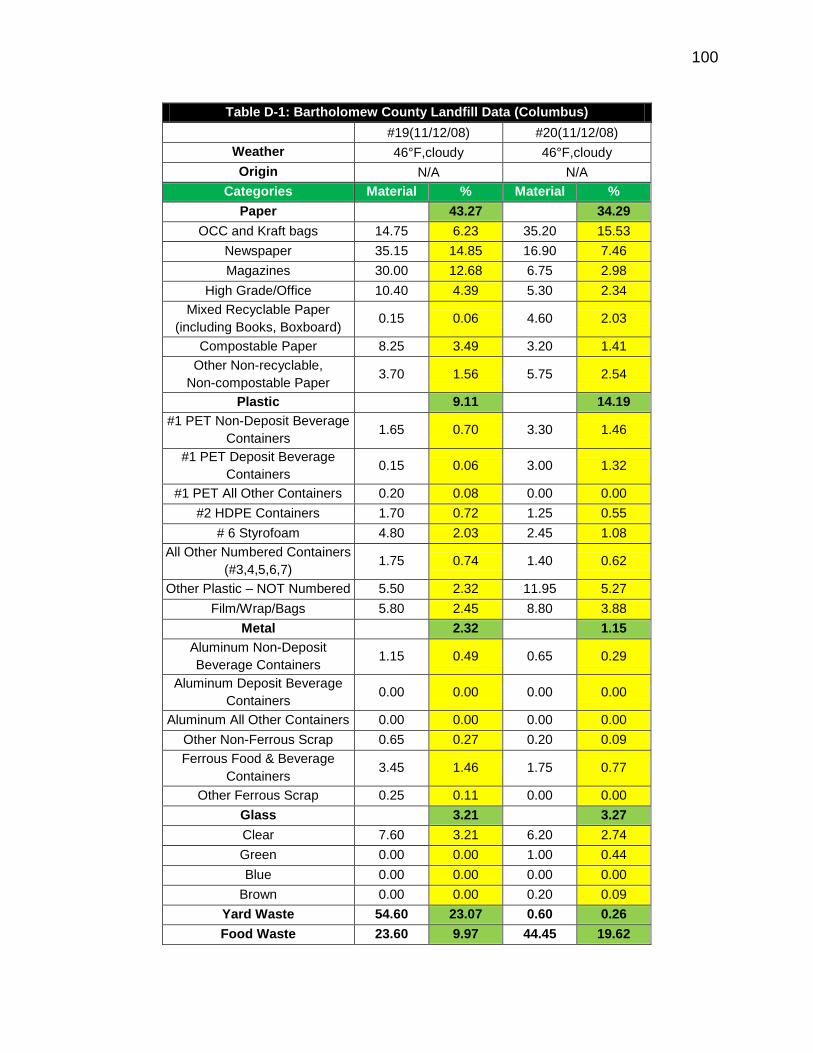
100
Table D-1: Bartholomew County Landfill Data (Columbus)
#19(11/12/08) #20(11/12/08)
Weather 46°F,cloudy 46°F,cloudy
Origin N/A N/A
Categories Material % Material %
Paper 43.27 34.29
OCC and Kraft bags 14.75 6.23 35.20 15.53
Newspaper 35.15 14.85 16.90 7.46
Magazines 30.00 12.68 6.75 2.98
High Grade/Office 10.40 4.39 5.30 2.34
Mixed Recyclable Paper
(including Books, Boxboard) 0.15 0.06 4.60 2.03
Compostable Paper 8.25 3.49 3.20 1.41
Other Non-recyclable,
Non-compostable Paper 3.70 1.56 5.75 2.54
Plastic 9.11 14.19
#1 PET Non-Deposit Beverage
Containers 1.65 0.70 3.30 1.46
#1 PET Deposit Beverage
Containers 0.15 0.06 3.00 1.32
#1 PET All Other Containers 0.20 0.08 0.00 0.00
#2 HDPE Containers 1.70 0.72 1.25 0.55
# 6 Styrofoam 4.80 2.03 2.45 1.08
All Other Numbered Containers
(#3,4,5,6,7) 1.75 0.74 1.40 0.62
Other Plastic – NOT Numbered 5.50 2.32 11.95 5.27
Film/Wrap/Bags 5.80 2.45 8.80 3.88
Metal 2.32 1.15
Aluminum Non-Deposit
Beverage Containers 1.15 0.49 0.65 0.29
Aluminum Deposit Beverage
Containers 0.00 0.00 0.00 0.00
Aluminum All Other Containers 0.00 0.00 0.00 0.00
Other Non-Ferrous Scrap 0.65 0.27 0.20 0.09
Ferrous Food & Beverage
Containers 3.45 1.46 1.75 0.77
Other Ferrous Scrap 0.25 0.11 0.00 0.00
Glass 3.21 3.27
Clear 7.60 3.21 6.20 2.74
Green 0.00 0.00 1.00 0.44
Blue 0.00 0.00 0.00 0.00
Brown 0.00 0.00 0.20 0.09
Yard Waste 54.60 23.07 0.60 0.26
Food Waste 23.60 9.97 44.45 19.62

101
Table D-1: Bartholomew County Landfill Data (Columbus)
#19(11/12/08) #20(11/12/08)
Weather 46°F,cloudy 46°F,cloudy
Origin N/A N/A
Categories Material % Material %
Wood 3.36 3.51
Non-Treated Wood 2.10 0.89 1.85 0.82
Treated Wood 5.85 2.47 6.10 2.69
Demolition/Renovation/
Construction Debris 0.00 0.00 0.00 0.00
Durables 1.37 0.00 4.26
All Electrical & Household
Appliances 2.05 0.87 5.50 2.43
Central Processing
Units/Peripherals 0.00 0.00 0.00 0.00
Computer Monitors/TV’s 0.00 0.00 0.00 0.00
Cell Phones 0.00 0.00 0.00 0.00
Other (Furniture & Furnishings) 1.20 0.51 4.15 1.83
Textiles & Leathers 0.35 0.15 20.40 9.00
Diapers 7.15 3.02 6.65 2.93
Rubbers 0.10 0.04 0.00 0.00
Household hazardous
Materials 0.63 0.15
Oil Filters 0.00 0.00 0.00 0.00
Paints & Solvents 1.50 0.63 0.00 0.00
Pesticides, Herbicides,
Fungicides 0.00 0.00 0.00 0.00
Household Cleaners 0.00 0.00 0.20 0.09
Batteries (Lead-Acid) 0.00 0.00 0.00 0.00
Batteries (Other) 0.00 0.00 0.00 0.00
Mercury Containing Products 0.00 0.00 0.00 0.00
Other (HHM Containers with
Product Inside) 0.00 0.00 0.15 0.07
Sharps 0.00 0.00 0.00 0.00
Fines/Supermix 0.5 0.21 1.00 0.44
Other-Specify 0.6 0.25 15.70 6.93
Total 236.65 100.00 226.60 100.00

102
Table D-1: Bartholomew County Landfill Data (Columbus)
By Total Weight of
Samples By Ave % Confidence Interval
Total Value of 20
Samples
Average value of 20
samples
Lower
Bound
Upper
Bound
Categories Material % Material % Material %
Paper 1382.15 31.43 69.11 31.38 28.46 34.29
OCC and Kraft bags 422.89 9.62 21.14 9.63 8.04 11.23
Newspaper 311.00 7.07 15.55 7.03 5.51 8.55
Magazines 168.46 3.83 8.42 3.78 2.74 4.81
High Grade/Office 171.80 3.91 8.59 3.94 2.90 4.97
Mixed Recyclable Paper
(including Books, Boxboard) 44.60 1.01 2.23 1.01 0.47 1.54
Compostable Paper 127.80 2.91 6.39 2.89 2.38 3.41
Other Non-recyclable,
Non-compostable Paper 135.60 3.08 6.78 3.10 2.27 3.94
Plastic 640.31 14.56 32.02 14.62 13.10 16.15
#1 PET Non-Deposit Beverage
Containers 62.96 1.43 3.15 1.44 1.07 1.82
#1 PET Deposit Beverage
Containers 59.65 1.36 2.98 1.36 0.64 2.08
#1 PET All Other Containers 14.95 0.34 0.75 0.34 0.19 0.50
#2 HDPE Containers 59.83 1.36 2.99 1.37 1.11 1.63
# 6 Styrofoam 45.45 1.03 2.27 1.03 0.79 1.27
All Other Numbered Containers
(#3,4,5,6,7) 36.40 0.83 1.82 0.83 0.58 1.08
Other Plastic – NOT Numbered 169.61 3.86 8.48 3.87 3.01 4.74
Film/Wrap/Bags 191.46 4.35 9.57 4.37 3.81 4.93
Metal 184.98 4.21 9.25 4.16 3.20 5.11
Aluminum Non-Deposit Beverage
Containers 29.70 0.68 1.49 0.68 0.48 0.87
Aluminum Deposit Beverage
Containers 6.95 0.16 0.35 0.16 0.05 0.28
Aluminum All Other Containers 26.10 0.59 1.31 0.55 0.01 1.09
Other Non-Ferrous Scrap 13.15 0.30 0.66 0.30 0.01 0.58
Ferrous Food & Beverage
Containers 77.73 1.77 3.89 1.78 1.37 2.20
Other Ferrous Scrap 31.35 0.71 1.57 0.69 0.22 1.16
Glass 200.65 4.56 10.03 4.63 2.77 6.50
Clear 110.65 2.52 5.53 2.57 1.36 3.78
Green 16.75 0.38 0.84 0.38 0.04 0.72
Blue 0.00 0.00 0.00 0.00 0.00 0.00
Brown 73.25 1.67 3.66 1.68 0.50 2.87
Yard Waste 411.07 9.35 20.55 9.34 6.41 12.27
Food Waste 615.50 14.00 30.78 14.13 11.77 16.49

103
Table D-1: Bartholomew County Landfill Data (Columbus)
By Total Weight of
Samples By Ave % Confidence Interval
Total Value of 20
Samples
Average value of 20
samples
Lower
Bound
Upper
Bound
Categories Material % Material % Material %
Wood 170.25 3.87 8.51 3.69 1.77 5.62
Non-Treated Wood 44.80 1.02 2.24 1.02 0.24 1.80
Treated Wood 125.45 2.85 6.27 2.68 0.73 4.63
Demolition/Renovation/
Construction Debris 14.90 0.34 0.75 0.37 0.00 0.75
Durables 172.43 3.92 8.62 4.03 1.91 6.15
All Electrical & Household
Appliances 54.25 1.23 2.71 1.25 0.75 1.76
Central Processing
Units/Peripherals 12.05 0.27 0.60 0.28 0.00 0.62
Computer Monitors/TV’s 0.00 0.00 0.00 0.00 0.00 0.00
Cell Phones 0.35 0.01 0.02 0.01 0.00 0.02
Other (Furniture & Furnishings) 105.78 2.41 5.29 2.48 0.49 4.48
Textiles & Leathers 180.10 4.10 9.01 4.13 2.95 5.31
Diapers 140.35 3.19 7.02 3.18 1.64 4.27
Rubbers 13.51 0.31 0.68 0.29 0.02 0.55
Household hazardous Materials 80.03 1.82 4.00 1.73 0.46 3.01
Oil Filters 8.45 0.19 0.42 0.16 0.00 0.44
Paints & Solvents 42.80 0.97 2.14 0.94 0.00 1.99
Pesticides, Herbicides, Fungicides 8.20 0.19 0.41 0.16 0.00 0.42
Household Cleaners 2.30 0.05 0.12 0.05 0.01 0.10
Batteries (Lead-Acid) 2.30 0.05 0.12 0.05 0.01 0.10
Batteries (Other) 4.35 0.10 0.22 0.09 0.04 0.15
Mercury Containing Products 0.00 0.00 0.00 0.00 0.00 0.00
Other (HHM Containers with
Product Inside) 11.63 0.26 0.58 0.27 0.00 0.62
Sharps 0.05 0.00 0.00 0.00 0.00 0.00
Fines/Supermix 45.00 1.02 2.25 1.02 0.76 1.28
Other-Specify 145.63 3.31 7.28 3.31 1.98 4.63
Total 4396.91 100.00 219.85 100.00 100.00 100.00

104
Table D-2 Adams County Transfer Station Data
Table D-2: Adams County Transfer Station (Decatur)
#1(05/28/09) #2(05/28/09) #3(05/29/09)
Weather 63°F,cloudy,humid,rain 63°F,cloudy,humid,rain 64°F,sunny
Origin truck 2, Decatur truck 2, Berne truck2, Decatur
Categories Material % Material % Material %
Paper 34.29 26.67 31.97
OCC and Kraft bags 25.30 12.55 11.85 5.55 28.00 11.86
Newspaper 4.85 2.41 7.35 3.44 13.21 5.60
Magazines 4.25 2.11 7.20 3.37 1.25 0.53
High Grade/Office 11.65 5.78 3.70 1.73 12.75 5.40
Mixed Recyclable Paper
(including Books, Boxboard) 5.70 2.83 7.25 3.39 4.75 2.01
Compostable Paper 16.40 8.13 7.40 3.46 7.00 2.97
Other Non-recyclable,
Non-compostable Paper 1.00 0.50 12.25 5.73 8.50 3.60
Plastic 21.00 19.02 15.86
#1 PET Non-Deposit Beverage
Containers 6.45 3.20 5.40 2.53 1.35 0.57
#1 PET Deposit Beverage
Containers 1.20 0.60 2.25 1.05 3.30 1.40
#1 PET All Other Containers 1.75 0.87 2.00 0.94 0.45 0.19
#2 HDPE Containers 3.05 1.51 6.80 3.18 2.55 1.08
# 6 Styrofoam 4.50 2.23 3.10 1.45 1.90 0.80
All Other Numbered
Containers (#3,4,5,6,7) 3.65 1.81 3.55 1.66 3.10 1.31
Other Plastic – NOT
Numbered 4.80 2.38 8.30 3.88 8.05 3.41
Film/Wrap/Bags 16.95 8.41 9.25 4.33 16.75 7.10
Metal 4.22 3.32 3.58
Aluminum Non-Deposit
Beverage Containers 2.65 1.31 0.85 0.40 3.85 1.63
Aluminum Deposit Beverage
Containers 0.00 0.00 0.00 0.00 0.05 0.02
Aluminum All Other Containers 1.00 0.50 0.35 0.16 0.20 0.08
Other Non-Ferrous Scrap 0.10 0.05 0.05 0.02 0.00 0.00
Ferrous Food & Beverage
Containers 3.70 1.83 5.80 2.71 2.80 1.19
Other Ferrous Scrap 1.05 0.52 0.05 0.02 1.55 0.66
Glass 3.60 4.77 2.22
Clear 4.75 2.36 8.75 4.09 1.75 0.74
Green 0.00 0.00 0.85 0.40 0.00 0.00
Blue 0.00 0.00 0.00 0.00 0.10 0.04

105
Table D-2: Adams County Transfer Station (Decatur)
#1(05/28/09) #2(05/28/09) #3(05/29/09)
Weather 63°F,cloudy,humid,rain 63°F,cloudy,humid,rain 64°F,sunny
Origin truck 2, Decatur truck 2, Berne truck2, Decatur
Categories Material % Material % Material %
Brown 2.50 1.24 0.60 0.28 3.40 1.44
Yard Waste 4.80 2.38 5.65 2.64 27.65 11.71
Food Waste 37.85 18.77 20.60 9.64 24.80 10.51
Wood 0.89 1.05 1.48
Non-Treated Wood 0.00 0.00 0.00 0.00 0.00 0.00
Treated Wood 1.79 0.89 2.25 1.05 3.50 1.48
Demolition/Renovation/
Construction Debris 0.00 0.00 0.00 0.00 0.00 0.00
Durables 0.52 3.32 1.29
All Electrical & Household
Appliances 1.05 0.52 7.10 3.32 3.05 1.29
Central Processing
Units/Peripherals 0.00 0.00 0.00 0.00 0.00 0.00
Computer Monitors/TV’s 0.00 0.00 0.00 0.00 0.00 0.00
Cell Phones 0.00 0.00 0.00 0.00 0.00 0.00
Other (Furniture & Furnishings) 0.00 0.00 0.00 0.00 0.00 0.00
Textiles & Leathers 5.20 2.58 8.25 3.86 8.80 3.73
Diapers 12.35 6.12 46.50 21.76 30.10 12.75
Rubbers 1.45 0.72 2.30 1.08 0.35 0.15
Household hazardous
Materials 0.15 0.00 0.91
Oil Filters 0.00 0.00 0.00 0.00 0.00 0.00
Paints & Solvents 0.00 0.00 0.00 0.00 1.90 0.80
Pesticides, Herbicides,
Fungicides 0.00 0.00 0.00 0.00 0.00 0.00
Household Cleaners 0.20 0.10 0.00 0.00 0.00 0.00
Batteries (Lead-Acid) 0.00 0.00 0.00 0.00 0.00 0.00
Batteries (Other) 0.10 0.05 0.00 0.00 0.00 0.00
Mercury Containing Products 0.00 0.00 0.00 0.00 0.00 0.00
Other (HHM Containers with
Product Inside) 0.00 0.00 0.00 0.00 0.25 0.11
Sharps 0.00 0.00 0.00 0.00 0.00 0.00
Fines/Supermix 5.25 2.60 4.80 2.25 8.10 3.43
Other-Specify 4.35 2.16 1.30 0.61 0.95 0.40
Total 201.64 100.00 213.70 100.00 236.06 100.00

106
Table D-2: Adams County Transfer Station (Decatur)
#4(06/01/09) #5(06/01/09) #6(06/02/09)
Weather 69°F,cloudy 69°F,cloudy 62°F,foggy
Origin truck 2, Decatur, heavy
pick-up week truck 2, Decatur truck 2, Decatur
Categories Material % Material % Material %
Paper 36.62 29.82 17.16
OCC and Kraft bags 23.90 10.76 18.40 8.27 11.90 5.11
Newspaper 11.50 5.18 14.30 6.43 7.15 3.07
Magazines 7.25 3.26 6.55 2.94 2.35 1.01
High Grade/Office 16.95 7.63 5.10 2.29 10.15 4.36
Mixed Recyclable Paper
(including Books, Boxboard) 9.85 4.43 5.65 2.54 1.70 0.73
Compostable Paper 6.20 2.79 3.00 1.35 3.65 1.57
Other Non-recyclable,
Non-compostable Paper 5.70 2.57 13.35 6.00 3.05 1.31
Plastic 19.74 13.57 18.55
#1 PET Non-Deposit Beverage
Containers 1.00 0.45 2.60 1.17 0.65 0.28
#1 PET Deposit Beverage
Containers 1.85 0.83 1.65 0.74 0.80 0.34
#1 PET All Other Containers 0.25 0.11 0.65 0.29 0.25 0.11
#2 HDPE Containers 1.90 0.86 3.25 1.46 1.25 0.54
# 6 Styrofoam 10.05 4.52 2.45 1.10 1.90 0.82
All Other Numbered
Containers (#3,4,5,6,7) 3.10 1.40 1.85 0.83 0.75 0.32
Other Plastic – NOT
Numbered 11.75 5.29 5.50 2.47 26.50 11.38
Film/Wrap/Bags 13.95 6.28 12.25 5.51 11.10 4.77
Metal 4.14 4.56 1.93
Aluminum Non-Deposit
Beverage Containers 1.95 0.88 2.00 0.90 0.65 0.28
Aluminum Deposit Beverage
Containers 0.00 0.00 0.00 0.00 0.15 0.06
Aluminum All Other Containers 0.45 0.20 1.10 0.49 0.70 0.30
Other Non-Ferrous Scrap 0.25 0.11 0.25 0.11 0.20 0.09
Ferrous Food & Beverage
Containers 6.05 2.72 5.80 2.61 2.45 1.05
Other Ferrous Scrap 0.50 0.23 1.00 0.45 0.35 0.15
Glass 5.72 3.37 1.63
Clear 5.00 2.25 3.70 1.66 2.80 1.20
Green 0.00 0.00 0.00 0.00 0.00 0.00
Blue 0.00 0.00 0.00 0.00 0.00 0.00
Brown 7.70 3.47 3.80 1.71 1.00 0.43
Yard Waste 13.05 5.87 21.15 9.51 102.10 43.85

107
Table D-2: Adams County Transfer Station (Decatur)
#4(06/01/09) #5(06/01/09) #6(06/02/09)
Weather 69°F,cloudy 69°F,cloudy 62°F,foggy
Origin truck 2, Decatur, heavy
pick-up week truck 2, Decatur truck 2, Decatur
Categories Material % Material % Material %
Food Waste 33.80 15.21 21.15 9.51 16.95 7.28
Wood 0.16 11.42 0.84
Non-Treated Wood 0.00 0.00 1.80 0.81 0.05 0.02
Treated Wood 0.35 0.16 23.60 10.61 1.90 0.82
Demolition/Renovation/
Construction Debris 4.60 2.07 0.00 0.00 0.00 0.00
Durables 0.99 0.56 0.28
All Electrical & Household
Appliances 2.20 0.99 0.00 0.00 0.65 0.28
Central Processing
Units/Peripherals 0.00 0.00 0.00 0.00 0.00 0.00
Computer Monitors/TV’s 0.00 0.00 0.00 0.00 0.00 0.00
Cell Phones 0.00 0.00 0.00 0.00 0.00 0.00
Other (Furniture & Furnishings) 0.00 0.00 1.25 0.56 0.00 0.00
Textiles & Leathers 2.45 1.10 9.05 4.07 6.20 2.66
Diapers 11.45 5.15 10.95 4.92 6.30 2.71
Rubbers 0.10 0.05 0.10 0.04 0.15 0.06
Household hazardous
Materials 0.00 0.25 0.21
Oil Filters 0.00 0.00 0.00 0.00 0.00 0.00
Paints & Solvents 0.00 0.00 0.40 0.18 0.30 0.13
Pesticides, Herbicides,
Fungicides 0.00 0.00 0.00 0.00 0.00 0.00
Household Cleaners 0.00 0.00 0.00 0.00 0.00 0.00
Batteries (Lead-Acid) 0.00 0.00 0.00 0.00 0.00 0.00
Batteries (Other) 0.00 0.00 0.15 0.07 0.20 0.09
Mercury Containing Products 0.00 0.00 0.00 0.00 0.00 0.00
Other (HHM Containers with
Product Inside) 0.00 0.00 0.00 0.00 0.00 0.00
Sharps 0.00 0.00 0.00 0.00 0.00 0.00
Fines/Supermix 4.25 1.91 2.90 1.30 4.20 1.80
Other-Specify 2.80 1.26 15.80 7.10 2.40 1.03
Total 222.15 100.00 222.50 100.00 232.85 100.00

108
Table D-2: Adams County Transfer Station (Decatur)
#7(06/02/09) #8(06/03/09) #9(06/03/09)
Weather 62°F,cloudy 56°F,rainy 56°F,rainy
Origin truck 2, Decatur truck 2, Berne truck 2, Decatur
Categories Material % Material % Material %
Paper 19.70 43.41 27.64
OCC and Kraft bags 13.10 5.82 22.55 9.79 29.75 12.62
Newspaper 3.80 1.69 17.10 7.43 10.90 4.62
Magazines 0.80 0.36 13.06 5.67 3.60 1.53
High Grade/Office 10.85 4.82 20.55 8.92 6.95 2.95
Mixed Recyclable Paper
(including Books, Boxboard) 2.30 1.02 10.45 4.54 5.90 2.50
Compostable Paper 4.65 2.07 9.15 3.97 3.90 1.65
Other Non-recyclable,
Non-compostable Paper 8.85 3.93 7.10 3.08 4.15 1.76
Plastic 12.53 14.29 22.16
#1 PET Non-Deposit Beverage
Containers 0.80 0.36 1.45 0.63 2.25 0.95
#1 PET Deposit Beverage
Containers 1.40 0.62 2.15 0.93 4.10 1.74
#1 PET All Other Containers 0.20 0.09 1.15 0.50 1.25 0.53
#2 HDPE Containers 2.55 1.13 3.95 1.72 2.80 1.19
# 6 Styrofoam 2.15 0.96 1.80 0.78 2.45 1.04
All Other Numbered
Containers (#3,4,5,6,7) 1.25 0.56 3.10 1.35 1.20 0.51
Other Plastic – NOT
Numbered 6.35 2.82 6.15 2.67 19.35 8.21
Film/Wrap/Bags 13.50 6.00 13.15 5.71 18.85 8.00
Metal 2.64 5.73 4.88
Aluminum Non-Deposit
Beverage Containers 1.05 0.47 1.00 0.43 2.20 0.93
Aluminum Deposit Beverage
Containers 0.00 0.00 0.00 0.00 0.00 0.00
Aluminum All Other Containers 0.40 0.18 0.50 0.22 0.30 0.13
Other Non-Ferrous Scrap 0.00 0.00 0.65 0.28 0.00 0.00
Ferrous Food & Beverage
Containers 2.45 1.09 3.65 1.59 2.60 1.10
Other Ferrous Scrap 2.05 0.91 7.40 3.21 6.40 2.71
Glass 5.04 2.45 3.90
Clear 3.95 1.75 4.10 1.78 7.60 3.22
Green 7.40 3.29 1.05 0.46 1.15 0.49
Blue 0.00 0.00 0.00 0.00 0.00 0.00
Brown 0.00 0.00 0.50 0.22 0.45 0.19
Yard Waste 0.60 0.27 15.40 6.69 9.10 3.86

109
Table D-2: Adams County Transfer Station (Decatur)
#7(06/02/09) #8(06/03/09) #9(06/03/09)
Weather 62°F,cloudy 56°F,rainy 56°F,rainy
Origin truck 2, Decatur truck 2, Berne truck 2, Decatur
Categories Material % Material % Material %
Food Waste 32.35 14.37 39.85 17.31 29.45 12.49
Wood 3.55 0.46 1.93
Non-Treated Wood 0.00 0.00 0.10 0.04 0.00 0.00
Treated Wood 8.00 3.55 0.95 0.41 4.55 1.93
Demolition/Renovation/
Construction Debris 19.45 8.64 0.00 0.00 0.00 0.00
Durables 12.99 2.00 0.55
All Electrical & Household
Appliances 1.80 0.80 4.60 2.00 1.30 0.55
Central Processing
Units/Peripherals 0.00 0.00 0.00 0.00 0.00 0.00
Computer Monitors/TV’s 27.45 12.19 0.00 0.00 0.00 0.00
Cell Phones 0.00 0.00 0.00 0.00 0.00 0.00
Other (Furniture & Furnishings) 0.00 0.00 0.00 0.00 0.00 0.00
Textiles & Leathers 27.60 12.26 12.50 5.43 17.05 7.23
Diapers 9.70 4.31 2.90 1.26 14.00 5.94
Rubbers 1.40 0.62 0.00 0.00 0.35 0.15
Household hazardous
Materials 1.67 0.22 6.85
Oil Filters 0.00 0.00 0.00 0.00 0.00 0.00
Paints & Solvents 3.75 1.67 0.00 0.00 16.05 6.81
Pesticides, Herbicides,
Fungicides 0.00 0.00 0.00 0.00 0.00 0.00
Household Cleaners 0.00 0.00 0.00 0.00 0.00 0.00
Batteries (Lead-Acid) 0.00 0.00 0.00 0.00 0.00 0.00
Batteries (Other) 0.00 0.00 0.50 0.22 0.10 0.04
Mercury Containing Products 0.00 0.00 0.00 0.00 0.00 0.00
Other (HHM Containers with
Product Inside) 0.00 0.00 0.00 0.00 0.00 0.00
Sharps 0.00 0.00 0.00 0.00 0.10 0.04
Fines/Supermix 2.00 0.89 1.45 0.63 3.85 1.63
Other-Specify 1.15 0.51 0.30 0.13 1.75 0.74
Total 225.10 100.00 230.26 100.00 235.75 100.00

110
Table D-2: Adams County Transfer Station (Decatur)
#10(06/03/09) #11(06/04/09) #12(06/04/09)
Weather 56°F,rainy 58°F,sunny 58°F,sunny
Origin truck 2, Berne truck 2, Decatur N/A
Categories Material % Material % Material %
Paper 32.20 48.34 21.43
OCC and Kraft bags 19.95 8.93 39.10 17.38 10.85 4.54
Newspaper 3.85 1.72 13.05 5.80 24.95 10.44
Magazines 3.05 1.36 12.85 5.71 1.35 0.56
High Grade/Office 9.00 4.03 12.65 5.62 2.35 0.98
Mixed Recyclable Paper
(including Books, Boxboard) 8.25 3.69 16.10 7.16 2.20 0.92
Compostable Paper 13.90 6.22 10.20 4.53 8.75 3.66
Other Non-recyclable,
Non-compostable Paper 13.95 6.24 4.80 2.13 0.75 0.31
Plastic 18.71 16.96 6.88
#1 PET Non-Deposit Beverage
Containers 4.40 1.97 1.85 0.82 1.50 0.63
#1 PET Deposit Beverage
Containers 7.75 3.47 3.80 1.69 1.20 0.50
#1 PET All Other Containers 0.80 0.36 1.30 0.58 0.50 0.21
#2 HDPE Containers 2.95 1.32 3.45 1.53 2.25 0.94
# 6 Styrofoam 1.85 0.83 1.85 0.82 0.40 0.17
All Other Numbered
Containers (#3,4,5,6,7) 2.55 1.14 2.60 1.16 1.55 0.65
Other Plastic – NOT
Numbered 7.12 3.19 7.20 3.20 5.35 2.24
Film/Wrap/Bags 14.40 6.44 16.10 7.16 3.70 1.55
Metal 2.08 3.47 1.74
Aluminum Non-Deposit
Beverage Containers 0.55 0.25 1.65 0.73 2.50 1.05
Aluminum Deposit Beverage
Containers 0.00 0.00 0.00 0.00 0.00 0.00
Aluminum All Other Containers 0.90 0.40 0.45 0.20 1.00 0.42
Other Non-Ferrous Scrap 0.00 0.00 0.30 0.13 0.00 0.00
Ferrous Food & Beverage
Containers 2.60 1.16 4.00 1.78 0.65 0.27
Other Ferrous Scrap 0.60 0.27 1.40 0.62 0.00 0.00
Glass 0.22 2.78 4.71
Clear 0.50 0.22 4.95 2.20 5.30 2.22
Green 0.00 0.00 0.00 0.00 0.00 0.00
Blue 0.00 0.00 0.00 0.00 0.00 0.00
Brown 0.00 0.00 1.30 0.58 5.95 2.49
Yard Waste 1.05 0.47 1.30 0.58 17.80 7.45

111
Table D-2: Adams County Transfer Station (Decatur)
#10(06/03/09) #11(06/04/09) #12(06/04/09)
Weather 56°F,rainy 58°F,sunny 58°F,sunny
Origin truck 2, Berne truck 2, Decatur N/A
Categories Material % Material % Material %
Food Waste 54.50 24.39 35.35 15.71 8.55 3.58
Wood 0.00 0.29 0.46
Non-Treated Wood 0.00 0.00 0.00 0.00 0.00 0.00
Treated Wood 0.00 0.00 0.65 0.29 1.10 0.46
Demolition/Renovation/
Construction Debris 0.00 0.00 0.00 0.00 110.30 46.16
Durables 6.58 0.60 2.53
All Electrical & Household
Appliances 14.70 6.58 1.35 0.60 6.05 2.53
Central Processing
Units/Peripherals 0.00 0.00 0.00 0.00 0.00 0.00
Computer Monitors/TV’s 0.00 0.00 0.00 0.00 0.00 0.00
Cell Phones 0.00 0.00 0.00 0.00 0.00 0.00
Other (Furniture & Furnishings) 0.00 0.00 0.00 0.00 0.00 0.00
Textiles & Leathers 7.95 3.56 12.60 5.60 2.10 0.88
Diapers 18.30 8.19 6.35 2.82 6.15 2.57
Rubbers 3.95 1.77 0.10 0.04 0.65 0.27
Household hazardous
Materials 0.00 0.04 0.00
Oil Filters 0.00 0.00 0.00 0.00 0.00 0.00
Paints & Solvents 0.00 0.00 0.00 0.00 0.00 0.00
Pesticides, Herbicides,
Fungicides 0.00 0.00 0.00 0.00 0.00 0.00
Household Cleaners 0.00 0.00 0.00 0.00 0.00 0.00
Batteries (Lead-Acid) 0.00 0.00 0.00 0.00 0.00 0.00
Batteries (Other) 0.00 0.00 0.10 0.04 0.00 0.00
Mercury Containing Products 0.00 0.00 0.00 0.00 0.00 0.00
Other (HHM Containers with
Product Inside) 0.00 0.00 0.00 0.00 0.00 0.00
Sharps 0.00 0.00 0.05 0.02 0.00 0.00
Fines/Supermix 2.30 1.03 5.45 2.42 1.60 0.67
Other-Specify 1.80 0.81 0.70 0.31 1.60 0.67
Total 223.47 100.00 224.95 100.00 238.95 100.00

112
Table D-2: Adams County Transfer Station (Decatur)
#13(06/05/09) #14(06/05/09) #15(06/08/09)
Weather 59°F,sunny 59°F,sunny 74°F,cloudy
Origin truck 2, Decatur truck 2, Decatur truck 2, Decatur
Categories Material % Material % Material %
Paper 35.94 34.56 48.96
OCC and Kraft bags 19.25 8.48 32.45 14.69 25.30 10.93
Newspaper 13.65 6.01 11.25 5.09 29.30 12.66
Magazines 9.35 4.12 5.90 2.67 11.25 4.86
High Grade/Office 15.10 6.65 7.95 3.60 30.30 13.09
Mixed Recyclable Paper
(including Books, Boxboard) 4.20 1.85 4.75 2.15 5.05 2.18
Compostable Paper 18.80 8.28 12.55 5.68 11.05 4.78
Other Non-recyclable,
Non-compostable Paper 1.25 0.55 1.50 0.68 1.05 0.45
Plastic 17.51 13.92 14.20
#1 PET Non-Deposit Beverage
Containers 1.45 0.64 1.40 0.63 3.35 1.45
#1 PET Deposit Beverage
Containers 0.75 0.33 1.70 0.77 1.85 0.80
#1 PET All Other Containers 1.35 0.59 1.45 0.66 1.55 0.67
#2 HDPE Containers 4.05 1.78 1.20 0.54 2.50 1.08
# 6 Styrofoam 1.95 0.86 1.95 0.88 2.50 1.08
All Other Numbered
Containers (#3,4,5,6,7) 2.00 0.88 1.85 0.84 2.50 1.08
Other Plastic – NOT
Numbered 14.45 6.36 10.60 4.80 6.25 2.70
Film/Wrap/Bags 13.75 6.06 10.60 4.80 12.35 5.34
Metal 3.96 2.72 3.87
Aluminum Non-Deposit
Beverage Containers 0.30 0.13 3.25 1.47 0.80 0.35
Aluminum Deposit Beverage
Containers 0.00 0.00 0.00 0.00 0.00 0.00
Aluminum All Other Containers 0.25 0.11 0.10 0.05 0.30 0.13
Other Non-Ferrous Scrap 1.85 0.81 0.65 0.29 0.30 0.13
Ferrous Food & Beverage
Containers 3.85 1.70 1.60 0.72 6.80 2.94
Other Ferrous Scrap 2.75 1.21 0.40 0.18 0.75 0.32
Glass 5.31 4.32 1.38
Clear 11.55 5.09 2.95 1.34 2.15 0.93
Green 0.00 0.00 0.00 0.00 0.00 0.00
Blue 0.00 0.00 0.00 0.00 1.05 0.45
Brown 0.50 0.22 6.60 2.99 0.00 0.00

113
Table D-2: Adams County Transfer Station (Decatur)
#13(06/05/09) #14(06/05/09) #15(06/08/09)
Weather 59°F,sunny 59°F,sunny 74°F,cloudy
Origin truck 2, Decatur truck 2, Decatur truck 2, Decatur
Categories Material % Material % Material %
Yard Waste 9.90 4.36 3.80 1.72 13.05 5.64
Food Waste 39.50 17.40 55.60 25.17 34.10 14.74
Wood 0.55 2.65 0.09
Non-Treated Wood 0.20 0.09 0.00 0.00 0.05 0.02
Treated Wood 1.05 0.46 5.85 2.65 0.15 0.06
Demolition/Renovation/
Construction Debris 0.00 0.00 0.00 0.00 0.25 0.11
Durables 0.46 0.34 1.02
All Electrical & Household
Appliances 1.05 0.46 0.75 0.34 2.35 1.02
Central Processing
Units/Peripherals 0.00 0.00 0.00 0.00 0.00 0.00
Computer Monitors/TV’s 0.00 0.00 0.00 0.00 0.00 0.00
Cell Phones 0.00 0.00 0.00 0.00 0.00 0.00
Other (Furniture & Furnishings) 0.00 0.00 0.00 0.00 0.00 0.00
Textiles & Leathers 8.90 3.92 15.80 7.15 5.35 2.31
Diapers 8.70 3.83 6.15 2.78 11.45 4.95
Rubbers 0.00 0.00 0.25 0.11 0.10 0.04
Household hazardous
Materials 0.33 2.38 0.09
Oil Filters 0.00 0.00 0.00 0.00 0.00 0.00
Paints & Solvents 0.00 0.00 2.10 0.95 0.00 0.00
Pesticides, Herbicides,
Fungicides 0.00 0.00 0.00 0.00 0.00 0.00
Household Cleaners 0.00 0.00 1.75 0.79 0.00 0.00
Batteries (Lead-Acid) 0.00 0.00 0.00 0.00 0.00 0.00
Batteries (Other) 0.75 0.33 0.20 0.09 0.20 0.09
Mercury Containing Products 0.00 0.00 0.00 0.00 0.00 0.00
Other (HHM Containers with
Product Inside) 0.00 0.00 1.20 0.54 0.00 0.00
Sharps 0.00 0.00 0.00 0.00 0.05 0.02
Fines/Supermix 2.95 1.30 2.95 1.34 3.95 1.71
Other-Specify 11.65 5.13 1.85 0.84 2.05 0.89
Total 227.05 100.00 220.90 100.00 231.40 100.00

114
Table D-2: Adams County Transfer Station (Decatur)
#16(06/08/09) #17(06/09/09) #18(06/09/09)
Weather 74°F,cloudy 68°F,sunny 68°F,sunny
Origin truck 2, Berne truck 2, Berne truck 2, Decatur
Categories Material % Material % Material %
Paper 19.69 43.06 39.40
OCC and Kraft bags 19.35 8.43 65.70 29.40 50.10 21.22
Newspaper 7.00 3.05 1.75 0.78 9.65 4.09
Magazines 1.10 0.48 0.80 0.36 9.75 4.13
High Grade/Office 0.90 0.39 11.50 5.15 12.25 5.19
Mixed Recyclable Paper
(including Books, Boxboard) 2.55 1.11 1.75 0.78 2.85 1.21
Compostable Paper 12.00 5.23 12.75 5.70 7.80 3.30
Other Non-recyclable,
Non-compostable Paper 2.30 1.00 2.00 0.89 0.60 0.25
Plastic 15.23 13.69 19.23
#1 PET Non-Deposit Beverage
Containers 5.50 2.40 1.60 0.72 5.35 2.27
#1 PET Deposit Beverage
Containers 2.35 1.02 3.55 1.59 1.65 0.70
#1 PET All Other Containers 1.40 0.61 2.70 1.21 2.25 0.95
#2 HDPE Containers 3.55 1.55 2.60 1.16 2.55 1.08
# 6 Styrofoam 6.40 2.79 1.50 0.67 7.55 3.20
All Other Numbered
Containers (#3,4,5,6,7) 2.00 0.87 1.75 0.78 1.45 0.61
Other Plastic – NOT
Numbered 5.05 2.20 4.40 1.97 12.30 5.21
Film/Wrap/Bags 8.70 3.79 12.50 5.59 12.30 5.21
Metal 4.73 2.89 4.94
Aluminum Non-Deposit
Beverage Containers 1.25 0.54 1.70 0.76 2.25 0.95
Aluminum Deposit Beverage
Containers 0.05 0.02 0.05 0.02 0.10 0.04
Aluminum All Other Containers 0.30 0.13 0.00 0.00 0.00 0.00
Other Non-Ferrous Scrap 1.75 0.76 0.70 0.31 0.80 0.34
Ferrous Food & Beverage
Containers 7.05 3.07 2.50 1.12 4.05 1.72
Other Ferrous Scrap 0.45 0.20 1.50 0.67 4.45 1.89
Glass 0.28 3.87 2.69
Clear 0.65 0.28 8.65 3.87 0.00 0.00
Green 0.00 0.00 0.00 0.00 3.80 1.61
Blue 0.00 0.00 0.00 0.00 0.00 0.00
Brown 0.00 0.00 0.00 0.00 2.55 1.08
Yard Waste 1.40 0.61 10.45 4.68 24.30 10.29

115
Table D-2: Adams County Transfer Station (Decatur)
#16(06/08/09) #17(06/09/09) #18(06/09/09)
Weather 74°F,cloudy 68°F,sunny 68°F,sunny
Origin truck 2, Berne truck 2, Berne truck 2, Decatur
Categories Material % Material % Material %
Food Waste 12.85 5.60 20.60 9.22 25.75 10.91
Wood 19.12 0.22 0.23
Non-Treated Wood 0.70 0.30 0.00 0.00 0.00 0.00
Treated Wood 43.20 18.82 0.50 0.22 0.55 0.23
Demolition/Renovation/
Construction Debris 71.05 30.95 1.50 0.67 0.10 0.04
Durables 0.00 7.07 0.55
All Electrical & Household
Appliances 0.00 0.00 15.80 7.07 1.30 0.55
Central Processing
Units/Peripherals 0.00 0.00 0.00 0.00 0.00 0.00
Computer Monitors/TV’s 0.00 0.00 0.00 0.00 0.00 0.00
Cell Phones 0.00 0.00 0.00 0.00 0.00 0.00
Other (Furniture & Furnishings) 0.00 0.00 0.00 0.00 0.00 0.00
Textiles & Leathers 2.60 1.13 6.25 2.80 7.55 3.20
Diapers 3.80 1.66 1.40 0.63 11.05 4.68
Rubbers 0.40 0.17 0.00 0.00 0.70 0.30
Household hazardous
Materials 0.02 2.19 0.32
Oil Filters 0.00 0.00 0.00 0.00 0.00 0.00
Paints & Solvents 0.00 0.00 4.75 2.13 0.30 0.13
Pesticides, Herbicides,
Fungicides 0.00 0.00 0.00 0.00 0.00 0.00
Household Cleaners 0.00 0.00 0.00 0.00 0.00 0.00
Batteries (Lead-Acid) 0.00 0.00 0.00 0.00 0.00 0.00
Batteries (Other) 0.05 0.02 0.15 0.07 0.45 0.19
Mercury Containing Products 0.00 0.00 0.00 0.00 0.00 0.00
Other (HHM Containers with
Product Inside) 0.00 0.00 0.00 0.00 0.00 0.00
Sharps 0.00 0.00 0.10 0.04 0.10 0.04
Fines/Supermix 1.85 0.81 3.25 1.45 5.25 2.22
Other-Specify 0.00 0.00 16.80 7.52 2.25 0.95
Total 229.55 100.00 223.50 100.00 236.05 100.00

116
Table D-2: Adams County Transfer Station (Decatur)
#19(06/09/09) #20(06/10/09) #21(06/10/09)
Weather 68°F,sunny 65°F,cloudy 65°F,cloudy
Origin truck 2, Berne truck 2, Berne truck 2, Decatur
Categories Material % Material % Material %
Paper 28.29 40.93 41.94
OCC and Kraft bags 20.15 8.78 18.05 8.14 17.45 7.44
Newspaper 3.20 1.39 19.05 8.59 20.10 8.58
Magazines 6.35 2.77 9.10 4.10 14.80 6.31
High Grade/Office 17.10 7.45 24.35 10.98 21.95 9.36
Mixed Recyclable Paper
(including Books, Boxboard) 4.95 2.16 3.20 1.44 3.65 1.56
Compostable Paper 11.20 4.88 15.50 6.99 18.20 7.76
Other Non-recyclable,
Non-compostable Paper 1.95 0.85 1.50 0.68 2.15 0.92
Plastic 23.69 17.03 18.39
#1 PET Non-Deposit Beverage
Containers 4.00 1.74 2.30 1.04 1.95 0.83
#1 PET Deposit Beverage
Containers 5.95 2.59 2.60 1.17 2.05 0.87
#1 PET All Other Containers 1.90 0.83 1.70 0.77 2.05 0.87
#2 HDPE Containers 3.15 1.37 6.30 2.84 4.95 2.11
# 6 Styrofoam 4.75 2.07 1.95 0.88 1.90 0.81
All Other Numbered
Containers (#3,4,5,6,7) 1.20 0.52 3.05 1.38 1.85 0.79
Other Plastic – NOT
Numbered 20.50 8.93 9.40 4.24 13.20 5.63
Film/Wrap/Bags 12.90 5.62 10.45 4.71 15.15 6.46
Metal 4.36 2.73 5.52
Aluminum Non-Deposit
Beverage Containers 2.25 0.98 1.90 0.86 1.50 0.64
Aluminum Deposit Beverage
Containers 0.00 0.00 0.00 0.00 0.00 0.00
Aluminum All Other Containers 0.00 0.00 0.30 0.14 0.15 0.06
Other Non-Ferrous Scrap 1.15 0.50 0.20 0.09 0.35 0.15
Ferrous Food & Beverage
Containers 3.55 1.55 2.65 1.20 6.95 2.97
Other Ferrous Scrap 3.05 1.33 1.00 0.45 4.00 1.71
Glass 1.29 5.14 2.45
Clear 0.00 0.00 4.35 1.96 2.75 1.17
Green 2.85 1.24 0.00 0.00 0.00 0.00
Blue 0.00 0.00 0.00 0.00 0.00 0.00
Brown 0.10 0.04 7.05 3.18 3.00 1.28
Yard Waste 9.65 4.21 8.65 3.90 10.25 4.37

117
Table D-2: Adams County Transfer Station (Decatur)
#19(06/09/09) #20(06/10/09) #21(06/10/09)
Weather 68°F,sunny 65°F,cloudy 65°F,cloudy
Origin truck 2, Berne truck 2, Berne truck 2, Decatur
Categories Material % Material % Material %
Food Waste 37.20 16.21 32.90 14.84 23.75 10.13
Wood 2.31 0.50 2.22
Non-Treated Wood 0.00 0.00 0.00 0.00 0.00 0.00
Treated Wood 5.30 2.31 1.10 0.50 5.20 2.22
Demolition/Renovation/
Construction Debris 5.95 2.59 11.15 5.03 0.65 0.28
Durables 0.00 0.09 0.38
All Electrical & Household
Appliances 0.00 0.00 0.20 0.09 0.90 0.38
Central Processing
Units/Peripherals 0.00 0.00 0.00 0.00 0.00 0.00
Computer Monitors/TV’s 0.00 0.00 0.00 0.00 0.00 0.00
Cell Phones 0.00 0.00 0.00 0.00 0.00 0.00
Other (Furniture & Furnishings) 0.00 0.00 0.00 0.00 0.00 0.00
Textiles & Leathers 21.50 9.37 17.45 7.87 18.70 7.98
Diapers 7.70 3.36 1.65 0.74 3.65 1.56
Rubbers 0.05 0.02 0.30 0.14 0.00 0.00
Household hazardous
Materials 3.99 0.07 1.26
Oil Filters 3.40 1.48 0.00 0.00 0.00 0.00
Paints & Solvents 0.00 0.00 0.00 0.00 0.00 0.00
Pesticides, Herbicides,
Fungicides 0.00 0.00 0.00 0.00 0.50 0.21
Household Cleaners 0.00 0.00 0.00 0.00 0.00 0.00
Batteries (Lead-Acid) 0.00 0.00 0.00 0.00 0.00 0.00
Batteries (Other) 0.65 0.28 0.15 0.07 0.00 0.00
Mercury Containing Products 0.00 0.00 0.00 0.00 0.00 0.00
Other (HHM Containers with
Product Inside) 5.10 2.22 0.00 0.00 2.45 1.05
Sharps 0.15 0.07 0.00 0.00 0.10 0.04
Fines/Supermix 0.00 0.00 1.95 0.88 6.45 2.75
Other-Specify 0.60 0.26 0.25 0.11 1.70 0.73
Total 229.45 100.00 221.70 100.00 234.40 100.00

118
Table D-2: Adams County Transfer Station (Decatur)
By Total Weight of
Samples By Ave % Confidence Interval
Total Value of 21
Samples
Average value of 21
samples
Lower
Bound
Upper
Bound
Categories Material % Material % Material %
Paper 1590.27 33.40 75.73 33.43 29.92 36.94
OCC and Kraft bags 522.45 10.97 24.88 10.99 8.78 13.19
Newspaper 246.96 5.19 11.76 5.15 3.98 6.31
Magazines 131.96 2.77 6.28 2.77 2.05 3.49
High Grade/Office 264.05 5.55 12.57 5.54 4.33 6.76
Mixed Recyclable Paper
(including Books, Boxboard) 113.05 2.37 5.38 2.39 1.80 2.98
Compostable Paper 214.05 4.50 10.19 4.52 3.72 5.33
Other Non-recyclable,
Non-compostable Paper 97.75 2.05 4.65 2.07 1.33 2.81
Plastic 796.97 16.74 37.95 16.77 15.35 18.19
#1 PET Non-Deposit Beverage
Containers 56.60 1.19 2.70 1.20 0.89 1.51
#1 PET Deposit Beverage
Containers 53.90 1.13 2.57 1.13 0.85 1.42
#1 PET All Other Containers 26.90 0.56 1.28 0.57 0.45 0.69
#2 HDPE Containers 67.60 1.42 3.22 1.43 1.18 1.67
# 6 Styrofoam 64.85 1.36 3.09 1.37 0.98 1.76
All Other Numbered Containers
(#3,4,5,6,7) 45.90 0.96 2.19 0.97 0.82 1.12
Other Plastic – NOT Numbered 212.57 4.46 10.12 4.44 3.49 5.38
Film/Wrap/Bags 268.65 5.64 12.79 5.66 5.10 6.22
Metal 177.05 3.72 8.43 3.71 3.28 4.15
Aluminum Non-Deposit Beverage
Containers 36.10 0.76 1.72 0.76 0.61 0.91
Aluminum Deposit Beverage
Containers 0.40 0.01 0.02 0.01 0.00 0.01
Aluminum All Other Containers 8.75 0.18 0.42 0.19 0.13 0.24
Other Non-Ferrous Scrap 9.55 0.20 0.45 0.20 0.11 0.29
Ferrous Food & Beverage
Containers 81.55 1.71 3.88 1.72 1.41 2.02
Other Ferrous Scrap 40.70 0.85 1.94 0.84 0.51 1.17
Glass 151.45 3.18 7.21 3.20 2.58 3.82
Clear 86.20 1.81 4.10 1.83 1.31 2.34
Green 17.10 0.36 0.81 0.36 0.06 0.66
Blue 1.15 0.02 0.05 0.02 0.00 0.06
Brown 47.00 0.99 2.24 0.99 0.56 1.43
Yard Waste 311.10 6.53 14.81 6.43 2.99 9.87
Food Waste 637.45 13.39 30.35 13.48 11.41 15.55

119
Table D-2: Adams County Transfer Station (Decatur)
By Total Weight of
Samples By Ave % Confidence Interval
Total Value of 21
Samples
Average value of 21
samples
Lower
Bound
Upper
Bound
Categories Material % Material % Material %
Wood 114.44 2.40 5.45 2.40 0.69 4.11
Non-Treated Wood 2.90 0.06 0.14 0.06 0.00 0.13
Treated Wood 111.54 2.34 5.31 2.34 0.68 4.00
Demolition/Renovation/
Construction Debris 225.00 4.73 10.71 4.60 0.19 9.00
Durables 94.90 1.99 4.52 2.01 0.81 3.21
All Electrical & Household
Appliances 66.20 1.39 3.15 1.40 0.65 2.15
Central Processing
Units/Peripherals 0.00 0.00 0.00 0.00 0.00 0.00
Computer Monitors/TV’s 27.45 0.58 1.31 0.58 0.00 1.58
Cell Phones 0.00 0.00 0.00 0.00 0.00 0.00
Other (Furniture & Furnishings) 1.25 0.03 0.06 0.03 0.00 0.07
Textiles & Leathers 223.85 4.70 10.66 4.70 3.58 5.82
Diapers 230.60 4.84 10.98 4.89 3.10 6.68
Rubbers 12.70 0.27 0.60 0.27 0.11 0.44
Household hazardous Materials 48.15 1.01 2.29 1.00 0.36 1.64
Oil Filters 3.40 0.07 0.16 0.07 0.00 0.19
Paints & Solvents 29.55 0.62 1.41 0.61 0.03 1.19
Pesticides, Herbicides, Fungicides 0.50 0.01 0.02 0.01 0.00 0.03
Household Cleaners 1.95 0.04 0.09 0.04 0.00 0.11
Batteries (Lead-Acid) 0.00 0.00 0.00 0.00 0.00 0.00
Batteries (Other) 3.75 0.08 0.18 0.08 0.04 0.11
Mercury Containing Products 0.00 0.00 0.00 0.00 0.00 0.00
Other (HHM Containers with
Product Inside) 9.00 0.19 0.43 0.19 0.00 0.39
Sharps 0.65 0.01 0.03 0.01 0.00 0.02
Fines/Supermix 74.75 1.57 3.56 1.57 1.26 1.89
Other-Specify 72.05 1.51 3.43 1.53 0.71 2.36
Total 4761.38 100.00 226.73 100.00 100.00 100.00

120
Table D-3 Newton County Landfill Data
Table D-3: Newton County Landfill Data (Brook)
#1(06/17/09) #2(06/17/09) #3(06/18/09)
Weather 72°F,cloudy,sunny,windy 72°F,cloudy,sunny,windy 71°F, AM rain
Origin truck 75, Scherriville tr. st. truck 75, Scherriville tr. st. truck 60, Lake St
Categories Material % Material % Material %
Paper 36.34 18.25 27.98
OCC and Kraft bags 11.85 5.46 14.60 6.40 28.60 12.61
Newspaper 13.35 6.15 7.35 3.22 13.50 5.95
Magazines 15.80 7.28 1.75 0.77 5.65 2.49
High Grade/Office 18.75 8.64 7.25 3.18 11.55 5.09
Mixed Recyclable Paper
(including Books, Boxboard) 2.15 0.99 2.70 1.18 0.55 0.24
Compostable Paper 15.90 7.33 6.05 2.65 3.20 1.41
Other Non-recyclable,
Non-compostable Paper 1.05 0.48 1.95 0.85 0.40 0.18
Plastic 9.59 11.94 20.73
#1 PET Non-Deposit
Beverage Containers 1.30 0.60 3.65 1.60 0.80 0.35
#1 PET Deposit Beverage
Containers 1.90 0.88 1.35 0.59 0.55 0.24
#1 PET All Other Containers 0.15 0.07 0.25 0.11 1.05 0.46
#2 HDPE Containers 0.20 0.09 2.25 0.99 2.75 1.21
# 6 Styrofoam 0.70 0.32 0.65 0.28 0.50 0.22
All Other Numbered
Containers (#3,4,5,6,7) 0.75 0.35 0.65 0.28 1.10 0.49
Other Plastic – NOT
Numbered 4.70 2.17 8.70 3.81 34.10 15.04
Film/Wrap/Bags 11.10 5.12 9.75 4.27 6.15 2.71
Metal 7.07 2.08 21.35
Aluminum Non-Deposit
Beverage Containers 0.80 0.37 2.75 1.20 0.95 0.42
Aluminum Deposit Beverage
Containers 0.05 0.02 0.10 0.04 0.00 0.00
Aluminum All Other
Containers 0.00 0.00 0.00 0.00 0.00 0.00
Other Non-Ferrous Scrap 5.70 2.63 0.35 0.15 0.85 0.37
Ferrous Food & Beverage
Containers 3.00 1.38 0.80 0.35 1.35 0.60
Other Ferrous Scrap 5.80 2.67 0.75 0.33 45.25 19.96
Glass 4.24 0.83 1.63
Clear 7.80 3.59 1.15 0.50 1.80 0.79
Green 0.00 0.00 0.15 0.07 1.70 0.75

121
Table D-3: Newton County Landfill Data (Brook)
#1(06/17/09) #2(06/17/09) #3(06/18/09)
Weather 72°F,cloudy,sunny,windy 72°F,cloudy,sunny,windy 71°F, AM rain
Origin truck 75, Scherriville tr. st. truck 75, Scherriville tr. st. truck 60, Lake St
Categories Material % Material % Material %
Blue 0.00 0.00 0.00 0.00 0.00 0.00
Brown 1.40 0.65 0.60 0.26 0.20 0.09
Yard Waste 16.30 7.51 61.40 26.90 21.70 9.57
Food Waste 5.05 2.33 12.25 5.37 3.40 1.50
Wood 4.86 5.70 1.63
Non-Treated Wood 0.00 0.00 0.00 0.00 0.05 0.02
Treated Wood 10.55 4.86 13.00 5.70 3.65 1.61
Demolition/Renovation/
Construction Debris 29.70 13.69 3.65 1.60 13.35 5.89
Durables 8.27 8.81 0.09
All Electrical & Household
Appliances 0.05 0.02 0.30 0.13 0.20 0.09
Central Processing
Units/Peripherals 0.00 0.00 0.00 0.00 0.00 0.00
Computer Monitors/TV’s 0.00 0.00 0.00 0.00 0.00 0.00
Cell Phones 0.00 0.00 0.00 0.00 0.00 0.00
Other (Furniture &
Furnishings) 17.90 8.25 19.80 8.67 0.00 0.00
Textiles & Leathers 2.05 0.94 25.20 11.04 11.60 5.12
Diapers 9.15 4.22 1.70 0.74 5.10 2.25
Rubbers 0.40 0.18 0.72 0.32 0.20 0.09
Household hazardous
Materials 0.21 0.00 0.00
Oil Filters 0.00 0.00 0.00 0.00 0.00 0.00
Paints & Solvents 0.00 0.00 0.00 0.00 0.00 0.00
Pesticides, Herbicides,
Fungicides 0.00 0.00 0.00 0.00 0.00 0.00
Household Cleaners 0.00 0.00 0.00 0.00 0.00 0.00
Batteries (Lead-Acid) 0.00 0.00 0.00 0.00 0.00 0.00
Batteries (Other) 0.45 0.21 0.00 0.00 0.00 0.00
Mercury Containing Products 0.00 0.00 0.00 0.00 0.00 0.00
Other (HHM Containers with
Product Inside) 0.00 0.00 0.00 0.00 0.00 0.00
Sharps 0.00 0.00 0.05 0.02 0.05 0.02
Fines/Supermix 1.20 0.55 13.05 5.72 4.60 2.03
Other-Specify 0.00 0.00 1.60 0.70 0.30 0.13
Total 217.00 100.00 228.27 100.00 226.75 100.00
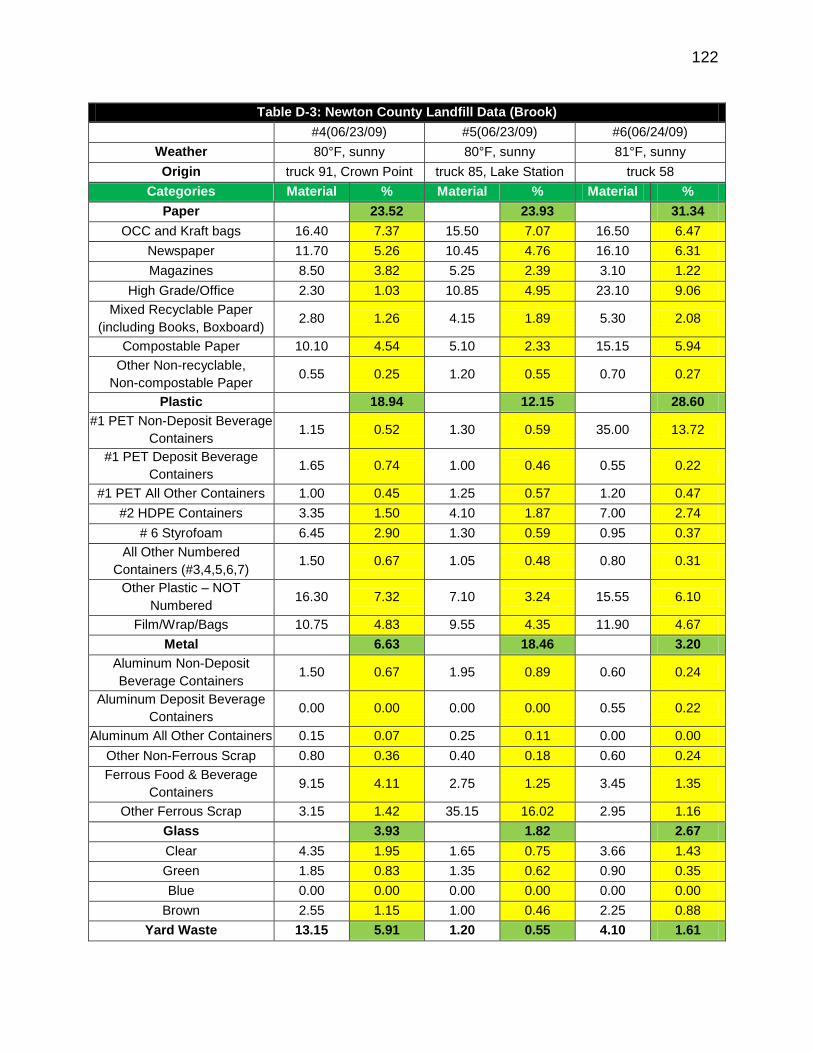
122
Table D-3: Newton County Landfill Data (Brook)
#4(06/23/09) #5(06/23/09) #6(06/24/09)
Weather 80°F, sunny 80°F, sunny 81°F, sunny
Origin truck 91, Crown Point truck 85, Lake Station truck 58
Categories Material % Material % Material %
Paper 23.52 23.93 31.34
OCC and Kraft bags 16.40 7.37 15.50 7.07 16.50 6.47
Newspaper 11.70 5.26 10.45 4.76 16.10 6.31
Magazines 8.50 3.82 5.25 2.39 3.10 1.22
High Grade/Office 2.30 1.03 10.85 4.95 23.10 9.06
Mixed Recyclable Paper
(including Books, Boxboard) 2.80 1.26 4.15 1.89 5.30 2.08
Compostable Paper 10.10 4.54 5.10 2.33 15.15 5.94
Other Non-recyclable,
Non-compostable Paper 0.55 0.25 1.20 0.55 0.70 0.27
Plastic 18.94 12.15 28.60
#1 PET Non-Deposit Beverage
Containers 1.15 0.52 1.30 0.59 35.00 13.72
#1 PET Deposit Beverage
Containers 1.65 0.74 1.00 0.46 0.55 0.22
#1 PET All Other Containers 1.00 0.45 1.25 0.57 1.20 0.47
#2 HDPE Containers 3.35 1.50 4.10 1.87 7.00 2.74
# 6 Styrofoam 6.45 2.90 1.30 0.59 0.95 0.37
All Other Numbered
Containers (#3,4,5,6,7) 1.50 0.67 1.05 0.48 0.80 0.31
Other Plastic – NOT
Numbered 16.30 7.32 7.10 3.24 15.55 6.10
Film/Wrap/Bags 10.75 4.83 9.55 4.35 11.90 4.67
Metal 6.63 18.46 3.20
Aluminum Non-Deposit
Beverage Containers 1.50 0.67 1.95 0.89 0.60 0.24
Aluminum Deposit Beverage
Containers 0.00 0.00 0.00 0.00 0.55 0.22
Aluminum All Other Containers 0.15 0.07 0.25 0.11 0.00 0.00
Other Non-Ferrous Scrap 0.80 0.36 0.40 0.18 0.60 0.24
Ferrous Food & Beverage
Containers 9.15 4.11 2.75 1.25 3.45 1.35
Other Ferrous Scrap 3.15 1.42 35.15 16.02 2.95 1.16
Glass 3.93 1.82 2.67
Clear 4.35 1.95 1.65 0.75 3.66 1.43
Green 1.85 0.83 1.35 0.62 0.90 0.35
Blue 0.00 0.00 0.00 0.00 0.00 0.00
Brown 2.55 1.15 1.00 0.46 2.25 0.88
Yard Waste 13.15 5.91 1.20 0.55 4.10 1.61

123
Table D-3: Newton County Landfill Data (Brook)
#4(06/23/09) #5(06/23/09) #6(06/24/09)
Weather 80°F, sunny 80°F, sunny 81°F, sunny
Origin truck 91, Crown Point truck 85, Lake Station truck 58
Categories Material % Material % Material %
Food Waste 12.55 5.64 13.45 6.13 10.40 4.08
Wood 13.72 12.15 8.51
Non-Treated Wood 0.00 0.00 3.55 1.62 0.00 0.00
Treated Wood 30.55 13.72 23.10 10.53 21.70 8.51
Demolition/Renovation/
Construction Debris 9.80 4.40 8.05 3.67 22.85 8.96
Durables 0.00 0.18 1.59
All Electrical & Household
Appliances 0.00 0.00 0.40 0.18 0.25 0.10
Central Processing
Units/Peripherals 0.00 0.00 0.00 0.00 0.00 0.00
Computer Monitors/TV’s 0.00 0.00 0.00 0.00 0.00 0.00
Cell Phones 0.00 0.00 0.00 0.00 0.00 0.00
Other (Furniture & Furnishings) 0.00 0.00 0.00 0.00 3.81 1.49
Textiles & Leathers 28.45 12.78 9.60 4.38 15.70 6.16
Diapers 7.00 3.14 25.95 11.83 0.15 0.06
Rubbers 0.00 0.00 0.05 0.02 0.25 0.10
Household hazardous
Materials 0.00 0.23 0.00
Oil Filters 0.00 0.00 0.00 0.00 0.00 0.00
Paints & Solvents 0.00 0.00 0.00 0.00 0.00 0.00
Pesticides, Herbicides,
Fungicides 0.00 0.00 0.00 0.00 0.00 0.00
Household Cleaners 0.00 0.00 0.00 0.00 0.00 0.00
Batteries (Lead-Acid) 0.00 0.00 0.00 0.00 0.00 0.00
Batteries (Other) 0.00 0.00 0.50 0.23 0.00 0.00
Mercury Containing Products 0.00 0.00 0.00 0.00 0.00 0.00
Other (HHM Containers with
Product Inside) 0.00 0.00 0.00 0.00 0.00 0.00
Sharps 0.00 0.00 0.05 0.02 0.00 0.00
Fines/Supermix 3.10 1.39 9.65 4.40 6.05 2.37
Other-Specify 0.00 0.00 0.15 0.07 1.95 0.76
Total 222.60 100.00 219.35 100.00 255.07 100.00

124
Table D-3: Newton County Landfill Data (Brook)
#7(06/24/09) #8(06/25/09) #9(06/25/09)
Weather 81°F, sunny 81°F, sunny 81°F, sunny
Origin #7(06/24/09) #8(06/25/09) #9(06/25/09)
Categories Material % Material % Material %
Paper 39.20 25.28 24.24
OCC and Kraft bags 49.05 22.96 11.45 4.87 28.70 11.32
Newspaper 15.45 7.23 5.85 2.49 8.10 3.19
Magazines 1.40 0.66 8.20 3.48 2.30 0.91
High Grade/Office 7.15 3.35 9.40 3.99 4.20 1.66
Mixed Recyclable Paper
(including Books, Boxboard) 1.95 0.91 4.20 1.78 2.25 0.89
Compostable Paper 8.50 3.98 19.35 8.22 15.15 5.98
Other Non-recyclable,
Non-compostable Paper 0.25 0.12 1.05 0.45 0.75 0.30
Plastic 12.50 12.85 25.46
#1 PET Non-Deposit Beverage
Containers 1.35 0.63 0.30 0.13 0.70 0.28
#1 PET Deposit Beverage
Containers 0.95 0.44 1.30 0.55 2.80 1.10
#1 PET All Other Containers 0.75 0.35 1.50 0.64 0.55 0.22
#2 HDPE Containers 0.55 0.26 2.80 1.19 7.35 2.90
# 6 Styrofoam 0.80 0.37 2.60 1.10 2.60 1.03
All Other Numbered
Containers (#3,4,5,6,7) 1.15 0.54 0.45 0.19 2.65 1.05
Other Plastic – NOT
Numbered 9.65 4.52 7.75 3.29 32.85 12.96
Film/Wrap/Bags 11.50 5.38 13.55 5.76 15.05 5.94
Metal 3.07 6.35 2.54
Aluminum Non-Deposit
Beverage Containers 1.60 0.75 0.15 0.06 1.50 0.59
Aluminum Deposit Beverage
Containers 0.05 0.02 0.00 0.00 0.00 0.00
Aluminum All Other Containers 0.00 0.00 0.05 0.02 0.00 0.00
Other Non-Ferrous Scrap 1.55 0.73 0.95 0.40 0.05 0.02
Ferrous Food & Beverage
Containers 1.45 0.68 0.65 0.28 1.95 0.77
Other Ferrous Scrap 1.90 0.89 13.15 5.59 2.95 1.16
Glass 2.95 4.53 2.27
Clear 5.25 2.46 7.40 3.14 3.90 1.54
Green 0.00 0.00 1.40 0.59 1.10 0.43
Blue 0.00 0.00 0.00 0.00 0.00 0.00
Brown 1.05 0.49 1.85 0.79 0.75 0.30
Yard Waste 4.65 2.18 15.55 6.61 4.35 1.72

125
Table D-3: Newton County Landfill Data (Brook)
#7(06/24/09) #8(06/25/09) #9(06/25/09)
Weather 81°F, sunny 81°F, sunny 81°F, sunny
Origin #7(06/24/09) #8(06/25/09) #9(06/25/09)
Categories Material % Material % Material %
Food Waste 21.85 10.23 37.25 15.83 11.55 4.56
Wood 5.92 1.44 11.26
Non-Treated Wood 0.00 0.00 1.50 0.64 0.00 0.00
Treated Wood 12.65 5.92 1.90 0.81 28.55 11.26
Demolition/Renovation/
Construction Debris 28.20 13.20 1.00 0.42 50.10 19.76
Durables 2.78 18.23 0.10
All Electrical & Household
Appliances 2.70 1.26 7.50 3.19 0.25 0.10
Central Processing
Units/Peripherals 0.00 0.00 0.00 0.00 0.00 0.00
Computer Monitors/TV’s 0.00 0.00 0.00 0.00 0.00 0.00
Cell Phones 0.00 0.00 0.00 0.00 0.00 0.00
Other (Furniture & Furnishings) 3.25 1.52 35.40 15.04 0.00 0.00
Textiles & Leathers 9.40 4.40 11.20 4.76 8.40 3.31
Diapers 1.55 0.73 3.05 1.30 6.65 2.62
Rubbers 0.20 0.09 2.20 0.93 2.40 0.95
Household hazardous
Materials 0.00 0.04 0.00
Oil Filters 0.00 0.00 0.00 0.00 0.00 0.00
Paints & Solvents 0.00 0.00 0.00 0.00 0.00 0.00
Pesticides, Herbicides,
Fungicides 0.00 0.00 0.00 0.00 0.00 0.00
Household Cleaners 0.00 0.00 0.00 0.00 0.00 0.00
Batteries (Lead-Acid) 0.00 0.00 0.00 0.00 0.00 0.00
Batteries (Other) 0.00 0.00 0.10 0.04 0.00 0.00
Mercury Containing Products 0.00 0.00 0.00 0.00 0.00 0.00
Other (HHM Containers with
Product Inside) 0.00 0.00 0.00 0.00 0.00 0.00
Sharps 0.00 0.00 0.00 0.00 0.00 0.00
Fines/Supermix 5.90 2.76 3.05 1.30 2.35 0.93
Other-Specify 0.00 0.00 0.30 0.13 0.75 0.30
Total 213.65 100.00 235.35 100.00 253.55 100.00

126
Table D-3: Newton County Landfill Data (Brook)
#10(06/26/09) #11(06/26/09) #12(06/26/09)
Weather 79°F, sunny 79°F, sunny 79°F, sunny
Origin N/A truck 97,East Chicago truck 63, East Chicago
Categories Material % Material % Material %
Paper 27.84 37.78 26.86
OCC and Kraft bags 46.05 19.51 18.65 7.48 25.90 11.47
Newspaper 2.75 1.17 9.00 3.61 11.15 4.94
Magazines 1.90 0.81 0.70 0.28 1.95 0.86
High Grade/Office 5.75 2.44 51.95 20.84 10.50 4.65
Mixed Recyclable Paper
(including Books, Boxboard) 0.85 0.36 1.80 0.72 1.85 0.82
Compostable Paper 7.20 3.05 10.90 4.37 9.25 4.10
Other Non-recyclable,
Non-compostable Paper 1.20 0.51 1.20 0.48 0.05 0.02
Plastic 19.92 31.49 11.91
#1 PET Non-Deposit Beverage
Containers 1.50 0.64 2.25 0.90 1.45 0.64
#1 PET Deposit Beverage
Containers 2.50 1.06 5.70 2.29 0.70 0.31
#1 PET All Other Containers 0.45 0.19 30.80 12.35 0.70 0.31
#2 HDPE Containers 3.60 1.53 8.75 3.51 5.10 2.26
# 6 Styrofoam 0.80 0.34 1.95 0.78 0.75 0.33
All Other Numbered
Containers (#3,4,5,6,7) 0.95 0.40 1.90 0.76 0.45 0.20
Other Plastic – NOT
Numbered 20.65 8.75 14.35 5.76 7.25 3.21
Film/Wrap/Bags 16.55 7.01 12.80 5.13 10.50 4.65
Metal 3.81 3.93 11.76
Aluminum Non-Deposit
Beverage Containers 0.45 0.19 0.65 0.26 0.95 0.42
Aluminum Deposit Beverage
Containers 0.00 0.00 0.00 0.00 0.00 0.00
Aluminum All Other Containers 0.00 0.00 0.00 0.00 0.05 0.02
Other Non-Ferrous Scrap 3.65 1.55 0.45 0.18 0.05 0.02
Ferrous Food & Beverage
Containers 1.20 0.51 1.60 0.64 1.35 0.60
Other Ferrous Scrap 3.70 1.57 7.10 2.85 24.15 10.70
Glass 0.53 2.34 0.24
Clear 0.05 0.02 3.95 1.58 0.10 0.04
Green 0.40 0.17 0.00 0.00 0.00 0.00
Blue 0.00 0.00 0.00 0.00 0.00 0.00
Brown 0.80 0.34 1.88 0.75 0.45 0.20
Yard Waste 10.65 4.51 0.00 0.00 9.10 4.03

127
Table D-3: Newton County Landfill Data (Brook)
#10(06/26/09) #11(06/26/09) #12(06/26/09)
Weather 79°F, sunny 79°F, sunny 79°F, sunny
Origin N/A truck 97,East Chicago truck 63, East Chicago
Categories Material % Material % Material %
Food Waste 7.95 3.37 17.05 6.84 7.20 3.19
Wood 16.82 5.01 8.66
Non-Treated Wood 0.00 0.00 0.00 0.00 13.90 6.16
Treated Wood 39.70 16.82 12.50 5.01 5.65 2.50
Demolition/Renovation/
Construction Debris 30.75 13.03 2.30 0.92 55.30 24.49
Durables 0.00 3.37 5.27
All Electrical & Household
Appliances 0.00 0.00 0.20 0.08 6.60 2.92
Central Processing
Units/Peripherals 0.00 0.00 0.00 0.00 0.00 0.00
Computer Monitors/TV’s 0.00 0.00 0.00 0.00 0.00 0.00
Cell Phones 0.00 0.00 0.00 0.00 0.00 0.00
Other (Furniture & Furnishings) 0.00 0.00 8.20 3.29 5.30 2.35
Textiles & Leathers 8.00 3.39 13.95 5.60 1.60 0.71
Diapers 2.65 1.12 1.35 0.54 0.40 0.18
Rubbers 3.25 1.38 0.75 0.30 0.00 0.00
Household hazardous
Materials 0.00 0.62 0.31
Oil Filters 0.00 0.00 0.00 0.00 0.70 0.31
Paints & Solvents 0.00 0.00 1.40 0.56 0.00 0.00
Pesticides, Herbicides,
Fungicides 0.00 0.00 0.00 0.00 0.00 0.00
Household Cleaners 0.00 0.00 0.00 0.00 0.00 0.00
Batteries (Lead-Acid) 0.00 0.00 0.00 0.00 0.00 0.00
Batteries (Other) 0.00 0.00 0.00 0.00 0.00 0.00
Mercury Containing Products 0.00 0.00 0.15 0.06 0.00 0.00
Other (HHM Containers with
Product Inside) 0.00 0.00 0.00 0.00 0.00 0.00
Sharps 0.00 0.00 0.00 0.00 0.00 0.00
Fines/Supermix 7.75 3.28 3.15 1.26 5.30 2.35
Other-Specify 2.35 1.00 0.00 0.00 0.10 0.04
Total 236.00 100.00 249.33 100.00 225.80 100.00
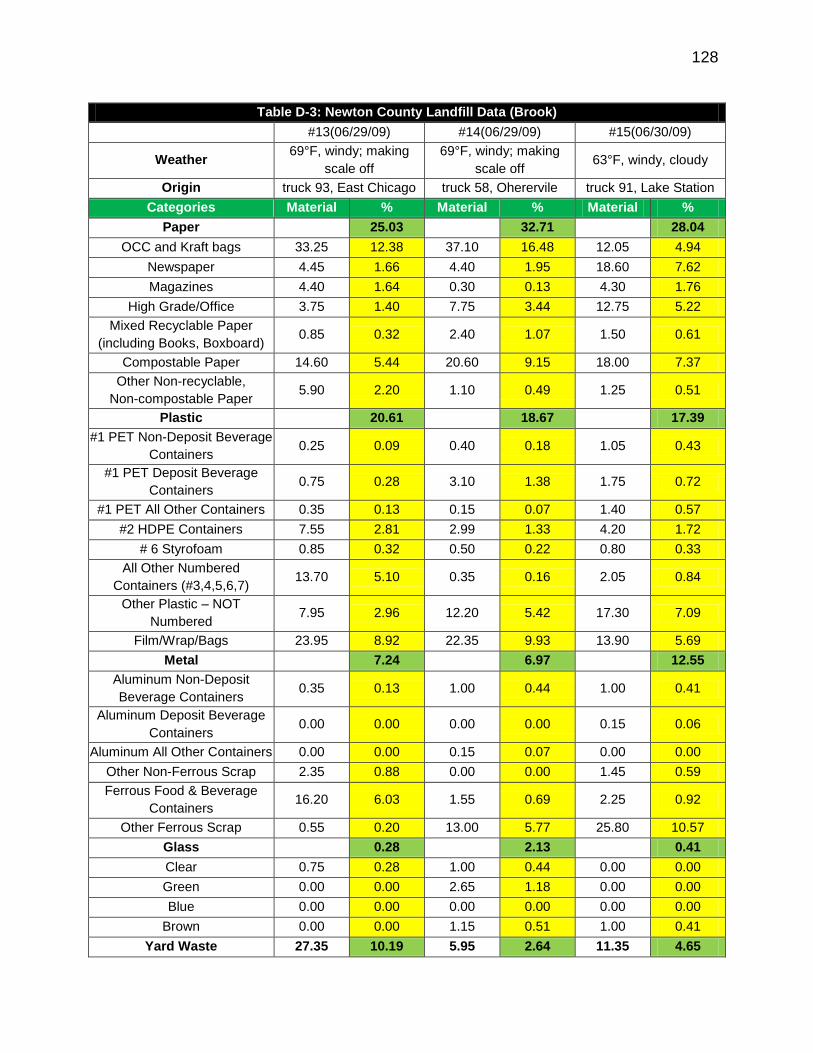
128
Table D-3: Newton County Landfill Data (Brook)
#13(06/29/09) #14(06/29/09) #15(06/30/09)
Weather 69°F, windy; making
scale off
69°F, windy; making
scale off 63°F, windy, cloudy
Origin truck 93, East Chicago truck 58, Oherervile truck 91, Lake Station
Categories Material % Material % Material %
Paper 25.03 32.71 28.04
OCC and Kraft bags 33.25 12.38 37.10 16.48 12.05 4.94
Newspaper 4.45 1.66 4.40 1.95 18.60 7.62
Magazines 4.40 1.64 0.30 0.13 4.30 1.76
High Grade/Office 3.75 1.40 7.75 3.44 12.75 5.22
Mixed Recyclable Paper
(including Books, Boxboard) 0.85 0.32 2.40 1.07 1.50 0.61
Compostable Paper 14.60 5.44 20.60 9.15 18.00 7.37
Other Non-recyclable,
Non-compostable Paper 5.90 2.20 1.10 0.49 1.25 0.51
Plastic 20.61 18.67 17.39
#1 PET Non-Deposit Beverage
Containers 0.25 0.09 0.40 0.18 1.05 0.43
#1 PET Deposit Beverage
Containers 0.75 0.28 3.10 1.38 1.75 0.72
#1 PET All Other Containers 0.35 0.13 0.15 0.07 1.40 0.57
#2 HDPE Containers 7.55 2.81 2.99 1.33 4.20 1.72
# 6 Styrofoam 0.85 0.32 0.50 0.22 0.80 0.33
All Other Numbered
Containers (#3,4,5,6,7) 13.70 5.10 0.35 0.16 2.05 0.84
Other Plastic – NOT
Numbered 7.95 2.96 12.20 5.42 17.30 7.09
Film/Wrap/Bags 23.95 8.92 22.35 9.93 13.90 5.69
Metal 7.24 6.97 12.55
Aluminum Non-Deposit
Beverage Containers 0.35 0.13 1.00 0.44 1.00 0.41
Aluminum Deposit Beverage
Containers 0.00 0.00 0.00 0.00 0.15 0.06
Aluminum All Other Containers 0.00 0.00 0.15 0.07 0.00 0.00
Other Non-Ferrous Scrap 2.35 0.88 0.00 0.00 1.45 0.59
Ferrous Food & Beverage
Containers 16.20 6.03 1.55 0.69 2.25 0.92
Other Ferrous Scrap 0.55 0.20 13.00 5.77 25.80 10.57
Glass 0.28 2.13 0.41
Clear 0.75 0.28 1.00 0.44 0.00 0.00
Green 0.00 0.00 2.65 1.18 0.00 0.00
Blue 0.00 0.00 0.00 0.00 0.00 0.00
Brown 0.00 0.00 1.15 0.51 1.00 0.41
Yard Waste 27.35 10.19 5.95 2.64 11.35 4.65

129
Table D-3: Newton County Landfill Data (Brook)
#13(06/29/09) #14(06/29/09) #15(06/30/09)
Weather 69°F, windy; making
scale off
69°F, windy; making
scale off 63°F, windy, cloudy
Origin truck 93, East Chicago truck 58, Oherervile truck 91, Lake Station
Categories Material % Material % Material %
Food Waste 52.10 19.40 23.10 10.26 19.30 7.91
Wood 6.31 8.15 7.27
Non-Treated Wood 0.00 0.00 1.80 0.80 0.00 0.00
Treated Wood 16.95 6.31 16.55 7.35 17.74 7.27
Demolition/Renovation/
Construction Debris 13.65 5.08 0.00 0.00 0.00 0.00
Durables 0.65 0.29 1.31
All Electrical & Household
Appliances 1.75 0.65 0.65 0.29 3.20 1.31
Central Processing
Units/Peripherals 0.00 0.00 0.00 0.00 0.00 0.00
Computer Monitors/TV’s 0.00 0.00 0.00 0.00 0.00 0.00
Cell Phones 0.00 0.00 0.00 0.00 0.00 0.00
Other (Furniture & Furnishings) 0.00 0.00 0.00 0.00 0.00 0.00
Textiles & Leathers 9.00 3.35 31.50 13.99 11.35 4.65
Diapers 0.15 0.06 5.80 2.58 14.10 5.78
Rubbers 4.75 1.77 1.10 0.49 16.85 6.90
Household hazardous
Materials 0.02 0.00 0.02
Oil Filters 0.00 0.00 0.00 0.00 0.00 0.00
Paints & Solvents 0.00 0.00 0.00 0.00 0.00 0.00
Pesticides, Herbicides,
Fungicides 0.00 0.00 0.00 0.00 0.00 0.00
Household Cleaners 0.00 0.00 0.00 0.00 0.00 0.00
Batteries (Lead-Acid) 0.00 0.00 0.00 0.00 0.00 0.00
Batteries (Other) 0.05 0.02 0.00 0.00 0.05 0.02
Mercury Containing Products 0.00 0.00 0.00 0.00 0.00 0.00
Other (HHM Containers with
Product Inside) 0.00 0.00 0.00 0.00 0.00 0.00
Sharps 0.00 0.00 0.00 0.00 0.00 0.00
Fines/Supermix 0.00 0.00 0.44 0.20 3.80 1.56
Other-Specify 0.00 0.00 2.10 0.93 3.85 1.58
Total 268.50 100.00 225.18 100.00 244.14 100.00

130
Table D-3: Newton County Landfill Data (Brook)
#16(06/30/09) #17(06/30/09) #18(07/01/09)
Weather 63°F, windy, cloudy 63°F, windy, cloudy 64°F,very cloudy
Origin truck 58, East Chicago truck 50, East Chicago truck 69,East Chicago
Categories Material % Material % Material %
Paper 34.10 31.21 25.22
OCC and Kraft bags 26.60 11.62 33.95 15.04 19.30 9.25
Newspaper 20.80 9.08 10.45 4.63 6.10 2.92
Magazines 2.05 0.90 2.00 0.89 1.55 0.74
High Grade/Office 12.40 5.41 16.35 7.24 9.65 4.62
Mixed Recyclable Paper
(including Books, Boxboard) 4.35 1.90 2.50 1.11 2.65 1.27
Compostable Paper 11.05 4.83 5.20 2.30 12.40 5.94
Other Non-recyclable,
Non-compostable Paper 0.85 0.37 0.00 0.00 1.00 0.48
Plastic 16.66 14.88 22.06
#1 PET Non-Deposit Beverage
Containers 1.30 0.57 1.45 0.64 2.25 1.08
#1 PET Deposit Beverage
Containers 2.25 0.98 2.15 0.95 3.85 1.84
#1 PET All Other Containers 1.05 0.46 1.40 0.62 1.00 0.48
#2 HDPE Containers 3.55 1.55 4.90 2.17 3.35 1.60
# 6 Styrofoam 2.75 1.20 0.40 0.18 1.15 0.55
All Other Numbered
Containers (#3,4,5,6,7) 1.80 0.79 1.20 0.53 1.15 0.55
Other Plastic – NOT
Numbered 10.35 4.52 15.20 6.73 24.10 11.54
Film/Wrap/Bags 15.10 6.59 6.90 3.06 9.20 4.41
Metal 3.84 3.28 5.75
Aluminum Non-Deposit
Beverage Containers 1.30 0.57 0.00 0.00 0.40 0.19
Aluminum Deposit Beverage
Containers 0.20 0.09 0.90 0.40 0.80 0.38
Aluminum All Other Containers 0.00 0.00 0.00 0.00 0.70 0.34
Other Non-Ferrous Scrap 0.45 0.20 0.50 0.22 0.30 0.14
Ferrous Food & Beverage
Containers 4.40 1.92 1.80 0.80 1.15 0.55
Other Ferrous Scrap 2.45 1.07 4.20 1.86 8.65 4.14
Glass 5.44 1.00 2.75
Clear 8.15 3.56 0.35 0.16 4.05 1.94
Green 0.00 0.00 0.00 0.00 0.00 0.00
Blue 0.00 0.00 0.00 0.00 0.00 0.00
Brown 4.30 1.88 1.90 0.84 1.70 0.81

131
Table D-3: Newton County Landfill Data (Brook)
#16(06/30/09) #17(06/30/09) #18(07/01/09)
Weather 63°F, windy, cloudy 63°F, windy, cloudy 64°F,very cloudy
Origin truck 58, East Chicago truck 50, East Chicago truck 69,East Chicago
Categories Material % Material % Material %
Yard Waste 2.60 1.14 0.00 0.00 17.20 8.24
Food Waste 23.60 10.31 5.35 2.37 11.45 5.49
Wood 4.50 26.76 14.59
Non-Treated Wood 0.00 0.00 41.55 18.41 0.00 0.00
Treated Wood 10.30 4.50 18.85 8.35 30.45 14.59
Demolition/Renovation/
Construction Debris 3.00 1.31 3.20 1.42 8.85 4.24
Durables 0.72 3.88 0.00
All Electrical & Household
Appliances 1.65 0.72 8.75 3.88 0.00 0.00
Central Processing
Units/Peripherals 0.00 0.00 0.00 0.00 0.00 0.00
Computer Monitors/TV’s 0.00 0.00 0.00 0.00 0.00 0.00
Cell Phones 0.00 0.00 0.00 0.00 0.00 0.00
Other (Furniture & Furnishings) 0.00 0.00 0.00 0.00 0.00 0.00
Textiles & Leathers 32.05 14.00 22.45 9.94 3.35 1.60
Diapers 7.40 3.23 2.20 0.97 11.60 5.56
Rubbers 1.15 0.50 0.20 0.09 2.60 1.25
Household hazardous
Materials 1.62 0.00 0.81
Oil Filters 0.00 0.00 0.00 0.00 1.25 0.60
Paints & Solvents 3.25 1.42 0.00 0.00 0.30 0.14
Pesticides, Herbicides,
Fungicides 0.00 0.00 0.00 0.00 0.00 0.00
Household Cleaners 0.00 0.00 0.00 0.00 0.00 0.00
Batteries (Lead-Acid) 0.00 0.00 0.00 0.00 0.00 0.00
Batteries (Other) 0.45 0.20 0.00 0.00 0.15 0.07
Mercury Containing Products 0.00 0.00 0.00 0.00 0.00 0.00
Other (HHM Containers with
Product Inside) 0.00 0.00 0.00 0.00 0.00 0.00
Sharps 0.10 0.04 0.00 0.00 0.00 0.00
Fines/Supermix 3.00 1.31 1.65 0.73 5.10 2.44
Other-Specify 2.95 1.29 7.85 3.48 0.00 0.00
Total 229.00 100.00 225.75 100.00 208.75 100.00

132
Table D-3: Newton County Landfill Data (Brook)
#19(07/01/09) #20(07/01/09)
Weather 64°F,very cloudy 64°F,very cloudy
Origin truck89, Valpo N/A
Categories Material % Material %
Paper 11.88 26.85
OCC and Kraft bags 5.50 2.28 49.85 20.29
Newspaper 5.00 2.08 0.90 0.37
Magazines 4.75 1.97 0.75 0.31
High Grade/Office 5.70 2.37 2.75 1.12
Mixed Recyclable Paper
(including Books, Boxboard) 1.40 0.58 2.30 0.94
Compostable Paper 6.10 2.53 9.20 3.75
Other Non-recyclable,
Non-compostable Paper 0.15 0.06 0.20 0.08
Plastic 6.56 12.44
#1 PET Non-Deposit Beverage
Containers 0.40 0.17 1.50 0.61
#1 PET Deposit Beverage
Containers 1.20 0.50 6.35 2.58
#1 PET All Other Containers 0.35 0.15 0.10 0.04
#2 HDPE Containers 3.65 1.52 2.50 1.02
# 6 Styrofoam 0.45 0.19 0.50 0.20
All Other Numbered Containers
(#3,4,5,6,7) 0.10 0.04 1.45 0.59
Other Plastic – NOT Numbered 7.30 3.03 7.55 3.07
Film/Wrap/Bags 2.35 0.98 10.60 4.32
Metal 2.18 1.24
Aluminum Non-Deposit
Beverage Containers 0.20 0.08 0.00 0.00
Aluminum Deposit Beverage
Containers 0.45 0.19 0.65 0.26
Aluminum All Other Containers 0.00 0.00 1.35 0.55
Other Non-Ferrous Scrap 0.40 0.17 0.20 0.08
Ferrous Food & Beverage
Containers 0.40 0.17 0.35 0.14
Other Ferrous Scrap 3.80 1.58 0.50 0.20
Glass 1.58 0.57
Clear 2.90 1.20 1.35 0.55
Green 0.45 0.19 0.00 0.00
Blue 0.00 0.00 0.00 0.00
Brown 0.45 0.19 0.05 0.02
Yard Waste 71.25 29.60 18.25 7.43
Food Waste 55.35 22.99 15.15 6.17
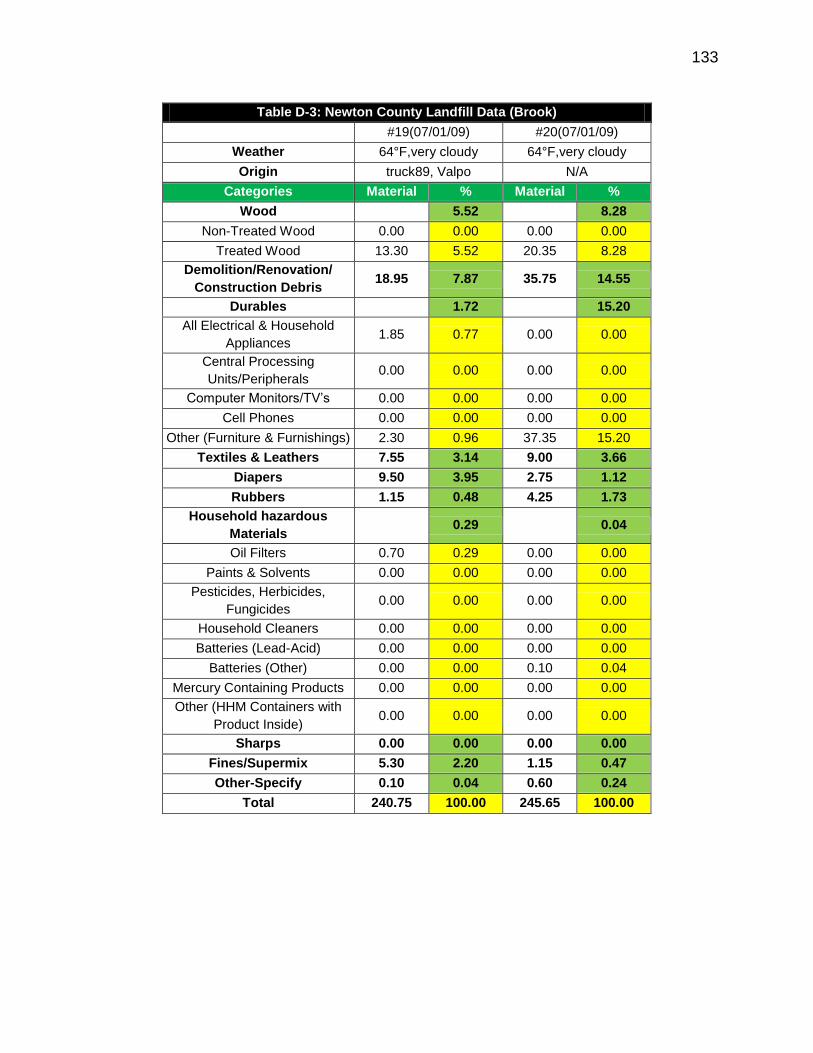
133
Table D-3: Newton County Landfill Data (Brook)
#19(07/01/09) #20(07/01/09)
Weather 64°F,very cloudy 64°F,very cloudy
Origin truck89, Valpo N/A
Categories Material % Material %
Wood 5.52 8.28
Non-Treated Wood 0.00 0.00 0.00 0.00
Treated Wood 13.30 5.52 20.35 8.28
Demolition/Renovation/
Construction Debris 18.95 7.87 35.75 14.55
Durables 1.72 15.20
All Electrical & Household
Appliances 1.85 0.77 0.00 0.00
Central Processing
Units/Peripherals 0.00 0.00 0.00 0.00
Computer Monitors/TV’s 0.00 0.00 0.00 0.00
Cell Phones 0.00 0.00 0.00 0.00
Other (Furniture & Furnishings) 2.30 0.96 37.35 15.20
Textiles & Leathers 7.55 3.14 9.00 3.66
Diapers 9.50 3.95 2.75 1.12
Rubbers 1.15 0.48 4.25 1.73
Household hazardous
Materials 0.29 0.04
Oil Filters 0.70 0.29 0.00 0.00
Paints & Solvents 0.00 0.00 0.00 0.00
Pesticides, Herbicides,
Fungicides 0.00 0.00 0.00 0.00
Household Cleaners 0.00 0.00 0.00 0.00
Batteries (Lead-Acid) 0.00 0.00 0.00 0.00
Batteries (Other) 0.00 0.00 0.10 0.04
Mercury Containing Products 0.00 0.00 0.00 0.00
Other (HHM Containers with
Product Inside) 0.00 0.00 0.00 0.00
Sharps 0.00 0.00 0.00 0.00
Fines/Supermix 5.30 2.20 1.15 0.47
Other-Specify 0.10 0.04 0.60 0.24
Total 240.75 100.00 245.65 100.00

134
Table D-3: Newton County Landfill Data (Brook)
By Total Weight of
Samples By Ave % Confidence Interval
Total Value of 20
Samples
Average value of 20
samples
Lower
Bound
Upper
Bound
Categories Material % Material % Material %
Paper 1299.05 27.81 64.95 27.88 25.36 30.40
OCC and Kraft bags 500.85 10.72 25.04 10.76 8.55 12.97
Newspaper 195.45 4.18 9.77 4.23 3.32 5.14
Magazines 76.60 1.64 3.83 1.66 1.02 2.31
High Grade/Office 233.85 5.01 11.69 4.98 3.29 6.68
Mixed Recyclable Paper
(including Books, Boxboard) 48.50 1.04 2.43 1.05 0.84 1.25
Compostable Paper 223.00 4.77 11.15 4.76 3.93 5.59
Other Non-recyclable,
Non-compostable Paper 20.80 0.45 1.04 0.43 0.25 0.61
Plastic 814.69 17.44 40.73 17.27 14.78 19.75
#1 PET Non-Deposit Beverage
Containers 59.35 1.27 2.97 1.22 0.07 2.36
#1 PET Deposit Beverage
Containers 42.35 0.91 2.12 0.91 0.65 1.16
#1 PET All Other Containers 45.45 0.97 2.27 0.94 0.00 1.98
#2 HDPE Containers 80.49 1.72 4.02 1.69 1.36 2.02
# 6 Styrofoam 27.45 0.59 1.37 0.59 0.35 0.83
All Other Numbered Containers
(#3,4,5,6,7) 35.20 0.75 1.76 0.72 0.30 1.13
Other Plastic – NOT Numbered 280.90 6.01 14.05 6.03 4.64 7.42
Film/Wrap/Bags 243.50 5.21 12.18 5.19 4.42 5.95
Metal 307.50 6.58 15.38 6.67 4.56 8.77
Aluminum Non-Deposit Beverage
Containers 18.10 0.39 0.91 0.39 0.27 0.52
Aluminum Deposit Beverage
Containers 3.90 0.08 0.20 0.08 0.03 0.14
Aluminum All Other Containers 2.70 0.06 0.14 0.06 0.00 0.11
Other Non-Ferrous Scrap 21.05 0.45 1.05 0.46 0.21 0.70
Ferrous Food & Beverage
Containers 56.80 1.22 2.84 1.19 0.63 1.74
Other Ferrous Scrap 204.95 4.39 10.25 4.49 2.33 6.64
Glass 96.89 2.07 4.84 2.11 1.52 2.70
Clear 59.61 1.28 2.98 1.30 0.85 1.75
Green 11.95 0.26 0.60 0.26 0.12 0.40
Blue 0.00 0.00 0.00 0.00 0.00 0.00
Brown 25.33 0.54 1.27 0.55 0.38 0.72
Yard Waste 316.10 6.77 15.81 6.75 3.65 9.85
Food Waste 365.35 7.82 18.27 7.70 5.46 9.93

135
Table D-3: Newton County Landfill Data (Brook)
By Total Weight of
Samples By Ave % Confidence Interval
Total Value of 20
Samples
Average value of 20
samples
Lower
Bound
Upper
Bound
Categories Material % Material % Material %
Wood 410.34 8.79 20.52 8.85 6.58 11.12
Non-Treated Wood 62.35 1.33 3.12 1.38 0.00 3.02
Treated Wood 347.99 7.45 17.40 7.47 5.84 9.11
Demolition/Renovation/
Construction Debris 338.45 7.25 16.92 7.23 4.49 9.96
Durables 169.61 3.63 8.48 3.62 1.61 5.64
All Electrical & Household
Appliances 36.30 0.78 1.82 0.78 0.33 1.24
Central Processing
Units/Peripherals 0.00 0.00 0.00 0.00 0.00 0.00
Computer Monitors/TV’s 0.00 0.00 0.00 0.00 0.00 0.00
Cell Phones 0.00 0.00 0.00 0.00 0.00 0.00
Other (Furniture & Furnishings) 133.31 2.85 6.67 2.84 0.93 4.74
Textiles & Leathers 271.40 5.81 13.57 5.85 4.23 7.46
Diapers 118.20 2.53 5.91 2.60 1.52 3.68
Rubbers 42.47 0.91 2.12 0.88 0.29 1.47
Household hazardous Materials 9.60 0.21 0.48 0.21 0.06 0.37
Oil Filters 2.65 0.06 0.13 0.06 0.00 0.12
Paints & Solvents 4.95 0.11 0.25 0.11 0.00 0.24
Pesticides, Herbicides, Fungicides 0.00 0.00 0.00 0.00 0.00 0.00
Household Cleaners 0.00 0.00 0.00 0.00 0.00 0.00
Batteries (Lead-Acid) 0.00 0.00 0.00 0.00 0.00 0.00
Batteries (Other) 1.85 0.04 0.09 0.04 0.01 0.07
Mercury Containing Products 0.15 0.00 0.01 0.00 0.00 0.01
Other (HHM Containers with
Product Inside) 0.00 0.00 0.00 0.00 0.00 0.00
Sharps 0.25 0.01 0.01 0.01 0.00 0.01
Fines/Supermix 85.59 1.83 4.28 1.86 1.31 2.41
Other-Specify 24.95 0.53 1.25 0.53 0.21 0.86
Total 4670.43 100.00 233.52 100.00 100.00 100.00

136
Table D-4 Daviess County Landfill Data
Table D-4: Daviess County Landfill Data (Washington)
#1(07/17/09) #2(07/17/09) #3(07/20/09)
Weather sunny sunny sunny
Origin truck 102, Washington truck 102, Washington truck 102
Categories Material % Material % Material %
Paper 37.69 25.37 30.44
OCC and Kraft bags 54.05 24.22 24.60 10.31 12.40 5.37
Newspaper 3.60 1.61 10.15 4.25 16.60 7.19
Magazines 1.40 0.63 3.50 1.47 11.05 4.79
High Grade/Office 5.55 2.49 7.75 3.25 14.45 6.26
Mixed Recyclable Paper
(including Books, Boxboard) 1.60 0.72 4.50 1.89 4.55 1.97
Compostable Paper 15.20 6.81 8.50 3.56 10.60 4.59
Other Non-recyclable,
Non-compostable Paper 2.70 1.21 1.55 0.65 0.60 0.26
Plastic 21.40 14.83 18.83
#1 PET Non-Deposit Beverage
Containers 4.90 2.20 1.80 0.75 2.51 1.09
#1 PET Deposit Beverage
Containers 2.95 1.32 1.65 0.69 2.35 1.02
#1 PET All Other Containers 0.55 0.25 1.20 0.50 3.35 1.45
#2 HDPE Containers 5.90 2.64 3.00 1.26 5.65 2.45
# 6 Styrofoam 2.10 0.94 2.45 1.03 2.75 1.19
All Other Numbered
Containers (#3,4,5,6,7) 2.10 0.94 2.00 0.84 2.00 0.87
Other Plastic – NOT
Numbered 17.55 7.86 6.30 2.64 14.15 6.13
Film/Wrap/Bags 11.70 5.24 17.00 7.12 10.70 4.64
Metal 4.03 7.02 3.49
Aluminum Non-Deposit
Beverage Containers 0.00 0.00 2.95 1.24 2.00 0.87
Aluminum Deposit Beverage
Containers 1.45 0.65 2.45 1.03 1.25 0.54
Aluminum All Other Containers 0.00 0.00 0.00 0.00 0.35 0.15
Other Non-Ferrous Scrap 0.35 0.16 0.20 0.08 0.25 0.11
Ferrous Food & Beverage
Containers 5.40 2.42 6.45 2.70 2.95 1.28
Other Ferrous Scrap 1.80 0.81 4.70 1.97 1.25 0.54
Glass 4.28 4.92 8.08
Clear 3.90 1.75 6.10 2.56 10.45 4.53
Green 1.55 0.69 0.00 0.00 2.35 1.02
Blue 0.00 0.00 0.00 0.00 0.00 0.00

137
Table D-4: Daviess County Landfill Data (Washington)
#1(07/17/09) #2(07/17/09) #3(07/20/09)
Weather sunny sunny sunny
Origin truck 102, Washington truck 102, Washington truck 102
Categories Material % Material % Material %
Brown 4.10 1.84 5.65 2.37 5.85 2.53
Yard Waste 5.00 2.24 28.75 12.04 2.65 1.15
Food Waste 30.60 13.71 38.20 16.00 27.95 12.11
Wood 0.96 3.69 3.96
Non-Treated Wood 0.00 0.00 1.95 0.82 0.10 0.04
Treated Wood 2.15 0.96 6.85 2.87 9.05 3.92
Demolition/Renovation/
Construction Debris 0.00 0.00 1.10 0.46 0.00 0.00
Durables 1.21 1.05 0.00
All Electrical & Household
Appliances 2.50 1.12 2.50 1.05 0.00 0.00
Central Processing
Units/Peripherals 0.00 0.00 0.00 0.00 0.00 0.00
Computer Monitors/TV’s 0.00 0.00 0.00 0.00 0.00
Cell Phones 0.20 0.09 0.00 0.00 0.00 0.00
Other (Furniture & Furnishings) 0.00 0.00 0.00 0.00 0.00 0.00
Textiles & Leathers 11.15 5.00 8.40 3.52 24.95 10.81
Diapers 17.05 7.64 16.90 7.08 19.95 8.64
Rubbers 0.05 0.02 0.00 0.00 0.05 0.02
Household hazardous
Materials 0.43 2.05 0.52
Oil Filters 0.00 0.00 0.00 0.00 0.00 0.00
Paints & Solvents 0.65 0.29 4.75 1.99 1.00 0.43
Pesticides, Herbicides,
Fungicides 0.00 0.00 0.00 0.00 0.00 0.00
Household Cleaners 0.00 0.00 0.00 0.00 0.00 0.00
Batteries (Lead-Acid) 0.00 0.00 0.00 0.00 0.00 0.00
Batteries (Other) 0.30 0.13 0.15 0.06 0.20 0.09
Mercury Containing Products 0.00 0.00 0.00 0.00 0.00 0.00
Other (HHM Containers with
Product Inside) 0.00 0.00 0.00 0.00 0.00 0.00
Sharps 0.10 0.04 0.00 0.00 0.00 0.00
Fines/Supermix 0.1 0.04 1.80 0.75 2.75 1.19
Other-Specify 2.9 1.30 2.90 1.21 1.75 0.76
Total 223.15 100.00 238.70 100.00 230.81 100.00
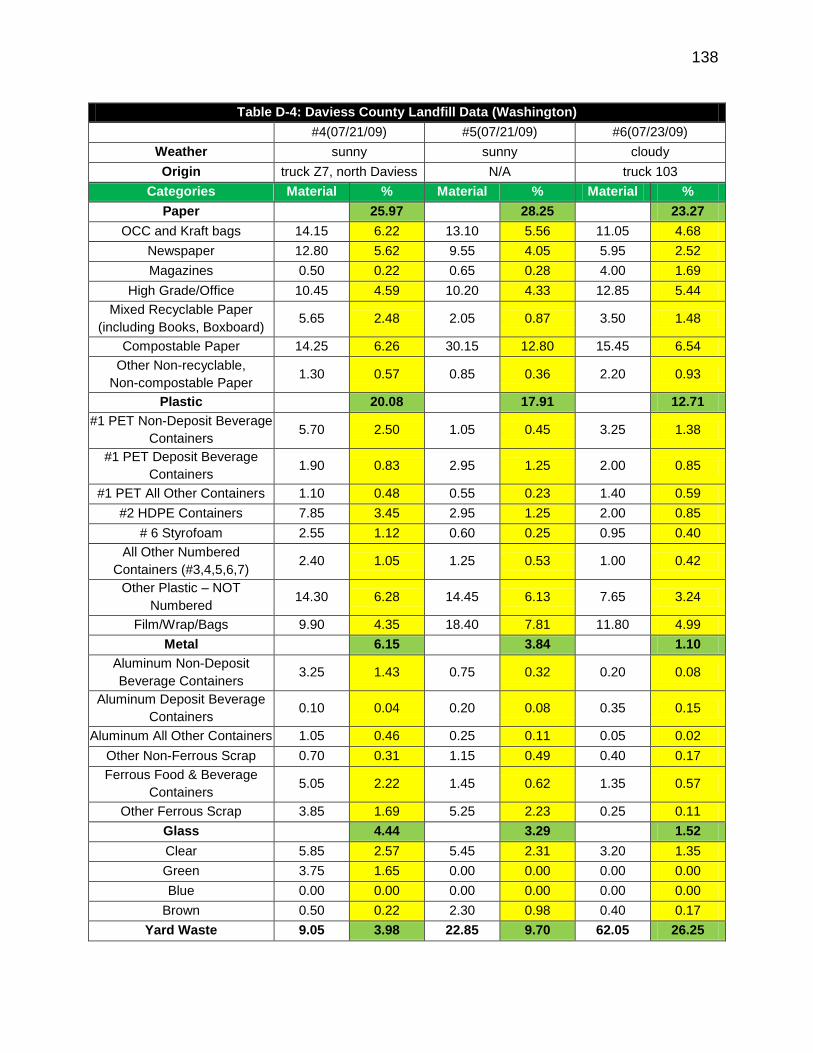
138
Table D-4: Daviess County Landfill Data (Washington)
#4(07/21/09) #5(07/21/09) #6(07/23/09)
Weather sunny sunny cloudy
Origin truck Z7, north Daviess N/A truck 103
Categories Material % Material % Material %
Paper 25.97 28.25 23.27
OCC and Kraft bags 14.15 6.22 13.10 5.56 11.05 4.68
Newspaper 12.80 5.62 9.55 4.05 5.95 2.52
Magazines 0.50 0.22 0.65 0.28 4.00 1.69
High Grade/Office 10.45 4.59 10.20 4.33 12.85 5.44
Mixed Recyclable Paper
(including Books, Boxboard) 5.65 2.48 2.05 0.87 3.50 1.48
Compostable Paper 14.25 6.26 30.15 12.80 15.45 6.54
Other Non-recyclable,
Non-compostable Paper 1.30 0.57 0.85 0.36 2.20 0.93
Plastic 20.08 17.91 12.71
#1 PET Non-Deposit Beverage
Containers 5.70 2.50 1.05 0.45 3.25 1.38
#1 PET Deposit Beverage
Containers 1.90 0.83 2.95 1.25 2.00 0.85
#1 PET All Other Containers 1.10 0.48 0.55 0.23 1.40 0.59
#2 HDPE Containers 7.85 3.45 2.95 1.25 2.00 0.85
# 6 Styrofoam 2.55 1.12 0.60 0.25 0.95 0.40
All Other Numbered
Containers (#3,4,5,6,7) 2.40 1.05 1.25 0.53 1.00 0.42
Other Plastic – NOT
Numbered 14.30 6.28 14.45 6.13 7.65 3.24
Film/Wrap/Bags 9.90 4.35 18.40 7.81 11.80 4.99
Metal 6.15 3.84 1.10
Aluminum Non-Deposit
Beverage Containers 3.25 1.43 0.75 0.32 0.20 0.08
Aluminum Deposit Beverage
Containers 0.10 0.04 0.20 0.08 0.35 0.15
Aluminum All Other Containers 1.05 0.46 0.25 0.11 0.05 0.02
Other Non-Ferrous Scrap 0.70 0.31 1.15 0.49 0.40 0.17
Ferrous Food & Beverage
Containers 5.05 2.22 1.45 0.62 1.35 0.57
Other Ferrous Scrap 3.85 1.69 5.25 2.23 0.25 0.11
Glass 4.44 3.29 1.52
Clear 5.85 2.57 5.45 2.31 3.20 1.35
Green 3.75 1.65 0.00 0.00 0.00 0.00
Blue 0.00 0.00 0.00 0.00 0.00 0.00
Brown 0.50 0.22 2.30 0.98 0.40 0.17
Yard Waste 9.05 3.98 22.85 9.70 62.05 26.25
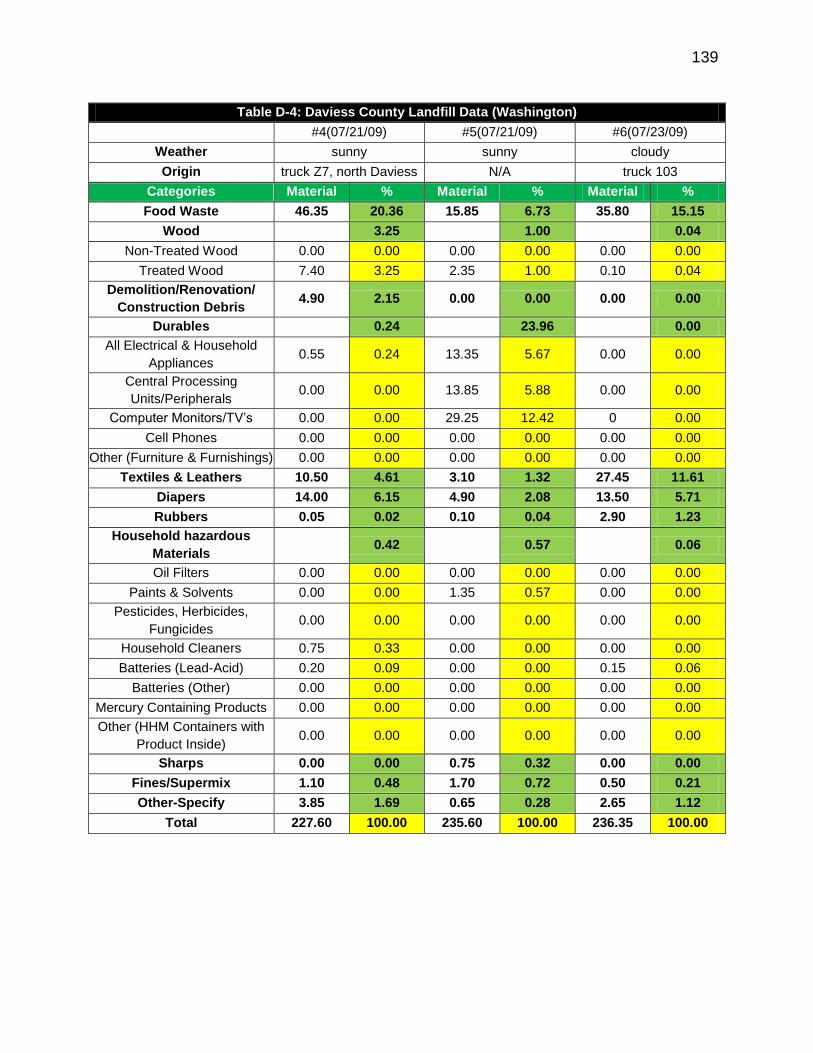
139
Table D-4: Daviess County Landfill Data (Washington)
#4(07/21/09) #5(07/21/09) #6(07/23/09)
Weather sunny sunny cloudy
Origin truck Z7, north Daviess N/A truck 103
Categories Material % Material % Material %
Food Waste 46.35 20.36 15.85 6.73 35.80 15.15
Wood 3.25 1.00 0.04
Non-Treated Wood 0.00 0.00 0.00 0.00 0.00 0.00
Treated Wood 7.40 3.25 2.35 1.00 0.10 0.04
Demolition/Renovation/
Construction Debris 4.90 2.15 0.00 0.00 0.00 0.00
Durables 0.24 23.96 0.00
All Electrical & Household
Appliances 0.55 0.24 13.35 5.67 0.00 0.00
Central Processing
Units/Peripherals 0.00 0.00 13.85 5.88 0.00 0.00
Computer Monitors/TV’s 0.00 0.00 29.25 12.42 0 0.00
Cell Phones 0.00 0.00 0.00 0.00 0.00 0.00
Other (Furniture & Furnishings) 0.00 0.00 0.00 0.00 0.00 0.00
Textiles & Leathers 10.50 4.61 3.10 1.32 27.45 11.61
Diapers 14.00 6.15 4.90 2.08 13.50 5.71
Rubbers 0.05 0.02 0.10 0.04 2.90 1.23
Household hazardous
Materials 0.42 0.57 0.06
Oil Filters 0.00 0.00 0.00 0.00 0.00 0.00
Paints & Solvents 0.00 0.00 1.35 0.57 0.00 0.00
Pesticides, Herbicides,
Fungicides 0.00 0.00 0.00 0.00 0.00 0.00
Household Cleaners 0.75 0.33 0.00 0.00 0.00 0.00
Batteries (Lead-Acid) 0.20 0.09 0.00 0.00 0.15 0.06
Batteries (Other) 0.00 0.00 0.00 0.00 0.00 0.00
Mercury Containing Products 0.00 0.00 0.00 0.00 0.00 0.00
Other (HHM Containers with
Product Inside) 0.00 0.00 0.00 0.00 0.00 0.00
Sharps 0.00 0.00 0.75 0.32 0.00 0.00
Fines/Supermix 1.10 0.48 1.70 0.72 0.50 0.21
Other-Specify 3.85 1.69 0.65 0.28 2.65 1.12
Total 227.60 100.00 235.60 100.00 236.35 100.00

140
Table D-4: Daviess County Landfill Data (Washington)
#7(07/23/09) #8(07/24/09) #9(07/24/09)
Weather cloudy, partially sunny sunny, windy sunny, windy
Origin N/A N/A N/A
Categories Material % Material % Material %
Paper 30.64 30.45 21.65
OCC and Kraft bags 13.20 5.98 22.35 9.78 19.05 8.37
Newspaper 8.15 3.69 11.70 5.12 2.45 1.08
Magazines 7.20 3.26 1.65 0.72 6.50 2.85
High Grade/Office 16.70 7.57 10.90 4.77 6.85 3.01
Mixed Recyclable Paper
(including Books, Boxboard) 6.05 2.74 2.65 1.16 3.60 1.58
Compostable Paper 14.35 6.50 15.35 6.72 8.55 3.75
Other Non-recyclable,
Non-compostable Paper 1.95 0.88 5.00 2.19 2.30 1.01
Plastic 23.69 13.39 21.23
#1 PET Non-Deposit Beverage
Containers 3.45 1.56 0.05 0.02 0.80 0.35
#1 PET Deposit Beverage
Containers 5.25 2.38 2.25 0.98 5.90 2.59
#1 PET All Other Containers 3.15 1.43 2.55 1.12 2.85 1.25
#2 HDPE Containers 7.55 3.42 1.60 0.70 5.85 2.57
# 6 Styrofoam 2.90 1.31 1.70 0.74 2.65 1.16
All Other Numbered
Containers (#3,4,5,6,7) 2.50 1.13 1.70 0.74 7.40 3.25
Other Plastic – NOT
Numbered 13.40 6.07 6.60 2.89 7.40 3.25
Film/Wrap/Bags 14.05 6.37 14.15 6.19 15.50 6.81
Metal 5.05 8.88 12.69
Aluminum Non-Deposit
Beverage Containers 3.35 1.52 1.30 0.57 2.15 0.94
Aluminum Deposit Beverage
Containers 0.70 0.32 0.60 0.26 0.60 0.26
Aluminum All Other Containers 0.10 0.05 0.10 0.04 0.05 0.02
Other Non-Ferrous Scrap 1.55 0.70 8.95 3.92 1.05 0.46
Ferrous Food & Beverage
Containers 3.85 1.75 3.65 1.60 4.25 1.87
Other Ferrous Scrap 1.60 0.73 5.70 2.49 20.80 9.13
Glass 2.22 5.67 2.15
Clear 1.45 0.66 10.45 4.57 3.05 1.34
Green 0.20 0.09 0.80 0.35 0.00 0.00
Blue 0.00 0.00 0.00 0.00 0.00 0.00
Brown 3.25 1.47 1.70 0.74 1.85 0.81
Yard Waste 3.95 1.79 18.30 8.01 2.90 1.27

141
Table D-4: Daviess County Landfill Data (Washington)
#7(07/23/09) #8(07/24/09) #9(07/24/09)
Weather cloudy, partially sunny sunny, windy sunny, windy
Origin N/A N/A N/A
Categories Material % Material % Material %
Food Waste 32.95 14.94 21.50 9.41 19.30 8.48
Wood 2.11 1.58 0.31
Non-Treated Wood 0.00 0.00 0.00 0.00 0.00 0.00
Treated Wood 4.65 2.11 3.60 1.58 0.7 0.31
Demolition/Renovation/
Construction Debris 2.50 1.13 0.00 0.00 8.55 3.75
Durables 0.02 0.39 1.08
All Electrical & Household
Appliances 0.00 0.00 0.00 0.00 2.45 1.08
Central Processing
Units/Peripherals 0.00 0.00 0.90 0.39 0.00 0.00
Computer Monitors/TV’s 0.00 0.00 0 0.00 0.00 0.00
Cell Phones 0.05 0.02 0.00 0.00 0.00 0.00
Other (Furniture & Furnishings) 0.00 0.00 0.00 0.00 0.00 0.00
Textiles & Leathers 14.80 6.71 15.55 6.80 14.2 6.24
Diapers 8.65 3.92 15.20 6.65 41.4 18.18
Rubbers 1.05 0.48 10.95 4.79 0.10 0.04
Household hazardous
Materials 0.97 0.20 0.81
Oil Filters 1.60 0.73 0.00 0.00 0.00 0.00
Paints & Solvents 0.00 0.00 0 0.00 1.45 0.64
Pesticides, Herbicides,
Fungicides 0.00 0.00 0.00 0.00 0.00 0.00
Household Cleaners 0.55 0.25 0.00 0.00 0.00 0.00
Batteries (Lead-Acid) 0.00 0.00 0.00 0.00 0.00 0.00
Batteries (Other) 0.00 0.00 0.00 0.00 0.05 0.02
Mercury Containing Products 0.00 0.00 0.00 0.00 0.35 0.15
Other (HHM Containers with
Product Inside) 0.00 0.00 0.45 0.20 0.00 0.00
Sharps 0.00 0.00 0.10 0.04 0.25 0.11
Fines/Supermix 5.30 2.40 0.85 0.37 3.7 1.62
Other-Specify 8.65 3.92 7.70 3.37 0.85 0.37
Total 220.60 100.00 228.55 100.00 227.70 100.00

142
Table D-4: Daviess County Landfill Data (Washington)
#10(07/27/09) #11(07/27/09) #12(07/27/09)
Weather sunny, hot, sizzling partially sunny partially cloudy, hot
Origin truck 102 truck 105 truck V4
Categories Material % Material % Material %
Paper 30.50 32.75 23.84
OCC and Kraft bags 13.75 5.94 23.30 10.09 18.85 8.93
Newspaper 19.25 8.31 11.35 4.91 8.55 4.05
Magazines 12.50 5.40 7.65 3.31 2.50 1.18
High Grade/Office 6.90 2.98 9.75 4.22 4.95 2.35
Mixed Recyclable Paper
(including Books, Boxboard) 3.50 1.51 4.50 1.95 5.10 2.42
Compostable Paper 11.80 5.09 11.15 4.83 8.75 4.15
Other Non-recyclable,
Non-compostable Paper 2.95 1.27 7.95 3.44 1.60 0.76
Plastic 12.04 16.52 14.99
#1 PET Non-Deposit Beverage
Containers 1.35 0.58 1.05 0.45 5.00 2.37
#1 PET Deposit Beverage
Containers 1.40 0.60 1.80 0.78 3.40 1.61
#1 PET All Other Containers 1.80 0.78 1.40 0.61 2.75 1.30
#2 HDPE Containers 4.25 1.83 9.65 4.18 2.30 1.09
# 6 Styrofoam 2.20 0.95 2.40 1.04 1.30 0.62
All Other Numbered
Containers (#3,4,5,6,7) 1.65 0.71 3.00 1.30 2.75 1.30
Other Plastic – NOT
Numbered 5.75 2.48 7.10 3.07 3.73 1.77
Film/Wrap/Bags 9.50 4.10 11.75 5.09 10.40 4.93
Metal 3.56 3.16 3.72
Aluminum Non-Deposit
Beverage Containers 1.15 0.50 1.20 0.52 1.90 0.90
Aluminum Deposit Beverage
Containers 0.40 0.17 0.60 0.26 0.60 0.28
Aluminum All Other Containers 0.40 0.17 0.00 0.00 0.05 0.02
Other Non-Ferrous Scrap 0.70 0.30 0.50 0.22 0.55 0.26
Ferrous Food & Beverage
Containers 2.90 1.25 2.60 1.13 4.25 2.01
Other Ferrous Scrap 2.70 1.17 2.40 1.04 0.50 0.24
Glass 3.09 8.33 7.92
Clear 2.00 0.86 15.25 6.60 5.10 2.42
Green 0.80 0.35 0.45 0.19 0.00 0.00
Blue 0.00 0.00 0.00 0.00 0.00 0.00
Brown 4.35 1.88 3.55 1.54 11.60 5.50
Yard Waste 22.45 9.69 8.35 3.61 5.80 2.75

143
Table D-4: Daviess County Landfill Data (Washington)
#10(07/27/09) #11(07/27/09) #12(07/27/09)
Weather sunny, hot, sizzling partially sunny partially cloudy, hot
Origin truck 102 truck 105 truck V4
Categories Material % Material % Material %
Food Waste 33.40 14.42 48.95 21.19 30.95 14.67
Wood 0.99 0.19 0.24
Non-Treated Wood 1.95 0.84 0.40 0.17 0.15 0.07
Treated Wood 0.35 0.15 0.05 0.02 0.35 0.17
Demolition/Renovation/
Construction Debris 29.50 12.73 0.90 0.39 0.00 0.00
Durables 0.00 0.00 0.47
All Electrical & Household
Appliances 0.00 0.00 0.00 0.00 1.00 0.47
Central Processing
Units/Peripherals 0.00 0.00 0.00 0.00 0.00 0.00
Computer Monitors/TV’s 0.00 0.00 0.00 0.00 0.00 0.00
Cell Phones 0.00 0.00 0.00 0.00 0.00 0.00
Other (Furniture & Furnishings) 0.00 0.00 0.00 0.00 0.00 0.00
Textiles & Leathers 6.20 2.68 25 10.82 20.50 9.72
Diapers 12.50 5.40 0 0.00 44.20 20.95
Rubbers 0.25 0.11 0.00 0.00 0.00 0.00
Household hazardous
Materials 3.41 2.06 0.00
Oil Filters 0.00 0.00 0.00 0.00 0.00 0.00
Paints & Solvents 0.00 0.00 4.75 2.06 0.00 0.00
Pesticides, Herbicides,
Fungicides 7.90 3.41 0.00 0.00 0.00 0.00
Household Cleaners 0.00 0.00 0.00 0.00 0.00 0.00
Batteries (Lead-Acid) 0.00 0.00 0.00 0.00 0.00 0.00
Batteries (Other) 0.00 0.00 0.00 0.00 0.00 0.00
Mercury Containing Products 0.00 0.00 0.00 0.00 0.00 0.00
Other (HHM Containers with
Product Inside) 0.00 0.00 0.00 0.00 0.00 0.00
Sharps 0.05 0.02 0.00 0.00 0.00 0.00
Fines/Supermix 2.50 1.08 1.4 0.61 1.55 0.73
Other-Specify 0.65 0.28 0.85 0.37 0.00 0.00
Total 231.65 100.00 231.00 100.00 210.98 100.00

144
Table D-4: Daviess County Landfill Data (Washington)
#13(07/31/09) #14(07/31/09) #15(08/03/09)
Weather sunny, windy sunny sunny, hot
Origin N/A N/A N/A
Categories Material % Material % Material %
Paper 18.31 25.13 35.39
OCC and Kraft bags 24.80 12.25 18.95 8.89 39.00 16.63
Newspaper 1.70 0.84 4.78 2.24 6.85 2.92
Magazines 1.10 0.54 1.80 0.84 6.25 2.66
High Grade/Office 0.65 0.32 15.20 7.13 15.80 6.74
Mixed Recyclable Paper
(including Books, Boxboard) 2.45 1.21 3.65 1.71 3.90 1.66
Compostable Paper 5.65 2.79 6.65 3.12 9.00 3.84
Other Non-recyclable,
Non-compostable Paper 0.70 0.35 2.55 1.20 2.20 0.94
Plastic 13.33 11.96 15.80
#1 PET Non-Deposit Beverage
Containers 0.10 0.05 4.15 1.95 2.40 1.02
#1 PET Deposit Beverage
Containers 1.50 0.74 0.65 0.30 4.05 1.73
#1 PET All Other Containers 1.30 0.64 0.65 0.30 1.20 0.51
#2 HDPE Containers 9.05 4.47 4.30 2.02 3.65 1.56
# 6 Styrofoam 1.67 0.83 1.30 0.61 2.55 1.09
All Other Numbered
Containers (#3,4,5,6,7) 1.20 0.59 1.30 0.61 2.35 1.00
Other Plastic – NOT
Numbered 7.65 3.78 1.70 0.80 11.50 4.90
Film/Wrap/Bags 4.50 2.22 11.45 5.37 9.35 3.99
Metal 2.84 5.46 5.22
Aluminum Non-Deposit
Beverage Containers 0.65 0.32 0.30 0.14 1.55 0.66
Aluminum Deposit Beverage
Containers 0.30 0.15 0.70 0.33 0.25 0.11
Aluminum All Other Containers 0.00 0.00 0.00 0.00 1.25 0.53
Other Non-Ferrous Scrap 0.15 0.07 0.20 0.09 0.75 0.32
Ferrous Food & Beverage
Containers 0.60 0.30 5.15 2.42 3.05 1.30
Other Ferrous Scrap 4.05 2.00 5.30 2.49 5.40 2.30
Glass 4.22 7.48 4.26
Clear 6.15 3.04 13.00 6.10 5.15 2.20
Green 0.00 0.00 0.00 0.00 0.15 0.06
Blue 0.00 0.00 0.00 0.00 0.00 0.00
Brown 2.40 1.19 2.95 1.38 4.70 2.00
Yard Waste 26.30 13.00 7.35 3.45 2.25 0.96

145
Table D-4: Daviess County Landfill Data (Washington)
#13(07/31/09) #14(07/31/09) #15(08/03/09)
Weather sunny, windy sunny sunny, hot
Origin N/A N/A N/A
Categories Material % Material % Material %
Food Waste 13.15 6.50 20.35 9.55 38.05 16.22
Wood 0.84 3.38 7.33
Non-Treated Wood 0.00 0.00 0.15 0.07 0.00 0.00
Treated Wood 1.70 0.84 7.05 3.31 17.20 7.33
Demolition/Renovation/
Construction Debris 37.60 18.58 8.65 4.06 3.60 1.53
Durables 9.64 7.13 2.68
All Electrical & Household
Appliances 19.50 9.64 10.10 4.74 5.64 2.40
Central Processing
Units/Peripherals 0.00 0.00 5.10 2.39 0.00 0.00
Computer Monitors/TV’s 0.00 0.00 0.00 0.00 0.00 0.00
Cell Phones 0.00 0.00 0.00 0.00 0.00 0.00
Other (Furniture & Furnishings) 0.00 0.00 0.00 0.00 0.65 0.28
Textiles & Leathers 20.95 10.35 35.15 16.49 18.60 7.93
Diapers 2.60 1.28 7.96 3.73 1.60 0.68
Rubbers 0.00 0.00 0.00 0.00 0.10 0.04
Household hazardous
Materials 0.10 0.00 0.28
Oil Filters 0.00 0.00 0.00 0.00 0.00 0.00
Paints & Solvents 0.20 0.10 0.00 0.00 0.00 0.00
Pesticides, Herbicides,
Fungicides 0.00 0.00 0.00 0.00 0.00 0.00
Household Cleaners 0.00 0.00 0.00 0.00 0.00 0.00
Batteries (Lead-Acid) 0.00 0.00 0.00 0.00 0.00 0.00
Batteries (Other) 0.00 0.00 0.00 0.00 0.10 0.04
Mercury Containing Products 0.00 0.00 0.00 0.00 0.00 0.00
Other (HHM Containers with
Product Inside) 0.00 0.00 0.00 0.00 0.55 0.23
Sharps 0.00 0.00 0.00 0.00 0.00 0.00
Fines/Supermix 1.30 0.64 1.95 0.91 3.65 1.56
Other-Specify 0.75 0.37 2.7 1.27 0.25 0.11
Total 202.37 100.00 213.19 100.00 234.54 100.00

146
Table D-4: Daviess County Landfill Data (Washington)
#16(08/04/09) #17(08/04/09) #18(08/05/09)
Weather cloudy, humid cloudy, humid, hot sunny
Origin truck 102 truck 103 truck V4
Categories Material % Material % Material %
Paper 24.79 32.76 32.41
OCC and Kraft bags 14.95 6.57 38.50 15.18 17.35 7.63
Newspaper 4.95 2.18 12.10 4.77 9.80 4.31
Magazines 0.75 0.33 5.65 2.23 9.05 3.98
High Grade/Office 12.85 5.65 9.80 3.86 16.00 7.04
Mixed Recyclable Paper
(including Books, Boxboard) 4.95 2.18 3.00 1.18 3.60 1.58
Compostable Paper 16.90 7.43 10.15 4.00 11.60 5.10
Other Non-recyclable,
Non-compostable Paper 1.05 0.46 3.90 1.54 6.30 2.77
Plastic 15.71 12.14 21.48
#1 PET Non-Deposit Beverage
Containers 5.40 2.37 1.70 0.67 5.50 2.42
#1 PET Deposit Beverage
Containers 3.25 1.43 3.75 1.48 1.65 0.73
#1 PET All Other Containers 1.00 0.44 1.20 0.47 1.75 0.77
#2 HDPE Containers 2.20 0.97 5.60 2.21 6.30 2.77
# 6 Styrofoam 2.20 0.97 1.55 0.61 1.95 0.86
All Other Numbered
Containers (#3,4,5,6,7) 2.15 0.94 2.60 1.03 2.20 0.97
Other Plastic – NOT
Numbered 4.60 2.02 3.55 1.40 15.60 6.86
Film/Wrap/Bags 14.95 6.57 10.85 4.28 13.90 6.11
Metal 4.44 3.47 4.66
Aluminum Non-Deposit
Beverage Containers 0.80 0.35 3.00 1.18 1.00 0.44
Aluminum Deposit Beverage
Containers 0.35 0.15 1.15 0.45 0.20 0.09
Aluminum All Other Containers 0.25 0.11 0.55 0.22 0.60 0.26
Other Non-Ferrous Scrap 0.05 0.02 0.10 0.04 0.35 0.15
Ferrous Food & Beverage
Containers 2.40 1.05 1.20 0.47 3.60 1.58
Other Ferrous Scrap 6.25 2.75 2.80 1.10 4.85 2.13
Glass 3.82 7.12 4.38
Clear 4.00 1.76 10.25 4.04 3.75 1.65
Green 0.00 0.00 0.00 0.00 0.00 0.00
Blue 0.00 0.00 0.00 0.00 0.00 0.00
Brown 4.70 2.07 7.80 3.08 6.20 2.73
Yard Waste 4.70 2.07 12.45 4.91 12.90 5.67

147
Table D-4: Daviess County Landfill Data (Washington)
#16(08/04/09) #17(08/04/09) #18(08/05/09)
Weather cloudy, humid cloudy, humid, hot sunny
Origin truck 102 truck 103 truck V4
Categories Material % Material % Material %
Food Waste 49.50 21.75 47.35 18.67 48.69 21.41
Wood 3.56 0.16 0.24
Non-Treated Wood 0.35 0.15 0.00 0.00 0.00 0.00
Treated Wood 7.75 3.41 0.40 0.16 0.55 0.24
Demolition/Renovation/
Construction Debris 0.05 0.02 0.00 0.00 5.55 2.44
Durables 12.39 0.20 1.52
All Electrical & Household
Appliances 0.00 0.00 0.50 0.20 3.45 1.52
Central Processing
Units/Peripherals 28.20 12.39 0.00 0.00 0.00 0.00
Computer Monitors/TV’s 0.00 0.00 0.00 0.00 0.00 0.00
Cell Phones 0.00 0.00 0.00 0.00 0.00 0.00
Other (Furniture & Furnishings) 0.00 0.00 0.00 0.00 0.00 0.00
Textiles & Leathers 19.70 8.66 34.05 13.42 8.65 3.80
Diapers 0.40 0.18 15.20 5.99 0.30 0.13
Rubbers 0.40 0.18 0.10 0.04 0.00 0.00
Household hazardous
Materials 0.00 0.14 0.44
Oil Filters 0.00 0.00 0.00 0.00 0.00 0.00
Paints & Solvents 0.00 0.00 0.25 0.10 0.00 0.00
Pesticides, Herbicides,
Fungicides 0.00 0.00 0.00 0.00 0.00 0.00
Household Cleaners 0.00 0.00 0.00 0.00 0.45 0.20
Batteries (Lead-Acid) 0.00 0.00 0.00 0.00 0.55 0.24
Batteries (Other) 0.00 0.00 0.10 0.04 0.00 0.00
Mercury Containing Products 0.00 0.00 0.00 0.00 0.00 0.00
Other (HHM Containers with
Product Inside) 0.00 0.00 0.00 0.00 0.00 0.00
Sharps 0.10 0.04 0.20 0.08 0.00 0.00
Fines/Supermix 5.05 2.22 1.45 0.57 1.55 0.68
Other-Specify 0.40 0.18 0.85 0.34 1.65 0.73
Total 227.55 100.00 253.65 100.00 227.39 100.00

148
Table D-4: Daviess County Landfill Data (Washington)
#19(08/05/09) #20(08/05/09)
Weather cloudy, humid cloudy
Origin truck 107 N/A
Categories Material % Material %
Paper 40.42 35.85
OCC and Kraft bags 54.30 22.60 30.68 14.49
Newspaper 2.75 1.14 7.10 3.35
Magazines 7.05 2.93 4.55 2.15
High Grade/Office 13.85 5.77 11.46 5.41
Mixed Recyclable Paper
(including Books, Boxboard) 6.55 2.73 4.20 1.98
Compostable Paper 7.90 3.29 13.98 6.60
Other Non-recyclable,
Non-compostable Paper 4.70 1.96 3.92 1.85
Plastic 14.94 16.07
#1 PET Non-Deposit Beverage
Containers 1.60 0.67 1.95 0.92
#1 PET Deposit Beverage
Containers 1.70 0.71 2.08 0.98
#1 PET All Other Containers 0.80 0.33 1.60 0.76
#2 HDPE Containers 3.30 1.37 5.52 2.61
# 6 Styrofoam 1.85 0.77 1.82 0.86
All Other Numbered Containers
(#3,4,5,6,7) 0.85 0.35 1.67 0.79
Other Plastic – NOT Numbered 15.10 6.29 10.60 5.01
Film/Wrap/Bags 10.70 4.45 8.78 4.15
Metal 10.51 5.47
Aluminum Non-Deposit
Beverage Containers 0.60 0.25 0.48 0.23
Aluminum Deposit Beverage
Containers 0.45 0.19 0.78 0.37
Aluminum All Other Containers 0.30 0.12 0.10 0.05
Other Non-Ferrous Scrap 1.45 0.60 3.15 1.49
Ferrous Food & Beverage
Containers 2.30 0.96 3.22 1.52
Other Ferrous Scrap 20.15 8.39 3.85 1.82
Glass 1.19 7.47
Clear 2.85 1.19 6.83 3.23
Green 0.00 0.00 0.78 0.37
Blue 0.00 0.00 0.00 0.00
Brown 0.00 0.00 8.20 3.87
Yard Waste 3.95 1.64 16.53 7.81
Food Waste 20.99 8.74 14.50 6.85

149
Table D-4: Daviess County Landfill Data (Washington)
#19(08/05/09) #20(08/05/09)
Weather cloudy, humid cloudy
Origin truck 107 N/A
Categories Material % Material %
Wood 7.45 0.96
Non-Treated Wood 0.10 0.04 0.00 0.00
Treated Wood 17.80 7.41 2.03 0.96
Demolition/Renovation/
Construction Debris 0.35 0.15 2.50 1.18
Durables 0.96 0.00
All Electrical & Household
Appliances 2.30 0.96 0.00 0.00
Central Processing
Units/Peripherals 0.00 0.00 0.00 0.00
Computer Monitors/TV’s 0.00 0.00 0.00 0.00
Cell Phones 0.00 0.00 0.00 0.00
Other (Furniture & Furnishings) 0.00 0.00 0.00 0.00
Textiles & Leathers 16.10 6.70 21.13 9.98
Diapers 1.85 0.77 11.08 5.23
Rubbers 0.15 0.06 1.98 0.94
Household hazardous
Materials 4.29 0.00
Oil Filters 0.00 0.00 0.00 0.00
Paints & Solvents 0.00 0.00 0.00 0.00
Pesticides, Herbicides,
Fungicides 0.00 0.00 0.00 0.00
Household Cleaners 0.00 0.00 0.00 0.00
Batteries (Lead-Acid) 0.00 0.00 0.00 0.00
Batteries (Other) 0.00 0.00 0.00 0.00
Mercury Containing Products 0.00 0.00 0.00 0.00
Other (HHM Containers with
Product Inside) 10.30 4.29 0.00 0.00
Sharps 0.00 0.00 0.00 0.00
Fines/Supermix 1.35 0.56 3.9 1.84
Other-Specify 3.90 1.62 0.75 0.35
Total 240.24 100.00 211.70 100.00

150
Table D-4: Daviess County Landfill Data (Washington)
By Total Weight of
Samples By Ave % Confidence Interval
Total Value of 20
Samples
Average value of 20
samples
Lower
Bound
Upper
Bound
Categories Material % Material % Material %
Paper 1338.47 29.40 66.92 29.29 27.08 31.51
OCC and Kraft bags 478.38 10.51 23.92 10.48 8.33 12.64
Newspaper 170.13 3.74 8.51 3.71 2.94 4.48
Magazines 95.30 2.09 4.77 2.07 1.48 2.67
High Grade/Office 212.91 4.68 10.65 4.66 3.93 5.39
Mixed Recyclable Paper
(including Books, Boxboard) 79.55 1.75 3.98 1.75 1.53 1.97
Compostable Paper 245.93 5.40 12.30 5.39 4.51 6.26
Other Non-recyclable,
Non-compostable Paper 56.27 1.24 2.81 1.23 0.90 1.56
Plastic 748.28 16.43 37.41 16.45 15.06 17.84
#1 PET Non-Deposit Beverage
Containers 53.71 1.18 2.69 1.19 0.86 1.51
#1 PET Deposit Beverage
Containers 52.43 1.15 2.62 1.15 0.92 1.38
#1 PET All Other Containers 32.15 0.71 1.61 0.71 0.56 0.86
#2 HDPE Containers 98.47 2.16 4.92 2.18 1.76 2.61
# 6 Styrofoam 39.44 0.87 1.97 0.87 0.76 0.97
All Other Numbered Containers
(#3,4,5,6,7) 44.07 0.97 2.20 0.97 0.74 1.20
Other Plastic – NOT Numbered 188.68 4.14 9.43 4.14 3.34 4.95
Film/Wrap/Bags 239.33 5.26 11.97 5.24 4.73 5.75
Metal 239.18 5.25 11.96 5.24 4.18 6.30
Aluminum Non-Deposit Beverage
Containers 28.58 0.63 1.43 0.62 0.45 0.80
Aluminum Deposit Beverage
Containers 13.48 0.30 0.67 0.29 0.20 0.38
Aluminum All Other Containers 5.45 0.12 0.27 0.12 0.06 0.18
Other Non-Ferrous Scrap 22.55 0.50 1.13 0.50 0.16 0.84
Ferrous Food & Beverage
Containers 65.67 1.44 3.28 1.45 1.18 1.72
Other Ferrous Scrap 103.45 2.27 5.17 2.26 1.34 3.17
Glass 217.11 4.77 10.86 4.79 3.91 5.67
Clear 124.23 2.73 6.21 2.74 2.09 3.38
Green 10.83 0.24 0.54 0.24 0.07 0.41
Blue 0.00 0.00 0.00 0.00 0.00 0.00
Brown 82.05 1.80 4.10 1.82 1.31 2.33
Yard Waste 278.53 6.12 13.93 6.10 3.76 8.44
Food Waste 634.38 13.93 31.72 13.84 11.85 15.83

151
Table D-4: Daviess County Landfill Data (Washington)
By Total Weight of
Samples By Ave % Confidence Interval
Total Value of 20
Samples
Average value of 20
samples
Lower
Bound
Upper
Bound
Categories Material % Material % Material %
Wood 97.23 2.14 4.86 2.11 1.24 2.98
Non-Treated Wood 5.15 0.11 0.26 0.11 0.01 0.21
Treated Wood 92.08 2.02 4.60 2.00 1.13 2.87
Demolition/Renovation/
Construction Debris 105.75 2.32 5.29 2.43 0.58 4.28
Durables 142.04 3.12 7.10 3.15 0.82 5.47
All Electrical & Household
Appliances 63.84 1.40 3.19 1.45 0.49 2.42
Central Processing
Units/Peripherals 48.05 1.06 2.40 1.05 0.00 2.22
Computer Monitors/TV’s 29.25 0.64 1.46 0.62 0.00 1.69
Cell Phones 0.25 0.01 0.01 0.01 0.00 0.01
Other (Furniture & Furnishings) 0.65 0.01 0.03 0.01 0.00 0.04
Textiles & Leathers 356.13 7.82 17.81 7.86 6.37 9.35
Diapers 249.24 5.47 12.46 5.52 3.37 7.67
Rubbers 18.23 0.40 0.91 0.40 0.00 0.82
Household hazardous Materials 39.10 0.86 1.96 0.84 0.37 1.30
Oil Filters 1.60 0.04 0.08 0.04 0.00 0.10
Paints & Solvents 14.40 0.32 0.72 0.31 0.07 0.55
Pesticides, Herbicides, Fungicides 7.90 0.17 0.40 0.17 0.00 0.47
Household Cleaners 1.75 0.04 0.09 0.04 0.00 0.08
Batteries (Lead-Acid) 0.90 0.02 0.05 0.02 0.00 0.04
Batteries (Other) 0.90 0.02 0.05 0.02 0.01 0.03
Mercury Containing Products 0.35 0.01 0.02 0.01 0.00 0.02
Other (HHM Containers with
Product Inside) 11.30 0.25 0.57 0.24 0.00 0.61
Sharps 1.55 0.03 0.08 0.03 0.00 0.06
Fines/Supermix 43.45 0.95 2.17 0.96 0.71 1.21
Other-Specify 44.65 0.98 2.23 0.98 0.58 1.39
Total 4553.32 100.00 227.67 100.00 100.00 100.00

152
Appendix E. Description of Calculation and Statistical Procedures
Data from facility tonnage reports and the sorting of waste samples was analyzed to
yield estimates of percentages and tonnages of material types in Indiana’s MSW
stream. This section describes the methodology used to obtain each estimate and its
associated confidence interval (error range).
Estimating the Composition Based on Sampling
For a giving site, the composition estimates represent the ratio of the components’
weight to the total waste for each participating facility. They were derived by summing
each component’s weight across all of the selected records and dividing by the sum of
the total weight of waste, as shown in the following equation:
Where:
c = weight of particular component
w = sum of all component weights
for i = 1 to n, where n = number of selected samples
for j = 1 to m, where m = number of components
The confidence interval for this estimate was derived in two steps. First, the variance
around the estimate was calculated, accounting for the fact that the ratio included two
random variables (the component and total sample weights). The variance of the ratio
estimator equation follows:
Where,

153
Second, precision levels at the 90 percent confidence level were calculated for a
component’s mean as follows:
Where z = the value of the z-statistic (1.645) corresponding to a 90 percent confidence
level.