munich personal repec archive - uni-muenchen.de · munich personal repec archive ... van der rhee...
TRANSCRIPT

MPRAMunich Personal RePEc Archive
Best-worst scaling approach to predictcustomer choice for 3PL services
Tim Coltman and Timothy M. Devinney and Byron W.
Keating
2010
Online at https://mpra.ub.uni-muenchen.de/40492/MPRA Paper No. 40492, posted 5. August 2012 00:08 UTC

i
Cover Page
BEST-WORST SCALING APPROACH TO PREDICT CUSTOMER
CHOICE FOR 3PL SERVICES
Tim Coltman1
University of Wollongong
Timothy M. Devinney
University of Technology Sydney
Byron Keating
University of Canberra
1 Corresponding author. Tim Coltman, University of Wollongong, Northfields Ave, Wollongong,
NSW 2522, Australia. +61 2 42 21 3912 (phone) +61 2 42 21 4170 (fax) [email protected]
1
INTRODUCTION
In the business logistics literature value is commonly viewed from the supply side, as
something created by the providers of products and services in the supply chain. Each firm makes its
own unique contribution to value—combining and modifying raw materials—and, in turn, strives to
capture a proportional share of end user payments. Yet, according to Drucker (1974) value is never an
absolute associated with a product or service, it is always customer utility; that is, value is what the
product or service allows a customer to do. Although Drucker’s point is widely accepted, companies
struggle to determine what customers truly value and to convert these demands across their own
functional boundaries to appropriate value (Flint, Larsson, and Gammelgaard 2008; Gattorna 2006;
Priem 2007).
The purpose of this paper is to illustrate recent advances in the science of discrete choice
elicitation that can be easily applied to enable a deeper understanding of what customers value. Recent
work in marketing and transportation demonstrates that market-utility-based frameworks, especially
discrete choice analysis (hereinafter, DCA) and conjoint analysis, can be very effective in
understanding what customers value ( Iqbal et al. 2003; Swait 2001; Swait and Ben-Akiva 1987).
Lenk and Bacon (2008 p.1) succinctly explain the benefits of DCA:
Discrete choice elicitation is often preferred to other measurement methods because it
better aligns with actual choice behaviour and avoids some of the well documented biases
inherent to alternative methods, such as ratings.
Moreover, to differentiate this paper from prior work and to explicate a more easily applied
method we apply a reduced form of DCA known as maximum difference scaling or best-worst
analysis (Marley and Louviere 2005). Best-worst offers design, execution and analysis advantages
over the more traditional DCA techniques without any substantive loss in analytical rigor. The surveys

2
are simple to construct, trouble-free to administer and do not require sophisticated software packages
for analysis (Buckley, Devinney, and Louviere 2007).
In order to demonstrate the value of best-worst analysis we measure the demand components
for third party logistics providers. Third party logistics (hereinafter, 3PL) is a burgeoning business-
services industry that can be defined as a dyadic relationship where all or part of a firm’s delivery
service is contracted to an independent service provider. Services provided by 3PLs are diverse and
may include outsourced freight forwarding, order management, packaging, warehousing, distribution,
transport, logistics information systems and supply chain management (Knemeyer and Murphy 2004;
Murphy and Poist 2000; Sink and Langley 1997; Vaidyanathan 2005).
The sample used in this study is representative of customer demand for market leading 3PL
brands such as DHL, FedEx and UPS. Traditionally these firms have sought to offer tangible product
features—such as overnight or 2nd
day delivery, the choice of air or ground reliability, and comparative
costs (Sawhney, Balasubramanian and Krishnan 2004; da Silveira 2005). True to the spirit of Drucker
(1974), the key issues for 3PL providers today are not products but benefits. These benefits include,
helping customers to achieve reliability levels high enough to create inventory cost savings, or to
provide complete visibility and transparency throughout all aspects of the supply chain to meet rising
expectations for customer service (DHL 2004). The increased focus on service benefits implies that a
deeper investigation of customer value is required to enhance our understanding of the factors that
influence customer demand in the logistics industry.
Furthermore, it is widely accepted that the logistics service attributes that any one firm
considers most and least important to their choice of a provider can vary for several reasons. For
example, customers may face quite different strategic and operational circumstances that directly
influence whether logistics is critical or not. Additionally, even firms in similar strategic and
operational circumstances can still vary because of preference heterogeneity amongst decision makers.

3
Hence, we require segmentation approaches that can better capture the heterogeneity that actually
exists between firms. Consistent with the discussion above we propose three research questions that
provide the focus for this paper:
1. What demand components (attributes) do customers prefer from a 3PL provider?
2. How do these demand components (attributes) stand relative to one another?
3. To what extent are these demand components (attribute) preferences segment specific?
All three questions are of practical and theoretical importance and the remaining sections of
this paper are organised as follows. The next section develops the theoretical background as it applies
to our understanding of customer value creation and segmentation in a third party logistics context.
Next, we describe the methodology that is based on a two-phase data estimation approach: (1) best-
worst scaling, and (2) latent class segmentation. Lastly, we discuss the results and the implications of
this work to academics and practitioners.
THEORTETICAL BACKGROUND
The cornerstone of competitive strategy is to create customer value and the business logistics literature
has devoted considerable attention to the investigation of value in 3PL services. To illustrate the point
Marasco (2008) identified 152 articles published between 1989 and 2006 in an ambitious attempt to
review the field. Within this literature a small number of studies have investigated the 3PL selection
process directly (McGinnis, Kochunny, and Ackerman 1995; Daugherty, Stank and Rogers 1996;
Stank and Maltz 1996; Sink and Langley 1997; Menon, McGinnis and Ackerman 1998; Murphy and
Poist 2000; Knemeyer and Murphy 2005; Vaidyanathan 2005). Notwithstanding the important
contributions in this work, the unit of analysis employed was based on managerial perceptions of
importance. This represents a critical limitation because as Verma and Pullman (1998) demonstrate
the perceived importance held by managers is not necessarily consistent with their actual choices.

4
These scholars found strong inconsistencies between perceived and actual choices on a range of 3PL
performance attributes such as cost, quality, delivery and flexibility.
Scholars in business logistics have also used a variety of methods in an attempt to accurately
measure supplier selection processes. For example, work has focused on single attribute ranking
methods (Blenstock, Mentzer, and Bird 1997) and two attribute comparisons (Christopher and Peck
2003; Mantel, Tatikonda, and Liao 2006). Others have used preference elicitation approaches such as
analytical hierarchy process (Danielis. Marcucci and Rotaris 2005; Göl and Catay 2007) or videotaped
focus groups can be used to graphically describe differences in desired values, benefits and attributes
(Mentzer, Rutner, and Matsuno 1997). These methods are all limited because customers do not trade-
off service features in isolation during the 3PL selection process but weigh up a number of attributes in
complex multidimensional ways.
Ratings-based conjoint analysis provides a more sophisticated approach where respondents rate
their preference for different product profiles. This method has been used to estimate individual level
attribute partworths that reflect the actual tradeoffs associated with supplier selection (Verma and
Pullman 1998; Li et al. 2006). Others have sought to understand the trade-offs in the selection process
using choice elicitation methods (Tsai, Wen and Chen 2007; van der Rhee, Verma and Plaschka 2009).
Although both approaches are considered useful additions to the operations research (Karniouchina,
Moore, van der Rhee and Verma 2009), the biggest difference is that conjoint analysis is essentially a
theory of numbers where judgment (i.e., preference ratings) are measured. Alternatively, choice-based
models are based on a theory of behaviour (i.e., random utility theory) where respondents make choice
from a series of sets of alternative product or service profiles.
The purpose of this paper is to respond to the call by Karmarkar (1996) for alternative models,
methods and techniques in operations research that borrow from disciplines such as marketing.
Specifically, the best-worst analysis technique proposed represents a choice elicitation method that has
5
not previously been applied to the logistics literature but has been applied in marketing (Lee, Soutar,
and Louviere 2007) and international business (Buckley et al. 2007) to investigate supplier selection
processes.
Third-party logistics selection process
Traditionally, 3PL providers have offered customers three primary competitive benefits—reduced cost,
faster delivery and improved reliability (Silveira 2005; Sink and Langley 1997; Voss et al. 2006). But
research in this area using a wide variety of methods and techniques has shown that the selection of a
logistics provider is based on a wider range and greater number of factors, including relational and
organizational factors, as well as operational factors. One difficulty is the very large number of
different attributes that have been suggested by different authors. This reflects the richness of the
bundle of services that a 3PL provider offers as well as the usual difficulties of precisely defining the
nature of quality dimensions in a service environment. For example, Sarkis and Talluri (2002) list 31
potential factors and Stank et al. (2001) list 38 items in their factor analysis. Christopher and Peck
(2005) suggest that customer value involves a much smaller trade off that is usually based on three or
four key success factors or what they call “market winners”.
In broad terms, the business logistics literature has identified cost factors (which will
potentially be wider than simply an initial price); logistics performance (encompassing delivery speed,
reliability etc); technology (primarily IT related capabilities); relational attributes (e.g. understanding
the customer, and fit between cultures); flexibility (being able to respond to changes in requirements);
as well as a range of other factors that do not fit easily into these categories such as reputation, ability
to innovate, trust, customer closeness and managerial involvement (Bowersox 1990; Droge, and Stank
2001; McGinnis et al. 1995; Morash 2001; Stank, Keller, and Closs 2001; Treacy and Wiersema 1995;
Vaidyanathan 2005).

6
Accepted wisdom also recognises that firms can benefit from understanding the segments that
drive value in their markets. Accordingly, the advantages of segmenting markets and offering different
service packages to different customer groups are widely recognised. However, in practice, it can be
difficult to identify meaningful segments and integrate the requirements of these customer groups into
operations strategy (Fisher 1997; Lilien 2007; Olhager and Selldin 2004). Yet concerns about how
best to link segmentation and supply chain strategy do not imply that the reasoning is flawed.
We know that different companies operate with different supply chains and, therefore, are by
definition heterogeneous. We also know that the popularity of segmentation with practitioners
suggests that there must be some perceived value. Rather, the mixed findings most likely reflect that:
(1) the prior emphasis on product-based segmentation techniques in isolation is misplaced (e.g., Fisher,
1997), and (2) the specific segmentation techniques used may not have been appropriate for the task at
hand. With regard to (1), an argument has been made that the focus on “products” needs to be
replaced by a focus on “customer behavior” (Dibb and Wensley 2002). This is the point Gattorna
(2006) also makes in suggesting that it is possible to develop an appropriate supply chain strategy by
developing a more sophisticated understanding of the underlying “behavioral logics” that interact and
are traded off in the final selection decision. With regard to (2), the question is what methods are
sufficiently rigorous to discover true heterogeneity? We address both these issues in this paper.
RESEARCH METHODOLOGY
An effective method for evaluating customer demand for various service features (such as those
offered by different 3PL providers) is to model the trade-off that customers are willing to make. In
this study we draw on a reduced form of DCA, known as maximum difference scaling or best-worst
analysis (see Appendix A for a detailed description of the method) to measure the attribute trade-off in
a manner that is consistent with the motivations for decisions surrounding 3PLs.
Best-worst scaling method of estimation

7
Best–worst scaling is based on a multiple-choice extension of the paired comparison approach that is
scale free. In other words, the method requires respondents to make a discriminating choice among
alternatives that reflect the cost of real market decisions. The formal statistical and measurement
properties for best-worst scaling analysis can be found in Marley and Louviere (2005).
The method is based on an ordering task that requires respondents to make a selection from a
group of items by choosing the “best” (most preferred) and “worst” (least preferred) items in a series
of blocks that contain three or more items. The items could be attributes of a product, options in a
decision, or bundles of services and products. Best-worst estimation assumes that there is some
underlying subjective dimension, such as “degree of importance”, “extent of preference”, “degree of
concern”, etc., and that the researcher wishes to measure the location or position of some set of objects
or items on that dimension.
The approach is particularly effective in creating a numerical ordering for the item preferences
when the number of items is large; as individuals are better able to determine which two items from a
group N of items are “best” and “worst” than they are at the specific ordering of 1, 2, 3, …, N. Best-
worst scaling has the added benefit that it is quick and simple to execute, provides results that are
empirically consistent with more complex ordering tasks and is theoretically in line with the precepts
of random utility theory (McFadden 1974).
One of the important properties of best-worst scaling is that it measures all of the attributes on
a common scale (Auger et al. 2007). Marley and Louviere (2005) demonstrate that subtracting the
number of times an item is selected “worst” from the number of times an item is selected “best” is a
close approximation of the true scale values obtained from Multinomial Logit Analysis (for a more
detailed elaboration see Auger et al. 2007). Additionally, the method addresses the scalar
inequivalence problem that characterises the way people use rating scales (Cohen and Neira 2003).
Scalar inequivalence arises primarily from differences in response styles, and is defined as “tendencies

8
to respond systematically to questionnaire items on some basis other than what the items were
specifically designed to measure” (Paulhus 1991). Unlike traditional ranking tasks (Christopher and
Peck 2003) or multi-point Likert scales (Swafford, Ghosh, and Murthy 2006) that have been used
previously in service operations research, every respondent works with a scale that has known
measurement properties.
Best-worst scaling has some distinct advantages over alternative preference elicitation
approaches such as self-explication methods and analytic hierarchical processing (AHP). Traditional
self-explication methods (Srinivasan, 1988) do not require respondents to make direct comparative
evaluations (trade-offs), and the data is collected using rating scales that are subject to the scalar
inequivalence issue discussed previously. The AHP approach (Saaty, 1980) extends the self-
explication method by introducing pairwise comparisons between attributes. However, as the number
of decision attributes becomes large, the number of possible paired comparisons increases
significantly. More specifically, there are J×(J−1)/2 possible pairs, where J is the number of attributes.
Thus, for an evaluation with 21 attributes―as conducted in this study―each respondent would be
required to complete 210 possible paired comparisons. Best-worst scaling overcomes the ratings scale
issue through the use of a choice-based evaluations, which Elrod et al. (1992) demonstrate has at least
equivalent predictive properties as the rating scale approach in measuring preferences but without the
biases. To reduce the number of comparisons we use a fixed orthogonal design to create partial
profiles. The individual level frequency data is then aggregated to elicit preference rankings for each
attribute. Capturing information on the “best” (most preferred) and “worst” (least preferred) options in
a given choice task also reduces problems associated with sparse data and the reliance on more
complicated estimation techniques such as hierarchical Bayesian methods (Pinnell and Fridley, 2001).
Latent class method of estimation
Research has shown that customers with relatively similar observable characteristics often behave in
very different ways (Wedel and DeSarbo 1995). Neglecting this unobserved heterogeneity can lead to

9
weak relationships between explanatory attributes and result in a biased assessment of customer
demand. In response, a variety of latent class techniques have been developed and applied to generate
more accurate cluster or segment solutions (Bensmail, Celeux, and Raftery 1993; Vermunt and
Magidson 2002). These models are particularly useful in estimating the likelihood that a specific firm
(or individual) fits into a class of firms (or individuals) for which a particular model applies.
More specifically, with latent class modeling we are able to derive a maximum likelihood-
based statistical model that accounts simultaneously for both the similarity and differences between
firms. It allows us to: (1) classify subtypes of related cases based on unobserved (latent)
heterogeneity, (2) estimate posterior probabilities that a specific firm falls into a class for which the
model is statistically appropriate, and (3) include exogenous variables to enable simultaneous segment
classification and description. The advantage of using this model-based approach is well documented
(see Wedel and Kamakura 2000 for a general explanation) and provides a more elegant interpretation
of the cluster or segment criterion that is less arbitrary and statistically more appropriate.
OPERATIONAL MEASURES, SAMPLE AND SURVEY CONSTRUCTION
Operational measures
A detailed pre-testing procedure was employed to capture the full range of attributes (demand
components) that are potentially important in the selection of a 3PL service provider. The range of
attributes selected were sourced from extensive rounds of qualitative work that included reviewing the
academic literature (Bowersox, Closs, and Stank 1999; Mentzer et al. 1999; Morash 2001; Tsai et al.
2007) industry reports and websites, along with insight gained from numerous discussions with
experienced academics, customers and practitioners. More than 40 interviews were conducted with
senior managers in the Asia-Pacific region (Australia, China, Japan, Korea, and Singapore), to assist
with attribute selection and definitions. The selection process was based on a stratified sample drawn
from the client revenue list of a 3PL provider―all customers interviewed were involved in the 3PL

10
selection process for their firm. Additionally, an extensive series of interviews were held with Vice
President level executives from a market leading 3PL provider to validate the attribute selection
process.
This preliminary analysis identified 21 attributes in five general categories that reflect the
common themes in the literature and were potentially relevant to the current evaluation and selection
of a 3PL provider. Operational definitions were developed to capture the domain for each of the 21
attributes to ensure that each responding decision-maker understood the meaning of these attributes in
exactly the same way. The specific definitions of these attributes are given in Table 1.
--- Insert Table 1 here ---
Experiment construction and procedures
The experiment required each individual to examine 21 sets of five attributes and indicate which issue
of the five they considered “the feature that matters most to you” or “the feature that matters least to
you” when selecting a logistics and transportation service provider. As noted earlier, rating scale bias
is avoided using this approach because there is only one way to choose something as most (or least)
important (Cohen and Neira 2003). Additionally, the decoy-enriched nature of the choice set design
mitigates the attraction effect problem of choosing between two equally desirable (or undesirable)
attributes (Hedgcock and Rao 2009). The 21 sets of five attributes were constructed using a 2K
fractional factorial design, which ensured that each attribute is orthogonal and appears an equal
number of times (Burgess and Street 2003; Street and Burgess 2004). Also, the experimental design
principles used to construct the best-worst instrument allow us to obtain more data from each
respondent, which in turn, increases the effective sample size allowing us to obtain reliable estimates
of demand preferences with smaller sample sizes. This feature of discrete choice methods is based on
assumptions regarding the independence of individual choices and the distribution and variance of
measurement errors (see Louviere et al., (2000) for a more detailed explanation). This enables

11
extraction of utility estimates for each attribute without needing every respondent to consider every
possible pairwise combination of attributes.
Because each of the 21 attributes appeared a total of five times in the experiment, individual-
level scales for each attribute can only range from +5 to –5. If a respondent chose an attribute as most
important (best) four times and least important (worst) once, then the resulting best-worst score would
be +3. This also highlights how our approach is scale equivalent. For any respondent, +5 is the
maximum—achieved when an item is “best” in all appearances—and –5 is the minimum—achieved
when an item is “worst” in all appearances. These scales are invariant to the decision maker’s
response style and only vary with actual choices. An example of the first choice task is provided in
Figure 1 (the other 20 sets are not presented due to space limitations). In addition to the experimental
best-worst task, respondents were also asked questions about the characteristics of their firms and
open-ended descriptions of the process by which they choose a 3PL. Key findings related to these
questions are presented in Table 2.
--- Insert Figure 1 here ---
Sample
Ninety-six 3PL customers completed either an online or paper based version of the questionnaire,
yielding a 38 percent response rate. The distribution of respondents covers most of the main segments
of business activity: wholesale trade (23%), retail trade (16%), transportation and storage (15%),
business services (13%), communication services (6%), manufacturing (8%), finance and insurance
(8%), mining (6%), government administration and defence (5%). Firm size was also well distributed,
with 46 percent small-to-medium sized firms (200 employees or less) and 54 percent large firms (more
than 200 employees). The mean and median sizes for the entire sample were 20,417 and 250
employees respectively. The results indicate that our sample is slightly skewed towards larger firms.
A review of the sample also indicates the majority of these firms are subsidiaries of multinational

12
companies and typically require multi-modal 3PL solutions comprising air, ocean, land transportation,
inventory management and order fulfilment services.
ANALYSIS AND RESULTS
A variety of statistical tests were conducted based on a two-step approach that included a: (1) a
detailed assessment of the ranked (best-worst) order for all 21 attributes, and (2) latent class
segmentation analysis based on the top ten attributes only. The reduced set of attributes included in
the segmentation analysis was intended to improve interpretation and reduce the confounding effects
of non-significant attributes.
Analysis of the best-worst scores
We first calculated a best-worst frequency score for each of the 21 attributes according to the number
of times the attribute was selected by respondents. The simple rank ordering process creates
individual-level scales for each attribute that are easily comparable across the entire sample (see Table
2). The “best” column illustrates the frequency that the particular attribute will be ranked “best” or
matters “most” to respondents from the attribute group. For example, the top-scoring attribute was
reliable performance (selected 333 times), followed by delivery speed (selected 211 times), through to
surcharge option (selected only 12 times).
--- Insert Table 2 here ---
The “worst” column shows the frequency with which respondents selected an attribute as the
“least” important feature. This column is read in the opposite way to the “best” column—the attribute
selected the least number of times as “least important”, was reliable performance (selected only
twice). It is worth noting that the attributes in this column appear to be almost perfect reciprocals of
the “best” column, implying consistency in the decisions (or selection of features as “most” or “least”
important) made by the respondents.

13
Second, to determine the attribute rank ordering we calculated a “maximum difference” scale
that is simply the difference between the “best” and “worst” columns (Marley and Louviere 2005).
This provides a rank position for each attribute. To develop a ratio scale of “best” we calculated the
square root (SQRT) of the “Best/Worst” based on the mathematical proofs that SQRT
[f(b)/f(w)]=f(b)/√k, where k is a constant, provided by Marley and Louviere (2005). To support
interpretation, Figure 2 plots the SQRT of the “best/worst” ratio as a graphical representation.
--- Insert Figure 2 here ---
The interpretation of Figure 2 requires some discussion because the scores are on a relative
scale. This means that reliable performance (3.82) is four times more important than relationship
orientation (0.93) and twelve times more important than surcharge option (0.33). Likewise, global
network (1.04) is twice as important as top management team presence (0.47), billing service (0.54)
and management reporting (0.53). Furthermore, the graphical representation clearly indicates a
logarithmic line of best fit. The implication here is that as the tail of the curve flattens out our ability
to determine meaningful differences disappear. For example, the range of scores among the last 11
attributes differs by only 0.6 indicating that respondents are more or less indifferent about these
attributes.
Latent class segmentation results
The ratio scale measures of relative importance enable us to identify the top ten attributes for inclusion
in the segmentation analysis. Focusing on this narrower set of the top attributes rather than the entire
set of 21 attributes allows us to differentiate demand based on the most economically important items
rather than simply items where differences might exist independent of the strength of their importance
to the final choice. For example, in terms of cumulative impact, the top ten attributes account for 75%
of the variation with the other 25% distributed across the remaining 11 attributes. By focusing on a
more parsimonious set of important attributes, we are able to remove noise from the solution, which in

14
turn, reduces the number of resulting segments and increases the practical interpretability of the
findings.
The first step used to formally identify the number of classes or segments was based on the
information criteria. Information criteria scores are derived by assessing the degree of improvement in
explanatory power adjusted by the degrees of freedom. The most common information criteria are the
Akaike information criterion (AIC) and the Bayesian information criterion (BIC). The consistent
Akaike information criterion (CAIC) and Akaike information criterion 3 (AIC3) provide more
conservative estimates of fit because they take into account parsimony by adjusting the log likelihood
goodness-of-fit values to account for the number of parameters in the model. The results shown in
Table 3 can be interpreted as the lower the value, the better the model fit. In this regard, the “low
value” is a relative measure of the information criterion in one model vis-à-vis the other models, where
the lower the value, generally speaking, the more attractive the model. As there are numerous
information criterion that can be evaluated, and all provide some specific limitation on the underlying
log likelihood scores, the goal is to identify the model with improvement across the greatest number of
criteria (Coltman et al. 2007).
--- Insert Table 3 here ---
The second step was to examine the classification statistics for the preferred model. These
scores were examined to ensure that the model had an acceptable and comparatively low ratio of
classification errors. Lastly, the estimates for each segment in the preferred model were plotted against
one another to ensure that the segment solution represented actual differences rather than systematic
variance.
Based on this three-step procedure, a two-segment solution was identified that best describes
the data modeled here. A likelihood ratio test also demonstrated that this model provided a statistically
significant improvement over the null model (-2LL=109.114, p<0.001). Table 4 presents specific

15
information on how the various attributes contributed to the two segments in the preferred model; and
consequently, how this model differed to the null model. In particular, Table 4 presents two statistics
of interest, mean best-worst scores and Wald statistics. The mean best-worst scores are based on the
segment level conditional probabilities for each attribute and provide a general indication of
importance. The Wald statistics reported are a measure of the extent to which the segment level means
for each attribute differ from the grand means of the attribute across both segments.
--- Insert Table 4 here ---
Segment one includes those companies that place emphasis on attributes associated mainly
with operational criteria: reliable performance (3.57), delivery speed (2.57), track and trace (1.96) and
customer service recovery (1.60). The segment two model best represents those companies that place
more emphasis on strategic criteria (Morash 2001): reliable performance (3.29), supply chain
flexibility (2.05), professionalism (1.90), proactive innovation (1.51), and relationship orientation
(0.53). With the exception of reliable performance, the Wald statistics confirm that the segment level
means for each attribute differ significantly between the segment solutions.
In the case of reliable performance the high mean scores indicate that it is an important
attribute in both segments. However, the lack of variance within this attribute inhibits its value as a
discriminator between the segments. This implies that in terms of its impact on 3PL selection, reliable
performance could be considered as an order qualifier—a necessary requirement to get a start at the
bidding table. In other words, reliable performance reflects a common strategic priority attached to
this attribute by all firms.
One of the most interesting aspects of the best-worst based segment solution is that it shows
quite clearly which attributes respondents are willing to abandon earliest. Hence, the segments can not
only be described based on the issues that customers favor, but also by the ones they are willing to
abandon should they be forced to make a trade-off. For example, respondents in segment one clearly

16
favored reliable performance, delivery speed and service handling support but were most likely to
abandon customer relationship orientation and proactive innovation. Similarly, respondents in
segment two favored supply chain flexibility but were most willing to abandon track and trace, and
service recovery when a choice had to be made. One possible reason for this is that customers in
segment two have no desire to spend time and effort working through a track and trace system; rather,
they expect the parcel will arrive as scheduled and, if there is a delay, then it is the 3PL’s role to notify
them.
Figure 3 provides a graphical representation of the differences and similarities between the two
segments. The class-specific means presented in Table 4 were re-scaled to lie within the 0–1 range.
Scaling of these “0–1 means” was accomplished by subtracting the lowest observed value from the
class-specific means and then dividing the results by the range, which is simply the difference between
the highest and the lowest observed value. The figure serves two primary purposes. First, it
demonstrates clearly that the two segments are conceptually different, satisfying the previously
introduced requirement that the segments not be the result of systematic variance. Second, the figure
provides for simple comparison of the relative attractiveness of each attribute for the two segments.
---Insert Figure 3 here---
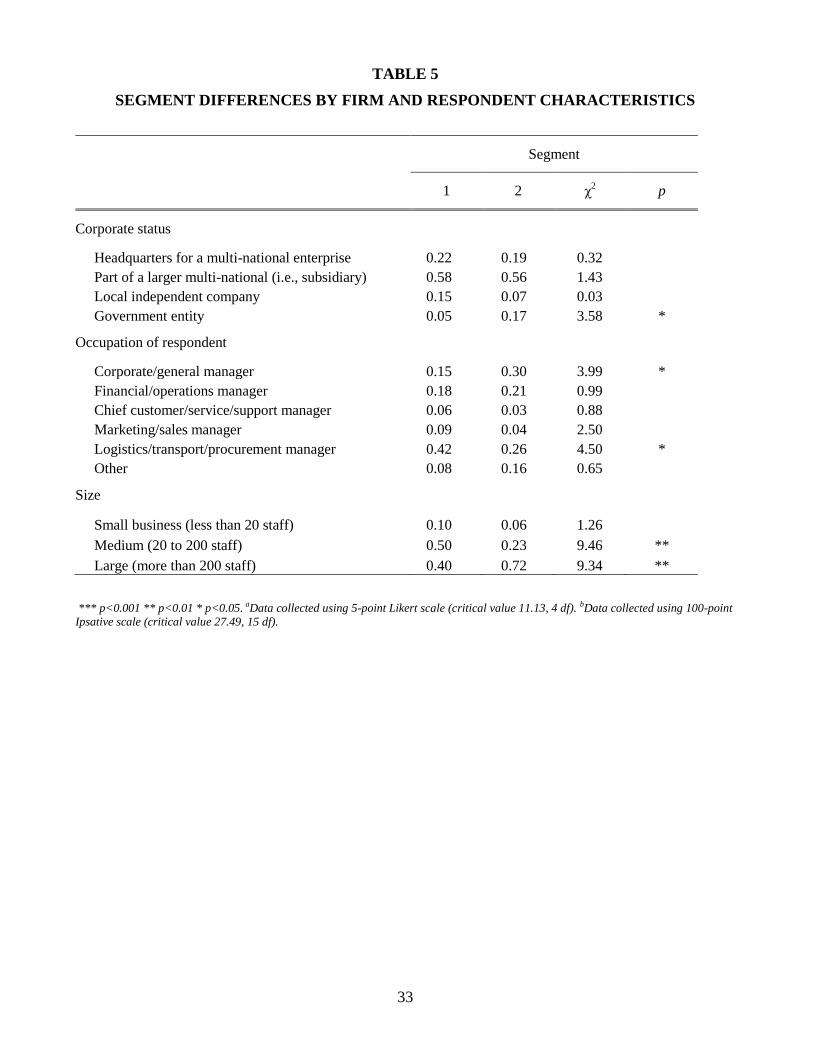
Several covariates were introduced into the segmentation analysis to assist in characterising the
domain of each of the segments. Covariates represent the differences between the segment classes
where the covariate differences are not estimated simultaneously with the parameters in the model.
They are post hoc descriptors of the segments and not a priori predictors of segment membership. The
descriptive statistics considered include: (1) corporate status of the business unit; (2) locus of decision
making control; (3) occupation of the respondent; (4) size of the company; and (5) type of exchange
relationship preferred. Only corporate status, occupation and size accounted for significant differences
across segments (see Table 5). The most interesting differences are between the different respondent

17
occupations and firm size where the table shows the percentage of respondents that make up each
segment. For example, segment one has a high composition of logisticians (42%) while segment two
is comprised mostly of C-level executives (30%). Conceptually, this result makes sense; logisticians
prefer operational excellence while C-level executives prefer more strategic service-based attributes.
However, this result was not reflected in the data on strategic orientation towards 3PLs; which
provides support for our claims regarding the unreliable nature of rating-scale based data. Likewise,
we see that 50 percent of firms in segment 1 are classified as medium (with 20 to 200 employees) and
75 percent of firms in segment 2 are classified as large (more than 200 employees). This suggests that
the larger firms see strategic benefits in service-based attributes. Likewise, we see that customers in
segment 2 were also more inclined to value collaboration over customers in segment 1. However, we
need to exercise caution when interpreting these results due to the susceptibility of the Chi-square test
to small sample sizes.
---Insert Table 5 here---
Finally, to demonstrate external validity, the two segments were evaluated against variables
other than those used to generate the solution (Punj and Stewart 1983). Using the two-segment
solution as the dependent variable, a discriminant analysis was conducted using two additional
variables chosen to reflect the domain of the two segments. The first function was based on a
preference for “dependable delivery”, which is closely aligned with the domain of segment one. The
function correctly identified 81 percent of the cases within segment one. The second function was
based on a preference for “customer responsiveness”, which is closely aligned to the domain of
segment two. The function correctly identified 57 percent of the cases within segment two. These
results provide some external validity to the segment solution and suggest that the two-segment
solution is a useful guide to further our understanding of customer demand.
DISCUSSION

18
This study has explored new ground in proposing a method to identify the structural factors that
contribute to genuine demand for a 3PL provider. The contribution is not only theoretically important
but of immense practical relevance to 3PL providers desiring to better understand their customers, to
3PL customers wishing to better appreciate how they are positioned relative to their peers, and to
industry stakeholders such as 4PLs who seek to develop service solutions to support both customers
and providers. As shown by a Georgia Institute of Technology report, 76-79 percent of firms in
Western Europe and 83 percent of firms in Asia-Pacific rely on 3PL providers (Langley, Dort, and
Ross 2005), facts highlighting the economic importance of efficient express logistic services on in
modern business.
Implications for research
Academically, the reduced form of DCA used in this study is theoretically sound. The efficacy of
results reported is confirmed by the almost perfect reciprocity reported between the best and worst
scores. Further, a growing body of research suggests that binary (“yes-no” or “best-worst” or “least-
most”) responses are reliable estimates of customer demand (Auger et al. 2007). It is cognitively
straightforward for respondents to indicate that “I prefer A” or “I do not like B” and “I think A is the
most important attribute, and B is the least important attribute in the set of (A B C D E).”
Furthermore, the approach is scale free and avoids problems that commonly arise in traditional
research where respondents are required to rate attributes according to a set scale (e.g., 1-5 or 1-7).
The problem with traditional rank order and Likert scale methods is that the scores can mean different
things to different respondents (Kampen and Swyngedouw 2000). Additionally, respondents often
suffer from biases such as “yea-saying”, “nay-saying” and “middle of the road.” The best-worst
scaling procedure used in this study forces the respondent to make a choice that provides data that is
scale free and less susceptible to respondent biases.

19
The study also sheds new light on the relative importance of the various customer needs or
what Theodore Levitt (1960) defines as the “augmented” product. This timeless contribution has
forced managers to think more broadly and attribute variation in business success to unique
combinations of tangible and intangible features. In segment one; the augmented product is based
heavily on operational efficiency. Transactional efficiency is front of mind and any attempt to convert
customers towards a more collaborative world would not only be unnecessary but create a negative
effect. Alternatively, there are equal numbers of customers in segment two, where a relational
approach is dominant. These customers display a preference for an inclusive arrangement that values
information flows, professionalism and long-term relationships. This finding is particularly interesting
in the light of the work of Stank and colleagues (Stank et al. 1999, 2003) who have extensively
examined the importance of operational and relational capabilities to firm performance. While our
research finds general support for the existence of two distinct demand structures impacting on choice
of provider, our research extends this earlier work in two important ways. First, we examine the
interaction between operational and relational capabilities, something that Zhao and Stank 2003
acknowledge has been lacking in prior studies on supplier selection. Second, in focusing on the service
delivery components that support the development and delivery operational and relational capabilities,
we also respond to a call by Stank and colleagues for research that provides different
operationalizations of the constructs. We believe that our research presents the first attempt at moving
from a reflective measurement model to a formative measurement model (Coltman et al 2008).
The two-segment solution seen arising from our data is important when one considers that
scholarly work on the structural characteristics of 3PL has emphasised a relationship marketing
perspective. Such an approach links relational attributes of 3PL arrangements to firm outcomes (e.g.,
Marasco 2008; Stank et al. 2001) and relies on operations management and optimisation models to
maximise this connection. For example, separate demand structures imply that models based on
assumptions of unitary demand or a “pooling equilibrium”—one in which all customers are treated the

20
same—must be viewed cautiously, both for theoretical and practical reasons. Normatively, a more
efficient approach would be to take into account the two types of demand reported in this study or to
consider characterizing heterogeneous customer demand using methods presented here in the first
instance. Based on our data, a natural “separating equilibrium” should arise as the attributes that
segment one demands differ significantly from those demanded by segment two. The implication is
that providers who meet the two demands more specifically will get higher sales simply because
customers will gravitate to the 3PL provider that fits best with what they want.
Implications for practice
From a practitioner standpoint the strategic challenge for 3PL service providers is that they must not
just determine what their customers want but must also be able to translate the implications of these
demands across their own functional boundaries to maximise customer value. This study directly
assists practitioners by providing the rationale for management decisions about strategic, operational
and tactical responses. This is important given that research in business settings indicates customers
are not motivated strictly by the attributes of the products/services their suppliers provide (Knemeyer
and Murphy 2005).
Our results also provide a justification for the reverse engineering of 3PL business processes to
bring them more in line with the requirements of the market. Operationally, this is valuable to the
manager who may be bombarded by long lists of attributes that they believe create customer value
without any effective guide as to the relative value (or validity) of this ordering (Anderson and Narus
1998). Indeed, one of the most important contributions in this paper is that it addresses the issue of
priority and where best to invest resources and capability development. Any scan of the popular press
quickly indicates that the top few attributes identified in this paper are widely understood and well
developed by the leading companies in the 3PL market. However, the nature of competitive advantage
implies that one needs capabilities that are not enjoyed by key competitors (Anderson, Narus, and
Rossum 2006). The present study directs attention towards those capabilities that have traditionally

21
been less black and white (e.g., service recovery, flexibility, professionalism, and innovation), but
nevertheless may be the key to success or failure.
Lastly, from a profit maximisation standpoint most optimisation models focus on the impact of
demand pooling on expected profits (Eppen 1979; Kim, Yang, and Kim 2008). The justification for
this is based on: (1) economies of scale, and (2) reduced demand fluctuations whenever sufficient firm
size exists. As noted earlier, our results imply that a natural separating equilibrium is possible should a
company choose to accommodate the differing demands. At the level of the individual service
provider, this does not mean that the decision to treat customer segments differently means that one
needs to give up scale advantages obtained by aggregating customer demand. It is well understood in
the operations management literature that firms comprise multiple supply chains and, therefore, one
can organise different parts of the supply chain in different ways (Rabinovich and Bailey 2004).
Limitations and future work
In common with all research, this paper has several limitations that confine the generalizability of our
results. First, the range of attributes examined was restricted to a set of 21 only. Dickson (2006) has
suggested that additional attributes influence the vendor selection process and future research may
benefit by investigating attributes not considered in this study. Additionally, our use of “parity price”
was deliberately designed to minimise the impact of price. The reasoning was based on a common
agreement in the literature regarding the high correlation between price and customer demand. What
is interesting about this study is that it reveals the 11 attributes that are preferable to price when price
matches (or is very close to) that of the competition.
Second, segmentation models are, at best, workable approximations of reality and one should
be mindful of their limitations. One cannot claim with complete certainty that segments exist or that
the distribution of unobserved heterogeneity can be captured (i.e., that it is discrete rather than
continuous). Like any segmentation or clustering technique, the appropriateness of latent class models

22
is determined first by theory and second by the ability to find meaningful and significant differences in
the population at hand. Further research is required to examine the extent that these results can be
replicated and the extent to which a strategy based on such segmentation was superior to one based on
a singular model of customer demand.
Thirdly, our study suffers from sample based limitations related to the use of the client list of a
single 3PL provider, and that are associated with all cross-sectional survey-based research. As such,
caution needs to be exercised when attempting to generalize beyond the present sample. Although
prior research demonstrates that 3PL customers tend to utilize multiple providers (Langley et al. 2005),
the use of convenience sampling could have introduced systematic error that would influence the
results. In this regard, the generalizability of the two-segment solution would be improved by sampling
randomly from the population of customers that utilize second- and third-tier 3PL providers. Further,
the generalizability of the findings would also benefit from a longitudinal examination of changes over
time, and from identifying a broader set of secondary data that could be used to describe the resulting
segments. Although the attributes used in this study are specific to tier one 3PL providers, we suggest
that future research should expand the range and number of covariates to assist with interpretation and
generalization to the broader 3PL population.
Lastly, our study assumes that all respondents are willing to purchase services from a 3PL
provider. In other words, we did not provide an opt-out option to capture unconditional demand where
a respondent may desire to stay with some status quo and “not demand or require” the services of a
3PL provider. The next logical stage is to address demand as a function of actual choice of a 3PL; this
should also include the choice to opt-out of an option.
CONCLUSION
We started this study with a relatively simple objective. First, we sought to identify the attributes that
are most and least important to the customers of a 3PL service provider. Using a theoretically based

23
best-worst methodology we calculate the relative importance of 21 attributes on a common scale.
Second, we sought to identify the extent to which these attribute preferences are segment specific.
Latent class segmentation allowed us to capture the heterogeneity amongst 3PL customers and
generate a picture of preference structures for operational excellence and relationship orientations.
The normative implications are that firms can improve service value and develop stronger
relationships with customers when they align their service offerings with the right customer preference
segment.
ACKNOWLEDGMENTS
This research has been supported by a linkage program grant from the Australian Research Council (ARC),
DHL Asia-Pacific and the Institute for Business and Social Research (IIBSoR) at the University of Wollongong.
The views expressed here are solely those of the authors who have been listed alphabetically. The authors wish
to thank Professor Eddie Anderson, Dr John Gattorna and Stuart Whiting for their contribution to discussions
and the direction of the paper.
ABOUT THE AUTHORS
Tim R. Coltman (Ph.D in Strategic Management from the Australian Graduate School of Management) is
currently the Director, Centre for Business Services Science and Deputy Director, Institute for Innovation in
Business and Social Research at the University of Wollongong, Australia. He has published in journals such as
California Management Review, Journal of Information Technology, Journal of Business Research, Interfaces,
European Management Journal, Supply Chain Management and the Journal of the Academy of Marketing
Science.
Timothy M. Devinney (Ph.D in Economics from the University of Chicago) is Professor of Strategy at the
University of Technology, Sydney. His research interests are in the areas of international business, social
consumerism and corporate strategy. He has published more than 80 articles in leading international journals
such as Management Science, Journal of Business, Academy of Management Review, Journal of International
Business Studies, Strategic Management Journal, Journal of Marketing and Organisation Science.

24
Byron W. Keating (Ph.D in Service Management from the University of Newcastle) is Associate Professor of
Service Management at the University of Canberra. His research interests focus on service science and modeling
complex decisions in service supply chains. He has published in Proceedings of the IEEE, Journal of the
Academy of Marketing Science, Electronic Markets, Supply Chain Management: An International Journal and
Managing Service Quality.

25
FIGURE 1
EXAMPLE BEST-WORST TASK
Question
Number
Which feature matters
LEAST to you?
(Select ONLY ONE )
Sets of features for you to consider Which feature matters
MOST to you?
(Select ONLY ONE)
1 ○ Professionalism ○
○ Global Network ○
○ Management Reporting ○
○ Surcharge Option Contract ○
○ Top Management Team Availability ○

26
FIGURE 2
RATIO SCALE OF RELATIVE ATTRIBUTE IMPORTANCE
0
0.5
1
1.5
2
2.5
3
3.5
4
4.5
Reliable
per
form
ance
Del
iver
y sp
eed
Profe
ssio
nalism
Cus
tom
er se
rvic
e su
pport
Supply
cha
in fl
exib
ility
Track
& T
race
Cus
tom
er se
rvic
es re
cover
y
Supply
cha
in cap
acity
Proac
tive in
novatio
n
Glo
bal n
etwor
k
Relatio
nship
orie
ntatio
n
Parity
pric
e
Risk
man
agem
ent
Acc
ount
repre
sent
ativ
e pre
senc
e
Cul
ture
Bill
ing se
rvice
Man
agem
ent r
epor
ting
Top m
anag
emen
t tea
m avai
labili
ty
Qual
ity cer
tificatio
n
Bra
nd
Surcha
rge op
tion

27
FIGURE 3
DISTRIBUTION OF RESPONDENTS BY SEGMENT
0
0.1
0.2
0.3
0.4
0.5
0.6
0.7
0.8
Reliable
per
form
ance
Del
iver
y sp
eed
Cus
tom
er se
rvic
e su
pport
Track
& T
race
Cus
tom
er se
rvic
es re
cover
y
Supply
cha
in fl
exib
ility
Profe
ssio
nalism
Proac
tive in
novatio
n
Supply
cha
in cap
acity
Relatio
nship
orie
ntatio
n
Resc
ale
d M
ea
ns
(0-1
)
Segment 1
Segment 2

28
TABLE 1
3PL ATTRIBUTE DEFINITIONS
Attribute Definition Category
Account
Representative
Presence
A high presence account representative would call you,
make a presentation, or address your concerns many times
a month.
Account management
Billing Service Accuracy, flexibility and currency of billing service. Account management
Brand Reflects overall competence that the supplier will deliver.
In a supply chain context we can distinguish between a
market leader and a new player in the market.
External factors
Culture Includes the unwritten rules that guide appropriate “norms”
of behaviour. In other words, it is the “way we do things
around here” and can either be similar to your own
company or not.
External factors
Delivery Speed Amount of time from pickup to delivery. Performance
Global Network Whether a supplier is fully represented at a global level and
can reliably deliver to remote locations. Internal factors
Management
Reporting Report customizability, range and flexibility. Highly
customised reports can be delivered at a frequency
determined by the customer.
Account management
Parity Price This is what the customer pays for the service or product.
A parity price is one that matches (or is very close to) that
of the competition.
Customer charges
Proactive
Innovation Proactive activity aimed at providing new solutions to
improve the customers business and address any potential
problems and challenges.
Internal factors
Professionalism Employees exhibit sound knowledge of products and
services in the industry and display punctuality and
courtesy in the way they interact and present to the
customer.
Internal factors
Quality
Certification Such as ISO certification, TAPA (Technology Asset
Protection Association) and Corrective Action Process etc.
This certification would also cover associated third parties.
Internal factors
Relationship
Orientation Characterised by sharing of information and trust in the
exchange partner. Internal factors
Reliable
Performance Consistent “on time” delivery without loss or damage of
shipment. Performance

29
Risk Management This relates to the security of supply chain systems. It
could include, for example correct levels of insurance for
the company and third parties, capability to ensure
packages are as stated using x-ray equipment, or other
audit trail systems.
Internal factors
Service Handling &
Support Prompt and effective handling of customer requests and
questions. Internal factors
Service Recovery Prompt and empathetic recovery and resolution of errors or
problems concerning customers. Internal factors
Supply Chain
Capacity The ability to cope with significant changes in volumes
e.g., demand surges and deliver through multi-modal
transport services including: international express and
domestic, by air; ocean; and land.
Performance
Supply Chain
Flexibility Ability to meet unanticipated customer needs e.g., conduct
special pickups, seasonal warehousing.
Performance
Surcharge Option in
Contract The contract includes the right to add surcharges due to
unanticipated costs e.g., fuel, unusual fluctuations in levels
of currency exchange rate, security surcharges.
Customer charges
Track & Trace Transparency and “up to the minute” data about the
location of shipments end-to-end. Account management
Top Management
Team Availability The frequency and quality of involvement by the “top
management team” with your management team during the
exchange relationship.
Account management

30
TABLE 2
BEST-WORST RESULTS
Attribute Name “Best”
(freq)
“Worst”
(freq)
Best
(weighted)
Worst
(weighted)
Best−Worst SQRT
(Best/Worst
weighted)
Rank
Reliable
performance
333 2 5330 365 331 3.82 1
Delivery speed 211 17 3393 483 194 2.65 2
Professionalism 138 12 2220 330 126 2.59 3
Service support 151 24 2440 535 127 2.14 4
Supply chain
flexibility
162 33 2625 690 129 1.95 5
Track & Trace 143 36 2324 719 107 1.80 6
Service
recovery
97 32 1584 609 65 1.61 7
Supply chain
capacity
88 53 1461 936 35 1.25 8
Proactive
innovation
119 75 1979 1319 44 1.22 9
Relationship
orientation
73 66 1234 1129 7 1.04 10
Global network 80 95 1375 1600 −15 0.93 11
Parity price 77 114 1346 1901 −37 0.84 12
Risk
management
42 67 739 1114 −25 0.81 13
Account
representative
47 91 843 1503 −44 0.75 14
Culture 45 108 828 1773 −63 0.68 15
Billing service 33 138 666 2241 −105 0.54 16
Management
reporting
34 153 697 2482 −119 0.53 17
Top mgmt team
availability
30 183 663 2958 −153 0.47 18
Quality
certification
22 171 523 2758 −149 0.44 19
Brand 14 236 460 3790 −222 0.35 20
Surcharge
option
12 245 437 3932 −233 0.33 21

31
TABLE 3
MEASURES OF MODEL FIT AND PARSIMONY BY SEGMENT
Number of Segments
1 2 3 4
Log Likelihood –1790 –1740 –1728 –1713
AIC 3933 3881 3909 3928
BIC 3735 3656 3655 3646
AIC3 3812 3744 3754 3756
CAIC 4010 3969 4008 4038
Npar 77 88 99 110
Class Error 0.00 0.06 0.07 0.06
Bold items indicates best fit (i.e., minimum score).

32
TABLE 4
SEGMENT ATTRIBUTES BASED ON MEAN SCORES
Null Model
(n=96)
Segment 1
(n=50)
Segment 2
(n=46)
Wald
Statistic
Reliable performance 3.45 3.57 3.29 0.69
Delivery speed 2.02 2.57 1.31 7.75***
Service handling & support 1.32 2.00 0.45 13.37***
Track and trace 1.11 1.96 0.04 10.35***
Service recovery 0.68 1.60 –0.50 8.25***
Supply chain flexibility 1.34 0.79 2.05 6.82***
Professionalism 1.31 0.85 1.90 7.57***
Proactive innovation 0.46 –0.36 1.51 11.66***
Supply chain capacity 0.36 –0.19 1.07 7.94***
Relationship orientation –0.16 –0.69 0.53 5.75***
*** p<0.001 ** p<0.01 * p<0.05.
33
TABLE 5
SEGMENT DIFFERENCES BY FIRM AND RESPONDENT CHARACTERISTICS
Segment
1 2 χ2 p
Corporate status
Headquarters for a multi-national enterprise 0.22 0.19 0.32
Part of a larger multi-national (i.e., subsidiary) 0.58 0.56 1.43
Local independent company 0.15 0.07 0.03
Government entity 0.05 0.17 3.58 *
Occupation of respondent
Corporate/general manager 0.15 0.30 3.99 *
Financial/operations manager 0.18 0.21 0.99
Chief customer/service/support manager 0.06 0.03 0.88
Marketing/sales manager 0.09 0.04 2.50
Logistics/transport/procurement manager 0.42 0.26 4.50 *
Other 0.08 0.16 0.65
Size
Small business (less than 20 staff) 0.10 0.06 1.26
Medium (20 to 200 staff) 0.50 0.23 9.46 **
Large (more than 200 staff) 0.40 0.72 9.34 **
*** p<0.001 ** p<0.01 * p<0.05. aData collected using 5-point Likert scale (critical value 11.13, 4 df). bData collected using 100-point
Ipsative scale (critical value 27.49, 15 df).

34
APPENDIX A: Explication of the best-worst scaling method
Best–worst scaling (BWS) is a theory for how people make decisions about the “best” and “worst”
attributes from a group of three or more attributes. Based on Thurstone’s (1927) random utility theory
for paired comparison judgements, BWS is used to find the position of these attributes on some
underlying latent dimension such as degree of importance, degree of interest etc. The conditional logit
model is used to estimate the location of each attribute on the underlying latent dimension.
The probability that respondent i selects alternative m as “best” in subset j is given attribute values βij ,
choice set characteristics δij , and the scale factor sij. This probability is denoted by P(yij = m | βij , δij ,
sij). Within this model, attribute values are characteristics of the alternatives; that is, attribute m will
have different values to attribute m’. While choice set characteristics are common across all
respondents (i.e., balanced), scale factors on the other hand, allow the utilities to be scaled differently
for ‘best’ and ‘worst’ choices. The conditional logit model for the response probabilities associated
with the first-choice, or “best” only model, has the form:
P(yij) = exp(sij . ηij) / Σij exp(sij . ηij)
where ηij is the systematic component of the utility associated with attribute m for case i in subset j.
The term ηij is a linear function of the attribute effects βij and the predictor effects δij. The utility is
also affected by an error component εij , but this is assumed to be identically and independently
distributed according to some Type 1 random function for identification purposes.
35
REFERENCES
Anderson, James C. and James A. Narus (1998), "Business Marketing: Understand What Customers
Value," Harvard Business Review, Vol.76, No.11/12, pp. 53-65.
Anderson, James C., James A. Narus, and Wouter Van Rossum (2006), "Customer Value Propositions
in Business Markets," Harvard Business Review, Vol.84, No.3, pp. 91-99.
Bensmail, Halima, Gilles Celeux, and Adrian E. Raftery (1993), "Inference in Model Based
Clustering," Statistics and Computing, Vol.7, No.1, pp. 1-10.
Bowersox, Donald J. (1990), "The Strategic Benefits of Logistics Alliances," Harvard Business
Review, Vol.68, No.4, pp. 36-45.
Bowersox, Donald J., David J. Closs, and Theodore P. Stank (1999), 21st Century Logistics: Making
Supply Chain Integration a Reality. Oak Brook IL: Council of Logistics Management.
Buckley, Peter J., Timothy M. Devinney, and Jordan J. Louviere (2007), "Do Managers Behave the
Way Theory Suggests? A Choice Theoretic Examination of Foreign Direct Investment Location
Decision Making " Journal of International Business, Vol.38, No.7, pp. 1069-95.
Burgess, Leonne and Deborah J. Street (2003), "Optimal Designs for 2k Choice Experiments.
Communications in Statistics," Theory & Methods, Vol.32, No.11, pp. 2185.
Christopher, Martin and Helen Peck (2003), Marketing Logistics (Second Edition ed.). Burlington,
MA: Elsevier Butterworth-Heinemann.
Cohen, Steve and Leopoldo Neira (2003), "Measuring Preference For Product Benefits Across
Countries," in Sawtooth Software Conference 2003. San Antonio, TX.
Coltman, Tim, Timothy M. Devinney, and David F. Midgley (2007), "E-Business Strategy and Firm
Performance: A Latent Class Assessment," Journal of Information Technology, Vol.22, No.2, pp.
1-15.
Coltman, Tim., Timothy M. Devinney, David F. Midgley and Sunil Venaik (2008) “Formative or
Reflective Scales: Two Applications of Erroneous Measurement”, Journal of Business Research
Vol 61, No. 12, pp. 1250-1262.
Danielis, Romeo, Edoardo Marcucci, and Lucia Rotaris (2005), "Logistics Managers’ Stated
Preferences for Freight Service Attributes," Transportation Research Part E: Logistics and
Transportation Review, Vol.41, No.4, pp. 201-15.
DHL (2004), "The Next Wave in Global Logistics and Delivery," a DHL commissioned study.
Dibb, Sally and Robin Wensley (2002), "Segmentation Analysis in Industrial Markets: Problems of
Integrating Customer Requirements into Operations Strategy," European Journal of Marketing,
Vol.36, No.1/2, pp. 231-51.
Daugherty, Patricia J., Theodore P. Stank, and D.S.,Rogers (1996), "Third-party logistics service
providers: Purchasers’ perceptions,". The Journal of Supply Chain Management, Vol 32, No. 2,
pp. 23–29.
Drucker, Peter F. (1974), Management: Tasks, Responsibilities, Practices. New York, Harper and
Row...
Eppen, Gary D. (1979), "Effects of Centralization on Expected Costs in a Muli-location Newsboy
Problem," Management Science, Vol.25, No.5, pp. 498-501.
Fisher, Marshall L. (1997), "What is the Right Supply Chain for Your Product?," Harvard Business
Review, Vol.36, No.4, pp. 105-16.
Flint, Daniel J., Everth Larsson, and Britta Gammelgaard (2008), "Exploring Processes for Customer
Value Insights, Supply Chain Learning and Innovations: An International Study," Journal of
Business Logistics, Vol.29, No.1, pp. 257-78.
Gattorna, John (2006), Living Supply Chains. London, England: Prentice Hall.

36
Hedgcock, William and Akshay R. Rao (2009), "Trade-Off Aversion as an Explanation for the
Attraction Effect: A Functional Magnetic Resonance Imaging Study," Journal of Marketing
Research, Vol.46, No.2, pp. 1-13.
Iqbal, Zafar, Rohit Verma, and Roger Baran (2003), "Understanding Consumer Choices and
Preferences in Transaction-Based e-Services," Journal of Service Research, Vol.6, No.1, pp. 51-
65.
Kampen, Jarl and Marc Swyngedouw (2000), "The Ordinal Controversy Revisited," Quality &
Quantity, Vol.34, No.1, pp. 87−102.
Karmarkar, Uday S., 1996. Integrative research in marketing and operations management. Journal of
Marketing Research 33 (5), 125–133.
Kim, Changsu, Kyung Hoon Yang, and Jaekjung Kim (2008), "A Strategy for Third-Party Logistics
Systems: A Case Analysis Using the Blue Ocean Strategy," Omega, Vol.36, No. 5, pp. 522-34.
Knemeyer, Michael A and Paul R. Murphy (2005), "Is the Glass Half Full or Half Empty?,"
International Journal of Physical Distribution and Logistics Management, Vol.35, No.30, pp.
708-27.
Langley, C.J., E.V. Dort, and T. Ross (2005), 2005 Third Party Logistics: Results and Findings of the
10th Annual Study. Atlanta, GA: Georgia Institute of Technology.
Lee, Julie Anne, Geoffrey N Soutar, and Jordan Louviere (2007), " Measuring Values Using Best-
Worst Scaling: The LOV Example," Psychology & Marketing, Vol.24, No.12, pp. 1043.
Lenk, Peter J. and Lynd Bacon, (2008), "Estimating common utility origins and scales in discrete
choice conjoint with auxiliary data," Working paper, Ross School of Business, University of
Michigan, Ann Arbor.
Levitt, Theodore (1960), "Marketing Myopia," Harvard Business Review, Vol.82, No.7/8, pp. 138.
Lilien, Gary L (2007), "B-to-B Segmentation for Greater ROI with Cluster Analysis ME."
Pennsylvania, USA: Institute for the Study of Business Markets, The Pennsylvania State
University.
Louviere, Jordan J., David A. Hensher, and Joffre D. Swait (2000), Stated Choice Methods: Analysis
and Application. Cambridge: Cambridge University Press.
Mantel, Susan Powell, Mohan V. Tatikonda, and Ying Liao (2006), "A Behavioral Study of Supply
Manager Decision-Making: Factors Influencing Make versus Buy Evaluation," Journal of
Operations Management, Vol.24, No.6, pp. 822-38.
Marasco, Alessandra (2008), "Third-party Logistics: A Literature Review," International Journal of
Production Economics, Vol.113, No.1, pp. 127-47.
Marley, Adrian and Jordan Louviere (2005), "Some Probabilistic Models of Best, Worst, and Best-
Worst Choices," Journal of Mathematical Psychology, Vol.49, No.6, pp. 464-80.
McFadden, Daniel (1974), "Conditional Logit Analysis of Qualitative Choice Behavior," in Frontiers
in Econometrics, P Zarembka, Ed. New York: Academic Press.
McGinnis, Michael A. C.M. Kochunny, and Kenneth B. Ackerman (1995), "Third-party logistics
choice," The International Journal of Logistics Management, Vol 6, No. 2, pp. 93–102.
Menon, Mohan K. Michael A. McGinnis, and Kenneth B. Ackerman, (1998), "Selection criteria for
providers of third-party logistics services: An explanatory study," Journal of Business Logistics,
Vol 19, No. 1, pp. 121–137.
Mentzer, John T., Daniel J. Flint, and John L. Kent (1999), "Developing a Logistics Service Quality
Scale," Journal of Business Logistics, Vol.20, No.1, pp. 9-32.
Mentzer, John T., S.M. Rutner, and K. Matsuno (1997), "Application of the Means−End Value
Hierarchy Model to Understanding Logistics Service Value," International Journal of Physical
Distribution and Logistics Management, Vol.27, No.9/10, pp. 630−43.
Morash, Edward A (2001), "Supply Chain Strategies, Capabilities, and Performance," Transportation
Journal, Vol.41, No.1, pp. 37-53.

37
Olhager, Jan and Erik Seldin (2004), "Supply Chain Management Survey of Swedish Manufacturing
Firms," International Journal of Production Economics, Vol.89, No.4, pp. 353-61.
Paulhus, Delroy L (1991), "Measurement and Control of Response Bias," in Measures of Personality
and Social Psychological Attitudes, John P Robinson and Phillip R Shaver and Lawrence L
Wright, Eds. San Diego, California: Academic Press.
Priem, Richard L. (2007), "A Consumer Perspective on Value Creation," Academy of Management
Review, Vol.32, No.1, pp. 219-35.
Punj, Girish and David W. Stewart (1983), "Cluster Analysis in Marketing Research: Review and
Suggestions for Application," Journal of Marketing Research, Vol.20, No.2, pp. 134-49.
Rabinovich, Elliot and Joseph P. Bailey (2004), "Physical Distribution Service Quality in Internet
Retailing: Service Pricing, Transaction Attributes and Firm Attributes," Journal of Operations
Management, Vol.21, No.6, pp. 651-72.
Sawhney, Mohanbir, Sridghar Balasubramanian, and Vish V. Krishnan (2004), "Creating Growth With
Services," MIT Sloan Management Review, Vol.45, No.2, pp. 34-43.
da Silveira, Giovani J.C. (2005), "Market Priorities, Manufacturing Configuration, and Business
Performance: An Empirical Analysis of the Order-Winners Framework," Journal of Operations
Management, Vol 23, No. 6, pp. 662-675.
Sink, Harry L., and John C. Langley, (1997), A managerial framework for the acquisition of third-
party logistics services," Journal of Business Logistics, Vol 18, No. 2, pp. 163–189.
Stank, Theodore P, Thomas J. Goldsby, Shawnee K. Vickery, and Katrina Savitskie. (2003), "Logistics
Service Performance: Estimating its Influence on Market Share," Journal of Business Logistics,
Vol.24, No.1, pp. 17.
Stank, Theodore P., S.B. Keller, and D.J. Closs (2001), "Performance Benefits of Supply Chain
Logistical Integration," Transportation Journal, Vol.41, No.2/3, pp. 32-47.
Stank, Theodore P. and A.B. Maltz, (1996), "Some propositions on third-party choice: Domestic vs.
international logistics providers," Journal of Marketing Theory and Practice, Vol 4, No. 2, pp. 45–
54.
Street, D J and L Burgess (2004), "Optimal and Near-Optimal Pairs for the Estimation of Effects in 2-
level Choice Experiments," Journal of Statistical Planning and Inference, Vol.118, No.1/2, pp.
185-99.
Swafford, Patricia M., Soumen Ghosh, and Nagesh Murthy (2006), "The antecedents of supply chain
agility of a firm: Scale development and model testing.," Journal of Operations Management,
Vol.24, No.2, pp. 170-88.
Swait, Joffre and M. Ben-Akiva (1987), "Empirical Test of a Constrained Choice Discrete Model:
Mode Choice in São Paulo, Brazil," Transportation Research Part B Vol.21, No.2, pp. 103-15.
Swait, Joffrey (2001), "Choice Set Generation within the Generalized Extreme Value Family of
Discrete Choice Models," Transportation Research Part B, Vol.35, No.7, pp. 643-66.
Treacy, Michael and Fred Wiersema (1995), The Discipline of Market Leaders. Reading, MA:
Addison-Wesley Publishing Co.
Tsai, Ming-Chih, Chieh-Hua Wen, and Chiang-Shin Chen (2007), "Demand Choices of High-Tech
Industry for Logistics Service Providers " Industrial Marketing Management, Vol.36, No.5, pp.
617-26.
Vaidyanathan, Ganesh (2005), "A Framework for Evaluating Third Party Logistics," Communications
of the ACM, Vol.48, No.1, pp. 89-94.
Vermunt, Jeroen K. and Jay Magidson (2002), "Latent Class Cluster Analysis," in Advances in Latent
Class Analysis, J.A. Hagenaars and A.L. McCutcheon, Eds. Cambridge: University Press.
Wedel, Michel and Wayne S. DeSarbo (1995), "A Mixture Likelihood Approach for Generalized
Linear Models"," Journal of Classification, Vol.12, No.1, pp. 1-35.
Wedel, Michel and Wagner Kamakura (2000), Market Segmentation. London: Kluwer.

38
Zhao, Meng, Cornelia Droge, and Theodore P Stank (2001), "The Effects of Logistics Capabilities on
Firm Performance: Customer-Focused versus Information-Focused Capabilities," Journal of
Business Logistics, Vol.22, No.2, pp. 91-108.
REFERENCES TO OTHER WORKS
Keating, B., Kriz, A., Quazi, A. and Alpert, F. (2011). Examining the Mediating Role of Relationship
Quality in Online Services, Journal of Computer Information Systems, 52(2), 33-41.
Richard, P., Coltman, T. and Keating, B. (2012). Designing the IS Service Strategy: An Information
Acceleration Approach, European Journal of Information Systems, 21(2), 87-98.
Anderson, E., Coltman, T. Devinney, T. and Keating, B. (2011). Unpacking the Service Concept for
3PL, Journal of Supply Chain Management, 47(2), 97-115.
Keating, B., Coltman, T., Fosso Wamba, S. and Baker, V. (2010). The RFID Investment Decision:
What Matters Most and Least, Proceedings of the IEEE, 98(9), 1672-1680.
Kriz, A. and Keating, B. (2010). Doing Business in China: Tips for an Outsider (Lǎo Wài), China
Review International, 16(1), 1-28.
Kriz, A. and Keating, B. (2010). Business Relationships in China: Lessons about Deep Trust, Asia
Pacific Business Review, 16(3), 299-318.
Keating, B. (2010). Review of Stopwatch Marketing by Rosen and Turano, Journal of Consumer
Marketing, 27(2), 192-195.
Keating, B. (2010). Review of Distribution Channels by Dent, Journal of Product and Brand
Management, 19(4), 312-313.
Keating, B. and Coltman, T. (2009). Marketing and the Law: Defending Single Color Trademarks,
Journal of the Academy of Marketing Science, 37(3), 375-380.
Keating, B., Kriz, A., and Quazi, A. (2009). The Influence of Perceived Financial Risk on Service
Relationships in the Online Retail Setting, Electronic Markets, 19(4), 237-250.
Keating, B. (2009). Managing Ethics in the Tourism Supply Chain: The Case of Chinese Travel to
Australia, International Journal of Tourism Research, 11(4), 403-408.
Keating, B., Quazi, A., Kriz, A. and Coltman, T. (2008). In Pursuit of a Sustainable Supply Chain:
Insights from Westpac Banking Corporation, Supply Chain Management: An International
Journal, 13(3), 175-179.
Keating, B. and Kriz, A. (2008). Outbound Tourism in China: Literature Review and Research
Agenda, Journal of Hospitality and Tourism Management, 15(2), 32-41.
Rugimbana, R., Quazi, A. and Keating, B. (2008). Applying a Consumer Perceptual Measure of
Corporate Social Responsibility: A Regional Australian Perspective, Journal of Corporate
Citizenship, 29 (Spring), 61-74.
Rugimbana, R., Quazi, A. and Keating, B. (2007). The Impact of Discontentment on Quality of Life:
An Exploratory Study of a Small Australian Regional Community after Bank Closures, Journal of
Management and World Business Research, 4(1), 10-21.
Quazi, A. Rugimbana, R., Muthaly, S. and Keating, B. (2003). Corporate Social Action Patterns in
Contrasting Markets, Australasian Marketing Journal, 11(3), 28-42.
Keating, B., Rugimbana, R. and Quazi, A. (2003). Differentiating Between Service Quality and
Relationship Quality in Cyberspace, Managing Service Quality, 13(3), 217-232.