download (320kb) - munich personal repec archive
TRANSCRIPT

MPRAMunich Personal RePEc Archive
An Analysis of Remuneration,Employment & VRS at Executive levelin CPSEs
Kumar Singh Sunny
Department of Public Enterprises, Government of India, GokhaleInstitute of Politics and Economics
31. July 2009
Online at https://mpra.ub.uni-muenchen.de/28798/MPRA Paper No. 28798, posted 11. February 2011 18:24 UTC

1
GOVERNMENT OF INDIA
MINISTRY OF HEAVY INDUSTRY & PUBLIC ENTERPRISES DEPARTMENT OF PUBLIC ENTERPRISES
NEW DELHI
An Analysis of Remuneration, Employment & VRS at Executive level in CPSEs
Summer Project
Submitted By
SUNNY KUMAR SINGH
GOKHALE INSTITUTE OF POLITICS & ECONOMICS, PUNE

2
Acknowledgements
I express my gratitude to all those people with whom I worked during the course of this project in
Department of Public Enterprises (DPE).
I express my sincere thanks to Dr. Sharat Kumar,Economic Advisor, Department of Public
Enterprises, Mr. Rajendra Kumar, Director (Wage Division) , Department of Public Enterprises and
Mr. P.J. Michael, Under Secretary, Department of Public Enterprises for guiding me and providing
me valuable inputs during the course of this project. Their thoughts and insights in all the areas
pertaining to remuneration and employment in CPSEs have helped me clarify and refine my own
perception about the Public Sector Enterprises.
I would also like to thank Mr. U.K. Swami from National Information Centre, DPE for providing me
all the data and support regarding my project and Dr. Pramod Kumar from CRR Division for giving
invaluable advice on VRS.
I am grateful to all the members of the Wage Division of the Department of Public Enterprises for
their guidance and help.
I am thankful to Mrs. Jyoti Mathur, Under Secretary, Department of Public Enterprises for her
continuous support and encouragement.
I am also grateful to the other members in the office especially Mr. S.D. Singh (Lower Divisional
Clerk, DPE) and Mr. Lakhan Singh, Resource Person, DPE for providing a comfortable and
pleasant atmosphere at work.
Lastly, I am also thankful to all the officers of the Department of Public Enterprises for their
invaluable advice time to time.

3
Abstract
The Department of Public Enterprises (DPE) under the Ministry of Heavy Industries and Public
Enterprises is the nodal department in the Government of India to provide, Inter alia, an overview of
the financial and physical performance of the CPSEs. The CPSEs are those companies wherein
more than 50% equity is held by the Central Government.
The Wage Division of the DPE is responsible for the policy on wages and salaries for the
employees of the CPSEs.
This project attempts to discuss the remuneration, employment and VRS in the CPSEs especially at
the executive level. This has been discussed in details in different chapters.
In the first chapter, the theoretical aspect of the CPSE & their employment, remuneration and VRS
policy have been discussed.
In the second chapter, the remuneration policies for executives of the CPSEs have been discussed.
For this, the recommendations of the first and second Pay Revision Committee (basis of
determining remuneration for executives of the CPSEs) have been discussed along with some
suggestions for a better implementation.
In the third chapter, the employment trend including recruitment and retirement trend of the
executive have been analyzed both aggregate and sector wise. During the analysis, some
observations were made which have been discussed.
In the fourth chapter, an analysis has been done regarding VRS in the CPSEs at the executive
level. By using regression line, a relationship between the surplus manpower and VRS have been
found which have been also discussed in detail.
In the fifth chapter, the relationship between the remuneration policy of the CPSEs & the
employment and VRS trend have been analyzed by dividing the CPSEs into Navratnas and
Miniratnas & Non-Navratnas and Non-Miniratnas.

4
In the sixth chapter, the future impact of the implementation of 2007 pay revision on the
employment of the executives has been discussed especially in the context of the recent slowdown.
Finally the conclusion of the whole analysis has been summarized upon in the last chapter.

5
Contents
Acknowledgement
Abstract
List of Tables
1. Introduction 1
1.1. Central Public Sector Enterprises 1
1.2. CPSEs and Employment 2
1.3. CPSEs and Remuneration 3
1.4. CPSEs and Voluntary Retirement Scheme 4
2. CPSEs and Remuneration Policy 6
2.1 First Pay Revision for Executive under IDA pattern 7
2.2 Second Pay Revision for Executive 9
2.3 Government Decision based on the recommendations 15
2.3 Some Suggestions 16
3. CPSEs and Employment Trend of Executive 18
3.1 Overall Employment Trend 18
3.2 Sector wise Employment Trend in CPSEs 22
3.3 Some Observations 24
4. Voluntary Retirement Trend 26
4.1 Overall VRS Trend 26
4.2 Some Analysis 28
4.3 Sector wise VRS Trend 28
5. Relation between Remuneration and Employment in CPSEs 32
6. Future Impact and Second Pay Revision 37
7. Conclusion 39

6
8. References 40

7
List of tables:
Table No. Title 3.1 Total & Executive Employment in CPSEs 17
3.2 Recruitment & Retirement in CPSEs 19
3.3 Employment data for Mining Sector 21
3.4 Employment data for Metal sector 21
3.5 Employment data for Petroleum Sector 22
3.6 Employment data for Power Sector 22
3.7 Employment data for Transport & Tourism Sector 22
4.1 Aggregate Surplus Manpower, VRS sought & VRS got data in
CPSEs 25
4.2 VRS data for Mining Sector 27
4.3 VRS data for Metal Sector 28
4.4 VRS data for Petroleum Sector 28
4.5 VRS data for Power Sector 28
4.6 VRS data for Transport & Tourism Sector 29
5.1 Employment data for Navratnas & Miniratnas CPSEs 31
5.2 Employment data for Non-Navratnas & Non-Miniratnas CPSEs 33

8
1. Introduction
1.1 Central Public Sector Enterprises (CPSEs) 1.1.1 The term ‘Public Sector Enterprises’(PSEs) is an undertaking that is owned by a national,
state, or local government, provides services or goods at a price, and is operated generally on a
self supporting basis. In India, the PSEs include departmental undertakings, corporations and public
limited companies.
1.1.2 The role of PSEs differs from country to country, depending whether the country is
developed or underdeveloped. The philosophy of PSEs is different for different countries.
In India, the CPSEs are engaged in large scale production and supply of a wide range of products
and services. These include basic goods like steel, cement and chemicals; capital goods like
pressure vessels, boilers and drilling rigs; and intermediate goods like electricity and gas. They also
render a large number of services, such as telecom, trading, tourism and warehousing etc. They all
have a great impact on the employment, infrastructure, capital formation and balanced regional
development of the country.
1.1.3 When India attained freedom, it adopted planned economic development policies in
democratic, federal polity. Prior to independence, India was a pre-dominantly agrarian economy
with a weak industrial base due to several factors like low saving, low investment and weak
infrastructure.
1.1.4 Due to these characteristics, the leaders of that time drew up a roadmap for the
development of Public sector as a source for self-reliant economic growth. This guiding factor led to
various industrial policy resolutions starting from 1948 and then to 1956 which focused mainly on
development of public sector enterprises in India. The Industrial policy of 1948 led to development
of core sectors through public enterprises which would intend to correct the regional imbalances
and create employment, whereas the Industrial Policy of 1956 gave primacy to the role of state for
industrial development and emphasized the development of heavy industries (Mahalnobish Model
of Economic Development).The new strategies for the public sector were later outlined in the policy
statements in the years 1973, 1977, 1980 and 1991.
1.1.5 The year 1991, which can be termed as the watershed year, heralded liberalization of Indian
economy where the role of public sector were kept limited to some important areas by reducing
number of reserved areas from 17 to only 8, abolishing industrial licensing in all areas except 18

9
which are of strategic importance. They have the only role of supplementing the private sector by
providing infrastructural facilities in the country and preservation and augmentation of basic
resources.
1.1.6 As on March 2008, there are 247 Central Public Sector Enterprises in India in which 28 are
under construction contributing about 8.4% of total GDP. These CPSE are presently employing
15.70 lakhs of people, out of which about one-fourth of the employees belong to managerial and
supervisory cadres.1
1.2 CPSEs and Employment 1.2.1 The economic development of any country solely depends on the Government policy of that
country. Hence it becomes the responsibility of Government to shape the economy in such a way
that it generates employment which further results into stable and growing economy. These days
the role and duties of the state have undergone a complete change. The state has to spend to
achieve economic and social ends which consist of direct services and benefits to community at
large. The public expenditure of the state should be in such a way so as to generate more
employment leading to rise in productivity. It should provide opportunity for employment. The state,
in this process through setting up PSEs, promotes investment and productivity which corresponds
to full employment.
1.2.2 In fact Indian planning, right from first five year plan, has given great importance to the role
of state when it comes to employment generation. In the process, there was large scale investment
in PSEs which resulted into large scale employment generation in India at least upto 1991. After
that, with opening of the economy, there has been downturn in employment generation by PSEs
due to privatization and disinvestment of many PSEs. But despite this, the share of PSEs in total
employment generation has been modestly high despite the competition from private sector and
multinational corporations.
1.2.A Some Issues Regarding Employment in CPSEs at executive level 2
• By the 70s, it was realized that though Public Sector played a very significant and vital role
in the economic development of the country, over a period of time it also developed certain
negative traits. Monopolistic operations and cost plus pricing system led to large operational
inefficiencies and recruitment of manpower far in excess of actual requirement.
1 Public Enterprises Survey 2007-08 2 Report of the 2nd Pay Revision Committee for the Executives of CPSEs

10
Management started getting politicized and many times decision was taken on
considerations other than sound commercial logic. Several CPSEs failed to foresee future
and adopt new technologies and management practices and became sick.
• And in the early 80s, it became clear that Public Sector monopoly was as bad as Private
Sector monopoly and competition is essential to bring about efficiency in economy.
• Since major part of industrial activities was reserved for Public Sector during the first four
decades after independence, apparently job opportunities for Professionals were also
largely in Public Sector. Since the rate of economic growth was relatively low, number of
jobs created was also relatively low. By the end of 60s and early 70s, there was stagnation
in employment opportunities which led employment in Public Sector the most sought after
career option for bright professionals.
• With the opening of Indian economy in early 90s, private sector started operations in almost
all sectors of the economy that were earlier reserved for CPSEs. Post 1991, private sector
has grown at far rapid rate than the Public Sector. With the entry of MNCs, the rate of
growth of private sector further increased. This growth in private sector has led to large
demand for technical and managerial talent from the private sector.
1.3 CPSEs and Remuneration 1.3.1 Human Resource (HR) is one of the most complex and challenging field of management in
any sector whether it is private sector or public sector, as it deals with the people dimension in
business management.
1.3.2 In CPSEs, HR practices and its management have a long way to go in order to achieve
professional and competitive HR standards. There is a lot to be done in HR in terms of identifying
and nurturing talent; creating a performance driven culture; and bringing about changes in the
mindsets of employees at all level so that all of them aim at providing value to the costumers.
However, the CPSEs, in this regard, have always been considered as model employers. They used
to recruit the brightest people in a very fair selection process and generally through open
competition and jobs in these sectors were used to be highly preferred by talented people. But the
situation has changed in the last 10-15 years. Because, earlier there were little opportunity available
for professionals to migrate from one company to another, but during the last decade there are
plenty of opportunities opened up for them in private sector to leave the organization. And more, the
demand for talent is not confined to any particular sector of industry but the professionals are
moving across sectors. As a result, the CPSEs are under huge pressure in terms of attracting and
retaining talent.

11
1.3.3 Hence, to attract and retain the talent within the CPSEs, there is a need of right approach
toward the employees by the selection committee. The right approach requires that the employees
be treated as resource for the organization in which they contribute. It is high time that CPSEs
should reorient themselves in the matter of human capital and they must ascertain motivational
methods for both tangible and intangible employees. It is in this regard that there has been periodic
revision of remuneration for the employees, basically executives of the CPSEs, by Government of
India through the Department of Public Enterprises (DPE) which is the nodal department for all the
CPSEs in India.
1.3.4 In view of the present scenario and the challenges ahead for the public sector and in
particular the competition from the private sector and MNCs, the Pay Revision Committee (which is
set up to look into the issue of remuneration of Executives in the CPSEs) should be serious about
of its role to recommend a comprehensive pay package to the CPSEs so as to improve efficiency,
productivity and economy through the rationalization of organizational structures, system and
processes. The committee should also emphasize the need to improve transparency, discipline,
and accountability, assimilation of technology and research & development. They should also
harmonize the functioning of the CPSEs with the demands of the emerging national and global
economic scenario.
1.4 CPSEs and Voluntary Retirement Scheme (VRS) 1.4.1 Mainstream economists perceive Voluntary Retirement as a measure to shed workforce
whose marginal productivity is zero. Further it is argued that this could be introduced in an industrial
organization for maintaining its cost effectiveness in an increasingly competitive world. However,
the rationale behind the introduction of VRS in the CPSEs that have to operate within the existing
legislative framework, which doesn’t allow the organization to shed the redundant workforce without
adequate compensation.
1.4.2 Employers refer to VRS as ‘Golden Handshake’, trade union call it ‘Voluntary Retrenchment
Scheme’. For the government it is an exit policy. VRS is one of the strategies introduced in the
CPSEs in India to reduce the so called surplus or redundant manpower. It gained publicity after
introduction of the New Economic Policy, 1991. It is envisaged in the policy that VRS can provide
minimum sustenance security to the retired individual and his family.
1.4.3 VRS, which was initially introduced in 1988 for the first time, was revised and a
comprehensive package was notified by DPE in 2000 so as to cater the need of the CPSEs

12
to meet their objective and also to protect the interest of the workers affected due to various
restructuring models. Considering the difficulties faced by the enterprises where the wage
revision of 1992 or 1997 couldn’t be effected, the VRS was liberalized in 2001.This provides
for 100% additional compensation for the employees where wage revision of 1997 couldn’t
be effected and similarly 50% additional compensation for employees where the wage
revision of 1997 could be made effective. The ex-gratia under VRS to employees following
CDA pattern at 1986 scales has also been enhanced by 50% from 26.10.2004. These
increases in VRS compensation are to be computed based on the existing pay of the
employees.
The different VRS approaches for different type of CPSEs3 are:
• The CPSEs, which are financially sound and can sustain VRS on their own, can frame their
own scheme of VRS and make it attractive enough to for the employees to opt for it. They
may offer compensation up to 60 days salary (only Basic Pay + DA) for every completed
year of the service. However, such compensation will not exceed the salary for the balance
period of service left.
• The CPSEs, which are sick/loss making/marginal profit earning, can adopt either Gujarat
Model (under which compensation is computed by allowing 35 day salary for every
completed year of service and 25 days for each year of the balance service left until
superannuating subject to condition that the compensation shall not exceed the sum of
salary for the balance period left for superannuation) or the VRS package of Department of
Heavy Industry Model (under which ex-gratia payment of equivalent to 45 days emoluments
for each completed year of service or the total emoluments for the balance period of service,
whichever is less, is applicable. The employees who have completed 30 years of service will
be eligible for a maximum of 60 months salary as compensation and this will be subject to
the amount not exceeding the salary for the balance period for service left.
However from the introduction of the VRS initially in 1988 to 2008, approximately 5.94 lakhs4
employees have been released under VRS so far.
3 Public Enterprises Survey 2007-08 4 Public Enterprises Survey 2007-08

13
2. CPSEs and Remuneration Policy
2.0.1 The remuneration policy for CPSEs in India is formulated by Government of India through
the Department of Public Enterprises (DPE) which is the apex regulatory body of CPSEs. For the
revision of remuneration of employees in CPSEs, DPE issues guidelines to be followed by the
CPSEs. The Department renders advice to the administrative Ministries/ Departments and CPSEs
in matters relating to the wage policy and revision in the scales of pay of the executives. The
CPSEs are largely following Industrial Dearness Allowance(IDA) pattern scales of pay and in some
cases, Central Dearness Allowance(CDA) pattern scales of pay is followed.
2.0.2 The Government policy regarding pay scales and pay pattern for all the employees of
CPSEs is that these should be on IDA pattern and related scales of pay. Instruction have been
issued by the DPE in July, 1981 and July, 1984 to all the administrative Ministries department that
as and when a new CPSEs is created or established, IDA pattern and related scales of pay should
be adopted. CDA pattern pay scale were applicable to some of the employees of 69 CPSEs, who
were on the rolls of these companies upto 31.12.88 and were in receipt of CDA pattern pay scale
during that time.
2.0.3 A High Power Pay Committee headed by justice R.B. Mishra, was appointed, by the
government in pursuance of the Supreme Court directions dated 12.3.86.The Committee submitted
its report to the Government on 24.11.84.As per the recommendations of the Committee and
Supreme Court directives thereon, the employees following CDA pattern of scales of the CPSEs
would get pay revision only as when similar changes are effected for the Central Government
employees.
2.0.4 However, out of 15.70 lakhs of employees, around 96% are on IDA pattern and related
scales of pay at present. The remaining are on the CDA pay pattern.
2.A Industrial Dearness Allowance Dearness Allowance is compensatory payment for erosion in real value of salaries resulting from
inflation like things. CPSEs in India are largely following IDA pattern scales of pay. Originally, the
IDA Scheme was based on a point rate system. The rate of neutralization per point rose gradually
from Rs. 1.35 in 1970 to Rs 1.65 in 1983 and thereafter to Rs 2.00 in 1989. In 1992, the IDA
scheme underwent a revision on the analogy of a scheme of percentage neutralization as it existed
in Government, which varied at different levels of basic pay (graded neutralization of cost of living).

14
With effect from 1.4.97, graded neutralization has been replaced with 100% neutralization of cost of
living as in the case of Central Government employees.
The salient features of IDA are as under:-
• Percentage Neutralization- 100%
• All India CPI for Industrial Workers series with base 1960 used for calculating DA. Derived
from the 2001 series by multiplying by a conversion factor of 4.63 and 4.93.
• DA installment to be released every quarter i.e. 4 times a year w.e.f. 1st January, 1st April,
1st July and 1st October.
• DA is paid for increase in AICPI above quarterly index average of 1708.
• The percentage increase in the quarterly average of the AICPI for the period ending
February, May, August and November over index 1708 is to be taken upto one decimal
point.
2. B Central Dearness Allowance Central Dearness Allowance applies in the case CPSEs, which have employees both on CDA and
IDA pattern of scales. The salient features of CDA are as under:-
• Percentage Neutralization – 100%
• AICPI series with base 1982 used for calculating DA. Derived from the 2001 series by
multiplying by a conversion factor of 4.63.
• 12 monthly average of AICPI taken.
• With effect from 1.7.96 for increase in 12 monthly average of AICPI over 12 monthly
average as on 1.1.96 i.e. 1510 (1960=100)
• Revised every six months.
2.1 First Pay Revision for Executives under IDA pat tern
2.1.1 For the first time in India, the Government appointed a Pay Revision Committee in
December, 1996 for the revision of pay scale of Executives of CPSEs, headed by Justice S. Mohan,
Retired Judge, Supreme Court of India.
2.2.2 While appointing the Committee, Government desired that the recommendations of the 5th
Central Pay Commission for Central Government Employees should be taken into consideration by
the Committee to level the pay scale of CPSEs to Central Government.

15
2.2.3 Justice Mohan Committee gave its report in 1999 after taking into account the
recommendations of the 5th Central Pay Commission. Based on the said recommendations, the
Government of India revised the pay scale of Executives of the Board and below Board level with
effect from 1.1.97.
2.2.4 While making the report, the Committee did recognize the change regarding CPSEs for the
last four decades and noted the difficulties that the public sector was facing in the wake of
liberalization of Indian economy. While recognizing serious disadvantages that CPSEs face in the
changed economic scenario, the Committee didn’t make any recommendation to provide a level
playing field to the CPSEs, particularly in the matter of executive compensation. The Committee
made the following observations: “While the financial attractions offered in the private sector are
real, the countervailing circumstance of heavy loses in many CPSEs also has to be borne in mind.
Besides Government as owner of CPSEs cannot ignore important aspects of considering all these
divergent goals against a broad social objective viz., to maintain a balanced overall structure of
wages and income. The task before the Committee has therefore been an exercise in constrained
optimization.”
2.2.5 Therefore the Committee didn’t propose any radical change in compensation of CPSEs and
only followed the relativity principles.
2.2.6 The Committee recommended that the payment of perquisites & allowances could be up to
a maximum of 50% of the basic pay. Payment over & above the ceiling of 50% are required to be
entirely in the nature of Performance Related payment ( PRP), which should not exceed 5% of the
distributable profits in an enterprise.
2.2.7 Government decision based on Justice Mohan committee was:-
• CPSEs, which have been making profit consistently for the last three years viz. 1996-97,
1997-98 and 1998-99, would be allowed to adopt the scales of pay for the executive holding
post at and below the board level and non-unionized supervisors, strictly in accordance with
these guidelines.
• CPSEs, which didn’t make profit during the last three years viz. 1996-97, 1997-98 and
1998-99 would also be allowed to adopt the guidelines with the approval of the government
i.e. the administrative ministries acting in consultation with the DPE provided they give an
estimate as to how resources would be generated by them to meet the extra expenditure.

16
• In respect of sick CPSEs referred to BIFR, revision of pay scales would be strictly in
accordance with rehabilitation packages approved by the BIFR and providing for the
additional expenditure on account of pay revision in these packages.
• CPSEs under construction would submit their proposals for adoption of revised scales of
pay to their respective ministries for approval in consultation with the DPE.
But, there has been certain departure from Pay Revision guidelines with respect to pay scales
including profit making companies including Navratnas CPSEs.
2.1.A Compensation Scenario In simple term, the compensation includes everything an employed individual receives in return for
his work, which mainly comprises of salaries, allowances, incentives & miscellaneous fringe
benefits. In today’s terminology, it is called ‘Cost to the Company’ (CTC). The competitive
organizations design the compensation system in such a way that it results in enhanced
performance and ensures the loyalty of the executives to remain with the company. In general term,
the compensation package broadly includes the following components:-
• Salary – It comprises of basic pay in pay- scale linked to grade, Dearness Allowance (DA)
etc.
• Performance Related Payments (PRP) – PRP generally consist of payments linked to
performance like incentives and rewards. PRP in CPSEs are linked to performance of the
organization and that of unit, a few CPSEs have already introduced payment for individual
performance. As per 1997 pay revision guidelines, the PRP shouldn’t exceed 5% of the
distributable profits of the organization.
• Allowance & reimbursements – It would include various allowances and reimbursements like
conveyance/transport allowance, city compensatory allowance, entertainment allowance
etc. This is allowed at the rate applicable to Central Government employees.
• Social Amenities & Benefits – It would include various facilities like housing, education,
medical etc for which premium is borne by the organization
• Retirement Benefits – It would generally include Provident Fund, Gratuity and social security
scheme. At present CPSEs don’t have such schemes.
2.2 Second Pay Revision w.e.f. 01.01.07
2.2.1 Significant changes have taken place in Indian Economy since the 1st Pay Revision
Committee submitted its report. India has emerged as one of the fastest growing economy and this

17
expansion in economy has for the first time created a situation especially in CPSEs, where demand
for talent far exceeds availability.
2.2.2 Hence to get rid of this demand- supply disequilibrium of talent, the 2nd Pay Revision
Committee was constituted in November, 2006 by the DPE under the Chairmanship of Mr. Justice
M. Jagannadha Rao, Retired judge, Supreme Court of India w.e.f. November2006. While finalizing
the report the committee was also requested to take into account the recommendation 6th Central
Pay Commission. The Committee, while preparing the report, has taken into account current
categorization of CPSEs such as Schedule ‘A’, ‘B’, ‘C’ and ‘D’ and their status as Navratna,
Miniratna, and loss/profit making CPSEs and also CPSEs referred to BIFR/BRPSE as well as under
IDA/CDA pattern. While making recommendations, the committee has kept in mind the general
principles, financial parameters and conditions, which should govern the desirability, feasibility and
continuation/modification of the Productivity Linked Incentives Schemes and Performance Related
Payments.
2.2.3 While making the report, the Committee was required to take note of some important points
which the earlier Committee didn’t take. These points have great importance in this changing
economic scenario where the CPSEs have to face stiff competition from Private Sector and MNCs.
These points are mentioned below:-
• The Committee was required to make recommendations that will transform the CPSEs into
modern, professional, citizen friendly and successful commercial enterprises that are also
dedicated to the service of the society.
• The Committee should work out a comprehensive pay package that is suitably linked to
promoting efficiency, productivity and economy through rationalization of structure,
organizations, systems, and processes as well as promoting financial and operational
autonomy within the CPSEs.
• The Committee should make recommendations so as to harmonize the functioning of
CPSEs with the demand of emerging national and global economic scenario.
The Committee, by taking into account the above important notes, proposed a radical change in the
principles to be adopted in deciding compensation package for the executive of CPSEs. These
radical changes are mentioned below which can also be termed as the recommendations by the
Committee.

18
2.2.A Relativity
• In the light of vast changes that have taken place in India economy and job market, the
principle of relativity with civil services cannot be applied to CPSEs any more. The CPSEs
didn’t face any competition in operations as well as in recruiting and retaining talent when
they had monopoly in several sectors of the economy. But with opening of the economy,
they are facing competition in recruitment and retention of talent from Indian Private Sector
and MNCs in India and abroad. Thus the Committee is of the view that, the compensation in
CPSEs has to be progressively aligned with their counterpart in private sector and MNCs
and not with the Government.
• According to Sixth Pay Commission on the issue of parity, it was observed that PSUs as a
commercial undertaking are required to function in a competitive environment, have the
commercial objective as the predominant objective. A comparison of salaries between the
public sector and the Government may not be appropriate as it would not be a comparison
between similarly placed entities.
• Following the relativity comparison, the Justice Mohan Committee recommended a relativity
of 1:4 between the entry level executive and CEO of the CPSEs. But by studying several
reports on relativity by the new Committee, it was found that while at entry level
compensation for executive in CPSEs is comparable to the private sector, the difference
increases at higher level. Salaries of comparable CEOs in private sector are higher by factor
of 10 or more. The relativity of compensation between entry-level executive and CEOs can
go as high as 1:50. The committee in this regard feels that while the ratio of 1:50 is
exceptional and does not appear rational, a ratio of about 1:10 between the lowest and the
highest paid executive in CPSEs would recognize the level of responsibility a CEO is
expected to discharge in a fiercely competitive market and also appear respectable with
reference to his counterpart in private sector. The committee recognizes that this change will
increase disparity of income between the lowest level worker and the highest paid executive
in CPSEs.
2.2.B Affordability
• The CPSEs have adopted uniform package to executives irrespective of size except at the
level of directors and CEOs. But the Committee believes that CPSEs being the commercial
organizations have to generate adequate resources to be able to pay their executives
market determined compensation.

19
• The Committee is of the view that the same level of compensation cannot be given for all
kinds of companies. For this, the Committee has recommended to reclassify CPSEs into
different sectors and categories for the purpose of deciding variable and fixed components
of the compensation. And Board of directors should decide compensation for different
individuals keeping in view affordability of the company and performance of the individual.
The 2nd PRC recommended that there should be no question of government giving any
support for paying dues of CPSEs employees, except in respect of sick CPSEs proposed for
rehabilitation or closure.
2.2.C Fixed and Variable Compensation
• The Committee proposed to change the current pattern of compensation which is fixed
in nature irrespective of performance of the company and is of the view that a significant
part should be made variable as is in the private sector. The variable component is
basically used to motivate and bring about desired behavioral changes in the employees
and to reward those employees who have made significant contribution to the company.
The variable component will be relatively low for lower level executives and
progressively increases to as high as 200% of the basic pay at level of CEOs. This
variable component to be called Performance Related Payment (PRP) and will be drawn
from the Profit before the tax (PBT) and will be linked to individual, group and company
performance.
2.2.D Performance Management System
• A significant PRP assumes existence of a robust and transparent performance
management system. The practice of grading most of the executive should be based on
a ‘bell curve shaped approach’ which is also followed by most of the private sector
companies and MNCs. In this approach, no more than 10-15% of the executive should
be graded ‘outstanding’ and 10% non-performing executive should also be graded as
below per. PRP should vary depending upon the performance.
• For determining the variable payments, companies as well as executive will have to
achieve pre-determined physical as well as financial target as under MOU. Only those
companies that achieve ‘excellent’ MOU rating should pay up to 100% of PRP.
Companies achieving ‘very good’, ‘good’, and ‘fair’ rating should pay a maximum of 80%,
60% and 40% respectively. No PRP is payable if MOU is rating is ‘poor’. Similarly,
Executives who get ‘outstanding’, ‘Very Good’, ‘Good’ and ‘Fair’ performance rating

20
should get up to 100%, 80%, 60% and 40% PRP. No PRP is recommended for those
achieving ‘Poor’ rating.
2.2.E Remuneration Committee
• Because of the conflict of interest between shareholders and management in deciding
managerial compensation, it is proposed that annual bonus pool and policy for its
distribution across the executive is decided by the Remuneration Committee of the
Company headed by an independent director. PRP will be decided only by a
Remuneration Committee.
2.2.F Concept of the Cost to the Company (CTC) The Committee is of the view that, like the private sector, the concept of CTC should be also
introduced in the CPSEs. The main components of CTC are mentioned below:
• Fixed Pay ( basic pay and risk pay)
• Dearness Allowance (only on the IDA pattern )
• Annual Increment (might be given up and replace by a flexible increment of 2-4% of
basic pay depending on the performance of the individual)
• House Rent Allowance ( depends on city to city population)
• City Compensation Allowance (to be dispensed with)
• Company Car ( Only to the CMD and Directors)
• Superannuation Benefits (enhanced 30% of basic pay)
• Long Term Incentives
1. In a market where there is serious shortage of talent, it becomes necessary for
companies to devise methods by which highly performing executive could be
retained. The government has issued guidelines for introduction of stock option in
CPSEs. But, the Committee is told that in its current form, stock option is at best a
saving option and not an incentive and there are no takers for this scheme.
2. The Committee recommended inclusion of stock option as long term incentive, in
order to seek high level of commitment of executive to company’s performance.
Committee recommended that CPSEs should pay part of PRP in the form of
company’s stock.
3. The Committee also recommended rest of the CPSEs to get listed on the stock
exchange and a small portion of equity; say up to 10% may be disinvested in favor
of employees and retail investors.

21
2.2.G Manpower Redundancy
• It is a matter of common knowledge that most CPSEs have manpower far in excess of their
needs. Despite operation of VRS for several years, excess employment continues. Time
bound promotions have been have been given without reference to need for higher-level
positions or performance of the individuals. Several CPSEs have created a large number of
positions at higher levels by simply upgrading existing incumbents, without any change in
their job content or responsibility. Companies, in this regard, should make proper
assessment of their manpower requirement at different levels, consistent with their business
requirement, duly benchmarking their manpower cost and productivity with best available in
the respective sectors in private and MNCs. The Committee should take these factors in
account while deciding on annual pay rises and variable component of compensation (PRP).
2.2.H Voluntary Retirement VS Compulsory Retiremen t
• The thing is that CPSEs have not been able to get rid of poorly performing executives under
VRS. It is therefore proposed to replace it by Compulsory Retirement Scheme and
management of CPSEs should have right to compulsorily retire surplus manpower by paying
adequate compensation.
• As far as executives with consistently poor record of services are concerned, their service
should be terminated in terms of contract of employment by the logic of changing economic
environment in which CPSEs are also treated as any commercial enterprises operating
under the ambit of Company Law and they have full autonomy in management of their
manpower and operations.
2.2.I Compensation Package for Executives of Sick CPSEs
• The Committee recommended that Sick Companies that are making cash profit may be
allowed to implement the pay revision without Risk Pay or Variable Pay.
• Enterprises that are recommended for revival should include the proposal for revised Pay
scale.
• If Enterprises are recommended for closure, the executive should be compulsorily retired by
paying compensation based on revised basic pay recommended. They may be paid
compensation at the rate of 2 months basic pay plus DA for every year of service completed
or amount equal to the salary for the remaining period of service whichever is less.

22
2.2.J Retirement Age
• Despite the request by the executives of several companies to enhance the retirement
age to 65 years, there is no case of any recommendation for this by the committee.
2.2.K Other Recommendation
• The Committee suggested that those company that are non-commercial in nature and
that are set up to implement the government program for specific section of the society
with no profit motive should be taken out of the proposed pay revision and government
may adopt scales of pay of 6th Central Pay Commission in respect of these companies.
• The Committee is of the view that all the companies in ‘D’ category (turnover of less than
or around 5o crore) except non-commercial companies should be withdrawn by the
Government through merger, privatization or otherwise as they are sick companies and
will not be able to pay the compensation to their executive according to the package
recommended by the Committee.
2.3 Government Decision based on the recommendation s
After due consideration of the above recommendations of the 2nd PRC, the Government on 26th
November 2008 decided about remuneration of Executives of the CPSEs w.e.f. 01.01.2007.
According to the Government decisions:-
• Revised Pay Scale for Board and below Board level executive have been decided by the
Government to be implemented.
• A uniform fitment benefit @30% on basic pay plus DA @ 68.8% as on 01.01.2007 would
be provided to all executives of the CPSEs.
• The revised pay scales would be adopted, subject to the condition that the additional
outgo by such revision for a period of 12 month should not result in more than 20% dip in
profit before tax(PBT) for the year 2007-08 of a CPSEs in respect of executives. CPSEs
that cannot afford to pay full package, can implement with either part PRP or no PRP.
• The CPSEs which are not able to adopt revised pay scales(2007), may give an increase
on the basic pay plus DA drawn in the pre-revised scale as on 01.01.2007, with a
uniform lower fitment of 10% or 20%, depending upon their affordability.
• Annual increment will be at the rate of 3% of the revised basic pay
23
• 100% DA neutralization will be adopted for all the executives who are on IDA pattern of
pay-scale, w.e.f. 01.01.2007.
• House Rent Allowance to the employees of the CPSEs will be 30%, 20% and 10% of the
Basic Pay based on the population of the respective city.
• The Compensatory Allowance stands dispensed with.
• The company car would be provided to Directors and CMDs.
• The Board of Directors will decide on the other allowances and perks admissible to the
different categories of the executives subject to a maximum ceiling of 50% of Basic Pay.
• The PRP has been directly linked to the profits of the CPSEs/units and performance of
the executives. The PRP, however, will be on conditions related to MoU rating, physical
and financial performance.
• All CPSEs would formulate Employees Stock Option Plan (ESOP) and 10-25% of the
PRP should be paid as ESOPs.
• The concept of Cost of Company (CTC) would be introduced in all the CPSEs.
• CPSEs would be allowed 30% of Basic Pay as Superannuation benefits, which may
include Contributory provident Fund (CPF), Gratuity, Pension and Post-Superannuation
Medical Benefits. The CPSEs should make their own scheme to manage these funds to
operate through insurance companies on fixed contribution basis. The Pension and
Medical benefits can be extended to those executives, who superannuates from the
CPSE and have put in a minimum of 15 years of service in the CPSE, prior to
superannuation.
2.4 Some Suggestions
While comparing the recommendations between 1st and 2nd Pay Revision Committees and the
decision of the Government based on the recommendations, we came across several observations.
Though the 1st PRC was attractive at first glance, it wasn’t according to the need of the open
economy where the CPSEs were not able to compete with their counterpart in the private sector
and MNCs. The reason appears to be 1st PRC recommendations was according to the pay scales
of parity and relativity with the 5th Central Pay Commission for the Government employees not
according to the pay scale of executives in the private sector and MNCs. The reason was limited
recommendation by the Committee regarding Public Sector like the recommendation was according
to the pay scale of 5th pay commission for the Government employees not according to the pay
scale of executives in private sector and MNCs. But when we come across the 2nd PRC
recommendations, we observe that it was comprehensive in nature according to the changing

24
market scenario and this time the focus was basically on the comparison of pay scale in the CPSEs
vis a vis private sector and MNCs. Like private sector, the Committee also considered about the
fixed pay and variable pay like stuffs for the CPSEs executives, which is going to be very beneficial
for the CPSEs in coming years. The focus was more on incentives for the talented executives
through PRP who contribute in the growth of the company. In fact the 1st PRC didn’t propose any
radical change but they focused mainly on relativity principle in compensation while the 2nd PRC
proposed many radical changes regarding compensation for the executive in CPSEs by taking into
account several issues as explained above.
Despite this, there are certain issues which should have been taken into account by the
Committee:-
• There has been a trend in the CPSEs, “the more skill a public sector post requires, the less
is the pay scale as compared to private sector.” This issue should be taken into account by
leveling the compensation of higher level executives in the CPSEs to that of private sector
and MNCs.
• The periodicity of pay revision is another issue of concern. There has been suggestion that
to get rid of high attrition rate, there has to be pay revision after every 5 year instead of 10
year due to fast changing economic environment in the country.
• Given the attrition rate and increasing demand for professionals in the CPSEs, there should
be increment in retirement age for executives to retain the critical talent within the company.
The study suggests that retirement age be reviewed on selective basis, allowing individual
companies to extend the retirement age to 62-65 years.

25
3. CPSEs and Employment Trend
3.1 Overall Employment Trend
3.1.2. Employment trend in the CPSEs over the years have witnessed a remarkable change with
regard to executive level in particular and aggregate level as a whole due to several policies of
government. These policies are remuneration policy, disinvestment policy, VRS policy etc which
largely influenced the employment trend in CPSEs over the years. Apart from these, the
government ‘s attitude towards private sector, in the wake of liberalization of the Indian economy,
also contributed a lot for the change in employment trend especially at executive level in the
CPSEs.
3.1.2 Hence while observing the data regarding total employment in CPSEs given below, we find
several interesting results.
Table 3.1 Total & Executive Employment in CPSEs
Source: National Information Centre, DPE
Total Employment Trend in CPSEs
0
500000
1000000
1500000
2000000
2500000
Ye a r
Series1
Executive Employment Trend In CPSEs
0
50000
100000
150000
200000
250000
300000
Ye a r
Series1
Year Total Executive Employment
Total casual and contract labor
Total employment Percentage of Exe. Emp. of total emp.
2000-01 201060 82285 1739901 11.55 2001-02 204086 Only casual 32187 1991974 10.24 2002-03 204305 Only casual 39451 1866365 10.94 2003-04 219336 85212 1762300 12.44 2004-05 236566 83462 1699650 13.91 2005-06 246576 90938 1648555 14.95 2006-07 253798 166289 1613716 15.72 2007-08 265773 238404 1573016 16.89

26
% of Exe emp of ttl emp
0
2
4
6
8
10
12
14
16
18
2000-01
2001-02
2002-03
2003-04
2004-05
2005-06
2006-07
2007-08
%
3.1.3 By observing the above data and the graph regarding the total executive employment and
total employment in CPSEs, we find that over the year total employment declined at regular
basis except in the period 2000-01 to 2001-02 but at the same time the employment at
executive level keep on increasing between the years 2000-01 to 2007-08. There might be
many reasons for this which has been mentioned below:-
• The reason for decline in total employment could be due to several disinvestment program
pursued by the government in that very period like privatization of BALCO, NALCO, VSNL
etc. Wherein after getting privatized, these companies offered their surplus manpower
lucrative VRS which resulted into overall decline in total employment. Many CPSEs also
offered VRS to right age the manpower.
• During that very period, there has been continuous increase in employment at executive
level at absolute and relative both level. This could be due to the companies’ effort to make
them competitive vis a vis the private sector. For this, there could have been the need to
make them efficient at technical and managerial level. This could be done by employing
more professionals at technical and managerial level.
• The increase in executive level employment implies a decline in below executive
(supervisory and workers) level employment in CPSEs. This is definitely true because during
this period, there has been increase in employment at below executive level on casual and
contract basis. This has been the case due to the indiscipline and lack of work culture
among workers at that level, which resulted into inefficiency for the company. Hence to

27
make the company more efficient, there has been trend in CPSEs to employ more people
below executive on casual and contract basis and less at regular basis.
• We, therefore, observe by the above case that during the last 10 years, the CPSEs have
given great importance to professionals, which resulted into more efficiency in the company.
This attitude of the CPSEs could be due to the competition faced by them from the private
sector.
3.1.A Recruitment and Retirement Trend in CPSEs
3.1.A.1 During the last 10 years, the recruitment policy in the CPSEs has been based on the
need of the market economy where the CPSEs have been facing stiff competition from the private
sector. The main thrust of the recruitment policy is to recruit more employees at executive level on
regular basis and also more employees at below executive level on contract/casual basis. The
analysis of recruitment policy in CPSEs is discussed below by taking into account the retirement of
the employees also.
Table 3.2 Recruitment & Retirement in CPSEs
year Total
Executive Recruitment
Total Recruitment
Percentage of Executive
Recruitment of the Total Recruit.
Total Executive
Retirement
Total retirement
Percentage of Exe.
Retired of total
retired 2000-01 4057 14130 28.71 4107 30499 13.46 2001-02 6094 13986 43.97 4953 27691 17.88 2002-03 2490 7371 33.78 4401 30324 14.51 2003-04 4055 8754 46.2 4667 30242 15.39 2004-05 3898 9422 41.37 4251 30591 13.81 2005-06 4795 11034 43.45 3918 27341 14.33 2006-07 7509 20237 37.11 6470 30338 21.32 2007-08 9313 30036 31 7675 42854 17.90
Source: National Information Center, DPE
Recruitment in CPSEs
0
5000
10000
15000
20000
25000
30000
35000
2000-01
2001-02
2002-03
2003-04
2004-05
2005-06
2006-07
2007-08
year
recruitm
ent
recr. Exe
total recr.

28
% of executive recruitment of total recruitment
05
101520253035404550
2000-01
2001-02
2002-03
2003-04
2004-05
2005-06
2006-07
2007-08
Year
%
%
total retirement
0100002000030000400005000060000
2000
-01
2001
-02
2002
-03
2003
-04
2004
-05
2005
-06
2006
-07
2007
-08
year
emp
retir
ed total retirement
retired executive
3.1.A.2 The general trend is that there should be direct relation between retirement and
recruitment trend for any company. If there is more retirement in any company, there has to be
same amount of recruitment to make the company operate as usual. But if there is expansion in the
company’s operations, the aggregate recruitment exceeds that of the aggregate retirement. As far
as the recruitment at executive level is concerned, it may be the company strategy to make the
company more efficient in terms of technology and management by recruiting more professionals.
3.1.A.3 When we take the case of CPSEs, we find from the above data that there has been
continuous increase in recruitment of executive as percentage of total recruitment and there has
been almost constant change in percentage of executive retired of total employees retired. This
indicates that with increase in competition from the private sector, the CPSEs are recruiting more
professional over the time which kept on increasing from 28.73% in 2000-01 to 43.5% in 2005-06 to

29
31% in 2007-08. But in absolute term, there has been continuous increase in the number of
executives recruited. This trend in recruitment of executives could definitely have made the CPSEs
more competitive in the market economy compare to the private sector in terms of efficiency and
operations.
3.2 Sector Wise Employment Trend in CPSEs
3.2.1 While analyzing sector wise trend, we took mainly five sectors; four from industry (Mining,
Metal, Power and Petroleum) and one from service sector. These sectors can give overall
employment trend for some flourishing (like Power and Petroleum) and some languishing (Metal,
Mining and to some extent service sector) CPSEs at executive level.
Table 3.3 Employment data for Mining Sector
Mining Sector
year
Total Executive Employm
ent
Total Employment
% of Executive Employm
ent of total
employment
Total Executive Recruitme
nt
Total Recruitme
nt
% of Executive recruitme
nt of Total
Recruitment
2002-03 19372 521514 3.71 39 1186 3.28 2003-04 18867 504655 3.73 122 903 13.51 2004-05 18591 487910 3.81 56 1296 4.32 2005-06 17760 471732 3.76 545 10852 5.02 2006-07 17718 460765 3.84 288 4085 7.05 2007-08 17803 449210 3.96 257 5143 4.99
Source: National Information Center, DPE
Table 3.4 Employment data for Metal sector
Metal Sector
year
Total Executive Employme
nt
Total Employment
% of Executive Employm
ent of total
employment
Total Executive Recruitme
nt
Total Recruitme
nt
% of Executive recruitment of Total Recruitme
nt
2002-03 20867 172641 12.08 164 995 16.48 2003-04 20891 164968 12.66 333 845 39.4 2004-05 21855 159824 13.67 123 1116 11.02 2005-06 17253 171372 10.06 624 4398 14.18 2006-07 23011 165797 13.87 444 1561 28.44 2007-08 23206 161545 14.36 1080 3033 35.6
Source: National Information Center, DPE

30
Table 3.5 Employment data for Petroleum Sector Petroleum Sector
year
Total Executive Employme
nt
Total Employment
% of Executive Employm
ent of total
employment
Total Executive Recruitme
nt
Total Recruitme
nt
% of Executive recruitment of Total Recruitme
nt
2002-03 41095 112591 39.49 598 950 62.94 2003-04 45625 109657 41.6 892 1072 83.2 2004-05 43498 106425 40.87 752 1139 66.02 2005-06 42936 107448 39.9 684 1513 45.2 2006-07 40821 99689 40.91 760 1673 45.42 2007-08 45098 107305 42.02 1280 2473 50.5
Source: National Information Center, DPE
Table 3.6 Employment data for Power Sector Power Sector
year
Total Executive Employme
nt
Total Employment
% of Executive Employm
ent of total
employment
Total Executive Recruitme
nt
Total Recruitme
nt
% of Executive recruitment of Total Recruitme
nt
2002-03 18977 68904 27.54 349 676 51.62 2003-04 23884 82749 28.8 1335 2695 49.53 2004-05 24431 79393 30.77 922 1155 79.82 2005-06 26384 83435 31.62 280 804 34.82 2006-07 27414 83538 32.81 1594 2159 73.83 2007-08 27916 83238 33.53 1172 1803 65
Source: National Information Center, DPE
Table 3.7 Employment data for Transport & Tourism Sector Transport and Tourism Sector
year
Total Executive Employme
nt
Total Employment
% of Executive Employment of total employme
nt
Total Executive Recruitme
nt
Total Recruitme
nt
% of Executive recruitment of Total Recruitme
nt 2002-03 11122 47208 23.55 21 636 3.01 2003-04 13487 65073 20.72 91 545 16.69 2004-05 15618 71036 21.98 96 592 16.21 2005-06 14307 56020 25.53 168 317 52.99 2006-07 11293 55863 20.21 568 1057 53.73 2007-08 11585 33863 34.21 144 318 45.83
Source: National Information Center, DPE

31
3.3 Some Observations
3.3.1 When we take a look at the important sector wise data on employment trend in CPSEs, we
find several interesting observations mentioned below:
• Over the years, the employment trend at executive level in the CPSEs has been in the
range of 10%-15% of the total employment. But when we take a look at the sector wise
data, we observe differences in the executive employment out of total employment. On the
one hand the Mining and Metal sectors have as low as approximately 3.7 % and 12%
respectively of the total employees at executive level and on the other hand the Petroleum
and Power sectors have as high as 40% and 30% respectively of the total employees at
executive level. In between, there is transport and tourism (service) sectors which have
approximately 25 % employees at executive level.
• The differences in the percentage of executive employment of total employment are
basically due to the need of that sector for executives. Like in Mineral and Metal sector,
there is more work related at lower level, where no more technical knowledge is required
and these sectors, except some, doesn’t have global exposure (which require managerial
skill to sustain in global market) also. But the case of Petroleum and Power sector is
different, where there is a need of great technical knowledge and due to global exposure of
these sectors, managerial skill is also expected from them. There is also more competition in
these sectors as compared to others from the private sector. That’s why over the year there
has been large recruitment drive at executive level in these sectors as compared to others.
• The same trend is observed while considering recruitment in CPSEs at executive level
which has been in the range of 30%-40% aggregate. But when we take it sector wise, there
is different story to tell. In Mineral and Metal sector the recruitment has been in the range of
3%-7% and 10%-30%, while in Petroleum and Power sector this has been in the range of
45%-65% and in the Transport and Tourism sectors it has is around 15%-50%.
• One very important observation has been found when we take a look at the data regarding
recruitment of executives in Mining, Metal and Petroleum sectors in the year 2003-04, there
had been exceptionally large increase (more than average trend) in recruitment of
executives which was as high as 13.51%, 39.4% and 83.2 % of total recruitment. The same
has been the case with Power sector in the year 2004-05, where executives had been 79.82
% of the total recruitment.
• This increase was basically due to large recruitment drive of some individual CPSEs in
these sectors. Like in Mining, the Coal India Ltd. alone recruited 86 executive out of 122
executive recruitment in that sector. In metal, the only two company SAIL and National
32
Aluminium Company Ltd. recruited around 330 executive( 228 by SAIL ) out of 333
executive recruited in that sector. In petroleum sector, this was due to ONGC and IOCL
recruitment drive. Whereas in power sector, NTPC and PGCI contributed for this large
recruitment drive.
• One interesting fact we also came across when we take a look at transport and tourism
sectors. In these sectors, the executives employment has been around 23% of total
employment in 2002-03 to 34% of total employment in 2007-08.Executives recruitment in
these sectors also saw steeper growth as compared to others with 3 % in 2002-03 to 45% in
2007-08 of the total recruitment. The increase in these sectors is basically due to
introduction of employment on contract basis at lower level, which increased the percentage
of executive recruited of total recruitment and the competition faced by them from private
players especially in the field of Aviation and Hospitality industry. The recruitment of
executives in these sectors could make these sectors more competitive especially the
Aviation and Hospitalities Sector where these CPSEs have to face stiff competition from the
new private players. Private players are definitely performing better when it comes to service
sector, where government shouldn’t involve itself in such sectors.

33
4. Voluntary Retirement Scheme (VRS) Trend
4.1 Overall VRS Trend 4.1.1 There are many CPSEs where due to contraction in operations and their loss making state,
the capacity to employ same level of employees become very difficult. This situation gave rise to
surplus manpower in these CPSEs. These CPSEs, due to their socialist and welfare approach, can
not compulsorily make all the surplus manpower to retire from the CPSEs to make them efficient in
terms of number of sufficient employees. Hence by taking into account these things in mind, the
Government of India introduced Voluntary Retirement Scheme (VRS) in the CPSEs for this surplus
manpower. Wherein by opting VRS, which provides many incentives to its holder, the employees of
the respective CPSEs get retired in a beneficial manner.
Table 4.1 Aggregate Surplus Manpower, VRS sought & VRS got data in CPSEs
year Total
Surplus Executive
Total Surplus
Employees
% of Total
executive surplus of total
Total Executive
VRS Sought
Total VRS
Sought
%of total VRS Exe of the
total
Executive retired under VRS
Total Retired under VRS
% of Exe of
the total
retired under VRS
2000-01 3555 74001 4.8 11222 45181 24.83 5316 38772 13.71 2001-02 5568 80547 6.91 8448 57540 14.68 13611 56786 23.96 2002-03 4374 69340 6.3 6596 64810 10.17 4970 62658 7.93 2003-04 3615 57246 6.31 5782 37087 15.9 5683 45125 12.59 2004-05 3098 58416 5.3 2247 29404 7.64 1833 19900 9.21 2005-06 2079 39931 5.2 1150 30986 3.71 1155 13666 8.45 2006-07 1082 19865 5.44 1408 26054 5.4 1019 24170 4.21 2007-08 514 7947 6.46 463 6137 7.54 381 6982 5.45
Source: National Information Center, DPE
Trend line between Total Surplus Executive and Total Executive sought VRS
y = 1.6207x
R2 = 0.6021
0
20004000
6000
800010000
12000
0 2000 4000 6000
Total Surplus Executive
Total E
xecu
tive
soug
ht V
RS
Total Executive VRSSought
Linear (TotalExecutive VRSSought)

34
Trend line between Total surplus Manpower and Total VRS sought
y = 0.6302x + 5000
R2 = 0.7682
010000200003000040000500006000070000
0 20000 40000 60000 80000 100000
Total Surplus Manpower
Tot
al V
RS
sou
ght
Total VRS Sought
Linear (Total VRSSought)
4.1.2 When we take a look at the data regarding surplus manpower, VRS sought and those
retired under VRS scheme, we come across some interesting conclusions:
• The percentage of surplus executive of the total surplus manpower has always been less
than the percentage of executive of total employees who sought VRS. The reason for this
has been explained below.
• When we observe the equation (y = 0.6302x + 5000), we can say that when there is zero
surplus manpower, there is still approx 5000 person seeking VRS i.e. VRS always exceeded
surplus manpower at aggregate level.
• The percentage of surplus executive of total surplus manpower, over the years, has always
been in the range of 5%-7% which might be termed as natural surplus executives in the
CPSEs.
• Over the years, there has been decline in the number of employees who sought VRS
especially at executives level in the CPSEs. The percentage of executive of the total
employees who sought VRS was about 24.83% in 2000-01 to 15.9% in 2003-04 and 7.54%
in 2007-08.
• There is no relation between the number of employees who sought VRS and the number of
employees who retired under VRS. But there should be direct relation between them i.e. the
employees who sought VRS should get retired under VRS. The reason might be that the
employees who are seeking VRS may not be the surplus manpower (as it happened in
many cases) or they don’t find VRS scheme attractive enough for themselves.

35
4.2 Some Analysis 4.2.1 The general trend in surplus manpower and employees opting for VRS is that the number of
employees opting for VRS should be almost same so that the respective CPSE can get rid of their
surplus manpower by offering them lucrative VRS. But when we see the trend in reality, we find that
there is some amount of differences especially at executives level which we have shown by drawing
trend line and by taking the value of R-square (Co-efficient of Determinant). The value of R-square
of one tells that the change in VRS is explained by the surplus manpower whereas the zero value of
R-square tells that the change in VRS is not explained by surplus labor. That’s what we need to
draw by the above trend line. The trend line between the total surplus manpower and the number of
employees opted for VRS gives the value of R-square as 0.77, which is nearer to one implying that
the change in VRS sought by total employees is largely if not completely explained by total surplus
manpower. This is true in reality especially at aggregate level, because the VRS sought by the total
employees is almost explained by due to the surplus manpower. .
4.2.1 While the trend line between the total surplus executive and number of executive sought
VRS gives the value of R-square as 0.60 which is less likely to explain the change in VRS due to
surplus executive. This result holds to some extent in reality. Because these days, whatever
amount of VRS is opted by the executive of the CPSEs, these are not only due to existence of
surplus executives in these CPSE but also lucrative offers from the private sector. Due to these
lucrative offers the executives in the CPSEs no longer want to work there which results in large
number of VRS opted by them whenever they get some chance in private sector. But after
implementation of 2nd Pay Revision in the CPSEs, which promises to pay the executive of the
CPSEs the same amount as in the private sector, we may get rid of the excess VRS by the
executives. Then we might get the value of R-square nearer to one, which will perfectly explain the
change in VRS as due to change in surplus manpower.
4.3 Sector Wise VRS trend in CPSEs
Table 4.2 VRS data for Mining Sector
Mining Sector
year Total
Surplus Executive
Total Surplus
Employees
% of Total
executive surplus of total
Total Executive
VRS Sought
Total VRS
Sought
%of total VRS Exe of the
total
Executive retired under VRS
Total Retired under VRS
% of Exe of
the total
retired under VRS
2002-03 336 23460 1.43 199 7905 2.51 208 8091 2.57 2003-04 1019 26432 3.85 114 5264 2.16 55 6136 0.89
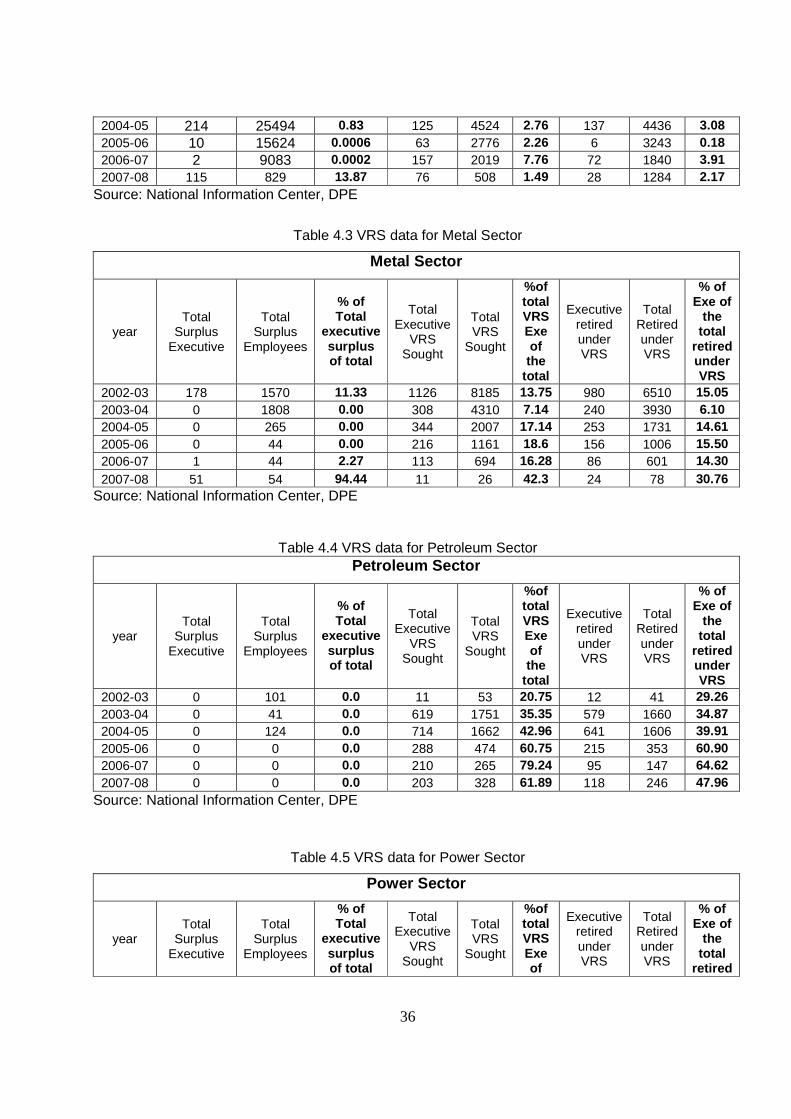
36
2004-05 214 25494 0.83 125 4524 2.76 137 4436 3.08 2005-06 10 15624 0.0006 63 2776 2.26 6 3243 0.18 2006-07 2 9083 0.0002 157 2019 7.76 72 1840 3.91 2007-08 115 829 13.87 76 508 1.49 28 1284 2.17
Source: National Information Center, DPE
Table 4.3 VRS data for Metal Sector
Metal Sector
year Total
Surplus Executive
Total Surplus
Employees
% of Total
executive surplus of total
Total Executive
VRS Sought
Total VRS
Sought
%of total VRS Exe of the
total
Executive retired under VRS
Total Retired under VRS
% of Exe of
the total
retired under VRS
2002-03 178 1570 11.33 1126 8185 13.75 980 6510 15.05 2003-04 0 1808 0.00 308 4310 7.14 240 3930 6.10 2004-05 0 265 0.00 344 2007 17.14 253 1731 14.61 2005-06 0 44 0.00 216 1161 18.6 156 1006 15.50 2006-07 1 44 2.27 113 694 16.28 86 601 14.30 2007-08 51 54 94.44 11 26 42.3 24 78 30.76
Source: National Information Center, DPE
Table 4.4 VRS data for Petroleum Sector
Petroleum Sector
year Total
Surplus Executive
Total Surplus
Employees
% of Total
executive surplus of total
Total Executive
VRS Sought
Total VRS
Sought
%of total VRS Exe of the
total
Executive retired under VRS
Total Retired under VRS
% of Exe of
the total
retired under VRS
2002-03 0 101 0.0 11 53 20.75 12 41 29.26 2003-04 0 41 0.0 619 1751 35.35 579 1660 34.87 2004-05 0 124 0.0 714 1662 42.96 641 1606 39.91 2005-06 0 0 0.0 288 474 60.75 215 353 60.90 2006-07 0 0 0.0 210 265 79.24 95 147 64.62 2007-08 0 0 0.0 203 328 61.89 118 246 47.96
Source: National Information Center, DPE
Table 4.5 VRS data for Power Sector
Power Sector
year Total
Surplus Executive
Total Surplus
Employees
% of Total
executive surplus of total
Total Executive
VRS Sought
Total VRS
Sought
%of total VRS Exe of
Executive retired under VRS
Total Retired under VRS
% of Exe of
the total
retired

37
the total
under VRS
2002-03 0 0 0.0 4 78 5.12 4 78 5.12 2003-04 0 1193 0.0 6 90 6.66 13 130 10.00 2004-05 0 1194 0.0 35 131 26.26 34 130 26.15 2005-06 0 1192 0.0 53 216 24.53 53 216 24.53 2006-07 113 1559 7.24 78 568 13.73 78 568 13.73 2007-08 105 1447 7.25 82 754 10.87 57 726 10.03
Source: National Information Center, DPE
Table 4.6 VRS data for Transport & Tourism Sector
Transport and Tourism Sector
year Total
Surplus Executive
Total Surplus
Employees
% of Total
executive surplus of total
Total Executive
VRS Sought
Total VRS
Sought
%of total VRS Exe of the
total
Executive retired under VRS
Total Retired under VRS
% of Exe of
the total
retired under VRS
2002-03 10 134 7.46 151 207 72.94 123 177 69.49 2003-04 0 0 0.00 290 1202 2.27 265 778 34.06 2004-05 18 55 3.27 35 201 17.41 5 11 45.45 2005-06 18 48 37.50 11 26 42.3 1 10 10.00 2006-07 0 0 0.00 113 694 16.28 86 601 14.30 2007-08 0 2 0.00 1 3 33.33 1 3 33.33
Source: National Information Center, DPE 4.3.A Some Observations
• Overall, the total surplus executive has been 5%-7% of the total surplus manpower. But
when we see the sector wise data, we observe that there are many sectors like Petroleum
and Power sectors where there is no surplus manpower at executive level. There are many
sectors where there is large amount of surplus manpower at executive level.
• The highest number of surplus manpower has been in mining sector at both executive and
below executive level. But it is very high at below executive level which also kept on
declining over the years.
• When we see the data on mining sector we find that surplus manpower is greater than the
VRS sought at below executive level. This is because of lesser opportunity available for the
workers outside that sector.
• Though there is no surplus executive found in many profit making CPSEs like SAIL, ONGC,
NHPC etc but the VRS sought by the employees at executive level has been very high
almost every year from year 2002-07. This is very important observation and it is necessary
to know what could be the reason of high VRS application in these profit making CPSEs

38
despite no surplus manpower. This might be the case of attrition occurring in those CPSEs
and also these CPSEs might be in loss making position.
• In transport and tourism sectors, which are an important part of service industry, there has
been large amount of VRS sought by the employees at executive level despite no surplus
manpower. This could be due to expansion of service sector in the private sectors which
offers the executives of CPSEs an incentive to leave the CPSEs. The private service sector,
overall, gives lucrative offer and job satisfaction to their employees.

39
5. Relation between Remuneration & Employment in CP SEs 5.0.1 In general economic theory, the relation between remuneration and employment can be
termed as positive from point of view of employees (supplier) and negative from the point of view of
employers (demander). But when it comes to CPSEs and in government organization, the general
economic theory fails especially in the case of employment at executive level. Because in this case,
the remuneration is set by the Pay Committee not by the theory of demand-supply of economics.
In the case of the CPSEs, the relation between remuneration and employment depends on whether
the CPSEs are profit making (Navratnas and Miniratnas) or Non-Navratnas and Miniratnas. The
remuneration in the CPSEs at executive level is decided by the Pay Revision Committee for some
fixed period (10 year in case of CPSEs). The last Pay Revision Committee (PRC) recommendations
were effective from 01.01.1997 and the 2nd PRC effective from 01.01.2007 after a gap of 10 years.
5.0.2 To see the relationship between remuneration and employment at executive level in the
CPSEs, we have to see the data between that very period regarding employment, recruitment and
VRS in the CPSEs.
5.0.3 For the Navratnas and Miniratnas, the general trend will be such that the employment at
executive level show upward trend initially for some time and after that it might show downward
trend. It may be because of stagnation in remuneration vis a vis private sector. Otherwise it will
always show upward trend. The VRS, in this case, might show the downward trend due to better
performance of the profit making CPSEs and lack of surplus manpower in them.
5.0.4 However, in case of the Non Navratnas and Miniratnas, the employment at executive level
might show downward trend or some fluctuations. Because in this case, there might be the case of
shedding off redundant manpower to make up the losses and due to higher remuneration which
these CPSEs might not be able to pay.
5.0.5 We’ll show this trend by analyzing the data regarding this and see whether it actually
happened or not. The data regarding this has been given below.

40
Table 5.1 Employment data for Navratnas & Miniratnas CPSEs
Navratnas and Miniratnas Companies (About 75 Companies )
Year Total
Executive Employment
Total Employment
Percentage of Exe emp- of
total employment
Total Executive
Recruitment
Total Recruitment
Percentage of Exe
recruitment of total
recruitment 2000-01 135303 964884 14.02 2430 8474 25.55 2001-02 135319 1184095 11.42 5163 11549 44.70 2002-03 141732 1199932 11.82 2004 5696 35.18 2003-04 158435 1193808 13.27 3441 6787 50.69 2004-05 189935 1175529 16.14 3374 7134 47.29 2005-06 186408 1077505 17.29 3881 8758 44.31 2006-07 206841 1152467 17.94 6340 15009 42.24 2007-08 210928 1123848 18.76 8284 25147 32.94
Year
Total Surplus Executi
ve
Total Surplus
Manpower
Percentage
of surplus exe.
of total
Executive
Sought VRS
Total VRS
sought
Percentage of Exe of total
sought VRS
Executive VRS got
Total VRS got
Percentage of Exe of total got
VRS
2000-01 488 11433 4.26 2882 13965 20.63 2772 13358 20.75 2001-02 380 12396 3.06 4311 22454 19.19 2708 18695 14.48 2002-03 286 13441 2.12 2525 15390 16.40 2362 14153 16.89 2003-04 64 17004 0.37 2217 13234 16.75 2047 12461 16.42 2004-05 108 12577 0.85 1461 8992 16.24 1260 8671 14.53 2005-06 38 7014 0.54 683 4335 15.75 485 3806 12.74 2006-07 119 8654 1.37 542 2538 21.38 311 2109 14.74 2007-08 284 1922 14.77 310 955 32.46 152 1056 14.39
Source: National Information Center, DPE

41
Executive Sought VRS
0500
100015002000250030003500400045005000
2000-01
2002 -03
2004-05
2006-07
Year
Exe
cutiv
e S
ough
t VR
S
Series1
Table 5.2 Employment data for Non-Navratnas & Non-Miniratnas CPSEs
Non-Navratnas and Miniratnas (Except 75 Companies)
Year Total
Executive Employment
Total Employment
Percentage of Exe emp- of
total employment
Total Executive
Recruitment
Total Recruitment
Percentage of Exe
recruitment of total
recruitment 2000-01 65757 775017 8.48 1627 5757 28.26 2001-02 68767 807879 8.51 931 2437 38.20 2002-03 62563 634933 9.85 486 1675 29.01 2003-04 60901 568498 10.71 614 1968 31.19 2004-05 46631 524121 8.89 524 2288 22.90 2005-06 60068 571050 10.51 914 2276 40.15 2006-07 46957 461249 10.18 1169 5228 22.36 2007-08 51784 446088 11.60 1029 4889 21.04
Executive Employment in Navratnas and Miniratnas
0
50000
100000
150000
200000
250000
2000
-01
2001
-02
2002
-03
2003
-04
2004
-05
2005
-06
2006
-07
2007
-08
Year
Exe
cutiv
e E
mpl
oym
ent
Series1
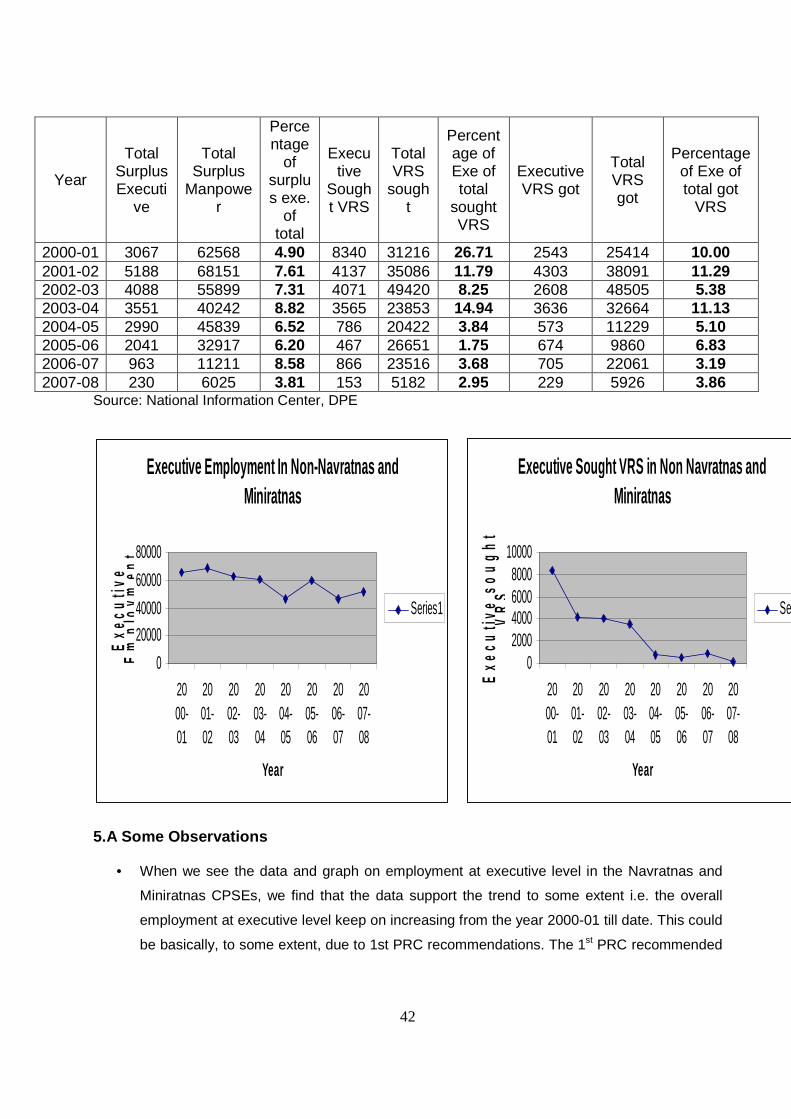
42
Year
Total Surplus Executi
ve
Total Surplus
Manpower
Percentage
of surplus exe.
of total
Executive
Sought VRS
Total VRS
sought
Percentage of Exe of total
sought VRS
Executive VRS got
Total VRS got
Percentage of Exe of total got
VRS
2000-01 3067 62568 4.90 8340 31216 26.71 2543 25414 10.00 2001-02 5188 68151 7.61 4137 35086 11.79 4303 38091 11.29 2002-03 4088 55899 7.31 4071 49420 8.25 2608 48505 5.38 2003-04 3551 40242 8.82 3565 23853 14.94 3636 32664 11.13 2004-05 2990 45839 6.52 786 20422 3.84 573 11229 5.10 2005-06 2041 32917 6.20 467 26651 1.75 674 9860 6.83 2006-07 963 11211 8.58 866 23516 3.68 705 22061 3.19 2007-08 230 6025 3.81 153 5182 2.95 229 5926 3.86
Source: National Information Center, DPE
Executive Sought VRS in Non Navratnas and Miniratnas
02000400060008000
10000
2000-01
2001-02
2002-03
2003-04
2004-05
2005-06
2006-07
2007-08
Year
Exe
cutiv
e so
ught
V
RS
Series1
5.A Some Observations
• When we see the data and graph on employment at executive level in the Navratnas and
Miniratnas CPSEs, we find that the data support the trend to some extent i.e. the overall
employment at executive level keep on increasing from the year 2000-01 till date. This could
be basically, to some extent, due to 1st PRC recommendations. The 1st PRC recommended
Executive Employment In Non-Navratnas and Miniratnas
0
20000
40000
60000
80000
2000-01
2001-02
2002-03
2003-04
2004-05
2005-06
2006-07
2007-08
Year
Exe
cutiv
e E
mpl
oym
ent
Series1

43
many lucrative offer (discussed already in chapter 2.1) which resulted into increase in
employment at executive level especially in profit making CPSEs.
• On the other hand, when we see the data and graph on employment at executive level in
the Non-Navratnas and Miniratnas CPSEs, we find that unlike the Navratnas and Miniratnas
CPSEs, the employment trend is very ambiguous showing fluctuations in the trend which
might be due to many reasons.
• The VRS trend in both types of CPSEs shows downward trend at executive level over the
years with different reasons. This indicates that due to high pay package, there would have
been more suitable recruitment of executives (talented) which resulted into overall better
performance. Such performance by the CPSEs resulted into less surplus manpower which
resulted into less executive opting for VRS. This is true in case of Navratnas and Miniratnas
CPSEs. But in the case of Non-Navratnas and Miniratnas, the reason for downward VRS
despite considerable surplus manpower might be due to inabilities of the executives to find
another job.
• With better remuneration package, the 1st PRC also recommended lucrative VRS offer,
which the CPSEs used as a tool to shed their surplus manpower. This definitely have
positive impact on the performance of the company. For example, during the period 1998-
2000, SAIL were incurring huge losses due to its surplus manpower. To get rid of their
surplus manpower, SAIL offered its employees lucrative VRS scheme which resulted into
large executive of SAIL opting for VRS in the period 2000-01 (about 1189 executive sought
VRS).
Hence, from the above observations and the data, we find that employment and the remuneration
at executive level are interrelated. If they are not related at any point of time, a new PRC may make
recommendations to make the CPSEs perform efficiently by creating conducive environment for
executives.

44
6. Future Impact & the Second Pay Revision
6.1 The Future impact of the Government’s decision on the Pay Revision, if implemented
properly, can be immense on the employment trend at the executive level in the CPSEs. The major
impact expected would be as follows:
• Attracting suitable managerial talent to the CPSEs. This was a main issue before the 2nd
PRC. Due to the lack of proper remuneration, the CPSEs were not able to attract suitable
talent at executive level. But after implementing the pay revision package, the CPSEs might
be able to attract talent in the future which will have great impact on the performance of the
CPSEs.
• Preventing attrition at senior executive level. It was told by many of the senior executives of
the CPSEs that the public sector system failed to attract any IIT or IIM graduate in any of the
CPSEs and visits to their campuses very often yielded no result which was basically due to
low remuneration in CPSEs vis a vis private sector which offers its employees attractive
salaries. This low salary level in CPSEs also explains attrition rate factors at the middle level
and higher level management. This can be prevented by the proper implementation of the
recommendation of second PRC.
• Stabilizing the performance of CPSEs after retaining the existing talent. The experience
earned by the managerial talent is invaluable for the company’s in which they contribute. If
they leave that company in the hope of better remuneration in another company, it might be
detrimental to the company’s performance.
• When there will be higher remuneration, there will be more talented executive appointed in
the CPSEs. This might boost the morale and confidence of the CPSEs. This can have
positive impact on the performance of the CPSEs.
• There will be tendency to reverse the trend in the IITs and IIMs towards CPSEs
employment. The employment in CPSEs might be preferred by the IITs and IIMs passouts
after Government’s decision on the pay revision. This, in fact, is happening in the wake of
the current economic slowdown where these talents prefer the employment in the CPSEs.
• As we know many CPSEs are facing the problem of surplus manpower. And the VRS didn’t
get rid of poorly performing executives; instead it benefited the more talented people who
after taking VRS have found lucrative jobs in private sector. Due to this, it was proposed in
the report that VRS scheme be replaced by Compulsory Retirement Scheme and
management of CPSEs should have the right to compulsorily retire surplus manpower by

45
paying adequate compensation. This scheme might improve the performance of the CPSEs
by eliminating poorly performing executives in the future.
Hence, we see that after implementation of the pay revision guidelines, the CPSEs might undergo a
considerable change in their overall performance with more talented people. Especially in the
current economic slowdown, the CPSEs are outweighting their counterpart in the private sector, as
the impact of slowdown has been very little in the CPSEs as compared to the private sectors. This
might change the attitude of the people towards CPSEs and in the current economic slowdown; the
CPSEs might emerge as a model employer.

46
7. Conclusion
By discussing the remuneration, employment and VRS policy and trend in the CPSEs at the
executive level, some conclusions can be reached regarding this.
7.1 The contribution of the CPSEs for the development of any economy is still significant even in
the presence of the large numbers of Private Sectors and MNCs, because of the welfare approach
of the Government.
7.2 To survive and make a significant contribution in the presence of competition from the
private sectors, the CPSEs have to adopt various strategies especially the strategy regarding the
employment at the executive level. Because, the right selection of the human capital (Executives) in
any organization can turnaround the performance of that very organization. Hence, to attract and
retain the talent within the CPSEs, there is a need of right approach towards the employees by the
selection committee. This has definitely been taken care by the DPE from time to time by revising
the remuneration of the executives in the CPSEs. The recent pay revision will definitely be helpful in
retaining and attracting the suitable talents in the CPSEs.
The revised pay package with its components of PRP and superannuation benefits will have the
positive impact on the employment in the CPSEs in the coming years.
7.3 The CPSEs are also characterized by the presence of huge surplus manpower at both
executive and below executive level these days. To right size the CPSEs, there has to be attractive
and lucrative VRS policy also. By the attractive and lucrative VRS policy, the CPSEs can shed their
surplus manpower and improve efficiently. The recent PRC recommendations which included
various VRS policy (already discussed) may be able to get rid of the problem of the surplus
manpower in the CPSEs.
7.5 Lastly, in the event of recent economic slowdown, the companies from the private sectors
and MNCs are cutting their workforce at every level, whereas the CPSEs are unaffected in every
aspect and keep on recruitment according to their requirement. This shows that even in the adverse
condition, the CPSEs prove themselves as a model employer which their counterpart in the Private
Sectors rarely does.
7.6 Hence, the pay revision packages approved by the Government can have a significant
positive impact in the employment of the executives in the CPSEs. This will definitely enhance
value of the CPSEs locally and globally with the help of the talented executives. This will also
improve the efficiency and productivity of the CPSEs and the economy as a whole.

47
8. References
1. “Public Enterprises Survey 2007-08”, Annual Report on the performance of CPSEs.
2. “Report of the 2nd Pay Revision Committee for the Executives of CPSEs”, Department of
Public Enterprises.
3. Om Prakash Brahmachary, “The Public Sector Today”.
4. National Information Centre (for all the data), Department of Public Enterprises.
5. www.dpe.nic.in