munich personal repec archive - uni- · pdf filemunich personal repec archive ... turkish...
TRANSCRIPT
MPRAMunich Personal RePEc Archive
Structural Change and the Efficiency ofBanking In Turkey: Does OwnershipMatter?
Ahmet Faruk Aysan and Sanli Pinar Ceyhan
Bogazici University, Center for Economics and Econometrics,Bogazici University, Department of Economics
2008
Online at http://mpra.ub.uni-muenchen.de/17849/MPRA Paper No. 17849, posted 13. October 2009 16:14 UTC
Structural Change and the Efficiency of Banking In Turkey: Does Ownership Matter?
Abstract In a period of increasing foreign bank entry, the popular question of “what does foreign bank entry bring to the Turkish banking sector?” can partly be answered with respect to the productivity effects. This paper aims to find the productivity change in the banking sector between 1990 and 2007 just before the global crisis. We are especially interested in the period beginning with 2001 after which the Turkish banking system has almost been flooded with foreign banks. Using a sample of 20 commercial banks, we attempt to find the Data Envelopment Analysis (DEA) type Malmquist Total Factor Productivity Change Index over the specified period. We also look at the source of this change decomposing this index into its mutually exclusive and exhaustive components of efficiency change and technological change. Additionally, we further decompose the technical efficiency change into pure technical efficiency change and scale efficiency change. The DEA results guide us in comparing the performances of banks of different ownership status (state, private and foreign banks) and of different size Keywords: Turkish Banking Industry, Foreign Bank Entry, Globalization of Banking, Data Envelopment Analysis, Efficiency JEL: E32, F20, F36, G0, G21
Ahmet Faruk Aysan Boğaziçi University, Department of Economics,
34342 Bebek, Istanbul, Turkey Phone: 90-212-359 76 39, Fax: 90-212-287 24 53 [email protected]
Sanli Pinar Ceyhan Tinbergen Institute, Department of Economics,
Amsterdam, Netherlands [email protected]
2
Structural Change and the Efficiency of Banking In Turkey: Does Ownership Matter?
1. Introduction The 2000 and 2001 crises are two events in the Turkish economic history with
sizable impacts on the financial system and especially on the Turkish banking
sector which occupies around three fourths of the financial system. The period
before the crises is marked by problems which were mainly caused by
macroeconomic instability reflected in high inflation numbers and a fluctuating
growth pattern of the economy. Income distribution was unfair and the informal
economy was quite large. High interest rates were keeping banks away from their
intermediation duty. The regulatory system was under the influence of political
powers, legislation was weak and many banks did not have sufficient capital to
cope with financial crises. More and more banks were founded in order to obtain
profits without much concern for the quality of the bank management (Akin et al.
2009).
These weaknesses caused many banks with insufficient capital to declare
bankruptcy. To deal with this problem, the monetary policy had to be loosened
and the exchange rate regime was switched from the crawling peg to the floating.
However, the new exchange rate regime resulted in currency depreciation which
left the banks with insufficient capital in a difficult situation. Many banks which
were not run properly had to be closed down. Hence, the banking sector needed
to be restructured and the capital base of the banks needed to be strengthened.
The trend in the banking sector was switching from “opening up more and more
banks” to “good management” in order to make profit.
After the 2001 crisis, the Turkish Banking Regulation and Supervisory Agency
(BRSA) (which was founded in Sep. 2000 after a Banking Act was passed in
June 1999) changed its main objective from supervision to restructuring and
rehabilitation (Al and Aysan, 2006). The May 2001 Rehabilitation Program
carried out by the BRSA was aimed at strengthening the private banks1,
1 Through strengthening, private banks would comply with the international reporting and prudential standards and improve their capital adequacy ratios.
3
restructuring the state banks which constitute a large part of the Turkish banking
sector, resolving the banks taken over by Saving and Deposit Insurance Fund
(SDIF) and increasing the quality of supervision in the banking sector. This
program helped state banks stop being a significant reason of ‘liquidity risk’ for
the markets (Steinherr et.al., 2004).This restructuring and the liquidation of the
sector by the SDIF decreased the costs in the banking sector thanks to alternative
delivery channels such as internet and telephone banking, and this is reflected as
higher profitability and productivity in the sector. Moreover, the number of
branches and personnel decreased due to mergers and acquisitions following the
crises such that the number of banks in the sector decreased from 59 banks in
2002 to 46 at the end of 2007 (TBA, Dec.2007).
The 2001 crisis also increased the desire of foreign banks to take over Turkish
banks cheaply and make profits. In fact, foreign banks were the only group of
banks that made profits during September 2000-December 2001 period and were
the ones with the highest interest margin. After the crisis, Turkey experienced a
great amount of foreign bank entry. Some of the reasons of foreign bank entry are
the increasing population and per capita income, reforms carried out in the
investment environment, improving macroeconomic performance of the Turkish
economy and the birth of the mortgage sector. Furthermore, it is now easier to
enter into the Turkish market; corporate governance system is improving and
there is better auditing and regulation in the banking system. However, the most
important reason remains to be the high growth potential of the Turkish banking
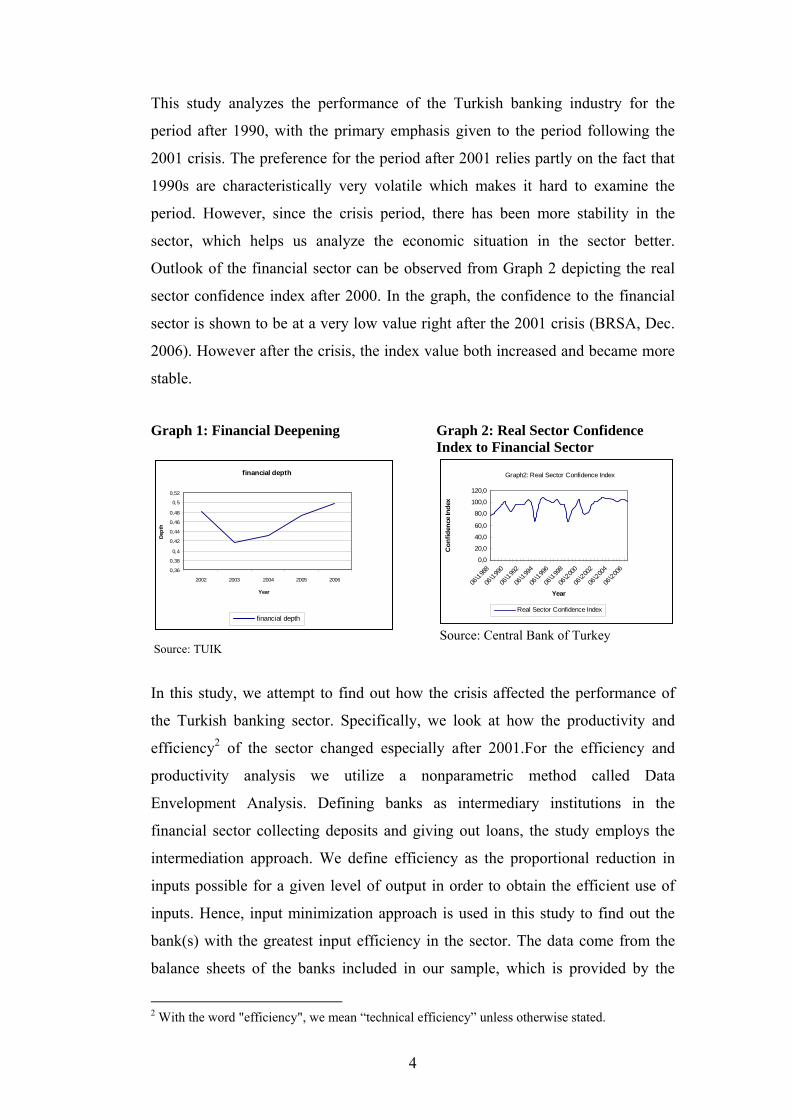
sector. This can be observed from the fact that the depth of the financial sector
increased considerably after the crises period (Graph 1). Moreover, the asset size
of the banking sector increased from YTL 171.9 billion in 2001 to YTL 768.6
billion in 2007 reaching 75.7 % of the financial sector. Profits of the sector also
increased from YTL 2.90 billion in 2002 to YTL 14.8 billion in 2007 (BRSA,
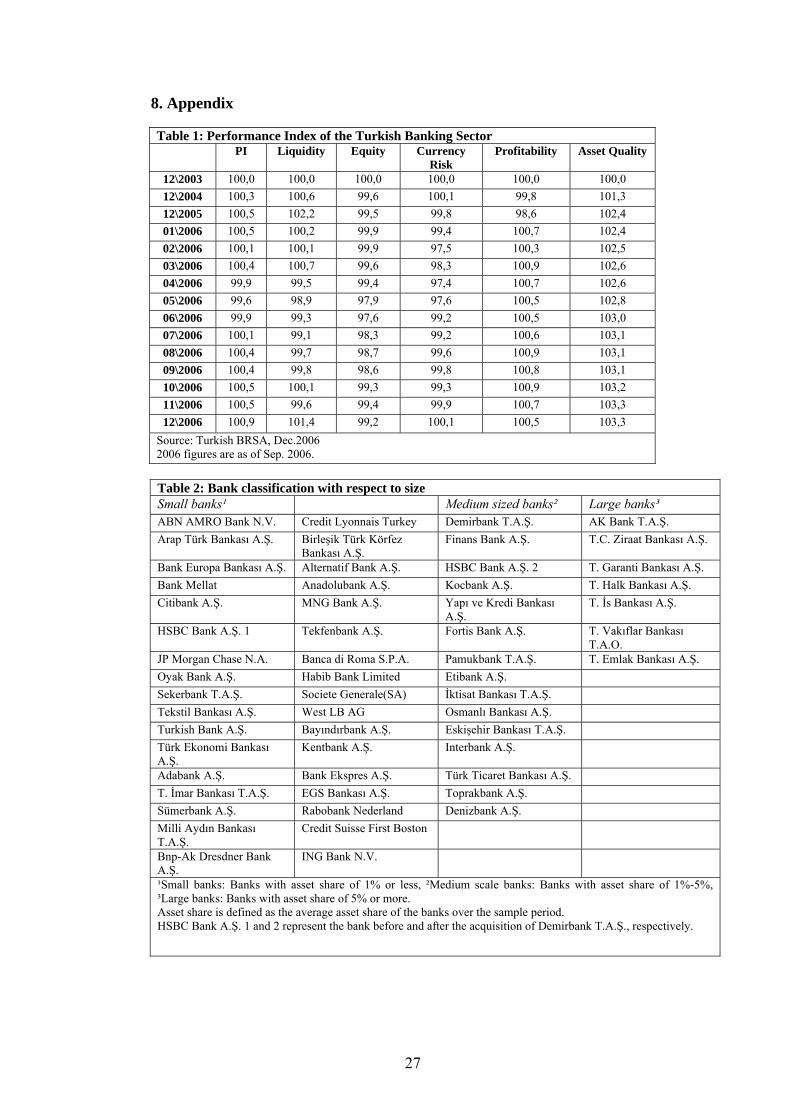
Dec. 2007). Table 1 shows some performance indices for the Turkish baking
sector between 2003 and 2006. It can be seen that while the currency risk does
not show much improvement, profitability, liquidity and asset quality of the
sector improved over the period.
4
This study analyzes the performance of the Turkish banking industry for the
period after 1990, with the primary emphasis given to the period following the
2001 crisis. The preference for the period after 2001 relies partly on the fact that
1990s are characteristically very volatile which makes it hard to examine the
period. However, since the crisis period, there has been more stability in the
sector, which helps us analyze the economic situation in the sector better.
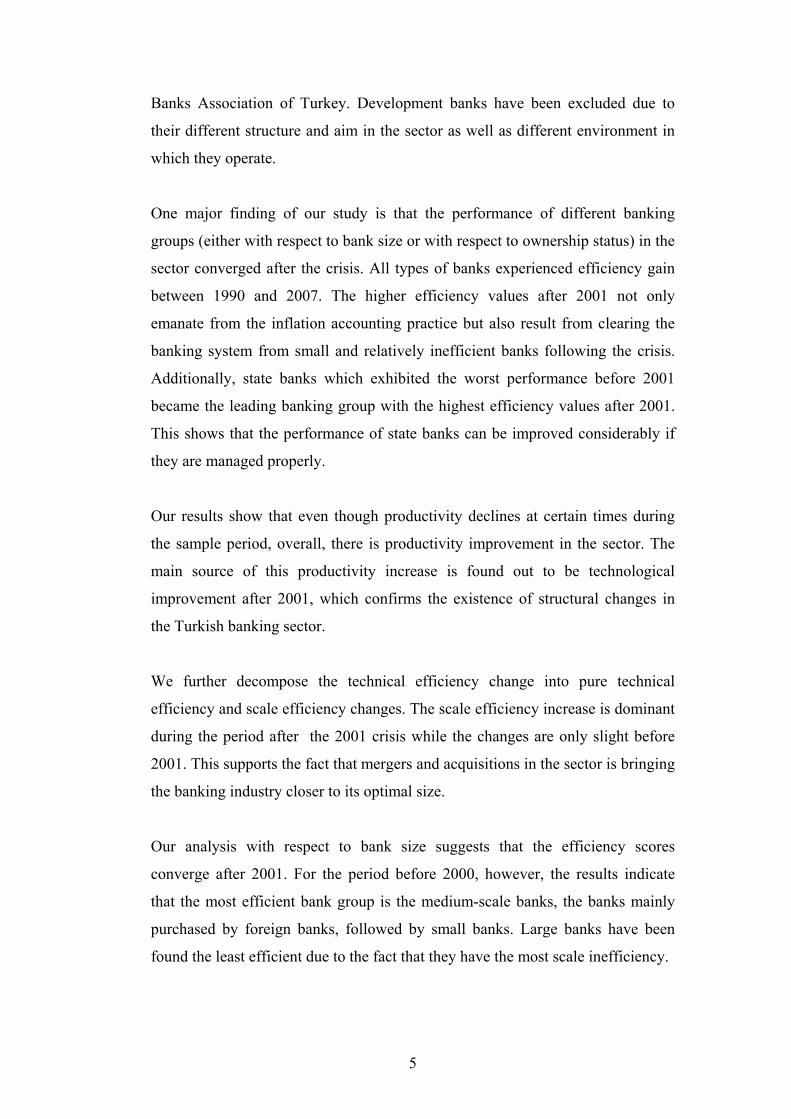
Outlook of the financial sector can be observed from Graph 2 depicting the real
sector confidence index after 2000. In the graph, the confidence to the financial
sector is shown to be at a very low value right after the 2001 crisis (BRSA, Dec.
2006). However after the crisis, the index value both increased and became more
stable.
Graph 1: Financial Deepening
financial depth
0,36
0,38
0,4
0,42
0,44
0,46
0,48
0,5
0,52
2002 2003 2004 2005 2006
Year
Dept
h
financial depth
Source: TUIK
Graph 2: Real Sector Confidence Index to Financial Sector
Graph2: Real Sector Confidence Index
0,0
20,0
40,0
60,0
80,0
100,0
120,0
06\198
8
06\199
0
06\199
2
06\199
4
06\199
6
06\199
8
06\200
0
06\200
2
06\200
4
06\200
6
Year
Con
fiden
ce In
dex
Real Sector Confidence Index
Source: Central Bank of Turkey
In this study, we attempt to find out how the crisis affected the performance of
the Turkish banking sector. Specifically, we look at how the productivity and
efficiency2 of the sector changed especially after 2001.For the efficiency and
productivity analysis we utilize a nonparametric method called Data
Envelopment Analysis. Defining banks as intermediary institutions in the
financial sector collecting deposits and giving out loans, the study employs the
intermediation approach. We define efficiency as the proportional reduction in
inputs possible for a given level of output in order to obtain the efficient use of
inputs. Hence, input minimization approach is used in this study to find out the
bank(s) with the greatest input efficiency in the sector. The data come from the
balance sheets of the banks included in our sample, which is provided by the
2 With the word "efficiency", we mean “technical efficiency” unless otherwise stated.
5
Banks Association of Turkey. Development banks have been excluded due to
their different structure and aim in the sector as well as different environment in
which they operate.
One major finding of our study is that the performance of different banking
groups (either with respect to bank size or with respect to ownership status) in the
sector converged after the crisis. All types of banks experienced efficiency gain
between 1990 and 2007. The higher efficiency values after 2001 not only
emanate from the inflation accounting practice but also result from clearing the
banking system from small and relatively inefficient banks following the crisis.
Additionally, state banks which exhibited the worst performance before 2001
became the leading banking group with the highest efficiency values after 2001.
This shows that the performance of state banks can be improved considerably if
they are managed properly.
Our results show that even though productivity declines at certain times during
the sample period, overall, there is productivity improvement in the sector. The
main source of this productivity increase is found out to be technological
improvement after 2001, which confirms the existence of structural changes in
the Turkish banking sector.
We further decompose the technical efficiency change into pure technical
efficiency and scale efficiency changes. The scale efficiency increase is dominant
during the period after the 2001 crisis while the changes are only slight before
2001. This supports the fact that mergers and acquisitions in the sector is bringing
the banking industry closer to its optimal size.
Our analysis with respect to bank size suggests that the efficiency scores
converge after 2001. For the period before 2000, however, the results indicate
that the most efficient bank group is the medium-scale banks, the banks mainly
purchased by foreign banks, followed by small banks. Large banks have been
found the least efficient due to the fact that they have the most scale inefficiency.
6
The plan of this paper is as follows. The following section gives a brief
introduction to the related literature. The third and the forth sections explain the
methodology and the data used. The fifth section gives the results together with
the underlying reasons, and the last section concludes.
2. Efficiency and Productivity Measurement For The Banking Industry
In the efficiency literature, there exist a considerable number of studies with the
aim of finding the performance change of economic units over a certain period of
time. Many of these examine the efficiency and productivity changes in the
banking sector following deregulation, privatization or an economic crisis.
Zaim (1995) analyzes the effects of liberalization on the performance of the
Turkish banks in terms of efficiency. However, it does not study the effects on
productivity nor does it give the decomposition of this change. The results
indicate that the Turkish banks became more efficient during the post-
liberalization era.
Isık and Hassan (2003b) later classify the source of productivity changes as
efficiency change and/ or technological change during the 1992-1996 period.
This study shows that DEA methodology could be utilized to analyze the
performance of banks in transition countries. One finding is that following the
1994 crisis, productivity declined mainly due to technological regress, the most
affected banking group being the foreign banks. They also look at the relationship
between productivity, bank size and crisis, and conclude that large banks were
affected the least from the crisis. In Isık and Hassan (2003a), the analysis is
divided into two, one using the off-balance sheet items and the other not. Both
groups of results indicate that the banking sector experienced productivity growth
resulting not from technological improvement, but from efficiency increase,
which, in turn, is mainly driven by the better resource management rather than
the scale improvement. They find that it was foreign banks followed by private
ones whose performance improved the most after the deregulation although the
performances of public and private banks converged during the period.
7
Green et al. (2003) and Naaborg (2003) are other studies analyzing the bank
performance in the Central and Eastern Europe in the late 1990s. Green et al. find
that, foreign banks are not significantly more efficient than domestic banks, either
in terms of cost advantage or in terms of economies of scale/scope. However,
Naaborg suggests that in spite of the superiority of foreign banks in terms of
profitability, there is convergence in the performances.
Another study for the transition countries is Bonin et al. (2005) which examines
the effect of ownership on bank efficiency over the period 1996-2000 using
stochastic frontier estimation procedure. They find that government owned banks
are not significantly less efficient than privately held banks, and that foreign
owned banks are more cost efficient than other banks and provide better service.
They suggest, therefore, that privatization on its own is not sufficient to enhance
the efficiency of the banking sector. However, in the Gilbert and Wilson (1998)
study, which analyze the effects of deregulation and privatization on the
productivity of Korean banking sector in the late 1980s, the productivity values
are found to have increased during this period. They suggest the reason as Korean
banks’ altering their input & output mix during this period.
Isık and Hassan (2002) examine the input and output efficiencies in the Turkish
banking industry for the period 1988-1996, and attempt to find a relationship
between variables of size, ownership, control and governance and variables of
profit, cost, allocative, technical, pure technical and scale efficiency. The
intermediation approach is used in this study which is the first nonparametric
efficiency study that takes the off-balance sheet items into account. The results
from the DEA analysis indicate that the cost and profit efficiencies of the banking
industry increased over time. The main reason of inefficiency is found out to be
the technical inefficiency rather than the allocative inefficiencies. They find that
the production efficiency in the industry fell over time, and that bank size and
efficiency are negatively correlated. Private banks are found to be more efficient
than public banks. Moreover, banks where the board and the management are
independent are more efficient than banks where they are not. Furthermore, banks
that operate under a holding company are found to be more efficient than the
independent banks.
8
Yıldırım (2002) studies the efficiency of the Turkish commercial banks during
the period 1988-1999. This study looks at the technical and scale efficiencies of
the banks using the DEA methodology. Scale efficiency, which is the main
source of inefficiency, and pure technical efficiency are found out to be very
volatile during the period when there was instability in the Turkish economy.
Moreover, efficient banks are found to be more profitable, and bank size is
positively related to pure technical and scale efficiencies.
Kasman (2002) examine the cost and scale efficiencies, and technological
improvement in the Turkish banking sector over the period 1988-1998 using
Fourier-flexible cost function. One finding is that the banking sector was
inefficient in spite of the increase in efficiency. However, the sector is found out
to be scale efficient, and there was technological improvement during 1988-1991
while technological regress during 1992-1998.
Gamal and Inanoglu (2005) analyze the efficiency of the Turkish banking sector
during the 1990-2000 period using a parametric technique and suggest that
although state banks are efficient in terms of generating loans, they are inefficient
in the sense of labor utilization, which is one reason behind the idea of
privatization. Another finding of the paper is that special finance houses are
relatively more efficient than conventional domestic banks.
A similar study for the same period of time is conducted by Özkan-Günay and
Tektas (2006) utilizing the nonparametric DEA methodology. The study reveals
that the number of efficient banks in the sector and the mean efficiency values for
different groups of banks declined over time. Moreover, they also look at the
sensitivity of the efficiency values to the choice of outputs. The effects of crises
are more obvious if output variables are defined as income rather than as
deposits, loans and securities portfolio. In this study, the sample period is
restricted to 1990-2001 due to data insufficiency, and the state banks are
excluded from the study. Our study attempts to fill in this gap in the literature by
analyzing the performance of commercial (private, state and foreign) banks in
9
Turkey between 1990 and 20073. We are especially interested in the time period
beginning with 2001 during which the Turkish banking system passed through a
radical structural change.
3. Methodology
Performance evaluation is a significant part of the management process that
provides firms with invaluable feedback for the ongoing operations, and helps
them keep competitive. One method in performance evaluation to measure
productivity is the ratio analysis. However, each ratio reflects the performance of
a firm with respect to a specific area of activity, and thus becomes inappropriate
for the banking industry which uses multiple inputs and multiple outputs.
Moreover, in evaluating performance using the optimization methods, the
estimation of the efficient frontier requires that we know the relationship among
different efficiency measures, which is usually not possible. However, one can
also estimate the efficient frontier empirically by using observations from the
firms, i.e. Decision Making Units (DMU), whose performances are to be
evaluated (Zhu, 2003).
There exist, therefore, two approaches in the estimation of frontier: (i) parametric
(stochastic frontier) methods, (ii) nonparametric (linear programming) methods.
In parametric methods, a certain form for the production function has to be
assumed, formulating the relationship of the efficient level of outputs to the level
of inputs. However, in nonparametric methods, no assumptions have to be made
to determine the form of the production function, but the frontier can be estimated
empirically using the input and output observations (Yıldırım, 2002). In
parametric approaches it is assumed that a single estimated regression line applies
to all the observations. However, in nonparametric approaches, each DMU is
analyzed separately and has its own efficiency value relative to the whole sample
3 Özkan-Günay and Tektas (2006) use personnel expenses, administrative expenses, and interest expenses from the Income Statement as inputs. The financial statement items most affected by the inflation accounting adjustment are the ones from the Income Statement and the “shareholder’s equity and securities portfolio” items from the Balance Sheet. Therefore, as opposed to Özkan-Günay and Tektas (2006), , we could use the unadjusted 2005 and 2006 numbers as well as the 2001-2004 adjusted numbers thanks to our definition of inputs as “labor, capital and loanable funds” and the low inflation rates during this period.
10
(Jemric and Vujcic, 2007). Among other advantages of using nonparametric
techniques is that they can easily work with production functions with multiple
inputs and multiple outputs and with Variable Returns to Scale. Moreover, they
can give the technical and scale efficiencies as well as the source of the scale
efficiency without using input prices (Fukuyama, 1993; Favero and Papi, 1995).
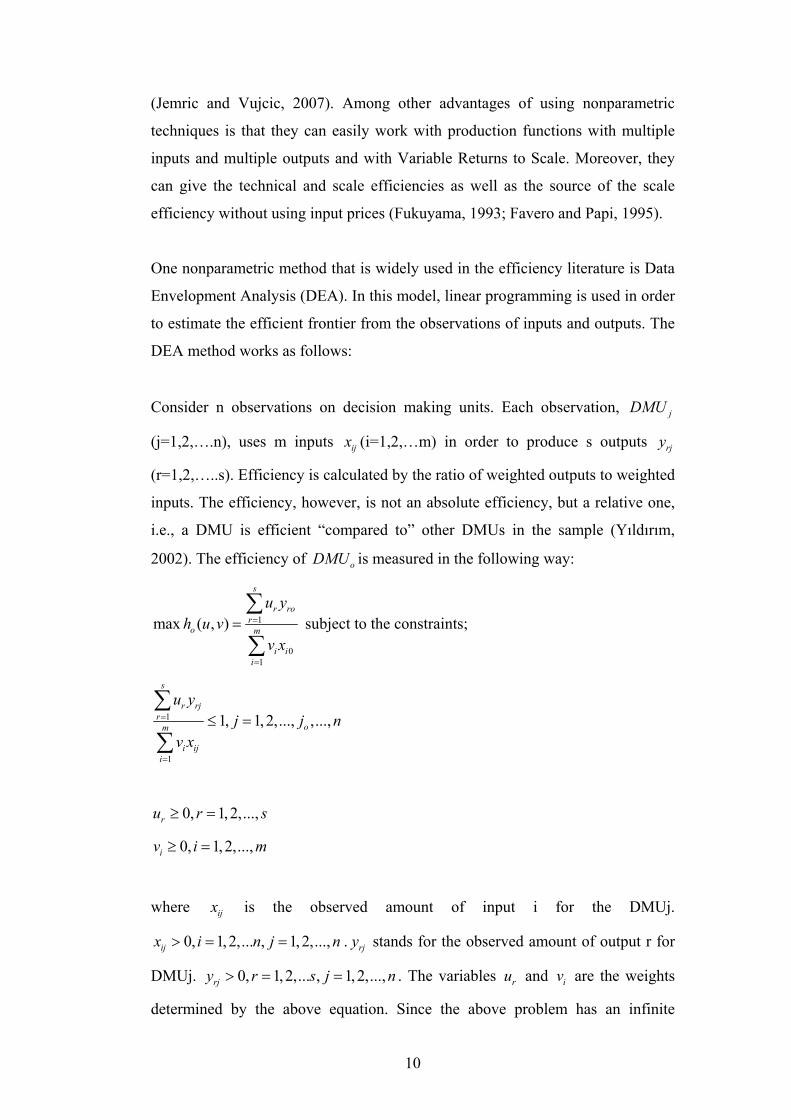
One nonparametric method that is widely used in the efficiency literature is Data
Envelopment Analysis (DEA). In this model, linear programming is used in order
to estimate the efficient frontier from the observations of inputs and outputs. The
DEA method works as follows:
Consider n observations on decision making units. Each observation, jDMU
(j=1,2,….n), uses m inputs ijx (i=1,2,…m) in order to produce s outputs rjy
(r=1,2,…..s). Efficiency is calculated by the ratio of weighted outputs to weighted
inputs. The efficiency, however, is not an absolute efficiency, but a relative one,
i.e., a DMU is efficient “compared to” other DMUs in the sample (Yıldırım,
2002). The efficiency of oDMU is measured in the following way:
1
01
max ( , )
s
r ror
o m
i ii
u yh u v
v x
=
=
=∑
∑ subject to the constraints;
1
1
1, 1, 2,..., ,...,
s
r rjr
om
i iji
u yj j n
v x
=
=
≤ =∑
∑
0, 1, 2,...,ru r s≥ =
0, 1, 2,...,iv i m≥ =
where ijx is the observed amount of input i for the DMUj.
0, 1,2,... , 1, 2,...,ijx i n j n> = = . rjy stands for the observed amount of output r for
DMUj. 0, 1,2,... , 1, 2,...,rjy r s j n> = = . The variables ru and iv are the weights
determined by the above equation. Since the above problem has an infinite
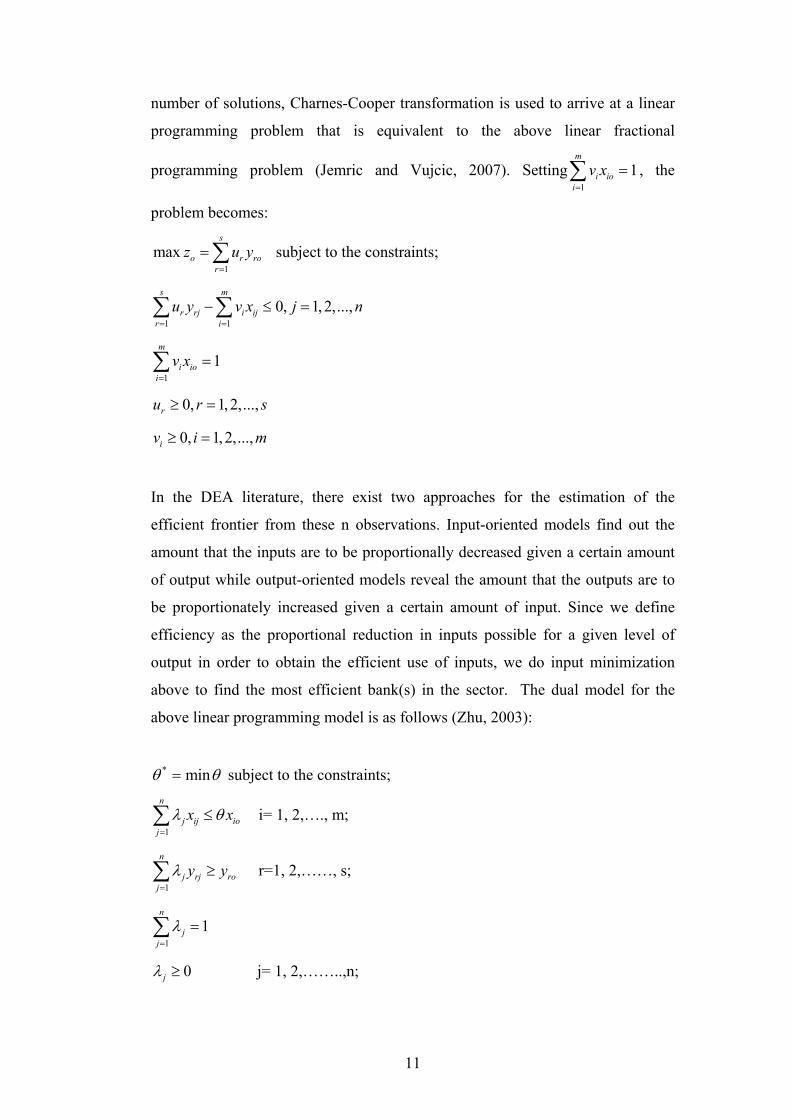
11
number of solutions, Charnes-Cooper transformation is used to arrive at a linear
programming problem that is equivalent to the above linear fractional
programming problem (Jemric and Vujcic, 2007). Setting1
1m
i ioi
v x=
=∑ , the
problem becomes:
1max
s
o r ror
z u y=
=∑ subject to the constraints;
1 10, 1, 2,...,
s m
r rj i ijr i
u y v x j n= =
− ≤ =∑ ∑
1
1m
i ioi
v x=
=∑
0, 1, 2,...,ru r s≥ =
0, 1, 2,...,iv i m≥ =
In the DEA literature, there exist two approaches for the estimation of the
efficient frontier from these n observations. Input-oriented models find out the
amount that the inputs are to be proportionally decreased given a certain amount
of output while output-oriented models reveal the amount that the outputs are to
be proportionately increased given a certain amount of input. Since we define
efficiency as the proportional reduction in inputs possible for a given level of
output in order to obtain the efficient use of inputs, we do input minimization
above to find the most efficient bank(s) in the sector. The dual model for the
above linear programming model is as follows (Zhu, 2003):
* minθ θ= subject to the constraints;
1
n
j ij ioj
x xλ θ=
≤∑ i= 1, 2,…., m;
1
n
j rj roj
y yλ=
≥∑ r=1, 2,……, s;
1
1n
jj
λ=
=∑
0jλ ≥ j= 1, 2,……..,n;
12
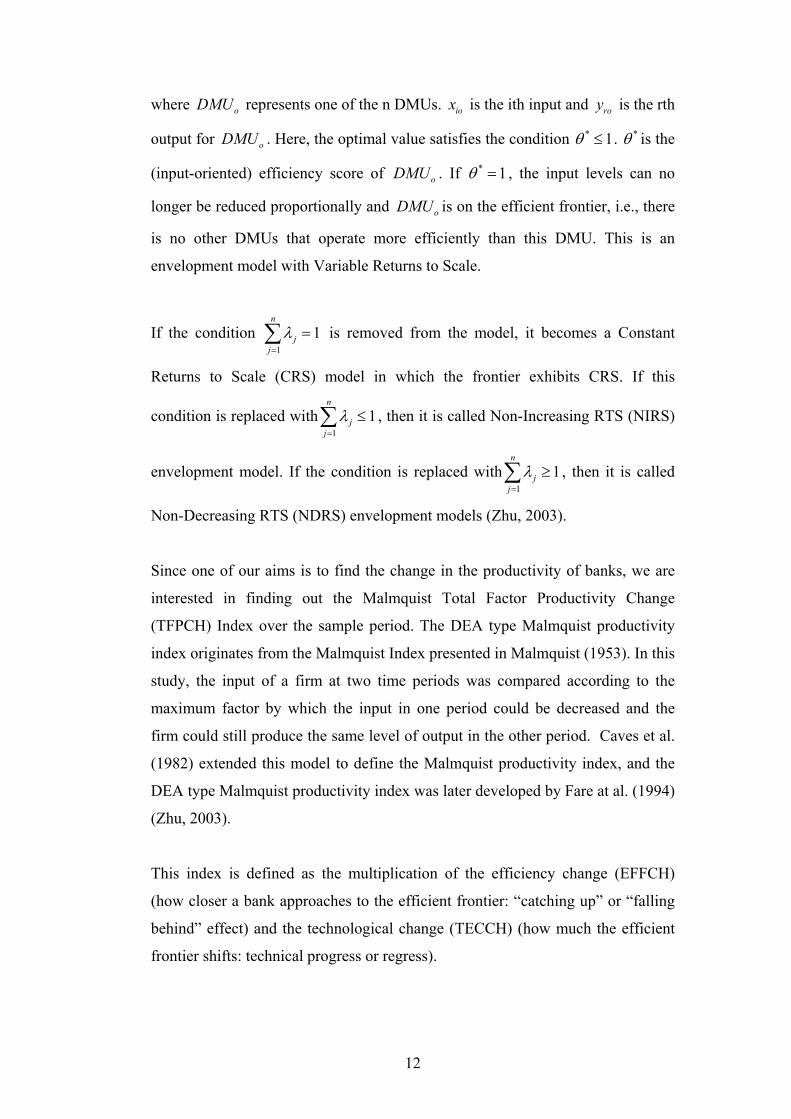
where oDMU represents one of the n DMUs. iox is the ith input and roy is the rth
output for oDMU . Here, the optimal value satisfies the condition * 1θ ≤ . *θ is the
(input-oriented) efficiency score of oDMU . If * 1θ = , the input levels can no
longer be reduced proportionally and oDMU is on the efficient frontier, i.e., there
is no other DMUs that operate more efficiently than this DMU. This is an
envelopment model with Variable Returns to Scale.
If the condition 1
1n
jj
λ=
=∑ is removed from the model, it becomes a Constant
Returns to Scale (CRS) model in which the frontier exhibits CRS. If this
condition is replaced with1
1n
jjλ
=
≤∑ , then it is called Non-Increasing RTS (NIRS)
envelopment model. If the condition is replaced with1
1n
jj
λ=
≥∑ , then it is called
Non-Decreasing RTS (NDRS) envelopment models (Zhu, 2003).
Since one of our aims is to find the change in the productivity of banks, we are
interested in finding out the Malmquist Total Factor Productivity Change
(TFPCH) Index over the sample period. The DEA type Malmquist productivity
index originates from the Malmquist Index presented in Malmquist (1953). In this
study, the input of a firm at two time periods was compared according to the
maximum factor by which the input in one period could be decreased and the
firm could still produce the same level of output in the other period. Caves et al.
(1982) extended this model to define the Malmquist productivity index, and the
DEA type Malmquist productivity index was later developed by Fare at al. (1994)
(Zhu, 2003).
This index is defined as the multiplication of the efficiency change (EFFCH)
(how closer a bank approaches to the efficient frontier: “catching up” or “falling
behind” effect) and the technological change (TECCH) (how much the efficient
frontier shifts: technical progress or regress).
13
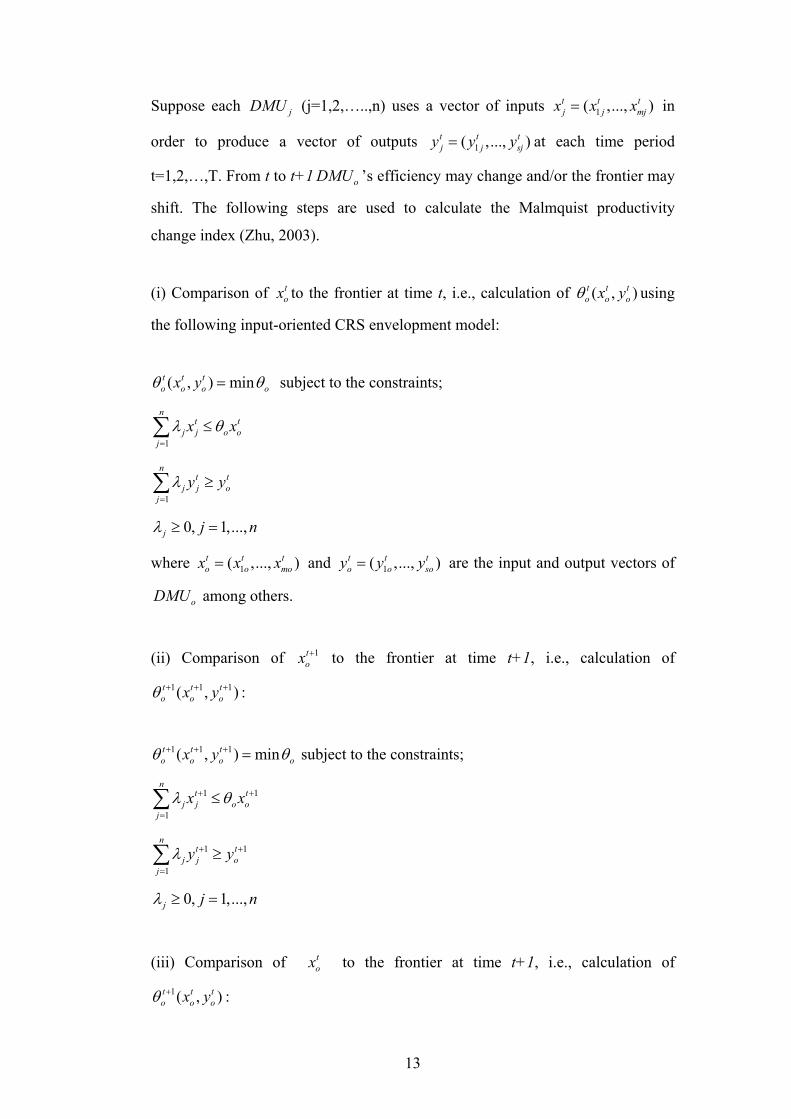
Suppose each jDMU (j=1,2,…..,n) uses a vector of inputs 1( ,..., )t t tj j mjx x x= in
order to produce a vector of outputs 1( ,..., )t t tj j sjy y y= at each time period
t=1,2,…,T. From t to t+1 oDMU ’s efficiency may change and/or the frontier may
shift. The following steps are used to calculate the Malmquist productivity
change index (Zhu, 2003).
(i) Comparison of tox to the frontier at time t, i.e., calculation of ( , )t t t
o o ox yθ using
the following input-oriented CRS envelopment model:
( , ) mint t to o o ox yθ θ= subject to the constraints;
1
nt t
j j o oj
x xλ θ=
≤∑
1
nt t
j j oj
y yλ=
≥∑
0, 1,...,j j nλ ≥ =
where 1( ,..., )t t to o mox x x= and 1( ,..., )t t t
o o soy y y= are the input and output vectors of
oDMU among others.
(ii) Comparison of 1tox + to the frontier at time t+1, i.e., calculation of
1 1 1( , )t t to o ox yθ + + + :
1 1 1( , ) mint t t
o o o ox yθ θ+ + + = subject to the constraints;
1 1
1
nt t
j j o oj
x xλ θ+ +
=
≤∑
1 1
1
nt t
j j oj
y yλ + +
=
≥∑
0, 1,...,j j nλ ≥ =
(iii) Comparison of tox to the frontier at time t+1, i.e., calculation of
1( , )t t to o ox yθ + :
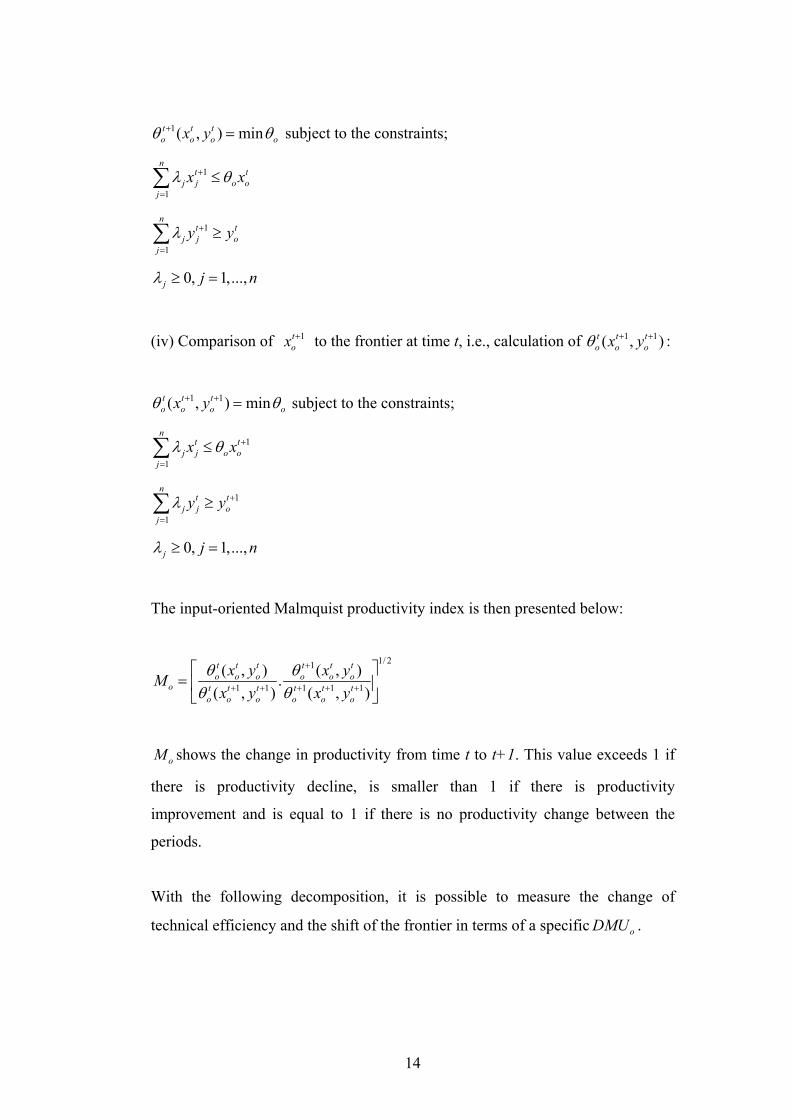
14
1( , ) mint t t
o o o ox yθ θ+ = subject to the constraints;
1
1
nt t
j j o oj
x xλ θ+
=
≤∑
1
1
nt t
j j oj
y yλ +
=
≥∑
0, 1,...,j j nλ ≥ =
(iv) Comparison of 1tox + to the frontier at time t, i.e., calculation of 1 1( , )t t t
o o ox yθ + + :
1 1( , ) mint t t
o o o ox yθ θ+ + = subject to the constraints;
1
1
nt t
j j o oj
x xλ θ +
=
≤∑
1
1
nt t
j j oj
y yλ +
=
≥∑
0, 1,...,j j nλ ≥ =
The input-oriented Malmquist productivity index is then presented below:
1/ 21
1 1 1 1 1
( , ) ( , ).( , ) ( , )
t t t t t to o o o o o
o t t t t t to o o o o o
x y x yMx y x y
θ θθ θ
+
+ + + + +
⎡ ⎤= ⎢ ⎥⎣ ⎦
oM shows the change in productivity from time t to t+1. This value exceeds 1 if
there is productivity decline, is smaller than 1 if there is productivity
improvement and is equal to 1 if there is no productivity change between the
periods.
With the following decomposition, it is possible to measure the change of
technical efficiency and the shift of the frontier in terms of a specific oDMU .
15
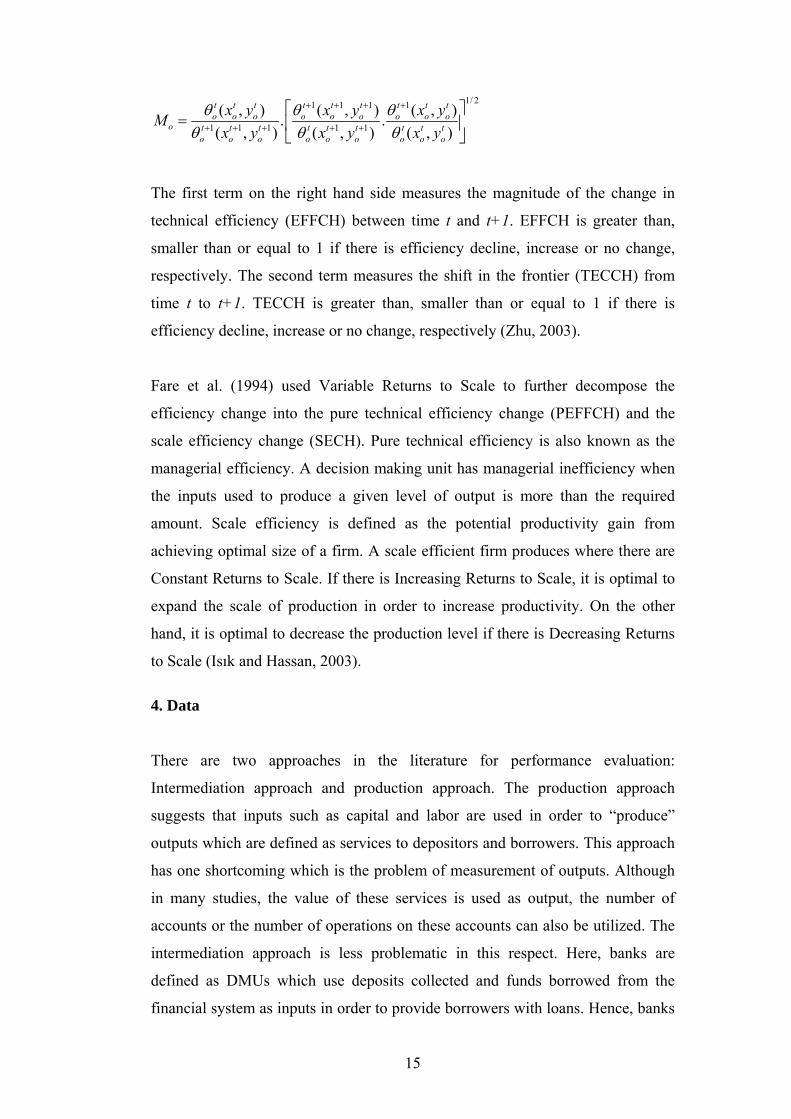
1/ 21 1 1 1
1 1 1 1 1
( , ) ( , ) ( , ). .( , ) ( , ) ( , )
t t t t t t t t to o o o o o o o o
o t t t t t t t t to o o o o o o o o
x y x y x yMx y x y x y
θ θ θθ θ θ
+ + + +
+ + + + +
⎡ ⎤= ⎢ ⎥
⎣ ⎦
The first term on the right hand side measures the magnitude of the change in
technical efficiency (EFFCH) between time t and t+1. EFFCH is greater than,
smaller than or equal to 1 if there is efficiency decline, increase or no change,
respectively. The second term measures the shift in the frontier (TECCH) from
time t to t+1. TECCH is greater than, smaller than or equal to 1 if there is
efficiency decline, increase or no change, respectively (Zhu, 2003).
Fare et al. (1994) used Variable Returns to Scale to further decompose the
efficiency change into the pure technical efficiency change (PEFFCH) and the
scale efficiency change (SECH). Pure technical efficiency is also known as the
managerial efficiency. A decision making unit has managerial inefficiency when
the inputs used to produce a given level of output is more than the required
amount. Scale efficiency is defined as the potential productivity gain from
achieving optimal size of a firm. A scale efficient firm produces where there are
Constant Returns to Scale. If there is Increasing Returns to Scale, it is optimal to
expand the scale of production in order to increase productivity. On the other
hand, it is optimal to decrease the production level if there is Decreasing Returns
to Scale (Isık and Hassan, 2003).
4. Data
There are two approaches in the literature for performance evaluation:
Intermediation approach and production approach. The production approach
suggests that inputs such as capital and labor are used in order to “produce”
outputs which are defined as services to depositors and borrowers. This approach
has one shortcoming which is the problem of measurement of outputs. Although
in many studies, the value of these services is used as output, the number of
accounts or the number of operations on these accounts can also be utilized. The
intermediation approach is less problematic in this respect. Here, banks are
defined as DMUs which use deposits collected and funds borrowed from the
financial system as inputs in order to provide borrowers with loans. Hence, banks

16
are financial institutions that compete in the market for loans and deposits aiming
to make profits from converting deposits into loans (Isık and Reda, 2006; Tarım,
2001).
Production approach is generally used in studies which aim to find the cost
efficiency of banks while the intermediation approach is preferred when the total
cost of the whole banking sector and the competitive power of banks are
concerned. Accordingly, we use the intermediation approach like many other
efficiency studies in the literature (Tarım, 2001; Zaim, 1995; Isık and Hassan,
2003, Isık and Reda, 2006).
The inputs and outputs used in this study are as listed below4:
Inputs:
1. Labor
2. Capital
3. Loanable Funds
Labor is defined as the number of full time employees on the payroll while
capital is the property and equipment. Loanable funds is the sum of deposits,
funds borrowed and marketable securities issued.
Outputs:
1. Short term credits
2. Long term credits
3. Off-balance sheet items
4. Other earning assets
Short- and long-term credits are defined as loans with less than and more than a
maturity of one year, respectively. Off-balance sheet items are the sum of
guarantees and warranties (letters of guarantee, bank acceptance, letters of credit,
guaranteed pre-financing, endorsements and others), commitments, foreign 4 Except for labor, the inputs and outputs used in this study are in nominal terms.
17
exchange and interest rate transactions as well as other off-balance sheet items.
Other earning assets include money market securities, banks and other financial
institutions, investments held to maturity, securities available for sale, securities
held for trading.
The data come from the bank balance sheets published by the Banks Association
of Turkey (BAT). The sample includes all the banks in Turkey except for the
development and investment banks because of their different function5 as well as
their small market shares6 in the banking industry. We also exclude banks with
insufficient report of data. Since the period 1990-2000 is one of the most volatile
periods in the history of Turkish banking, the number of banks included in this
study varies throughout the sample period. Another reason of changing bank
numbers is the unavailability of data for some sample years. Sümerbank was
privatized in October 1995. This is the reason of the drop by one bank in the
number of state banks and increase by one bank in the number of private banks in
1996. Etibank was privatized in December 1997 for the second time, and this is
the reason of the decrease by one bank in the number of state banks and increase
by one bank in the number of private banks in 1998. Moreover, as of July 2005,
Turk Dıs Ticaret Bankasi A.S. changed status from private commercial banks to
foreign banks after the acquisition by Fortis of 89.34% of this bank, and thus the
number of private banks fell by one while the number of foreign banks increased
by one.
5. Empirical Results
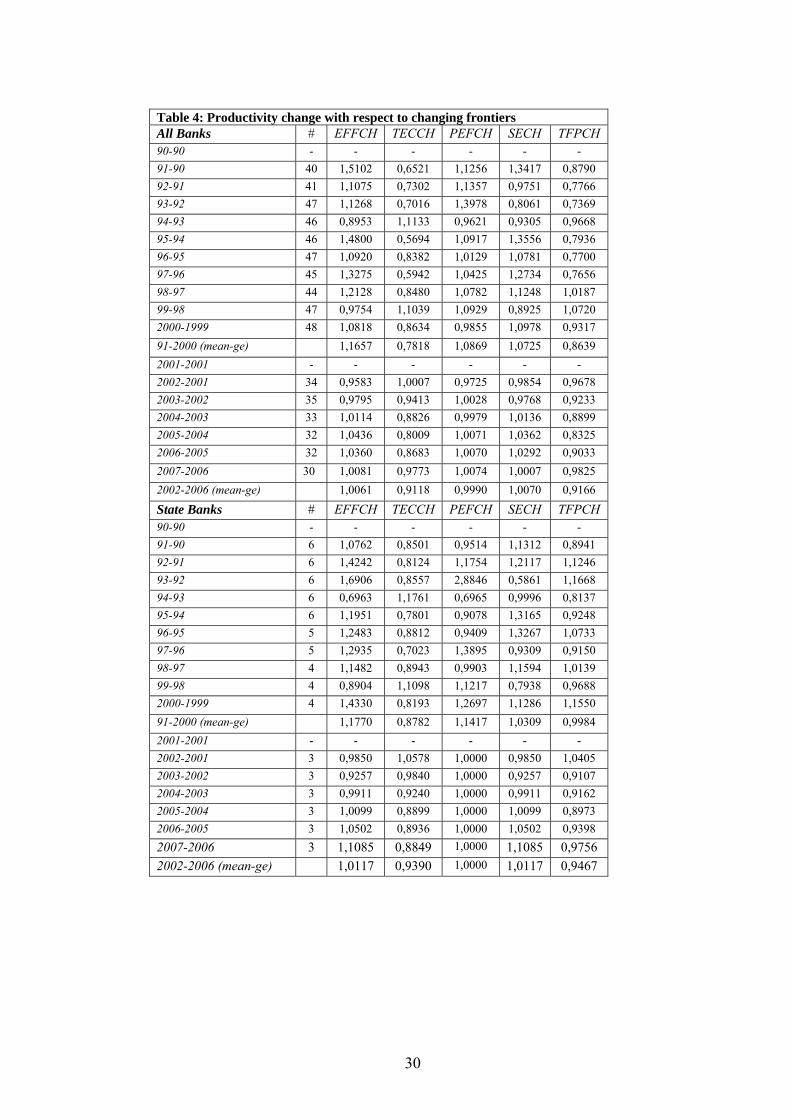
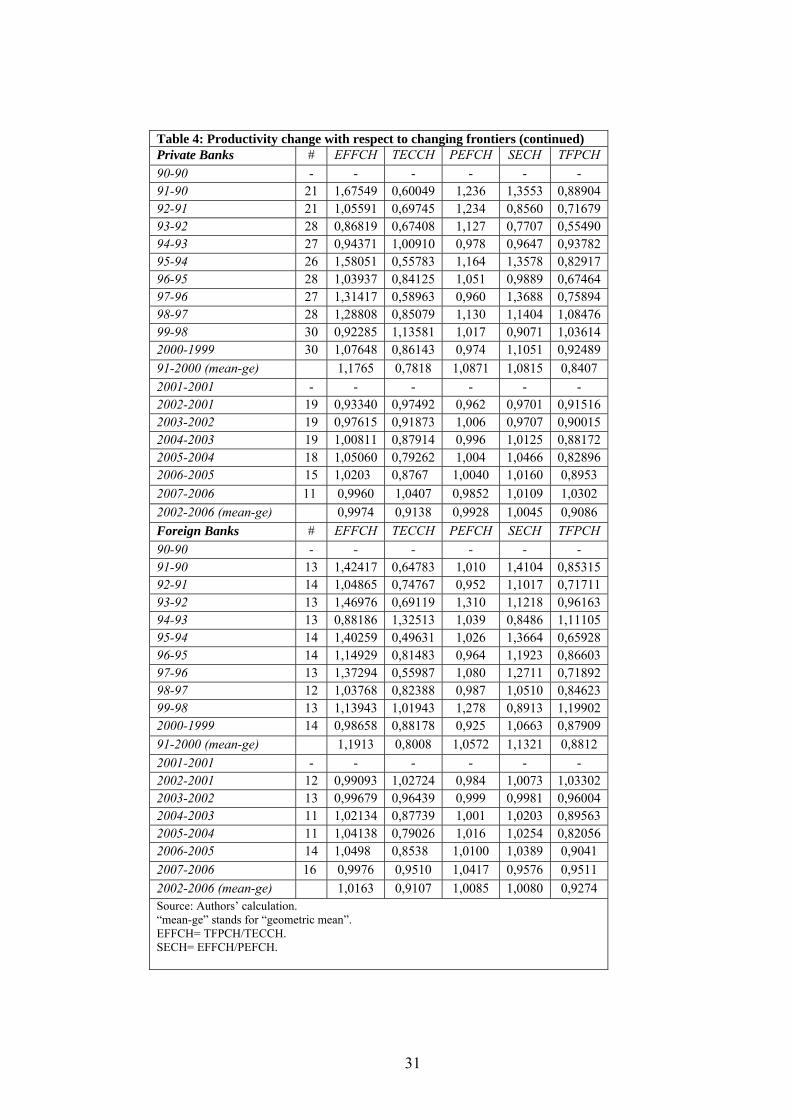
We have examined the productivity change in the banking sector not only with
respect to fixed time periods7, but also with respect to changing frontiers8
5Development and investment banks do not collect deposits. Instead, investment banks focus on corporate finance, foreign exchange, mergers and initial public offerings while development banks provide medium term finance to the industry and give government funds to the sectors with priority for the government. (Etkin et al., 2000) 6Development and investment banks constitute around 3.1 % of the banking sector in 2009. 7We take 1990 as the base year for the period before 2000, inclusive, for which there is no inflation accounting adjustment and take 2001 for the period after 2001 for which the data are adjusted according to inflation accounting. We have to divide our sample as such in order to deal with the problem of inconsistency between these two groups of data. 8 The base year for each period of analysis is the previous year.
18
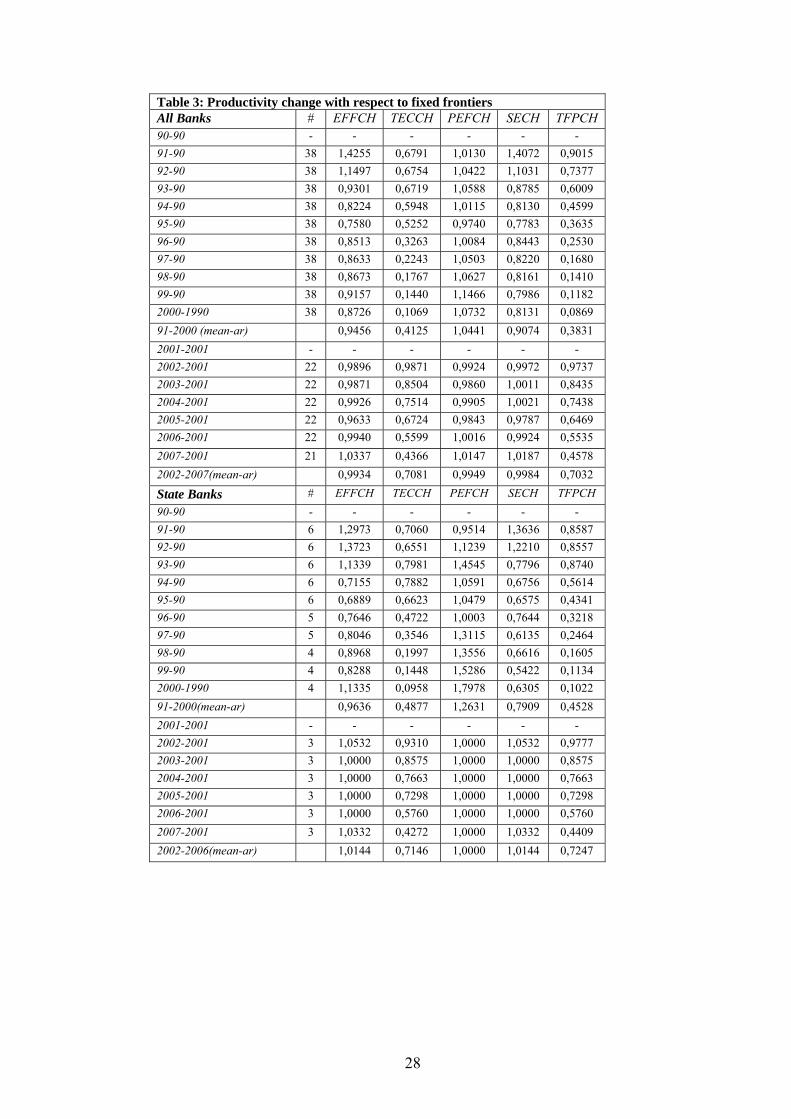
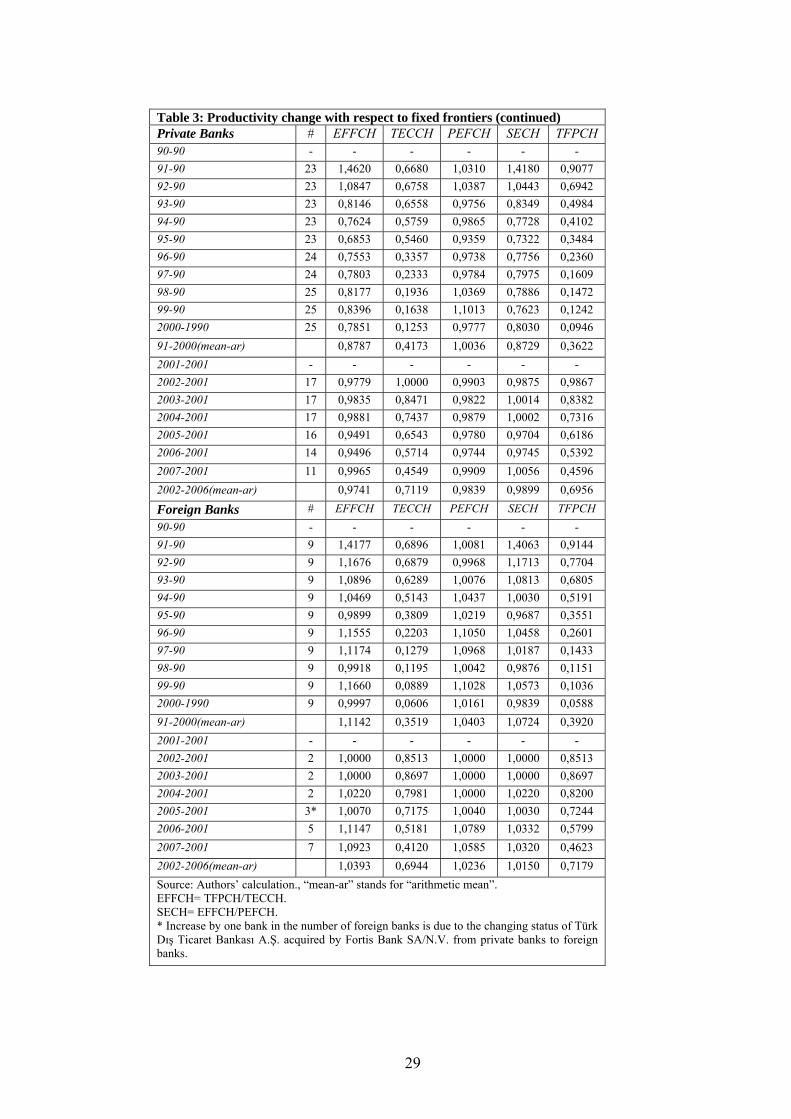
(Tables 3 & 4, respectively). Our results indicate that with respect to both 1990
and 2001, there has been productivity improvement in the sector overall, and also
for each banking group. The only exception comes from the private bank group
which showed a slight performance deterioration the year after the 2001 crisis.
For this post-crisis year, state banks showed a slight improvement. However, a
bigger improvement comes from the foreign banking group since foreign banks
are not as much affected by the crisis in the host country as domestic banks
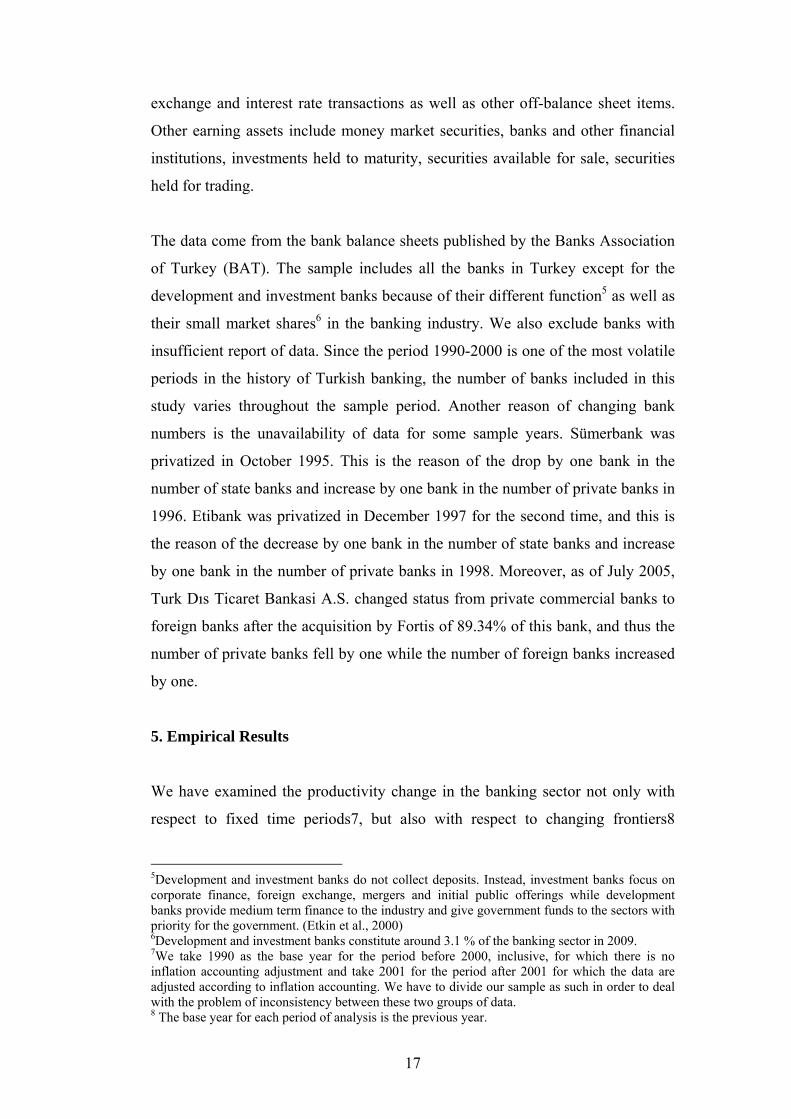
(Tschoegl, 2003). Our analysis with respect to “changing frontiers” can be seen in
Graph 3. It shows that except for the periods 1998 and 1999, the overall banking
sector experienced productivity increase9. Moreover, the number of years of
productivity decline is the biggest for the state banks. This shows that state banks
are more volatile than both private and foreign banks in terms of performance
(Table 4). Furthermore, the reason of different behaviors (productivity decline)
in 1998 and 1999 is found out to be the choice of reference points (fixed vs.
changing)10. In summary, we conclude that even though there may be
productivity declines between two successive periods, overall, there is
productivity improvement in the sector.
Graph 3: Malmquist Index with respect to Bank Ownership
The numbers we have found above do not speak much on their own. We also
need to look at the source of this change decomposing the TFPCH Index into its
mutually exclusive and exhaustive components of efficiency change and
technological change (Table 3). The results show that the productivity increases
were a composition of technological improvement and efficiency increase except 9According to our definition of the Malmquist index, values smaller than 1 indicate productivity improvement. 10The result follows from the fact that both the fixed- and changing-frontier analysis using time the same banks reveal similar results: improvement in all years in the fixed frontier analysis vs. improvement in all years but 1998 and 1999 in the changing frontier analysis.
00.20.40.60.8
11.21.4
90-9092-9194-9396-9598-972000-992002-012004-032006-05
Year
Malmquist Index
All State Private Foreign
19
for the years 1991 and 1992, in which the increases resulted solely from
technology improvement. Similarly, after 2000, the productivity increase was
solely due to technological improvement. These observations pronounce one
more time the existence of structural changes in the Turkish banking sector
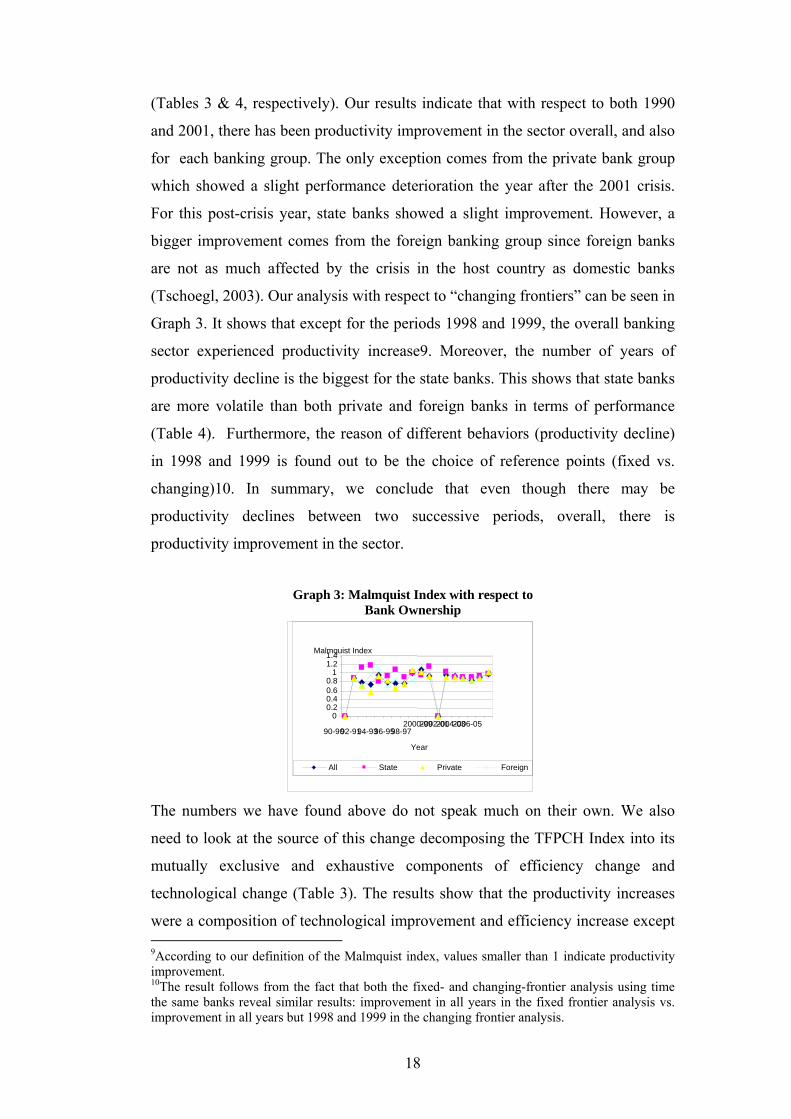
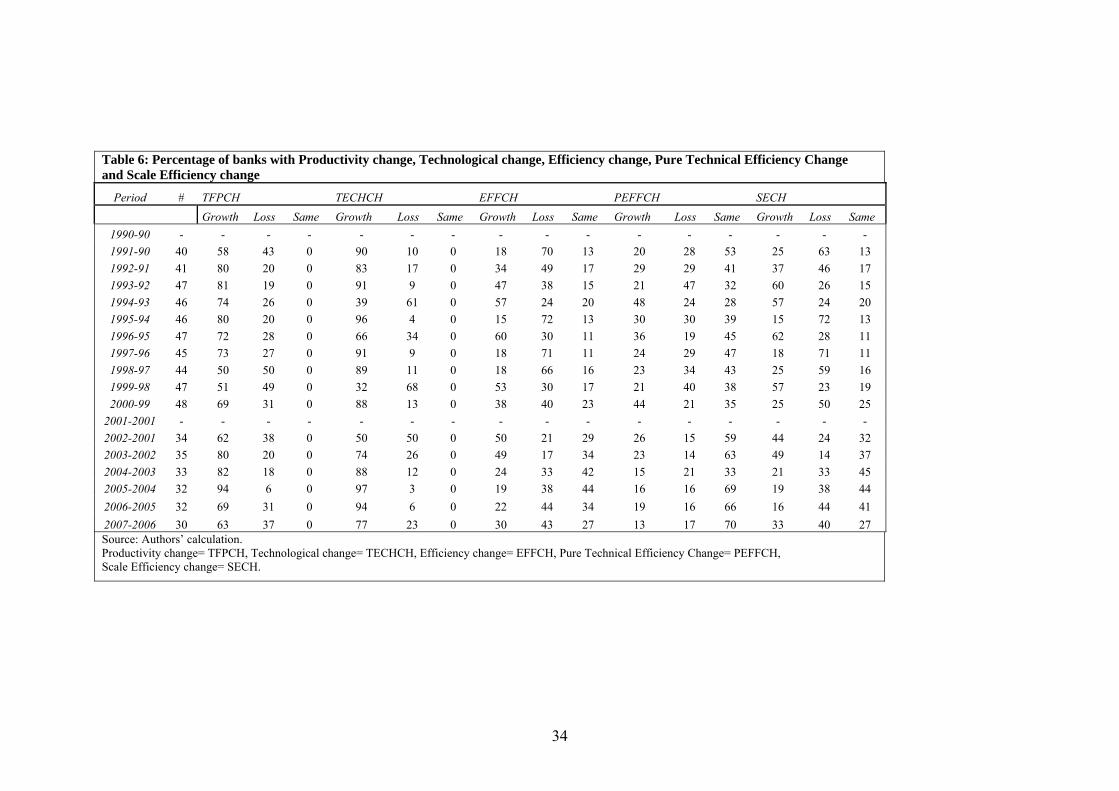
leading to this technological improvement. Graph 4 supports this argument
depicting the percentages of banks experiencing productivity growth,
technological growth and efficiency increase. It reveals that over time, more than
half of the banks showed productivity increase, and more than half experienced
technological improvement (Table 6).
Graph 4: Percentage of Banks with Productivity, Technology or Efficiency Increase
As an additional analysis, we decompose the technical efficiency change into its
components of pure technical efficiency and scale efficiency changes. From the
data, we observe that the scale efficiency increase is dominant during the period
before the 2001 crisis (Table 3). This result supports the fact that mergers and
acquisitions in the sector was bringing the banking industry to its optimal size.
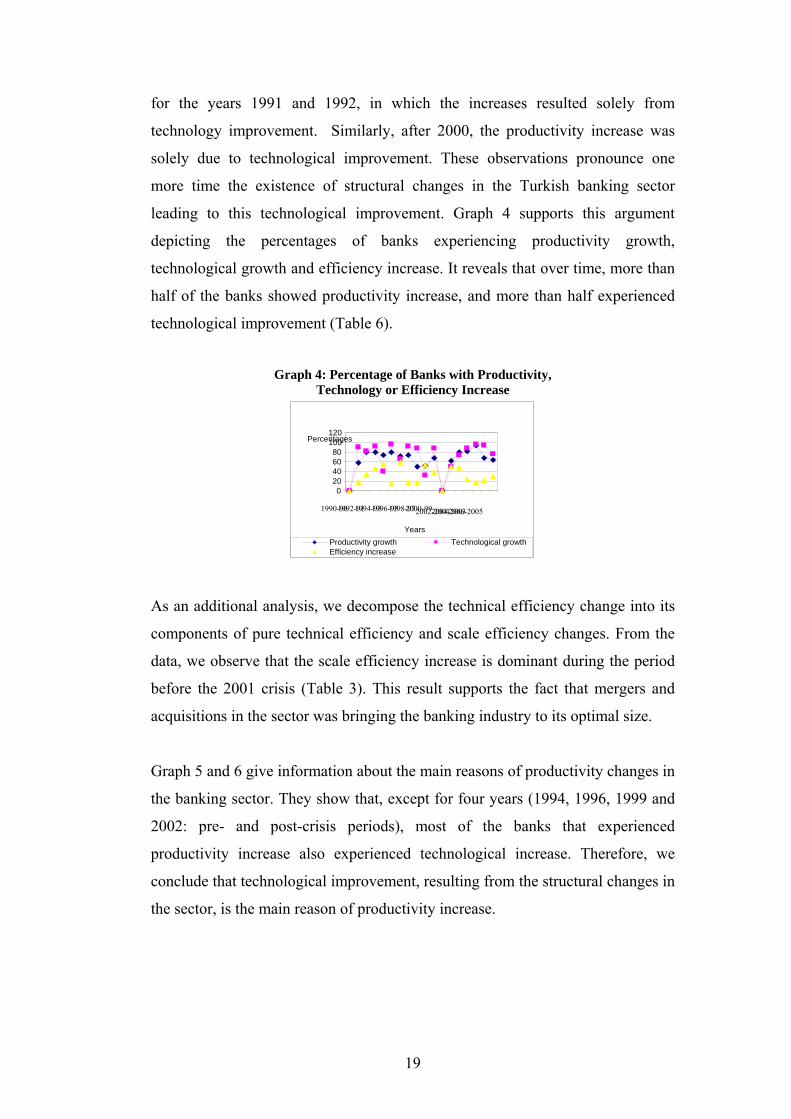
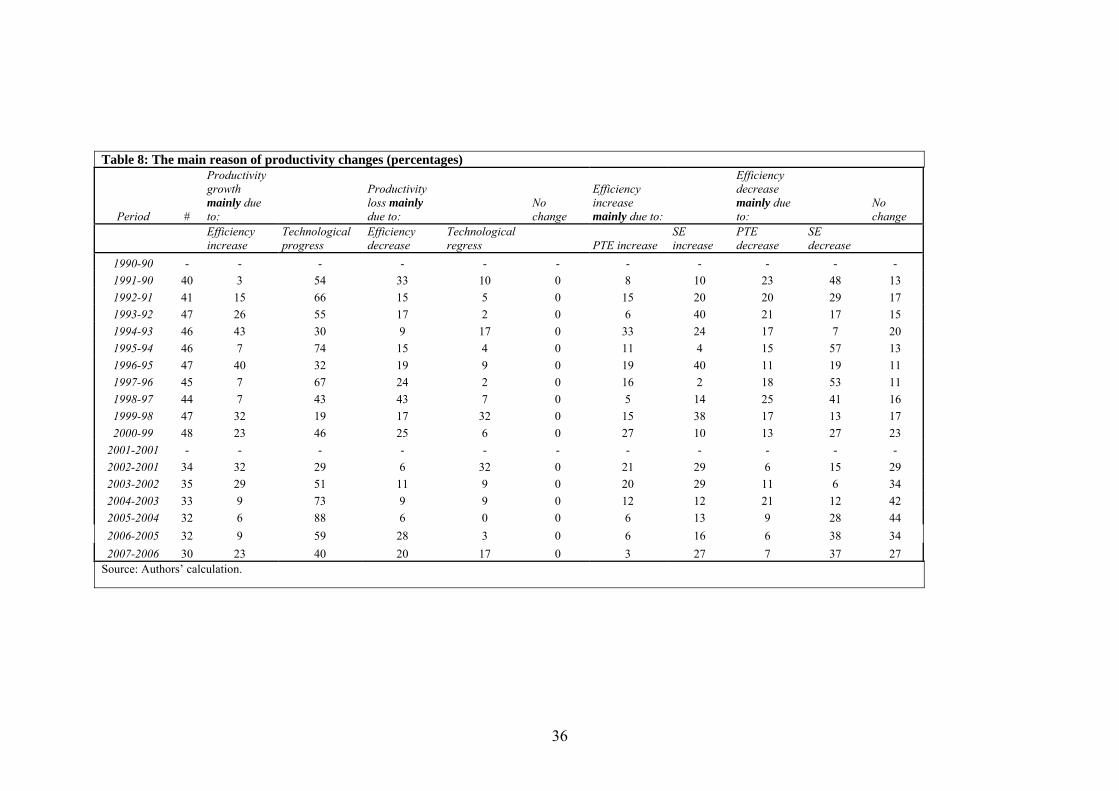
Graph 5 and 6 give information about the main reasons of productivity changes in
the banking sector. They show that, except for four years (1994, 1996, 1999 and
2002: pre- and post-crisis periods), most of the banks that experienced
productivity increase also experienced technological increase. Therefore, we
conclude that technological improvement, resulting from the structural changes in
the sector, is the main reason of productivity increase.
020406080
100120
1990-901992-911994-931996-951998-972000-992002-20012004-20032006-2005
Years
Percentages
Productivity growth Technological growthEfficiency increase
20
Graph 5: Decomposition of Productivity Growth
020406080
100
1990
-90
1992
-91
1994
-93
1996
-95
1998
-97
2000
-99
2002
-2001
2004
-2003
2006
-2005
Years
Perc
enta
ge
Efficiency increase Technological improvement
Graph 6: Decomposition of Productivity Decline
0
10
2030
40
50
1990
-90
1992
-91
1994
-93
1996
-95
1998
-97
2000
-99
2002
-2001
2004
-2003
2006
-2005
Years
Perc
enta
ge
Efficiency decrease Technological regress
The results are just the opposite with respect to the decline in productivity. We
conclude that the main reason behind productivity decline comes from the
efficiency side rather than technological deterioration which is in line with the
implicit assumption that technology does improve rather than regress over time.
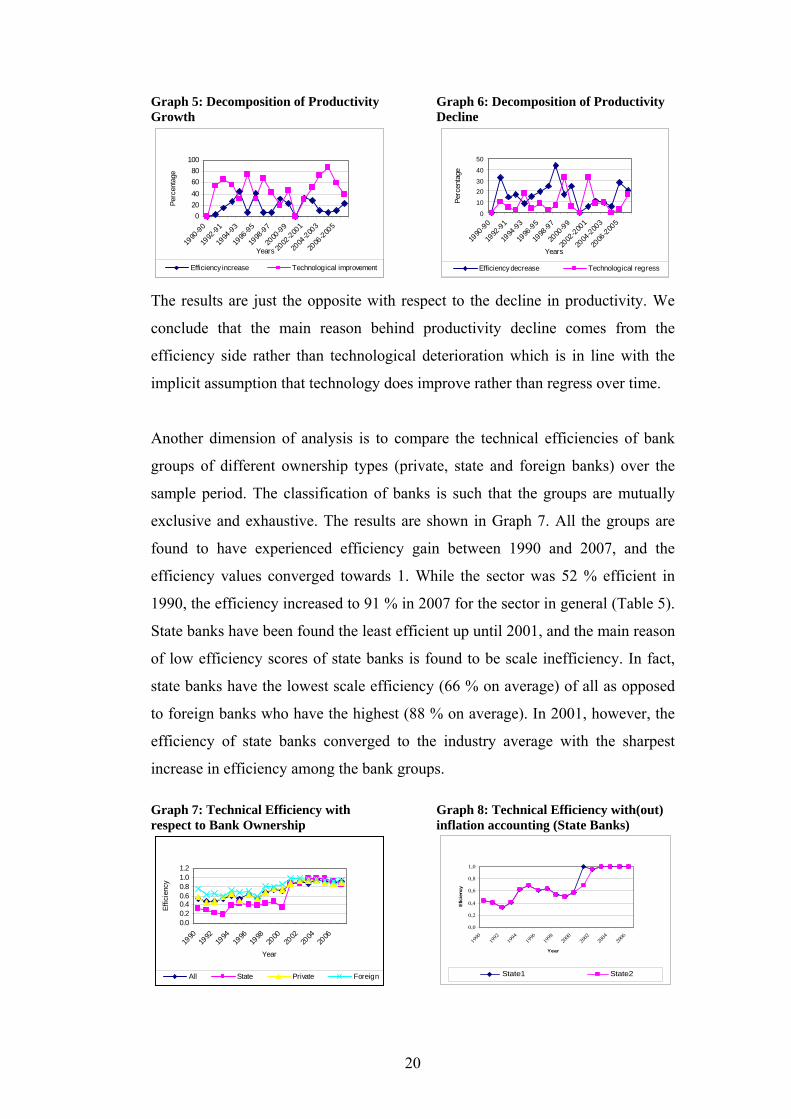
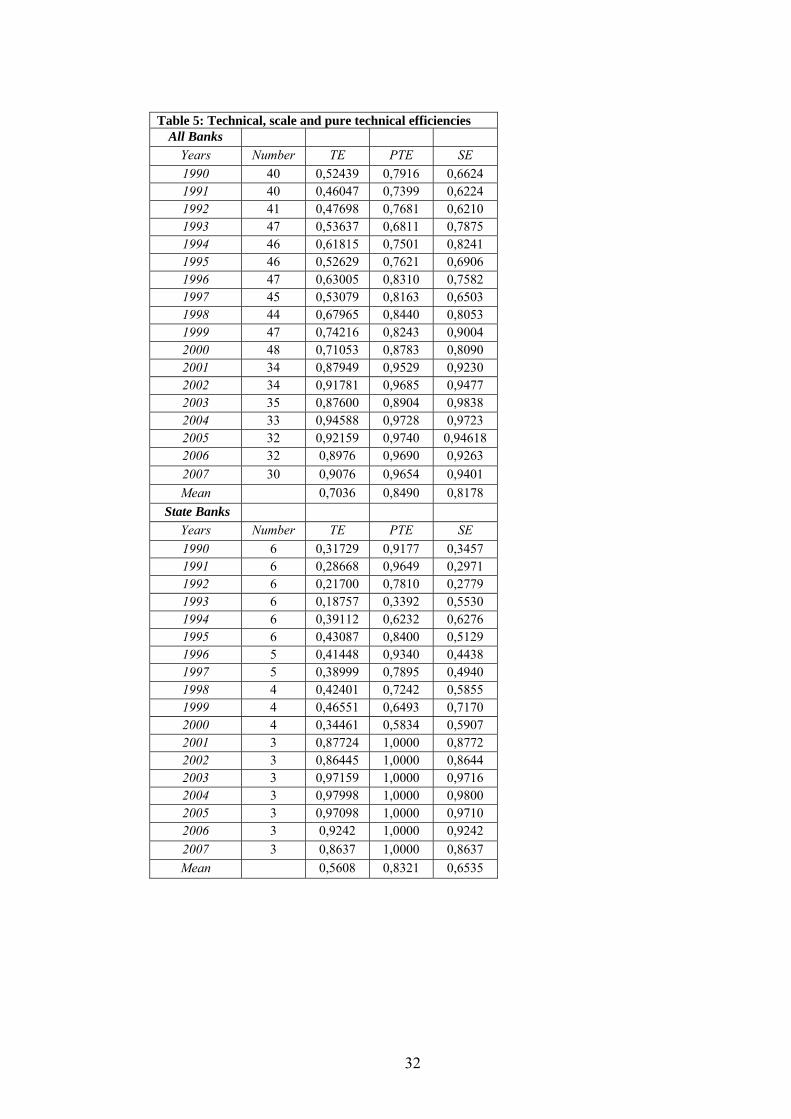
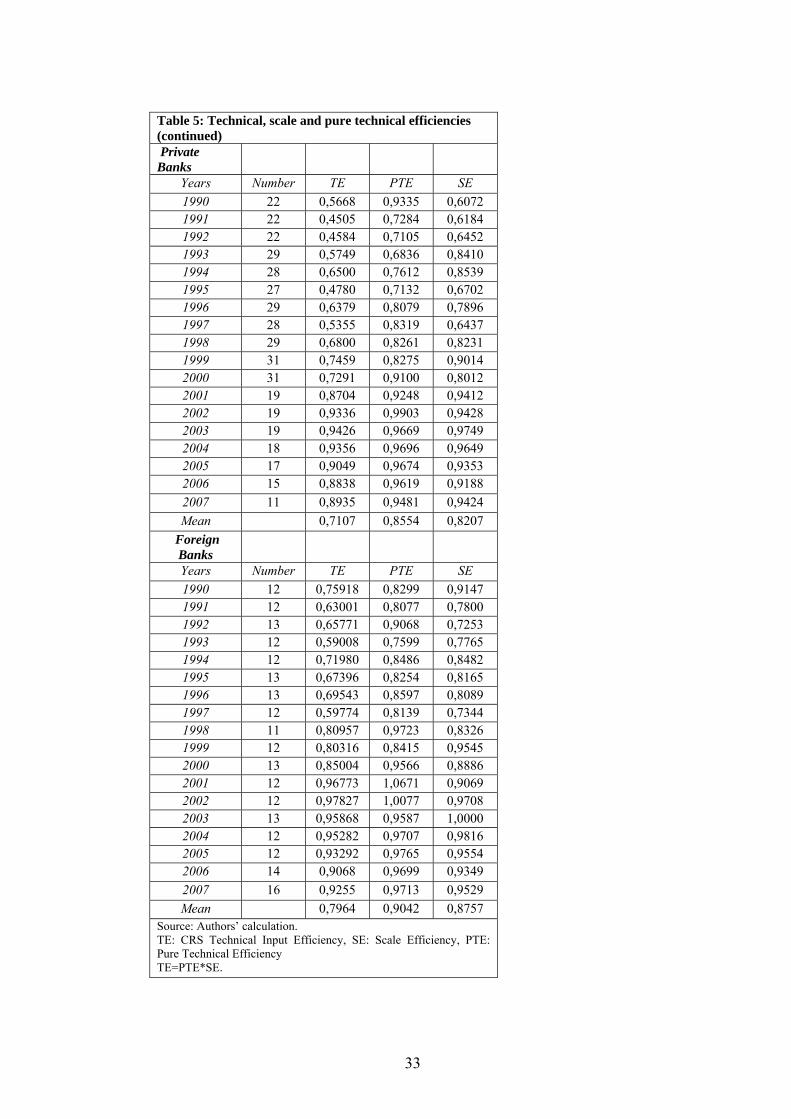
Another dimension of analysis is to compare the technical efficiencies of bank
groups of different ownership types (private, state and foreign banks) over the
sample period. The classification of banks is such that the groups are mutually
exclusive and exhaustive. The results are shown in Graph 7. All the groups are
found to have experienced efficiency gain between 1990 and 2007, and the
efficiency values converged towards 1. While the sector was 52 % efficient in
1990, the efficiency increased to 91 % in 2007 for the sector in general (Table 5).
State banks have been found the least efficient up until 2001, and the main reason
of low efficiency scores of state banks is found to be scale inefficiency. In fact,
state banks have the lowest scale efficiency (66 % on average) of all as opposed
to foreign banks who have the highest (88 % on average). In 2001, however, the
efficiency of state banks converged to the industry average with the sharpest
increase in efficiency among the bank groups. Graph 7: Technical Efficiency with respect to Bank Ownership
0.00.20.40.60.81.01.2
1990
1992
1994
1996
1998
2000
2002
2004
2006
Year
Effic
ienc
y
All State Private Foreign
Graph 8: Technical Efficiency with(out) inflation accounting (State Banks)
0,0
0,2
0,4
0,6
0,8
1,0
1990
1992
1994
1996
1998
2000
2002
2004
2006
Year
Efic
ienc
y
State1 State2
21
One reason why state banks show the sharpest increase in efficiency in 2001 is
found out to be the inflation accounting practice which was in effect beginning
with 200211. Our efficiency analyses with respect to both the inflation-adjusted
2001 values and the original 2001 values reveal that the adjustment increased the
efficiency figures for all types of banks. However, the difference is the biggest
for the state banks as shown in Graph 812. The same argument holds for Graphs
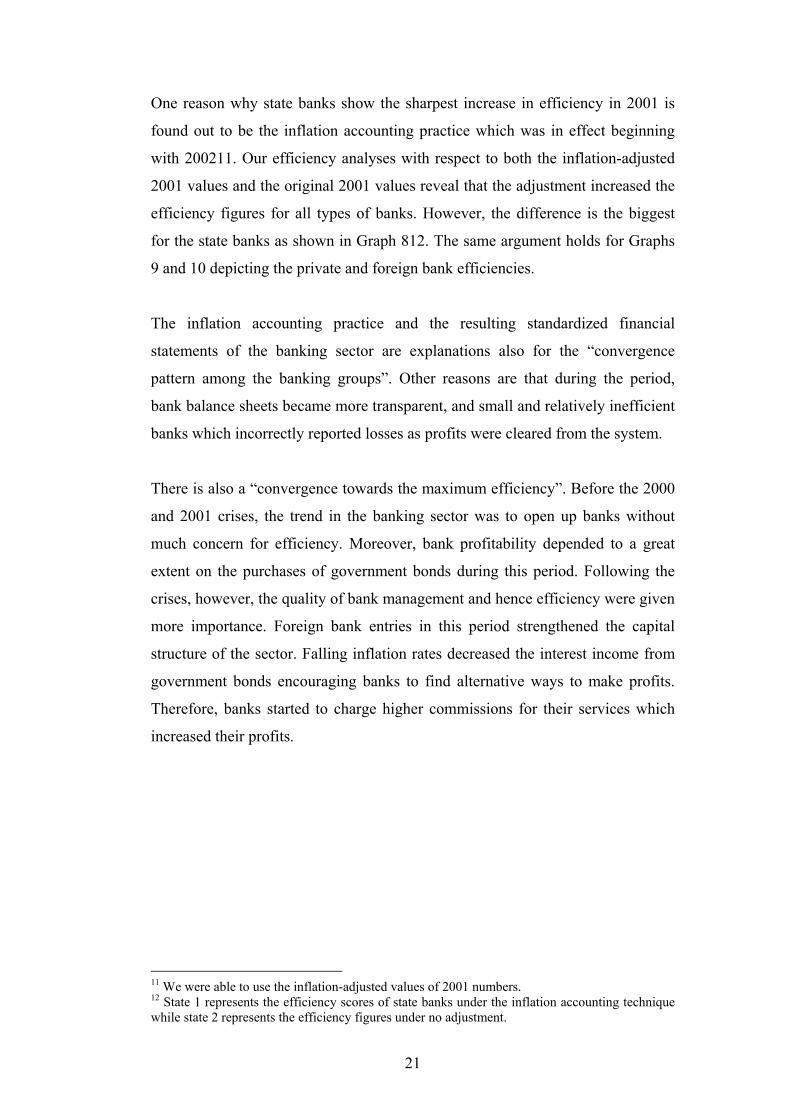
9 and 10 depicting the private and foreign bank efficiencies.
The inflation accounting practice and the resulting standardized financial
statements of the banking sector are explanations also for the “convergence
pattern among the banking groups”. Other reasons are that during the period,
bank balance sheets became more transparent, and small and relatively inefficient
banks which incorrectly reported losses as profits were cleared from the system.
There is also a “convergence towards the maximum efficiency”. Before the 2000
and 2001 crises, the trend in the banking sector was to open up banks without
much concern for efficiency. Moreover, bank profitability depended to a great
extent on the purchases of government bonds during this period. Following the
crises, however, the quality of bank management and hence efficiency were given
more importance. Foreign bank entries in this period strengthened the capital
structure of the sector. Falling inflation rates decreased the interest income from
government bonds encouraging banks to find alternative ways to make profits.
Therefore, banks started to charge higher commissions for their services which
increased their profits.
11 We were able to use the inflation-adjusted values of 2001 numbers. 12 State 1 represents the efficiency scores of state banks under the inflation accounting technique while state 2 represents the efficiency figures under no adjustment.
Graph 9: Technical Efficiency with(out) inflation accounting (Private Banks)
0,0
0,2
0,4
0,6
0,8
1,0
1990
1992
1994
1996
1998
2000
2002
2004
2006
Year
Effi
cien
cy
Private1 Private2
Graph 10: Technical Efficiency with(out) inflation accounting (Foreign Banks)
0,0
0,2
0,4
0,6
0,8
1,0
1990
1992
1994
1996
1998
2000
2002
2004
2006
Year
Effi
cien
cy
Foreign1 Foreign2
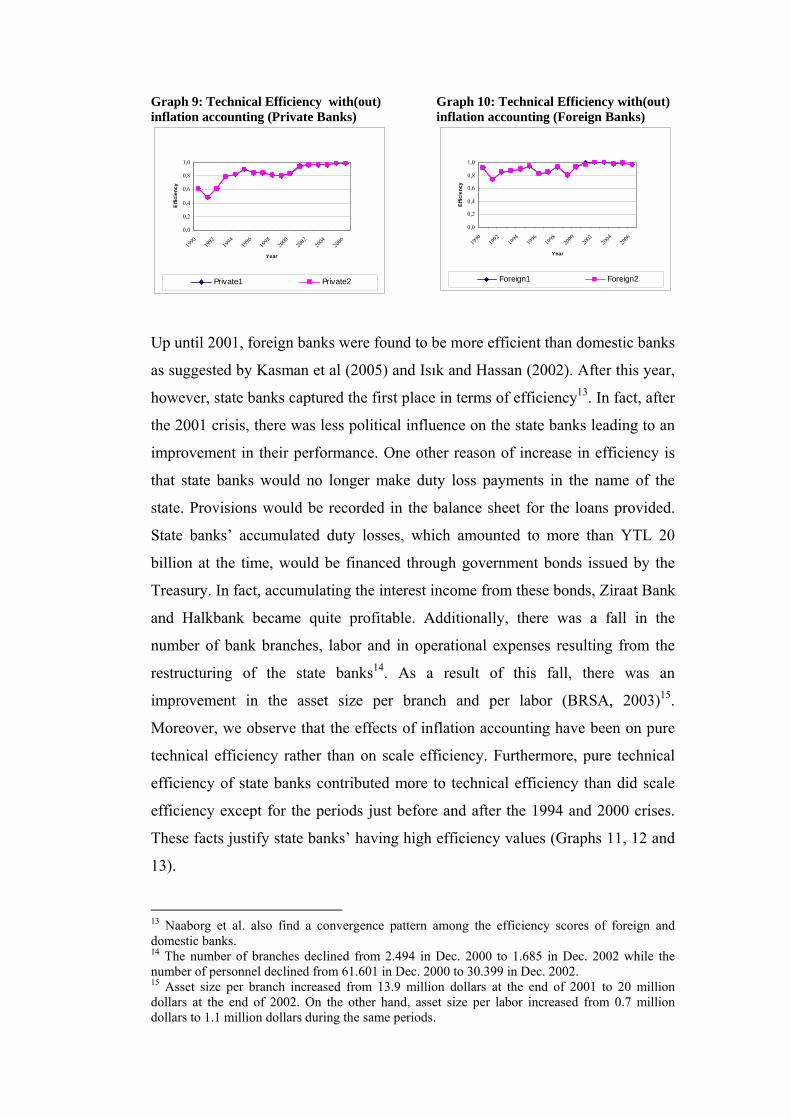
Up until 2001, foreign banks were found to be more efficient than domestic banks
as suggested by Kasman et al (2005) and Isık and Hassan (2002). After this year,
however, state banks captured the first place in terms of efficiency13. In fact, after
the 2001 crisis, there was less political influence on the state banks leading to an
improvement in their performance. One other reason of increase in efficiency is
that state banks would no longer make duty loss payments in the name of the
state. Provisions would be recorded in the balance sheet for the loans provided.
State banks’ accumulated duty losses, which amounted to more than YTL 20
billion at the time, would be financed through government bonds issued by the
Treasury. In fact, accumulating the interest income from these bonds, Ziraat Bank
and Halkbank became quite profitable. Additionally, there was a fall in the
number of bank branches, labor and in operational expenses resulting from the
restructuring of the state banks14. As a result of this fall, there was an
improvement in the asset size per branch and per labor (BRSA, 2003)15.
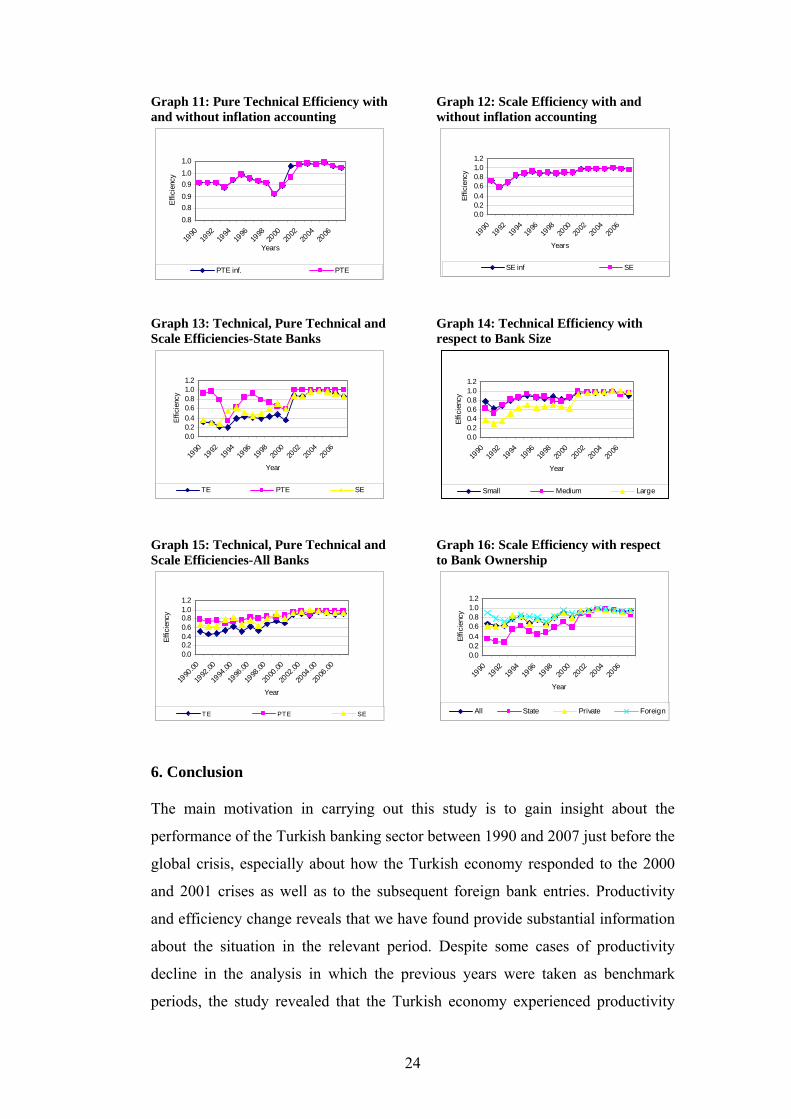
Moreover, we observe that the effects of inflation accounting have been on pure
technical efficiency rather than on scale efficiency. Furthermore, pure technical
efficiency of state banks contributed more to technical efficiency than did scale
efficiency except for the periods just before and after the 1994 and 2000 crises.
These facts justify state banks’ having high efficiency values (Graphs 11, 12 and
13).
13 Naaborg et al. also find a convergence pattern among the efficiency scores of foreign and domestic banks. 14 The number of branches declined from 2.494 in Dec. 2000 to 1.685 in Dec. 2002 while the number of personnel declined from 61.601 in Dec. 2000 to 30.399 in Dec. 2002. 15 Asset size per branch increased from 13.9 million dollars at the end of 2001 to 20 million dollars at the end of 2002. On the other hand, asset size per labor increased from 0.7 million dollars to 1.1 million dollars during the same periods.

23
A final analysis is conducted with respect to bank size. One more time we
observe that the efficiency scores converge after 2001. For the period before
2000, however, the results indicate that the most efficient bank group is the
medium-scale banks, the banks mainly purchased by foreign banks, followed by
small banks. Large banks have been found the least efficient with very different
efficiency measures from the industry average. The reason of low efficiency is
found out to be the fact that they have the most scale inefficiency. In fact; scale
inefficiency is what pulls the efficiency scores down in general (Graphs 14, 15
and 16).
24
Graph 11: Pure Technical Efficiency with and without inflation accounting
0.80.80.90.91.01.0
1990
1992
1994
1996
1998
2000
2002
2004
2006
Years
Effic
ienc
y
PTE inf. PTE
Graph 12: Scale Efficiency with and without inflation accounting
0.00.20.40.60.81.01.2
1990
1992
1994
1996
1998
2000
2002
2004
2006
Years
Effic
ienc
y
SE inf SE
Graph 13: Technical, Pure Technical and Scale Efficiencies-State Banks
0.00.20.40.60.81.01.2
1990
1992
1994
1996
1998
2000
2002
2004
2006
Year
Effic
ienc
y
TE PTE SE
Graph 14: Technical Efficiency with respect to Bank Size
0.00.20.40.60.81.01.2
1990
1992
1994
1996
1998
2000
2002
2004
2006
YearEf
ficie
ncy
Small Medium Large
Graph 15: Technical, Pure Technical and Scale Efficiencies-All Banks
0.00.20.40.60.81.01.2
1990
.00
1992
.00
1994
.00
1996
.00
1998
.00
2000
.00
2002
.00
2004
.00
2006
.00
Year
Effic
ienc
y
TE PTE SE
Graph 16: Scale Efficiency with respect to Bank Ownership
0.00.20.40.60.81.01.2
1990
1992
1994
1996
1998
2000
2002
2004
2006
Year
Effic
ienc
y
All State Private Foreign
6. Conclusion The main motivation in carrying out this study is to gain insight about the
performance of the Turkish banking sector between 1990 and 2007 just before the
global crisis, especially about how the Turkish economy responded to the 2000
and 2001 crises as well as to the subsequent foreign bank entries. Productivity
and efficiency change reveals that we have found provide substantial information
about the situation in the relevant period. Despite some cases of productivity
decline in the analysis in which the previous years were taken as benchmark
periods, the study revealed that the Turkish economy experienced productivity
25
increase when the benchmark years were 1990 and 2001. The productivity
improvement was predominantly the result of both technological improvement
and efficiency increase. After 2000, however, the productivity increase was
solely due to technological improvement reflecting the existence of structural
changes in the Turkish banking sector. We also observed that after 2000, pure
technical efficiency of the sector increased reflecting the fact that the quality of
bank management has been of increasing importance.
More than half of the banks are found to have experienced productivity increase
and more than half have experienced technological improvement. Another
observation is that the main reason of productivity increase in the sector is
technological improvement while the main reason of productivity decline is
efficiency decrease.
One other analysis of efficiency is with respect to bank groups of different
ownership types. The results show that all the banking groups experienced
efficiency increase between 1990 and 2007, and there was convergence among
efficiency values towards 1 after 2001. Before the 2000 and 2001 crises, new
banks would be founded without much concern for efficiency. However, after the
crises, the quality of bank management became more important which led to this
convergence towards this maximum efficiency.
Foreign banks, which were the most efficient ones in the sector before 2001, left
their places to state banks after this year. In fact, state banks are found to be the
least efficient before 2001 and the reason of low efficiency scores is found out to
be the scale inefficiency. State banks are also the banks which experienced the
sharpest increase in efficiency after 2001. Two reasons are that after the crises,
political influence on state banks declined and these banks would no longer make
duty loss payments in the name of the state. Moreover, there was a fall in the
number of bank branches, labor and in operational expenses resulting from the
restructuring of the state banks. One other reason is the inflation accounting
practice which was in effect beginning with 2002 and which mostly affected the
state banks. The effects of inflation accounting are found to be on pure technical
efficiency rather than on scale efficiency, and pure technical efficiency of state
26
banks contributed more to technical efficiency than did scale efficiency except
for the periods just before and after the 1994 and 2000 crises.
The inflation accounting practice and the resulting standardized financial
statements of the banking sector are among the explanations also for the
“convergence pattern among the banking groups” after 2001. Other explanations
are that the bank balance sheets became more transparent, and small and
relatively inefficient banks were cleared from the system during the period.
Finally, this study examined the performance of the sector with respect to bank
size. Before 2000, the most efficient bank group is found to be the medium-scale
banks, the banks mainly purchased by foreign banks, followed by small banks.
The least efficient bank group is the large banks due to the scale inefficiency.
27
8. Appendix Table 1: Performance Index of the Turkish Banking Sector
PI Liquidity Equity Currency Risk
Profitability Asset Quality
12\2003 100,0 100,0 100,0 100,0 100,0 100,0 12\2004 100,3 100,6 99,6 100,1 99,8 101,3 12\2005 100,5 102,2 99,5 99,8 98,6 102,4 01\2006 100,5 100,2 99,9 99,4 100,7 102,4 02\2006 100,1 100,1 99,9 97,5 100,3 102,5 03\2006 100,4 100,7 99,6 98,3 100,9 102,6 04\2006 99,9 99,5 99,4 97,4 100,7 102,6 05\2006 99,6 98,9 97,9 97,6 100,5 102,8 06\2006 99,9 99,3 97,6 99,2 100,5 103,0 07\2006 100,1 99,1 98,3 99,2 100,6 103,1 08\2006 100,4 99,7 98,7 99,6 100,9 103,1 09\2006 100,4 99,8 98,6 99,8 100,8 103,1 10\2006 100,5 100,1 99,3 99,3 100,9 103,2 11\2006 100,5 99,6 99,4 99,9 100,7 103,3 12\2006 100,9 101,4 99,2 100,1 100,5 103,3
Source: Turkish BRSA, Dec.2006 2006 figures are as of Sep. 2006.
Table 2: Bank classification with respect to size Small banks¹ Medium sized banks² Large banks³ ABN AMRO Bank N.V. Credit Lyonnais Turkey Demirbank T.A.Ş. AK Bank T.A.Ş. Arap Türk Bankası A.Ş. Birleşik Türk Körfez
Bankası A.Ş. Finans Bank A.Ş. T.C. Ziraat Bankası A.Ş.
Bank Europa Bankası A.Ş. Alternatif Bank A.Ş. HSBC Bank A.Ş. 2 T. Garanti Bankası A.Ş. Bank Mellat Anadolubank A.Ş. Kocbank A.Ş. T. Halk Bankası A.Ş. Citibank A.Ş. MNG Bank A.Ş. Yapı ve Kredi Bankası
A.Ş. T. İs Bankası A.Ş.
HSBC Bank A.Ş. 1 Tekfenbank A.Ş. Fortis Bank A.Ş. T. Vakıflar Bankası T.A.O.
JP Morgan Chase N.A. Banca di Roma S.P.A. Pamukbank T.A.Ş. T. Emlak Bankası A.Ş. Oyak Bank A.Ş. Habib Bank Limited Etibank A.Ş. Sekerbank T.A.Ş. Societe Generale(SA) İktisat Bankası T.A.Ş. Tekstil Bankası A.Ş. West LB AG Osmanlı Bankası A.Ş. Turkish Bank A.Ş. Bayındırbank A.Ş. Eskişehir Bankası T.A.Ş. Türk Ekonomi Bankası A.Ş.
Kentbank A.Ş. Interbank A.Ş.
Adabank A.Ş. Bank Ekspres A.Ş. Türk Ticaret Bankası A.Ş. T. İmar Bankası T.A.Ş. EGS Bankası A.Ş. Toprakbank A.Ş. Sümerbank A.Ş. Rabobank Nederland Denizbank A.Ş. Milli Aydın Bankası T.A.Ş.
Credit Suisse First Boston
Bnp-Ak Dresdner Bank A.Ş.
ING Bank N.V.
¹Small banks: Banks with asset share of 1% or less, ²Medium scale banks: Banks with asset share of 1%-5%, ³Large banks: Banks with asset share of 5% or more. Asset share is defined as the average asset share of the banks over the sample period. HSBC Bank A.Ş. 1 and 2 represent the bank before and after the acquisition of Demirbank T.A.Ş., respectively.
28
Table 3: Productivity change with respect to fixed frontiers All Banks # EFFCH TECCH PEFCH SECH TFPCH 90-90 - - - - - - 91-90 38 1,4255 0,6791 1,0130 1,4072 0,9015 92-90 38 1,1497 0,6754 1,0422 1,1031 0,7377 93-90 38 0,9301 0,6719 1,0588 0,8785 0,6009 94-90 38 0,8224 0,5948 1,0115 0,8130 0,4599 95-90 38 0,7580 0,5252 0,9740 0,7783 0,3635 96-90 38 0,8513 0,3263 1,0084 0,8443 0,2530 97-90 38 0,8633 0,2243 1,0503 0,8220 0,1680 98-90 38 0,8673 0,1767 1,0627 0,8161 0,1410 99-90 38 0,9157 0,1440 1,1466 0,7986 0,1182 2000-1990 38 0,8726 0,1069 1,0732 0,8131 0,0869 91-2000 (mean-ar) 0,9456 0,4125 1,0441 0,9074 0,3831 2001-2001 - - - - - - 2002-2001 22 0,9896 0,9871 0,9924 0,9972 0,9737 2003-2001 22 0,9871 0,8504 0,9860 1,0011 0,8435 2004-2001 22 0,9926 0,7514 0,9905 1,0021 0,7438 2005-2001 22 0,9633 0,6724 0,9843 0,9787 0,6469 2006-2001 22 0,9940 0,5599 1,0016 0,9924 0,5535 2007-2001 21 1,0337 0,4366 1,0147 1,0187 0,4578 2002-2007(mean-ar) 0,9934 0,7081 0,9949 0,9984 0,7032
State Banks # EFFCH TECCH PEFCH SECH TFPCH 90-90 - - - - - - 91-90 6 1,2973 0,7060 0,9514 1,3636 0,8587 92-90 6 1,3723 0,6551 1,1239 1,2210 0,8557 93-90 6 1,1339 0,7981 1,4545 0,7796 0,8740 94-90 6 0,7155 0,7882 1,0591 0,6756 0,5614 95-90 6 0,6889 0,6623 1,0479 0,6575 0,4341 96-90 5 0,7646 0,4722 1,0003 0,7644 0,3218 97-90 5 0,8046 0,3546 1,3115 0,6135 0,2464 98-90 4 0,8968 0,1997 1,3556 0,6616 0,1605 99-90 4 0,8288 0,1448 1,5286 0,5422 0,1134 2000-1990 4 1,1335 0,0958 1,7978 0,6305 0,1022 91-2000(mean-ar) 0,9636 0,4877 1,2631 0,7909 0,4528 2001-2001 - - - - - - 2002-2001 3 1,0532 0,9310 1,0000 1,0532 0,9777 2003-2001 3 1,0000 0,8575 1,0000 1,0000 0,8575 2004-2001 3 1,0000 0,7663 1,0000 1,0000 0,7663 2005-2001 3 1,0000 0,7298 1,0000 1,0000 0,7298 2006-2001 3 1,0000 0,5760 1,0000 1,0000 0,5760 2007-2001 3 1,0332 0,4272 1,0000 1,0332 0,4409 2002-2006(mean-ar) 1,0144 0,7146 1,0000 1,0144 0,7247
29
Table 3: Productivity change with respect to fixed frontiers (continued) Private Banks # EFFCH TECCH PEFCH SECH TFPCH 90-90 - - - - - - 91-90 23 1,4620 0,6680 1,0310 1,4180 0,9077 92-90 23 1,0847 0,6758 1,0387 1,0443 0,6942 93-90 23 0,8146 0,6558 0,9756 0,8349 0,4984 94-90 23 0,7624 0,5759 0,9865 0,7728 0,4102 95-90 23 0,6853 0,5460 0,9359 0,7322 0,3484 96-90 24 0,7553 0,3357 0,9738 0,7756 0,2360 97-90 24 0,7803 0,2333 0,9784 0,7975 0,1609 98-90 25 0,8177 0,1936 1,0369 0,7886 0,1472 99-90 25 0,8396 0,1638 1,1013 0,7623 0,1242 2000-1990 25 0,7851 0,1253 0,9777 0,8030 0,0946 91-2000(mean-ar) 0,8787 0,4173 1,0036 0,8729 0,3622 2001-2001 - - - - - - 2002-2001 17 0,9779 1,0000 0,9903 0,9875 0,9867 2003-2001 17 0,9835 0,8471 0,9822 1,0014 0,8382 2004-2001 17 0,9881 0,7437 0,9879 1,0002 0,7316 2005-2001 16 0,9491 0,6543 0,9780 0,9704 0,6186 2006-2001 14 0,9496 0,5714 0,9744 0,9745 0,5392 2007-2001 11 0,9965 0,4549 0,9909 1,0056 0,4596 2002-2006(mean-ar) 0,9741 0,7119 0,9839 0,9899 0,6956
Foreign Banks # EFFCH TECCH PEFCH SECH TFPCH 90-90 - - - - - - 91-90 9 1,4177 0,6896 1,0081 1,4063 0,9144 92-90 9 1,1676 0,6879 0,9968 1,1713 0,7704 93-90 9 1,0896 0,6289 1,0076 1,0813 0,6805 94-90 9 1,0469 0,5143 1,0437 1,0030 0,5191 95-90 9 0,9899 0,3809 1,0219 0,9687 0,3551 96-90 9 1,1555 0,2203 1,1050 1,0458 0,2601 97-90 9 1,1174 0,1279 1,0968 1,0187 0,1433 98-90 9 0,9918 0,1195 1,0042 0,9876 0,1151 99-90 9 1,1660 0,0889 1,1028 1,0573 0,1036 2000-1990 9 0,9997 0,0606 1,0161 0,9839 0,0588 91-2000(mean-ar) 1,1142 0,3519 1,0403 1,0724 0,3920 2001-2001 - - - - - - 2002-2001 2 1,0000 0,8513 1,0000 1,0000 0,8513 2003-2001 2 1,0000 0,8697 1,0000 1,0000 0,8697 2004-2001 2 1,0220 0,7981 1,0000 1,0220 0,8200 2005-2001 3* 1,0070 0,7175 1,0040 1,0030 0,7244 2006-2001 5 1,1147 0,5181 1,0789 1,0332 0,5799 2007-2001 7 1,0923 0,4120 1,0585 1,0320 0,4623 2002-2006(mean-ar) 1,0393 0,6944 1,0236 1,0150 0,7179 Source: Authors’ calculation., “mean-ar” stands for “arithmetic mean”. EFFCH= TFPCH/TECCH. SECH= EFFCH/PEFCH. * Increase by one bank in the number of foreign banks is due to the changing status of Türk Dış Ticaret Bankası A.Ş. acquired by Fortis Bank SA/N.V. from private banks to foreign banks.
30
Table 4: Productivity change with respect to changing frontiers All Banks # EFFCH TECCH PEFCH SECH TFPCH 90-90 - - - - - - 91-90 40 1,5102 0,6521 1,1256 1,3417 0,8790 92-91 41 1,1075 0,7302 1,1357 0,9751 0,7766 93-92 47 1,1268 0,7016 1,3978 0,8061 0,7369 94-93 46 0,8953 1,1133 0,9621 0,9305 0,9668 95-94 46 1,4800 0,5694 1,0917 1,3556 0,7936 96-95 47 1,0920 0,8382 1,0129 1,0781 0,7700 97-96 45 1,3275 0,5942 1,0425 1,2734 0,7656 98-97 44 1,2128 0,8480 1,0782 1,1248 1,0187 99-98 47 0,9754 1,1039 1,0929 0,8925 1,0720 2000-1999 48 1,0818 0,8634 0,9855 1,0978 0,9317 91-2000 (mean-ge) 1,1657 0,7818 1,0869 1,0725 0,8639 2001-2001 - - - - - - 2002-2001 34 0,9583 1,0007 0,9725 0,9854 0,9678 2003-2002 35 0,9795 0,9413 1,0028 0,9768 0,9233 2004-2003 33 1,0114 0,8826 0,9979 1,0136 0,8899 2005-2004 32 1,0436 0,8009 1,0071 1,0362 0,8325 2006-2005 32 1,0360 0,8683 1,0070 1,0292 0,9033 2007-2006 30 1,0081 0,9773 1,0074 1,0007 0,9825 2002-2006 (mean-ge) 1,0061 0,9118 0,9990 1,0070 0,9166
State Banks # EFFCH TECCH PEFCH SECH TFPCH 90-90 - - - - - - 91-90 6 1,0762 0,8501 0,9514 1,1312 0,8941 92-91 6 1,4242 0,8124 1,1754 1,2117 1,1246 93-92 6 1,6906 0,8557 2,8846 0,5861 1,1668 94-93 6 0,6963 1,1761 0,6965 0,9996 0,8137 95-94 6 1,1951 0,7801 0,9078 1,3165 0,9248 96-95 5 1,2483 0,8812 0,9409 1,3267 1,0733 97-96 5 1,2935 0,7023 1,3895 0,9309 0,9150 98-97 4 1,1482 0,8943 0,9903 1,1594 1,0139 99-98 4 0,8904 1,1098 1,1217 0,7938 0,9688 2000-1999 4 1,4330 0,8193 1,2697 1,1286 1,1550 91-2000 (mean-ge) 1,1770 0,8782 1,1417 1,0309 0,9984 2001-2001 - - - - - - 2002-2001 3 0,9850 1,0578 1,0000 0,9850 1,0405 2003-2002 3 0,9257 0,9840 1,0000 0,9257 0,9107 2004-2003 3 0,9911 0,9240 1,0000 0,9911 0,9162 2005-2004 3 1,0099 0,8899 1,0000 1,0099 0,8973 2006-2005 3 1,0502 0,8936 1,0000 1,0502 0,9398 2007-2006 3 1,1085 0,8849 1,0000 1,1085 0,9756 2002-2006 (mean-ge) 1,0117 0,9390 1,0000 1,0117 0,9467
31
Table 4: Productivity change with respect to changing frontiers (continued) Private Banks # EFFCH TECCH PEFCH SECH TFPCH 90-90 - - - - - - 91-90 21 1,67549 0,60049 1,236 1,3553 0,88904 92-91 21 1,05591 0,69745 1,234 0,8560 0,71679 93-92 28 0,86819 0,67408 1,127 0,7707 0,55490 94-93 27 0,94371 1,00910 0,978 0,9647 0,93782 95-94 26 1,58051 0,55783 1,164 1,3578 0,82917 96-95 28 1,03937 0,84125 1,051 0,9889 0,67464 97-96 27 1,31417 0,58963 0,960 1,3688 0,75894 98-97 28 1,28808 0,85079 1,130 1,1404 1,08476 99-98 30 0,92285 1,13581 1,017 0,9071 1,03614 2000-1999 30 1,07648 0,86143 0,974 1,1051 0,92489 91-2000 (mean-ge) 1,1765 0,7818 1,0871 1,0815 0,8407 2001-2001 - - - - - - 2002-2001 19 0,93340 0,97492 0,962 0,9701 0,91516 2003-2002 19 0,97615 0,91873 1,006 0,9707 0,90015 2004-2003 19 1,00811 0,87914 0,996 1,0125 0,88172 2005-2004 18 1,05060 0,79262 1,004 1,0466 0,82896 2006-2005 15 1,0203 0,8767 1,0040 1,0160 0,8953 2007-2006 11 0,9960 1,0407 0,9852 1,0109 1,0302 2002-2006 (mean-ge) 0,9974 0,9138 0,9928 1,0045 0,9086 Foreign Banks # EFFCH TECCH PEFCH SECH TFPCH 90-90 - - - - - - 91-90 13 1,42417 0,64783 1,010 1,4104 0,85315 92-91 14 1,04865 0,74767 0,952 1,1017 0,71711 93-92 13 1,46976 0,69119 1,310 1,1218 0,96163 94-93 13 0,88186 1,32513 1,039 0,8486 1,11105 95-94 14 1,40259 0,49631 1,026 1,3664 0,65928 96-95 14 1,14929 0,81483 0,964 1,1923 0,86603 97-96 13 1,37294 0,55987 1,080 1,2711 0,71892 98-97 12 1,03768 0,82388 0,987 1,0510 0,84623 99-98 13 1,13943 1,01943 1,278 0,8913 1,19902 2000-1999 14 0,98658 0,88178 0,925 1,0663 0,87909 91-2000 (mean-ge) 1,1913 0,8008 1,0572 1,1321 0,8812 2001-2001 - - - - - - 2002-2001 12 0,99093 1,02724 0,984 1,0073 1,03302 2003-2002 13 0,99679 0,96439 0,999 0,9981 0,96004 2004-2003 11 1,02134 0,87739 1,001 1,0203 0,89563 2005-2004 11 1,04138 0,79026 1,016 1,0254 0,82056 2006-2005 14 1,0498 0,8538 1,0100 1,0389 0,9041 2007-2006 16 0,9976 0,9510 1,0417 0,9576 0,9511 2002-2006 (mean-ge) 1,0163 0,9107 1,0085 1,0080 0,9274 Source: Authors’ calculation. “mean-ge” stands for “geometric mean”. EFFCH= TFPCH/TECCH. SECH= EFFCH/PEFCH.
32
Table 5: Technical, scale and pure technical efficiencies
All Banks Years Number TE PTE SE 1990 40 0,52439 0,7916 0,6624 1991 40 0,46047 0,7399 0,6224 1992 41 0,47698 0,7681 0,6210 1993 47 0,53637 0,6811 0,7875 1994 46 0,61815 0,7501 0,8241 1995 46 0,52629 0,7621 0,6906 1996 47 0,63005 0,8310 0,7582 1997 45 0,53079 0,8163 0,6503 1998 44 0,67965 0,8440 0,8053 1999 47 0,74216 0,8243 0,9004 2000 48 0,71053 0,8783 0,8090 2001 34 0,87949 0,9529 0,9230 2002 34 0,91781 0,9685 0,9477 2003 35 0,87600 0,8904 0,9838 2004 33 0,94588 0,9728 0,9723 2005 32 0,92159 0,9740 0,94618 2006 32 0,8976 0,9690 0,9263 2007 30 0,9076 0,9654 0,9401 Mean 0,7036 0,8490 0,8178
State Banks Years Number TE PTE SE 1990 6 0,31729 0,9177 0,3457 1991 6 0,28668 0,9649 0,2971 1992 6 0,21700 0,7810 0,2779 1993 6 0,18757 0,3392 0,5530 1994 6 0,39112 0,6232 0,6276 1995 6 0,43087 0,8400 0,5129 1996 5 0,41448 0,9340 0,4438 1997 5 0,38999 0,7895 0,4940 1998 4 0,42401 0,7242 0,5855 1999 4 0,46551 0,6493 0,7170 2000 4 0,34461 0,5834 0,5907 2001 3 0,87724 1,0000 0,8772 2002 3 0,86445 1,0000 0,8644 2003 3 0,97159 1,0000 0,9716 2004 3 0,97998 1,0000 0,9800 2005 3 0,97098 1,0000 0,9710 2006 3 0,9242 1,0000 0,9242 2007 3 0,8637 1,0000 0,8637 Mean 0,5608 0,8321 0,6535
33
Table 5: Technical, scale and pure technical efficiencies (continued) Private Banks
Years Number TE PTE SE 1990 22 0,5668 0,9335 0,6072 1991 22 0,4505 0,7284 0,6184 1992 22 0,4584 0,7105 0,6452 1993 29 0,5749 0,6836 0,8410 1994 28 0,6500 0,7612 0,8539 1995 27 0,4780 0,7132 0,6702 1996 29 0,6379 0,8079 0,7896 1997 28 0,5355 0,8319 0,6437 1998 29 0,6800 0,8261 0,8231 1999 31 0,7459 0,8275 0,9014 2000 31 0,7291 0,9100 0,8012 2001 19 0,8704 0,9248 0,9412 2002 19 0,9336 0,9903 0,9428 2003 19 0,9426 0,9669 0,9749 2004 18 0,9356 0,9696 0,9649 2005 17 0,9049 0,9674 0,9353 2006 15 0,8838 0,9619 0,9188 2007 11 0,8935 0,9481 0,9424 Mean 0,7107 0,8554 0,8207
Foreign Banks
Years Number TE PTE SE 1990 12 0,75918 0,8299 0,9147 1991 12 0,63001 0,8077 0,7800 1992 13 0,65771 0,9068 0,7253 1993 12 0,59008 0,7599 0,7765 1994 12 0,71980 0,8486 0,8482 1995 13 0,67396 0,8254 0,8165 1996 13 0,69543 0,8597 0,8089 1997 12 0,59774 0,8139 0,7344 1998 11 0,80957 0,9723 0,8326 1999 12 0,80316 0,8415 0,9545 2000 13 0,85004 0,9566 0,8886 2001 12 0,96773 1,0671 0,9069 2002 12 0,97827 1,0077 0,9708 2003 13 0,95868 0,9587 1,0000 2004 12 0,95282 0,9707 0,9816 2005 12 0,93292 0,9765 0,9554 2006 14 0,9068 0,9699 0,9349 2007 16 0,9255 0,9713 0,9529 Mean 0,7964 0,9042 0,8757
Source: Authors’ calculation. TE: CRS Technical Input Efficiency, SE: Scale Efficiency, PTE: Pure Technical Efficiency TE=PTE*SE.
34
Table 6: Percentage of banks with Productivity change, Technological change, Efficiency change, Pure Technical Efficiency Change and Scale Efficiency change
Period # TFPCH TECHCH EFFCH PEFFCH SECH Growth Loss Same Growth Loss Same Growth Loss Same Growth Loss Same Growth Loss Same
1990-90 - - - - - - - - - - - - - - - - 1991-90 40 58 43 0 90 10 0 18 70 13 20 28 53 25 63 13 1992-91 41 80 20 0 83 17 0 34 49 17 29 29 41 37 46 17 1993-92 47 81 19 0 91 9 0 47 38 15 21 47 32 60 26 15 1994-93 46 74 26 0 39 61 0 57 24 20 48 24 28 57 24 20 1995-94 46 80 20 0 96 4 0 15 72 13 30 30 39 15 72 13 1996-95 47 72 28 0 66 34 0 60 30 11 36 19 45 62 28 11 1997-96 45 73 27 0 91 9 0 18 71 11 24 29 47 18 71 11 1998-97 44 50 50 0 89 11 0 18 66 16 23 34 43 25 59 16 1999-98 47 51 49 0 32 68 0 53 30 17 21 40 38 57 23 19 2000-99 48 69 31 0 88 13 0 38 40 23 44 21 35 25 50 25
2001-2001 - - - - - - - - - - - - - - - - 2002-2001 34 62 38 0 50 50 0 50 21 29 26 15 59 44 24 32 2003-2002 35 80 20 0 74 26 0 49 17 34 23 14 63 49 14 37 2004-2003 33 82 18 0 88 12 0 24 33 42 15 21 33 21 33 45 2005-2004 32 94 6 0 97 3 0 19 38 44 16 16 69 19 38 44 2006-2005 32 69 31 0 94 6 0 22 44 34 19 16 66 16 44 41 2007-2006 30 63 37 0 77 23 0 30 43 27 13 17 70 33 40 27 Source: Authors’ calculation. Productivity change= TFPCH, Technological change= TECHCH, Efficiency change= EFFCH, Pure Technical Efficiency Change= PEFFCH, Scale Efficiency change= SECH.
35
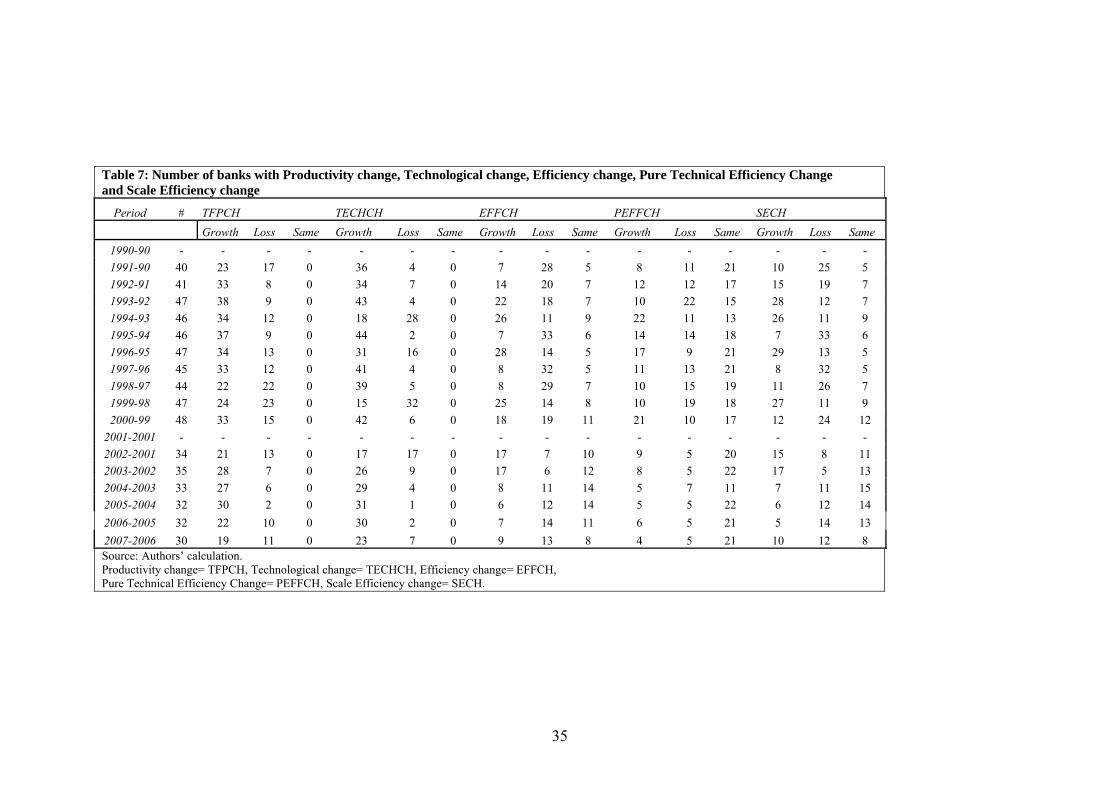
Table 7: Number of banks with Productivity change, Technological change, Efficiency change, Pure Technical Efficiency Change and Scale Efficiency change
Period # TFPCH TECHCH EFFCH PEFFCH SECH Growth Loss Same Growth Loss Same Growth Loss Same Growth Loss Same Growth Loss Same
1990-90 - - - - - - - - - - - - - - - - 1991-90 40 23 17 0 36 4 0 7 28 5 8 11 21 10 25 5 1992-91 41 33 8 0 34 7 0 14 20 7 12 12 17 15 19 7 1993-92 47 38 9 0 43 4 0 22 18 7 10 22 15 28 12 7 1994-93 46 34 12 0 18 28 0 26 11 9 22 11 13 26 11 9 1995-94 46 37 9 0 44 2 0 7 33 6 14 14 18 7 33 6 1996-95 47 34 13 0 31 16 0 28 14 5 17 9 21 29 13 5 1997-96 45 33 12 0 41 4 0 8 32 5 11 13 21 8 32 5 1998-97 44 22 22 0 39 5 0 8 29 7 10 15 19 11 26 7 1999-98 47 24 23 0 15 32 0 25 14 8 10 19 18 27 11 9 2000-99 48 33 15 0 42 6 0 18 19 11 21 10 17 12 24 12
2001-2001 - - - - - - - - - - - - - - - - 2002-2001 34 21 13 0 17 17 0 17 7 10 9 5 20 15 8 11 2003-2002 35 28 7 0 26 9 0 17 6 12 8 5 22 17 5 13 2004-2003 33 27 6 0 29 4 0 8 11 14 5 7 11 7 11 15 2005-2004 32 30 2 0 31 1 0 6 12 14 5 5 22 6 12 14 2006-2005 32 22 10 0 30 2 0 7 14 11 6 5 21 5 14 13 2007-2006 30 19 11 0 23 7 0 9 13 8 4 5 21 10 12 8 Source: Authors’ calculation. Productivity change= TFPCH, Technological change= TECHCH, Efficiency change= EFFCH, Pure Technical Efficiency Change= PEFFCH, Scale Efficiency change= SECH.
36
Table 8: The main reason of productivity changes (percentages)
Period #
Productivity growth mainly due to:
Productivity loss mainly due to:
No change
Efficiency increase mainly due to:
Efficiency decrease mainly due to:
No change
Efficiency increase
Technological progress
Efficiency decrease
Technological regress PTE increase
SE increase
PTE decrease
SE decrease
1990-90 - - - - - - - - - - - 1991-90 40 3 54 33 10 0 8 10 23 48 13 1992-91 41 15 66 15 5 0 15 20 20 29 17 1993-92 47 26 55 17 2 0 6 40 21 17 15 1994-93 46 43 30 9 17 0 33 24 17 7 20 1995-94 46 7 74 15 4 0 11 4 15 57 13 1996-95 47 40 32 19 9 0 19 40 11 19 11 1997-96 45 7 67 24 2 0 16 2 18 53 11 1998-97 44 7 43 43 7 0 5 14 25 41 16 1999-98 47 32 19 17 32 0 15 38 17 13 17 2000-99 48 23 46 25 6 0 27 10 13 27 23
2001-2001 - - - - - - - - - - - 2002-2001 34 32 29 6 32 0 21 29 6 15 29 2003-2002 35 29 51 11 9 0 20 29 11 6 34 2004-2003 33 9 73 9 9 0 12 12 21 12 42 2005-2004 32 6 88 6 0 0 6 13 9 28 44 2006-2005 32 9 59 28 3 0 6 16 6 38 34 2007-2006 30 23 40 20 17 0 3 27 7 37 27
Source: Authors’ calculation.
37
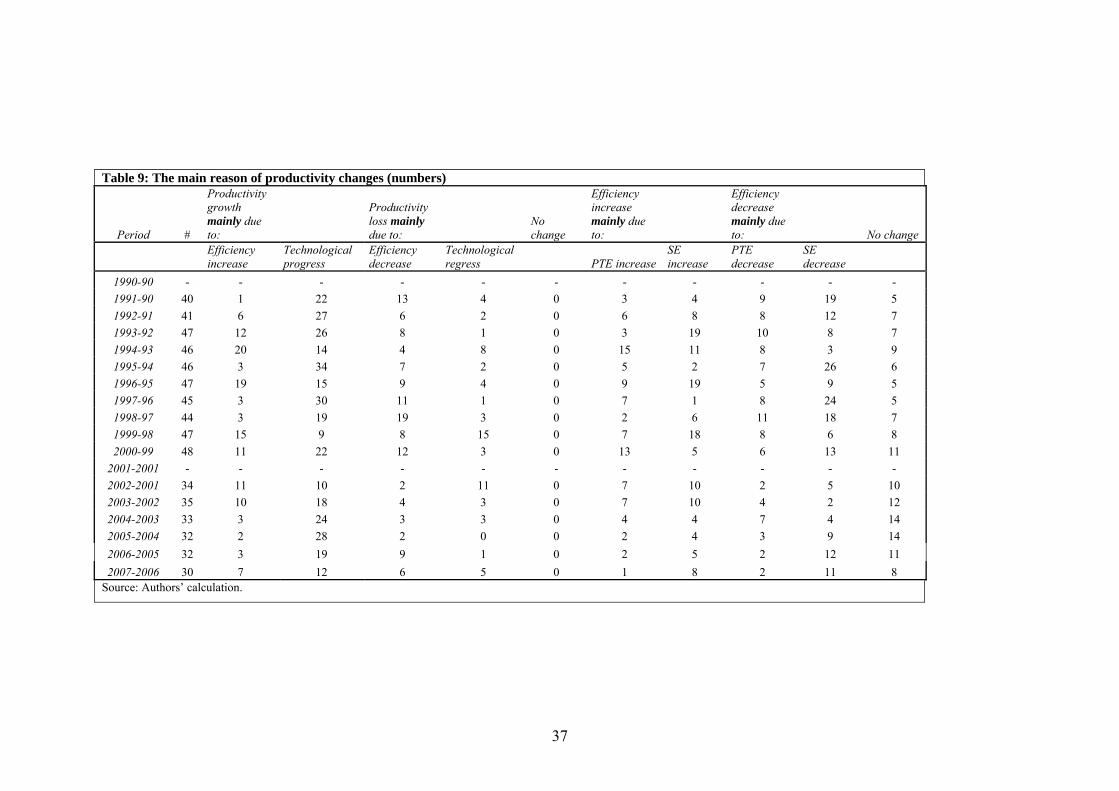
Table 9: The main reason of productivity changes (numbers)
Period #
Productivity growth mainly due to:
Productivity loss mainly due to:
No change
Efficiency increase mainly due to:
Efficiency decrease mainly due to: No change
Efficiency increase
Technological progress
Efficiency decrease
Technological regress PTE increase
SE increase
PTE decrease
SE decrease
1990-90 - - - - - - - - - - - 1991-90 40 1 22 13 4 0 3 4 9 19 5 1992-91 41 6 27 6 2 0 6 8 8 12 7 1993-92 47 12 26 8 1 0 3 19 10 8 7 1994-93 46 20 14 4 8 0 15 11 8 3 9 1995-94 46 3 34 7 2 0 5 2 7 26 6 1996-95 47 19 15 9 4 0 9 19 5 9 5 1997-96 45 3 30 11 1 0 7 1 8 24 5 1998-97 44 3 19 19 3 0 2 6 11 18 7 1999-98 47 15 9 8 15 0 7 18 8 6 8 2000-99 48 11 22 12 3 0 13 5 6 13 11
2001-2001 - - - - - - - - - - - 2002-2001 34 11 10 2 11 0 7 10 2 5 10 2003-2002 35 10 18 4 3 0 7 10 4 2 12 2004-2003 33 3 24 3 3 0 4 4 7 4 14 2005-2004 32 2 28 2 0 0 2 4 3 9 14 2006-2005 32 3 19 9 1 0 2 5 2 12 11 2007-2006 30 7 12 6 5 0 1 8 2 11 8
Source: Authors’ calculation.
38
9. References Akin , G.G. , Aysan, A.F. and Yildiran ,L. (2008). Transformation of the Turkish Financial Sector in the Aftermath of the 2001 Crisis. Unpublished Bonin, J.P., Hasan, I. and Wachtel, P. (2005). Bank Performance, Efficiency and Ownership in Transition Countries. Journal of Banking and Finance, 29,p. 31-53. Caves, D.W., Christensen, L.R. and Diewert, D.E. (1982). The Economic Theory of Index Numbers and the Measurement of Input, Output and Productivity. Econometrica, 50, 1, p. 393-414. Çakar, V. (2003). Yabancı Sermayeli Banka Girişleri ve Ulusal Bankacılık Sektörleri Üzerindeki Etkileri. TCMB Bankacılık ve Finansal Kuruluşlar Genel Müdürlüğü, TCMB Uzmanlık Yeterlilik Tezi, p.21. Etkin, L.P., Helms, M.M., Turkkan, U. and Morris, D.J. (2000). The Economic Emergence of Turkey. European Business Review, 12, 2, p. 64-75. Fare, R., Grosskopf, S., Norris, M and Zhang, Z. (1994). Productivity Growth, Technical Progress and Efficiency Change in Industrialized Countries. American Economic Review, 84,1, p. 66-83. Favero, C. and Papi, L. (1995). Technical and Scale Efficiency in the Italian Banking Sector: A Non-parametric Approach. Applied Economics, 27, p. 385-395. Fukuyama, H. (1993). Technical and Scale Efficiencies of Japanese Commercial Banks: A Nonparametric Approach. Applied Economics, 25, p. 1101-1112. Gamal, M. A. and Inanoglu, H. (2005). Inefficiency and Heterogeneity in Turkish Banking: 1990–2000. Journal of Applied Econometrics, 20, p. 641–664. Green, C.J., Murinde, V. and Nikolov, I. (2003). Are Foreign Banks in Central and Eastern Europe More Efficient than Domestic Banks? 24th SUERF Colloquium on Stability and Efficiency of Financial Markets in Central and Eastern Europe. Isık, I. and Hassan, M.K. (2003a). Financial Deregulation and Total Factor Productivity Change: An Empirical Study of Turkish Commercial Banks. Journal of Banking and Finance, 27, p. 1455-1485. Isık, I. and Hassan, M.K. (2003b). Financial Disruption and Bank Productivity: The 1994 experience of Turkish Banks. The Quarterly Review of Economics and Finance, 43, p. 291-320. Isık, I. and Hassan, M.K. (2002). Technical, Scale and Allocative Efficiencies of Turkish Banking Industry. Journal of Banking and Finance, 26, p. 719-766.
39
Isık, I. and Reda, M. (2006). Efficiency and Productivity Change of Egyptian Commercial Banks(1995-2003). ERF 13th Annual Conference. December 2006. Jemric, I. and Vujcic, B. (2007). Efficiency of Banks in Croatia: A DEA Approach. The Croatian National Bank, Feb. 2007. Kasman, A. (2002). Cost Efficiency, Scale Economies, and Technological Progress in Turkish Banking. Central Bank Review 1, p. 1-20. Malmquist, S. (1953). Index Numbers and Indifference Surfaces. Trabajos de Estatistica, 4, p. 209-242. Naaborg, I., Scholtens, B., Haan, J., Bol, H. and Haas, R. (2003). How Important are Foreign Banks in the Financial Development of European Transition Countries? CESIFO Working Paper, No 1100, Dec.2003. Özkan-Günay and Tektas (2006). Efficiency Analysis of the Turkish Banking Sector in Pre-crisis and Crisis Period: A DEA Approach. Contemporary Economic Policy, 24, 3, p. 418–431. Steinherr, A., Tukel, A. and Ucer, M. (2004). The Turkish Banking Sector: Challenges and Outlook in Transition to EU Membership, Bruges European Economic Policy Briefings, No.9. Tarim, A. (2001). Veri Zarflama Analizi. Matematiksel Programlama Tabanlı Göreli Etkinlik Ölçüm Yaklaşımı. Sayıştay Yayınları, No:15, 2001.
Tschoegl, Adrian E. (2003). Financial Crises and the Presence of Foreign Banks. Wharton Financial Institutions Center Working Paper Series No: 03-35.Wharton Financial Institutions Center.
Turkish BRSA. Finansal Piyasalar Raporu. Aralık 2006, sayı 4, Strateji Geliştirme Dairesi. Turkish BRSA. Finansal Piyasalar Raporu. Aralık 2007, sayı 8, Strateji Geliştirme Dairesi. Turkish BRSA. Bankacılık Sektörü Yeniden Yapılandırma Programı-Gelişme Raporu VII. Ekim 2003. Turkish Banking Association. Türkiye’de Bankacılık Sistemi: Üç Aylık Banka, Şube ve Personel Sayıları. Aralık 2007. Yıldırım (2002). Evolution of Banking Efficiency Within an Unstable Macroeconomic Environment: the Case of Turkish Commercial Banks. Applied Economics, 34, p. 2289-2301. Zaim, O. (1995). The Effect of Financial Liberalization on the Efficiency of Turkish Commercial Banks. Applied Financial Economics 5, p. 257–264.

40
Zhu, J. (2003). Quantitative Models for Performance Evaluation and Benchmarking: Data Envelopment Analysis with Spreadsheets and DEA Excel Solver. Kluwer Academic Publishers, p. 1-5; 11; 278-280.