munich personal repec archive - uni-muenchen.de · munich personal repec archive transfer pricing...
TRANSCRIPT

MPRAMunich Personal RePEc Archive
Transfer Pricing by Multinational Firms:New Evidence from Foreign FirmOwnerships
Anca D. Cristea and Daniel X. Nguyen
University of Oregon, University of Copenhagen
7. December 2013
Online at http://mpra.ub.uni-muenchen.de/61922/MPRA Paper No. 61922, posted 9. February 2015 15:05 UTC

Transfer Pricing by Multinational Firms:
New Evidence from Foreign Firm Ownerships∗
Anca D. Cristea† Daniel X. Nguyen‡
University of Oregon University of Copenhagen
December 2013
Abstract
Using a firm-level panel dataset covering the universe of Danish exports between 1999 and 2006,we find robust evidence for profit shifting by multinational corporations (MNC) through transferpricing. Our triple difference estimation method corrects for a downward bias in previous studies.The bias results from MNCs adjusting their arm’s length prices to obscure the extent of theirtransfer price manipulations. Our identification strategy exploits the movement in export pricesto a destination in response to: (1) the establishment of a foreign affiliate by an exporter to thatdestination, and (2) a change in the foreign corporate tax rates. After acquiring an affiliate in acountry with a corporate tax rate lower than in the home country, Danish multinationals reducethe unit values of their exports there between 5.7 to 9.1 percent, on average. This reductioncorresponds to $141 million in underreported export revenues in year 2006, which translatesinto a loss in tax income equal to 3.24 percent of Danish MNCs’ tax returns.
JEL: F23, H25, D23Keywords: corporate tax, transfer prices, arm’s length principle, triple difference, foreign own-ership
∗This work could not have been accomplished without tremendous help from Rasmus Jorgensen. In addition, wethank Bruce Blonigen, Eyal Dvir, Doireann Fitzgerald, David Hummels, Don Lee, Kalina Manova, Jakob Munch,Pascalis Raimondos-Moller, Tim Schmidt-Eisenlohr, Andreas Waldkirch, Caroline Weber, Chong Xiang and seminarparticipants at the Colby College, Penn State University, Stanford University, University of Oregon and LjubljanaEmpirical Trade Conference (LECT 2013) for helpful comments and suggestions. We are grateful to Mary Ceccaneseand the Office of Tax Policy Research at the University of Michigan for help with the World Tax Database. Allremaining errors are our own.†Corresponding Author: Department of Economics, University of Oregon, 1285 University of Oregon, Eugene, OR
97403, USA. E-mail: [email protected].‡Contact: Department of Economics, University of Copenhagen. E-mail: [email protected]
1 Introduction
Large budget deficits and a sluggish world economy have forced governments worldwide to tighten
regulations and intensify corporate audits in the hope of raising tax revenues. Among the key targets
sought by tax authorities are multinational corporations (MNC). While their rapidly growing global
activities generate large operating profits, MNCs avoid paying taxes on a substantial portion of
their profits by shifting taxable income to jurisdictions with low corporate tax rates.1 Concerns
over tax avoidance have intensified so much in recent years that international taxation regulation
has become a top priority on the agenda of the OECD and G8 country meetings.2
A vehicle commonly used by MNCs to shift income across countries is intra-firm trade. The
pricing of goods exchanged between related parties – known as transfer pricing – provides MNCs
a tool to allocate incomes across affiliated entities in different tax jurisdictions. By underpricing
the exports shipped from a high tax country to a low tax country, an MNC is able to reduce its
effective global tax rate.3 A classic case study of this profit shifting strategy involved the chemical
company Du Pont de Nemours. In 1959, Du Pont created a wholly-owned Swiss marketing and
sales subsidiary - Du Pont International S.A. (“DISA”), which distributed all Du Pont chemical
products outside the USA. According to court documents, Du Pont’s “internal memoranda were
replete with references to tax advantages, particularly in planning prices on Du Pont goods to be
sold to [DISA]. The tax strategy was simple. If Du Pont sold its goods to [DISA] at prices below
fair market value, [DISA], upon resale of the goods, would recognize the greater part of the total
profit (i.e., manufacturing and selling profits). Since this foreign subsidiary could be located in a
country where its profits would be taxed at a much lower level than the parent Du Pont would
be taxed here, the enterprise as a whole would minimize its taxes.”4 Given this evidence of profit
shifting, the IRS rejected Du Pont’s transfer pricing position and adjusted its US income upwards.
In response to income shifting strategies seen in E. I. Du Pont de Nemours and Company
1In Denmark, our data source for the empirical analysis, the evidence suggests that.“30% of all foreign and 28%of all Danish multinational companies have paid no company tax in the period 2006-2008.” (KPMG, 2010).
2In a recent address at the World Economic Forum in Davos, the British prime minister expressed the intention to“use the G8 [presidency] to drive a more serious debate on tax evasion and tax avoidance.[...] There are some formsof avoidance that have become so aggressive [...] it is time to call for more responsibility and for governments to actaccordingly.” (Cameron, 2013). Soon after Davos, the OECD (2013) published a report calling for the participationof all members to a “comprehensive action plan” to reform the current tax rules.
3Another common method to shift profits across locations is debt financing. Given that the interest on debt istax deductible, MNCs benefit from having affiliates in low tax locations lend to affiliates in high tax locations. Forempirical evidence, see Huizinga, Laeven, and Nicodeme (2008) and Egger et al. (2010) among others.
4E. I. Du Pont de Nemours and Company v. the United States., 608 F.2d 445 (Fed. Cir. 1979)
1

v. the United States, tax authorities around the world have established regulations on recording
internal prices for taxation purposes. The arm’s length principle of taxation requires MNCs to
invoice intra-firm transactions at the same arm’s length price charged to unaffiliated parties. In
practice, however, the regulations leave enough room for companies to strategically choose arm’s
length prices in order to hide transfer pricing manipulations. This makes identifying income shifting
activities a challenge for both tax authorities and empirical researchers.
In this paper we estimate the extent to which MNCs manipulate both (1) transfer prices
to controlled affiliates and (2) arm’s length prices to uncontrolled third parties in order to reduce
their global tax burdens. To guide our empirical analysis, we use a theory set-up that formal-
izes the taxation problem of a multinational corporation in a partial equilibrium framework.5 A
known prediction arising from this model is that in the presence of tax differences across countries,
multinational firms have the incentive to manipulate transfer prices in order to shift income to the
country with lower tax rates.
This study examines an overlooked prediction of the standard theory: that firms will also
manipulate their arm’s length price in the direction of the transfer price as a result of corporate
tax differences across locations. This second price manipulation obscures the extent of the first
one, allowing MNCs to comply with the arm’s length principle of taxation and, at the same time,
engage in income shifting. The total income shifted out of the home country is the cumulation
of these two manipulations. Previous studies that focused only on movements in transfer prices
underestimate the full extent of income shifting.
This study’s prediction that MNCs’ manipulate arm’s length prices has important implica-
tions for both econometricians and tax authorities. It suggests that MNCs’ arm’s length export
prices should not be used as comparable uncontrolled prices (“CUP”s) for contemporaneous intra-
firm trade transactions. By comparing an MNC’s transfer price to its arm’s length price instead of
a true reference CUP6, tax authorities and researchers underestimate the extent to which the MNC
manipulates prices in order to shift profits.7 The contribution of our empirical analysis is to mitigate
5The theory set-up follows Bernard, Jensen, and Schott (2006).6As we will explain in the theory section, we define a true reference CUP as the price of a good sold to an unrelated
party, determined in the absence of any tax saving incentives.7Several recent papers argue that the arm’s length taxation principle is a distortionary rule because even in the
absence of tax differences across countries, profit maximizing MNCs may optimally set intra-firm prices at a differentlevel from arm’s length prices. In an offshoring model with financing frictions, Kreuschnigg and Devreux (2012) showthat even absent tax rate differences across countries, a parent firm may still shift income via transfer pricing in order
2

this bias. Specifically, we use a triple difference estimation strategy to impute an unbiased difference
between an MNC’s export unit value and the true reference CUP. The export unit value comprises
both the transfer price and arm’s length price. Its deviation from the true CUP, multiplied by the
quantity traded, represents the total revenue shifted by MNCs out of the home country.
Our estimation strategy requires rich firm and transaction level data. We exploit information
on multinational firms that establish new foreign affiliates in markets to which they export. By
comparing the export unit values before and after acquiring an affiliate in a foreign country, we
identify the change in export unit values related to the foreign acquisition. Using a triple difference
method, we are able to discern between (1) the changes in export unit values associated with
differences in corporate tax rates across jurisdictions and (2) the changes in export unit values
associated with an internal reorganization of the firm following the affiliate acquisition.
In implementing our estimation strategy, we use firm and transaction level data for Denmark
for the period 1999 - 2006. There are several advantages in departing from U.S. data. First, Den-
mark has a territorial taxation system, unlike the residential taxation system in the U.S.8 This dis-
tinction is relevant for our purposes because the potential gains from transfer price manipulations,
and thus the incentive to shift profits internationally, are expected to be larger under territorial
taxation systems (Hines, 1996; Swenson, 2001). Moreover, the territorial taxation system is the
most commonly used taxation system in the world, which makes our findings more generalizable
to other environments. Second, historically Denmark has imposed moderate levels of corporate tax
rates. This implies that at each point in time there exists a sizeable number of important foreign
markets that fall into a high tax, or a low tax regime category, defined relative to the tax rate in
the home country.9 We exploit this feature of our data by allowing for the elasticity of transfer
prices with respect to corporate tax rates to differ for high tax versus low tax regime countries.10
This paper provides significant empirical evidence showing that Danish multinational firms
use transfer pricing to shift income to countries with lower tax rates. We find that a 10 percentage
to relax the financing constraints faced by the foreign affiliate. Raimondos-Moller and Scharf (2002) emphasize theinefficiency of the arm’s length standard in the context of a non-cooperative tax competition game among countries.
8In a residential taxation system, residents are taxed for income earned worldwide. However, in a territorial systemonly income earned from activities performed in that country gets taxed.
9In this paper, we define a low (high) tax regime as a country with a lower (higher) tax rate than the home country.This is not to be confused with the terminology from other papers where low tax jurisdictions are considered taxhavens (Desai, Foley, and Hines, 2006).
10A reason to suspect asymmetric transfer price effects comes from the unbalanced effort of tax authorities to verifyprofit shifting in the case of an increase, as opposed to a decrease in the domestic tax base.
3

point decrease in the tax rate of a low tax regime country results in a 5.7 percent drop in the export
unit values of MNCs owning affiliates in that country, compared to non-affiliated exporters. This
drop in unit values is more pronounced for differentiated goods (6.5 percent), and even more so for
the subsample of firms who establish new affiliates during the sample period (9.1 percent).
Our findings contribute to several areas of on-going research. A large empirical literature
documents the profit shifting behavior of MNCs as a response to differences in corporate tax rates
across countries.11 While most studies find that MNCs earn higher profit margins in low corporate
tax locations, they do not shed light on the mechanisms by which profit shifting occurs. From a
policy perspective, these results are less informative as they provide no guidance on the kind of
regulation that is needed to secure a country’s income tax base.
Few papers provide direct evidence for transfer pricing as an important mechanism of profit
shifting. While the empirical strategy generally consists of relating the difference in product unit
values between intra-firm and arm’s length trade to the gap in corporate tax rates across trade
partners, the findings are more heterogeneous. This is partly because earlier studies have relied
on trade datasets available at industry or product level (Swenson, 2001; Clausing, 2003).12 An
implication of the data aggregation is that the observed average unit values of traded goods embed
compositional effects such as firm heterogeneities within a product category, or product differences
within an industry. This has a direct effect on the estimates, potentially biasing them downwards
due to attenuation bias, or upwards if comparing product prices from firms heterogeneous in pro-
ductivity.13 The paper most closely related to ours that uses U.S. micro level data is Bernard,
Jensen, and Schott (2006). By observing MNCs’ exports to affiliated and unrelated parties in a
11Grubert and Mutti (1991) use U.S. outward FDI data to show that the after-tax profit rates of foreign affiliatesare negatively related to effective income tax rates, and that the net capital investments are larger in countries withlower tax rates. Hines and Rice (1994) focus on U.S. FDI in tax havens, and find even larger elasticities of income andof real activity to tax rates. Bartelsman and Beetsma (2003) use OECD industry level data to show that when incomeshifting occurs, the inverse of the labor cost share becomes a direct function of the corporate tax rate differencesacross countries. More recently, Egger, Eggert, and Winner (2010) provide evidence that foreign owned plants makelower tax payments than similar domestic counterparts, attributing most of this tax savings to profit rather thandebt shifting. For comprehensive surveys of the literature see Hines (1999) and Devreux (2006).
12Swenson (2001) uses product level U.S. import data to examine the response of average unit values to importtariffs and corporate tax rate differences across countries. While she finds evidence for income shifting throughtransfer pricing, the effects are economically small. Using detailed monthly price data for over 22,000 productstraded by the U.S., Clausing (2003) brings evidence suggesting significantly larger transfer price manipulations: a 1percent drop in the foreign corporate tax rate is associated with 0.94 percent lower intra-firm export prices.
13Given the abundant evidence on the selection of firms into foreign markets based on productivity levels (Melitz,2003; Helpman, Melitz, and Yeaple, 2004), it becomes particularly important to conduct the empirical analysis at firmlevel. In a recent paper, Bauer and Langenmayr (2013) show how setting transfer prices at market values determinedby a pool of outside firms leads to systematic overpricing and profit shifting by multinational firms as a consequenceof their exceptional productivity levels.
4

market, Bernard, Jensen, and Schott (2006) are able to construct firm specific price wedges be-
tween intra-firm and arm’s length transactions, and relate them to differences in tax rates across
countries. However, their findings underestimate the extent of profit shifting via transfer pricing if,
as argued in this paper, MNCs act strategically by setting arm’s length prices closer to the optimal
transfer price. Our contribution provides an econometric strategy that accounts for this behavior.
This paper also relates to the recent work on intra-firm trade. The increasing importance
of MNCs and the continuous fragmentation of production processes across national borders have
accelerated the growth of intra-firm trade as a fraction of world trade. Furthermore, the volume
and composition of intra-firm transactions have played a key role in explaining the geography
of multinational production (Keller and Yeaple, 2012; Irarrazabal, Moxnes, and Opromolla, 2012;
Cristea, 2012). By investigating the discrepancies between the reported and actual trade unit values,
this paper documents a generally neglected reason – i.e., corporate taxes – for why intra-firm trade
may vary systematically across countries.
The paper proceeds as follows. Section 2 provides a simple theory framework to motivate
the empirical analysis. Section 3 describes the estimation strategy, highlighting the sources of
identification. The data are detailed in section 4, while the estimation results are discussed in
section 5. The main policy implications are summarized in section 6, and section 7 concludes.
2 Theory Framework
This section formalizes the change in export prices determined by the profit shifting motives of
multinational corporations. We show how a tax-savvy multinational firm, when faced with exoge-
nous foreign country tax rates that differ from the home country, will set the arm’s length and
transfer prices so as to maximize the firm’s global profit. Both of these prices will differ systemat-
ically from the prices set by an identical pure exporter with no foreign affiliates.
Our model follows closely Bernard, Jensen, and Schott (2006) and, as such, we attempt
to follow their notation simplifying where possible. Our model reproduces their main predictions.
However, while Bernard, Jensen, and Schott (2006) use their set-up to show how tax rate differences
across locations affect the gap between an MNC’s intra-firm transfer price and its arm’s length
export price, we extend the analysis to show that in the face of tax saving incentives, the MNC
5
responds not only by manipulating its transfer price, but also by changing its arm’s length price.
And because the direction of change in the arm’s length price mimics the direction of change in the
transfer price, the resulting price gap conceals the full extent of the MNC’s price manipulations.
Thus, we argue that the price gap analyzed by Bernard, Jensen, and Schott (2006) and the existing
transfer pricing literature does not reflect the full extent of profit shifting undertaken by MNCs.
2.1 A true Comparable Uncontrolled Price (CUP)
To begin, we define the arm’s length export price of a product transacted between two unrelated
parties, neither of whom have any incentives to shift income via price manipulations for the purpose
of avoiding taxes. Given the perfect data, tax authorities and econometricians alike would use this
price as a true reference price, i.e., true CUP, for comparison with transfer prices.14
A firm based in the home country h, who exports a product to a foreign destination country
f , only sells its variety to an unrelated party in that market and has no incentives to alter its price
from the profit maximizing level. We label this type of firm a pure exporter, and index it by x.
We assume that the product is sold in a monopolistically competitive market, where it faces an
iso-elastic demand curve. Letting σ denote the demand elasticity, the pure exporter sets the export
price px equal to a constant markup over its marginal cost c:
px =σ
σ − 1c (1)
We term px the true CUP, or alternatively the true reference price for the particular product
exported to country f . It reflects the true market value of the exported product, when produced by
a firm with cost c. For the multinational firm identical to the pure exporter, selling a comparable
product to the same destination country, tax authorities would use px as a benchmark to evaluate
transfer prices, if px were observable. The rest of the section details how the price set by a
comparable multinational firm differs from this reference price posted by a pure exporter whenever
corporate tax rates differ across the two countries.
14IRS §1.482−1(d)(1) aims to evaluate transfer prices by comparing them to“results realized by [unrelated parties]engaged in comparable transactions under comparable circumstances.”
6

2.2 Export Prices for a Multinational Corporation
Next, we consider a multinational corporation that is assumed to be identical to the previous
exporting firm in terms of product characteristics, production technology and cost structure. The
only difference between the multinational firm and the pure exporter comes from their ownership
structure: the MNC owns a foreign affiliate in country f , and as such can sell its variety both
internally to its foreign affiliate, and to unrelated parties in that market.15
To focus the attention on the price distortions driven by taxation motives, we eliminate any
production allocation decisions from the problem of the multinational firm and assume that the
final good is produced in the home country, and the foreign affiliate only serves a distribution role
in its local market.16 We also simplify the exposition by assuming away any frictions affecting
international transactions.
The parent and foreign affiliate are establishments integrated in the same corporation, but for
tax purposes they act as separate entities. Each entity makes pricing decisions so as to maximize
after tax profits. The parent keeps two sets of books: one for internal purposes, where intra-firm
prices are optimally chosen to maximize global profits, and one for taxation purposes, where intra-
firm transfers are evaluated following the arm’s length principle.
Foreign Affiliate’s Problem:
The foreign affiliate only trades with the parent firm (i.e., intra-firm trade). It imports the final
product at an internal price pi and re-sells it in the local market at a price pf .17 Subject to the iso-
elastic local demand for its variety qf ≡ qf (pf ;σ), the foreign affiliate posts a price pf to maximize
its after tax profits.
The affiliate’s income before tax is given by:
π̃f = (pf − pi)qf (2)
15These unrelated parties could be thought of as third-party distributors or local retailers that rebrand the product.16This simplification circumvents the discussion about offshoring decisions that arises with the expansion of multi-
national production. Recent evidence suggests that a significant share of intra-firm trade is motivated by distributionrather than production purposes. Using data for Germany, Krautheim (2012) and Kleinert and Toubal (2013) docu-ment that 46 percent of the foreign affiliates of German multinationals are classified as wholesale. The ratio of salesby wholesale affiliates relative to affiliates in the same sector as their parent ranges between 0.3 and 1.
17The internal price is also known as an ‘incentive rate’, and is chosen by the parent to incentivize the manager ofthe foreign affiliate to make optimal purchase decisions that maximize total corporation profits.
7

where the fixed cost is set to zero for simplicity.
For tax purposes, the affiliate has to report an intra-firm invoice price that is consistent with
the transfer price regulations. Denoting the transfer price reported to the tax authorities by pt, the
tax paid by the foreign affiliate is given by:
taxf = τf (pf − pt)qf (3)
where τf is the statutory corporate tax rate in the foreign country. This implies that the after tax
profit maximized by the affiliate firm is given by:
πf = π̃f − taxf (4)
= (1− τf )pfqf − (pi − τfpt)qf
Since the foreign affiliate has a monopoly on the product variety sold in the local market, and faces
a demand with constant elasticity σ, it follows that the optimal sale price set by the affiliate is:
p∗f =1
1− τfσ
σ − 1(pi − τfpt) (5)
Parent Firm’s Problem:
The parent firm produces a single product at a constant marginal cost c (which is the same as the
pure exporter), and exports it to the foreign affiliate as well as to unrelated parties located in the
same foreign market f . The foreign affiliate demands the quantity qf based on the internal price
pi and the transfer price pt provided to it by the parent. The parent also posts an arm’s length
price pa for the sale of its good to unrelated parties. The parent faces an arm’s length demand
qa ≡ qa(pa;σ) with the same constant elasticity σ as the affiliate.18
The parent’s objective is to maximize after-tax corporate profits. The pre-tax profit of the
parent firm can be written as:
π̃h = paqa + piqf − c(qa + qf ) (6)
where again we assume that fixed costs are zero for simplicity.
18We implicitly assume that the parent can rebrand the variety for arm’s length sales to prevent cannibalizationof the affiliate’s sales.
8

The transfer price pt reported to the foreign tax authorities is also reported to the home
country’s tax authorities. The resulting tax paid by the parent firm is given by:
taxh = τh[paqa + ptqf − c(qa + qf )
](7)
where τh is the statutory tax rate in the home country, and it could be greater, equal or less than
the foreign country tax rate τf . This leads to the after-tax headquarter profits equal to:
πh = π̃h − taxh (8)
= (1− τh)[(paqa − c(qa + qf )
]+ piqf − τhptqf
The parent firm chooses the internal price pi, the transfer price pt, and the arm’s length price
pa such that it maximizes the global corporate profits, denoted by Π:
Π = πh + πf (9)
= (1− τh)[paqa − c(qa + qf )
]+ (1− τf )p∗fqf − (τh − τf )ptqf
A few things are worth pointing out about equation (9). First, while the intra-firm price
pi does not enter the expression for after-tax corporate profits directly, the level of pi implicitly
affects the after-tax profits via its impact on the affiliate’s local resale price p∗f (see equation (5)).
Similarly, the transfer price pt has both a direct effect on the after-tax corporate profits, as well as
an indirect effect operating via its impact on p∗f . Finally, the quantities qf and qa are functions of
pf and pa, respectively, and of the demand elasticity σ.
Recognizing this tax avoidance incentive of MNCs, many governments around the world
have adopted the arm’s length principle of taxation to prevent intra-firm profit transfers and thus
protect their income tax base. This principle regulates the intra-firm transaction price reported for
taxation purposes, which must be set at the same level as between unaffiliated parties. Whenever
a multinational firm fails to comply with the arm’s length principle, it risks a penalty, which takes
the following functional form:19
λ
2
[(pa − pt)qf
]2(10)
19Bernard, Jensen, and Schott (2006) and Swenson (2001) use penalty functions very similar to this one.
9

This penalty function assumes that the home country’s tax authorities use the MNC’s arm’s
length price as a comparable uncontrolled price (CUP).20 The quadratic form reflects higher penal-
ties for substantial or gross misstatements of the export values.21 The parameter λ captures both
the probability with which tax authorities contest the firm’s transfer pricing strategy, as well as
the fraction of the mis-reported income that needs to be paid as penalty.
The first order conditions from maximizing equation (9) subject to penalty charges are:
[pa] : pa −σ
σ − 1c+
λ(pa − pt)q2fpa
(1− τh)(σ − 1)qa= 0 (11)
[pi] : pi − τhpt − (1− τh)c− λ(pa − pt)2qf = 0 (12)
[pt] :∂qf∂pt
[σ − 1
σ(1− τf )pi − (1− τh)c− (τh − τf )pt − λ(pa − pt)2qf
]− (13)
− (τh − τf )qf + λ(pa − pt)q2f = 0
After some algebra we derive the following relationship between the transfer price and the arm’s
length export price chosen by the MNC:22
pt − pa =−(τh − τf )
λqi(14)
Equation (14) shows that for exports to low tax countries, i.e., τh > τf , the parent firm sets
the transfer price below the arm’s length price. The tax wedge ∆τ ≡ τh − τf directly increases the
magnitude of the gap between the transfer price and the arm’s length export price. However, the
indirect effect of ∆τ through qf cannot be explicitly solved.
As noted in Bernard, Jensen, and Schott (2006), this model does not lend itself to explicit
solutions for the endogenous variables p∗f , pa, pt, pi, qf , and qa. However, the system of price equa-
tions given by (5), (11), (13), (12), together with the two demand equations qa(pa;σ) and qf (pf ;σ),
are readily solvable numerically. Bernard, Jensen, and Schott (2006) show in their appendix the
20 IRS §482-4.61.3.6 states that “the search for a comparable should begin with a review of the taxpayers operations.The taxpayer may have engaged in uncontrolled transactions potentially comparable to the controlled transactions.This type of comparable is known as an internal comparable.”
21This penalty function is consistent with the IRS 6662(e) penalty structure, which applies heftier penalties for“substantial or gross misstatements of valuation.”
22To solve for the transfer price pt from equation (13), note that the first term inside the square brackets can besubstituted for using equation (5), while the remaining terms in the square brackets can be substituted for usingequation (12). Upon making these changes, the first line of equation (13) becomes zero, leading to equation (14).
10

results using linear demands while we show in Figure 1 the results using CES demands.
As seen in Figure 1, the direct relationship between the tax wedge and the price gap shown
in equation (14) holds true for a wide range of ∆τ .23 We do not see a price ranking reversal due to
the indirect effect of ∆τ through qi. Figure 1 shows that as the tax wedge increases, the MNC will
increase the price gap between its transfer price and its corresponding arm’s length export price in
order to reduce its global tax burden. This result is well known in the literature on transfer pricing.
Most of the empirical analyses to date focus on the price gap (pt − pa) to examine the effect of
foreign corporate tax rates on transfer pricing. This price gap is consistent with the sort of price
disparities examined by tax authorities. As such, it has been the focus of the existing literature on
transfer pricing.24
Manipulations in both Arm’s Length and Transfer Prices
We now come to the crux of this study’s contribution: the price gap (pt− pa) examined by the tax
authorities and by the existing literature underestimates the true extent of transfer price manipula-
tions. When facing a penalty for profit shifting via transfer prices, the MNC opts to re-optimize its
arm’s length price pa to mitigate this penalty. The price pa will now differ from the true reference
price px given by equation (1), which is the price a pure exporter identical to the MNC would
charge an unrelated party.25 So, to obtain an unbiased measure of the total income shifted by
transfer pricing, we need to estimate the difference (pt − px), which incorporates the price wedge
(pa − px).26
Both the arm’s length price and the transfer price of the MNC differ systematically from px,
and the difference grows with ∆τ. To show this, first we combine (14) and (11) to find the arm’s
length export price pa:
23For exposition purposes, we assume ∆τ ≡ τh − τf ∈ [0, 30%]. Given a 30% home tax rate τh, which reflects theaverage Danish tax rate for our sample period, the range considered for ∆τ covers an extensive set of values for τf .
24See footnote 19 for examples.25Tax authorities recognize the potential to manipulate arm’s length prices to hide corresponding manipulations of
transfer prices. To account for this, IRS §1.482−1(d)(4)(iii) suggests that an MNC’s transaction with an uncontrolledthird party should be disregarded as a CUP if “one of the principal purposes of the uncontrolled transaction was toestablish an arm’s length result with respect to the controlled transaction.” In practice, however, demonstrating thatpa was manipulated is a difficult task for tax authorities. Our theory posits that pa is always manipulated, and soshould never be used as a CUP.
26As we will show below, the MNC will charge prices equal to the the fair market value price px in the absence ofany tax related incentives to shift profits abroad (i.e., when τf = τh).
11

pa = px ·1
1 + κ(∆τ)(15)
where κ(∆τ) ≡ ∆τ
(1− τh)(σ − 1)
(qfqa
)(16)
Equation (15) shows that pa differs from px by a fraction 11+κ(∆τ) , which depends on the tax wedge
∆τ , among others. Importantly, note that κ(∆τ) is increasing in, and has the same sign as ∆τ .27
Similarly, the transfer price pt can be derived as:
pt = px ·1
1 + κ(∆τ)− ∆τ
λqf(17)
which shows that the difference between pt and the true reference price px is also dependent on
the tax wedge. Importantly, note that when the tax wedge is equal to zero, i.e., τh = τf , then the
MNC has no incentives to manipulate its export prices, and both pt and pa are exactly equal to
the true CUP, px:
τh = τf ⇒ pt = pa = px (18)
When faced with different tax rates between the headquarter country and the destination
country, the MNC will skew both the arm’s length price and the transfer price for exports to that
destination. To measure the extent to which the differential tax rates influence the export prices
of an MNC, we must measure the difference between the transfer price pt and the true reference
price px posted in the absence of income shifting incentives. This price difference is given by:
pt − px = −[( σ
σ − 1c)· κ(∆τ)
1 + κ(∆τ)+
∆τ
λqi
](19)
Note that the term in the square bracket has the same sign as ∆τ . When the home country has a
higher tax rate than the foreign country (i.e., ∆τ > 0), the multinational firm prices its affiliated
exports below the true reference price in order to transfer income abroad and reduce its tax burden.
Likewise, the difference between pa and px can be calculated as:
pa − px = −( σ
σ − 1c)· κ(∆τ)
1 + κ(∆τ)(20)
27We could not explicitly sign the derivative dκd∆τ
due to the nonexplicit nature ofqfqa
. However, Figure 2 shows
that dκd(∆τ)
is positive for the range of ∆τ in our sample.
12

The negative sign in front of the two positive terms implies that when ∆τ > 0, i.e., the home
country has a higher tax rate than the foreign country, the firm will lower its arm’s length price
charged to independent parties to a value below the true reference price (i.e., true CUP).
Since both the transfer price and the arm’s length price are affected by the tax wedge ∆τ , the
price gap pt − pa in equation (14) understates the extent of transfer price manipulations, which is
in fact given by pt− px. This can be seen in Figure 1, where pt is always below pa, which is always
below px. By estimating equation (14), the existing literature implicitly assumes that the arm’s
length price pa is equal to the true reference CUP, px, underestimating the full extent of transfer
price manipulations.
An implication of our analysis is that MNCs, in addition to shifting income to their foreign
affiliates via their transfer pricing strategies, also shift income to foreign unrelated parties via their
arms length pricing, pa. This is a tradeoff that the MNCs have to incur in order to take advantage
of the tax savings obtained from transfer pricing. However, this further reduces the income reported
to the home tax authorities and the MNCs’ global tax burden. So, in order to measure the total
income shifted by MNCs to foreign shores, we need to consider the effect of tax rate differences on
both price gaps: (pt − px) and (pa − px).
From Theoretical Prices to Observed Unit Values
The prior section discussed the theoretical pricing of exports. In reality, customs data only report
the total value and total weight of a shipment. From these data, econometricians observe only the
unit value of an international shipment. In addition, most observed export transactions do not
include information on the affiliation of the importing entity. This is the case for our micro dataset
as well. So, an MNC that exports a good to both affiliated and unrelated third parties is going to
be observed in our transaction dataset as charging an export unit value that is a weighted average
of the (intra-firm) transfer price pt and the arm’s length export price pa. For consistency with our
empirical analysis, we define the observable MNC export unit value pm as:
pm = sfpt + (1− sf )pa, with sf ≡qf
qf + qa(21)
The behavior of pm is graphed in Figure 1. Predicting the behavior of pm is made easier
by the fact that both pa and px respond in the same direction, although to a different extent, to
13
differences in corporate tax rates across locations. So, we can show theoretically that the difference
pm − px increases with the tax wedge. Formally:
pm − px = −(
κ(∆τ)
1 + κ(∆τ)· px +
∆τ
λ(qa + qf )
)(22)
The size of this unit value gap is sufficient to determine the total income shifted by the MNC,
both to related and to unrelated parties, in an attempt to reduce its global tax burden. To see this,
notice that the export revenue underreported by the MNC to the home government when trading
with a low tax regime country is given by:
LostExpRev = (pt − px)qa + (pt − px)qf
=(pa
qaqa + qf
+ pfqf
qa + qf
)(qa + qf )− px(qa + qf )
= (pm − px)(qa + qf ) (23)
This result shows the importance of measuring with precision the difference pm − px. Ex-
amination of equation (22) and of the corresponding Figure 1 leads to the following key implication.
Hypothesis 1:
Differences in corporate tax rates across countries determine multinational corporations to set export
unit values that are lower(higher) than the true reference prices (i.e., true CUPs) as a result of
income shifting to low(high) tax countries. Formally:
1. For ∆τ > 0 ⇒ px > pa > pt, which implies that pm − px < 0.
For ∆τ < 0 ⇒ px < pa < pt, which implies that pm − px > 0.
2. d|pm−px|d|∆τ | < 0.
The main prediction derived from the theory is that a multinational firm facing different
corporate tax rates in the home and foreign markets will manipulate its intra-firm and arm’s length
export prices in order to shift income away from the high tax regime locations. This strategic
behavior will affect the MNC’s export unit value in the following manner: the price gap (pm − px)
between the export unit value of the MNC and that of a comparable pure exporter will have the
opposite sign as the tax wedge ∆τ between the home and foreign countries. Further, the magnitude
of this price gap increases with the magnitude of the tax wedge. That is, d|pm−px|d|∆τj | < 0.
14

Prior studies have examined the relationship between the tax wedge ∆τ , and the price gap
(pt − pa), calculated based on contemporaneous intra-firm and arm’s length trade transactions.28
What we have shown is that the price gap (pt − pa) is an incomplete and understated measure of
the degree of income shifting undertaken by MNCs. Researchers and tax authorities should instead
measure the gap (pm − px). However, an empirical challenge with this metric is that the true
CUP, px, is not directly observable for active MNCs. So we cannot directly calculate the difference
between pm and px. Instead, we need to infer from the data what export price an MNC would have
charged a third party, had it behaved as a pure exporter unaffected by tax savings incentives (i.e.,
the true CUP, px). This study does it by employing a difference-in-difference-in-differences (DDD)
estimation method described in detail below.
3 Estimation Strategy
The prior section provided predictions about the price gap (pm − px) between the observed export
unit value of a multinational firm and the price that the MNC would have charged absent any
incentives to minimize the tax burden by shifting profits across locations. However, this price
gap is difficult to calculate since the true reference CUP, px, is not directly observable for any
active MNC. To overcome this challenge, we exploit information on the unit values of non-MNC
firms that export the same product to the same destination across multiple years. An important
aspect to consider is the systematic difference between MNC and pure-exporters in the way they
set export prices and respond to market-specific shocks. To strip away these additional layers
of heterogeneity, we use a difference-in-difference-in-differences (“DDD”) methodology. The next
subsection presents this DDD methodology. The subsection after discusses how we implement it in
the data, while controlling for the various idiosyncrasies in our sample.
3.1 A difference-in-difference-in-differences methodology for export prices
In this subsection, we step through our DDD methodology to show how triple differencing the data
allows us to correctly identify the extent of transfer price manipulations, in accordance with the
predictions of Hypothesis 1. The strategy is to estimate the average change in the export price
28See, among others, Clausing (2003) and Bernard, Jensen, and Schott (2006).
15

of a product resulting from the change in foreign firm ownership (first treatment), differentiating
between destination countries based on the level of their corporate tax rates relative to the tax rate
of the home country (second treatment).
We consider the export of a product to a low tax regime country j in two years y ∈ {1, 2}
by two types of firms: one of them, indexed by x, belongs to the control group of pure exporters,
who only trade in the destination market j with unaffiliated parties; the other one, indexed by
m, is part of the treatment group of ‘emerging’ MNCs, who set up their first affiliate in country j
between years 1 and 2. In each time period we observe the export unit values of the pure exporter,
pjyx , as well as the export unit values of the emerging MNC, i.e., pjym . The evolution of these unit
values over the two years is illustrated by the solid lines in Figure 3.
We characterize the observed unit value of the pure exporter x as follows:
pjyx ≡ px + αx + αjy, y ∈ {1, 2} (24)
where px denotes the true CUP of a representative exporter, determined as in equation (1). Because
export unit values differ across firms and across foreign markets for numerous reasons, including
differences in technology or foreign market competition, we let αx account for any firm charac-
teristics unique to the pure exporter, and we let αjy capture all the unobservable time-specific
heterogeneities characterizing the foreign market j.
We define the observed unit values of an emerging MNC in a similar way, but write them
separately for years 1 and 2 because of the change in the foreign firm ownership. Thus:
pj1m ≡ px + αm + αj1 (25)
pj2m ≡ pm + δ + αm + αj2 (26)
In the first period, the emerging MNC does not own an affiliate in the foreign market, so its behavior
mirrors that of a pure exporter. It posts the same true reference export price, px, adjusted to
accommodate for latent firm specific effects, αm, as well as destination-year fixed effects, αjy.
Between the two periods, firm m acquires an affiliate in foreign country j. This act changes
the observed export unit value pj2m in two ways. First, as our theory predicts, there is a deviation
in the valuation of the good from the true exporter price, px, to a new tax-incentivized unit value,
16

pm, defined in equation (21). Second, there may be an additional price effect influencing the export
transactions of an MNC, that is determined by the expansion of the firm’s activity through the
establishment of a foreign affiliate. This additional price effect is captured by δ in equation (26),
and is considered to be orthogonal to the difference in corporate tax rates across locations.29
To test Hypothesis 1, we must estimate the difference between pm and px. Given the export
unit values observable in the dataset, one candidate is the difference (pj2m − pj2x ) between the MNC
and the pure-exporter selling the same product to the same low tax country j:
[First Difference]: pj2m − pj2x =(pm − px
)+ δ + αm − αx (27)
However, as this equation shows, the difference (pj2m−pj2x ) does not only reflect the MNC’s response
to the tax rate difference across countries (i.e., pm−px), but also the unobserved heterogeneities in
firm characteristics (i.e., αm − αx), or ownership status (i.e., δ) that affect the unit values. These
heterogeneities bias our estimates. The purpose of our triple-difference methodology is to net out
these heterogeneities in order to isolate (pm − px).
To infer what fraction of the observed price gap is due to systematic differences across firms,
we exploit information from the first period export unit values, i.e., equations (24) and (25):
pj1m − pj1x = αm − αx (28)
An essential insight in deriving this result is the fact that the emerging MNC, in the absence of a
foreign affiliate in a market with a different tax rate than the home country, posts the same base
price px as that of a pure exporter with identical firm characteristics. This means that the observable
price disparity is the result of systematic differences in firm characteristics. Referring to Figure 3,
this difference (αm − αx) is illustrated by ‘ϕ’. It accounts for any unobservable heterogeneities in
firm-specific attributes such as production technology, cost structure or market power, that have a
direct effect on the level of export prices.
29For example, the firm could move the final stages of of packaging from the headquarters to the affiliate. Sinceproduction fragmentation happens irrespective of the corporate tax rate in the foreign market, the parameter δ wouldautomatically capture these effects. All the systematic price changes that are associated with the establishment anew plant in a foreign market and which are not caused by transfer pricing manipulations should be captured by δ.
17

Subtracting equation (28) from equation (27), we get:
[Double Difference]: Λj ≡(pj2m − pj2x
)−(pj1m − pj1x
)=(pm − px
)+ δ. (29)
where Λj captures the effect that the establishment of a foreign affiliate in country j has on the
export prices to that destination. Note that Λj is market specific because the export price pm is
chosen based on the tax regime of the destination country. However, if Λj = Λ for ∀j, then Λ
would correspond to the standard difference-in-difference estimator. Referring to Figure 3 again,
the price difference in equation (29) is illustrated by ‘Λj ’.
A preliminary look at the data gives support to such a systematic change in export prices.
Figure 4 illustrates the average unit value of a product exported by an MNC both before and
after establishing foreign ownership in a destination country with a lower tax rate than the home
country. The MNC export unit value is expressed relative to the unit value of a pure exporter firm.
Relevant for us, the observed direction of change in the MNC export price post-acquisition seems
to be correlated with the corporate tax difference between the home and foreign countries in a way
that is consistent with equation (29). What remains to be shown is whether tax avoidance is the
reason behind the observed price difference.
The theory section shows that in the absence of profit shifting incentives via transfer price
manipulations, the MNC export price pm would be equal to the true CUP px. Referring to equation
(29), this implies that the price effect associated with the foreign firm ownership would boil down
to δ, being common across all destination countries irrespective of their tax regimes. However,
this only happens when ∆τj = 0. Otherwise, (pm − px) varies with the difference in corporate tax
rates ∆τj between the home and foreign countries (as suggested by equation (22) in the theory).
We approximate this direct relationship between the export prices and corporate tax rates across
markets as linear in the tax wedge:
pm − px ≡ β ·∆τj (30)
β is a parameter that captures the responsiveness of an MNC’s export price to differences in
corporate tax rates, relative to a pure exporter’s price. Given this predicted relation, we can
rewrite Λj from equation (29) as follows:
18

Λj = β ·∆τj + δ (31)
Variation in corporate tax rates across countries allows us to identify the slope parameter
β separately from the acquisition effect δ. To be specific, by observing Λj′ for another low tax
country j′ for which ∆τj 6= ∆τj′ , we can infer β by taking the difference between the two difference-
in-difference estimators:
[Triple Difference]: Λj − Λj′ = β ·(∆τj −∆τj′
)(32)
Equation (32) defines our triple difference estimator. Since all the terms on the left hand
side are directly observable, it is straightforward to estimate β. If β = 0, then the tax rates do not
affect the export unit values of MNCs, and the difference-in-difference estimator Λj = δ is sufficient
to capture the price effects associated with the establishment of a foreign affiliate. However, the
hypothesis derived from our theory predicts that the tax regime does affect the export prices chosen
by an MNC. Based on the prediction of Hypothesis 1.1, β is expected to be less than zero. Thus,
the test of our model is whether the triple difference estimator is significantly negative.30
3.2 Implementing the triple difference methodology using the trade data
To implement our DDD methodology using micro level trade data, we start from a standard
difference-in-difference estimation equation that captures the effect of a change in the foreign firm
ownership on the export unit values of traded goods. We then amend the model to incorporate the
triple difference term exploiting the variation in the corporate tax rates across countries.
In this process, an important aspect to consider is the dimensionality of the trade dataset,
and its many levels of heterogeneity. Our panel spans four dimensions - firm, product, country
and time - but for our empirical analysis we reduce in to two dimensions. We define a unit of
observation as a trade transaction by firm i to country j in product k, and evaluate the effects of
our two treatments – changes in foreign firm ownership and changes in foreign corporate tax rates
– on the observed export unit values.
We consider the observed export unit value pijkt for a firm i exporting product k to market
30The discussion of the methodology is conducted with country j assumed to be a low tax regime country. Theanalysis proceeds in a similarly way for the high tax regime country case, with the prediction that the triple differenceestimator is greater than zero.
19

j at time t, and denote by DAffijt the indicator variable equal to one if firm i owns a foreign
affiliate in country j at time t. Before discussing our triple difference estimation, let’s begin with
a standard Difference-in-Difference specification relating pijkt to DAffijt:
lnpijkt = αijk + αt + Λ ·DAffijt + θ ·Xit + γ ·Xjt + εijkt. (33)
In the above equation, α indexes fixed effects: αijk captures any unobservable, time-invariant price
determinant that is specific to a given firm-country-product trade transaction, while αt captures
period-specific price shocks. The vectors Xit and Xjt represent observable time-varying firm and
foreign country control variables, respectively.31 ε denotes the error term. The coefficient Λ mea-
sures the average impact of owning a foreign affiliate on an MNC’s export unit values. The DiD
specification assumes this impact is constant across destinations.
However, our theory predicts that the impact of owning an affiliate does vary systematically
with destination market characteristics. Therefore, a specification consistent with this prediction
would replace Λ in equation (33) with Λj . In addition, Hypothesis 1 predicts that Λj is correlated
with the foreign country tax rate, as modeled by Equation (31). Our goal is to estimate this
correlation. Substituting Λj from equation (31) into Λ in equation (33), and expressing the tax
wedge ∆τj in absolute terms as |∆τjt| × ILowTax, with ILowTax an indicator for low tax regime
countries, we derive the following estimation equation:
lnpijkt = αijk + αt +[δ + β · |∆τjt| · ILowTax
]×DAffijt + θ ·Xit + γ ·Xjt + εijkt (34)
This equation represents our difference-in-difference-in-differences regression model. The coefficient
δ measures the average price effect associated with establishing an affiliate, while β captures the
additional price change determined by differences in corporate tax rates across destinations. If the
relationship between export unit values and affiliate acquisition were not dependent on the tax
regime of country j, then adding the tax wedge ∆τj to the regression model would be superfluous.
31In the estimation, the vector Xit includes information on firm level employment and sales, while the vector Xjtincludes information on country level population and real per capita GDP, on exchange rates and statutory corporatetax rates. These control variables are important not only because they explain export prices, but also because theyinfluence the decision to establish foreign affiliates. For example, di Giovanni (2005) provides evidence of a significantnegative effect of corporate taxes on M&As, while Desai, Foley, and Hines (2006) finds that large, fast growing MNCsare more likely to set tax haven operations, affecting their potential to shift income and reduce the global tax burden.
20

However, Hypothesis 1 suggests that the tax regime of a country is a key omitted variable in the
export price regression.
Our coefficient of interest is β. It corresponds exactly to the triple-difference estimator defined
by equation (32). The interaction between owning a foreign affiliate and the tax rate difference
for low tax regime countries strictly identifies the change in intra-firm export unit values driven by
profit shifting motives. Thus, β reveals the firm’s transfer pricing behavior.
For consistency with the theory and the empirical methodology, we expand the regression
model in two ways. First, we add another interaction term to capture the effect of owning an
affiliate in a foreign country that has a higher corporate tax rate than the home market. Although
the theory framework does not suggest a differential price response for a change in the absolute
tax wedge |∆τjt| based on the tax regime of the foreign country (i.e., whether country j has a
higher tax rate or lower tax rate compared to the home market), we nevertheless allow for such
asymmetries in our estimation model.32
Second, we allow the year fixed effects αt to vary by the tax regime of the foreign country.
Thus, we denote by (αt,LowTax) and (αt,HighTax) the interaction terms between the year fixed effects
and the corresponding tax regime indicators. In adding these differential time effects, we aim to
control for unobservable time-varying factors that affect export prices and may be specific to the
group of countries that set higher, respectively lower tax rates.33
With these additional control variables, after rearranging, our regression model becomes:
lnpijkt = αijk + αt + δ ·DAffijt +[β1 · ILowTax + β2 · IHighTax
]× |∆τjt| ×DAffijt+
+ θ ·Xit + γ ·Xjt + αt,LowTax + αt,HighTax + εijkt (35)
This represents the estimation equation that we take to the data. To account for possible correla-
tions in export prices among all the Danish firms trading with the same foreign market, we cluster
the standard errors by country-year pairs.
32Asymmetries in MNCs’ responses to corporate tax rate differences may be explained, for example, by the unequalefforts of the home country tax authorities to inspect and detect transfer pricing in transactions with high taxcountries, relative to low tax countries. At the same time, it could be the case that governments in high tax countriesmay have on average a stronger tax enforcement power, deterring Danish MNCs from engaging in transfer pricing.
33These regime specific time effect represent a closer approximation to the country-year fixed effects from the priceequation (24)-(26).
21

4 Data
To estimate our model, we employ micro level data from Denmark. We combine two data sources
on Danish firms, one providing information on all international trade transactions, and the other
on firms’ ownership of foreign assets.
Our firm level data comes from the administrative records maintained by Statistics Denmark.
The Firm Statistics Register covers the universe of private sector Danish firms, with each firm
identified by a unique numeric code to facilitate drawing information on firm characteristics and
activities from multiple administrative registries. For each firm we observe the employment size
and level of sales, the industry affiliation (eight digit NACE code) for all its productive activities,
and all the international transactions reported in customs statistics.
For the estimations in this paper, we only focus on the sample of manufacturing exporters op-
erating during the time period 1999–2006. Based on the information on annual exports recorded by
value and by weight for each product code and foreign destination market, we determine the average
unit values by dividing export values by the quantities shipped at the firm–product–destination
level of detail. In constructing the sample, we drop the observations with negative or missing export
values, or for which we cannot measure unit values because of zero or missing weight values.34 We
further drop the top and bottom 1 percent of prices to eliminate measurement or keying errors.
To obtain information on foreign direct investments (FDI) involving Danish firms, we use data
on foreign firm ownership shares provided by Experian. Experian collects firm level information
on foreign ownership from the annual reports published by Danish firms, which are supplemented
with information from the transaction records maintained by the National Bank of Denmark.35
Each firm is reported in the dataset with the same unique numeric firm identifier as employed by
Statistics Denmark.
Based on the firm level information available in the Experian database, we construct two
indicator variables of foreign ownership. First, we identify the manufacturing firms that operate
in Denmark during our sample period and that are foreign owned (i.e., majority shares are owned
by foreign nationals). This foreign ownership indicator corresponds to a fraction of the inbound
34We lose approximately 4 percent of the data because of such data reporting issues.35The firms reported in the database may not cover the entire population of Danish firms undertaking foreign direct
investments. Even so, the data provided by Experian is of very high quality, being widely used by research analysts.In fact, this is the primary data source on Danish firms used in Bureau van Dijk’s Orbis and Amadeus databases.
22
FDI activity in Denmark.36 In a similar manner, we track Denmark’s outward FDI activity by
identifying the countries in which a Danish firm holds majority ownership of a local establishment.
In the end, the resulting firm level dataset on foreign direct investments reports for each Danish
firm information about its foreign ownership status, and its multinational activity, with a complete
list of foreign markets in which the firm owns affiliates.
To construct our estimation sample, we merge the firm level information on asset ownership
by foreign country with corresponding customs data on export transactions. Important for our
purposes, the resulting dataset reports for each manufacturing exporter the unit values of every
product shipped to a particular foreign country, and whether the firm owns a foreign affiliate in
that country.37
We do not have information on whether the beneficiary of a particular export transaction is
an affiliated party or an unrelated buyer. So, we rely on the expectation that whenever an exporter
owns a firm in a foreign market, at least a fraction of the observed export shipments must be intra-
firm. This means that the unit value observed in foreign markets where the firms owns a foreign
affiliate represents a weighted average of intra-firm and arm’s length prices. This is important for
interpreting the results from our estimation exercises.
We augment the Danish firm level dataset with foreign country level information on popu-
lation, per-capita GDP, real exchange rate and statutory corporate tax rate. All the country level
variables are taken from the Penn World Tables version 3.0. except for the corporate tax infor-
mation, which is collected from the OECD Tax Database and, for non-OECD countries, from the
World Tax Database provided by the Office of Tax Policy Research at the University of Michigan.
We use the statutory corporate tax rates to compute the difference in absolute value between the
tax rate of a foreign country and that of Denmark. In doing so, we track the countries with tax
rates above or below Denmark’s rate by creating indicator variables equal to one if a country has
High Tax, respectively Low Tax.
To summarize the tax rate dynamics present in our data, Figure 5 illustrates the time trend
36FDI statistics are defined based on a minimum threshold of 10 percent ownership share. By disregarding foreigninvestment activities that fall short of the 50 percent majority ownership break point, our indicator measure offoreign ownership underestimates the volume of inbound FDI. The same comment applies to outbound FDI, givenour interest in majority-owned foreign affiliates of Danish multinational firms.
37For all the firms that establish a foreign affiliate during the sample period, we remove the observation corre-sponding to the actual year of acquisition. This is done in order to mitigate measurement error in export unit values.This way we can be sure that when DAff =1 (DAff =0), the pricing strategy of the Danish exporter is characterized100 percent by its MNC (exporter-only) status.
23

for the Danish corporate tax rate in comparison to the level of taxes in several top export destination
markets. Figure 6 provides a histogram of the corporate tax rate difference between Denmark and
its foreign trade partner. Both data plots convey a similar message: the level of the Danish statutory
corporate tax rate is conservative, as there are important trade partners that charge significantly
higher, or significantly lower tax rates. The dispersion in the foreign corporate tax rates relative to
the level in Denmark is very useful for our estimation exercises, as it provides significant variation
to the constructed tax wedge variable.
To conclude the discussion on the data sources and sample construction, Table 1 provides the
summary statistics for the variables in our final dataset. A unit of observation is a firm-product-
country-year quadruplet. Trade transactions carried by Danish multinationals in foreign markets
where they have majority owned affiliates represent 11.4 percent of all observations. Almost 3
percent of all trade transactions correspond to Danish multinationals that establish their first
majority owned affiliate in a country during our sample period. Even though the number of export
transactions handled by Danish multinationals is not large by count, in value terms they account
for a significant fraction of total Danish exports. Table 2 provides evidence in support of this.
The reported summary statistics are constructed by year at firm-country level in order to illustrate
the exceptional growth and export performance of Danish multinationals in countries where they
establish foreign ownership.
5 Estimation Results
In this section we examine the extent to which Danish multinational firms shift profits to low tax
locations via transfer price manipulations. In estimating the regression model given by equation
(35), we exploit a novel source of variation: the establishment of new foreign affiliates by Danish
multinationals in countries where they have previously exported. This allows us to investigate
whether the changes in the product level export prices determined by new foreign firm ownerships
are systematically related to difference in corporate tax rates across countries. Throughout our
analysis, we treat firms’ foreign direct investment decisions as orthogonal to pricing decisions, es-
pecially once we condition on all the firm and country characteristics.38
38In this paper, we do not consider the ability to shift profits via transfer price manipulations a determining factorin investment location decisions, but rather an opportunistic behavior consequent to investments already made. This
24

5.1. Baseline Specification
Table 3 reports the effects of the corporate tax wedge on the unit value of a multinational’s
exports to a low/high tax destination, after controlling for all the relevant dimensions of data
heterogeneity that may affect the estimates. Overall, we find significant evidence that firms lower
the unit value of exports to low tax countries where they own affiliates. As column 1 shows, a 10
percentage point decrease in the corporate tax rate of a low tax country corresponds to a 5.7 percent
decrease in the export unit value of an MNC, relative to a pure exporter shipping the same product
to that market. This result is consistent with our theory that Danish multinationals undervalue
their exports to low tax countries in order to transfer profits and avoid taxation. We also find
evidence that multinational firms price their exports higher in high tax countries where they own
an affiliate, by comparison to pure exporters. However, the results are statistically insignificant.
Later, we will show subsamples where this difference becomes weakly significant.
The results reported in column 1 of Table 3 could be biased by two sources of endogeneity.
First, Danish firms that own affiliates in foreign countries could also themselves be affiliates of a
foreign multinational firm. It may be that Danish firms owned by foreign multinationals make
different transaction decisions than their domestic counterparts, particularly because of their in-
volvement in the tax avoidance strategies decided by their parent firms. Second, our estimation
exploits the data variation generated at the time when a firm establishes an affiliate in a foreign
country. If the firm sets up the foreign affiliate in response to a decline in export prices in low
tax countries, then this generates ambiguity in the direction of causation between acquisition and
fallings prices.
We address these two issues in columns 2 and 3 of Table 3. We add a control dummy variable
indicating the foreign ownership of the Danish firm, and a pre-MNC indicator controlling for the
price of that firm-product-destination export transaction in the year prior to the establishment of a
foreign affiliate. As the results in column 2 show, foreign ownership has no statistically significant
is because, for one, taxation policy can change quite frequently, making this source of income savings highly uncertainin the future. Furthermore, multinational firms exploit a variety of mechanisms to minimize their global tax burden,so setting up affiliates that undertake real activity may not necessarily be the most cost-effective option. In theend, even if transfer pricing were to be a determinant of investment locations, then the production and transfer ofintangibles must weigh in more heavily in this decision (i.e., higher valued transactions with lower risk of detection).Consistent with these explanations, the evidence in Blonigen and Piger (2012) suggest that foreign plant acquisitionsare insensitive to host country tax rates.
25

effect on export unit values. The same can be inferred from the estimates reported in column 3.
They suggest that there is no systematic variation in unit values the year prior to the establishment
of a foreign affiliate. If anything, the unit values of exports to low tax countries set by emerging
multinational firms actually increases slightly the year before this change of status, relative to pure
exporters.
In identifying MNCs’ pricing behavior, we exploit two sources of data variation. The first
comes from changes in the countries’ corporate tax rates relative to Denmark’s tax rate. The second
comes from the switch of an exporter-only firm into a multinational firm through the establishment
of a foreign affiliate. To separately exploit each source of data variation, we examine the price
effects from two distinct subsets of our treatment group. The results are summarized in Table 4.
For the first subsample, we select those firms who establish a foreign affiliate sometime during
our sample period, and drop all their export transactions that occurred prior to the foreign firm
ownership. That is, we only keep firm-product-country exporting spells that are entirely attributed
to pure exporters or to multinational firms. Our only source of data variation and coefficient
identification comes solely from changes in the tax wedge. Since any Danish firm in our sample is
too small at the international level to influence foreign governments into changing their corporate
tax rates, this variation is entirely exogenous to the firm’s behavior. That is, a country’s tax policy
is taken as given by each multinational corporation making intra-firm trade decisions. As Table 4
column 1 reports, our main results hold true even when using this restricted sample: multinationals
selling to a low tax country will reduce the unit value of their exports by 6.36 percent in response
to a 10 percentage point drop in that country’s tax rate.
A potential concern with exploiting this source of data variation is the possibility of sluggish
adjustments in transfer prices to changes in foreign tax rates. Multinational firms with continuously
owned foreign affiliates have a history of transfer prices that can be used by tax authorities towards
detecting profit shifting motives whenever there is a simultaneous change in transfer prices and
foreign corporate tax rates. This may attenuate a firm’s price response to a change in foreign
corporate tax rates. As a result, profit shifting may happen much more gradually over time.
Because of this consideration, we investigate the performance of our model on a sample of expanding
multinational firms.
For our second subsample, we remove from the estimation the export transactions by multi-
26

national firms that own affiliates in a given location for the entire sample period, and thus are never
observed acting as pure exporters at any point during in time. By doing so, we essentially eliminate
the data variation within a firm-product-country triplet that comes solely from movements in the
tax wedge.39 The resulting estimates are stronger. Table 4 column 2 shows an increase in the
price elasticity: a 10 percentage point decrease in a country’s tax rate relative to Denmark’s rate
corresponds to an 8.24 percent decrease in the unit value of affiliated exports. The results are even
more pronounced when we restrict the treatment group to only those multinationals that establish
a new affiliate, and thus remove the variation coming from closing down or selling an affiliate. Table
4 column 3 shows that for those multinationals that establish an affiliate in a low tax country, a
10 percentage point decrease in the tax rate relative to Denmark’s corresponds to a 9.13 percent
decrease in the export unit value. For this subsample, the tax wedge in the high tax countries also
influences significantly the average unit value of exports: a 10 percentage point increase in the rate
of a high tax country relative to Denmark’s corresponds to a 12.6 percent increase in the unit value
of exports by multinationals.
Non-measureable product characteristics can also determine the extent to which a firm can
shift profits overseas. For commodities sold on organized exchanges, or for products that have a
reference price, MNCs have a more difficult time justifying price differences to the tax authorities.
By contrast, prices of differentiated goods can more easily hide profit shifting under the guise of
product complexity or quality differentiation. To test this, we restrict the sample to products clas-
sified as “differentiated” based on the liberal classification proposed by Rauch (1999). As observed
from the results reported in Table 5, price manipulation is more pronounced among differentiated
goods. This finding is consistent across the subsamples previously considered in Table 4. The
estimates reported in column 1 suggest that a 10 percentage point increase in the tax wedge deter-
mines MNCs owning foreign affiliates in low corporate tax countries to export their goods at unit
values 6.48 percent below the arm’s length unit values charged by comparable exporters. While
not statistically significant, a 10 percentage point increase in the tax rate difference for high tax
countries corresponds to a 4.09 percent increase in the unit value of exports by multinationals.
These effects are much larger when estimated on the subsample of newly established affiliates.
39One advantage in exploiting changes in foreign firm ownership is that it allows us to observe firms making transferprice decisions in a new environment that is not constrained by prior intra-firm transactions. We believe that sucha scenario gives MNCs more bargaining power in defending their pricing strategies, potentially leading to largerestimates.
27

5.2. Robustness Exercises
To ensure the robustness of our results, we verify the stability of our estimates to: 1) various
sub-samples, 2) a narrower re-definition of the “treatment” group, and 3) possible non-linearities
in the main effect.
The first data cut considers the existence of a double taxation agreement (DTT) between
Denmark and each foreign country in the sample. These DTTs allow firms to credit foreign taxes
against their domestic tax bill. In theory, they would encourage firms to shift more income. On
the other hand, DTTs typically involve increased cooperation among partner countries in detecting
and penalizing tax evasion, and this may refrain MNCs from using transfer pricing as a method to
shift profits.
Table 6 reports the estimation results from this sample cut. For comparison purposes column
1 reproduces the baseline coefficients from Table 3 obtained from all goods trade data, and column
2 reproduces the coefficients from Table 5 based on the differentiated goods subsample. Columns 3
and 4 report the estimates from the double taxation agreement sub-sample using export transactions
of all goods and of differentiated goods respectively. While the sign and significance pattern is
identical across the two sets of columns, the magnitude of the estimates is larger in absolute value
in the DTT sub-sample. If a country has a double taxation agreement with Denmark, then a 10
percentage points decrease in the foreign corporate tax rate below Denmark’s rate results in MNCs
lowering their unit values by 6.34 percent on average when exporting to that destination. The fall
in unit values is slightly larger, 7.17 percent, if focusing on the differentiated goods subsample.
This evidence is consistent with DTTs providing incentives for engaging in more profit shifting.
In columns 5 and 6 of Table 6, we report the estimates from a subsample of countries con-
sidered to have judicial systems of poor quality based on Kaufmann, Kraay, and Mastruzzi (2004)
measure of ‘rule of law’. All else equal, these are the locations where the risk of penalty for profit
shifting via transfer pricing is low. As expected, the estimates from columns 5 and 6 are much large
in magnitude then their corresponding counterparts from the baseline specification in columns 1
and 2. The results suggests that Danish MNCs lower their unit values by 8.16 percent (8.28 percent
for differentiated goods) when exporting to destinations that witness a fall in their corporate tax
rate of 10 percentage points below Denmark’s tax rate.
28
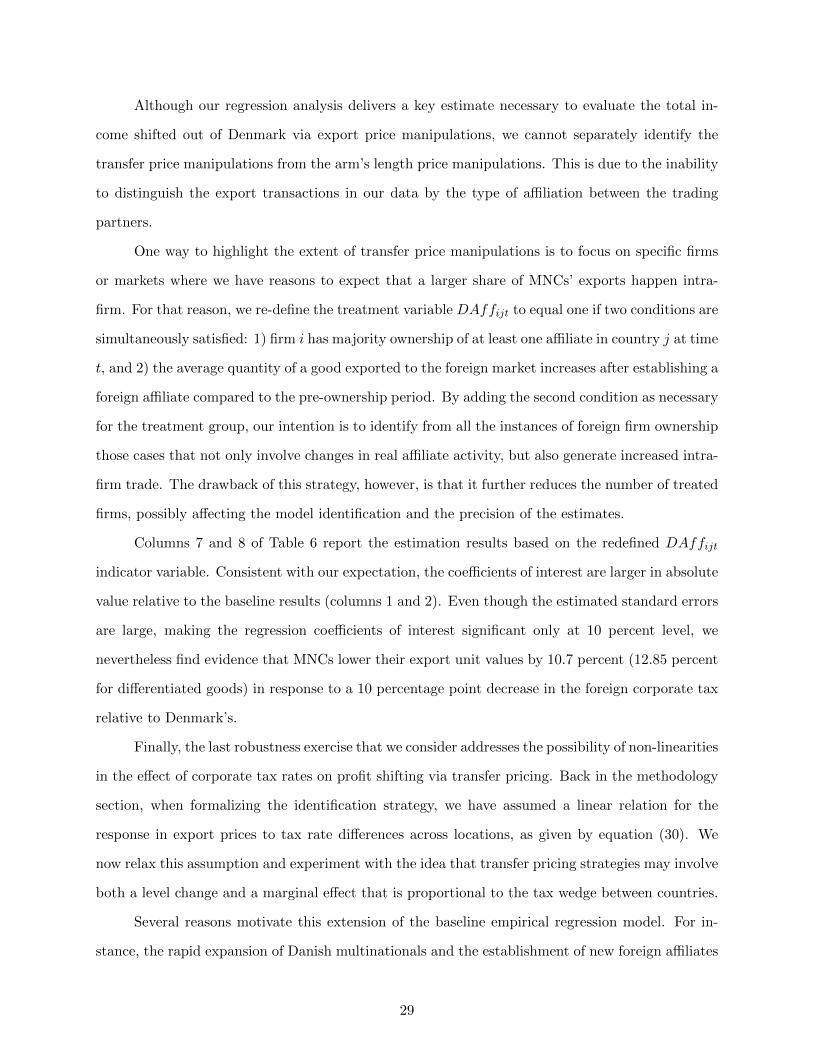
Although our regression analysis delivers a key estimate necessary to evaluate the total in-
come shifted out of Denmark via export price manipulations, we cannot separately identify the
transfer price manipulations from the arm’s length price manipulations. This is due to the inability
to distinguish the export transactions in our data by the type of affiliation between the trading
partners.
One way to highlight the extent of transfer price manipulations is to focus on specific firms
or markets where we have reasons to expect that a larger share of MNCs’ exports happen intra-
firm. For that reason, we re-define the treatment variable DAffijt to equal one if two conditions are
simultaneously satisfied: 1) firm i has majority ownership of at least one affiliate in country j at time
t, and 2) the average quantity of a good exported to the foreign market increases after establishing a
foreign affiliate compared to the pre-ownership period. By adding the second condition as necessary
for the treatment group, our intention is to identify from all the instances of foreign firm ownership
those cases that not only involve changes in real affiliate activity, but also generate increased intra-
firm trade. The drawback of this strategy, however, is that it further reduces the number of treated
firms, possibly affecting the model identification and the precision of the estimates.
Columns 7 and 8 of Table 6 report the estimation results based on the redefined DAffijt
indicator variable. Consistent with our expectation, the coefficients of interest are larger in absolute
value relative to the baseline results (columns 1 and 2). Even though the estimated standard errors
are large, making the regression coefficients of interest significant only at 10 percent level, we
nevertheless find evidence that MNCs lower their export unit values by 10.7 percent (12.85 percent
for differentiated goods) in response to a 10 percentage point decrease in the foreign corporate tax
relative to Denmark’s.
Finally, the last robustness exercise that we consider addresses the possibility of non-linearities
in the effect of corporate tax rates on profit shifting via transfer pricing. Back in the methodology
section, when formalizing the identification strategy, we have assumed a linear relation for the
response in export prices to tax rate differences across locations, as given by equation (30). We
now relax this assumption and experiment with the idea that transfer pricing strategies may involve
both a level change and a marginal effect that is proportional to the tax wedge between countries.
Several reasons motivate this extension of the baseline empirical regression model. For in-
stance, the rapid expansion of Danish multinationals and the establishment of new foreign affiliates
29

may first trigger a one time level change in transfer prices, which then evolves only subsequently and
gradually according to the tax rate difference between host and home markets. At the same time,
there may be a non-monotonic relation between the tax wedge and the transfer price manipulations
across countries, which could affect the slope coefficient but not necessarily the intercept.
To implement empirically this idea, we take the indicator variables identifying whether a
country has a higher or lower tax rate relative to the tax rate in Denmark, and interact each
one of them with the foreign affiliate indicator to get at the level effect, and with the continuous
interaction variable “affiliate×tax wedge” to obtain the marginal effect. That is, we estimate:
lnpijkt = δ ·DAffijt +[β10 + β11 · |∆τjt|
]×DAffijt × ILowTax +
[β20 + β21 · |∆τjt|
]×DAffijt × IHighTax
+ θ ·Xit + γ ·Xjt + αijk + αt + αt,LowTax + αt,HighTax + εijkt (36)
Note that if the level effects are zero, i.e., β10 = β20 = 0, then the above regression boils down to
the baseline model from equation (35).
Table 7 reports the results from estimating this extended regression using the full data sample.
For comparison purposes, column 1 reproduces the baseline estimates from Table 3 while column 2
includes the specification with the additional interaction terms. Interestingly, the estimates suggest
that while there is no level change in multinational firms’ export unit values to low tax destinations,
there is a positive and significant level change in multinational firms’ export unit values to high tax
countries. So, it is the insignificant but negative slope coefficient on the interaction term between
the affiliate indicator and the tax wedge variable that makes the overall transfer price effect in high
tax destinations insignificant. Evaluated at the sample average tax wedge, the marginal effects
reported at the bottom of Table 7 are significant.
6 Policy Implications
This section provides a back-of-the-envelope calculation that quantifies the tax revenue lost by the
Danish government due to the profit shifting activities of multinational firms, focusing on transfer
price manipulations.
Based on the estimation results from our new affiliate sample that are reported in column 3 of
Table 4, a typical Danish multinational firm exporting to a host country with a tax rate that is 6.1
30

percentage points lower than Denmark’s (i.e., our sample average tax wedge for low tax countries)
will sell a given product at a price that is 5.6 percent lower than a pure exporter, on average. This
drop in export prices reduces the revenue earned from international transactions by the Danish
parent firms, diminishing the income tax base in the home country. To determine the total ex-
port revenue underreported to the Danish tax authorities in a given year, we use country specific
information on the statutory corporate tax rate difference and calculate the following value:40
LostExpRev =∑
j∈LowTax
(β̂2(taxDk − taxj) ·XMNC,j
)(37)
where j indexes a destination country with a tax rate lower than Denmark’s, β2 is the coefficient
on the interaction term DAff ijt × |∆τjt| × ILowTax from equation (35), and XMNC,j denotes the
total volume of exports by Danish multinationals owning at least one affiliate in country j.
Using the export data for 2006, the last year of our sample, and the coefficient estimate
from our regression specification reported in column 3 of Table 4, we estimate that the Danish
multinationals in our sample underreported 141 million USD in export revenues through lower-than-
arm’s-length transfer prices to affiliates in low tax countries. At a Danish tax rate of 28 percent in
2006, this correspond to 39.5 million USD in forgone corporate tax revenues, the equivalent of 3.24
percent of the 1.2 billion USD in corporate income taxes collected by the Danish treasury from the
multinational corporations in the sample. For comparison, a 3.24 percent decrease in corporate
taxes collected by the IRS in 2006 would result in a loss of over 10 billion USD in tax receipts by
the US government.
7 Conclusions
Multinational corporations are beholden to their shareholders to maximize global profits. In pur-
suit of this goal, firms exploit differences in policies and tax rates across countries to minimize
their effective global tax burden. A consequence of reallocating profits across jurisdictions within
multinational firms is the erosion of countries’ reported income tax bases, despite the actual value
of production activities that occur in those countries. Concerns over the extent of tax avoidance by
multinational firms have risen so much in recent years that international taxation has now become
40A similar calculation is done by Bernard, Jensen, and Schott (2006) using estimates based on U.S. data.
31

a top priority for OECD and G8 member states.
In drafting action plans to fight the tax avoidance practices of multinational firms, tax au-
thorities need to establish the main mechanisms through which profit shifting occurs. This paper
contributes towards that goal by providing evidence for profit shifting via transfer price manipu-
lations of exported manufactured goods. Danish firms that own affiliates in low tax countries are
found to underprice their exports relative to sales to affiliates in countries with the same tax rate
as Denmark.
A contribution of this paper is to highlight a bias in measuring income shifting by comparing
transfer prices to controlled affiliates with arm’s length prices to uncontrolled third parties. We
show that multinationals who trade both with affiliated and unaffiliated parties have an incentive
to deviate the arm’s length price from profit maximizing levels in order to reduce the gap from
transfer prices and thus conceal profit shifting. To correct for this attenuation bias, we propose
a triple difference estimation strategy that exploits a novel source of variation coming from the
establishment of new plants in foreign markets characterized by various levels of statutory corporate
tax rates.
Future research should examine transfer pricing strategies for a multinational firm shipping
to multiple destinations. In this study, we concentrate only on bilateral trade between firms and
countries in which they have an affiliate. However, we can further correct for international tax
planning by studying how multinationals might hide profit shifting in one destination country by
manipulating prices in another destination.
References
Bartelsman, Eric J. and Roel M.W.J. Beetsma. 2003. “Why Pay More? Corporate Tax Avoidance
Through Transfer Pricing in OECD Countries.” Journal of Public Economics 87:2225–2252.
Bauer, Christian J. and Dominika Langenmayr. 2013. “Sorting Into Outsourcing: Are Profits Taxed
at a Gorilla’s Arm’s Length?” Journal of International Economics , forthcoming.
Bernard, Andrew, Bradford Jensen, and Peter Schott. 2006. “Transfer Pricing by U.S.-based
Multinational Firms.” NNER, Working Paper 12493.
32

Blonigen, Bruce A. and Jeremy Piger. 2012. “Determinants of Foreign Direct Investment.” Uni-
versity of Oregon, mimeo.
Cameron, David. 2013. “Prime Minister David Cameron’s Speech to the World Economic Forum
in Davos.” Jan. 24, 2013, http://www.number10.gov.uk/news/prime-minister-david-camerons-
speech-to-the-world-economic-forum-in-davos.
Clausing, Kimberly A. 2003. “Tax-motivated Transfer Pricing and US Intrafirm Trade Prices.”
Journal of Public Economics 87:2207–2223.
Cristea, Anca D. 2012. “Multinational Production with Costly Communication: The Role of
Foreign Skilled Labor.” University of Oregon, mimeo.
Desai, Mihir, Fritz Foley, and James R. Hines. 2006. “The Demand for Tax Haven Operations.”
Journal of Public Economics 90 (3):513 – 531.
Devreux, Michael. 2006. “The Impact of Taxation on the Location of Capital, Firms and Profit: A
Survey of Empirical Evidence.” Oxford University Centre for Business Taxation, Working Paper
No. 07/02.
di Giovanni, Julian. 2005. “What Drives Capital Flows? The Case of Cross-Border M&A Activity
and Financial Deepening.” Journal of International Economics 65 (1):127 – 149.
Egger, Peter, Wolfgang Eggert, Christian Kreuschnigg, and Hannes Winner. 2010. “Corporate
Taxation, Debt Financing and Foreign Plant Ownership.” European Economic Review 54:96–
107.
Egger, Peter, Wolfgang Eggert, and Hannes Winner. 2010. “Saving Taxes through Foreign Plant
Ownership.” Journal of International Economics 81:99–108.
Grubert, Harry and John Mutti. 1991. “Taxes, Tariffs and Transfer Pricing in Multinational
Corporation Decision Making.” Review of Economics and Statistics 17 (2):285–293.
Helpman, Elhanan, Marc Melitz, and Stephen Yeaple. 2004. “Export versus FDI with Heteroge-
neous Firms.” American Economic Review 94:300–316.
Hines, James R. 1996. “Altered States: Taxes and the Location of Foreign Direct Investment in
America.” The American Economic Review 86 (5):1076–1094.
———. 1999. “Lessons from Behavioral Responses to International Taxation.” National Tax
Journal 52:304–322.
Hines, James R. and Eric M. Rice. 1994. “Fiscal Paradise: Foreign Tax Havens and American
Business.” Quarterly Journal of Economics 109:149–182.
Huizinga, Harry, Luc Laeven, and Gaetan Nicodeme. 2008. “Capital Structure and International
Debt Shifting.” Journal of Financial Economics 88:80–118.
33
Irarrazabal, Alfonso, Andreas Moxnes, and Luca David Opromolla. 2012. “The Margins of Multina-
tional Production and the Role of Intrafirm Trade.” Journal of Political Economy Forthcoming.
Kaufmann, Daniel, Aart Kraay, and Massimo Mastruzzi. 2004. “Governance Matters III: Gover-
nance Indicators for 1996 - 2002.” The World Bank Economic Review 18 (2):253 – 287.
Keller, Wolfgang and Stephen R. Yeaple. 2012. “The Gravity of Knowledge.” American Economic
Review Forthcoming.
Kleinert, Jorn and Farid Toubal. 2013. “Production versus Distribution Oriented FDI.” Review of
World Economics , forthcoming.
KPMG. 2010. “Denmark: Government’s Plan of Action for the Taxation of Multinational Compa-
nies.” www.us.kpmg.com/microsite/taxnewsflash/tp/2010/TNFTP10 44Denmark.html.
Krautheim, Sebastian. 2012. “Heterogeneous Firms, Exporter Networks and the Effect of Distance
on International Trade.” Journal of International Economics 87 (1):27–35.
Kreuschnigg, Christian and Michael Devreux. 2012. “The Arm‘s Length Principle and Distorsions
to Multinational Firm Organization.” Journal of International Economics , forthcoming.
Melitz, Marc. 2003. “The Impact of Trade on Intra-Industry Reallocations and Aggregate Industry
Productivity.” Econometrica 71 (6):1695–1725.
OECD. 2013. “Addressing Base Erosion and Profit Shifting.” OECD Publishing.
http://dx.doi.org/10.1787/9789264192744-en.
Raimondos-Moller, Pascalis and Kimberley Scharf. 2002. “Transfer Pricing Rules and Competing
Governments.” Oxford Economic Papers 54 (2):230–246.
Rauch, James E. 1999. “Networks versus markets in international trade.” Journal of International
Economics 48 (1):7 – 35.
Swenson, Deborah L. 2001. “Tax Reforms and Evidence of Transfer Pricing.” National tax Journal
54 (1):7–25.
34

Figure 1: Numerical Solution to the MNC Pricing Decision
Note: The functional forms and parameters used in generating this graph are described in the Appendix.
Figure 2: Numerical Solution to the Kappa Function
Note: The functional forms and parameters used in generating this graph are described in the Appendix.
35

Year 1 Year 2
pxj1
pxj2
pmj1
pmj2
! j
!
Figure 3: Difference-in-Difference-in-Differences Identification Strategy
Note: The figure above illustrates the movement in export prices for two firms trading in country j. The econometri-cian observes the two export prices pjt for each of two firms, x and m. Firm m acquires an affiliate between the twoperiods. ϕ represents the time-invariant difference in prices across firms (which may or may not be country-specific),as defined in equation (28). Λj represents the change in the export price due to firm m’s acquisition of an affiliate incountry j, as defined by equation (29). Λj includes both the MNC’s price response to tax saving incentives, as wellas any other price responses triggered by the firm m’s cross-border expansion of activity.
36

-.18
-.15
-.12
-.09
-.06
-.03
0.0
3.0
6.0
9
-5 -4 -3 -2 -1 0 1 2 3 4 5
Time Line for Affiliate Ownership
Change OwnershipLow Tax Country
Expo
rt Pr
ice
of M
NCs
Rela
tive
to E
xpor
ters
Figure 4: Intra-firm Export Prices relative to Arm’s Length by Country Tax Status
Note: The trend lines depicts the average export price charged by a multinational firm relative to an exporting firmfor the same product shipped to the same destination market (conditional on time-invariant firm characteristics).The average relative export price is observed for 5 years before and after the multinational establishes its first foreignaffiliate in a country, focusing on countries with corporate tax rates below the rate in Denmark.
37

Denmark
Germany
USA
Sweden
France
.25
.3.3
5.4
.45
1999 2000 2001 2002 2003 2004 2005 2006
Top
Corp
orat
e Ta
x Ra
tes
Figure 5: Top Corporate Tax Rates for Denmark and Its Main Trade Partners
mean = - 0.40
median = - 1.00
0.0
2.0
4.0
6.0
8
Dens
ity
-40 -30 -20 -10 0 10 20 30 40
Tax Difference: DK - ForeignCtry
Figure 6: Distribution of Tax Rate Differences among Danish Export Markets
38

Table 1: Summary Statistics
Mean St. Dev. Min Max Obs.(1) (2) (3) (4) (5)
Firm CharacteristicsLog Price 4.982 1.783 0.397 9.552 1203111Log Quantity 4.500 2.918 0.000 18.572 1203111Log Employment 4.556 1.654 -4.605 9.440 1203111Log Sales 11.886 1.715 0.693 17.045 1203111
Firm Level Indicator VariablesNon-MNC Exporters 0.483 0.500 0.000 1.000 1203111Majority-owned Affiliate (DAff) 0.114 0.317 0.000 1.000 1203111Acquired Affiliates (during sample) 0.027 0.163 0.000 1.000 1203111Sold Affiliates (during sample) 0.011 0.106 0.000 1.000 1203111Foreign owned 0.178 0.382 0.000 1.000 1203111
Country CharacteristicsLog real pcGDP 11.985 0.598 9.026 13.189 1203111Log Population 9.776 1.577 5.625 14.089 1203111Log Exchange Rate 0.786 1.765 -7.897 7.882 1203111Statutory Corporate Tax Rate 0.283 0.069 0.085 0.450 1203111Low Corporate Tax Rate Dummy 0.544 0.498 0.000 1.000 1203111High Corporate Tax Rate Dummy 0.349 0.477 0.000 1.000 1203111ILowTax x |∆τjt| (Low Tax Wedge) 0.061 0.056 0.008 0.235 653951IHighTax x |∆τjt| (High Tax Wedge) 0.049 0.024 0.010 0.150 420397
Table 2: Representation of Danish Multinational Corporations (MNC) in the Trade Data
Year Exporters MNC % MNC All firms Related Party* % Related Party*
1999 45650 1206 2.64 203.3 40.5 19.922000 46725 1309 2.80 224.3 46.4 20.692001 47346 1477 3.12 237.7 57.6 24.232002 47976 1487 3.10 233.1 66.9 28.702003 46230 1586 3.43 230.3 66.0 28.662004 44890 1799 4.01 223.6 78.9 35.292005 42497 1755 4.13 229.6 77.7 33.842006 43030 1907 4.43 241.1 80.2 33.26
* Related-party exports are defined as the value of exports by MNCs to those countrieswhere they own an affiliate.
Note: These numbers are taken from the initial tax_exports dataset that includes only firm-country-year informationI further collapse the data at firm-country level by summing all observations
Number Firm-Country Pairs Export Values
Note: The unit of observation in the dataset used for the constructing the above tabulation is a firm-country-yeartriplet. This means that every time a firm exports to a new market, or every time a MNC opens an affiliate in a newcountry, these are counted as though they would be new firms.
39
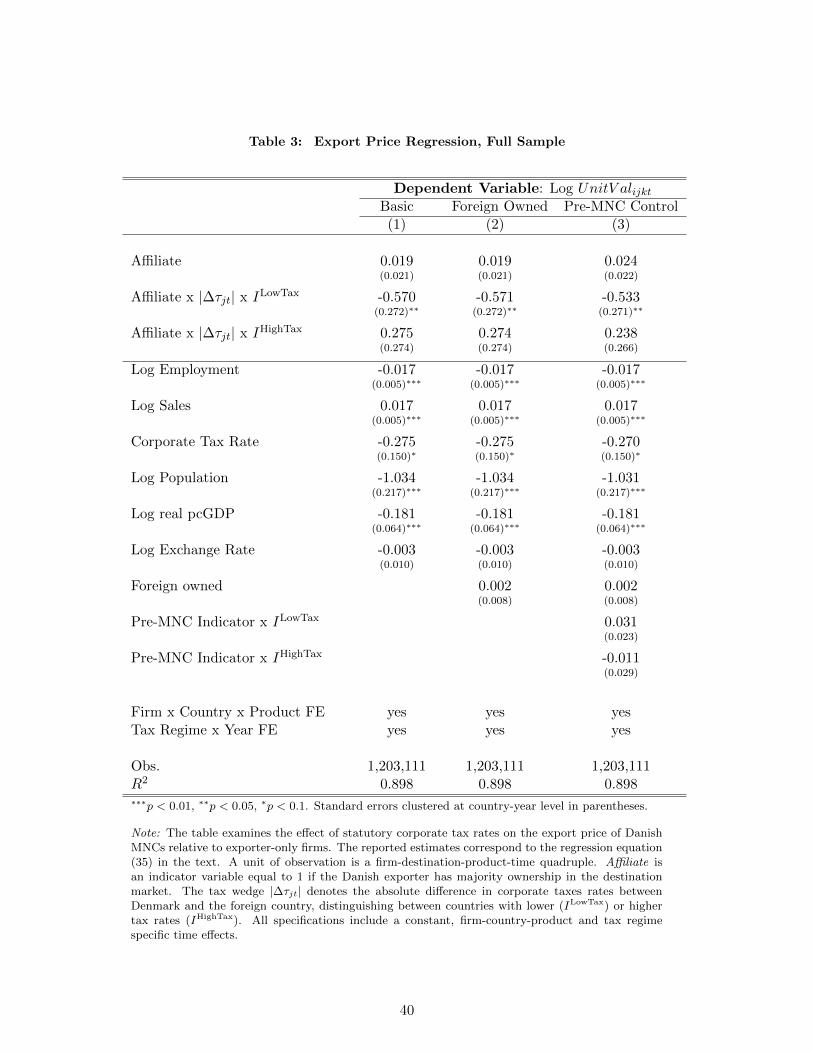
Table 3: Export Price Regression, Full Sample
Dependent Variable: Log UnitV alijktBasic Foreign Owned Pre-MNC Control(1) (2) (3)
Affiliate 0.019 0.019 0.024(0.021) (0.021) (0.022)
Affiliate x |∆τjt| x ILowTax -0.570 -0.571 -0.533(0.272)∗∗ (0.272)∗∗ (0.271)∗∗
Affiliate x |∆τjt| x IHighTax 0.275 0.274 0.238(0.274) (0.274) (0.266)
Log Employment -0.017 -0.017 -0.017(0.005)∗∗∗ (0.005)∗∗∗ (0.005)∗∗∗
Log Sales 0.017 0.017 0.017(0.005)∗∗∗ (0.005)∗∗∗ (0.005)∗∗∗
Corporate Tax Rate -0.275 -0.275 -0.270(0.150)∗ (0.150)∗ (0.150)∗
Log Population -1.034 -1.034 -1.031(0.217)∗∗∗ (0.217)∗∗∗ (0.217)∗∗∗
Log real pcGDP -0.181 -0.181 -0.181(0.064)∗∗∗ (0.064)∗∗∗ (0.064)∗∗∗
Log Exchange Rate -0.003 -0.003 -0.003(0.010) (0.010) (0.010)
Foreign owned 0.002 0.002(0.008) (0.008)
Pre-MNC Indicator x ILowTax 0.031(0.023)
Pre-MNC Indicator x IHighTax -0.011(0.029)
Firm x Country x Product FE XX yes yes yesTax Regime x Year FE yes yes yes
Obs. 1,203,111 1,203,111 1,203,111R2 0.898 0.898 0.898∗∗∗p < 0.01, ∗∗p < 0.05, ∗p < 0.1. Standard errors clustered at country-year level in parentheses.
Note: The table examines the effect of statutory corporate tax rates on the export price of DanishMNCs relative to exporter-only firms. The reported estimates correspond to the regression equation(35) in the text. A unit of observation is a firm-destination-product-time quadruple. Affiliate isan indicator variable equal to 1 if the Danish exporter has majority ownership in the destinationmarket. The tax wedge |∆τjt| denotes the absolute difference in corporate taxes rates betweenDenmark and the foreign country, distinguishing between countries with lower (ILowTax) or highertax rates (IHighTax). All specifications include a constant, firm-country-product and tax regimespecific time effects.
40

Table 4: Export Price Regression, Continuous versus New Establishments
Dependent Variable: Log UnitV alijktContinuous Non-Continuous New Affiliates
(1) (2) (3)
Affiliate 0.022 -0.033(0.022) (0.026)
Affiliate x |∆τjt| x ILowTax -0.636 -0.824 -0.913(0.318)∗∗ (0.328)∗∗ (0.300)∗∗∗
Affiliate x |∆τjt| x IHighTax 0.027 0.466 1.261(0.279) (0.598) (0.643)∗
Log Employment -0.008 -0.018 -0.021(0.006) (0.005)∗∗∗ (0.005)∗∗∗
Log Sales 0.010 0.016 0.020(0.006) (0.006)∗∗∗ (0.006)∗∗∗
Corporate Tax Rate -0.326 -0.249 -0.193(0.192)∗ (0.146)∗ (0.138)
Log Population -1.049 -1.024 -0.889(0.294)∗∗∗ (0.216)∗∗∗ (0.205)∗∗∗
Log real pcGDP -0.156 -0.167 -0.167(0.088)∗ (0.062)∗∗∗ (0.060)∗∗∗
Log Exchange Rate 0.007 -0.003 -0.005(0.008) (0.009) (0.009)
Firm x Country x Product FE yes yes yesTax Regime x Year FE yes yes yes
Obs. 736,228 1111520 1,083,235R2 0.901 0.900 0.901∗∗∗p < 0.01, ∗∗p < 0.05, ∗p < 0.1. Standard errors clustered at country-year level in parentheses.
Note: The table examines the effect of statutory corporate tax rates on the export price of Dan-ish MNCs relative to exporter-only firms. The reported coefficients correspond to the regressionequation (35) in the text, estimated across three different subsamples. All subsamples include the(common) reference group of exporter-only firms. In addition, the Continuous subsample includesonly MNCs that own affiliates in a country throughout the sample period. The Non-Continous sub-sample includes all MNCs that change their foreign firm ownership in a market. The New Affiliatessubsample includes only non-continous MNCs that acquire affiliates in a country during the sampleperiod (rather than sell). All other explanations from the footnote in Table 3 apply.
41

Table 5: Export Price Regression, Differentiated Goods Only
Dependent Variable: Log UnitV alijktAll Sample Continuous Affiliates New Affiliates
(1) (2) (3)
Affiliate 0.018 -0.040(0.027) (0.036)
Affiliate x |∆τjt| x ILowTax -0.648 -0.736 -0.967(0.323)∗∗ (0.361)∗∗ (0.353)∗∗∗
Affiliate x |∆τjt| x IHighTax 0.409 -0.008 1.668(0.321) (0.321) (0.886)∗
Log Employment -0.021 -0.005 -0.024(0.007)∗∗∗ (0.008) (0.007)∗∗∗
Log Sales 0.015 0.014 0.017(0.007)∗∗ (0.008)∗ (0.008)∗∗
Corporate Tax Rate -0.368 -0.417 -0.266(0.166)∗∗ (0.215)∗ (0.155)∗
Log Population -0.949 -0.940 -0.724(0.246)∗∗∗ (0.336)∗∗∗ (0.236)∗∗∗
Log real pcGDP -0.179 -0.131 -0.144(0.074)∗∗ (0.104) (0.070)∗∗
Log Exchange Rate -0.006 0.006 -0.006(0.012) (0.009) (0.011)
Firm x Country x Product FE yes yes yesTax Regime x Year FE yes yes yes
Obs. 790,561 476,194 712,163R2 0.885 0.889 0.889∗∗∗p < 0.01, ∗∗p < 0.05, ∗p < 0.1. Standard errors clustered at country-year level in parentheses.
Note: The table examines the effect of statutory corporate tax rates on the export price of DanishMNCs relative to exporter-only firms. The reported coefficients correspond to the regression equation(35) in the text, estimated using exports of differentiated goods only (Rauch (1999) classification) anddifferent data samples. Column 1 includes the trade transactions of differentiated goods carried by allfirms, while column 2 and 3 restricts the set of MNCs included in the same way as in columns 1 and 3of Table 4 respectively. All other explanations from the footnote in Table 3 apply.
42

Table 6: Robustness Checks
Dependent Variable: Log UnitV alijktBaseline Double Tax Treaty Poor Judicial Qual. Intra-firm Q Increase
All Goods Diff. All Goods Diff. All Goods Diff. All Goods Diff.(1) (2) (3) (4) (5) (6) (7) (8)
Affiliate 0.019 0.018 0.024 0.031 0.017 0.025 -0.182 -0.186(0.021) (0.027) (0.027) (0.035) (0.047) (0.058) (0.032)∗∗∗ (0.041)∗∗∗
Affiliate x |∆τjt| x ILowTax -0.570 -0.648 -0.634 -0.717 -0.816 -0.828 -1.072 -1.285(0.272)∗∗ (0.323)∗∗ (0.291)∗∗ (0.358)∗∗ (0.356)∗∗ (0.462)∗ (0.622)∗ (0.706)∗
Affiliate x |∆τjt| x IHighTax 0.275 0.409 0.304 0.395 1.251 1.450 0.589 0.988(0.274) (0.321) (0.867) (0.308) (0.698)∗ (0.941) (0.867) (1.037)
Log Employment -0.017 -0.021 -0.020 -0.029 -0.020 -0.031 -0.017 -0.020(0.005)∗∗∗ (0.007)∗∗∗ (0.006)∗∗∗ (0.007)∗∗∗ (0.009)∗∗ (0.011)∗∗∗ (0.005)∗∗∗ (0.007)∗∗∗
Log Sales 0.017 0.015 0.015 0.018 0.022 0.026 0.017 0.016(0.005)∗∗∗ (0.007)∗∗∗ (0.007)∗∗ (0.008)∗∗ (0.010)∗∗ (0.010)∗∗ (0.005)∗∗∗ (0.007)∗∗
Corporate Tax Rate -0.275 -0.368 -0.376 -0.513 -0.621 -0.779 -0.227 -0.316(0.150)∗ (0.166)∗∗ (0.149)∗∗ (.169)∗∗∗ (.170)∗∗∗ (.181)∗∗∗ (0.153) (0.167)∗
Log Population -1.034 -0.949 -1.012 -0.971 -0.820 -0.641 -1.041 -0.952(0.217)∗∗∗ (0.246)∗∗∗ (0.241)∗∗∗ (0.278)∗∗∗ (0.276)∗∗∗ (0.314)∗∗ (0.216)∗∗∗ (0.245)∗∗∗
Log real pcGDP -0.181 -0.179 -0.169 -0.176 -0.091 -0.087 -0.172 -0.170(0.064)∗∗∗ (0.074)∗∗ (0.068)∗∗ (0.080)∗∗ (0.088) (0.102) (0.065)∗∗∗ (0.074)∗∗
Log Exchange Rate -0.003 -0.006 -0.004 -0.006 -0.005 -0.008 -0.004 -0.006(0.010) (0.012) (0.009) (0.011) (0.009) (0.011) (0.010) (0.012)
Firm x Country x Product FE yes yes yes yes yes yes yes yesTax Regime x Year FE yes yes yes yes yes yes yes yesObs. 1,203,111 790,561 871,457 571,381 550,773 364,352 1,203,111 790,563R2 0.898 0.885 0.896 0.883 0.900 0.888 0.898 0.885∗∗∗p < 0.01, ∗∗p < 0.05, ∗p < 0.1. Standard errors clustered by country-year in parentheses.
Note: The table examines how robust is the effect of statutory corporate tax rates on the export price of Danish MNCs relative to exporter-only firms. Thereported coefficients correspond to the regression equation (35) in the text, estimated across various subsamples. All variable descriptions from the footnotein Table 3 apply. For comparison purposes, columns 1 and 2 reproduce prior estimates from Table 3 column 1 and Table 5 column 1. Columns 3 and 4 areestimated based on a subsample of countries that have a Double Taxation Treaty with Denmark in force. Columns 5 and 6 are obtained based on the bottomhalf countries ranked in terms of judicial quality (based on Kaufmann, Kraay, and Mastruzzi (2004) measure of ‘rule of law’). Finally, columns 7 and 8 areestimated based only on MNCs that establish new affiliates during the sample period and are observed increasing exports to that market post-acquisition.
43

Table 7: Export Price Regression, Level Changes and Marginal Effects
Dependent Var.: Log UnitV alijktEntire Sample
(1) (2)
Affiliate 0.019 0.002(0.021) (0.023)
Affiliate x ILowTax 0.005(0.025)
Affiliate x ILowTax x |∆τjt| -0.570 -0.490(0.272)∗∗ (0.297)∗
Affiliate x IHighTax 0.061(0.031)∗∗
Affiliate x IHighTax x |∆τjt| 0.275 -0.341(0.274) (0.420)
Log Employment -0.017 -0.017(0.005)∗∗∗ (0.005)∗∗∗
Log Sales 0.017 0.017(0.005)∗∗∗ (0.005)∗∗∗
Corporate Tax Rate -0.275 -0.246(0.150)∗ (0.146)∗
Log Population -1.034 -1.020(0.217)∗∗∗ (0.217)∗∗∗
Log real pcGDP -0.181 -0.177(0.064)∗∗∗ (0.064)∗∗∗
Log Exchange Rate -0.003 -0.003(0.010) (0.010)
Firm x Country x Product FE XXXXXX yes yesTax Regime x Year FE yes yesObs. 1,203,111 1,203,111R2 0.898 0.898
Marginal Effects:Low Tax Country -0.025
(0.015)∗
High Tax Country 0.045(0.016)∗∗∗
∗∗∗p < 0.01, ∗∗p < 0.05, ∗p < 0.1. Standard errors clustered at country-year level in parentheses.
Note: The table investigates non-linearities in the effect of statutory corporate tax rates on theexport price of Danish MNCs relative to exporter-only firms. The reported coefficients correspondto the regression equation (36) in the text. All variable descriptions from the footnote in Table3 apply. All specifications include a constant, firm-country-product and tax regime specific timeeffects.
44

Appendix
Figures 1 and 2 are generated by solving the model using the equations (5), (11), (13), (12), andthe two demand equations:
qi = p−σi Ai
qa = p−σa Aa
using the following parametrization:
σ = 2.3
τh = 0.30
c = 1
λ = 0.005
Ai = 1000
Aa = 1000.
45