munich personal repec archive - uni-muenchen.de · munich personal repec archive youth inclusion...
TRANSCRIPT

MPRAMunich Personal RePEc Archive
Youth Inclusion Policies and NEETs’Targeting Requirements in ArabCountries
Ahmed Driouchi and Tahar Harkat
IEAPS, Al Akhawayn University, Ifrane, Morocco
5 August 2017
Online at https://mpra.ub.uni-muenchen.de/80622/MPRA Paper No. 80622, posted 6 August 2017 21:09 UTC
Youth Inclusion Policies and NEETs’ Targeting Requirements in
Arab Countries
By: Ahmed Driouchi & Tahar Harkat
IEAPS, Al Akhawayn University, Ifrane, Morocco
Note: I certify I have the right to publish with the MPRA
Abstract:
The current research analyzes the trend of the NEETs, or young individuals
that are not in education, employment, or training, in the Arab economies, based on
the estimated NEET data in the contribution of Driouchi and Harkat (2017). Evidence
shows that the trends of the NEETs are increasing in 9 Arab economies, decreasing in
Algeria and statistically not significant for the remaining countries. This is assumed
to be related to the absence of policies, programs, and strategies that directly target
this category of youth. The present contribution assesses also, the determinants of the
NEETs using Granger Causality test. The link between this category of youth and
variables such as education, macroeconomic, and governance is assessed. The
empirical findings indicate that each of the Arab economies exhibits a unique model
with specific factors leading to the changes of this segment of population. This
provides supporting evidence of the surrounding environment of the NEETs, and gives
incentives to policy makers for monitoring through targeted policies, the significant
factors that enable this category of youth.
JEL: I25; I32; J62; J68.
Keywords: NEETs, Arab countries, Causality, Policies, Targeting

Introduction:
The higher the unemployment rate, the more countries, mostly developing
ones, are likely to have economic and political instability, (Harkat, Driouchi,
Achehboune, 2016). But, existing policies for youth inclusion in Arab economies are
mainly targeting employment and education, separately. ETF (2015a) indicates that
the unemployment indicator does not capture the overall situation of youth, as it does
not apprehend the human capital that is represented by education.
The absence of targeted policies of the NEETs in Arab countries can be
explained by data limitation, as there are only few times series observations for some
countries such as Algeria, Palestine, Saudi Arabia, and Egypt. For most of the
remaining economies, they either have single or no observations. For that, the current
contribution uses data generated from the unemployment of the group aged 15-24 as
in the contribution of Driouchi and Harkat (2017).
This research describes policies related to youth inclusion or development and
focuses on the analysis of the trends of the NEET population in Arab countries. In
addition, the current paper provides evidence on the causalities for each specific Arab
country to give incentive to policy makers to capture the determinants that lead to the
creation of this category of youth, as well as to support the change of policies that
relate to education and employability.
The questions that could be raised at this stage of the research are:
What are the existing policies of youth inclusion in Arab countries?
At which extent the NEETs exist in these economies and what are their
trends?
What are the likely determinants of the NEETs when considering
education, employment besides health, social, macroeconomic, and
governance variables?
Among these latter variables, what are the most important determinants
of this category of young individuals?
The current paper introduces a literature review about the NEETs followed by
a description of the youth inclusion policies in Arab countries. The third part analyzes

the trends of the NEET population followed by the likely determinants of this
category. The last part focuses on providing guidance to policy makers in the
conclusion and discussion section.
Literature Review:
Challenges that Arab countries are facing nowadays are exacerbated by the
increasing rates of unemployment among the youngest segments. This is mainly due
to the low levels of supply of job opportunities besides the growing share of the
youngest population. The youngest population in Algeria increased from 23% in 1990
to approximately 30% in 2011. This is also the case for Jordan, Libya, Qatar, Saudi
Arabia, Syria, and the United Arab Emirates (Chaoul, 2013; Angel-Urdinola et al.,
2010; 2012; 2014).
Youth of the group age between 15 and 24 in Arab countries are subject to
higher rates of unemployment compared to other age groups. Graph 1 indicates a
cross comparison between unemployment rate of youth and total unemployment rate
for all the sub-regions of the Arab economies, including Gulf Cooperation Council
(GCC) countries and Euro-med countries. Findings show that unemployment among
youth is twice the unemployment of older generations (Chaoul, 2013). This is due to
labor importing, poor educational system and school-to-work transition (ETF, 2014a).
Graph 1: Youth unemployment across the Arab region
Even if the Arab economies invested aggressively in education in these recent
years, the employment opportunities emerged in the form of low-level activities
besides those from the informal sector. In Tunisia, the unemployment rate accounted
for 14.2% in 2010, with a higher rate for young graduates that accounted for 47%.
Other persisting issues relate to the drop out from school. This latter has noticed an
average of 10% in Arab countries in 2014 (ETF, 2014a). Furthermore, student
participation in vocational education and training is low in Morocco, Tunisia, Algeria,
and Palestine. This accounts for 6% participation for this latter country (ETF, 2013a;
2013b). But concerning enrolment in universities, some countries scored high rates
such as Lebanon with 53% while other countries still have lower rates such as
Morocco with 13% (ETF, 2014a).
All Arab countries are putting strategies to increase employability as well as
education reach for youth. These strategies relate to youth inclusion. In the case of
Morocco, Jordan, Egypt, and Lebanon, focus is on highly skilled young individuals
that are not employed (Angel-Urdinola et al, 2012). Other focus is on urban areas, and
young women. With regard to active labor programs, most of Arab governments
divided these strategies to have public intermediation services to enhance job
matching quality and efficiency (World Bank, 2013; 2012; Murata, 2014), to create
training programs to increase skills and productivity of job seekers (Kluve, 2014;
Angel‑Urdinola et al, 2010), to have employment incentive programs to facilitate the
hiring process (Kluve, 2014; World Bank, 2012), to have public work programs (Del
Ninno et al, 2009), and to support entrepreneurship (ETF, 2013c, 2014b).
Algeria initiated many programs that are “Vocational Integration Assistance
Mechanism for Young People” that consists of 4 programs, “Social Inclusion
Programs to fight Youth Unemployment”, “Advice, Training, Project Funding,
Monitoring of Microbusinesses created by Young People”, “Micro Enterprise Support
Programs”, where providers of funds are National Employment Agency, Ministry of
National Solidarity, Social Development Agency, National Youth Employment
Support Agency, National Unemployment Insurance Fund, and National Agency for
Management of Microcredit besides many others.
For Egypt, the programs are “Youth for Employment project – pilot youth
units, building career counseling capacity”, “National Program for Training for

Employment”, “Job placement training program, school‑ to‑market program,
merchandiser training program”, “Egypt@Work program”, “The Community
Development Program (training, microcredit activities)”, “Small Enterprise
Development Organization”, “Shoroukh program”, “Emergency Labor Intensive
Investment Program (ELIP), costing USD 200 million”, and “Emergency
Employment Investment Program (EEIP), costing EUR 70 million”. Providers of
these programs are World Bank, European Union, SFD through the Organization for
Reconstruction and Development of the Egyptian Village, Social Fund for
Development (SFD), Industrial Training Council (ITC), Education for Employment
(EFE), “Nahdel El Mahroussa”, Ministry of Manpower and Migration: 300 job
service centers, Ministry of Manpower and Migration/ International Labor
Organization, “Masr Works” employability portal, and Licensed recruitment agencies
(ETF, 2015b).The following table summarizes the programs and strategies for the
remaining Arab countries.
Table 1: Active Labor Market Programs in Arab Mediterranean Countries:
Country Type Programs Providers
Jordan Intermediation - National Electronic Employment
System online platform
(www.nees.jo)
- Ministry of Labor: 21 public
employment offices
- Licensed recruitment
agencies
Training and
employment
incentives
- Programs that include training and
retraining, on-the-job training and
dual system: internships:
employment subsidies paid to
employers for wages and social
contributions
- Satellite Units Program
- National Campaign for
Employment - Employment subsidy
programs
- National Employment and
Training Company
- Vocational Training
Corporation
- Ministry of Labor
Entrepreneurship - Programs to support micro-
enterprises (lending and training
services)
- Development and
Employment Fund
Lebanon Intermediation - Electronic Labor Exchange: free
online job matching service
- National Employment
Office (NEO): 3 offices. By
law, NEO is the only labor
intermediation service
provider. However, several
private recruitment agencies
are illegally working in this
field.

Training - An accelerated vocational training
program
- Subsidized vocational training for
people with disabilities
- Short-term vocational training.
- Funded by NEO, provided
by NGOs and private
institutions
- Vocational Training Centre
- Social Development Centers
of Ministry of Social Affairs
Entrepreneurship - Integrated SME Support Program
(ISSP)
- Ministry of Economy and
Trade
- Kafalat (a Lebanese
financial company)
Libya Intermediation - Ministry of Labor and
Rehabilitation: 72 labor
offices
- Small professional
employment services have
started to develop
- Web-based employment
services
Training - Programs for demilitarized
fighters: “IFAD”, “KADER”
- Warriors Affairs
Commission (WAC)
Entrepreneurship - Program for demilitarized fighters
(thuwar): “Tamouh”
- SME program
- Warriors Affairs
Commission (WAC)
- National Small and Medium
Enterprise Program
Morocco Intermediation - National Agency for
Employment and Skills
Promotion (ANAPEC): 74
offices
- Private recruitment agencies
- Temporary employment
agencies
Training and
employment
incentives
- “Idmaj” - first-time recruitment
contract
- “Taehil” - training contract
- Support for training in emerging
sectors
- ANAPEC
Entrepreneurship - “Moukawalati” - support scheme
for small business creation
- ANAPEC
Public works - Intensive public work program - “Promotion nationale”
Palestine Intermediation - Ministry of Labor: 16
employment offices in the
West Bank and 5 offices in
the Gaza Strip
- Online portal: Jobs.ps.Ltd
Training - Various donor-sponsored
professional training and career
development programs
- NGOs: more than 2000
organizations active in the
labor market, such as
“Sharek” Youth Forum,
Education for Employment

Foundation, Welfare
Association
Entrepreneurship - Donor-sponsored entrepreneurship
promotion programs
- Palestinian Fund for
Employment and Social
Protection
- NGOs
Tunisia Intermediation - National Agency for
Employment and Independent
Work (ANETI): 91
employment offices. By law,
this is the only institution
allowed to provide labor
intermediation services.
Training and
employment
incentives
- Employability improvement
“cheque”
- Employment support “cheque”
- Program to foster employment
- Donor-sponsored programs
- ANETI
- NGOs
Entrepreneurship - Support for small business
entrepreneurs
- Donor-sponsored programs
- ANETI
- NGOs
Public works - Local community partnerships to
foster employment
- ANETI
Source: ETF, 2015b
Arab countries do not have policies directly linked to the NEET, as they lack
organizations to support this latter category. In addition, the lack of statistical
databases limits the understanding of the NEETs in the Arab region. Still, the most
recent contribution of Kovacheva, Popivanov, Kabaivanov (2017) indicates that even
the new policies in the Arab Mediterranean Countries target only general inclusion of
youth without specifying the NEETs.
Policies of youth inclusion in Arab countries define the age groups of the
young population differently. For instance, it is between 15 and 29 in Morocco and
between 18 and 35 in Egypt. For other countries, there is no clear definition of the age
group of the youth. This is the case of Algeria, Lebanon and Tunisia (Strategy
Morocco, 2014; Rhanem, 2015; Lebanon Youth Policy, 2012; Rossis, 2014;
Churchill, 2013; Floris, 2010; Rarrbo, 2010; Algeria, 2016).
Youth policies in Arab economies suffer from the lack of coordination. In the
case of Morocco, there is a gap between the skills provided in the educational system
and those required in the job market. This is also the case of Algeria and Tunisia
(Ministry Algeria, 2015). In addition to this, other issues that relate to the youth
policies are the imperfections of the existing ones. The imperfections in education

policies and programs in Morocco, Egypt, and Tunisia are illustrated with higher rates
of dropout from school at early stages, as the rate of leaving school is between 33%
and 50% within these economies (ETF, 2015a).
Youth policies need to include the NEETs. The contribution of the World
Bank (2013) indicates that the exclusion of this category within economies leads to
higher rates of poverty, more political instability, as well as higher economic losses.
Methods and Data:
The following contribution is the analysis of the estimated NEET data of the
Arab countries based on the contribution of Driouchi and Harkat (2017). The results
are divided into describing youth inclusion policies, analyzing the trends of the
NEETs population, and defining the likely determinants of the NEETs in Arab
economies.
The analysis of the youngest segment of the population within each of the
Arab countries indicates both the trends of the total young population and the NEETs
separately. An increasing young population with a negative trend of the NEETs
indicates that youth inclusion policies capture this category of individuals. But an
increasing trend of the NEETs population indicates that policies related to youth
exclude this segment.
The empirical method used for describing the NEETs trends and population in
Arab countries is a regression analysis given by the following model:
𝑌𝑡 = 𝛼 + 𝛽1𝑌𝑃𝑡 + 𝛽2𝑁𝑃𝑡
Where:
𝑌𝑡: is time period (independent variable);
𝑌𝑃𝑡: is the youth population of the age group between 15 and 24;
𝑁𝑃𝑡: is the NEETs population of the age group between 15 and 24;
𝛽1 and 𝛽2: are the coefficients corresponding to the YP and NP, respectively.
The third part of the analysis is a follow up of the contribution of Driouchi and
Harkat (2017b) based on the Granger Causality test. This test predicts the
unidirectional and bidirectional causalities between two time series variables in a
sense that a variable x helps predicting the accurateness of a value y and vise versa.
In addition to the NEETs variable, the other variables are enrolment in
education, enrolment in vocational and general education separately, expenditure on
education as a percentage of GNI, expenditure on health as a percentage of GDP, and

world governance variables. These variables are extracted from the World Bank for
the time period 1992 and 2016.
The governance indicators are divided into 6 variables that are: voice and
accountability, political stability, rule of law, government effectiveness, regulatory
quality, and control of corruption.
The political stability measures the chances of the destabilization of a
government taking into account terrorism and violent means. Concerning the
government effectiveness, it measures the stimulus of the relationship between the
public and private sector while the regulatory quality measures the government
support to the private sector. The rule of the law measures the extent the law governs
the economy and the control of corruption measures the power exerted by the public
sector on the private one. These variables are an index with values between -2 and 2.
The hypotheses to be tested are those of the contribution of Driouchi and
Harkat (2017b) and are summarized in the following tables:
Table 2: hypotheses of the Granger Causality test between the NEETs and the
educational variables
H0: NEET does not Granger cause Education
HA: Education does not Granger cause NEET
H0: NEET does not Granger cause General Education
HA: General Education does not Granger cause NEET
H0: NEET does not Granger cause Vocational
Education
HA: Vocational Education does not Granger cause
NEET
Table 3: hypotheses of the Granger Causality test between the NEETs,
macroeconomic and governance variables
H0: NEET does not Granger cause Expenditure on Education
HA: Expenditure on Education does not Granger cause NEET
H0: NEET does not Granger cause Expenditure on Health
HA: Expenditure on Health does not Granger cause NEET
H0: NEET does not Granger cause Labor Force
HA: Labor Force does not Granger cause NEET
H0: NEET does not Granger cause Voice and Accountability
HA: Voice and Accountability does not Granger cause NEET
H0: NEET does not Granger cause Political Stability
HA: Political Stability does not Granger cause NEET
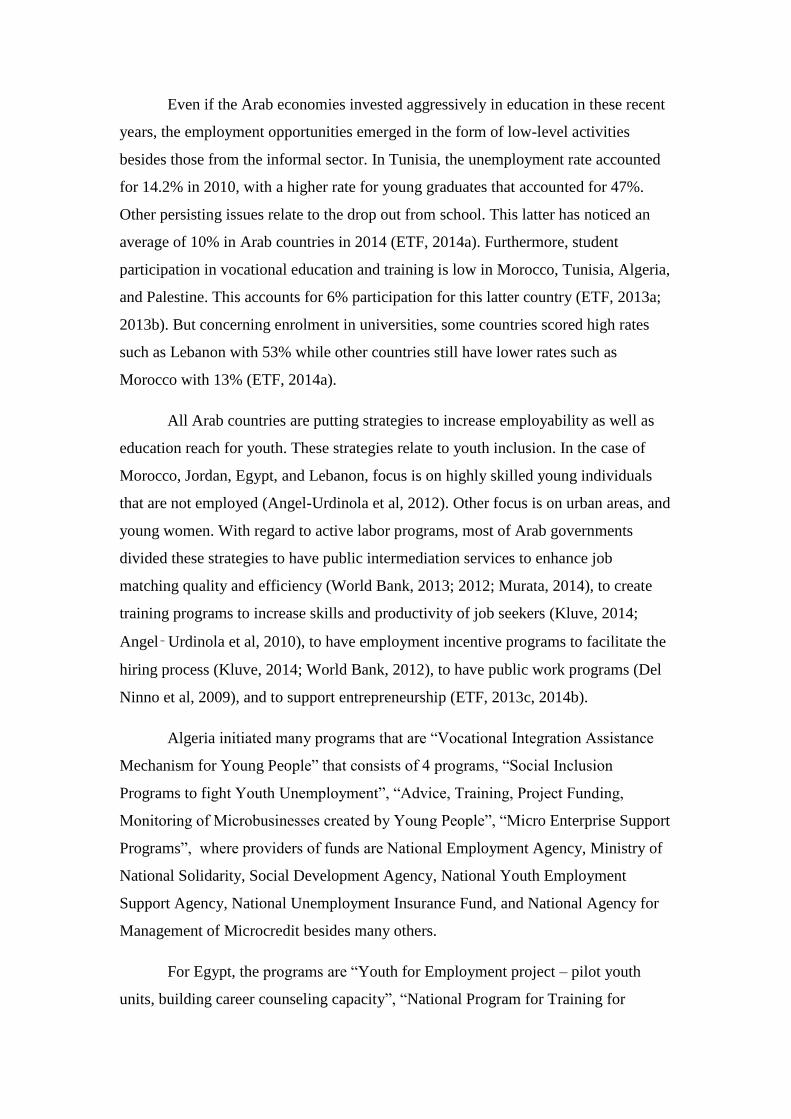
H0: NEET does not Granger cause Government Effectiveness
HA: Government Effectiveness does not Granger cause NEET
H0: NEET does not Granger cause Regulatory Quality
HA: Regulatory quality does not Granger cause NEET
H0: NEET does not Granger cause Rule of Law
HA: Rule of Law does not Granger cause NEET
H0: NEET does not Granger cause Control of Corruption
HA: Control of Corruption does not Granger cause NEET
Education causing the NEETs implies that the educational system cannot
support or reach the entire young segment. This is the case for the general or
vocational system. For the macroeconomic variable, the causal relationship captures
the determinants that lead to the creation of the NEETs such as health issues and
demand on the labor force. Finally, the governance indicator indicates whether if the
NEETs affect politically the economies or vise versa. For instance and in some
economies, the NEETs lead to the political instability.
Results and Discussion
Three sets of results are attained based on the empirical frameworks discussed above.
1. Unemployment and Education Programs and Policies in Arab Countries:
In Arab countries, policies related to the inclusion of the young segment under
25 years old target education and employment separately, which does not capture the
link between these two indicators. In addition to that, there are no policies targeting
directly the NEETs in Arab economies, and this can be explained by the lack of
understanding of this phenomenon.
According to the ILO (2010a) report related to the labor market policies,
Algeria, Jordan, Morocco, and Syria made many modifications in terms of
employment and education policies. In Morocco, there are many government agencies
that were recently implemented within the country to target youth. There is the
“Ministry of Youth and Sports” that was restructured in 2013. In addition to that,
there are ministries of health, employment, education that encourage youth activities.
Within Morocco, a human development initiative was launched in 2005 targeting the
youngest segment for employment initiatives. With regard to education, Morocco has
adopted an emergency plan between the years of 2009 and 2019 aiming to increase

access to education as well as education quality. The last strategy that relates to youth
is called “National Youth Strategy 2015-2030” that was launched by the Ministry of
Youth and Sports. This strategy envisages enhancing equality among the young
segment within the country by focusing on 5 main core elements that are the increase
of economic opportunities that will lead to the increase of employability, the
enhancing of access to public services for youth, the inclusion of youth in decision
making processes, the promotion of human rights, and the reinforcement of
institutional arrangements. It is the responsibility of the Ministry of Youth and Sports
to coordinate with other organization and execute the Action Plan (Euromed, 2014).
For Algeria, the government agencies targeting youth development are the
“Ministry of Youth and Sports” that was created in 1964. This latter organization
attempts to create in the near future a Council for youth (Rarrbo, 2010; Ministry
Algeria, 2015; Algeria, 2016). Algeria has adopted the Action Plan of the Algerian
Government that targets the creation of 3 million jobs before 2014, with at least
400 000 jobs yearly starting 2009. These policies besides policies related to the
educational system contribute to the significant decrease of the NEETs population, as
they target the young segment of the country.
The population of youth in Jordan is increasing significantly. This economy
has made reform programs including reshaping the skills of the labor force, upgrading
the industrial base within the economy and developing value added sectors in the
knowledge economy.
For Syria, the increase of the NEETs and the decrease of the young population
are mainly due to political reasons (OECD, 2010). In addition to that, the school
dropout rates within this economy for the years 2014 and 2015 are 40% and 32%
respectively. For this, the ministry of education in Syria implemented new techniques
in its educational system that enabled the coordination between education authorities
and stabilization actors to enhance the delivery of formal education. The ministry of
education also reformed the education policies and increased both the quality and
access to schools. This was done by the training of more than 15000 teachers and
reaching more than 480 000 students including areas that are hard to reach (Brussels
Conference Education Report, 2017).

Bahrain (ILO, 2010 b) is undergoing many reforms for the liberalization of the
economy. This latter country has made many initiative related to the increase of job
opportunities. These reforms were initiated in 2004 and 2007 through the “Labor
Market National Plan”. In addition, the government aims at providing technical and
financial support to job seekers.
In an ILO (2015) report, the NEETs are targeted in Tunisia. This contribution
split between the males and the females, as females have marriage as an alternative
for employment. Despites all the policies made on education and employment, the
NEETs population is still increasing within this economy, which leads questioning the
current strategies and the previous strategies for youth inclusion.
Concerning the main objective of the government of Yemen is to decrease
poverty (ILO, 2008). For this many actions were taking. These actions were
motivated by the “Poverty Reduction Strategy Paper” for the years between 2002 and
2005, and the government has developed the third Development Plan for Poverty
Reduction and Reform for the years between 2006 and 2010. This program has as
main goals the inclusion of citizens for the development progress with emphasis on
the youngest segment.
In the case of Egypt, the ILO (2014) indicates that despites the increasing
educational attainment, the NEETs population is still high while the unemployment
affects one-sixth the young segment. This is due to the lack of entrepreneurs in this
economy besides the low-quality jobs and informal employment.
Lebanon implemented many programs to decrease the school dropout and
enhance the education quality and accessibility within the country. For this, the
ministry of education and higher education implemented a “RACE plan 2017-2021”
that improved the capacity of the ministry for better administration of public schools.
In addition to that, there are strategies such as “Accelerated Learning Program” and
“Early Childhood Education Programs” that reached more youth and decreased so far
the school dropout by nearly 6% in a period of 1 year. This programs target also youth
that are refugees (Brussels Conference Education Report, 2017).
2. Trends of young population and NEETs population aged 15-24 in Arab
countries:
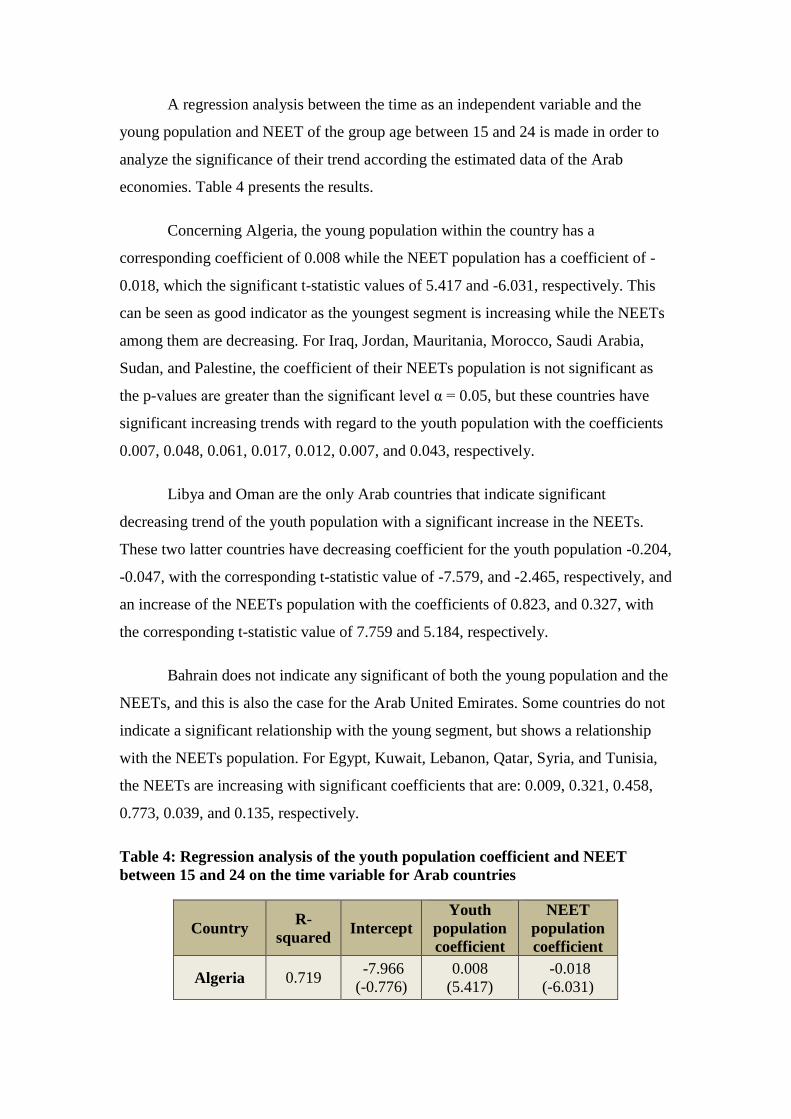
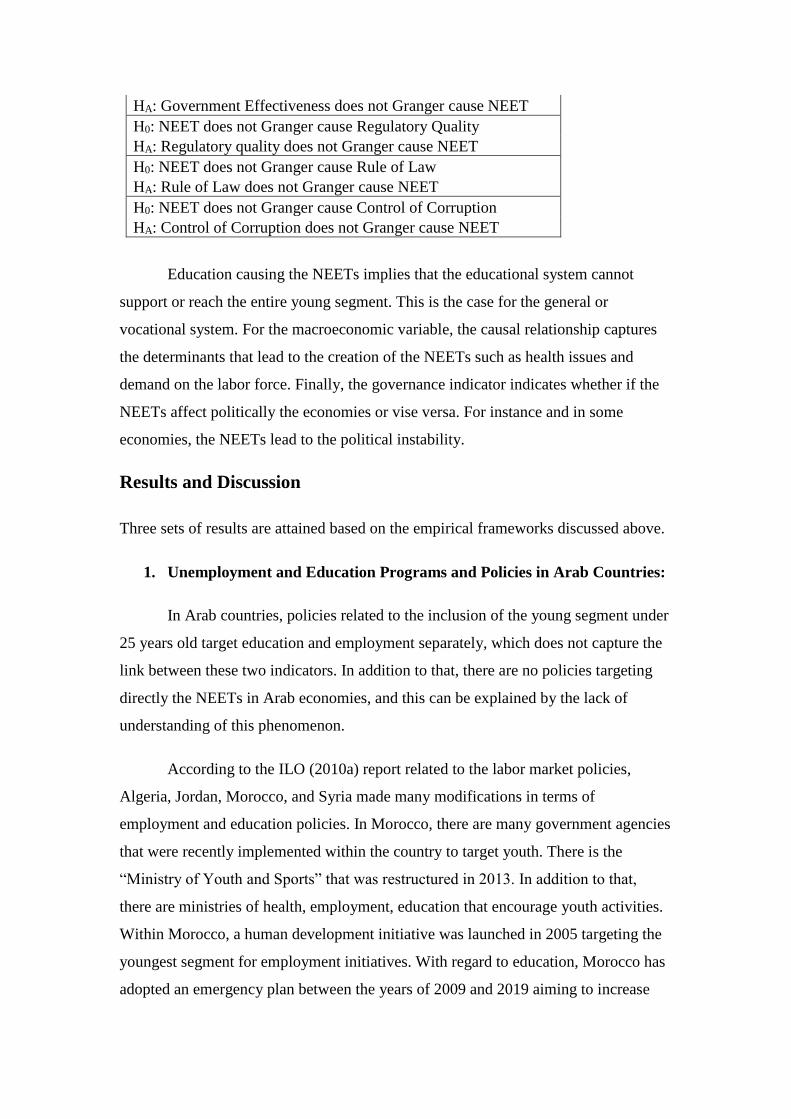
A regression analysis between the time as an independent variable and the
young population and NEET of the group age between 15 and 24 is made in order to
analyze the significance of their trend according the estimated data of the Arab
economies. Table 4 presents the results.
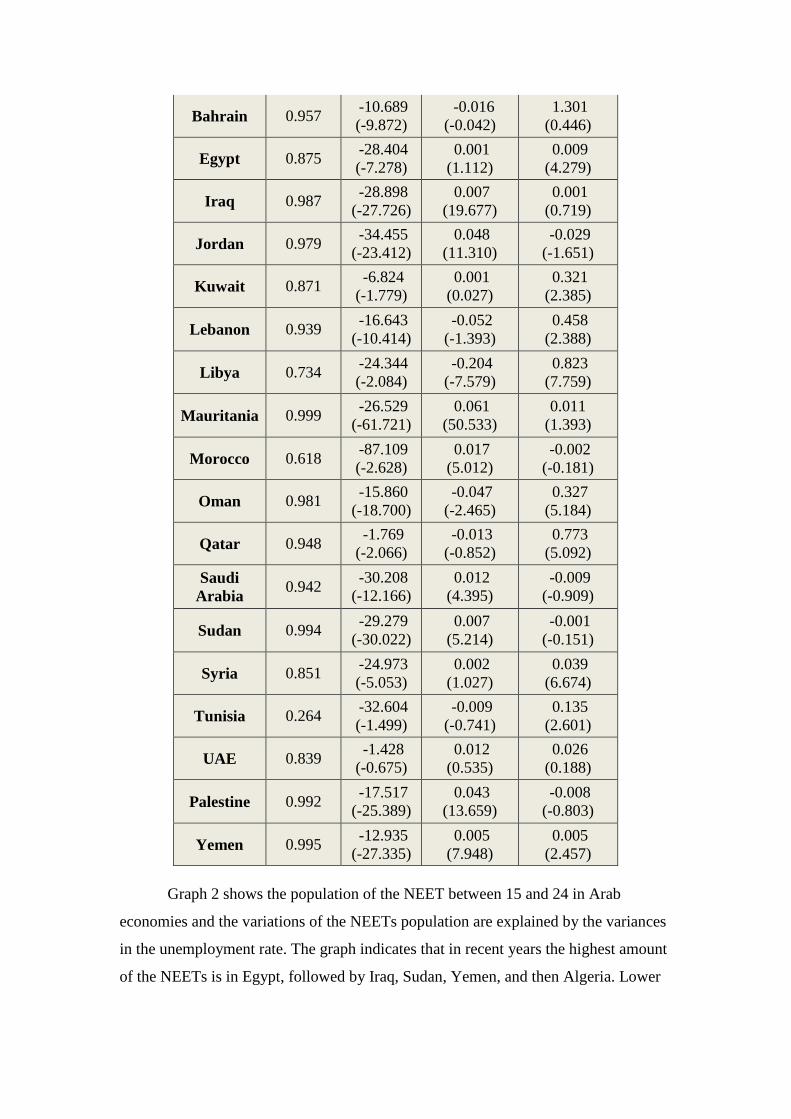
Concerning Algeria, the young population within the country has a
corresponding coefficient of 0.008 while the NEET population has a coefficient of -
0.018, which the significant t-statistic values of 5.417 and -6.031, respectively. This
can be seen as good indicator as the youngest segment is increasing while the NEETs
among them are decreasing. For Iraq, Jordan, Mauritania, Morocco, Saudi Arabia,
Sudan, and Palestine, the coefficient of their NEETs population is not significant as
the p-values are greater than the significant level α = 0.05, but these countries have
significant increasing trends with regard to the youth population with the coefficients
0.007, 0.048, 0.061, 0.017, 0.012, 0.007, and 0.043, respectively.
Libya and Oman are the only Arab countries that indicate significant
decreasing trend of the youth population with a significant increase in the NEETs.
These two latter countries have decreasing coefficient for the youth population -0.204,
-0.047, with the corresponding t-statistic value of -7.579, and -2.465, respectively, and
an increase of the NEETs population with the coefficients of 0.823, and 0.327, with
the corresponding t-statistic value of 7.759 and 5.184, respectively.
Bahrain does not indicate any significant of both the young population and the
NEETs, and this is also the case for the Arab United Emirates. Some countries do not
indicate a significant relationship with the young segment, but shows a relationship
with the NEETs population. For Egypt, Kuwait, Lebanon, Qatar, Syria, and Tunisia,
the NEETs are increasing with significant coefficients that are: 0.009, 0.321, 0.458,
0.773, 0.039, and 0.135, respectively.
Table 4: Regression analysis of the youth population coefficient and NEET
between 15 and 24 on the time variable for Arab countries
Country R-
squared Intercept
Youth
population
coefficient
NEET
population
coefficient
Algeria 0.719 -7.966
(-0.776)
0.008
(5.417)
-0.018
(-6.031)
Bahrain 0.957 -10.689
(-9.872)
-0.016
(-0.042)
1.301
(0.446)
Egypt 0.875 -28.404
(-7.278)
0.001
(1.112)
0.009
(4.279)
Iraq 0.987 -28.898
(-27.726)
0.007
(19.677)
0.001
(0.719)
Jordan 0.979 -34.455
(-23.412)
0.048
(11.310)
-0.029
(-1.651)
Kuwait 0.871 -6.824
(-1.779)
0.001
(0.027)
0.321
(2.385)
Lebanon 0.939 -16.643
(-10.414)
-0.052
(-1.393)
0.458
(2.388)
Libya 0.734 -24.344
(-2.084)
-0.204
(-7.579)
0.823
(7.759)
Mauritania 0.999 -26.529
(-61.721)
0.061
(50.533)
0.011
(1.393)
Morocco 0.618 -87.109
(-2.628)
0.017
(5.012)
-0.002
(-0.181)
Oman 0.981 -15.860
(-18.700)
-0.047
(-2.465)
0.327
(5.184)
Qatar 0.948 -1.769
(-2.066)
-0.013
(-0.852)
0.773
(5.092)
Saudi
Arabia 0.942
-30.208
(-12.166)
0.012
(4.395)
-0.009
(-0.909)
Sudan 0.994 -29.279
(-30.022)
0.007
(5.214)
-0.001
(-0.151)
Syria 0.851 -24.973
(-5.053)
0.002
(1.027)
0.039
(6.674)
Tunisia 0.264 -32.604
(-1.499)
-0.009
(-0.741)
0.135
(2.601)
UAE 0.839 -1.428
(-0.675)
0.012
(0.535)
0.026
(0.188)
Palestine 0.992 -17.517
(-25.389)
0.043
(13.659)
-0.008
(-0.803)
Yemen 0.995 -12.935
(-27.335)
0.005
(7.948)
0.005
(2.457)
Graph 2 shows the population of the NEET between 15 and 24 in Arab
economies and the variations of the NEETs population are explained by the variances
in the unemployment rate. The graph indicates that in recent years the highest amount
of the NEETs is in Egypt, followed by Iraq, Sudan, Yemen, and then Algeria. Lower

number of NEETs is found in Qatar and the United Arab Emirates. Still, the NEET
population is relative to the overall population of these countries.
Graph 2: NEET population between 15 and 24 in Arab countries:
3. Determinants of the NEETs in Arab countries
The following section introduces the results of the Granger causality test. The
used method gives the causality between economic, social, educational, and political
reasons and the NEET category. This method gives an indication to policy makers in
the Arab region to understand the root problem of the NEET category while
considering a specific model for each country. Analysis is indicated in terms of a
confidence level of 5% while also those that are significant under a 10% confidence
interval are indicated.
Empirical findings of Driouchi and Harkat (2017b) indicate that in the case of
Algeria, the NEETs cause vocational education, regulatory quality, and are caused by
expenditure on health. For Egypt, it is the general education that causes the NEETs. In
this latter economy, the NEETs cause the expenditure on education. In Saudi Arabia,
0
500
1000
1500
2000
2500
3000
3500
4000
4500
Po
pu
lati
on
in
th
ou
san
ds
NEET Population in Arab Countries
AlgeriaBahrainEgyptIraqJordanKuwaitLebanonLibyaMauritaniaMoroccoOmanQatarSaudi ArabiaSudanSyriaTunisiaUAEPalestineYemen
the NEETs have a double causality with education and labor force while in Palestine,
no causalities are found.
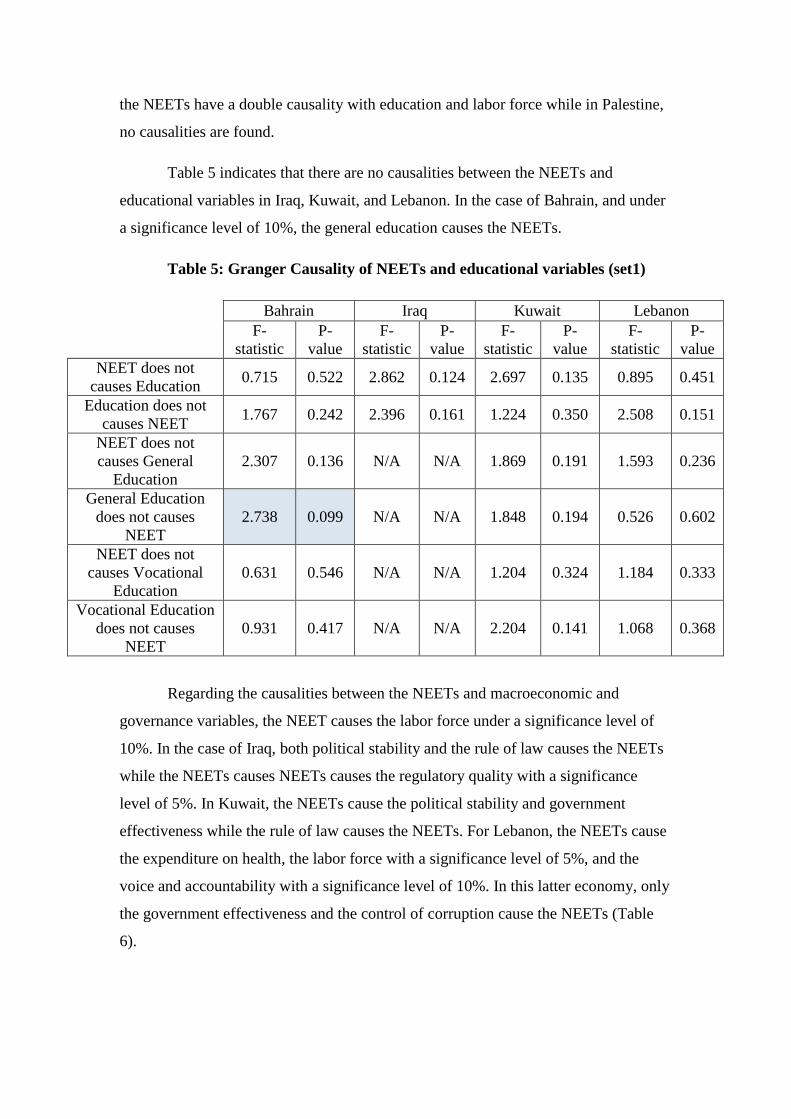
Table 5 indicates that there are no causalities between the NEETs and
educational variables in Iraq, Kuwait, and Lebanon. In the case of Bahrain, and under
a significance level of 10%, the general education causes the NEETs.
Table 5: Granger Causality of NEETs and educational variables (set1)
Bahrain Iraq Kuwait Lebanon
F-
statistic
P-
value
F-
statistic
P-
value
F-
statistic
P-
value
F-
statistic
P-
value
NEET does not
causes Education 0.715 0.522 2.862 0.124 2.697 0.135 0.895 0.451
Education does not
causes NEET 1.767 0.242 2.396 0.161 1.224 0.350 2.508 0.151
NEET does not
causes General
Education
2.307 0.136 N/A N/A 1.869 0.191 1.593 0.236
General Education
does not causes
NEET
2.738 0.099 N/A N/A 1.848 0.194 0.526 0.602
NEET does not
causes Vocational
Education
0.631 0.546 N/A N/A 1.204 0.324 1.184 0.333
Vocational Education
does not causes
NEET
0.931 0.417 N/A N/A 2.204 0.141 1.068 0.368
Regarding the causalities between the NEETs and macroeconomic and
governance variables, the NEET causes the labor force under a significance level of
10%. In the case of Iraq, both political stability and the rule of law causes the NEETs
while the NEETs causes NEETs causes the regulatory quality with a significance
level of 5%. In Kuwait, the NEETs cause the political stability and government
effectiveness while the rule of law causes the NEETs. For Lebanon, the NEETs cause
the expenditure on health, the labor force with a significance level of 5%, and the
voice and accountability with a significance level of 10%. In this latter economy, only
the government effectiveness and the control of corruption cause the NEETs (Table
6).

Table 6: Granger Causality of NEETs, macroeconomic, and governance
variables (set1)
Bahrain Iraq Kuwait Lebanon
F-
statistic
P-
value
F-
statistic
P-
value
F-
statistic
P-
value
F-
statistic
P-
value
NEET does not causes
Expenditure on Education 0.601 0.559 N/A N/A 1.184 0.335 0.014 0.986
Expenditure on Education
does not causes NEET 0.136 0.874 N/A N/A 2.354 0.131 1.633 0.230
NEET does not causes
Expenditure on Health 0.555 0.587 0.951 0.447 0.758 0.488 4.199 0.039
Expenditure on Health does
not causes NEET 1.642 0.231 0.570 0.598 0.163 0.851 1.671 0.226
NEET does not causes
Labor Force 3.633 0.054 N/A N/A 2.672 0.113 5.595 0.015
Labor Force does not causes
NEET 0.109 0.897 N/A N/A 0.857 0.451 0.189 0.830
NEET does not causes
Voice & Accountability 0.899 0.431 0.935 0.452 0.691 0.519 3.508 0.061
Voice & Accountability
does not causes NEET 1.839 0.198 1.429 0.323 0.241 0.789 1.648 0.230
NEET does not causes
Political Stability 0.688 0.534 1.433 0.301 4.781 0.049 1.794 0.235
Political Stability does not
causes NEET 0.343 0.721 13.415 0.004 1.164 0.366 1.306 0.329
NEET does not causes
Government Effectiveness 0.705 0.526 1.418 0.304 8.733 0.013 0.957 0.429
Government Effectiveness
does not causes NEET 0.385 0.694 0.249 0.786 1.487 0.289 4.952 0.046
NEET does not causes
Regulatory Quality 0.757 0.504 5.438 0.038 2.744 0.132 0.273 0.769
Regulatory Quality does not
causes NEET 1.967 0.209 1.026 0.407 0.521 0.615 0.796 0.488
NEET does not causes Rule
of Law 0.357 0.712 2.002 0.205 2.318 0.169 1.325 0.325
Rule of Law does not causes
NEET 2.861 0.124 11.892 0.006 6.119 0.029 0.207 0.818
NEET does not causes
Control of Corruption 0.462 0.648 0.412 0.668 1.547 0.278 0.505 0.624
Control of Corruption does
not causes NEET 0.408 0.679 0.437 0.662 0.027 0.974 8.780 0.012
Table 7 shows that the general education causes the NEETs in Libya while in
Qatar, the vocational education causes the NEETs.

Table 7: Granger Causality of NEETs and educational variables (set2)
Libya Qatar Sudan Syria
F-
statistic
P-
value
F-
statistic
P-
value
F-
statistic
P-
value
F-
statistic
P-
value
NEET does not causes
Education 1.307 0.329 0.159 0.855 2.018 0.203 0.868 0.440
Education does not causes
NEET 2.918 0.119 0.904 0.428 0.226 0.803 0.971 0.401
NEET does not causes General
Education 1.731 0.245 0.137 0.873 0.689 0.538 0.807 0.465
General Education does not
causes NEET 5.499 0.037 0.836 0.454 2.657 0.149 0.953 0.408
NEET does not causes
Vocational Education 0.010 0.989 1.209 0.328 0.799 0.492 0.882 0.434
Vocational Education does not
causes NEET 1.926 0.216 5.291 0.019 2.819 0.137 0.932 0.415
Table 8 summarizes the findings of the granger causality tests between the
NEETs, macroeconomic, and governance variables. Empirical results indicate that
expenditure on health and the rule of law causes the NEETs while there is a double
causality between the NEETs and regulatory quality in Libya. For Qatar, the NEETs
cause expenditure on health, regulatory quality and rule of law, while they have a
double causality with voice and accountability. For Sudan, it is the expenditure on
health and voice and accountability that causes the NEETs. In Syria, the NEETs cause
government effectiveness and regulatory quality. Further details indicate that under a
significance level of 10%, the control of corruption causes the NEETs in Libya while
it is caused by the NEETs in Qatar; also, the political stability causes the NEETs
while these latters cause the rule of law in Syria.
Table 8: Granger Causality of NEETs, macroeconomic, and governance
variables (set2)
Libya Qatar Sudan Syria
F-
statistic
P-
value
F-
statistic
P-
value
F-
statistic
P-
value
F-
statistic
P-
value
NEET does not causes Expenditure on
Education N/A N/A 1.232 0.316 1.225 0.319 0.998 0.389
Expenditure on Education does not
causes NEET N/A N/A 0.267 0.769 2.304 0.130 0.165 0.849
NEET does not causes Expenditure on
Health 0.558 0.585 4.488 0.033 1.488 0.261 1.818 0.201

Expenditure on Health does not causes
NEET 4.754 0.028 0.322 0.730 5.016 0.024 1.657 0.229
NEET does not causes Labor Force N/A N/A N/A N/A 0.299 0.752 N/A N/A
Labor Force does not causes NEET N/A N/A N/A N/A 0.292 0.757 N/A N/A
NEET does not causes Voice &
Accountability N/A N/A 27.304 0.001 1.513 0.257 1.088 0.388
Voice & Accountability does not
causes NEET N/A N/A 6.101 0.029 4.562 0.032 0.099 0.907
NEET does not causes Political
Stability N/A N/A 2.863 0.123 1.954 0.212 0.557 0.596
Political Stability does not causes
NEET N/A N/A 3.013 0.114 0.933 0.437 3.423 0.092
NEET does not causes Government
Effectiveness 0.501 0.617 2.763 0.131 0.412 0.678 8.644 0.013
Government Effectiveness does not
causes NEET 4.847 0.027 0.032 0.968 2.869 0.123 0.267 0.773
NEET does not causes Regulatory
Quality 5.687 0.034 7.650 0.017 2.026 0.202 4.838 0.048
Regulatory Quality does not causes
NEET 21.259 0.001 0.504 0.624 0.623 0.564 0.229 0.801
NEET does not causes Rule of Law 2.577 0.145 12.175 0.005 3.049 0.112 3.336 0.096
Rule of Law does not causes NEET 11.222 0.007 0.263 0.776 0.737 0.512 0.058 0.944
NEET does not causes Control of
Corruption 0.092 0.913 3.574 0.085 0.246 0.779 2.159 0.186
Control of Corruption does not causes
NEET 3.830 0.075 0.225 0.804 0.250 0.785 0.529 0.611
Table 9 indicates that the vocational education causes the NEETs in the United
Arab Emirates while education causes the NEETs in Yemen. No additional causalities
are found between the NEETs and the educational variables in Tunisia United Arab
Emirates, Yemen and Morocco.
Table 9: Granger Causality of NEETs and educational variables (set3)
Tunisia UAE Yemen Morocco
F-
statistic
P-
value
F-
statistic
P-
value
F-
statistic
P-
value
F-
statistic
P-
value
NEET does not causes
Education 0.269 0.767 0.875 0.458 1.944 0.213 0.061 0.942
Education does not causes
NEET 0.872 0.439 1.142 0.372 8.171 0.015 0.107 0.899
NEET does not causes
General Education 0.004 0.996 3.081 0.109 N/A N/A 0.473 0.631
General Education does not
causes NEET 0.448 0.648 0.597 0.576 N/A N/A 0.442 0.649
NEET does not causes
Vocational Education 0.984 0.415 0.348 0.714 N/A N/A 0.213 0.810
Vocational Education does
not causes NEET 1.623 0.256 4.553 0.036 N/A N/A 0.031 0.969
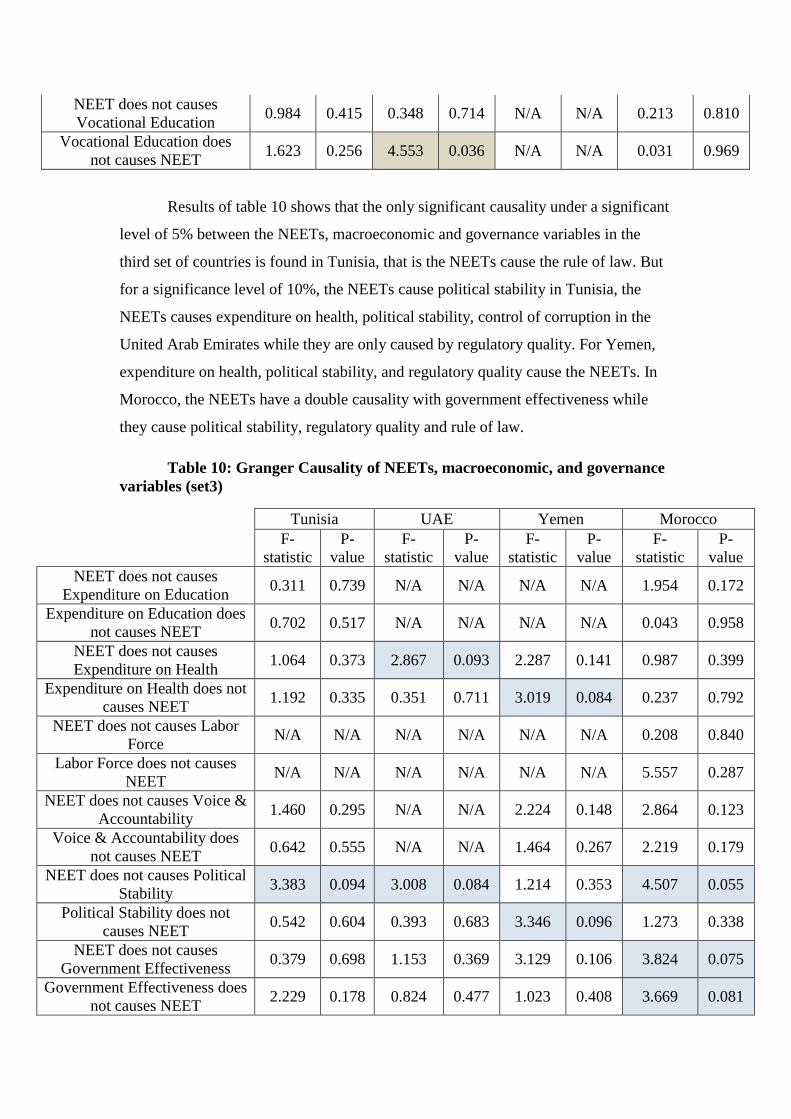
Results of table 10 shows that the only significant causality under a significant
level of 5% between the NEETs, macroeconomic and governance variables in the
third set of countries is found in Tunisia, that is the NEETs cause the rule of law. But
for a significance level of 10%, the NEETs cause political stability in Tunisia, the
NEETs causes expenditure on health, political stability, control of corruption in the
United Arab Emirates while they are only caused by regulatory quality. For Yemen,
expenditure on health, political stability, and regulatory quality cause the NEETs. In
Morocco, the NEETs have a double causality with government effectiveness while
they cause political stability, regulatory quality and rule of law.
Table 10: Granger Causality of NEETs, macroeconomic, and governance
variables (set3)
Tunisia UAE Yemen Morocco
F-
statistic
P-
value
F-
statistic
P-
value
F-
statistic
P-
value
F-
statistic
P-
value
NEET does not causes
Expenditure on Education 0.311 0.739 N/A N/A N/A N/A 1.954 0.172
Expenditure on Education does
not causes NEET 0.702 0.517 N/A N/A N/A N/A 0.043 0.958
NEET does not causes
Expenditure on Health 1.064 0.373 2.867 0.093 2.287 0.141 0.987 0.399
Expenditure on Health does not
causes NEET 1.192 0.335 0.351 0.711 3.019 0.084 0.237 0.792
NEET does not causes Labor
Force N/A N/A N/A N/A N/A N/A 0.208 0.840
Labor Force does not causes
NEET N/A N/A N/A N/A N/A N/A 5.557 0.287
NEET does not causes Voice &
Accountability 1.460 0.295 N/A N/A 2.224 0.148 2.864 0.123
Voice & Accountability does
not causes NEET 0.642 0.555 N/A N/A 1.464 0.267 2.219 0.179
NEET does not causes Political
Stability 3.383 0.094 3.008 0.084 1.214 0.353 4.507 0.055
Political Stability does not
causes NEET 0.542 0.604 0.393 0.683 3.346 0.096 1.273 0.338
NEET does not causes
Government Effectiveness 0.379 0.698 1.153 0.369 3.129 0.106 3.824 0.075
Government Effectiveness does
not causes NEET 2.229 0.178 0.824 0.477 1.023 0.408 3.669 0.081
NEET does not causes
Regulatory Quality 2.358 0.165 0.284 0.761 0.462 0.648 3.396 0.093
Regulatory Quality does not
causes NEET 0.043 0.958 3.994 0.069 4.274 0.061 0.706 0.526
NEET does not causes Rule of
Law 7.771 0.017 0.087 0.917 0.158 0.857 3.631 0.083
Rule of Law does not causes
NEET 1.608 0.266 1.232 0.348 0.443 0.659 0.007 0.993
NEET does not causes Control
of Corruption 0.521 0.615 3.454 0.091 0.505 0.624 0.366 0.706
Control of Corruption does not
causes NEET 0.702 0.527 0.206 0.819 1.051 0.399 0.058 0.944
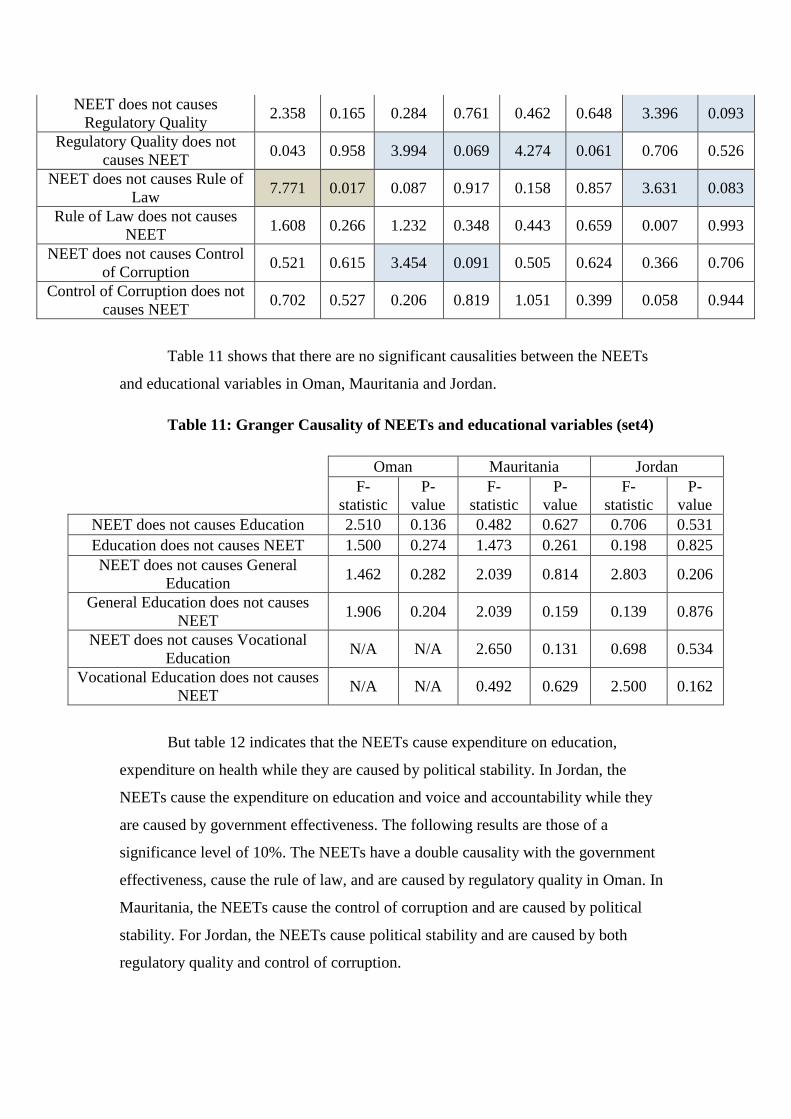
Table 11 shows that there are no significant causalities between the NEETs
and educational variables in Oman, Mauritania and Jordan.
Table 11: Granger Causality of NEETs and educational variables (set4)
Oman Mauritania Jordan
F-
statistic
P-
value
F-
statistic
P-
value
F-
statistic
P-
value
NEET does not causes Education 2.510 0.136 0.482 0.627 0.706 0.531
Education does not causes NEET 1.500 0.274 1.473 0.261 0.198 0.825
NEET does not causes General
Education 1.462 0.282 2.039 0.814 2.803 0.206
General Education does not causes
NEET 1.906 0.204 2.039 0.159 0.139 0.876
NEET does not causes Vocational
Education N/A N/A 2.650 0.131 0.698 0.534
Vocational Education does not causes
NEET N/A N/A 0.492 0.629 2.500 0.162
But table 12 indicates that the NEETs cause expenditure on education,
expenditure on health while they are caused by political stability. In Jordan, the
NEETs cause the expenditure on education and voice and accountability while they
are caused by government effectiveness. The following results are those of a
significance level of 10%. The NEETs have a double causality with the government
effectiveness, cause the rule of law, and are caused by regulatory quality in Oman. In
Mauritania, the NEETs cause the control of corruption and are caused by political
stability. For Jordan, the NEETs cause political stability and are caused by both
regulatory quality and control of corruption.
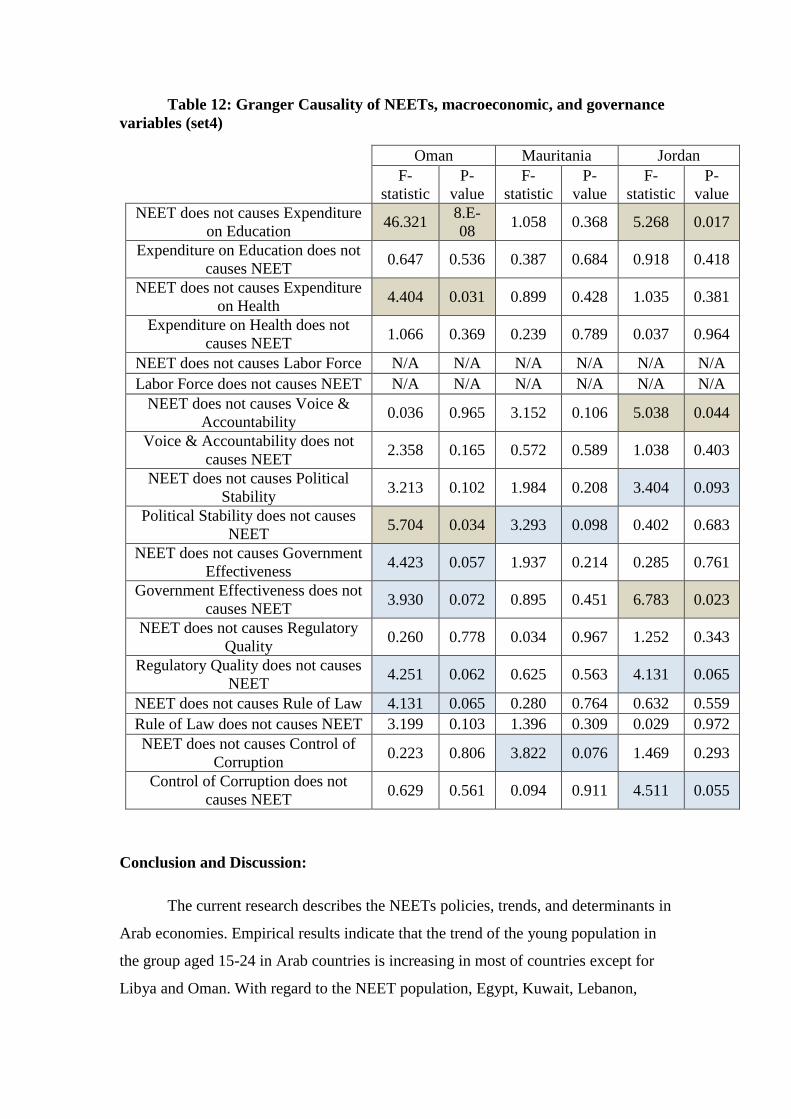
Table 12: Granger Causality of NEETs, macroeconomic, and governance
variables (set4)
Oman Mauritania Jordan
F-
statistic
P-
value
F-
statistic
P-
value
F-
statistic
P-
value
NEET does not causes Expenditure
on Education 46.321
8.E-
08 1.058 0.368 5.268 0.017
Expenditure on Education does not
causes NEET 0.647 0.536 0.387 0.684 0.918 0.418
NEET does not causes Expenditure
on Health 4.404 0.031 0.899 0.428 1.035 0.381
Expenditure on Health does not
causes NEET 1.066 0.369 0.239 0.789 0.037 0.964
NEET does not causes Labor Force N/A N/A N/A N/A N/A N/A
Labor Force does not causes NEET N/A N/A N/A N/A N/A N/A
NEET does not causes Voice &
Accountability 0.036 0.965 3.152 0.106 5.038 0.044
Voice & Accountability does not
causes NEET 2.358 0.165 0.572 0.589 1.038 0.403
NEET does not causes Political
Stability 3.213 0.102 1.984 0.208 3.404 0.093
Political Stability does not causes
NEET 5.704 0.034 3.293 0.098 0.402 0.683
NEET does not causes Government
Effectiveness 4.423 0.057 1.937 0.214 0.285 0.761
Government Effectiveness does not
causes NEET 3.930 0.072 0.895 0.451 6.783 0.023
NEET does not causes Regulatory
Quality 0.260 0.778 0.034 0.967 1.252 0.343
Regulatory Quality does not causes
NEET 4.251 0.062 0.625 0.563 4.131 0.065
NEET does not causes Rule of Law 4.131 0.065 0.280 0.764 0.632 0.559
Rule of Law does not causes NEET 3.199 0.103 1.396 0.309 0.029 0.972
NEET does not causes Control of
Corruption 0.223 0.806 3.822 0.076 1.469 0.293
Control of Corruption does not
causes NEET 0.629 0.561 0.094 0.911 4.511 0.055
Conclusion and Discussion:
The current research describes the NEETs policies, trends, and determinants in
Arab economies. Empirical results indicate that the trend of the young population in
the group aged 15-24 in Arab countries is increasing in most of countries except for
Libya and Oman. With regard to the NEET population, Egypt, Kuwait, Lebanon,

Libya, Oman, Qatar, Tunisia, United Arab Emirates, and Yemen have increasing
trends. Only Algeria has a significant decreasing trend of the NEETs while the
remaining countries have non-statistically significant trends.
This is explained by the lack of targeted policies, programs, and strategies that
relate directly to the NEETs category.
With regard to the determinants of the NEETs, the empirical results suggest
that there is a specific model, in which different factors cause the NEETs in each of
the Arab economies. For Iraq, the NEETs cause the regulatory quality while they are
caused by political stability and rule of law. For Kuwait, the NEETs cause both the
political stability and the government effectiveness, and are caused by the rule of law.
For Lebanon, the NEETs cause the expenditure on health and the labor force and are
caused by the government effectiveness and the control of corruption. For Libya, the
NEETs are caused by the general education, expenditure on health, government
effectiveness, rule of law, and have a double causality with the regulatory quality. In
Qatar, the NEETs are caused by the vocational education and have a double causality
with the voice and accountability. In this latter country, the NEETs cause the
expenditure on health, the regulatory quality, and the rule of law. For Sudan, the
expenditure on health and the voice and accountability cause the NEETs. In Syria, the
NEETs cause the government effectiveness and regulatory quality. For Tunisia, the
rule of law causes the NEETs while in the United Arab Emirates the vocational
education causes the NEETs. Education causes the NEETs in Yemen. In Oman, the
NEETs cause expenditure on education and expenditure on health and are caused by
political stability. In Jordan, the NEETs cause the expenditure on education and the
voice and accountability while they are caused by the government effectiveness.
The above causalities are significant under a significance level of 5%. For the
remaining countries that are Bahrain, Mauritania, and Morocco, no causalities are
found under this latter significance level, but are found only under a 10% significance
level. For Bahrain, NEETs cause the labor force and are caused by the government
effectiveness. In Morocco, the NEETs cause the political stability, the regulatory
quality, the rule of law, and have a double causality with the government
effectiveness. In Mauritania, the NEETs cause the control of corruption and are
caused by the political stability.

Policy makers in Arab economies need to put emphasis on implementing new
policies and programs that targets mainly the NEETs. For countries in which the
education, either general or vocational, causes the NEETs, it indicates that the
capacity of schools and universities cannot undertake all the young population. This is
also indicated by the expenditure on education. But when the NEETs are causing
education, it might indicate that there are higher rates of dropouts. This can be
interpreted such as schools and universities create discouraged students.
In the case where labor force being the factor that causes the NEETs, it shows
that there is a lack in the job supply within the economy. For this, governments need
to create more job opportunities.
Expenditure on health also causes the NEETs in some economies such as
Libya. This means that there should be health access, insurance and, coverage for
young individuals.
For the world governance indicators causing the NEETs, policy makers need
to put strategies for educating, training, and employing this category of young
individuals, as to reduce to likelihood of the occurrence of political instability.
Governments should also use different public offices, authorities, and NGOs to fight
against corruption, as well as to increase the efficiency of public administration and
the rule of low to minimize the NEETs population.
This contribution provides supporting evidence about the corresponding
environment specific to each of the Arab countries that lead to the increase of the
NEETs. Thus, policy makers should put targeted strategies for NEETs inclusion and
monitor the NEETs by monitoring education, macroeconomic, and political variables.
References:
Algeria. (2016). “Le président Bouteflika appelle la jeunesse à un sursaut "pacifique
et généreux" pour gagner la bataille du développement”, 04.07.2016,
http://www.radioalgerie.dz/news/fr/article/20160704/82607.html.
Angel‑Urdinola D.F. et al,. (2010). Non-public provision of active labor market
programs in Arab-Mediterranean Countries: An inventory of youth programs.
World Bank, Washington DC.

Angel‑Urdinola D.F. et al,. (2012). Public employment services in the Middle East
and North Africa. World Bank, Washington DC.
www.iza.org/conference_files/worldb2012/angel‑urdinola_d4898.pdf
Angel‑Urdinola D.F. and Leon‑Solano, R.A., (2014). A reform agenda for
improving the delivery of ALMPs in the MENA region. IZA Journal of Labor
Policy, vol. 2, 2013, pp. 1‑25. www.izajolp.com/content/2/1/13
Brussels Conference Education Report. (2017). Preparing for the Future of Children
and Youth in Syria and the Region through Education: London One Year On.
Supporting the future of Syria and the region, 1-32. Retrieved from http://wos-
education.org/uploads/reports/170331_Brussels_paper.pdf
Chaoul, H. (2013). Arab youth unemployment. Alkhabeer Capital, 1-12.
Churchill, E. (2013). Youth work in Tunisia after the eevolution. Euromed Youth
Program IV Report.
Del Ninno C. et al,. (2009). How to make public works work: a review of the
experiences. Social Protection Paper 0905, World Bank, Washington DC,
2009.
Driouchi, A., Harkat, T. (2017). Counting the NEETs for countries with no or less
data, using information on unemployment of youth aged 15-24: The case of
Arab countries. MPRA 79330. 1-19
Driouchi, A., Harkat, T. (2017b). Determinants of NEETs, using Granger Causality
Tests: Applications to ECE and Arab Economies. MPRA 78099. 1-28
ETF. (2015a). Young people not in employment, education or training (NEET): An
overview in ETF partner countries. 1-76. Retrieved from
http://www.etf.europa.eu/webatt.nsf/0/BFEEBA10DD412271C1257EED0035
457E/$file/NEETs.pdf
ETF (European Training Foundation). (2015b). The challenges of youth
employability in Arab Mediterranean countries: The role of active labor
market programs. ETF.
http://www.etf.europa.eu/webatt.nsf/0/4C4059A5BA350653C1257E52004533
77/$file/Youth%20employability%20AMCs.pdf
ETF (European Training Foundation). (2014a). Employability in the Mediterranean
region. updated policy paper, ETF, Turin.
www.etf.europa.eu/web.nsf/pages/Employability_Mediterranean_2013
ETF (European Training Foundation). (2014b). Employment policies and active labor
market programs in Tunisia. ETF, Turin, Luxembourg.
www.etf.europa.eu/web.nsf/pages/Employment_policies_Tunisia
ETF (European Training Foundation). (2014c). Young people not in employment,
education or training in the ETF partner countries. ETF, Turin.

ETF (European Training Foundation). (2013a). Youth employment: challenges and
policy responses in the Arab Mediterranean countries. Policy paper presented
to the High Level Policy Forum in Marseille on 6 October 2013, ETF, Turin.
www.etf.europa.eu/web.nsf/pages/Youth_employment_AMC
ETF (European Training Foundation). (2013b). Torino process 2012: Southern and
Eastern Mediterranean. ETF, Turin.
ETF (European Training Foundation). (2013c). Training for women entrepreneurs: an
imperative for growth and jobs. INFORM Issue 14, ETF, Turin.
Euromed. (2014). Youth work in Morocco and youth participation projects at local
level. 1-21. Retrieved from https://www.salto-youth.net/downloads/4-17-
3140/def_p_1-40_youth_work_morocco.pdf.
Floris, S. (2010). Tunisia. Studies on youth policies in the Mediterranean partner
countries. EuroMed Youth III Program.
Harkat, T., Driouchi, A., Achehboune, A. (2016). Generational gap and youth in Arab
countries. MPRA 75834. 1-33
International Labor Organization (ILO). (2015a). Global employment trends for youth
2015. (Geneva).
International Labor Organization (ILO). (2014). Labor market transitions of young
women and men in Egypt. International Labor Office, 1-72.
International Labor Organization (ILO). (2010a). Labor market policies and
institutions: A synthesis report - The cases of Algeria, Jordan, Morocco, Syria
and Turkey. International Labor Office - Geneva, 1-77.
International Labor Organization (ILO). (2010b). Kingdom of Bahrain Decent Work
Country Program 2010–2013. International Labor Office, 1-24.
International Labor Organization (ILO). (2008). Decent work country program:
Republic of Yemen. International Labor Office, 1-34.
Kluve, J. (2014). Active labor market policies with a focus on youth. Working paper,
ETF, Turin, 2014.
Kovacheva, S., Popivanov, B., & Kabaivanov, S. (2017). Youth policy in Arab
Mediterranean countries in a comparative perspective. SAHWA, 1-36.
Lebanon Youth Policy. (2012). Endorsed by the Lebanese Council of Ministers,
03.04.2012,
http://www.youthpolicy.org/national/Lebanon_2012_National_Youth_Policy.
Ministry Algeria. (2015). “Un Conseil supérieur pour orienter et suivre les décisions
arrêtées par l’Etat au bénéfice de la jeunesse, annonce M. Abdelkader
Khomri”. http://www.radioalgerie.dz/news/fr/article/20150426/38309.html
Murata A. (2014). Designing youth employment policies in Egypt. Global Economy
& Development working paper No. 68, Centre of Universal Education at
Brookings, Washington DC.
OECD. (2010). Opportunities and Challenges in the MENA Region. 1-27.
Rarrbo, K. (2010). Studies on youth policies in the Mediterranean partner countries.
EuroMed Youth III Program.
Rhanem, K. (2015). Country sheet on youth policy in Morocco. Partnership between
the European Commission and the Council of Europe in the field of youth.
http://pjpeu.coe.int/documents/1017981/8534762/Morocco+country+sheet-
2015.pdf/bb33a361-ce20-472cbdb3-20096a129e9f
Rossis, N. (2014). Youth Work in Lebanon and Cultural Identities: ‘Diversity of
Communities: Richness or…?’”, EuroMed Report,
https://www.euromedyouth.net/IMG/pdf/youth_in_lebanon_gb_hd_on_line.pd
f
Strategy Morocco. (2014). “Stratégie nationale intégrée de la jeunesse 2015-2030.
Pour une jeunesse citoyenne, entreprenante, heureuse et épanouie”.
http://www.mjs.gov.ma/sites/default/files/strategiemorocco.pdf
World Bank. (2012). Soft skills or hard cash? The impact of training and wage
subsidy programs on female youth employment in Jordan. Policy Research
Working Paper No 6141, World Bank, Washington DC.
World Bank. (2013). Jobs for shared prosperity: time for action in the Middle East
and North Africa, World Bank, Washington DC.