multiple folding mechanisms of protein...
TRANSCRIPT

Multiple Folding Mechanisms of Protein UbiquitinJian Zhang,1 Meng Qin,1 and Wei Wang1,2*1National Laboratory of Solid State Microstructure and Department of Physics, Nanjing University, China2Interdisciplinary Center of Theoretical Studies, Chinese Academy of Sciences, Beijing, China
ABSTRACT Based on the C� Go-type model,the folding kinetics and mechanisms of proteinubiquitin with mixed �/� topology are studied bymolecular dynamics simulations. The relaxation ki-netics shows that there are three phases, namely themajor phase, the intermediate phase and the slow-est minor phase. The existence of these three phasesare relevant to the phenomenon found in experi-ments. According to our simulations, the folding athigh temperatures around the folding transitiontemperature Tf is of a two-state process, and thefolding nucleus is consisted of contacts between thefront end of �-helix and the turn4. The folding at lowtemperature (� T � 0.8) is also studied, where anA-state like structure is found lying on the majorfolding pathway. The appearance of this structure isrelated to the stability of the first part (residue 1–51)of protein ubiquitin. As the temperature decreases,the formation of secondary structures, tertiary struc-tures and collapse of the protein are found to bedecoupled gradually and the folding mechanismchanges from the nucleation–condensation to thediffusion–collision. This feature indicates a unify-ing common folding mechanism for proteins. Theintermediate phase is also studied and is found torepresent a folding process via a long-lived interme-diate state which is stabilized by strong interactionsbetween the �1 and the �5 strand. These stronginteractions are important for the function of pro-tein ubiquitin as a molecular chaperone. Thus theintermediate phase is assumed as a byproduct of therequirement of protein function. In addition, thevalidity of the current Go-model is also investigated,and a lower limited temperature for protein ubiq-uitin Tlimit � 0.8 is proposed. At temperatures higherthan this value, the kinetic traps due to glass dynam-ics cannot be significantly populated and the inter-mediate states can be reliably identified althoughthere is slight chevron rollover in the folding rates.At temperature lower than Tlimit, however, the trapsdue to glass dynamics become dominant and may bemistaken for real intermediate states. This limita-tion of valid temperature range prevents us to re-veal the burst phase intermediate in the majorfolding phase since it might only be stabilized attemperatures lower than Tlimit, according to experi-ments. Our works show that caution must be takenwhen studying low-temperature intermediate statesby using the C� Go-models. Proteins 2005;59:565–579.© 2005 Wiley-Liss, Inc.
Key words: validity of Go-model; intermediatestates; glass dynamics; folding mecha-nisms
INTRODUCTION
The folding kinetics and folding mechanisms are centralproblems for the study of protein folding both experimen-tally and theoretically. Theoretical methods vary fromminimalist models of protein, including lattice and off-lattice simulations,1–13 to all-atom models.14–22 Althoughsimulations based on all-atom models provide much de-tailed information of folding, it can only resolve the timescale of several nanoseconds in one run or reach severalmicroseconds combining a large number of runs. To com-pletely characterize the nature of the energy landscapeand the kinetics of folding, ensemble averaging oversimulations or long time-running is still quite difficult andbeyond the current computer capacity. Thus the minimal-ist models are the main tools for studying the energylandscape and folding mechanisms of proteins.23
Among the minimalist models, the Go-type models haveshown some distinguished success in protein folding andhave been widely used.6–10 The studies on two-statefolders (such as Cl2, SH3, barnase, and Im97,8,24 andthree-state folders (such as CheY, Rnase, and Im78,9,24)have shown that the folding kinetics and thermodynamics,as well as the overall structures of transition states andintermediates can be modelled successfully by the Go-typemodels, and the folding rates can also be obtained qualita-tively.10 The main reason of such success is due to that thereal protein sequences are sufficiently well optimized ordesigned by nature and the folding mechanisms are mostlydominated by the native structures and the compensationbetween energy and entropy of the chains.6–8,25–27
Beyond the two-state or three-state folding mechanism,proteins may folds by multiple mechanisms simulta-neously. For example, for a small three-helix-bundle pro-tein with 46 residues, it was found that for large-gapmodels, the protein can fold simultaneously using a two-state mechanism and a three-state mechanism with twononobligatory intermediates.28,29 For small-gap models,
Grant sponsor: the National Natural Science Foundation of China;Grant numbers: 90103031, 90403120, 10021001, and 10474041; Grantsponsor: the Nonlinear Project (973) of the NSM.
*Correspondence to: Wei Wang, National Laboratory of Solid StateMicrostructure and Department of Physics, Nanjing University,210093, China. E-mail: [email protected]
Received 18 May 2004; Accepted 1 November 2004
Published online 14 March 2005 in Wiley InterScience(www.interscience.wiley.com). DOI: 10.1002/prot.20430
PROTEINS: Structure, Function, and Bioinformatics 59:565–579 (2005)
© 2005 WILEY-LISS, INC.

however, the mechanism becomes three-state and one ofintermediates becomes obligatory. Other examples includea designed four-helix bundle,5,30,31 lysozyme,32 DHFR,7
cytochrome c551,33 the FEP WW domain,34 and a proline-free variant of staphylococcal nuclease,35 and so on. Allthese proteins show complex kinetics with multiple foldingmechanisms, a fraction of molecules reaches the nativestate via a two-state mechanism, whereas the rest passthrough one or several intermediates. This has beentermed as kinetic partition mechanism and was proposedas a unifying scheme in the folding of biomolecules byThirumalai et al.5,30,31 The reason comes from the poly-meric nature and the presence of conflicting energy scalesin proteins, and also that the free energy landscape isrough and contains not only the native basin attraction,but competing basins of attraction as well. The rough freeenergy landscape results in direct and indirect pathwaysto the native basin, that is, a kinetic partitioning mecha-nism.
The work by Karplus and coworkers on a small proteinwith a three-helix-bundle showed that for this smallprotein with rather simple topology multiple folding mecha-nisms and the structures of intermediates can be describedquite well by the Go-type model related to the experimen-tal findings. Now the question is: can the Go-type modelscharacterize the folding behaviors of larger proteins withcomplex topology and multiple folding mechanisms, canthe partition among different mechanisms and the relatedintermediate states be predicted correctly? Previously, aGo-type model has been used to study the folding of proteinDHFR9 which is a two-domain 162-residue �/� enzyme. Itfolds via intermediate IHF represented as a set of struc-tures I1–I4 which are structurally similar to each other butproceed toward the native state with different rates. Thestudy based on the Go-model for this protein showed that aset of intermediates can be seen and the overall structuresof the intermediates are in agreement with the experimentfindings. However, the partition among different foldingpathways and the corresponding folding rates have notbeen studied. Although proteins with multiple foldingmechanisms have long been discovered both theoreti-cally5,28–30,36–38 and experimentally,31–35 detailed Go-type modelling studies on multiple folding mechanisms oftopological complex proteins are rare.
As a small globular protein with 76 residues, ubiquitinshows unusual native structural features and foldingkinetics. As shown in Figure 1, protein ubiquitin includesa five-strand �-sheet with three antiparallel and oneparallel pairs of strands, an �-helix (residues 23–34), twoshort helices (helix-1, residues 38–40; helix-2, residues56–59), and seven reverse turns. Among the turns, fivelocate near the contact region between the front end of�-helix and turn-4 (see Fig. 1).39 The curved �-sheet andthe flanking �-helix enclose a single core of densely packedhydrophobic side chains that contributes to the highstructural stability of ubiquitin. The protein has impor-tant functions and acts as a chaperone for proteasomaldegradation.40
The hydrogen exchange and stopped-flow fluorescenceexperiments on ubiquitin refolding have shown a relax-ation kinetics with three distinct time scales:41–44 a fastestmajor folding phase, an intermediate phase and a slowestminor phase. Experimentally, the major phase has arousedmany debates where the central question is whether thereis an intermediate state during the major folding pro-cess.41–44 In recent years, due to the advances of experimen-tal techniques, this question is becoming clear. There isindeed an hidden intermediate during folding, but it canonly be observed under strong native conditions, such as atlow temperatures or with presence of stabilizing addi-tives.45–47 Besides, for the protein ubiquitin, the nature ofthe intermediate phase is not very clear either. As for theslowest minor phase, it is attributed to the cis–transisomerization of proline residues. Therefore experimentshave suggested that protein ubiquitin reaches its nativestate via different pathways with different mechanisms.The hidden intermediate state in the major phase and themultiple folding pathways of ubiquitin provide a realchallenge to the Go-models. Can the Go-models success-fully describe the folding of this protein?
Theoretically, there has been many works on the foldingof ubiquitin. These works include study of backbone desol-vation and mutational hot spots of ubiquitin,48 study of thefolding nucleus, structure of the transition state, foldingmechanisms and pathway heterogeneity using a Ram-achandran basin folding algorithm,49,50 all-atom molecu-lar dynamical simulation of the hydrophobic collapse andthe A-state of protein ubiquitin,51,52 the study of theconservation of folding nucleus residues in ubiquitin super-
Fig. 1. The 3D structure of the protein-ubiquitin (PDB code: 1ubq).The figure is ploted by RasMol.
566 J. ZHANG ET AL.

family53 and so on. Especially, a designed ubiquitin-likeprotein with 68 residues is studied based on the so-calledBLN model.38 In that work, multiple exponential kineticswas observed. The burst phase intermediate was alsoobserved, but it has little secondary structures, whichagrees with previous experiments54 whereas it contradictswith a recent CD experiment.45 Although there has beenmuch progress, the studies aimed to reveal hidden interme-diate states in the folding of ubiquitin are still lacking, andthe possibly different folding mechanisms at differenttemperatures are still not fully understood.
To help understand the folding of the protein ubiquitinand to check how far the C� Go-type models can go for suchproteins with multiple folding pathways, a Go-type modelis employed to study the folding of protein ubiquitin. First,the valid temperature range of the current Go-model isstudied, and a lower limit Tlimit is found. Within the validtemperature range, different relaxation kinetics and fold-ing mechanisms at high and low temperatures are investi-gated. The structures of intermediate state responsible forthe intermediate phase and the stabilizing interactions ofthis intermediate state are also studied. At last, theslowest minor phase found in our simulations is studied.Based on these studies, a discussion for the advantagesand limitations of the C� Go-models is made.
THE MODEL
The folding of the protein ubiquitin is studied by usingan off-lattice C� based the Go-type model. In the model, allresidues are represented as beads centered in their C�
positions, and interact with each other by bond, angle,dihedral angle, and 10–12 Lennard-Jones interactions.The Hamiltonian is shown in Eq. (1).8
U � �bonds
Kr�r � r0�2 � �
angles
K��� � �0�2 � �
dihedral
K��n�
� �1 � cosn�� � �0�� � �i�j 3
���i,j��5��ij
rij�12
� 6��ij
rij�10�
� �2�i,j���ij
rij�12�. (1)
In Eq. (1), r and r0 represent the distances between twosubsequent residues at the calculated conformation andnative state, respectively. Analogously, �(�0) and �(�0)represent the corresponding angle and dihedral angle,respectively. The last term contains the Go-type non-bonded interactions, �(i,j) � � and �2(i, j) � 0 if residues iand j form a native contact, while �(i, j) � 0 and �2(i, j) � � ifthey do not. Residues i and j are assumed to form a “nativecontact” if the distance between any two heavy-atoms thatbelong to these two residues is within 5 Å in the nativestate. In the simulations, residues i and j are assumed toform a “contact” if their distance is within 1.2 times of theirnative distance. The parameter � (i, j) is taken equal to thedistance between two C� atoms in residues i and j at thenative state for native contacts, while �(i, j) � 4 Å for theother pairs. Parameters are taken to be Kr � 100�, K� �20�, K�
(1) � � and K�(3) � 0.5�, respectively.
The simulation package AMBER (version 7.0) is used todo the simulations55 at constant temperature (NTB � 0,NTT � 1, see AMBER’s user guide). The Berendsenalgorithm is invoked to couple the system to an externalbath, and the coupling constant is chosen as tautp � 1.0(its unit is the same as that of time, see below). The timeunit (t.u.) is arbitrary defined as 500 MD steps, that is if wesay current time is t � 1 t.u., that means 500 MD steps.This is just for expression simplicity and is compatiblewith AMBER.
In the simulation, the native structure of the protein isfirst heated to temperature T � 2.0 (the folding tempera-ture is Tf � 1.07 in our model, which is obtained from themain peak in temperature dependence of specific heat Cv
curve) to unfold them to denatured states with Q � 0.2.Here Q is the fraction of the total native contacts. Then thetemperature is jumped to the study temperature and theprotein begins to refold. The molecules are assumed to befolded when the reaction coordinate Q � 0.95 and theradius of gyration Rg � 12 Å (for comparison, the Rg ofnative state calculated based on the C� atoms is 11.8 Å).The refolding processes are simulated at several tempera-tures ranging from T � 0.7 to Tf � 1.07. At each tempera-ture, more than 1000 independent trajectories are col-lected except at temperature T � 0.8, where more than8000 trajectories are calculated.
RESULTS AND DISCUSSIONRelaxation Kinetics
The time evolution of population of denatured statesP(t) � �t
� � f(t�)dt� is monitored to study the refoldingkinetics. Here f (t) is the distribution of first passage time(FPT) for reaching the native state with Q � 0.95 and Rg �12.0 Å. The ensemble averaged �P(t)� at temperatures fromT � 0.7 to T � 1.0 are shown in Figure 2. For thetemperatures close to the folding temperature Tf, such asT � 1.0, the value of �P(t)� decreases exponentially. Incontrast, at low temperature, such as T � 0.8, �P(t)� firstdecreases exponentially with a fast relaxation time con-stant and 90% molecules fold within time t � 100t.u.,which is called the major folding phase hereafter (see insetof Fig. 2). After the major folding phase, �P(t)� decreasesexponentially by a slower time constant, called the interme-diate phase. Besides these two phases, another minorfolding phase can also be seen at T � 0.8 with a slowesttime constant (see the tail of the curve). Thus the foldingrelaxation processes can be divided into three phases, amajor phase with fastest relaxation constant, an interme-diate phase, and a slowest minor phase.
It is found that �P(t)� can be fitted quite well with thefollowing formula,
�P�t�� � A0 � A1exp� � �t/�1��� � A2exp� � t/�2�
� A3exp� � t/�3�. (2)
The fitting based on this equation leads to reduced error�2 � 10 6 at all temperatures. The obtained parametersare given in Table I. Note that a similar formula with onlytwo exponential terms will result in a larger error, whereas
FOLDING MECHANISMS OF UBIQUITIN 567

two relaxation time constants �i will be same if fourexponential terms are employed. As proved that the kinet-ics can be divided into three phases. The A1, A2, and A3
terms are related to the major phase, the intermediatephase and the slowest minor phase, respectively. Exceptfor refolding through these three phases, about 2% oftrajectories do not reach their folded state within theupper limit of simulation time tmax � 10000t.u.. However,with sufficiently large tmax, we believe that they will fold tothe native state finally. It should be noted that at alltemperatures below the folding temperature Tf � 1.07, theparameter � obtained from our simulations is larger than1. It is due to the strong bias of free energy surface towardthe native state at these temperatures, and the smoothfeature of the energy funnel of the Go-type model. Withincreasing temperature, the free-energy surface is biasedagainst native state gradually, � decreases and reaches 1at the temperature slightly above the folding temperature.This behavior has been reported recently in a study oftwo-dimensional lattice HP model.56
The temperature dependence of the amplitudes Ai andthe folding time constants �i of three phases are shown in
Table I. At low temperatures, all the amplitudes A1, A2,and A3 are non-zero. As the temperature increases, theamplitude A1 of the major phase increases monotonicallyand the amplitude A2 and A3 decrease monotonically.When the temperature approaches Tf, the major phasebecomes dominant and the relaxation curve shows a singleexponential form. As for the folding time constants, boththe time constants of the major (�1) and the intermediatephases (�2) increase as the temperature increases, but theincreasing speed of the intermediate phase is smaller thanthat of the major phase. Then, these two time constantscoincide at the temperature Tf, and two processes mergethere. Note that the time constants of the slowest minorphase �3 are always very large at all temperatures.
The fact that the population of denatured states relaxeswith a three-exponential kinetics reflects that the proteinfolds through three different pathways with differentfolding mechanisms. Hereafter, we label these three path-ways as I, II, and III, corresponding to the major phase, theintermediate phase, and the slowest minor phase, respec-tively. This feature has long been discovered by Thirum-alai et al. and named kinetic partitioning mechanism.31
The free energy of these three pathways calculated at T �0.8 is given in Figure 3. To calculate this figure, more than8000 folding trajectories are collected and the conforma-tions are classified by their Q values, then the free energyis calculated as negative logarithm of the population, thatis, F � log�P(Q)�, where P(Q) is the population of thestates with their fraction of native contacts are Q. Suchkinds of free energy are not the free energy in equilibriumstates, but they can also illustrate the relative populationof states during the folding process; in this sense, they are
Fig. 2. Refolding relaxation monitored by time evolution of populationsof denatured states at temperatures from T � 0.7 to T � 1.0. Both the xand y coordinates are logarithmic ones. At high temperature (T � 1.0), therelaxation kinetics shows a single exponential phase. However, at lowtemperature it shows three exponential phases, a fastest major phase, anintermediate phase and a slowest minor phase, which can be seen clearlyin the inset.
TABLE I. Fitting Parameters for the Kinetic Traces inFigure 2
T A0 A1 �1 � A2 �2 A3 �3
0.7 0.06 0.78 27.2 4.1 0.12 49.6 0.08 1405.90.8 0.03 0.86 39.1 3.87 0.09 80.8 0.04 1683.90.9 0.01 0.92 70.2 3.05 0.09 106.6 0.00 5400.31.0 0 0.95 233.9 2.02 0.08 327.9 0 —1.07 — 1 1377 1.34 0 — 0 —
Fig. 3. The free energy as a function of Q of the three folding pathwayswhich are related to three phases respectively. The inset shows a typicaltrajectory which folds through the pathway III, it illustrates that theintermediate and native basin overlap each other and the molecule has touse a long time to overcome the folding barrier.
568 J. ZHANG ET AL.

also free energy. When calculating Figure 3, the trajecto-ries are partitioned into three classes, each corresponds toa folding phase. The trajectories with their FPT smallerthan t � 39t.u. are assumed passing through pathway Iand corresponding to the major phase. The trajectoriesthat reach the native basin within the time range 81t.u. �t � 300t.u. are assumed to be related to the intermediatephase. The choice of limitation of t � 300t.u. is somewhatarbitrary, but the calculated quantities are not sensitive tothis choice since very few trajectories in the intermediatephase have an FPT larger than this value. Analogously,the trajectories with their FPT larger than t � 1700t.u. areassumed belonging to the slowest minor phase. Note thatall the free energy plots in this article are calculated in asimilar way as mentioned above, thus the calculatingmethod will be not repeated later.
According to Figure 3, the free energy barrier for foldingalong pathway I is about 1kBT, this small barrier isconsistent with the fast-folding rate of the major phase.The rate limiting barrier for folding along pathway II(located at Q � 0.75) is about 2.5kBT, resulting in a slowerfolding rate of the intermediate phase. The free energywell located at Q � 0.5 in the pathway II corresponds to anintermediate state, which will be discussed later. For thepathway III, the free energy curve is somewhat confusingat first sight since there is no obvious large barrierresponsible for the slowest folding rate of the minor phase.In fact, the rate limiting barrier located at Q � 0.9 is a verylarge barrier. It is not obvious at first sight because theintermediate basin prior to this barrier and the nativebasin overlap each other when projected on the reactioncoordinate Q. This barrier is actually very high, which canbe seen clearly from the inset of Figure 3. The inset showsa typical trajectory, which folds through the pathway III.It clearly shows that the intermediate and native basinoverlap each other and the molecules have to use a longtime to jump out the intermediate basin and enter thenative basin. It can be expect that this barrier will beobvious when the free energy is projected on an appropri-ate reaction coordinate. This implies that one should bevery cautious when choosing reaction coordinates sinceincorrect reaction coordinates may lead to wrong conclu-sions.
The Valid Temperature Range of the Current Go-model and Intermediate States
Although the Go-type models have been very successfulin understanding the folding of many small proteins, itwas pointed out by Chan and Kaya recently that thecommon Go-models fall short of producing the type ofcalorimetric two-state cooperativity observed for manysmall proteins.57–61 For the common Go-models, the chev-ron rollovers emerge under strongly native conditions dueto a competition between a stronger driving force forfolding and the onset of glass dynamics under stronglynative conditions (large values of �/kT). As the nativecondition becomes stronger (for examples, when tempera-ture is lowered), the kinetic trapping becomes more promi-nent, the protein has to use more time to overcome the
barrier to proceed folding. This raises a question on thevalidity of the common Go-models at low temperatures,especially when one tries to find the hidden intermediatesthat can only be populated at low temperatures. Under lowtemperatures, the kinetic traps due to the glass dynamicsmay be mistaken for real intermediates. Thus it is veryimportant to investigate the valid temperature range ofthe model before studying the folding mechanism.
To do this, we have calculated the free energy ofubiquitin as a function of temperature. For comparison,the results of protein CI2 (PDB code: 1coa) are given first.Figure 4 shows the free energy contour plots of protein CI2projected onto reaction coordinates Q-Rg [Fig. 4(a)] andQ-Q2 [Fig. 4(b)] at the temperature T � 1.06 and T � 0.85,respectively. Here Q is the fraction of native contacts, Rg isthe radius of gyration and Q2 is the fraction of contacts insecondary structures. The free energy is calculated asnegative logarithm of the population, for example, F � log[P(Q, Rg)], where P(Q, Rg) is the population of thestates with their fraction of native contacts and radius ofgyration are Q and Rg, respectively. Each plot is obtainedby averaging on more than 1000 trajectories.
As shown in Figure 4(a, b), at the temperature T � 1.06,slightly above the folding temperature (Tf � 1.05), thereare only two basins populated: the native (N) and unfoldedbasin (U). At low temperature T � 0.85, however, a thirdbasin Ig appears in the Q-Q2 plot, as shown by Figure 4(d).From experiments, it is known that there is no intermedi-ate state for protein CI2. Thus the appearance of this basinIg can only be attributed to the glass dynamics of the
Fig. 4. The free energy contour plots for protein CI2 projected ontoreaction coordinates Q-Rg (a) and Q-Q2 (b) at temperature T � 1.06,slightly above the folding temperature Tf � 1.05. The Q are the fraction oftotal native contacts, Q2 the fraction of native contacts in secondarystructures, and Rg the radius of gyration, respectively. (c) and (d) are thesame plots but calculated at temperature T � 0.85. The free energydifference between adjacent contour lines is 0.5kBT. The unfolded basin,native basin and an intermediate basin are marked by U, N, and Ig,respectively.
FOLDING MECHANISMS OF UBIQUITIN 569

model. This indicates that the present Go-model has arather high glass temperature Tg � 0.85. Actually, it isthis kind of basin that contributes to the chevron rolloverof the folding rates, which was first related to the glassdynamics by Chan and Kaya.57,60 Therefore, for CI2, thevalid temperature of the C� Go-model should be limited toT � 0.85. Any observation below this temperature shouldbe carefully checked to ensure that it is not caused by theglass dynamics. It is also worth noting that the basin Ig
cannot be observed in Q-Rg plot, the free energy projec-tions onto these two reaction coordinates are not assensitive as the Q-Q2 plot.
The folding of protein ubiquitin is much complex com-pared with protein CI2. Figures 5–8 show the free energycontour plots for protein ubiquitin at four temperatures Tf
� 1.07, 0.95, 0.8, and 0.75, respectively. When calculatingthese figures, all trajectories of three folding phases areused. As expected, the protein shows two-state behavior atthe folding temperature Tf (Fig. 5), only unfolded basin Uand native basin N are populated. This is consistent withexperiments under weak native conditions.44,47 Anotherpopulated basin Im is first observed at T � 0.95 (Fig. 6), ascan be seen in both Q-Rg and Q-Q2 contour plots of the freeenergy. This intermediate basin cannot be assumed astraps due to the glass dynamics since its first appearanceis at the temperature T � 0.95. If we estimate the foldingtemperature for ubiquitin to be roughly 350 K, the tempera-
ture T � 0.95 corresponds to 311 K. Thus, the states thatemerge at such a high temperature can hardly be attrib-uted to the glass dynamics. In fact, this basin is related tothe slowest minor phase in relaxation kinetics, as will bediscussed later.
When the temperature is lowered to T � 0.75, as shownin Figure 8(b), at least two new basins emerge, namely Ig
1
and Ig2. These two basins only appear at temperature lower
than T � 0.75 (corresponds to roughly 245 K), thus it ishighly possible that they are caused by the glass dynamicsof the model.
For temperatures T � 0.8, as shown in Figures 5–7,except the above mentioned basin Im, there are only twomain basins populated, i.e., U and N basins. From thesefigures, it is very interesting to note that the U basin shiftsgreatly to the native side as the temperature decreases. Attemperature T � 0.8, more than 70% secondary structureshave been formed for the states in this basin [see the Q2
coordinate of the U basin in Figure 7(b)] and the radius ofgyration of the geometry center of the basin is 12.3 Å [Fig.7(a)], close to the value of the native state. This raises suchquestions as: Is the U basin at low temperature only ashifted unfolded basin or a signature of a hidden interme-diate state? If the later case is true, does this intermediatestate arise from the glass dynamics?
Fig. 5. The free energy contour plots for protein ubiquitin projectedonto reaction coordinates Q-Rg (a) and Q-Q2 (b) at the folding tempera-ture Tf � 1.07. The free energy difference between adjacent contour linesis 0.5kBT.
Fig. 6. The free energy contour plots for protein ubiquitin projectedonto reaction coordinates Q-Rg (a) and Q-Q2 (b) at temperature T � 0.95.An intermediate basin Im begins to appear at this temperature. Thefree-energy difference between adjacent contour lines is 0.5kBT.
Fig. 7. The free energy contour plots for protein ubiquitin projectedonto reaction coordinates Q-Rg (a) and Q-Q2 (b) at temperature T � 0.8.Note the U basin shifts greatly to the native side, which signals theexistence of a hidden intermediate state. The free-energy differencebetween adjacent contour lines is 0.5kBT.
Fig. 8. The free-energy contour plots for protein ubiquitin projectedonto reaction coordinates Q-Rg (a) and Q-Q2 (b) at temperature T � 0.75.Two traps, Ig
1 and Ig2 begin to appear at this temperature which are related
to the glass dynamics. The Q-Rg plot (a) is insensitive compared to theQ-Q2 plot (b). The free energy difference between adjacent contour linesis 0.5kBT.
570 J. ZHANG ET AL.

To answer such questions, the shift of the geometrycenters of the U basin of both protein CI2 and ubiquitin asa function of temperature are calculated and shown inFigure 9. The difference between two proteins can be seenclearly. In case of CI2, the values of Rg (Q) decrease(increase) linearly as temperature decreases, this demon-strates that the U basin at low temperature for protein CI2is merely a shifted unfolded basin. For protein ubiquitin,however, the behavior of Rg (Q) begins to deviate fromlinearity at temperature T � 0.95 and the values of Rg (Q)decrease (increase) rapidly as the temperature decreasesfurther. When such a protein is subject to a T-jumpexperiment, according to Figure 9(a), the Rg related signalwill show a burst phase and the amplitude of the burstphase as a function of temperature will be a sigmoid-shape. Experimentally, such a behavior of the signal isoften interpreted as the existence of a hidden intermediatestate. Thus it is highly possible that the great shift of the Ubasin at lower temperature for ubiquitin indicates theexistence of a hidden intermediate state.
By carefully checking the trajectories of three phases,we found that there is indeed a hidden intermediate stateIi which is responsible for the intermediate phase inrelaxation kinetics. The great shift of the U basin forprotein ubiquitin in Figure 9 is only superficial and due topartial overlap of the unfolding basin of the major phaseand the intermediate basin Ii when projecting the freeenergy onto the reaction coordinates. To prove such anargument, we select a representative state Iref within the Ii
basin and calculate the Q-RMSD contour plot of the freeenergy for the intermediate phase. The RMSD is calcu-lated by taken Iref as a reference state. When calculatingthese plots, only the trajectories passing through thepathway II are used. Here, which pathway the trajectorieswill pass through is determined by their FPT (see thefolding time constants in Table I and the previous discus-sions). The result at T � 0.9 is shown in Figure 10 wherethe free energy difference between adjacent contour linesare 0.5kBT. An intermediate basin Ii can be seen clearly. Ifthe Ii basin is defined by the edge whose free energy is1kBT higher than that of the center, the width of the basinis W (RMSD) � 2 Å and W (Q) � 0.1. Such relatively smallvariance of RMSD and Q suggest that the states within
this basin are highly structured, thus the Ii basin is indeedan intermediate basin instead of an unfolded basin. Thisproves our argument that the great shift of the unfoldedbasin U at low temperature implies the existence of anhidden intermediate state. This intermediate cannot beattributed to the glass dynamics of the model since Figure10 shows that it can be populated at a high temperaturesuch as T � 0.9 and its effect can be firstly seen at T � 0.95[Fig. 9(a)]. Here T � 0.95 corresponds to 294 K if Tf isestimated to be about 350 K for protein ubiquitin. On theother hand, the intermediate Ii cannot be caused by theGo-type model itself since there is no evidence of interme-diate state at such high temperatures for protein CI2 withexactly the same model (Fig. 9).
Thus, by comparing with the results for protein CI2, weconclude that the valid temperature range for the presentmodel should be limited to T � Tlimit � 0.8 since at T �0.75 several traps due to the glass dynamics have beenobserved. For temperatures higher than T � 0.8, althoughthere is slight chevron rollover in the folding rates, whichindicates the onset of the glass dynamics, the kinetic trapscannot be significantly populated at these relatively hightemperatures and the real intermediate states can still beidentified. Differently, for temperatures below the Tlimit,the glass dynamics become dominant, and the real interme-diate states will be difficult to distinguish from the trapscaused by the glass dynamics.
The Major Phase
Experimentally, the major phase [the A1 term in Eq.(1)] is the fastest one among three phases and accountsfor large percent of total amplitude change of signalsduring folding process. The nature of the major phasehas arisen many debates, such as whether the folding ofthe major phase is a two-state or three-state process,whether an intermediate state exists and has somestructures, and so on. Recently, due to the advances inexperimental techniques, it has become clear that thereis indeed a hidden intermediate state for ubiquitin, butthis intermediate state may only exist under strongnative conditions, such as at low temperatures or withstabilizing additives.45– 47
Fig. 9. The shift of the geometry center of the U basin as a function oftemperature for protein CI2 and ubiquitin, illustrated by the value of Rg (a)and Q (b) respectively. The straight lines for CI2 is the best fit, the lines forubiquitin are only a guide for the eye.
Fig. 10. The free energy contour plot for the intermediate phaseprojected onto Q-RMSD at temperature T � 0.9. The RMSD is calculatedby using a representative intermediate state as reference state. Anintermediate basin is revealed and marked by Ii. The free-energydifference between adjacent contour lines is 0.5kBT.
FOLDING MECHANISMS OF UBIQUITIN 571

In the following section, we investigate the foldingbehaviors at high and low temperatures and hope tounderstand the folding of protein ubiquitin. At the sametime, we check the prediction abilities of the currentGo-model concerning the intermediate states.
Folding of ubiquitin at high temperature
The contour plots of the free energy of the major phase atthe folding temperature Tf � 1.07 (� Tf) have been shown
in Figure 5. Two populated basins can be seen in thefigure, labelled by U and N, respectively. At the foldingtemperature, protein ubiquitin is clearly a standard two-state folder. Figure 5(b) also shows that the secondary andtertiary structures form cooperatively since the most pos-sible folding pathway marked by the black line lies approxi-mately on the diagonal. These results are in agreementwith the observations in hydrogen exchange experi-ments,42,54 stopped-flow fluorescence intensity44 andfar-UV CD spectroscopy measurements.54 In these experi-ments, the burst phase intermediate has not been de-tected, suggesting that the secondary structural elementscan be populated only marginally ahead of the majorcooperative folding events. This supports the two-statefolding mechanism with cooperative formation of the sec-ondary and tertiary structures.
The detailed folding orders of the structural elements forubiquitin at T � 1.07 is illustrated in Figure 11. Figure11(a) shows the first formation time of each structuralelement and Figure 11(b) gives their formation probabili-ties as a function of Q. Note that both of them wereaveraged on more than 1000 trajectories. To calculate
Fig. 11. (a) The formation order of structural elements for proteinubiquitin calculated at T � 1.07. The contacts are colored by their firstformation time, the contacts with blue color form earlier, and the ones withred color form later. For clarity, the first formation time of each contactcluster has been rescaled to the range [0,1] and labelled beside it. Thearrows indicate the folding routes. (b) The formation probability of eachcontact cluster as a function of Q. The important contact clusters areplotted by thicker lines.
Fig. 12. The free-energy contour plot for the major phase calculated attemperature T � 0.8. The free-energy difference between adjacentcontour lines is 0.5kBT. It should be noted that the U basin is rather broadand shallow.
Fig. 13. The average structure of the states in the U basin in Figure12, showing that these states are partially structured. The formationprobability of each contact cluster is given by the number beside it.
Fig. 14. (a) The formation order of structural elements for proteinubiquitin calculated at T � 0.8. The contacts are colored by their firstformation time. The first formation time of each contact cluster has beenrescaled to the range [0,1] and labelled beside it. The arrows indicate thefolding routes. (b) The formation probability of each contact cluster as afunction of Q. The important contact clusters are plotted by thicker lines.
Fig. 15. (a) Time evolution of the secondary structure, tertiary con-tacts, and the “collapse” of a typical trajectory at temperature Tf � 1.0. The“collapse” is calculated by Rg
3 (N)/Rg3, where the Rg (N) is the radius of
gyration of the native state. (b) The average formation probability of thesecondary structure and tertiary contacts and the collapse of protein as afunction of time, the three curves with peaks at the left side are thecorresponding derivatives. These curves are obtained by averaging morethan 1000 trajectories.
572 J. ZHANG ET AL.

Figure 11(b), all the conformations during the foldingprocess are classified by their Q values, and the formationprobability of each contact at Q is calculated by thenumber of conformations with this contact formed dividedby the total number of conformations with this Q. Theformation probability of each contact cluster is obtained byaveraging on all contacts in the cluster. Figure 11(a) and11(b) are combined to describe the overall folding processof protein ubiquitin. In Figure 11(a), the contacts arecolored by their first formation time, the contacts with bluecolor form earlier, and the ones with red color form later.The first formation time of each contact cluster is alsolabelled beside it (the time has been rescaled to the range[0,1], see the time labelled beside each contact cluster). Itcan be seen that the secondary structures form first, suchas the �-helix, helix-1, helix-2, the �1�2 hairpin, and the�3�4 hairpin. Then the tertiary contacts between thecentral �-helix, helix-1 and �3 are formed. At almost thesame time, the contacts between �3�4 hairpin and helix-2are formed. Shortly after, the contacts between �-helix and�2 are also formed. It should be noted that the formation ofthese contacts does not necessarily mean that they will notbreak later. Actually these contacts keep fluctuating, i.e.,forming and breaking, which can be seen from the fluctua-tion of formation probabilities in Figure 11(b). We alsoemphasize that in Figure 11 we intend to show the relativeformation order of structural elements. In fact, the forma-tion of different structural elements is rather cooperativefor the folding at temperatures close to Tf, as will bediscussed in detail later.
From Figure 11(a), the formation of contacts between�-helix and turn-4 occurs rather late compared to the fastformation of secondary structures and some tertiary con-tacts. Thus it can be reasonably assumed that the forma-tion of these contacts is the rate-limiting step for proteinfolding. That is, these contacts serve as candidates ofcritical contacts for protein folding, namely, the foldingnucleus. By watching movies of the folding process, it isalso found that only until these contacts are formed, arethe two parts of protein pulled together and the moleculesovercome the transition state and reach their native state.
The folding nucleus can be calculated by checkingseveral long-time trajectories at the folding temperatureTf and picking out the FF and UU conformations contain-ing ample information of transition state. Here the FFconformations are those ones that originate in and returnto folded region without ascending to the unfolded regionand the UU conformations originate in and return to theunfolded region without descending to the folded region.62
The nucleus is constructed by these contacts that appearmuch more often in the FF conformations than in the UUconformations (for the detailed description of this method,refer to a work done by Shakhnovich’s group62). Forprotein ubiquitin, we found by using this method that thefolding nucleus is composed of the contacts between thefront part of �-helix and turn-4. This is consistent with ouranalysis based on the formation orders of structuralelements in Figure 11(a).
The position of the folding nucleus can explain why acis-trans isomerization of PRO-19 affects the folding of theentire molecule whereas the isomerization of PRO-37 orPRO-38 does not propagate into other parts of the mole-cule.43 The reason is that the PRO-19 locates very close tothe nucleus in both sequence and space. The presence of acis peptide bond close to PRO-19 will inhibit the formationof folding nucleus at this region, therefore the moleculecannot overcome the transition state and has to returnback to unfolded basin.
Figure 11(a, b) also shows that the last folding event isthe packing of the �5 strand onto the hydrophobic corewhich is composed of the central �-helix and the curved�-sheet. After the packing, the contacts between �3 and �5,�1 and �5 are formed. Then the entire � sheet is con-structed. This folding picture agrees with the previous onesuggested based on experiments43 or simulation results.38
There the first formation of the tertiary structure occurscooperatively between the central �-helix and �-sheet, andthe formation of the C-terminus loop region is the lastevent in the folding process.
Folding of ubiquitin at low temperature
Recent experiments on ubiquitin have shown that theburst phase intermediate is only marginally stable at roomtemperature and in water solution. However, it can bestabilized under strong native conditions, such as at lowtemperature45,46 or with high concentration of stabilizingadditives.47 This prompts us to calculate the free energy ofthe major folding phase at low temperature since it yieldsa strong native condition.
According to previous discussions, the valid tempera-ture range of current Go-model is T � Tlimit � 0.8. Fortemperatures lower than Tlimit, the glass dynamics be-comes dominant and the resulting traps may be mistakenfor intermediate states. Therefore, the low-temperaturebehavior of ubiquitin folding is studied at temperature T �0.8. The free energy plots of the major phase projected onQ-Rg and Q-Q2 are calculated at this temperature andshown in Figure 12(a, b). To calculate these figures, onlythe trajectories with their FPT smaller than the relaxationconstant of the major phase (�1 � 39t.u.) are used. Thereason of such selection is that the molecules folding alongdifferent pathways sample different part of free energylandscape. According to Figure 12, there are only twobasins populated, labelled by U and N respectively. The Ubasin also shifts to the native side comparing to its positionat high temperatures, similar to the behavior of the Ubasin in Figure 7. However, for the major phase, the Rg ofthe geometry center of the U basin is linearly dependent onthe temperature, indicating that the shift of the U basindoes not signal an intermediate state. Further, if we definethe U basin as the region circled by the contour line withits free energy 1kBT higher than that of the center, thewidth of this basin is W(Rg) � 4 Å and W(Q) � 0.3 (thisvalue corresponds to 57 contacts), as shown by Figure12(a). The large width of the basin suggests that thefluctuation of states in the U basin is large and the statesare only partially structured.
FOLDING MECHANISMS OF UBIQUITIN 573

The average structure of the states located in the Ubasin at temperature T � 0.8 is shown in Figure 13. It willbe easier to understand the structure if we divide theprotein into two parts: the first one comprises the �1�2
hairpin, the central helix, helix1, and the �3�4 hairpin(residues 1–51) and the second part is composed of theturn-4, helix-2, and the �5 strand (residues 51–76). Thisdivision is based on the contact map in Figure 13 whichshows that the contacts inside the first part are all wellformed (such as the �1�2 hairpin, �3�4 hairpin, the centralhelix and helix1, contacts between �2 and �-helix, andbetween �-helix, helix1, and �3 strand), whereas thecontacts between these two parts are basically not formed(such as the contacts between �3 and �5, between �-helixand turn-4, and between �1 and �5). The structure of thestates in the U basin implies that the the first part ofubiquitin is rather stable, and can exist weakly dependenton the second part. These states are similar to the A-statein protein ubiquitin which is formed at PH 2.0 in 60%methanol/40% water.63 The A-state is characterized by thepresence of first �-hairpin and part of the third strand, thehydrophobic face of the �-sheet is covered by a partiallystructured �-helix. The structure of the A-state is consis-tent with our argument that the first part of proteinubiquitin is relatively stable. Such a stability is alsorelevant to the experimental results on peptide fragmentsof ubiquitin (each fragment with residue 1–51).64 Twofragments form a dimer (the S state) that is stabilized by0.8 M sodium sulfate at room temperature. The structureof each fragment and the interface between two fragmentsmimic related features in the structure of intact ubiquitin.
Although the states in the U basin are partially struc-tured, we prefer to assume this U basin as an shiftedunfolded basin instead of an intermediate state. This isdue to the fact that the width of this basin is rather broad(see Fig. 12) and the Rg of the geometry center of the Ubasin is linearly dependent on the temperature. Thesepartially structured states are not necessarily contradic-tory to the concept of unfolded states since the unfoldedstates are found with some native-like mean structures.65
It is interesting to note that the width of this basin willcontinuously decrease at much lower temperature. Forexample, at T � 0.6, the width of the basin becomes Rg � 2Å and Q � 0.2. Unfortunately, this temperature goesbeyond the valid temperature range of the model and it ishard to distinguish the hidden intermediate states fromtraps due to the glass dynamics. Experimentally, theburst-phase intermediate state can only be observed at lowtemperatures (T � 4°C).46 If we estimate the foldingtemperature of protein ubiquitin to be 350 K, this corre-sponds to 277/350 � 0.79, right below the temperaturelimitation T � 0.8 of the current Go-model. This lowtemperature prevents us from revealing the burst phaseintermediate observed in the major phase of ubiquitinfolding. Although we cannot reproduce the hidden interme-diate observed in experiments at low temperatures due tothe limitation of current model, we found that the states inthe U basin become more and more structured as thetemperature decreases. Their structures resemble the
structures of the A-state of ubiquitin, which was suggestedto be on the folding pathway of ubiquitin.64 Whether theA-state-like structures are related to the burst phaseintermediate state is a very interesting question and needsfurther study.
The folding mechanism at low temperatures is differentfrom that at high temperatures. The detailed folding orderof the structural elements at temperature T � 0.8 is shownin Figure 14. Figure 14(a) shows the first formation time ofeach structural element and Figure 14(b) gives theirformation probabilities as a function of Q during thefolding process. Figure 14(a) is very similar to Figure 11(a)but the formation times of structural elements are differ-ent. At high temperatures, the formation of contacts aremore “compact” in time, thus the folding has highercooperatively comparing to that at low temperature. Thiscan be seen more clearly by comparing Figure 14(b) withFigure 11(b). In the former case most curves lie at thediagonal and close to each other. In the later case, how-ever, the curves depart from each other, indicating thatthe formation of different structural elements decouplessomewhat. The difference between Figure 14 and Figure11 indicates that there exist different folding mechanismsat different temperatures. Actually, according to our simu-lations, the folding mechanism at high temperatures is anucleation–condensation one, it will slide to a diffusion–collision mechanism as the temperature decreases, thisfeature will be discussed in detail in the following section.
The folding mechanisms at high and lowtemperatures
At high temperature (T � Tf), the folding mechanism isa nucleation–condensation one which involves cooperativeformation of the secondary and the tertiary structures. Todemonstrate such a mechanism more clearly, Figure 15(a)shows a typical trajectory calculated at T � 1.0. Before thetime t � 170t.u., the trajectory is characterized by along-time search for the correct nucleus, indicated by thefluctuation of the inverse fraction of native volume (see thecurve marked with “collapse”). Little stable secondary andtertiary structures are formed during this period. After t �170t.u., the correct nuclei are formed, then the moleculesundergo a suddenly collapse and the secondary and ter-tiary structures are formed cooperatively, manifesting anucleation– condensation mechanism. The average forma-tion probabilities of the secondary and tertiary contactsand the collapse of protein as a function of time are shownin Figure 15(b), which is obtained by averaging on morethan 1000 trajectories. The three curves with peaks at theleft side are their respective derivatives, showing thedistribution of formation time of secondary and tertiarystructures and collapse of protein. It is clearly that thethree events occur closely to each other in time, manifest-ing a high folding cooperativity and the nucleation–condensation mechanism.
At low temperatures (T � Tf), however, the foldingmechanism becomes diffusion–collision-like gradually. Fig-ure 16(a) gives the same plot as Figure 15(a) but calculatedat T � 0.8. At t � 17t.u., almost all the secondary
574 J. ZHANG ET AL.

structures (� 80%) are formed, whereas less than 30%tertiary contacts are formed and the volume of the mole-cule is about three times larger than the native volume.These are the typical aspects of the diffusion–collisionmechanism. After t � 17t.u., the molecule keeps searchingfor the correct packing of formed structural elements in aslow diffusion–collision-like manner until mission accom-plished at t � 32t.u.. Then the molecule collapses to thecorrect conformation and the formation of tertiary contactsfollows. The average formation probability of the second-ary structure, the tertiary contacts and the collapse ofprotein are shown in Figure 16(b). In contrast to the caseat high temperatures [Fig. 15(b)], the collapse of proteinand formation of the tertiary contacts clearly lag behindthe formation of the secondary structure, suggesting a lowfolding cooperativity and diffusion–collision mechanism.
Previously, such sliding from one mechanism to anotherunder different conditions has been seen in protein three-helix studied by a Go-model.28 It has been found thatunder strong bias gap (optimized protein), the proteinfolding mechanism tends to be a diffusion–collision one,whereas for less optimized protein, the mechanism changesto one involving simultaneous collapse and partial second-ary structure formation, followed by reorganization to thenative structure. This picture is similar to the behavior ofubiquitin in our simulations. In our case, the temperatureacts as a parameter like bias gap in their study. This is dueto the fact that generally lower temperature leads to astronger bias of free energy surface to the native statewhereas high temperature results in a weaker bias towardthe native state or even against it.
In our opinion, the sliding from nucleation–condensa-tion to diffusion–collision mechanism with increasing ofnative conditions (by decreasing temperature or usingsome other techniques) may be a general feature in proteinfolding. Physically, the formation of the secondary struc-tures should occur prior to the major folding event due totheir small size. But for many proteins, the stability of thesecondary structures are low and cannot be populatedwithout the protection by the tertiary structures, thus theMG state with ample secondary structures cannot beobserved in experiments. This low stability of secondary
structures demands the proteins to fold cooperatively andleads to a nucleation–condensation mechanism. However,if the stability of secondary structures increases, such asby simulating at low temperatures, the formation of thesecondary and tertiary structures may be decoupled andthe folding mechanisms will slide to the diffusion–collisionone. In this sense, the two folding mechanisms are differ-ent facets of an unifying mechanism. The key to whichfacet a protein manifests is the relative stability of thesecondary and tertiary structures, which can be tuned bytemperature, solvent additives, mutation of the sequence,or other techniques. This unifying mechanism has alsobeen reported by recent work that shows that the mecha-nisms can slide from nucleation–condensation to diffusion–collision/framework for proteins in a superfamily of three-helical.66
We also emphasis that the C�-based Go-model can onlydescribe the general features of protein folding mecha-nisms instead of predicting the behaviors of the specificprotein such as ubiquitin. In our opinion, similar remarksshould also be made for the previous work on three-helix.28
This is because for real proteins, the stability of a second-ary structure may be mainly determined by the hydrogenbonds, the strong native interactions between side chains,67
non-native docking of structural elements68 or some otherinteractions, whereas the effect of the temperature in theexperimental range may only serve as a small perturba-tion. Thus we can reasonably imagine that only one foldingmechanism can be observed for these proteins. In thecurrent model, the sequence information and side chaineffects as well as the non-native interactions are omitted,so it cannot be used to predict the folding mechanism ofspecific protein such as ubiquitin or three-helix, the resultsshould be viewed as a general feature of protein folding.
The Intermediate Phase and the Slowest MinorPhase
The folding of the protein ubiquitin is rather complexsince it folds not only through the major phase but alsothrough another slow intermediate phase. This intermedi-ate phase has long been observed experimentally and itaccounts for up to 20% of the amplitude.44 The intermedi-ate phase is generally attributed to the cis-trans isomeriza-tion of the proline residues. However, according to theexperiments,44 its rate constant is within a factor of five ofthe rate constant of the major phase. Since the rateconstant of the major phase measured in stopped-flowexperiments at 0.54 M GdmCL solvent condition is368s 1,44 the rate constant of the intermediate state isestimated to be 70s 1. We think that this rate appears tobe too fast for proline isomerization.41,43 Furthermore, theintermediate phase still exists even in double-jump experi-ments where the isomerization effects have been weak-ened. Thus the origin of the intermediate phase is veryinteresting and will be discussed in this section.
In our simulations, the intermediate phase is observedin the relaxation kinetics and is found to be related to theintermediate state Ii, as has been discussed above. InFigure 10 we have given the free energy of the intermedi-
Fig. 16. (a) Time evolution of the secondary structure, tertiary con-tacts, and collapse of the protein of a typical trajectory at temperature T �0.8, similar to Figure 15. (b) The average formation probability of thesecondary structure, tertiary contacts and collapse of protein and theirrespective derivatives as a function of time, same as Figure 15, butcalculated at temperature T � 0.8.
FOLDING MECHANISMS OF UBIQUITIN 575
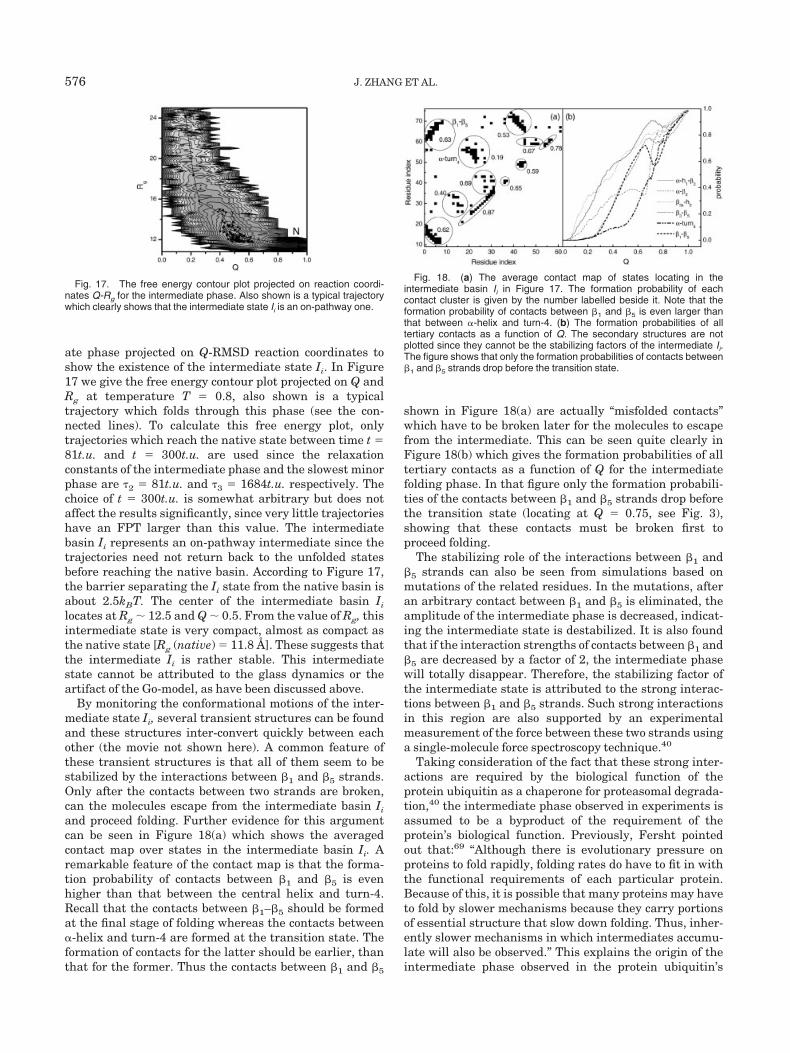
ate phase projected on Q-RMSD reaction coordinates toshow the existence of the intermediate state Ii. In Figure17 we give the free energy contour plot projected on Q andRg at temperature T � 0.8, also shown is a typicaltrajectory which folds through this phase (see the con-nected lines). To calculate this free energy plot, onlytrajectories which reach the native state between time t �81t.u. and t � 300t.u. are used since the relaxationconstants of the intermediate phase and the slowest minorphase are �2 � 81t.u. and �3 � 1684t.u. respectively. Thechoice of t � 300t.u. is somewhat arbitrary but does notaffect the results significantly, since very little trajectorieshave an FPT larger than this value. The intermediatebasin Ii represents an on-pathway intermediate since thetrajectories need not return back to the unfolded statesbefore reaching the native basin. According to Figure 17,the barrier separating the Ii state from the native basin isabout 2.5kBT. The center of the intermediate basin Ii
locates at Rg � 12.5 and Q � 0.5. From the value of Rg, thisintermediate state is very compact, almost as compact asthe native state [Rg (native) � 11.8 Å]. These suggests thatthe intermediate Ii is rather stable. This intermediatestate cannot be attributed to the glass dynamics or theartifact of the Go-model, as have been discussed above.
By monitoring the conformational motions of the inter-mediate state Ii, several transient structures can be foundand these structures inter-convert quickly between eachother (the movie not shown here). A common feature ofthese transient structures is that all of them seem to bestabilized by the interactions between �1 and �5 strands.Only after the contacts between two strands are broken,can the molecules escape from the intermediate basin Ii
and proceed folding. Further evidence for this argumentcan be seen in Figure 18(a) which shows the averagedcontact map over states in the intermediate basin Ii. Aremarkable feature of the contact map is that the forma-tion probability of contacts between �1 and �5 is evenhigher than that between the central helix and turn-4.Recall that the contacts between �1–�5 should be formedat the final stage of folding whereas the contacts between�-helix and turn-4 are formed at the transition state. Theformation of contacts for the latter should be earlier, thanthat for the former. Thus the contacts between �1 and �5
shown in Figure 18(a) are actually “misfolded contacts”which have to be broken later for the molecules to escapefrom the intermediate. This can be seen quite clearly inFigure 18(b) which gives the formation probabilities of alltertiary contacts as a function of Q for the intermediatefolding phase. In that figure only the formation probabili-ties of the contacts between �1 and �5 strands drop beforethe transition state (locating at Q � 0.75, see Fig. 3),showing that these contacts must be broken first toproceed folding.
The stabilizing role of the interactions between �1 and�5 strands can also be seen from simulations based onmutations of the related residues. In the mutations, afteran arbitrary contact between �1 and �5 is eliminated, theamplitude of the intermediate phase is decreased, indicat-ing the intermediate state is destabilized. It is also foundthat if the interaction strengths of contacts between �1 and�5 are decreased by a factor of 2, the intermediate phasewill totally disappear. Therefore, the stabilizing factor ofthe intermediate state is attributed to the strong interac-tions between �1 and �5 strands. Such strong interactionsin this region are also supported by an experimentalmeasurement of the force between these two strands usinga single-molecule force spectroscopy technique.40
Taking consideration of the fact that these strong inter-actions are required by the biological function of theprotein ubiquitin as a chaperone for proteasomal degrada-tion,40 the intermediate phase observed in experiments isassumed to be a byproduct of the requirement of theprotein’s biological function. Previously, Fersht pointedout that:69 “Although there is evolutionary pressure onproteins to fold rapidly, folding rates do have to fit in withthe functional requirements of each particular protein.Because of this, it is possible that many proteins may haveto fold by slower mechanisms because they carry portionsof essential structure that slow down folding. Thus, inher-ently slower mechanisms in which intermediates accumu-late will also be observed.” This explains the origin of theintermediate phase observed in the protein ubiquitin’s
Fig. 17. The free energy contour plot projected on reaction coordi-nates Q-Rg for the intermediate phase. Also shown is a typical trajectorywhich clearly shows that the intermediate state Ii is an on-pathway one.
Fig. 18. (a) The average contact map of states locating in theintermediate basin Ii in Figure 17. The formation probability of eachcontact cluster is given by the number labelled beside it. Note that theformation probability of contacts between �1 and �5 is even larger thanthat between �-helix and turn-4. (b) The formation probabilities of alltertiary contacts as a function of Q. The secondary structures are notplotted since they cannot be the stabilizing factors of the intermediate Ii.The figure shows that only the formation probabilities of contacts between�1 and �5 strands drop before the transition state.
576 J. ZHANG ET AL.

folding. Here the functional requirements on the proteinstructures yield a slower folding pathway for proteinubiquitin, and such a folding pathway manifests itself as aslower intermediate phase in experiments.
Beside the major and the intermediate phases, we alsoobserved a slowest minor phase in the relaxation kinetics.This phase takes less than 4% of all trajectories and itsrelaxation time constant is much larger than that of themajor and intermediate phase. As discussed above, thisphase is linked to the intermediate basin Im in Figures 6and 7. By carefully checking the structures of states in thisbasin, we find that all of them are with their N-terminus orC-terminus buried in the hydrophobic core (figure notshown). This cannot be possible for real proteins, since theside chains will overlap each other and cause extremelyhigh potential energy for these conformations, thus the Im
states are not realistic in our opinion. The appearance ofthe Im states should be attributed to the lack of side-chaineffects of the current C� model. It can be expected that thisminor phase and the related intermediate state Im willdisappear in an all-atom Go-model.70
Conclusions
Our work is aimed to undertake a systematic understand-ing of the folding of the protein ubiquitin with complextopology, and to see how-far the Go-type model can go forsuch kinds of proteins with multiple folding pathways.
By comparing the results with those of protein CI2, wefound that the application of the current model should belimited to a temperature range T � Tlimit. For ubiquitin,Tlimit is roughly 0.8. At temperatures higher than thislimitation, although there are slightly chevron rollovers inthe folding rates, the traps due to the glass dynamicscannot be significantly populated and the real intermedi-ate states can be reliably identified if they exist. Attemperatures lower than the limitation, the glass dynam-ics become dominant. Although we may still observe realintermediates, it is hard to distinguish them from trapsdue to the glass dynamics. Because of this limitation of thecurrent C� Go-model, the burst intermediate in the majorfolding phase of the protein ubiquitin cannot be repro-duced in our simulations since this intermediate may onlyexist at very low temperatures. However, we find that thefolding mechanism at low temperatures is different fromthat in high temperatures, and an A–state-like state lieson the folding pathway at low temperatures. Whether thisstate is related to the burst-phase intermediate is interest-ing and needs to be further studied.
This limitation of Go-type model is due to lack of manybody interactions in the model according to Chan et al.60,61 As Chan has pointed out,61 to ascertain the physicalbases of the many-body interactions, it would be extremelyinteresting to see how side-chain packing, hydrogen bonds,and other atomic interactions may give rise to the mecha-nisms of local–nonlocal coupling. In our opinion, oneimportant factor omitted in current C� Go-model is theeffect of side chains. At temperatures lower than Tlimit, thetraps due to the glass dynamics dominate the folding andcause serious chevron rollovers in the arms of folding
rates. For real proteins, these trap states may be destabi-lized by the interactions between the side chains whichwill cause high-energy contacts thus eliminating thesetraps, so only the native and real intermediate states havereasonable energy and can be populated. (This can bepartly seen by the observation of an intermediate Im whichwe think will disappear when the effect of side chains isintroduced into the model). This destabilization of kinetictraps is consistent with the requirement of high cooperat-ivity that “entails not only the stabilization of the nativestructure but also the destabilization of otherwise stablenonnative conformations”.61 By this way the interactionsbetween side chains may serve as one of the physical basesof the high folding cooperativity and the extremely lowglass temperature Tg of real proteins. (A recent worksuggests that for real calorimetrically two-state proteins,the energy landscape theory “folding to glass transitiontemperature ratio” Tf/Tg may exceed 6.0.58) Presumably,during the folding process, the native interactions guidethe protein to native state while the side-chain interac-tions pave the road by stuffing the possible kinetic traps.When the side-chain effect is introduced into the currentmodel, the glass temperature may be greatly decreased,then the model can be used at much lower temperaturesand the hidden intermediate in ubiquitin folding observedin experiments at low temperature may be reproduced insimulations. Of course, our arguments here are highlytentative and need to be further investigated.
It is very interesting to note that in a very recent work,the c-Crk SH3 domain has been studied over a broad rangeof temperatures by using a C� Go-model. Below the kineticpartition temperature TKP, two intermediates have beenfound. However, since the main conclusions in this workare deduced from simulations at T � 0.33, its ratio over Tf
is about 0.53, the detected intermediate states in thisprotein have to be examined carefully by experiments.
Although the burst phase intermediate state of themajor phase cannot be reproduced in the current model,we do find an intermediate state Ii which cannot beattributed to the glass dynamics or the artifact of themodel itself. The reason is that this intermediate state canbe populated at a high temperature and at this tempera-ture no intermediate states can be observed in protein CI2by using exactly the same model. This is consistent withthe success of the Go-type models reported previously onthe reproduction of intermediates and transition states.The success of the Go-models suggests that native interac-tions are the primary determinant of most protein folding,and that non-native interactions lead only to local struc-tural perturbations. Although recent literature shows thatsome on-pathway intermediates are actually misfoldedspecies, there are also reports manifesting that someintermediates are mainly stabilized by the native interac-tions and the non-native interactions are not essentiallyfor the formation of these intermediates.71 Remarkably,the Go-models also demonstrate consistency with thegeneral features of transition states though to be stabi-lized by non-native interactions.72 These manifest that the
FOLDING MECHANISMS OF UBIQUITIN 577

Go-type models are still powerful even when non-nativeinteractions are presented but not dominant.
In summary, both the limitation and success of thecurrent C� Go-model have been presented in this work.Generally speaking, the C� Go-type models can still begood tools to study protein folding if we are only interestedin the transition states, intermediate states or some otherproperties under weakly native conditions, such as at nottoo-low temperatures relative to Tf. In this area, thesuccess of the Go-models is surprising. The model’s successcomes from that most proteins are highly optimized andtheir folding are mainly determined by the native interac-tions and that non-native interactions lead only to localstructural perturbations. After introducing side chains ofresidues into C� model, the all-atom Go-model should beworkable in much larger areas. It can be expected that,even for more complex problems, such as interactionsbetween proteins and interactions between proteins andother biomolecules, e.g., DNA and biological membranes,the Go-type model and its more realistic versions will stillbe a powerful method. These will enable us to have adeeper understanding of the mystery of the structure andfunction of biomolecules.
ACKNOWLEDGMENTS
We thank two anonymous referees and the editorialmanager for their critical reading of the manuscript andvery helpful comments.
REFERENCES
1. Go� N. Theoretical studies of protein folding. Annu Review BiophysBioeng 1983;12:183–210.
2. Dill KA, Chan HS. From Levinthal to pathways to funnels. NatStruct Biol 1997;4:10–19.
3. Sali A, Shakhnovich EI, Karplus M. How does a protein fold.Nature 1994;369:248–251.
4. Shakhnovich EI, Farztdinov G, Gutin AM, Karplus M. Proteinfolding bottlenecks: a lattice monte carlo simulation. Phys RevLett 1991;67:1665–1668.
5. Guo Z, Thirumalai D. Kinetics and thermodynamics of folding of ade novo designed four-helix bundle protein. J Mol Biol 1996;263:323–343.
6. Nymeyer H, Carcıa AE, Onuchic JN. Folding funnels and frustra-tion in off-lattice minimalist protein landscapes. Proc Natl AcadSci USA 1998;95:5921–5928.
7. Clementi C, Jennings PA, Onuchic JN. Prediction of foldingmechanism for circular-permuted proteins. J Mol Biol 2001;311:879–890.
8. Clementi C, Nymeyer H, Onuchic JN. Topological and energeticfactors: what determines the structural details of the transitionstate ensemble and “en-route” intermediates for protein folding?An investigation for small globular proteins. J Mol Biol 2000;298:937–953.
9. Clementi C, Jennings PA, Onuchic JN. How native-state topologyaffects the folding of dihydrofolate reductase and interleukin-1�.Proc Natl Acad Sci USA 2000;97:5871–5876.
10. Koga N, Takada S. Roles of native topology and chain-lengthscaling in protein folding: a simulation study with a Go�-like model.J Mol Biol 2001;313:171–180.
11. Wang J, Wang W. Folding transition of model protein chainscharacterized by partition function zeros. J Chem Phys 2003;118:2952–2963.
12. Qin M, Wang J, Tang Y, Wang W. Folding behaviors of latticemodel proteins with three kinds of contact potentials. Phys Rev E2003;67:061905(1–8).
13. Li J, Wang J, Zhang J, Wang W. Thermodynamic stability andkinetic foldability of a lattice protein model. J Chem Phys 2004;120:6274–6287.
14. Duan Y, Kollman PA. Pathways to a protein folding intermediateobserved in a 1-microsecond simulation in aqueous solution.Science 1998;282:740–744.
15. Duan Y, Wang L, Kollman PA. The early stage of folding of villinheadpiece subdomain observed in a 200-nanosecond fully solvatedmolecular dynamics simulation. Proc Natl Acad Sci USA 1998;95:9897–9902.
16. Daggett V, Levitt M. A model of the molten globule state frommolecular dynamics simulations. Proc Natl Acad Sci USA 1992;89:5142–5146.
17. Daggett V. Long timescale simulations. Curr Opin Struct Biol2000;10:160–164.
18. Petrella RJ, Karplus M. A limiting-case study of protein structureprediction: energy-based searches of reduced conformational space.J Phys Chem 2000;104:11370–11378.
19. Snow CD, Nguyen N, Pande VS, Gruebele M. Absolute comparisonof simulated and experimental protein-folding dynamics. Nature2002;420:102–106.
20. Kussell E, Shimada J, Shaklmovich EI. A structure-based methodfor derivation of all-atom potentials for protein folding. Proc NatlAcad Sci USA 2002;99:5343–5348.
21. Shen MY, Freed KF. All-atom fast protein folding simulations: thevillin headpiece. Proteins 2002;49:439–445.
22. Garcıa AE, Onuchic JN. Folding a protein in a computer: anatomic description of the folding/unfolding of protein A Proc NatlAcad Sci USA 2003;100:13898–13903.
23. Head-Gordon T, Brown S. Minimalist models for protein foldingand design. Curr Opin Struct Biol 2003;13:160–167.
24. Ferguson N, Capaldi AP, James R, Kleanthous C, Radford SE.Rapid folding with and without populated intermediates in thehomologous four-helix proteins Im7 and Im9. J Mol Biol 1999;286:1597–1608.
25. Takada S. Go�-ing for the prediction of protein folding mechanisms.Proc Natl Acad Sci USA 1999;96:11698–11700.
26. Baker, D. A surprising simplicity to protein folding. Nature2000;405:39–42.
27. Munoz V, Eaton WA. A simple model for calculating the kinetics ofprotein folding from three-dimensional structures. Proc Natl AcadSci USA 1999;96:11311–11316.
28. Zhou YQ, Karplus M. Interpreting the folding kinetics of helicalproteins. Nature 1999;401:400–403.
29. Zhou YQ, Karplus M. Folding of a model three-helix bundleprotein: a thermodynamic and kinetic analysis. J Mol Biol 1999;293:917–951.
30. Veitshans T, Klimov D, Thirumalai D. Protein folding kinetics:timescales, pathways and energy landscapes in terms of sequence-dependent properties. Fold & De 1996;2:1–22.
31. Thirumalai D, Klimov DK, Woodson SA. Kinetic partitioningmechanism as a unifying theme in the folding of biomolecules.Theor Chem Acc 1997;96:14–22.
32. Wildegger G, Kiefhaber T. Three-state model for lysozyme folding:triangular folding mechanism with an energetically trapped inter-mediate. J Mol Biol 1997;270:294–304.
33. Gianni S, Travaglini-Allocatelli C, Cutruzzola F, Brunori M,Ramachandra Shastry MC, Roder H. Parallel pathways in cyto-chrome c551 folding. J Mol Biol 2003;330:1145–1152.
34. Karanicolas J, Brooks III, CL. The structural basis for biphasickinetics in the folding of the WW domain from a formin-bindingprotein: lessons for protein design? Proc Natl Acad Sci USA2003;100:3954–3959.
35. Kamagata K, Sawano Y, Tanokura M, Kuwajhna K. Multipleparallel-pathway folding of proline-free staphylococcal nuclease. JMol Biol 2003;332:1143–1153.
36. Abkevich VI, Gutin AM, Shakhnovich EI. Free energy landscapefor protein folding kinetics: intermediates, traps, and multiplepathways in theory and lattice model simulations. J Chem Phys1994;101:6052–6062.
37. Dinner AR, Karplus M. The Thermodynamics and kinetıcs ofprotein folding: a lattice model analysis of multiple pathways withintermediates. J Phys Chem 1999;103:7976–7994.
38. Sorenson JM, Head-Gordon T. Toward minimalist models of largeproteins: a ubiquitin-like protein. Proteins 2002;46:368–379.
39. Laub PB, Khorasanizadeh S, Roder H. Localized solution struc-ture refinement of an F45W variant of ubiquitin using stochasticboundary molecular dynamics and NMR distance restraints.Protein Sci 1995;4:973–982.
40. Carrion-Vazquez M, Li HB, Lu H, Marszalek PE, Oberhauser AF,
578 J. ZHANG ET AL.

Fernandez JM. The mechanical stability of ubiquitin is linkagedependent. Nat Struct Biol 2003;10:738–743.
41. Khorasanizadeh S, Peters ID, Butt TR, Roder H. Folding andstability of a tryptophan-containing mutant of ubiquitin. Biochem-istry 1993;32:7054–7063.
42. Khorasanizadeh S, Peters ID, Roder H. Evidence for a three-statemodel of protein folding from kinetic analysis of ubiquitin variantswith altered core residues. Nat Struct Biol 1996;3:193–205.
43. Briggs MS, Roder H. Early hydrogen-bounding events in thefolding reaction of ubiquitin. Proc Natl Acad Sci USA 1992;89:2017–2021.
44. Krantz BA, Sosnick TR. Distinguishing between two-state andthree-state models for ubiquitin folding. Biochemistry 2000;39:11696–11701.
45. Qin Z, Ervin J, Larios E, Gruebele M, Kihara H. Formation of acompact structured ensemble without fluorescence signature earlyduring ubiquitin folding. J Phys Chem B 2002;106:13040–13046.
46. Larios E, Li JS, Schulten K, Kihara H, Gruebele M. Multipleprobes reveal a native-like intermediate during low-temperaturerefolding of ubiquitin J Mol Biol 2004;340:115–125.
47. Went HM, Benitez-Cardoza CG, Jackson SE. Is an intermediatestate populated on the folding pathway of ubiquitin? FEBS Lett2004;567:333–338.
48. Fernandez A. Time-resolved backbone desolvation and muta-tional hot spots in folding proteins. Proteins 2002;47:447–457.
49. Fernandez A, Colubri A. Pathway heterogeneity in protein fold-ing. Proteins 2002;48:293–310.
50. Sosnick TR, Berry RS, Fernandez A, Colubri A. Distinguishingfoldable proteins from nonfolders: when and how do they differ?Proteins 2002;49:15–23.
51. Alonso DOV, Daggett V. Molecular dynamics simulations ofprotein unfolding and limited refolding: characterization of par-tially unfolded states of ubiquitin in 60% methanol and in water. JMol Biol 1995;247:501–20.
52. Alonso DOV, Daggett V. Molecular dynamics simulations ofhydrophobic collapse of ubiquitin. Protein Sci 1998;7:860–874.
53. Michnick SW, Shakhnovich E. A strategy for detecting the conser-vation of folding-nucleus residues in protein superfamilies. FoldDes 1998;3:239–251.
54. Gladwin ST, Evans PA. Structure of very early protein foldingintermediates: new insights through a variant of hydrogen ex-change labelling. Fold Des 1996;1:407–417.
55. Case DA, Pearlman DA, Caldwell JW, Cheatham III TE, Wang J,Ross WS, Simmerling CL, Darden TA, Merz KM, Stanton RV, andothers. AMBER 7, 2002, University of California, San Francisco.
56. Nakamura HK, Sasai M, Takano M. Squeezed exponential tialkinetics to describe a nonglassy downhill folding as observed in alattice protein model. Proteins 2004;55:99–106.
57. Chan HS. Modeling protein density of states: additive hydropho-bic effects are insufficient for calorimetric two-state cooperativity.Proteins 2000;40:543–571.
58. Kaya H, Chan HS. Polymer principles of protein calorimetrictwo-state cooperativity. Proteins 2000;40:637–661.
59. Kaya H, Chan HS. Solvation effects and driving forces for proteinthermodynamic and kinetic cooperativity: how adequate is native-centric topological modeling? J Mol Biol 2003;326:911–931.
60. Kaya H, Chan HS. Origins of chevron rollovers in non-two-stateprotein folding kinetics. Phys Rev Lett 2003;90:258104.
61. Chan HS, Shimizu S, Kaya H. Cooperativity principles in proteinfolding. Methods Enzymol 2004;380:350–379.
62. Dokholyan NV, Buldyrev SV, Stanley HE, Shakhnovich EI.Identifying the protein folding nucleus using molecular dynamics.J Mol Biol 2000;296:1183–1188.
63. Harding MM, Williams DH, Woolfson DN. Characterization of apartially denatured state of a protein by two-dimensional NMR:reduction of the hydrophobic interactions in ubiquitin. Biochemis-try 1991;30:3120–3128.
64. Bolton D, Evans PA, Stott K, Brondhurst RW. Structure andproperties of a dimeric N-terminal fragment of human ubiquitin. JMol Biol 2001;314:773–787.
65. Zagrovic B, Snow CD, Khaliq S, Shirts MR, Pande VS. Native-likemean structure in the unfolded ensemble of small proteins. J MolBiol 2002;323:153–164.
66. Gianni S, Guydosh NR, Khan F, Caldas TD, Mayor U, WhiteGWN, DeMarco ML, Daggett V, and Fersht AR. Unifying featuresin protein-folding mechanisms. Proc Natl Acad Sci USA 2003;100:13286–13291.
67. Cochran AG, Skelton NJ, Starovasnik MA. Tryptophan zippers:stable, monomeric b-hairpins. Proc Natl Acad Sci USA 2001;98:5578–5583.
68. Gorski SA, Duff CSL, Capaldi AP, Kalverdal AP, Beddard GS,Moore GR, Radford SE. Equilibrium hydrogen exchange revealsextensive hydrogen bonded secondary structure in the on-pathway intermediate of Im7. J Mol Biol 2004;337:183–193.
69. Fersht AR. Nucleation mechanisms in protein folding. Curr OpinStruct Biol 1997;7:3–9.
70. Clementi C, Garcıa AE, Onuchic JN. Interplay among tertiarycontacts, secondary structure formation and side-chain packing inthe protein folding mechanism: all-atom representation study ofprotein L. J Mol Biol 2003;326:933–954.
71. Mizuguchi M, Kobashigawa Y, Kumaki Y, Demura M, Kawano K,Nittal K. Effects of a helix substitution on the folding mechanismof bovine �-Lactalbumin. Proteins 2002;49:95– 103.
72. Karanicolas J, Brooks III CL. Improved Co-like models demon-strate the robustness of protein folding mechanisms towardnonnative interactions. J Mol Biol 2003;334:309–325.
FOLDING MECHANISMS OF UBIQUITIN 579