multilateral trade liberalization and economic … trade organization, geneva, switzerland *...
TRANSCRIPT
Abstract
Over the last years, the world has experienced a backlash against trade. It could translate into a strong appeal to trade protectionism, lowering multilateral cooperation and delaying further trade liberalization at both domestic and international level. Against this background, this paper assesses the impact of multilateral trade liberalization on the economic growth rate by using an unbalanced panel dataset comprising 150 countries over the period 1995~2015. Results suggest a strong positive impact of multilateral trade liberalization on economic growth in both entire sample and sub-samples alike.
JEL Classifications: F13, F43Keywords: Multilateral trade liberalization, Economic growth, Developed and developing countries
ⓒ 2018-Center for Economic Integration, Sejong Institution, Sejong University, All Rights Reserved. pISSN: 1225-651X eISSN: 1976-5525
Multilateral Trade Liberalization and Economic Growth
Sèna Kimm GnangnonWorld Trade Organization, Geneva, Switzerland
* Corresponding Author: Sèna Kimm Gnangnon; World Trade Organization, Rue de Lausanne 154, CH-1211 Geneva 21, Switzerland. E-mail: [email protected]; [email protected]
Acknowledgements: The Author would like to express his gratitude to the Editor-in-Chief and the anonymous Referees for their comments on the earlier version of the paper. This paper represents the personal opinions of individual staff members and is not meant to represent the position or opinions of the WTO or its Members, nor the official position of any staff members. Any errors or omissions are the fault of the author.
Journal of Economic Integration
Vol.33 No.2, June, 2018, 1261~1301http://dx.doi.org/10.11130/jei.2018.33.2.1261
jei
1262
I. Introduction
One of the most debated topics in the area of development economics is the relationship between international trade and economic development, particularly economic growth (Singh 2010, Salvatore 2011). Researchers have largely explored the theoretical and empirical links between international trade and economic growth. However, the impact of domestic trade liberalization on economic growth has received much less attention even though the theoretical aspects of this relationship have been well established. Surprisingly, little attention has been paid to the effect of multilateral trade liberalization (reduction for a given country of world trade barriers) on countries' economic growth.
From a theoretical perspective, trade liberalization could allow the reallocation of resources from the areas of comparative disadvantages (where resources may be redundant) into the areas of comparative advantage, thereby facilitating the movement of the income toward its steady -state level. Thus, even if in the short-term trade liberalization could negatively affects economic growth, in the medium-to the long-term, its impact could become positive. These static gains could be enhanced by reductions in rent seeking, corruption, and smuggling. Other gains entail greater economies of scale and scope, including in export industries, reduction of market power in protected markets, knowledge and technology spillovers, increased variety and quality of imported goods available to domestic producers and consumers, stimulation of export-platform Foreign Direct Investment (FDI) inflows ( Lee, 1995, Falvey et al., 2012).
On the empirical front, studies on the impact of trade liberalization on economic growth have used various econometric approaches, and reached mixed. Papageorgiou et al. (1991) have reported that trade liberalization results in a more rapid growth of exports and Gross Domestic Product (GDP), without significant transitional costs in terms of unemployment. Greenaway et al.
Vol.33 No.2, June, 2018, 1263~1303 Sèna Kimm Gnangnon
http://dx.doi.org/10.11130/jei.2018.33.2.1263jei
Multilateral Trade Liberalization and Economic Growth jei
1263
(1997) have used a smooth transition model to examine whether there exists a transition in the level and trend of real GDP per capita for 13 countries, and whether these are related to trade liberalization. They concluded that in the majority of countries, transition in level or trend was negative, and where it was positive, it was not affected by trade liberalization. Based on case studies, Greenway (1998) concluded that the impact of trade liberalization on economic growth can be positive or negative, although the cases for positive impact tend to dominate those over the negative impact. Using a dynamic panel model, Greenaway et al. (1998, 2002) obtained that there exist in the short-term and long-term, a J-curve effect, whereby economic growth declines in the first instances, and then increases after liberalization. Wacziard and Welch (2008) have used panel data regression which include fixed effects and time effects and have found that a liberalized and a non-liberalized country experience a difference in growth of 1.53%. In the same vein, Salinas and Aksoy (2006) have provided evidence that trade liberalization promotes growth by between 1% and 4%. Falvey et al. (2012) have used threshold regression techniques, including a single threshold (i.e., a two-regime model) to investigate whether economic crisis is a good time for countries to undertake trade reforms. In particular, they examined whether there is differential growth effects in the crisis and non-crisis regimes. Their findings have suggested that while trade liberalization has raised subsequent economic growth in both crisis and non-crisis periods, it appeared that internal crisis generated a lower acceleration of economic growth, whereas an external crisis induces a higher acceleration related to non-crisis. Chang et al. (2009) have used the system Generalized Methods of Moments (GMM) estimator to examine the role of policy complementarities in enhancing the positive effect of trade openness on economic growth. They concluded that the growth effect of trade openness may be significantly improved if certain complementary reforms are undertaken. Christiansen et al. (2013) have used the GMM approach and reported that economic growth benefits from trade liberalization. More recently, Naito (2017) has formulated an asymmetric two-country Melitz model of trade and endogenous growth, and demonstrated that
Vol.33 No.2, June, 2018, 1263~1303 Sèna Kimm Gnangnon
http://dx.doi.org/10.11130/jei.2018.33.2.1263jei
1264
unilateral trade liberalization increases growth of all countries for all periods. In parallel to the impact of trade liberalization, another discussion has
recently re-surfaced in light of recent years’ backlash against international trade. This trade backlash has manifested in a strong appeal for the adoption of restrictive domestic trade measures amid world economic slowdown (United Nations 2017, WTO 2017). In this context, concerns could arise as to whether the rise in restrictive domestic trade measures would not undermine multilateral cooperation on trade. This is because WTO Members had delivered substantive multilateral outcomes at two consecutive WTO Ministerial Conferences1 for example, the 2013 Bali Ministerial Conference and the 2015 Nairobi Ministerial Conference, which were genuinely the two historically successful Ministerial meetings since the creation of the WTO in 1995. The implementation of the outcomes, which are currently underway, could induce greater multilateral trade liberalization.
Among studies that have used macroeconomic data2 to examine the macroeconomic impact of multilateral trade liberalization (Egger et al. 2004, Collie 2011, Ratnaike 2012, Gnangnon 2017a 2017b 2017c 2017d 2017e and 2017f), only two papers (Egger et al. 2004, Gnangnon 2017b) are closely related to the topic addressed in the current paper. Egger et al. (2004) have used numerical simulation models to examine the effect of multilateral and bilateral trade and investment liberalization on countries’ welfare and convergence in per capita Gross Domestic Product (GDP). Overall, they have obtained that pure multilateral trade liberalization could be welfare enhancing. Moreover, their findings have suggest that both pure multilateral trade liberalization, and bilateral trade and investment liberalization are less likely to promote most effectively the convergence in per capita GDP than multilateral trade and investment liberalization, or pure multilateral investment liberalization. Gnangnon(2017b) has used a quantile regressions
1The outcome of the 2013 Bali Ministerial Conference is online at: https://www.wto.org/english/thewto_e/minist_e/mc9_e/balipackage_e.htm The outcome of the 2015 Nairobi Ministerial Conference is online at: https://www.wto.org/english/thewto_e/minist_e/mc10_e/nairobipackage_e.htm 2Hertel et al. (2003), Hertel et al. (2004), Bamou and Tchanou (2006) and Casabianca (2016) are examples of studies that have used microeconomic or sectoral data to investigate the distributional impact of multilateral trade liberalization.
Multilateral Trade Liberalization and Economic Growth jei
1265
approach and a macroeconomic indicator of multilateral trade liberalization (Ratnaike 2012, Gnangnon 2017a 2017c 2017d 2017e and 2017f who have used the same indicator in their analyses) to investigate the impact of multilateral trade liberalization on countries’ development level, as proxied by their real per capita GDP. This study has provided evidence of strong support for the view that multilateral trade liberalization promotes countries’ economic development.
The objective of the current study is to contribute to this strand of literature by examining the impact of multilateral trade liberalization (and not domestic trade policy liberalization) on economic growth. In that respect, it departs from previous studies that have focused on the impact of (domestic) trade liberalization (or trade openness) on economic growth, by investigating how countries' access to the world trade market (thanks to multilateral trade liberalization) influences their economic growth rate. Furthermore, this article draws on the standard growth literature, and in line with few of the afore-mentioned studies (Chang et al. 2009 and Christiansen et al. 2013) uses the GMM approach to address the issue at hand. The analysis is conducted on an unbalanced panel dataset containing 150 countries over the period 1995~2015 using non-overlapping sub-periods of 3 year averages. The salient message of this analysis is that multilateral trade liberalization strongly promotes economic growth although the magnitude of this positive impact varies across sub-samples of countries. In particular, upper-middle-income countries and high-income countries appear to be the main beneficiaries of the growth effect of multilateral trade liberalization. It is because these countries have a greater trading capacity than low-income or lower-middle-income countries. This allows them to take better advantage of the opportunities offered by multilateral trade liberalization to promote their economic growth than the other categories of countries. The rest of the paper is organized as follows. Section II provides a theoretical discussion on the avenues through which multilateral trade liberalization can influence economic growth. Section III presents the model underlying the empirical assessment for the impact of
Vol.33 No.2, June, 2018, 1263~1303 Sèna Kimm Gnangnon
http://dx.doi.org/10.11130/jei.2018.33.2.1263jei
1266
multilateral trade liberalization on economic growth. Section IV interprets empirical results and Section V concludes.
II. Conceptual Framework
A. Definition and measurement
We follow a number of recent studies (Ratnaike 2012, Gnangnon 2017a, 2017b, 2017c, 2017d, 2017e, 2017f) and define “multilateral trade policy liberalization” as all trade-related decisions—including those adopted under the auspices of the WTO—that ultimately contribute to reducing tariff and non-tariff barriers to trade for all countries, or at least for the overwhelming majority of them. For example, decisions or agreements adopted by WTO trade ministers (such as the Trade Facilitation Agreement3 adopted in 2013 and the Export Competition Decision4 adopted in 2015) at WTO Ministerial Conferences apply to all WTO Members and contribute directly to the liberalization of trade at the multilateral level. Similarly, the reduction of tariff and non-tariff barriers among members of a trading group involving many WTO Members would certainly lead to multilateral trade liberalization if extended to countries that are not members of the group.
Computing an indicator of multilateral trade liberalization is not an easy task. In light of the aforementioned definition of multilateral trade liberalization, the computation of multilateral trade liberalization requires
3The TFA is the first multilateral deal concluded in the 21-year history of the World Trade Organization (see further information online: https://www.wto.org/english/news_e/news17_e/fac_31jan17_e.htm). It aims at simplifying, modernizing, and harmonizing export and import processes. It contains provisions for expediting the movement, release, and clearance of goods, including goods in transit. It also sets out measures for effective cooperation between customs and other appropriate authorities on trade facilitation and customs compliance issues. It further contains provisions for technical assistance and capacity building in this area (see further information online at: https://www.wto.org/english/tratop_e/tradfa_e/tradfa_e.htm). According to a 2015 study carried out by WTO economists (see online at: https://www.wto.org/english/res_e/publications_e/wtr15_e.htm), the full implementation of the TFA would reduce members’ trade costs by an average of 14.3 percent, with developing countries having the most to gain. Furthermore, it is expected to reduce the time needed to import goods by over a day and a half and to export goods by almost two days, representing a reduction of 47 percent and 91 percent, respectively, over the current average. 4The multilateral (WTO) Export Competition Decision contains some provisions that oblige all WTO Members, including developed and developing countries, to reduce their agricultural subsidies that cause distortions in the international trade markets.

Multilateral Trade Liberalization and Economic Growth jei
1267
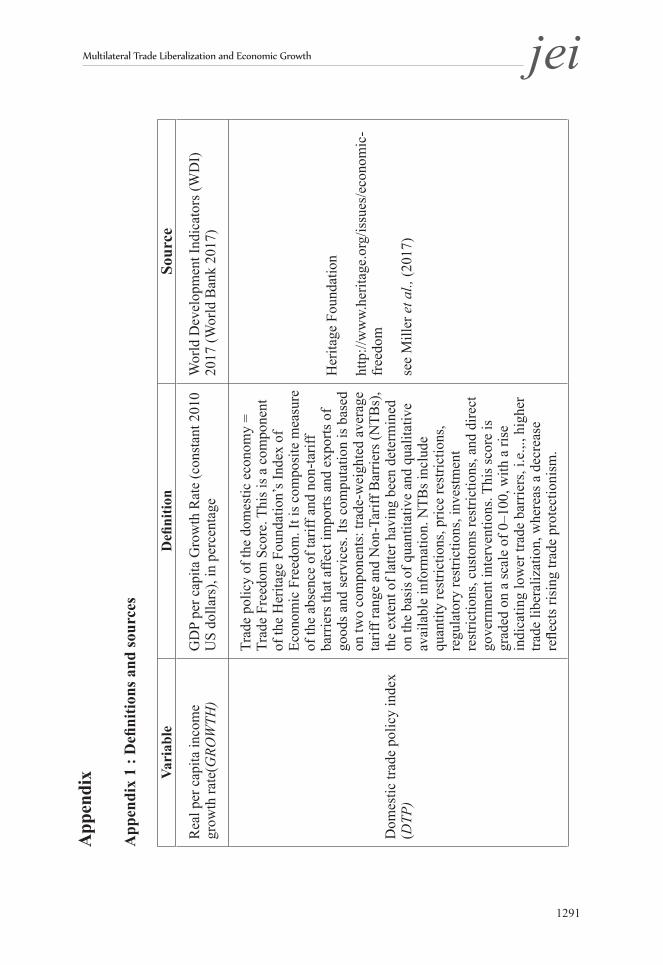
finding an appropriate indicator of domestic trade policy liberalization. Following Ratnaike (2012) and Gnangnon (2017a, 2017b, 2017c, 2017d, 2017e, 2017f), we use two criteria to choose the appropriate indicator of domestic trade policy that would help us calculate the index of multilateral trade policy. First, the indicator of domestic trade policy should reflect the multiple facets of trade policy, including both tariff and non-tariff measures. Second, it should allow computing the indicator of multilateral trade policy liberalization according to the definition of multilateral trade liberalization provided above. The absence of consensus in the international trade literature on a unique indicator of trade policy further complicates the task of computing a multilateral trade liberalization indicator. In this study, the only one indicator that appears to fulfill these two conditions is the “freedom to trade internationally.” This indicator, developed by the Heritage Foundation5 (Miller et al. 2017), represents an important component of the Economic Freedom Index (EFW) and is employed in the empirical macroeconomic literature. Therefore, we calculate the index of multilateral trade liberalization by relying on the “"freedom to trade internationally” index proposed by the Heritage Foundation, as a measure of the domestic trade policy. It is worth noting that the “freedom to trade internationally” index developed by the Fraser Institute6 would have been used to compute the indicator of multilateral trade liberalization. However, this indicator has a lower annual data coverage compared with the indicator developed by the Heritage Foundation. Against this background, the indicator of multilateral trade liberalization is computed as follows: for a given country, multilateral trade policy liberalization is the average of the domestic trade policy liberalization (i.e., the trade policy liberalization score of a given country) of the rest of the world, i.e., of all the other countries (except for the concerned country). This allows us to obtain over the panel dataset a time-varying variable of multilateral trade
5Data for this index are found at http://www.heritage.org/index/ 6Data for this index are found at https://www.fraserinstitute.org/

Vol.33 No.2, June, 2018, 1263~1303 Sèna Kimm Gnangnon
http://dx.doi.org/10.11130/jei.2018.33.2.1263jei
1268
liberalization that indicates the extent of multilateral trade liberalization that a given country faces.
To provide insight into the relationship between multilateral trade policy liberalization and growth, Figure 1 illustrates the correlation pattern between the index of multilateral trade liberalization (MTP) and the real per capita income growth rates (GROWTH). The correlation pattern between these two variables displayed in Figure 1 is not clear-cut. It particularly appears that one country, notably Equatorial Guinea is an outlier in this Figure. Statistics show that Equatorial Guinea had experienced very high values of real per capita
Figure 1. Correlation pattern
(Note) MTP denotes the index of multilateral trade liberalization and Growth denotes the real per capita income growth rates.
(Source) Author’s own creation
100
500
-50
GR
OW
TH
Multilateral Trade Liberalization

Multilateral Trade Liberalization and Economic Growth jei
1269
income growth rate during the period 1995~2015. For example, in 1996, 1997, and 2001, the growth rate was, respectively, 61%, 141.6%, and 58%. Accordingly, we address the presence of this outlier in the empirical analysis.
B. Discussion on the expected impact
There are several channels through which multilateral trade liberalization can promote economic growth.
First, by improving welfare (e.g., Hertel et al. 2003, Egger et al. 2004, Hertel et al. 2004, Casabianca 2016), multilateral trade liberalization would surely contribute to promoting economic growth.
Second, by promoting FDI inflows (Collie 2011, Gnangnon 2017a), multilateral trade liberalization could induce higher economic growth in light of the possible positive impact of FDI inflows on economic growth. Indeed, from a theoretical perspective, FDI inflows could promote economic growth, including long-term growth through several channels, including the incorporation of new technologies in the production function of the host economy (Borensztein et al. 1998), the rise in the existing stock of knowledge in the host economy through labor training and skill acquisition (Hanson and Slaughter 2003), the introduction of alternative management practices and organizational arrangements (De Mello and Jr Luiz 1999), and capital accumulation and knowledge spillover (Niles 2003). Several studies have provided empirical support for a positive impact of FDI inflows on economic growth (Borensztein et al. 1998, Lee 1998, Bengoa and Sanchez-Robles 2003, Li and Liu 2005, Hertel 2008, and Gomes and Veiga 2013).
Third, by helping reduce trade costs, multilateral trade liberalization (such as the Trade Facilitation Agreement and the Export Competition Decision) could promote export diversification (Beverelli et al., 2015). Such export diversification would be further enhanced if multilateral trade liberalization helps address the tariff peaks and escalations faced by developing countries when they try to export higher value added products to developed countries’
Vol.33 No.2, June, 2018, 1263~1303 Sèna Kimm Gnangnon
http://dx.doi.org/10.11130/jei.2018.33.2.1263jei
1270
markets. Export diversification could, in turn, promote economic growth (Hesse 2008, Aditya and Acharyya 2013).
Fourth, greater cooperation at the multilateral level on trade matters among WTO Members could facilitate multilateral cooperation on other issues, such as global financial and monetary as well as climate change issues, and international security matters such as international terrorism. These would help reduce the frequency of occurrence of external shocks, which particularly hurt economic growth in developing countries and poor countries that lack the financial resources to cope with the adverse consequences of these shocks. In this context, multilateral trade liberalization can be conducive to economic growth (Guillaumont and Wagner 2012, Dabla-Norris and Gündüz 2014, Shabnam 2014).
Fifth, by helping dampen terms of trade fluctuations and in the international trade market, multilateral trade liberalization, such as the Export Competition Decision adopted by WTO Members at the Nairobi Ministerial Conference, could provide traders in countries, including developing and the poorest ones, with stable incom e. This could, in turn, lead to higher domestic consumption and/or imports, which would ultimately promote economic growth.
Sixth, as multilateral trade liberalization could generate higher public revenue (Gnangnon 2017d), it could help governments provide the basic infrastructure as well as physical infrastructure needed to spur economic growth. As a result, it would lead to higher economic growth.
III. Model specification
The estimation of the impact of multilateral trade liberalization on economic growth is carried out by drawing on the standard growth literature7. In particular, we consider a model that includes control variables affecting
7There is a voluminous literature that has explored various microeconomic and macroeconomic factors that could affect countries’ economic growth or per capita income. A survey of this literature could be found in a survey on this literature is provided by Chirwa and Odhiambo (2016).
Multilateral Trade Liberalization and Economic Growth jei
1271
it it it it
it itit 1110
it it itit13 1412
(1)
the influence of multilateral trade liberalization on economic growth. These controls include domestic trade policy, financial openness, financial development, human capital accumulation (proxied by the gross enrolment ratio in secondary schools), government expenditure over GDP, inflation rate, the initial real per capita income to capture convergence, gross fixed capital formation as a share of GDP as a measure of the level of domestic investment, total population, and a measure of institutional and governance quality.
Therefore, we postulate the following baseline dynamic model:
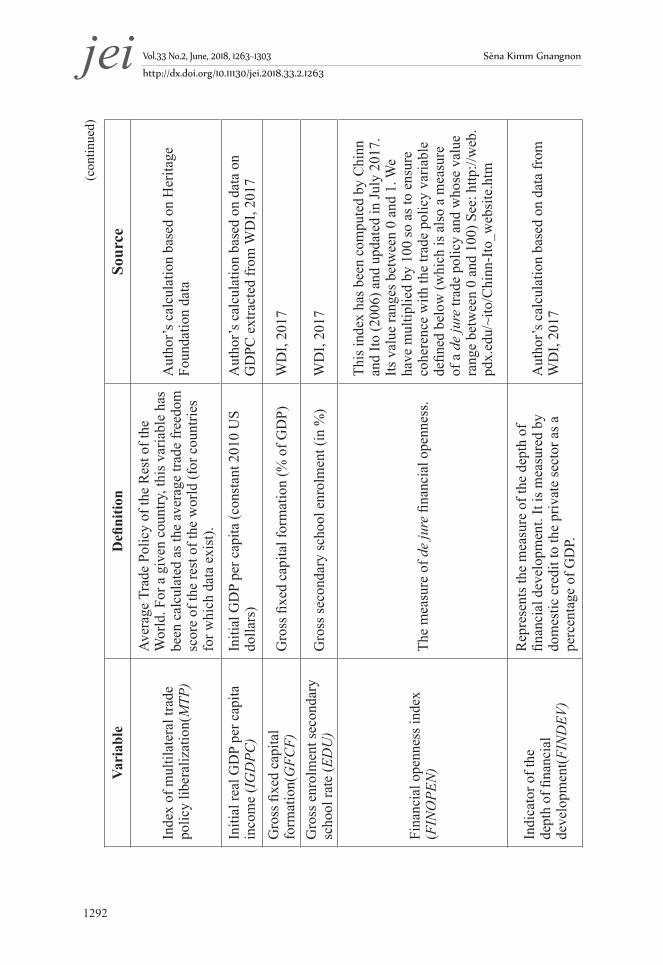
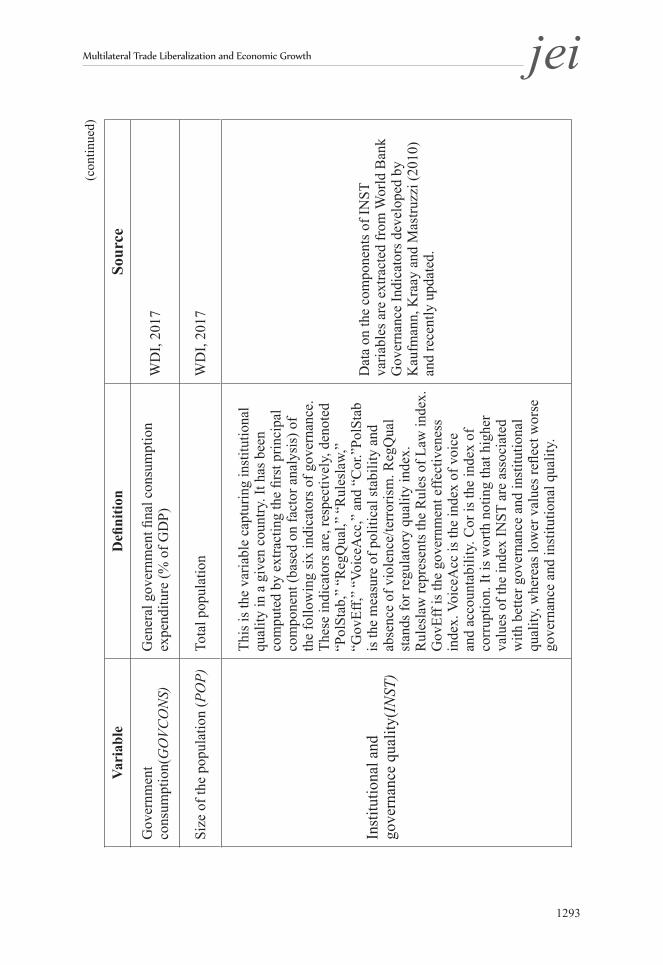
where i represents the country’s index and t denotes the time period. The panel dataset used is unbalanced and contains 150 countries (developed and developing), with data spanning over seven non-overlapping sub-periods of three years covering the period 1995~2015. The sub-periods considered are respectively 1995~1997, 1998~2000, 2001~2003, 2004~2006, 2007~2009, 2010~2012, and 2013~2015. The choice of the dataset is dictated by data availability. The sources of these variables as well as their definition are provided in Appendix 1. α 0to α 14are parameters to be estimated. μi are countries’ fixed effects. κt are time dummies capturing shocks that could have affected together all countries’ economic growth patterns. εit is a well-behaving error term.
The dependent variable GROWTH is real per capita income growth rate, which we henceforth refer to as “growth.”
MTP is our index of multilateral trade policy liberalization, whose expected theoretical impact has been discussed in Section II.
The variable DUM stands for a dummy variable taking the value 1 for the country Equatorial Guinea and 0 otherwise. Indeed, in light of the observation

Vol.33 No.2, June, 2018, 1263~1303 Sèna Kimm Gnangnon
http://dx.doi.org/10.11130/jei.2018.33.2.1263jei
1272
in Figure 1 that Equatorial Guinea is an outlier in the relationship between multilateral trade liberalization and economic growth over the entire sample, we control in Model (1) for this outlier effect so as to avoid biased estimates, notably of the estimate of the variable MTP. This involves the inclusion in Model (1) of this dummy variable along with its interaction with the MTP variable.
The variables DTP (domestic trade policy index), IGDPC (initial real GDP per capita income), FINOPEN (financial openness index), FINDEV (indicator of the depth of financial development), EDU (gross enrolment secondary school rate), GOVCONS (government consumption, in % GDP), GFCF (gross fixed capital formation, in % GDP), INF (inflation rate, expressed in terms of percentage), POP (size of the population), and INST (institutional and governance quality) are described along with their sources in Appendix 1. The standard descriptive statistics are reported in Appendix 2 and pairwise correlations among variables are presented in Appendix 3.
As described in Appendix 1, we have computed our indicator of institutional and governance quality by following the empirical literature on this field (Globerman and Shapiro 2002, Buchanan et al. 2012), i.e., by relying on the factor analysis and using the first principal components of five indicators of governance, namely, a measure of political stability and absence of violence/terrorism, regulatory quality index, rules of law index, government effectiveness index, and index of corruption.
The use of factor analysis to compute the index of institutional and governance quality severely mitigates the possible endogeneity of this variable. Notwithstanding, a number of other endogeneity issues need to be addressed in the estimation of Model (1). These include the presence of the one-year lag of the dependent variable as a regressor, which could potentially generate the Nickell’s (1981) bias, given the nature of our panel dataset (short time period and large cross-section). Additionally, there is a potential endogeneity of the variables DTP, IGDPC, FINOPEN, FINDEV,

Multilateral Trade Liberalization and Economic Growth jei
1273
EDU, GOVCONS, GFCF, and INF due to the possible reverse causality from the dependent variable to each of these variables. In this context, we need an appropriate estimator to obtain efficient estimates from the estimation of Model (1). Dynamic panel estimators, such as the difference and the system GMM, have become popular to address the abovementioned endogeneity issues in panel data like ours, i.e., with a short time-period and large cross-section. The difference GMM estimator involves the transformation of regressors through differencing. This estimator uses lags of the regressors as instruments for the first-differenced estimators. However, when variables such as economic growth follow a random walk, lagged levels can be poor instruments for first differences. Additionally, Roodman (2009) has suggested avoiding using the difference GMM estimator when the panel dataset is unbalanced, as this estimator has a weakness of magnifying gaps. To address the weaknesses of the difference GMM, the system GMM estimator has been developed by Arellano and Bover (1995) and Blundell and Bond (1998). This involves the estimation of a system of equation where an equation in levels is added to the difference equation. In this system, the equation in levels uses lagged differences of the regressors as instruments, whereas the equation in differences uses lagged levels of regressors as instruments. Hence, the proposed system GMM relies upon the assumption that the differenced variables used as instruments are uncorrelated with country fixed effects. Furthermore, it allows for efficiency gain through the use of additional instruments. The system GMM has two variants: the one-step system GMM and the two-step system GMM. Between these two types of system GMM estimators, the two-step system GMM estimator performs better than the one-step GMM estimator, in the presence of heteroscedasticity and serial correlation, as the former uses a consistent estimate of the weighting matrix taking the residuals from the one-step estimate (Davidson and MacKinnon, 2004). In this paper, we use the system GMM approach, in particular the two-

Vol.33 No.2, June, 2018, 1263~1303 Sèna Kimm Gnangnon
http://dx.doi.org/10.11130/jei.2018.33.2.1263jei
1274
step system GMM estimator. We check the appropriateness of this estimator by performing the following diagnostic tests: the Arellano–Bond test of first-order serial correlation (AR(1)) in the residuals and no second-order autocorrelation (AR(2)) in the error term as well as the standard Sargan test of over-identifying restrictions (OID), which determines the validity of the instruments used in the estimations. We also present results of the third-order serial correlation (AR(3)) in the error term. The number of instruments used in the regressions is also reported because researchers like Roodman (2009) have shown that the abovementioned diagnostic tests may lose power if the number of instruments is higher than the number of countries.
Overall, we estimate Model (1) over the entire sample by means of the two-step system GMM estimator. In addition, we carry out the estimations of several variants of this model, which allows us to examine the differentiated impact of multilateral trade liberalization on economic growth over several sub-samples. These sub-samples include Low-Income Countries (LICs), Lower-Middle-Income Countries (LMICs), Upper-Middle-Income Countries (UMICs), and High-Income Countries (HICs), as per the World Bank’s classification of countries in the world. The lists of countries contained in the entire sample as well as in each of these sub-samples are presented in Appendices 4 and 5. To examine these differentiated impacts, we create four dummies, namely, LIC (which takes the value 1 when a country is classified as belonging to the category of LICs and 0 otherwise), LMIC (which takes the value 1 when a country is classified as belonging to the category of LMICs and 0 otherwise), UMIC (which takes the value 1 when a country is classified as belonging to the category of UMICs and 0 otherwise), HIC (which takes the value 1 when a country is classified as belonging to the category of HICs and 0 otherwise). Each of these dummies is interacted with the MTP variable and both the dummy and its interaction with the MTP variable are included once in Model (1).
In the estimations of all these specifications of Model (1), the variables DTP, IGDPC, FINOPEN, FINDEV, EDU, GOVCONS, GFCF, and INF are
Multilateral Trade Liberalization and Economic Growth jei
1275
considered as endogenous. Moreover, in all regressions, we use a maximum of two lags of dependent variable as instruments and two lags of endogenous variables as instruments.
IV. Empirical results
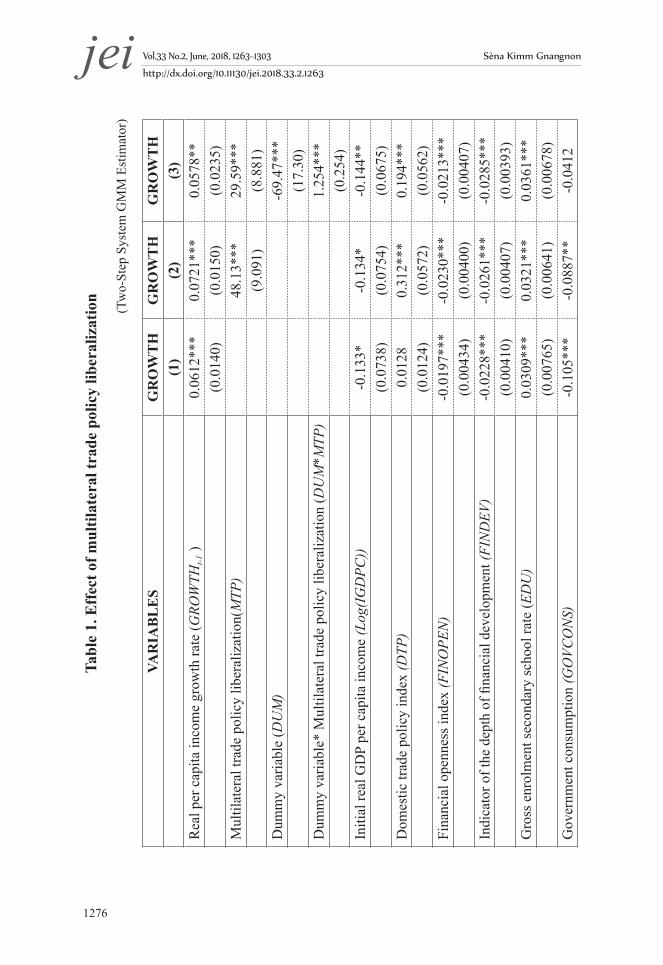
Table 1 reports the outcome of the estimation of Model (1). In particular, column 1 of this table provides the estimates of the Model (1) specification and do not include the MTP variable or the variable DUM and its interaction with the MTP variable. Column 2 provides the estimates of Model (1) specification, which includes only t e MTP variable, but not variable DUM and its interaction with the MTP variable (which aims to address the outlier effect on the estimates). Finally column 3 displays the results of Model (1) as it stands, i.e., including all variables.
Vol.33 No.2, June, 2018, 1263~1303 Sèna Kimm Gnangnon
http://dx.doi.org/10.11130/jei.2018.33.2.1263jei
1276
Tabl
e 1.
Eff
ect o
f mul
tilat
eral
trad
e po
licy
liber
aliz
atio
n
(Tw
o-St
ep S
yste
m G
MM
Est
imat
or)
VAR
IAB
LE
SG
RO
WT
HG
RO
WT
HG
RO
WT
H(1
)(2
)(3
)R
eal p
er c
apita
inco
me
grow
th ra
te (G
ROW
THt-1
)0.
0612
***
0.07
21**
*0.
0578
**(0
.014
0)(0
.015
0)(0
.023
5)M
ultil
ater
al tr
ade
polic
y lib
eral
izat
ion(
MTP
)48
.13*
**29
.59*
**(9
.091
)(8
.881
)D
umm
y va
riabl
e (D
UM
)-6
9.47
***
(17.
30)
Dum
my
varia
ble*
Mul
tilat
eral
trad
e po
licy
liber
aliz
atio
n (D
UM
*MTP
)1.
254*
**(0
.254
)In
itial
real
GD
P pe
r cap
ita in
com
e (L
og(I
GD
PC))
-0.1
33*
-0.1
34*
-0.1
44**
(0.0
738)
(0.0
754)
(0.0
675)
Dom
estic
trad
e po
licy
inde
x (D
TP)
0.01
280.
312*
**0.
194*
**(0
.012
4)(0
.057
2)(0
.056
2)Fi
nanc
ial o
penn
ess i
ndex
(FIN
OPE
N)
-0.0
197*
**-0
.023
0***
-0.0
213*
**(0
.004
34)
(0.0
0400
)(0
.004
07)
Indi
cato
r of t
he d
epth
of fi
nanc
ial d
evel
opm
ent (
FIN
DEV
)-0
.022
8***
-0.0
261*
**-0
.028
5***
(0.0
0410
)(0
.004
07)
(0.0
0393
)G
ross
enr
olm
ent s
econ
dary
scho
ol ra
te (E
DU
)0.
0309
***
0.03
21**
*0.
0361
***
(0.0
0765
)(0
.006
41)
(0.0
0678
)G
over
nmen
t con
sum
ptio
n (G
OVC
ON
S)-0
.105
***
-0.0
887*
*-0
.041
2
Multilateral Trade Liberalization and Economic Growth jei
1277
(Not
e)*p
-val
ue <
0.1
; **p
-val
ue <
0.0
5; *
**p-
valu
e <
0.01
. Rob
ust S
tand
ard
Erro
rs a
re in
par
enth
esis
. The
var
iabl
e D
UM
is a
dum
my
varia
ble
taki
ng th
e va
lue
1 fo
r the
cou
ntry
Equ
ator
ial G
uine
a an
d 0
othe
rwis
e. T
his
dum
my
varia
ble
is in
trodu
ced
alon
g w
ith it
s in
tera
ctio
n w
ith th
e M
TP v
aria
ble
in th
e re
gres
sion
s be
caus
e th
is c
ount
ry a
ppea
rs to
be
an o
utlie
r in
Fig
ure
1. I
ndee
d, E
quat
oria
l Gui
nea
had
expe
rienc
ed v
ery
high
val
ues
of r
eal p
er c
apita
in
com
e gr
owth
rate
dur
ing
the
perio
d 19
95~2
015.
For
exa
mpl
e, in
199
6, 1
997,
and
200
1, th
e gr
owth
rate
was
, res
pect
ivel
y, 6
1%, 1
41.6
%, a
nd 5
8%.
Thus
, the
incl
usio
n of
this
dum
my
alon
g w
ith it
s int
erac
tion
with
the
MTP
var
iabl
e al
low
s con
trolli
ng fo
r the
spec
ifici
ty a
ssoc
iate
d w
ith th
is c
ount
ry. I
n th
e tw
o-st
ep s
yste
m G
MM
est
imat
ions
, the
var
iabl
es F
INO
PEN
, DTP
, FIN
DEV
, GFC
F, IN
FL, G
OVC
ON
S, IG
DPC
, and
ED
U h
ave
been
con
side
red
as
endo
geno
us. T
he o
ther
var
iabl
es h
ave
been
con
side
red
as e
xoge
nous
. Tim
e du
mm
ies h
ave
been
incl
uded
in th
e re
gres
sion
s
(con
tinue
d)
VAR
IAB
LE
SG
RO
WT
HG
RO
WT
HG
RO
WT
H(1
)(2
)(3
)(0
.033
0)(0
.034
9)(0
.035
2)G
ross
fixe
d ca
pita
l for
mat
ion
(GFC
F)0.
111*
**0.
111*
**0.
0965
***
(0.0
0605
)(0
.006
31)
(0.0
142)
Infla
tion
rate
(IN
FL)
-0.0
465*
**-0
.038
9***
-0.0
537*
**(0
.011
8)(0
.011
0)(0
.014
1)Si
ze o
f the
pop
ulat
ion
(Log
(PO
P))
-0.2
84**
-0.2
73**
*-0
.017
4(0
.117
)(0
.104
)(0
.113
)In
stitu
tiona
l and
gov
erna
nce
qual
ity (I
NST
)-0
.054
60.
0264
0.08
75(0
.140
)(0
.142
)(0
.124
)C
onst
ant
5.39
2**
-2,9
21**
*-1
,798
***
(2.3
55)
(553
.1)
(540
.2)
Obs
erva
tions
-Cou
ntrie
s66
7–15
066
7–15
066
7–15
0N
umbe
r of i
nstru
men
ts10
210
310
4A
R1
(p-v
alue
)0.
0000
0.00
000.
0000
AR
2 (p
-val
ue)
0.96
160.
7990
0.92
96A
R3
(p-v
alue
)0.
2758
0.24
440.
3271
Vol.33 No.2, June, 2018, 1263~1303 Sèna Kimm Gnangnon
http://dx.doi.org/10.11130/jei.2018.33.2.1263jei
1278
Tabl
e 2.
Diff
eren
tiate
d im
pact
of m
ultil
ater
al tr
ade
polic
y lib
eral
izat
ion
VAR
IAB
LE
SG
RO
WT
HG
RO
WT
HG
RO
WT
HG
RO
WT
H
(1)
(2)
(3)
(4)
Rea
l per
cap
ita in
com
e gr
owth
rate
(GRO
WTH
t-1 )
0.06
11**
0.06
75**
*0.
0520
**0.
0773
***
(0.0
244)
(0.0
250)
(0.0
231)
(0.0
236)
Mul
tilat
eral
trad
e po
licy
liber
aliz
atio
n (M
TP)
28.6
3***
26.4
5***
38.3
7***
31.7
5***
(9.0
46)
(8.7
92)
(10.
30)
(8.9
85)
Low
-Inc
ome
Cou
ntrie
s* M
ultil
ater
al tr
ade
polic
y lib
eral
izat
ion
(LIC
*MTP
)-0
.037
4
(0.0
422)
Low
er-M
iddl
e-In
com
e C
ount
ries *
Mul
tilat
eral
trad
e po
licy
liber
aliz
atio
n (L
MIC
*MTP
)0.
0149
(0.0
308)
Upp
er-M
iddl
e-In
com
e C
ount
ries*
Mul
tilat
eral
trad
e po
licy
liber
aliz
atio
n ( U
MIC
*MTP
)0.
112*
**
(0.0
304)
Hig
h-In
com
e C
ount
ries *
Mul
tilat
eral
trad
e po
licy
liber
aliz
atio
n (H
IC*M
TP)
-0.0
980*
**
(0.0
345)
Multilateral Trade Liberalization and Economic Growth jei
1279
(con
tinue
d)
VAR
IAB
LE
SG
RO
WT
HG
RO
WT
HG
RO
WT
HG
RO
WT
H
(1)
(2)
(3)
(4)
Dum
my
varia
ble
(DU
M)
-94.
27**
*-7
5.28
***
-59.
81**
*-5
0.72
**
(22.
77)
(18.
38)
(19.
12)
(22.
09)
Dum
my
varia
ble*
Mul
tilat
eral
trad
e po
licy
liber
aliz
atio
n (D
UM
*MTP
)1.
621*
**1.
351*
**1.
115*
**0.
977*
**
(0.3
34)
(0.2
70)
(0.2
82)
(0.3
25)
Low
-Inc
ome
Cou
ntrie
s (LI
C)
1.98
1
(2.8
98)
Low
er-M
iddl
e-In
com
e C
ount
ries (
LMIC
)-0
.117
(2.0
73)
Upp
er-M
iddl
e-In
com
e C
ount
ries (
UM
IC)
-8.4
74**
*
(2.0
41)
Hig
h-In
com
e C
ount
ries (
HIC
)6.
314*
**
(2.2
98)
Initi
al re
al G
DP
per c
apita
inco
me
(Log
(IG
DPC
))-0
.103
-0.1
45**
-0.1
99**
*-0
.039
6
(0.0
705)
(0.0
680)
(0.0
685)
(0.0
654)
Dom
estic
trad
e po
licy
inde
x (D
TP)
0.18
9***
0.17
6***
0.24
6***
0.20
1***
Vol.33 No.2, June, 2018, 1263~1303 Sèna Kimm Gnangnon
http://dx.doi.org/10.11130/jei.2018.33.2.1263jei
1280
VAR
IAB
LE
SG
RO
WT
HG
RO
WT
HG
RO
WT
HG
RO
WT
H
(1)
(2)
(3)
(4)
(0.0
571)
(0.0
558)
(0.0
646)
(0.0
555)
Fina
ncia
l ope
nnes
s ind
ex (F
INO
PEN
)-0
.023
7***
-0.0
208*
**-0
.023
1***
-0.0
194*
**
(0.0
0411
)(0
.004
11)
(0.0
0416
)(0
.004
31)
Indi
cato
r of t
he d
epth
of fi
nanc
ial d
evel
opm
ent
(FIN
DEV
)-0
.031
4***
-0.0
275*
**-0
.028
1***
-0.0
295*
**
(0.0
0373
)(0
.003
80)
(0.0
0441
)(0
.003
92)
Gro
ss e
nrol
men
t sec
onda
ry sc
hool
rate
(ED
U)
0.03
23**
*0.
0380
***
0.04
29**
*0.
0292
***
(0.0
0804
)(0
.007
40)
(0.0
0820
)(0
.007
91)
Gov
ernm
ent c
onsu
mpt
ion
(GO
VCO
NS)
-0.0
234
-0.0
395
-0.0
334
-0.0
501
(0.0
375)
(0.0
364)
(0.0
387)
(0.0
401)
Gro
ss fi
xed
capi
tal f
orm
atio
n (G
FCF)
0.11
2***
0.09
83**
*0.
0938
***
0.07
59**
*
(0.0
178)
(0.0
145)
(0.0
153)
(0.0
176)
Infla
tion
rate
(IN
FL)
-0.0
492*
**-0
.051
3***
-0.0
532*
**-0
.050
8***
(0.0
125)
(0.0
152)
(0.0
132)
(0.0
142)
Size
of t
he p
opul
atio
n (L
og(P
OP)
)0.
0454
0.00
686
-0.0
822
-0.0
708
(0.1
19)
(0.1
12)
(0.1
17)
(0.1
27)
(con
tinue
d)
Multilateral Trade Liberalization and Economic Growth jei
1281
VAR
IAB
LE
SG
RO
WT
HG
RO
WT
HG
RO
WT
HG
RO
WT
H
(1)
(2)
(3)
(4)
Inst
itutio
nal a
nd g
over
nanc
e qu
ality
(IN
ST)
0.18
10.
117
-0.0
380
0.29
0
(0.1
22)
(0.1
22)
(0.1
61)
(0.1
79)
Con
stan
t-1
.741
***
-1.6
08**
*-2
.331
***
-1.9
29**
*
(550
.2)
(534
.8)
(626
.7)
(546
.6)
Obs
erva
tions
-Cou
ntrie
s66
7–15
066
7–15
066
7–15
066
7–15
0
Num
ber o
f ins
trum
ents
105
105
105
105
AR
1 (p
-val
ue)
0.00
000.
0000
0.00
000.
0000
AR
2 (p
-val
ue)
0.96
100.
9657
0.92
250.
8602
AR
3 (p
-val
ue)
0.31
180.
3354
0.35
050.
3380
OID
(p-v
alue
)0.
2750
0.34
140.
3887
0.42
67
(con
tinue
d)
Vol.33 No.2, June, 2018, 1263~1303 Sèna Kimm Gnangnon
http://dx.doi.org/10.11130/jei.2018.33.2.1263jei
1282
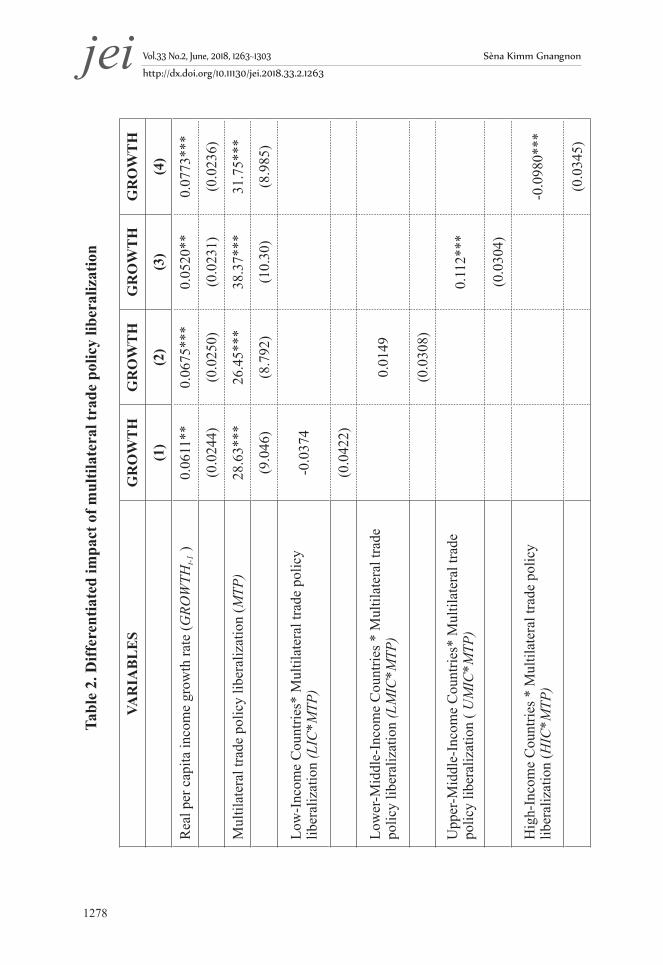
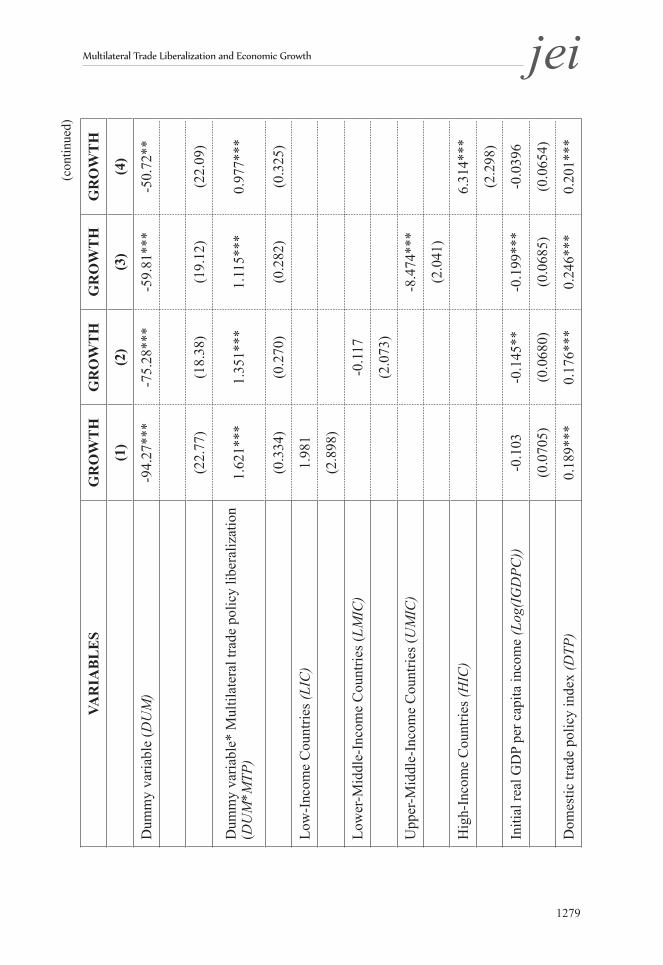
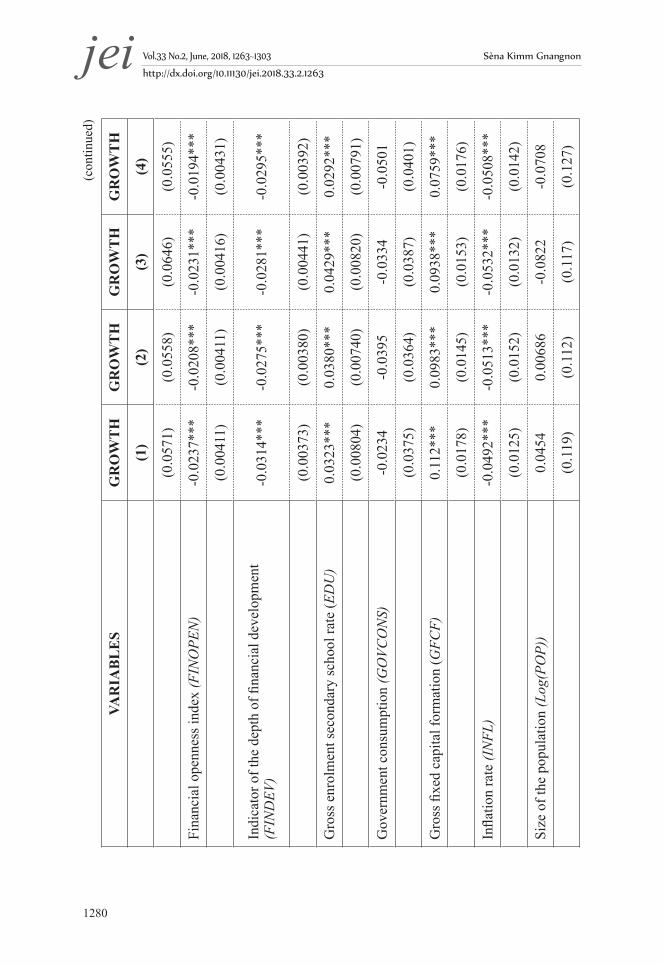
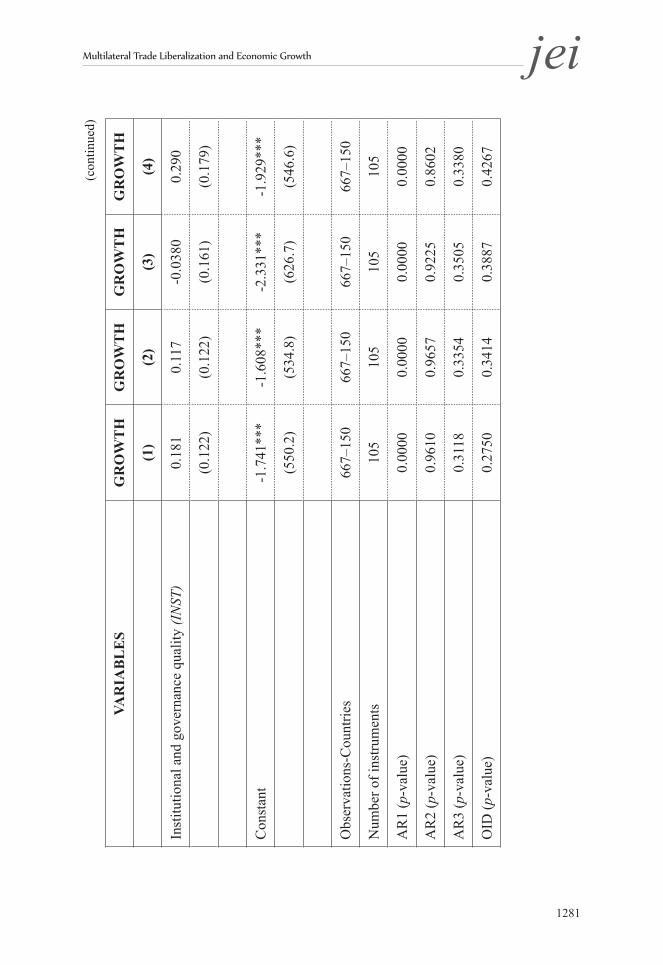
In Table 2, we present the results of the estimations of different specifications of Model (1) in which we include once the dummy capturing each sub-sample mentioned above along with its interaction with the variable MTP so as to capture the impact of MTP on this specific sub-sample of countries.
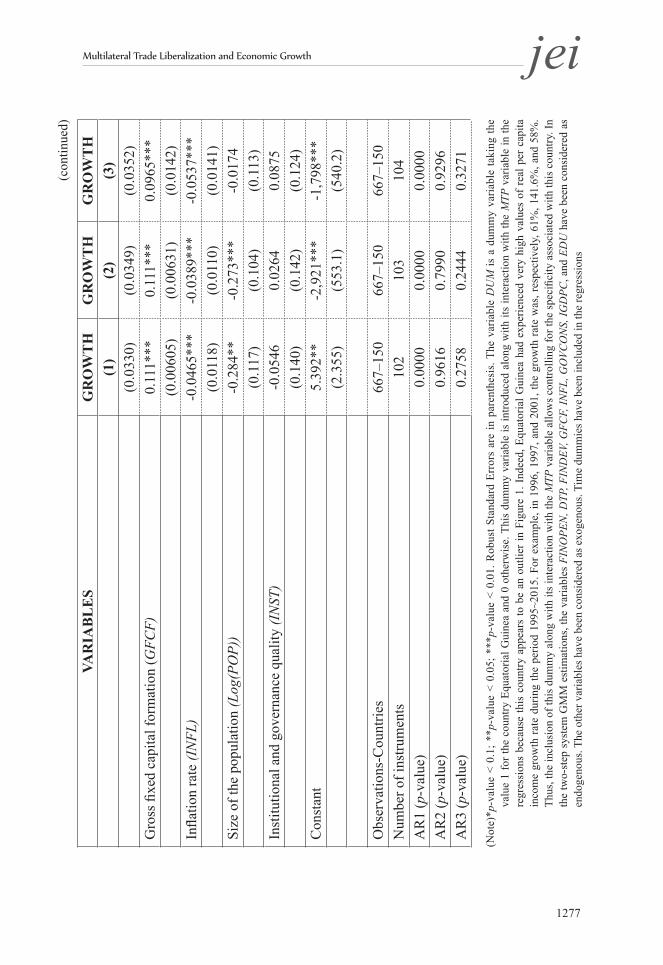
Across all columns of the two tables, we note that the coefficient of the one-year lag of the dependent variable is positive and statistically significant at the 1% level. This signifies that there is a state dependence in economic growth rate. At the bottom of all these columns, we also report the outcome of the diagnostic tests that help check the validity of the two-step system GMM. It appears that the p-values associated with the AR(1) are 0 across all columns, whereas the p-values relating to AR (2) and AR(3) are higher than 0.10. Moreover, the p-values associated with the Sargan test (OID) are higher than 0.10. Taken together, these results confirm the validity of the two-step system GMM to perform the empirical analysis.
Let us now start with the results provided in Table 1.It appears from the comparison of the results in columns 1 and 2 that the introduction of the variable MTP in the model specification does not change substantially the sign, the magnitude, or the statistical significance of coefficients relating to control variables (i.e., variables in column 1). Results in column 2 suggest that multilateral trade liberalization exerts a positive and significant impact on the economic growth rate. A one-point increase in the index of multilateral trade liberalization is associated with a 48.1 percentage point increase in the economic growth rate. However, this outcome does not take into account the presence of an outlier in Figure 1. Results in column 3 address this issue and show that multilateral trade liberalization still exerts a positive and significant impact on the economic growth rate. Specifically, over the entire sample (when the variable DUM takes the value 0), the net impact of multilateral trade liberalization on economic growth rate is given by 29.6, which means that a 1-point increase in the index of multilateral trade liberalization is associated with a 29.6 percentage point increase in the economic growth rate. Specifically, for Equatorial Guinea (when the variable DUM takes the value 1), the net impact of multilateral trade liberalization on economic growth rate is given by 30.844 (= 29.59 + 1.254), which means that a 1-point increase in
Multilateral Trade Liberalization and Economic Growth jei
1283
the index of multilateral trade liberalization is associated in Equatorial Guinea with a 30.84 percentage point increase in the economic growth rate.
Turning to results on control variables in column 3, we obtain that economic growth is positively and statistically driven by lower initial real per capita income, therefore confirming the convergence hypothesis, domestic trade policy liberalization, higher education level, higher investment, and lower inflation. While government consumption, population size, and institutional and governance quality do not significantly influence economic growth, although their impact may vary across countries in the entire sample, we do obtain that financial openness and financial development exert a negative and statistically significant impact on the economic growth rate. It is worth noting here that Christiansen et al. (2013) also obtained a negative impact of capital account openness on growth. Notwithstanding, the negative impacts of financial development and financial openness over the entire sample likely reflect different impacts across countries. As this study does not focus on the impact of these two variables on the economic growth rate, we do not go into further detail on the analysis of the impact of these two variables. Nevertheless, results on the differentiated impacts of each of these two variables across the entire sample are available upon request. For example, we obtain that financial development and financial openness exert a net positive impact on economic growth rate in low-income countries and different results are also obtained on other sub-samples considered. It is worth mentioning that Christiansen et al. (2013) reported a negative impact of capital account openness on economic growth.
Let us now take up results reported in Table 2. Results over control variables in column 1 to column 4 of this table are broadly in line in terms of sign, statistical significance, and magnitude of coefficients relating to these variables with those reported in Table 1.
As for our variable of interest, we obtain that there is no statistically significant difference between the impact of multilateral trade liberalization on economic growth rate in LICs versus non-LICs (countries not classified as LICs) and in LMICs versus non-LMICs (countries not classified as LMICs).
Vol.33 No.2, June, 2018, 1263~1303 Sèna Kimm Gnangnon
http://dx.doi.org/10.11130/jei.2018.33.2.1263jei
1284
This is because the coefficients associated with the interaction between the MTP variable and each of the dummies, LIC and LMIC, are not statistically significant at the 10% level. Thus, the net impact of multilateral trade liberalization on economic growth in LICs and LMICs (as Equatorial Guinea is considered as an upper-middle-income country in the World Bank’s classification, we consider here the variable DUM equal to 0) is given, respectively, by 28.63 and 26.45. This signifies that a 1-point increase in the index of multilateral trade liberalization promotes the economic growth rate in LICs by 28.63 percentage points and in LMICs by 26.45 percentage points. Concerning UMICs, we find that multilateral trade liberalization exerts a higher positive and significant impact on economic growth in UMICs than in non-UMICs (countries not classified as UMICs in the sample). As Equatorial Guinea is classified as an UMIC (we consider here that the variable DUM takes the value 1), the net impact of multilateral trade liberalization on the economic growth rate in UMICs is given by 39.6 (= 38.37 + 0.112 + 1.115). This suggests that a 1-point increase in the index of multilateral trade liberalization induces a 39.6 percentage point increase in UMICs’ economic growth rate. Finally, HICs experience a lower impact of multilateral trade liberalization on economic growth rate than non-HICs (countries not classified as HICs in the sample). The net impact of multilateral trade liberalization on the economic growth rate in HICs (here, we consider that the variable DUM takes the value 0) is given by 31.65 (= 31.75 − 0.0980). Hence, a 1-point increase in the index of multilateral trade liberalization leads to a 31.65 percentage point increase in the economic growth rate in HICs.
Overall, while all four country categories appear to benefit significantly from multilateral trade liberalization, UMICs appear to be, on average, the main beneficiaries of multilateral trade liberalization in terms of economic growth rate. This group is followed by HICs, LICs, and LMICs. This could be explained by the fact that many countries in the categories of UMICs and HICs have a greater capacity to trade than the two other country groups. This places UMICs and HICs in a better position to reap the benefits of further liberalization of trade at the multilateral level.
Multilateral Trade Liberalization and Economic Growth jei
1285
V. Conclusion
This paper assesses the impact of multilateral trade liberalization on the economic growth rate. The analysis relies on an unbalanced panel dataset comprising 150 developed and developing countries over the period of 1995~2015.
Over the entire sample, the results suggest a very strong impact of multilateral trade liberalization on countries’ economic growth rate. This result is confirmed upon examination of the net impact of multilateral trade liberalization on sub-samples of low-income, lower-middle-income, upper-middle–income, and high-income countries. Notwithstanding, upper-middle-income countries appear to be, on average, the main beneficiaries of multilateral trade liberalization in terms of economic growth rate. This group is followed by High-Income Countries (HICs), Low-Income Countries (LICs), and Lower-Middle-Income Countries (LMICs). This outcome is not surprising and could be explained by the fact that many countries in the categories of Upper-Middle-Income Countries (UMICs) and High-Income Countries (HICs) have a greater capacity to trade than the two other country groups; hence, these countries are in a better position to benefit from further multilateral trade liberalization.
The policy implication is that the adoption of trade protection measures would likely trigger a trade war, which would undermine the possibility of greater cooperation among WTO Members to make further progress on multilateral trade liberalization. As a result, countries’ economic growth and development prospects would be adversely affected.
Received 29 March 2018, Revised 1 May 2018, Accepted 23 May 23, 2018
Vol.33 No.2, June, 2018, 1263~1303 Sèna Kimm Gnangnon
http://dx.doi.org/10.11130/jei.2018.33.2.1263jei
1286
References
Aditya, A. and R.Acharyya. “Export diversification, composition, and economic growth: Evidence from cross-country analysis”. The Journal of International Trade and Economic Development 22(7) (2013): 959-992.
Arellano, M., and O. Bover. “Another look at the instrumental variable estimation of error-components models”. Journal of Econometrics 68(1) (1995), 29-51.
Bamou, E., and J.P. Tchanou. “Impact assessment of the multilateral agricultural trade negotiations on CEMAC countries”. Journal of Asian Economics 17(2) (2006), 333-349.
Bengoa, M., and B. Sanchez-Robles. “Foreign direct investment, economic freedom and growth: new evidence from Latin America”. European journal of political economy 19(3) (2003), 529–545.
Beverelli, C., Neumueller, S. and R. “The Export Diversification Effects of the WTO Trade Facilitation Agreement”. World Development 76 (2015), 293-310.
Blundell, R. and S. Bond. “Initial conditions and moment restrictions in dynamic panel data equations”. Journal of Econometrics 87(1) (1998), 115–143.
Borensztein, E., J. De Gregorio, and J.-W. Lee. “How does foreign direct investment affect economic growth?” Journal of International Economics, 45(1) (1998), 115–135.
Casabianca, E.J. “Distributional effects of multilateral and preferential trade liberalisation: The case of Paraguay”. The Journal of International Trade & Economic Development, 25(1) (2017), 80-102.
Cavallo, A., and E. Cavallo. “Are crises good for long-term growth? The role of political institutions”. Journal of Macroeconomics, 32(3) (2010), 838-857.
Chang, R., Kaltani, L., and N.V. Loayza “Openness can be good for growth: The role of policy complementarities”. Journal of Development Economics, 90(1) (2009), 33-49.
Multilateral Trade Liberalization and Economic Growth jei
1287
Chirwa, T.G., and N.M. Odhiambo. “Macroeconomic Determinants of Economic Growth: A Review of International Literature”. South East European Journal of Economics and Business, 11 (2) (2016), 33-47; DOI: 10.1515/jeb-2016-0009
Chinn, M. D. and H. Ito. “What Matters for Financial Development? Capital Controls, Institutions, and Interactions”. Journal of Development Economics 81(1) (2006), 163-192.
Collie, R. D. “Multilateral Trade, Foreign Direct Investment and the Volume of World Trade”. Economics Letters 113 (2011), 47-49.
Christiansen, L., Schindler, M. and T. Tressel. “Growth and structural reforms: A new assessment”. Journal of International Economics, 89(2) (2013), 347-356.
Dabla-Norris, E., and Gündüz, Y. B. “Exogenous Shocks and Growth Crises in Low-Income Countries: A Vulnerability Index”. World Development, 59, (2014): 360-378.
Davidson, R and J G. MacKinnon. Econometric Theory and Methods, Oxford University Press, 2004.
De Mello, R. Jr Luiz. “Foreign Direct Investment-led growth: evidence from time series and panel data”. Oxford Economic Papers, 51(1999),133-154.
Egger, P., Larch, M. and M. Pfaffermay. “Multilateral trade and investment liberalization: effects on welfare and GDP per capita convergence”. Economics Letters, 84(1) (2004), 133-140.
Falvey, R., Foster, N., and D. Greenaway “Trade Liberalization, Economic Crises, and Growth”. World Development, 40(11) (2012), 2177-2193.
Gnangnon, S. K. “Multilateral Trade Liberalization and Foreign Direct Investment Inflows”. Economics Affairs 37(1) (2017a), 66–84.
Gnangnon, S. K. “The Impact of Multilateral Trade Liberalization on Economic Development: Some Empirical Evidence”. Economic Affairs 37(3) (2017b), 397–410.
Vol.33 No.2, June, 2018, 1263~1303 Sèna Kimm Gnangnon
http://dx.doi.org/10.11130/jei.2018.33.2.1263jei
1288
Gnangnon, S. K. “Effect of multilateral trade liberalization on foreign direct investment outflows amid structural economic vulnerability in developing countries”. Research in International Business and Finance, 45 (2017c), 15-29. In Press, Corrected Proof. https://www.sciencedirect.com/science/article/pii/S0275531917303768
Gnangnon, S. K. “Multilateral Trade Liberalization and Government Revenue”. Journal of Economic Integration 32(3) (2017d), 586-614.
Gnangnon, S. K. “Multilateral Trade Liberalization, Export Share in the International Trade Market and Aid for Trade”. Journal of International Commerce, Economics and Policy, 08(03) (2017e), 1750014.
Gnangnon, S. K. “Empirical Evidence on the Impact of Multilateral Trade Liberalization on Domestic Trade Policy”. Global Economy Journal, 17(3 (2017f) https://doi.org/10.1515/gej-2017-0047
Gomes, D. N. and F.J. Veiga. “Financial globalization, convergence and growth: The role of foreign direct investment”. Journal of International Money and Finance, 37(2013), 161–186.
Greenaway, D. “Does trade liberalisation promote economic development?” Scottish Journal of Political Economy 45(5) (1998), 491-511.
Greenaway, D., S. Leybourne, and D. Sapsford. “Modelling growth (and liberalisation) using smooth transitions analysis.” Economic Inquiry, 35(4) (1997) 798–814.
Greenaway, D., C. W. Morgan, and P. Wright “Trade reform, adjustment and growth: What does the evidence tell us?” Economic Journal, 108 (1998), 1547–1561.
Greenaway, D., C.W. Morgan and P. Wright “Trade liberalization and growth in developing countries”. Journal of Development Economics, 67 (2002), 229–244.
Guillaumont, P., and L. Wagner. “Aid and Growth Accelerations: Vulnerability Matters”. UNU-WIDER Working Paper No. 2012/31(2012).
Multilateral Trade Liberalization and Economic Growth jei
1289
Hanson, G. H., and M. J. Slaughter. “The Role of Multinational Corporations in International Business Cycle Transmission: Skew Lines or Arbitrage Opportunities?” (2003),University of San Diego, Tuck School of Business at Dartmouth and NBER http://www.uniiel.de/ifw/konfer/kwc/slaughter.pdf.
Hertel, T. W., Preckel, P.V., Cranfield, J.A.L. and M. Ivanic. “Multilateral trade liberalization and poverty in Brazil and Chile”. Economie internationale 2003/2 (n° 94-95) (2003), 201-233.
Hertel, T. W., Ivanic, M., Preckel, P. V., and J. A. L. Cranfield. “The Earnings Effects of Multilateral Trade Liberalization: Implications for Poverty”. The World Bank Economic Review, 18(2) (2004), 205-236.
Herzer, D. “The long run relationship between outward FDI and domestic output: evidence from panel data". Economic Letters, 100(1) (2008), 146-149.
Hesse, H. “Export diversification and economic growth”. Commission on growth and development working paper no. 21(2008). Washington, DC: World Bank.
Kaufmann, D, Kraay, A. and M. Mastruzzi. (2010). The Worldwide Governance Indicators Methodology and Analytical Issues. World Bank Policy Research N° 5430 (WPS5430).
Lee, J-W. “Capital goods imports and long-run growth”. Journal of Development Economics, 48(1) (1995), 19-110.
Li, X., Liu, X. “Foreign direct investment and economic growth: an increasingly endogenous relationship”. World Development 33(2005), 393-407.
Miller, T., Kim, A. B., Roberts, J.M., Riley, B., and T. Whiting. “2017 Index of Economic Freedom”, (2017). Institute for Economic Freedom, The Heritage Foundation, Washington, DC. See online: http://www.heritage.org/index/download
Naito, T. “An asymmetric Melitz model of trade and growth”. Economics Letters, 158(2017), 80-83.
Nickell, S. “Biases in Dynamic Models with Fixed Effects.” Econometrica,

Vol.33 No.2, June, 2018, 1263~1303 Sèna Kimm Gnangnon
http://dx.doi.org/10.11130/jei.2018.33.2.1263jei
1290
49(6) (1981), 1417–1426.
Niles Russ, K. “The Endogeneity of the Exchange Rate as a Determinant of FDI: A Model of Money, Entry, and Multinational Firms” (2003). Mimeo. Johns Hopkins University.
Papageorgiou, D., Michaely M. and A. Choksi Liberalising Foreign Trade. Oxford, UK: Basil Blackwell, 1991.
Ratnaike, Y. C. “Is there an empirical link between trade liberalisation and export performance?” Economics Letters, 117(2012), 375–378.
Roodman, D. M. “A note on the theme of too many instruments”. Oxford Bulletin of Economic and Statistics, 71 (1) (2009), 135–158.
Salvatore, D. (2011). International economics: Trade and finance (11th ed.). Singapore: Wiley.
Salinas, G. and A. Aksoy. “Growth before and after trade liberalization”. World Bank Policy Research Working Paper no. 4062 (2006), Washington, DC.
Shabnam, N. “Natural Disasters and Economic Growth: A Review”. International Journal of Disaster Risk Science 5(2) (2014), 157–163.
Singh, T. “Does international trade cause economic growth? A Survey”. The World Economy 33(11) (2010), 1517-1564.
United Nations) World Economic Situation and Prospects 2017. New York: United Nations, 2017. https://www.un.org/development/desa/dpad/wp-content/uploads/sites/45/publication/2017wesp_full_en.pdf (accessed 24 May 217).
Wacziarg, R. and K. Welch. “Trade liberalisation and growth: New evidence”. World Bank Economic Review, 22(2) (2008), 187-231.
WTO (World Trade Organization) “Trade recovery expected in 2017 and 2018, amid policy uncertainty”. Trade Statistics and Outlook Press Release 793, 12 April 2017. https://www.wto.org/english/news_e/pres17_e/pr791_e.htm (accessed 12 April 2017).
Multilateral Trade Liberalization and Economic Growth jei
1291
App
endi
x
App
endi
x 1
: Defi
nitio
ns a
nd so
urce
s
Vari
able
Defi
nitio
nSo
urce
Rea
l per
cap
ita in
com
e gr
owth
rate
(GRO
WTH
)G
DP
per c
apita
Gro
wth
Rat
e (c
onst
ant 2
010
US
dolla
rs),
in p
erce
ntag
eW
orld
Dev
elop
men
t Ind
icat
ors (
WD
I)
2017
(Wor
ld B
ank
2017
)
Dom
estic
trad
e po
licy
inde
x (D
TP)
Trad
e po
licy
of th
e do
mes
tic e
cono
my
= Tr
ade
Free
dom
Sco
re. T
his i
s a c
ompo
nent
of
the
Her
itage
Fou
ndat
ion’
s Ind
ex o
f Ec
onom
ic F
reed
om. I
t is c
ompo
site
mea
sure
of
the
abse
nce
of ta
riff a
nd n
on-ta
riff
barr
iers
that
affe
ct im
ports
and
exp
orts
of
good
s and
serv
ices
. Its
com
puta
tion
is b
ased
on
two
com
pone
nts:
trad
e-w
eigh
ted
aver
age
tarif
f ran
ge a
nd N
on-T
ariff
Bar
riers
(NTB
s),
the
exte
nt o
f lat
ter h
avin
g be
en d
eter
min
ed
on th
e ba
sis o
f qua
ntita
tive
and
qual
itativ
e av
aila
ble
info
rmat
ion.
NTB
s inc
lude
qu
antit
y re
stric
tions
, pric
e re
stric
tions
, re
gula
tory
rest
rictio
ns, i
nves
tmen
t re
stric
tions
, cus
tom
s res
trict
ions
, and
dire
ct
gove
rnm
ent i
nter
vent
ions
. Thi
s sco
re is
gr
aded
on
a sc
ale
of 0
–100
, with
a ri
se
indi
catin
g lo
wer
trad
e ba
rrie
rs, i
.e.,.
, hig
her
trade
libe
raliz
atio
n, w
here
as a
dec
reas
e re
flect
s ris
ing
trade
pro
tect
ioni
sm.
Her
itage
Fou
ndat
ion
http
://w
ww.
herit
age.
org/
issu
es/e
cono
mic
-fr
eedo
m
see
Mill
er e
t al.,
(201
7)
Vol.33 No.2, June, 2018, 1263~1303 Sèna Kimm Gnangnon
http://dx.doi.org/10.11130/jei.2018.33.2.1263jei
1292
Vari
able
Defi
nitio
nSo
urce
Inde
x of
mul
tilat
eral
trad
e po
licy
liber
aliz
atio
n(M
TP)
Aver
age
Trad
e Po
licy
of th
e R
est o
f the
W
orld
. For
a g
iven
cou
ntry
, thi
s var
iabl
e ha
s be
en c
alcu
late
d as
the
aver
age
trade
free
dom
sc
ore
of th
e re
st o
f the
wor
ld (f
or c
ount
ries
for w
hich
dat
a ex
ist).
Aut
hor’s
cal
cula
tion
base
d on
Her
itage
Fo
unda
tion
data
Initi
al re
al G
DP
per c
apita
in
com
e (I
GD
PC)
Initi
al G
DP
per c
apita
(con
stan
t 201
0 U
S do
llars
)A
utho
r’s c
alcu
latio
n ba
sed
on d
ata
on
GD
PC e
xtra
cted
from
WD
I, 20
17G
ross
fixe
d ca
pita
l fo
rmat
ion(
GFC
F)G
ross
fixe
d ca
pita
l for
mat
ion
(% o
f GD
P)W
DI,
2017
Gro
ss e
nrol
men
t sec
onda
ry
scho
ol ra
te (E
DU
)G
ross
seco
ndar
y sc
hool
enr
olm
ent (
in %
)W
DI,
2017
Fina
ncia
l ope
nnes
s ind
ex
(FIN
OPE
N)
The
mea
sure
of d
e ju
re fi
nanc
ial o
penn
ess.
This
inde
x ha
s bee
n co
mpu
ted
by C
hinn
an
d Ito
(200
6) a
nd u
pdat
ed in
July
201
7.
Its v
alue
rang
es b
etw
een
0 an
d 1.
We
have
mul
tiplie
d by
100
so a
s to
ensu
re
cohe
renc
e w
ith th
e tra
de p
olic
y va
riabl
e de
fined
bel
ow (w
hich
is a
lso
a m
easu
re
of a
de
jure
trad
e po
licy
and
who
se v
alue
ra
nge
betw
een
0 an
d 10
0) S
ee: h
ttp://
web
.pd
x.ed
u/~i
to/C
hinn
-Ito
_web
site
.htm
Indi
cato
r of t
he
dept
h of
fina
ncia
l de
velo
pmen
t(FIN
DEV
)
Rep
rese
nts t
he m
easu
re o
f the
dep
th o
f fin
anci
al d
evel
opm
ent.
It is
mea
sure
d by
do
mes
tic c
redi
t to
the
priv
ate
sect
or a
s a
perc
enta
ge o
f GD
P.
Aut
hor’s
cal
cula
tion
base
d on
dat
a fr
om
WD
I, 20
17
(con
tinue
d)
Multilateral Trade Liberalization and Economic Growth jei
1293
(con
tinue
d)
Vari
able
Defi
nitio
nSo
urce
Gov
ernm
ent
cons
umpt
ion(
GO
VCO
NS)
Gen
eral
gov
ernm
ent fi
nal c
onsu
mpt
ion
expe
nditu
re (%
of G
DP)
WD
I, 20
17
Size
of t
he p
opul
atio
n (P
OP)
Tota
l pop
ulat
ion
WD
I, 20
17
Inst
itutio
nal a
nd
gove
rnan
ce q
ualit
y(IN
ST)
This
is th
e va
riabl
e ca
ptur
ing
inst
itutio
nal
qual
ity in
a g
iven
cou
ntry
. It h
as b
een
com
pute
d by
ext
ract
ing
the
first
prin
cipa
l co
mpo
nent
(bas
ed o
n fa
ctor
ana
lysi
s) o
f th
e fo
llow
ing
six
indi
cato
rs o
f gov
erna
nce.
Th
ese
indi
cato
rs a
re, r
espe
ctiv
ely,
den
oted
“P
olSt
ab,”
“R
egQ
ual,”
“R
ules
law,
” “G
ovEf
f,” “
Voic
eAcc
,” a
nd “
Cor
.”Po
lSta
b is
the
mea
sure
of p
oliti
cal s
tabi
lity
and
abse
nce
of v
iole
nce/
terr
oris
m. R
egQ
ual
stan
ds fo
r reg
ulat
ory
qual
ity in
dex.
R
ules
law
repr
esen
ts th
e R
ules
of L
aw in
dex.
G
ovEf
f is t
he g
over
nmen
t effe
ctiv
enes
s in
dex.
Voi
ceA
cc is
the
inde
x of
voi
ce
and
acco
unta
bilit
y. C
or is
the
inde
x of
co
rrup
tion.
It is
wor
th n
otin
g th
at h
ighe
r va
lues
of t
he in
dex
INST
are
ass
ocia
ted
with
bet
ter g
over
nanc
e an
d in
stitu
tiona
l qu
ality
, whe
reas
low
er v
alue
s refl
ect w
orse
go
vern
ance
and
inst
itutio
nal q
ualit
y.
Dat
a on
the
com
pone
nts o
f IN
ST
varia
bles
are
ext
ract
ed fr
om W
orld
Ban
k G
over
nanc
e In
dica
tors
dev
elop
ed b
y K
aufm
ann,
Kra
ay a
nd M
astru
zzi (
2010
) an
d re
cent
ly u
pdat
ed.

Vol.33 No.2, June, 2018, 1263~1303 Sèna Kimm Gnangnon
http://dx.doi.org/10.11130/jei.2018.33.2.1263jei
1294
(Not
e)*p
-val
ue <
0.1
App
endi
x 2
: Des
crip
tive
stat
istic
s
Vari
able
Obs
erva
tions
Mea
nSt
anda
rd
devi
atio
nM
inim
umM
axim
um
GRO
WTH
1,04
62.
491
4.11
3-2
9.07
472
.057
MTP
1,05
067
.228
6.41
957
.290
75.1
35
DTP
1,00
767
.792
15.3
839.
067
95
FIN
OPE
N1,
049
52.5
6936
.60
100
FIN
DEV
1,02
948
.149
44.9
960.
001
250.
609
IGD
PC96
999
27.0
1714
991.
530
157.
565
7374
7.84
0
GFC
F1,
030
22.5
0310
.059
2.23
417
5.29
0
INFL
1,03
035
.990
764.
382
-6.9
3424
411.
030
GO
VCO
NS
1,03
215
.593
5.40
34.
005
44.3
75
EDU
901
75.9
0330
.791
5.39
116
3.95
6
POP
1050
4.11
e+07
1.44
e+08
7634
6.67
1.36
e+09
INST
1,04
6-0
.054
2.21
9-5
.139
4.80
1

Multilateral Trade Liberalization and Economic Growth jei
1295
App
endi
x 3
: Pai
rwis
e co
rrel
atio
n
Real
per c
apita
in
com
e gro
wth
rate(
GROW
TH)
Inde
x of
m
ultil
atera
l tra
de
polic
y lib
erali
zatio
n(M
TP)
Dom
estic
tra
de p
olicy
in
dex
(DTP
)
Fina
ncial
op
enne
ss
inde
x (F
INOP
EN)
Indi
cato
r of
the
dept
h of
fin
anci
alde
velo
pmen
t(F
IND
EV)
Initi
al re
al GD
P pe
r cap
ita
inco
me
(IGDP
C)
Gros
s fixe
d ca
pital
fo
rmati
on(G
FCF)
Real
per
capi
ta
inco
me g
row
th
rate
(GRO
WTH
)1.
0000
Inde
x of
mul
tilat
eral
tra
de p
olic
y lib
eral
izat
ion(
MTP
)-0
.099
6*1.
0000
Dom
estic
trad
e pol
icy
inde
x (D
TP)
-0.0
371
0.40
04*
1.00
00
Fina
ncia
l ope
nnes
s in
dex
(FIN
OPE
N)-0
.047
70.
0703
*0.
5459
*1.
0000
Indi
cato
r of t
he
dept
h of
fina
ncia
l de
velo
pmen
t(FIN
DEV)
-0.1
125*
0.17
80*
0.46
04*
0.43
59*
1.00
00
Initi
al re
al G
DP
per
capi
ta in
com
e (IG
DPC
)0.
0096
-0.0
301
-0.0
149
-0.0
642*
0.03
681.
0000
Gro
ss fi
xed
capi
tal
form
atio
n(G
FCF)
0.53
48*
0.08
15*
0.05
73*
-0.0
091
0.07
40*
0.02
441.
0000
Infla
tion
rate
(INF
L)-0
.071
5*0.
0138
-0.0
449
-0.0
506
-0.0
938*
-0.0
219
-0.0
518*
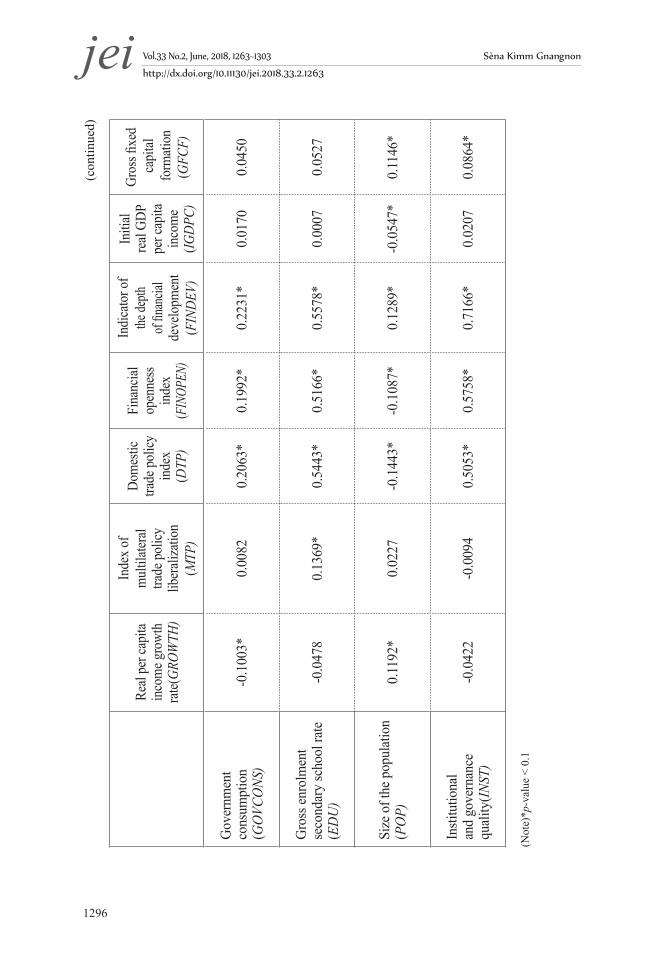
Vol.33 No.2, June, 2018, 1263~1303 Sèna Kimm Gnangnon
http://dx.doi.org/10.11130/jei.2018.33.2.1263jei
1296
Real
per c
apita
in
com
e gro
wth
rate(
GROW
TH)
Inde
x of
m
ultil
atera
l tra
de p
olicy
lib
erali
zatio
n(M
TP)
Dom
estic
tra
de p
olicy
in
dex
(DTP
)
Fina
ncial
op
enne
ss
inde
x (F
INOP
EN)
Indi
cato
r of
the de
pth
of fin
ancia
l de
velo
pmen
t(F
INDE
V)
Initi
al re
al GD
P pe
r cap
ita
inco
me
(IGDP
C)
Gros
s fixe
d ca
pital
form
ation
(GFC
F)
Gov
ernm
ent
cons
umpt
ion
(GO
VCO
NS)
-0.1
003*
0.00
820.
2063
*0.
1992
*0.
2231
*0.
0170
0.04
50
Gro
ss en
rolm
ent
seco
ndar
y sc
hool
rate
(E
DU
)-0
.047
80.
1369
*0.
5443
*0.
5166
*0.
5578
*0.
0007
0.05
27
Size
of t
he p
opul
atio
n (P
OP)
0.11
92*
0.02
27-0
.144
3*-0
.108
7*0.
1289
* -0
.054
7*0.
1146
*
Insti
tutio
nal
and
gove
rnan
ce
qual
ity(IN
ST)
-0.0
422
-0.0
094
0.50
53*
0.57
58*
0.71
66*
0.02
070.
0864
*
(Not
e)*p
-val
ue <
0.1
(con
tinue
d)
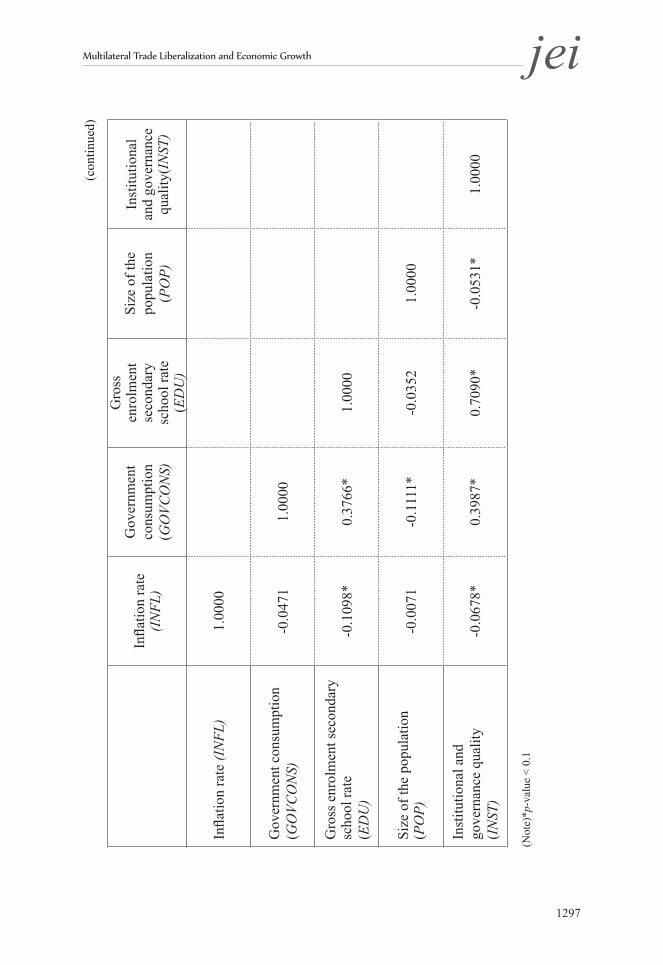
Multilateral Trade Liberalization and Economic Growth jei
1297
(Not
e)*p
-val
ue <
0.1
(con
tinue
d)
Infla
tion
rate
(I
NFL
)
Gov
ernm
ent
cons
umpt
ion
(GO
VCO
NS)
Gro
ss
enro
lmen
t se
cond
ary
scho
ol ra
te
(ED
U)
Size
of t
he
popu
latio
n (P
OP)
Inst
itutio
nal
and
gove
rnan
ce
qual
ity(I
NST
)
Infla
tion
rate
(IN
FL)
1.00
00
Gov
ernm
ent c
onsu
mpt
ion
(GO
VCO
NS)
-0.0
471
1.00
00
Gro
ss e
nrol
men
t sec
onda
ry
scho
ol ra
te
(ED
U)
-0.1
098*
0.37
66*
1.00
00
Size
of t
he p
opul
atio
n (P
OP)
-0.0
071
-0.1
111*
-0.0
352
1.00
00
Inst
itutio
nal a
nd
gove
rnan
ce q
ualit
y(I
NST
)-0
.067
8*0.
3987
*0.
7090
*-0
.053
1*1.
0000

Vol.33 No.2, June, 2018, 1263~1303 Sèna Kimm Gnangnon
http://dx.doi.org/10.11130/jei.2018.33.2.1263jei
1298
Appendix 4: List of countries in the entire sample
Entire Sample
Albania Colombia Guinea-Bissau Malaysia Senegal
Algeria Comoros Guyana Mali Seychelles
Angola Congo, Dem. Rep. Honduras Malta Sierra Leone
Argentina Congo, Rep. Hong Kong SAR, China Mauritania Slovak
Republic
Armenia Costa Rica Hungary Mauritius Slovenia
Australia Cote d'Ivoire Iceland Mexico South Africa
Austria Croatia India Moldova Spain
Bahamas, The Cyprus Indonesia Mongolia Sri Lanka
Bahrain Czech Republic
Iran, Islamic Rep. Morocco St. Lucia
Bangladesh Denmark Ireland MozambiqueSt. Vincent
and the Grenadines
Barbados Djibouti Israel Namibia Suriname
Belarus Dominica Italy Nepal Swaziland
Belgium Dominican Republic Jamaica Netherlands Sweden
Belize Ecuador Japan New Zealand Switzerland
Benin Egypt, Arab Rep. Jordan Nicaragua Tajikistan
Bhutan El Salvador Kazakhstan Niger Tanzania
Bolivia Equatorial Guinea Kenya Nigeria Thailand

Multilateral Trade Liberalization and Economic Growth jei
1299
Entire Sample
Botswana Eritrea Korea, Rep. Norway Togo
Brazil Estonia Kuwait Oman Tonga
Bulgaria Fiji Kyrgyz Republic Pakistan Trinidad and
Tobago
Burkina Faso Finland Lao PDR Panama Tunisia
Burundi France Latvia Paraguay Turkey
Cabo Verde Gabon Lebanon Peru Uganda
Cambodia Gambia, The Lesotho Philippines Ukraine
Cameroon Georgia Liberia Poland United Kingdom
Canada Germany Libya Portugal United States
Central African
RepublicGhana Lithuania Romania Uruguay
Chad Greece Macedonia, FYR
Russian Federation
Venezuela, RB
Chile Guatemala Madagascar Rwanda Yemen, Rep.
China Guinea Malawi Saudi Arabia Zimbabwe
(continued)
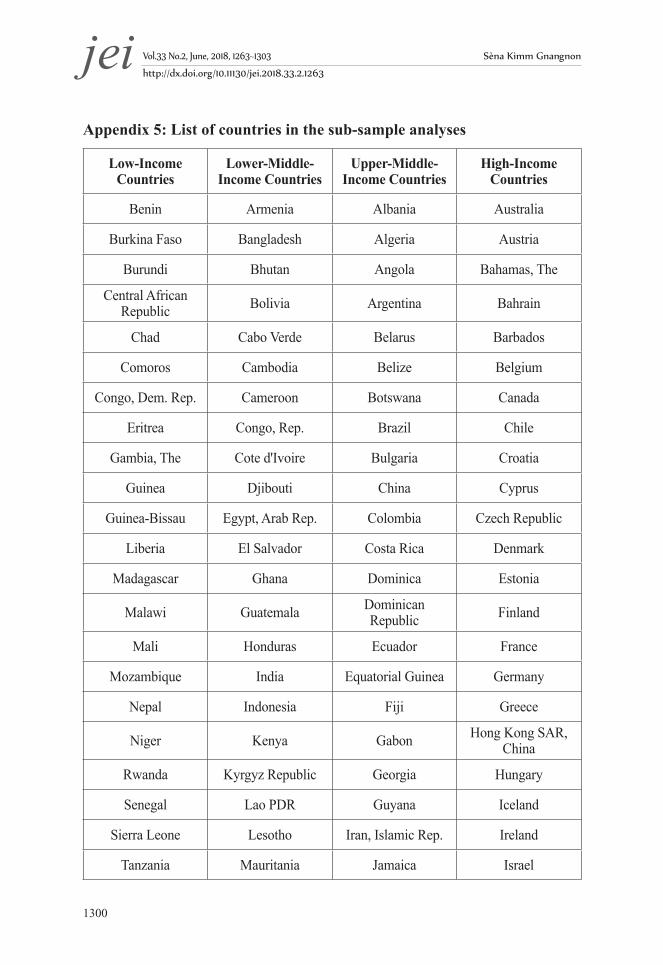
Vol.33 No.2, June, 2018, 1263~1303 Sèna Kimm Gnangnon
http://dx.doi.org/10.11130/jei.2018.33.2.1263jei
1300
Appendix 5: List of countries in the sub-sample analyses
Low-Income Countries
Lower-Middle-Income Countries
Upper-Middle-Income Countries
High-Income Countries
Benin Armenia Albania Australia
Burkina Faso Bangladesh Algeria Austria
Burundi Bhutan Angola Bahamas, The
Central African Republic Bolivia Argentina Bahrain
Chad Cabo Verde Belarus Barbados
Comoros Cambodia Belize Belgium
Congo, Dem. Rep. Cameroon Botswana Canada
Eritrea Congo, Rep. Brazil Chile
Gambia, The Cote d'Ivoire Bulgaria Croatia
Guinea Djibouti China Cyprus
Guinea-Bissau Egypt, Arab Rep. Colombia Czech Republic
Liberia El Salvador Costa Rica Denmark
Madagascar Ghana Dominica Estonia
Malawi Guatemala Dominican Republic Finland
Mali Honduras Ecuador France
Mozambique India Equatorial Guinea Germany
Nepal Indonesia Fiji Greece
Niger Kenya Gabon Hong Kong SAR, China
Rwanda Kyrgyz Republic Georgia Hungary
Senegal Lao PDR Guyana Iceland
Sierra Leone Lesotho Iran, Islamic Rep. Ireland
Tanzania Mauritania Jamaica Israel
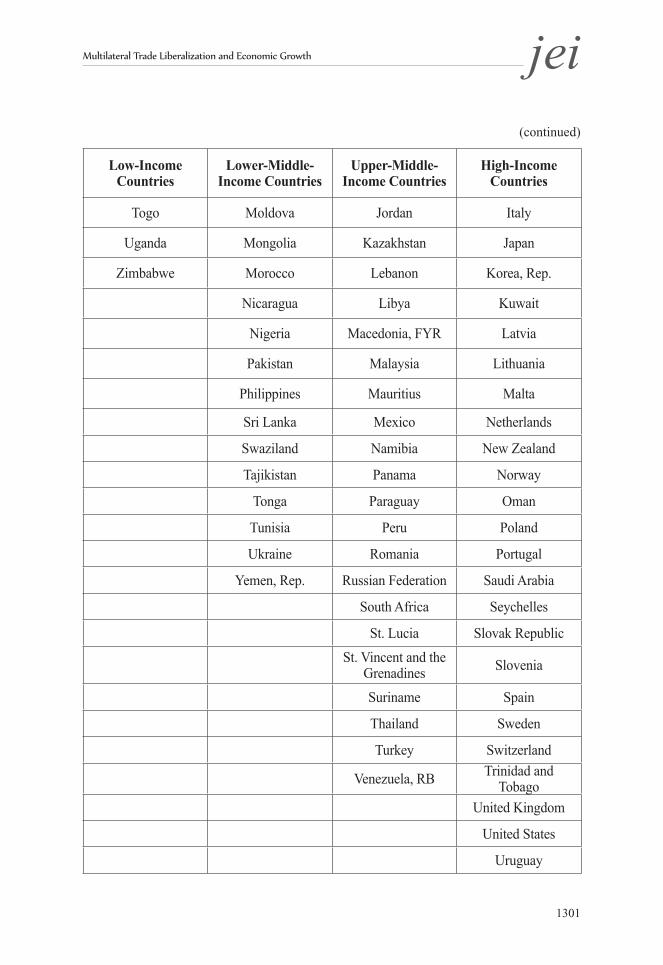
Multilateral Trade Liberalization and Economic Growth jei
1301
Low-Income Countries
Lower-Middle-Income Countries
Upper-Middle-Income Countries
High-Income Countries
Togo Moldova Jordan Italy
Uganda Mongolia Kazakhstan Japan
Zimbabwe Morocco Lebanon Korea, Rep.
Nicaragua Libya Kuwait
Nigeria Macedonia, FYR Latvia
Pakistan Malaysia Lithuania
Philippines Mauritius Malta
Sri Lanka Mexico Netherlands
Swaziland Namibia New Zealand
Tajikistan Panama Norway
Tonga Paraguay Oman
Tunisia Peru Poland
Ukraine Romania Portugal
Yemen, Rep. Russian Federation Saudi Arabia
South Africa Seychelles
St. Lucia Slovak Republic
St. Vincent and the Grenadines Slovenia
Suriname Spain
Thailand Sweden
Turkey Switzerland
Venezuela, RB Trinidad and Tobago
United Kingdom
United States
Uruguay
(continued)